Article

Intelligent Insights for Manufacturing Inspections from Efficient Image Recognition †

1
Department of Mechanical and Industrial Engineering, University of Massachusetts Amherst, Amherst, MA 01003, USA
2
FTL Labs Corporation, 479 West Street Suite 48, Amherst, MA 01002, USA
*
Author to whom correspondence should be addressed.
This paper is an extended version of our paper published in Douglas Eddy, Michael White, Damon Blanchette, “Learned Manufacturing Inspection Inferences from Image Recognition Capabilities”, FAIM 2022 conference, LNME Springer.
Machines 2023, 11(1), 45; https://doi.org/10.3390/machines11010045
Submission received: 17 November 2022 / Revised: 27 December 2022 / Accepted: 28 December 2022 / Published: 1 January 2023

Abstract

:
Many complex electromechanical assemblies that are essential to the vital function of certain products can be time-consuming to inspect to a sufficient level of certainty. Examples include subsystems of machine tools, robots, aircraft, and automobiles. Out-of-tolerance conditions can occur due to either random common-cause variability or undetected nonstandard deviations, such as those posed by debris from foreign objects. New methods need to be implemented to enable the utilization of detection technologies in ways that can significantly reduce inspection efforts. Some of the most informative three-dimensional image recognition methods may not be sufficiently reliable or versatile enough for a wide diversity of assemblies. It can also be an extensive process to train the recognition on all possible anomalies comprehensively enough for inspection certainty. This paper introduces a methodical technique to implement a semiautonomous inspection system and its algorithm, introduced in a prior publication, that can learn manufacturing inspection inference from image recognition capabilities. This fundamental capability accepts data inputs that can be obtained during the image recognition training process followed by machine learning of the likely results. The resulting intelligent insights can inform an inspector of the likelihood that an assembly scanned by image recognition technology will meet the manufacturing specifications. An experimental design is introduced to generate data that can train and test models with a realistic representation of manufacturing cases. A benchmark case study example is presented to enable comparison to models from manufacturing cases. The fundamental method is demonstrated using a realistic assembly manufacturing example. Recommendations are given to guide efforts to deploy this entire methodical technique comprehensively.

1. Introduction

Inspections of complex assemblies, which have traditionally been costly and unreliable, have improved. However, there currently remains a key opportunity to design inspection processes appropriately [1]. For example, misses in visual inspections, which could be traced to several factors, were found to occur more frequently than false alarms [2]. Most current solutions are designed for only specific types of applications.
Many technologies and techniques have been developed to improve these conditions, including automated optical inspection (AOI) instruments customized for their respective applications [3], machine vision systems to detect very specific types of defects in industrial applications [4], computer-vision detection of a set of numerous types of defects [5], augmented or virtual reality to aid defect prevention in construction management processes [6], inspector eye tracking as it relates to inspection accuracy [7] and the potential to predict systematic patterns [8], and image recognition of welding defects [9]. The use of various tools, technologies, and techniques can help inspectors. However, ensuring zero defects requires their integration within a robust quality control system. Such a system also needs to be combined with a method that can be adapted for each individual process. Such a formalism was introduced for construction projects [10], but there is still a dearth of related research for complex assembly processes in manufacturing operations.
Certain types of complex assembly operations must ensure zero defects, due to the significant potential for severe consequences from a defect. Examples include aircraft, some other transportation modes, metal working machine tools, and safety systems. A systematic method was introduced to potentially achieve zero defects in complex assemblies by manual inspections that do not utilize detection technology [11]. Notable work has improved defect-prediction models for complex assemblies [12]. More recent research has aimed to improve inspection intelligence. A recent work combined image recognition with machine learning from complex data to assess suitable parameters by pattern recognition toward the goal of defect-free manufacturing [13]. Another recent development described a virtual evaluation system to infer results from non-destructive evaluations [14]. Another recent work summarizes intelligence capabilities when searching for specific defects with automated optical inspection (AOI) systems [15].
A publication about the business perspective suggests that it may be useful to identify current research needs for the facilitation of overall manufacturing inspection and decision-making in industry [16]. Conventional manufacturing inspections require further inference of results to determine whether all specified tolerances are met. Thus, a need remains for systems and methods with reliable quality that can utilize advanced detection technology. However, best practices in industry to ensure zero defects were established a few decades ago prior to the availability of many of the advanced technologies of today. One research effort integrated some established best practices within techniques in the Six Sigma school of thought, i.e., Define, Measure, Analyze, Improve, and Control (DMAIC) and Failure Modes and Effects Analysis (FMEA) [17]. Another prior work addressed Design FMEA (DFMEA) by associating the severity of any failure mode with the jeopardy posed to any critical function of a product [18]. The integration with detection technology capabilities as presented in that work could become useful during a new product development stage.
However, many large companies with vulnerable complex assembled products have already established diligent and rigorous design processes. Such design processes specifically ensure that the verification of each product unit’s quality only requires ensuring that every tolerance specification is met. Without some type of semiautonomous inspection system, inspectors still must spend significant labor hours inferring results from measurements recorded by the available technology. There are many tolerance specifications required for each assembled product that require an inspector’s effort. The amount of effort can be significant due to the number of such specifications. Thus, the current most compelling solutions may be those that provide statistics-based binary assessments of each tolerance specification during the inspection of each product unit.
This presents an opportunity to address ubiquitous needs at assembly operations in the manufacturing industry by leveraging emerging technologies from the research community. The work presented in this paper is based on the premise that data and information from autonomous image recognition capabilities can be contextualized in a way that reveals an informative probability that each tolerance specification is met. With those key intelligent insights revealed autonomously, an inspector can more easily decide where in an assembly to concentrate any further specific efforts. To this end, advancements in Explainable Artificial Intelligence (XAI) could be useful for understanding the contextual meaning of each autonomous observation.
Bayesian Rule Lists (BRLs) are a potentially suitable subset of XAI. BRLs can learn the probabilities of a binary occurrence from datasets based on each given set of observed conditions. As a result, BRLs can attain ease of interpretability and high prediction accuracy. A classic example derived a set of conditional rule-based probabilities for stroke prediction based on the symptoms and medical profile of any given patient [19]. One objective of the work described in this paper is to potentially equip inspectors with data-driven probabilistic predictions of whether a tolerance will be met. The second objective of this work is for this capability to be achieved using mere inputs of easily represented autonomous measurements that are well understood. There was an opportunity for this study to fill a dearth of scientific literature that can address these specific objectives.
As a starting point, a method to generate learned manufacturing inspection inferences from image recognition capabilities (LeMIIIRC) [20] is described in the following section. Section 3 demonstrates the application of the LeMIIIRC method in a case study example of the installation of brackets to mount electrical cable harness assemblies in their main routing cabinet, such as inside the fuselage of a transport aircraft. This case study is illustrated by some representative data of a hypothetical assembly inspection result in Section 3.2. To extend the prior work [20], an experiment is designed in Section 3.3 within the schema presented in Section 3.2 for potential use with image recognition data from manufacturing operations. Test results with manufacturing data from an experiment recommended in Section 3.3 can be compared to a benchmark example introduced in Section 3.1. Section 4 discusses and evaluates feasibility from the case study based on the objectives of this work and recommends general procedures to implement LeMIIIRC into assembly inspections in industry. Section 5 summarizes the conclusions of this paper.

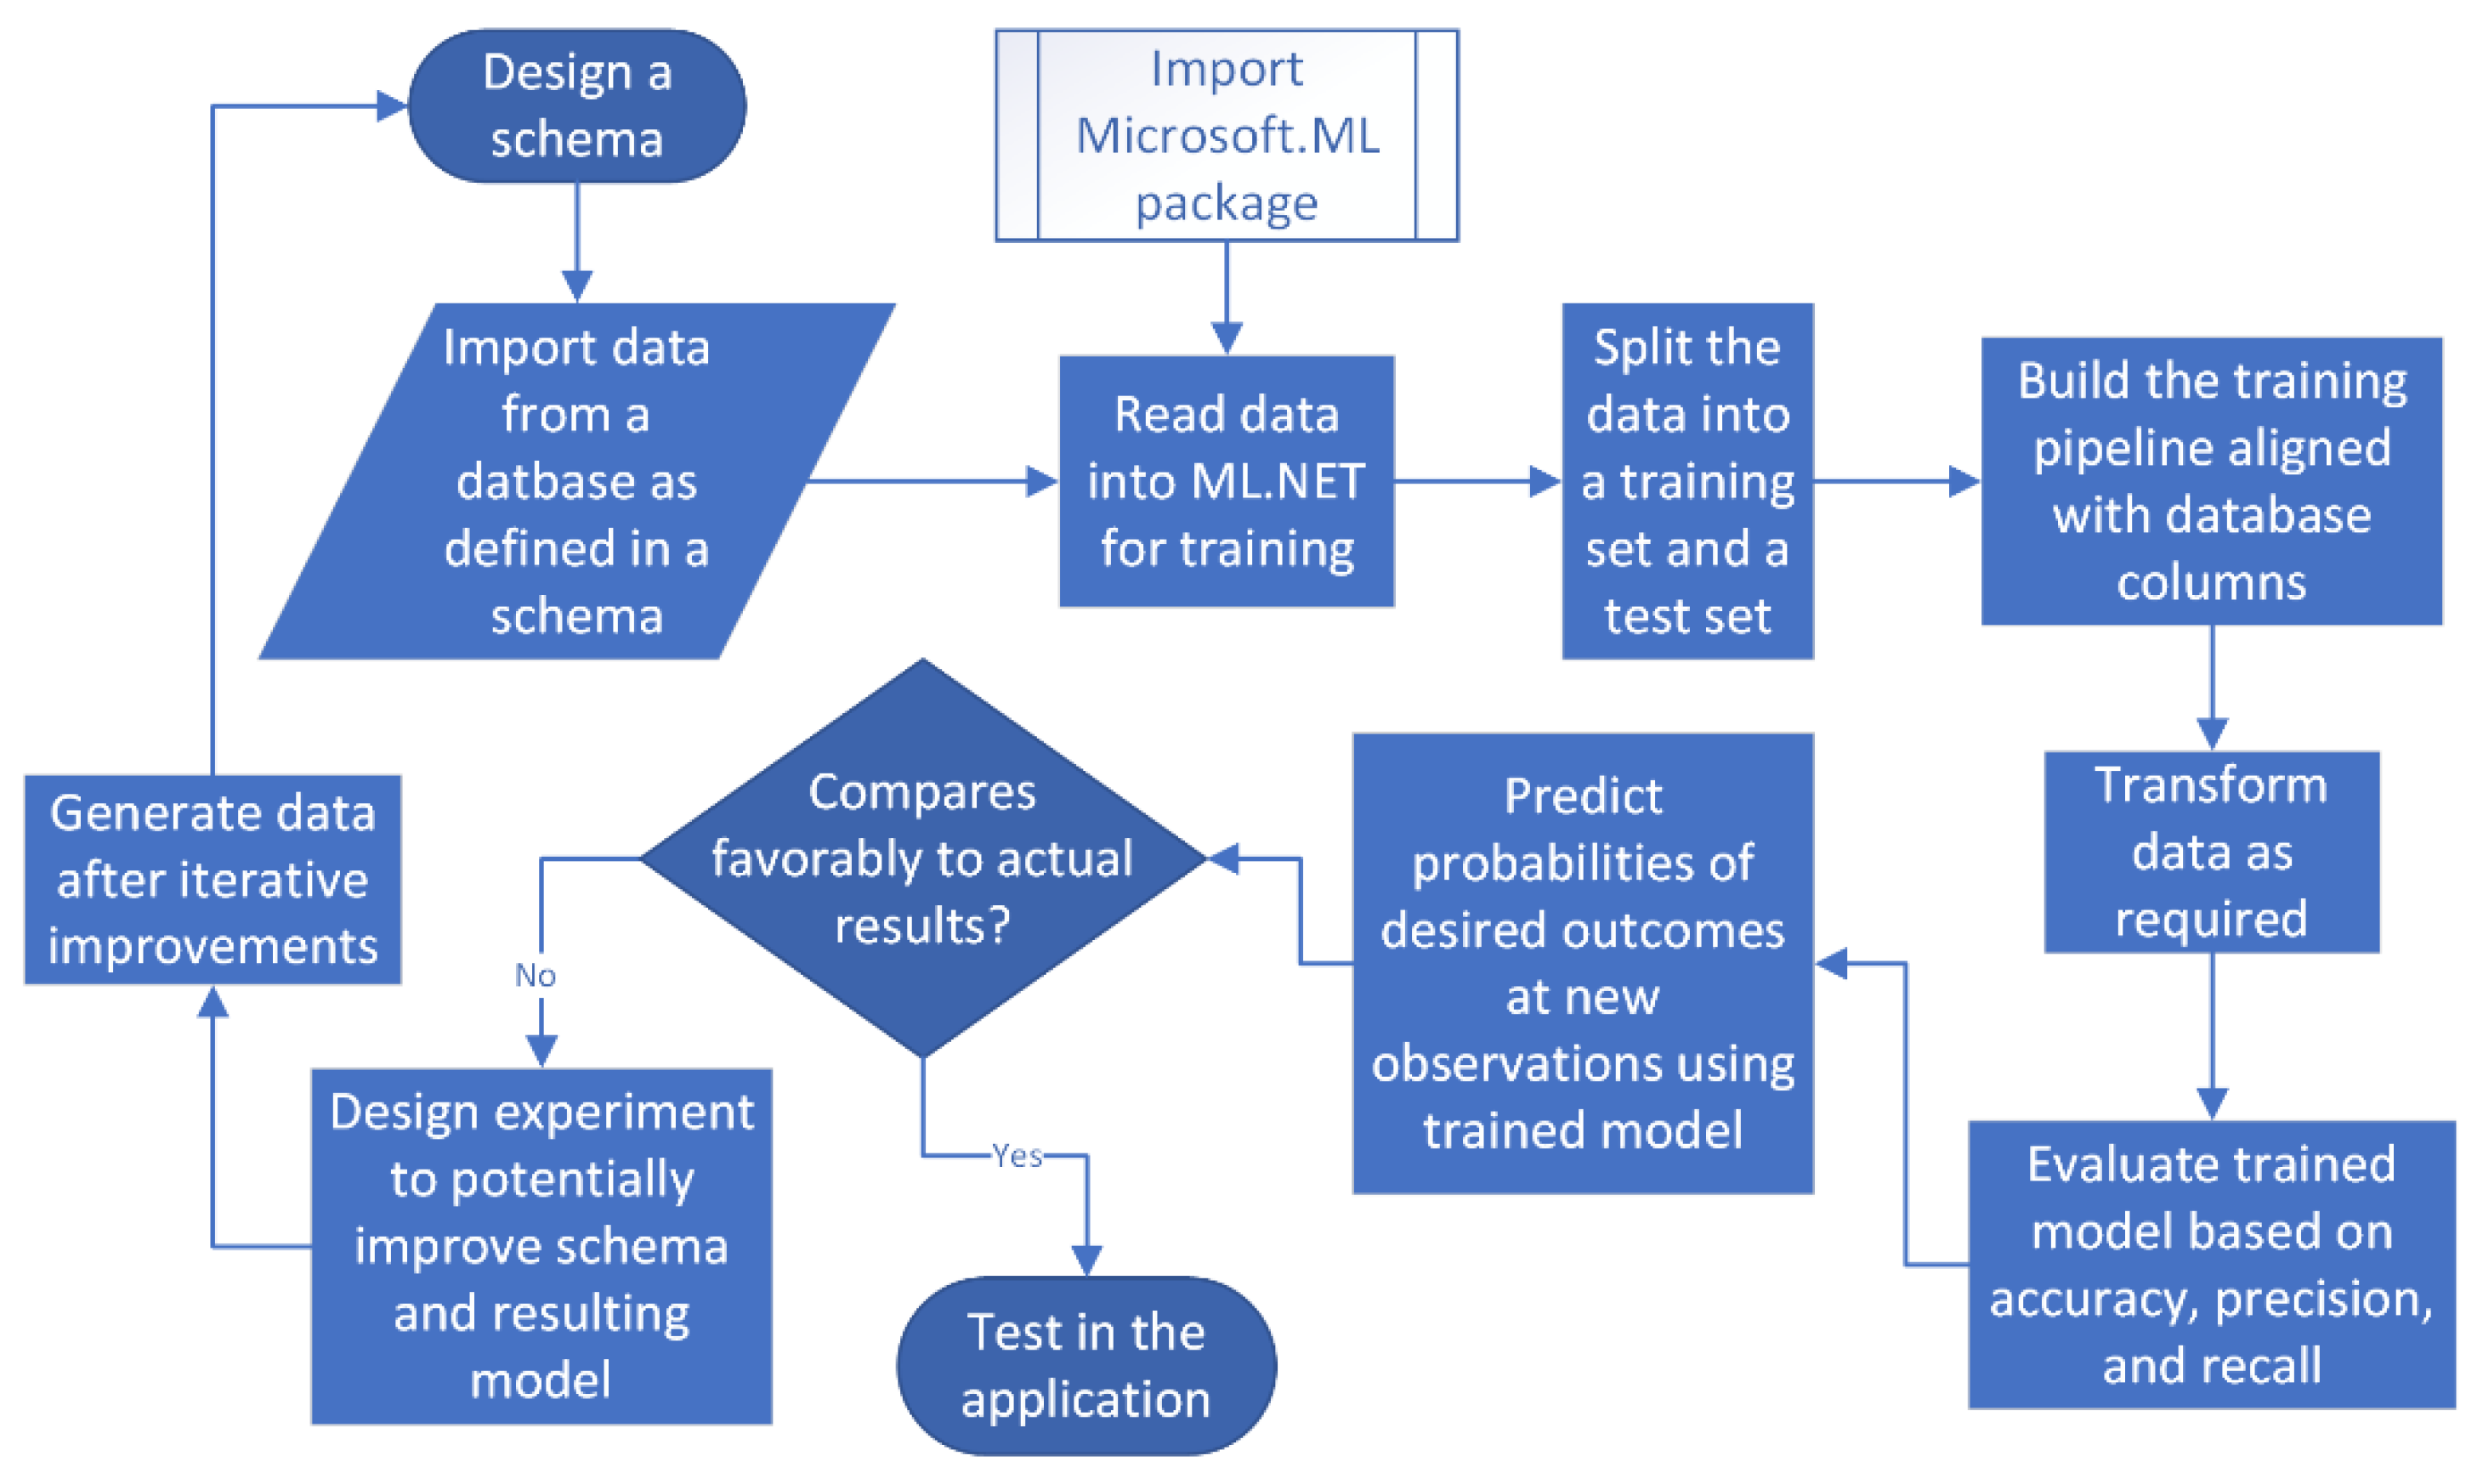
2. Materials and Methods

Figure 1 shows the main methodical process developed in this work to generate LeMIIIRC. Figure 1 highlights that a central challenge to iteratively address pertains to a search for the feasible intersection between architecture, machine learning algorithms, and the characteristics of inspection data for an application. That intersection is illustrated by the Venn diagram on the left side of Figure 1.
OpenCV and its library offer an architecture that enables a user with a headset to visualize computer-vision results [21,22,23]. The graphics in that architecture are easiest to visualize within a Unity platform. Headsets function best in Unity by utilizing the C# programming language for computer-vision applications. Some additional C++ programming enables integration with the OpenCV library. C# is also capable of generating datasets for training image recognition and using the associated scan data in a computer-vision process. Although there are many other ways to develop a solution, the goal of this work is to deliver a solution that is useful for a manufacturing operation and feasible for an enterprise to develop and implement on their own.
Algorithms of Bayesian Rule Lists (BRLs) have progressed in terms of greater computational speed, improved prediction accuracy, and greater depth of explainability. The foundations of BRL have been successively extended to Scalable BRL (SBRL) [24], followed by Certifiably Optimal RulE ListS (CORELS) [25], Optimal Sparse Decision Trees (OSDT) [26], and then Generalized and Scalable Optimal Sparse Decision Trees (GOSDT) [27]. To the point of usability in a manufacturing environment, there remains an opportunity to further develop the most suitable solution into code that can easily be integrated within a Unity platform in C#. The method and algorithm presented in this work enable such customizable integrations.
Thus, this work utilized the ML.NET framework [28,29] applied by the Microsoft.ML namespace and package [30]. This enables open-source easy coding of machine learning (ML) algorithms into any C# program. The resulting C# program should be compatible with any computer-vision system and its data management wherever they are developed in a Unity environment. For this type of problem, Binary Classification ML algorithms may be sufficient [31]. The ML.NET Model Builder provides some very user-friendly applications [32], but it was not able to generate usable results for this type of problem at the time of this work. To enable expedited solutions that are easy to replicate, a prepackaged software program in C# [33] was deployed to execute a Binary Classification algorithm in this work.
The use of the ML.NET framework for this application offers the advantages of potential seamless compatibility with OpenCV and C# to easily integrate within a Unity environment that may be the most compatible with image recognition technologies deployed in industry. There is potential to code some of the more advanced algorithms mentioned [24,25,26,27] that could predict more accurately. This may require more advanced software development in an environment such as Python, which will likely require industry to obtain more specialized resources to implement. Therefore, this work was developed within an environment that is most likely to lead to faster implementation in industry.
The flowchart in Figure 2 shows the functionality of the software as it was developed in the ML.NET architecture consistently with a prepackaged program [33]. Figure 2 shows how the design of an appropriate schema is a key foundation for the objectives of this study. The following subsection proposes a schema design to obtain the most suitable data for the general case.

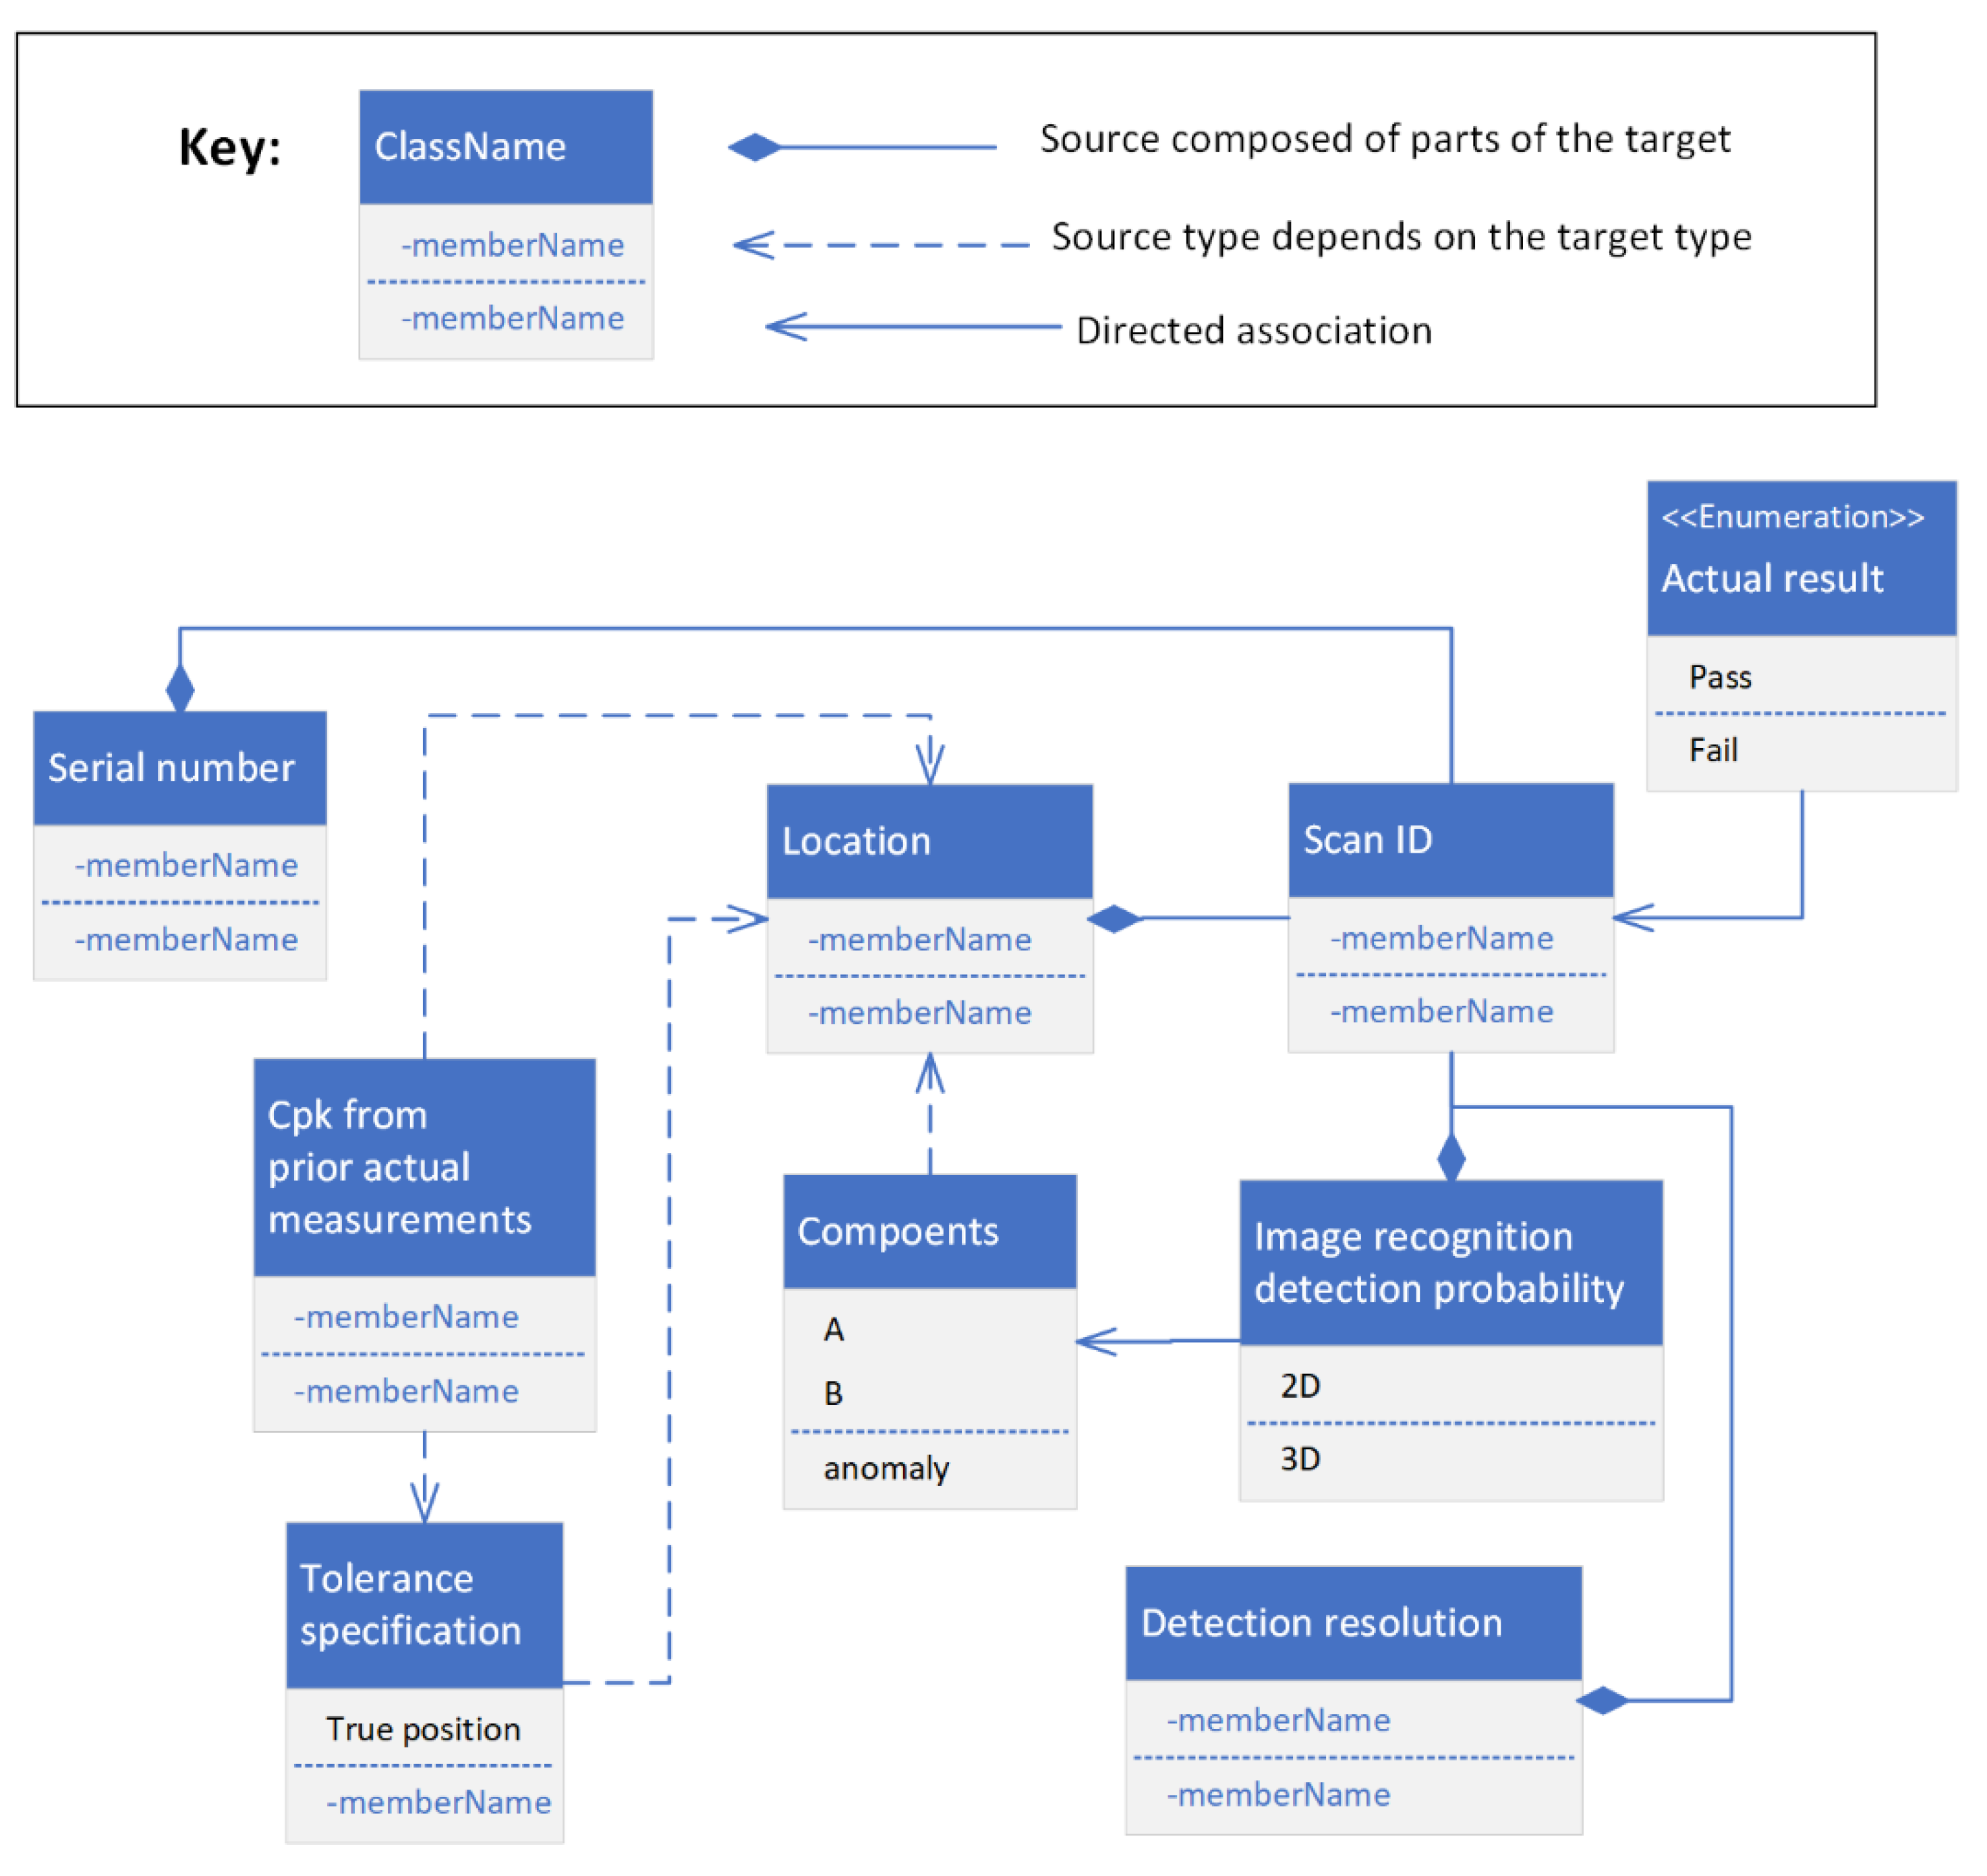
Schema Design for Assembly Inspection Data

Applications that require Design FMEA (DFMEA) suggest a need for a schema that can generate inferences based on semantics defined in some form of a relational database [18]. However, such semantic representations are likely not necessary for binary inspections of each product unit. In these cases, inferences from measurable data closely related to each specification will likely lead to the best informatics in each digital twin. This can be made seamless by programming with the SQLite database engine to avoid interfaces with various spreadsheets. This can be enabled by the entry of data into and from the ML execution in the C# program within a Unity application [34]. The central question driving a success metric based on FMEA principles for manufacturing concerns the probability of detection of each out-of-tolerance condition.
For binary inspections of assemblies, the output response for every datapoint is simply a pass or fail entry corresponding to the given set of measured observations. The design of the set of measurements that are practical and effective is central to this research. Figure 3 shows the proposed schema design to which datasets may generally conform. The class entities in the database schema shown in Figure 3 consist of information and data obtainable in an inspection system with minimal manual interventions and burdens. This schema design recognizes the limitations that two-dimensional (2D) image recognition can only recognize objects and not their location and that three-dimensional (3D) image recognition takes significantly longer and does not often have as high a success rate as the 2D techniques.
To better overcome these limitations, this schema utilizes calculations of the process capability index (Cpk) from a statistically significant number of prior inspection measurements related to each tolerance requirement specified. Cpk is a statistical measurement of the capability of a process to meet a tolerance specification. Cpk measures how many tripled standard deviations of common-cause process variability there are between the process mean and the nearest tolerance specification limit. A Cpk equal to one corresponds to a process yield of 99.73% on average.
When a high Cpk is established for a specification, image recognition only needs to find some unusual anomaly because the common variability will probably not approach a specification limit. Thus, when Cpk is high, 3D image recognition capability may not be important at all. Hypothetically, 2D image recognition can identify that everything is there as it should be without any identifiable foreign object debris (FOD). Where Cpk is lower, the expectation is that the resolution of 3D image recognition will have a much more significant effect on how likely it is that a tolerance specification such as the relative true position of an object will be met. An assembly can consist of various types of components, and some will be more likely to be identified by 3D image recognition than others. Furthermore, some objects could be stronger indicators of an out-of-tolerance condition when recognized. The confirmation of all such effects will be data-dependent.
It follows from Figure 2 that a schema is needed to execute such an application. The schema in Figure 3 is designed to produce a database or spreadsheet organized accordingly. Next, the design of details in the schematic of the UML diagram in Figure 3 should be explained in terms of the concepts that have been previously described. UML diagrams show relationships between classes in some form of a relational database into which data from image recognition systems can be integrated within an architecture such as Unity. Each serial number will have its own file instance of inspection records. Thus, each scan ID becomes a new record, or row, in the database of its serial number. In addition to the serial number, each scan ID is also composed of the location observed in the assembly, the 2D and 3D image recognition probabilities, and the resolution of 3D image recognition at that location. When 3D recognition probability is high and resolution is sharp relative to the tolerance band, the image recognition can be expected to be more likely to predict the correct result. All that information is generated at each image recognition scan and can be executed as a semiautonomous procedure.
Each image recognition scan applies to various components at that specified location in an assembly. The location is characterized generally by tolerance specifications. Each set of pertinent tolerance specifications will have its own dataset in the database because that is what is being inspected. Each tolerance specification will also have an associated Cpk, which will be determined by a statistically significant number (12–15) of previous measurements of that specification. The actual pass or fail result is assessed for each image scan in the database in terms of whether that image scan can correctly determine whether tolerances are met. That assessment entry is critical to make each record meaningful for training a binary classification model. The following section demonstrates the method of using this schema design to generate LeMIIIRC in an example.

3. Results

This section introduces a benchmark case study from a conventional machine learning application followed by a manufacturing inspection case study in subsequent subsections.

3.1. Baseline Test of Machine Learning Capabilities

For comparison of the same software program [33] with data known to generate desirable results, the program was executed without any tailored modifications with its accompanying dataset and is summarized in Table 1. This dataset consists of 890 passengers who were on the Titanic. The binary result in the last column indicates whether each passenger survived the sinking of the ship based on the input variables in the first three columns that characterize each passenger. The test resulted in a model accuracy of 85.1%, an area under the precision–recall curve of 84.3%, and an F1 score of 79.7%. The probability that a 30-year female traveling in first class survives was predicted to be 98.0%. The probability that a 60-year male traveling in third class survives was predicted to be 6.7%. These results did change to an extent when smaller sample sizes of the full dataset were used.

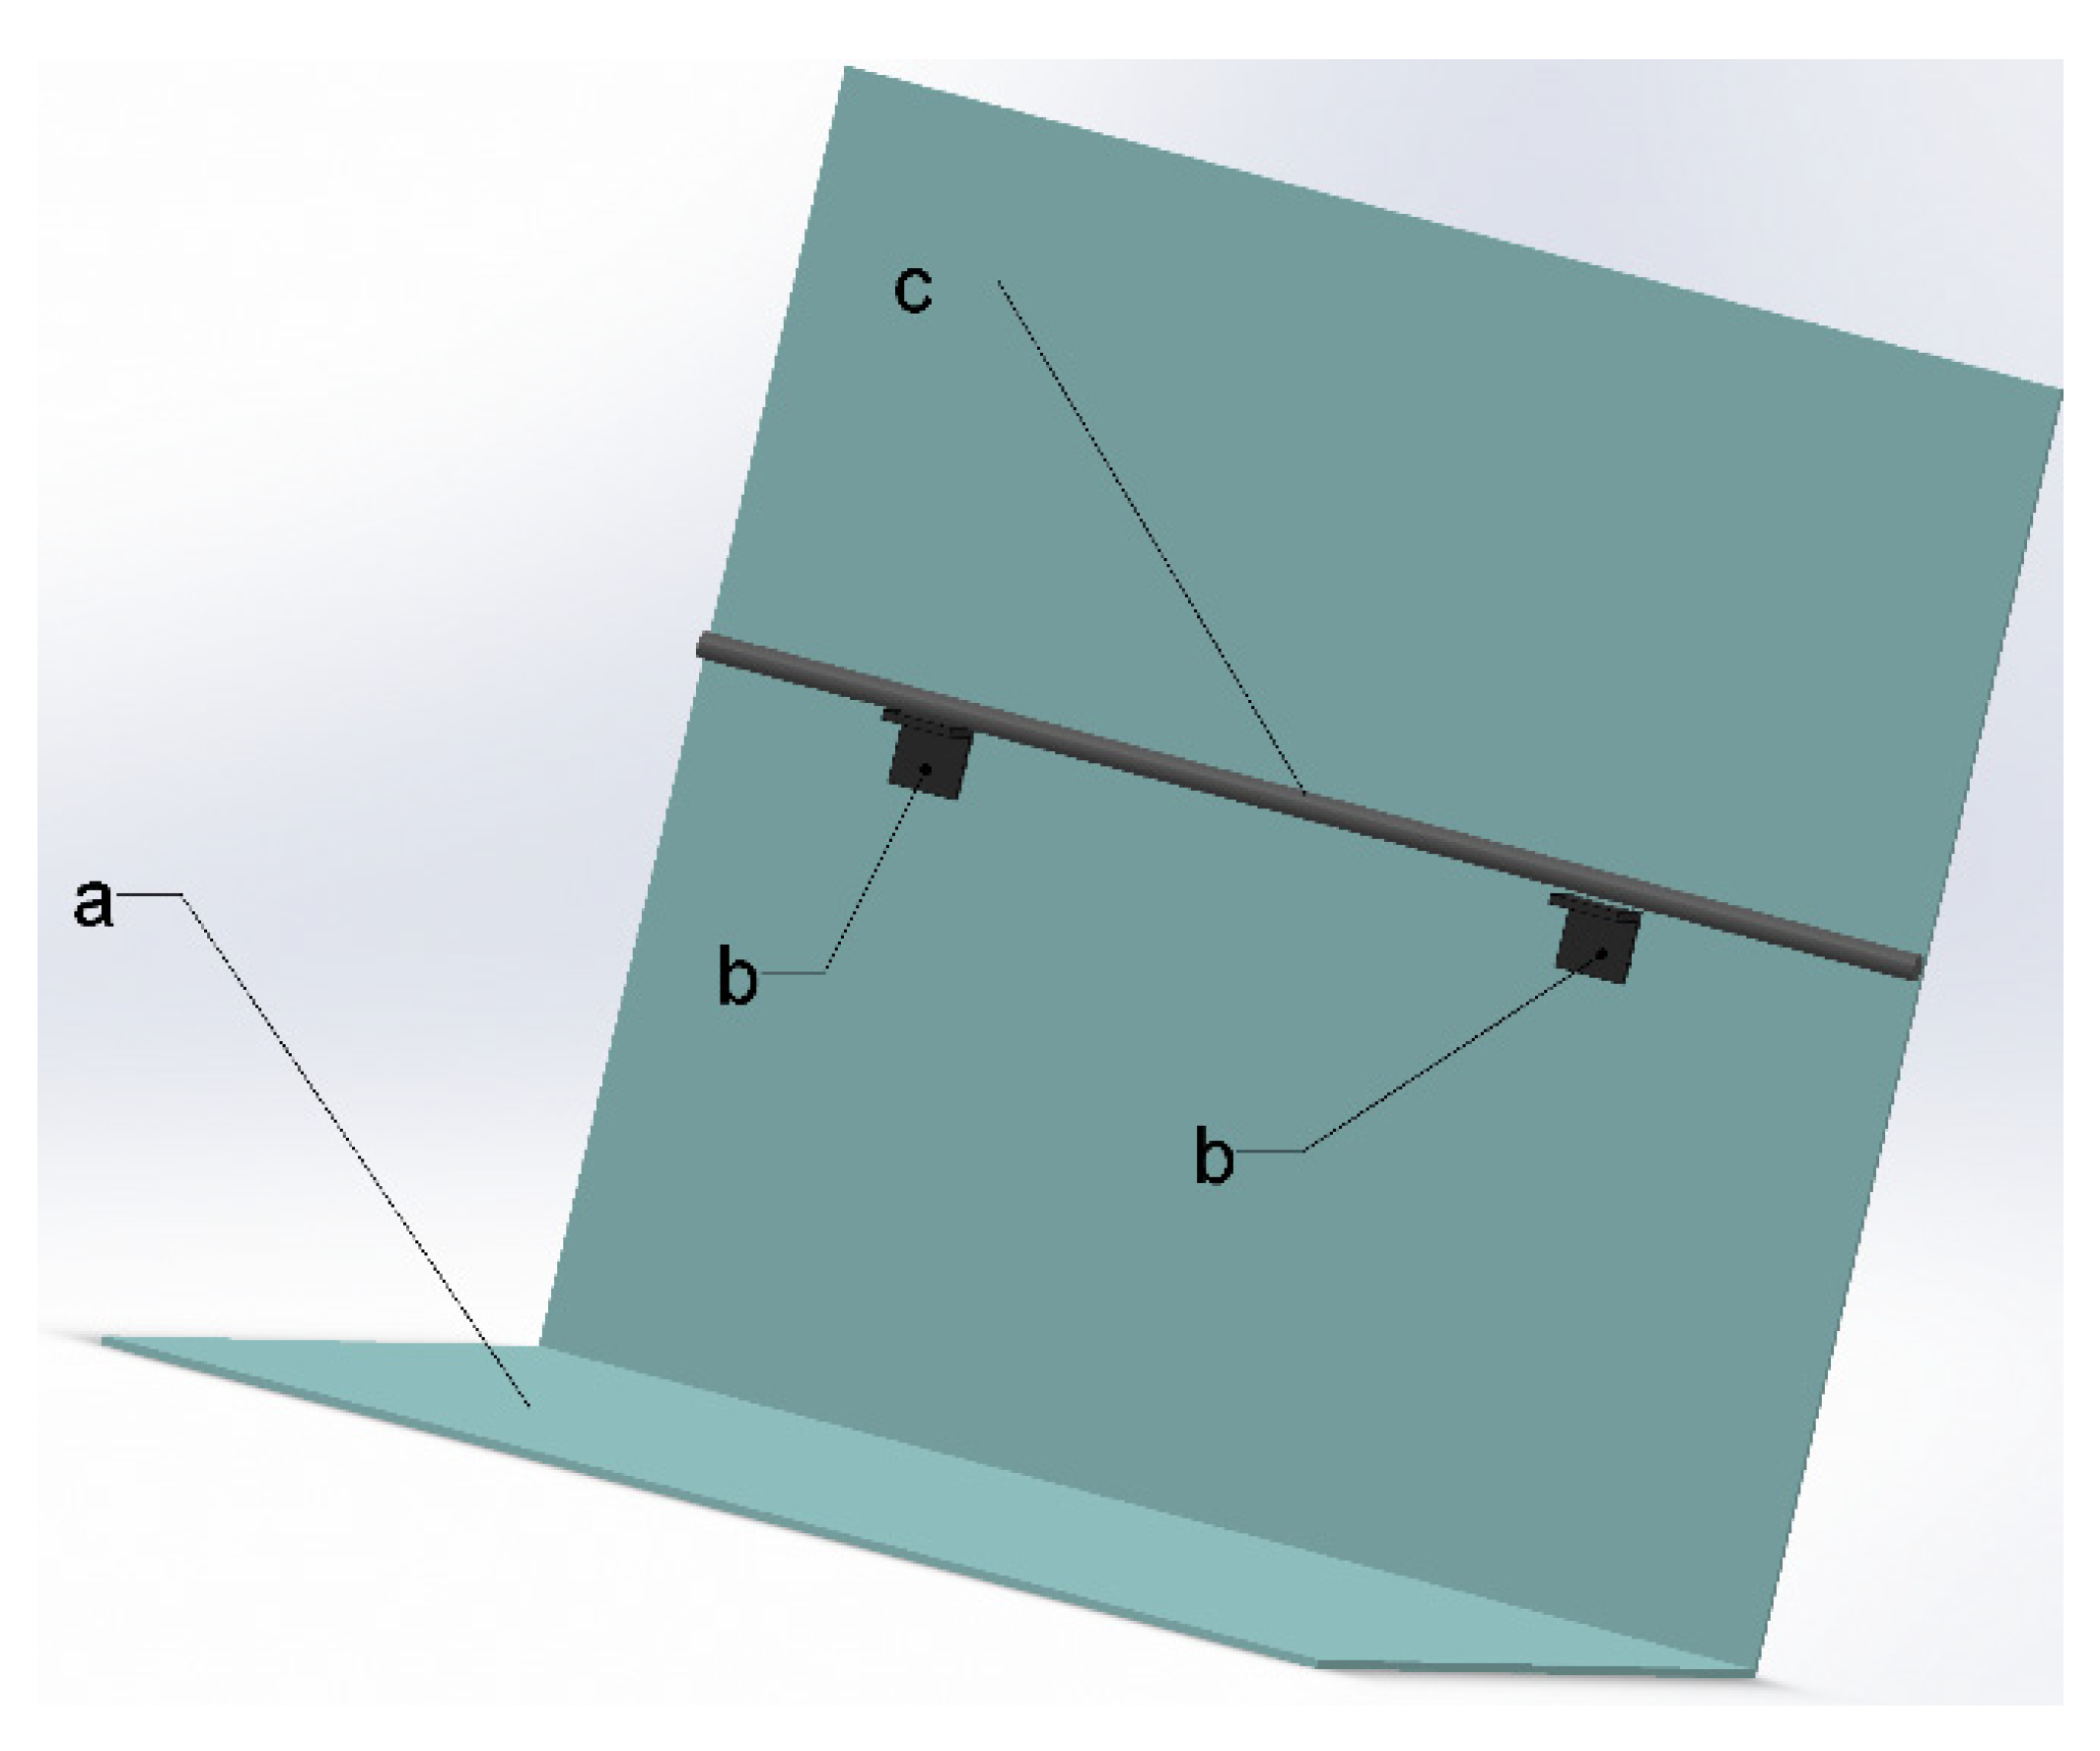
3.2. Case Study: Assembly of Cable Harnesses

Cable harness assemblies can be sensitive to tolerance specifications because each electrical wire is often cut to nearly its exact length to avoid excessive cable slack or inadequate reach for a secure connection. Figure 4 illustrates an archetype of just one of many such assemblies found in an enclosure or track with such assemblies. If examined closely, a very small gap appears between the bracket on the right and the taut cable above it. Of course, the cable will be clamped to both brackets. The inspector must find out as quickly as possible if this will be acceptable or not, and the assumption in this case is that the assembly tolerance definitions are complete and specified correctly.
For illustrative purposes, hypothetical data were generated by a designed random simulation within the assumed value ranges given in Table 2. These simulations may represent something that could occur in actual practice in a real assembly operation. The first few rows of data points in the generated dataset are shown in Table 2, and the column fields of this data set conform to the schema design shown in Figure 3. Cpk in the sixth column was calculated in advance from fifteen hypothetical measurements relative to the tolerance specifications at four different bracket locations, which is why four values of Cpk are repeated every four rows in Table 2.
Due to the number of small faces on the brackets, the detectability of the brackets with 3D point clouds may not be reliably predictable. The continuous surface of the cables might be recognized far more frequently. However, if a Cpk value is high, the 3D object recognition of bracket position may often not be necessary for quality assurance, especially if the mounted cable can be recognized and measured to some extent. In such cases with a high Cpk value, the value in the first column may be far more important to determine whether anything unusual might have occurred based on what is recognized, as is reported in the second column. Other columns can be more significant when the 3D images are essential to assessments when the Cpk is lower. Once the Cpk is known, it is unlikely to change unless there is some type of process change to compel new measurements. All other values in the first five columns are usually available semi-autonomously from a computer-vision system. Notably, the results in the last column for this case were logically deduced based on the other values in each corresponding row to expedite some initial results. Data from an actual manufacturing operation were not yet generated for this initial illustrative study. Probably due to randomness of simulations, this test resulted in a model accuracy of 67.3%, an area under the precision–recall curve of 58.4%, and an F1 score of 50.0%. The last three rows in Table 2 below the solid line show the probability of the ability to correctly predict an in-tolerance condition in the last column based on values at the new observation points and the model trained from the dataset. The chart in Figure 5 shows the comparative results of the model tests reported here and in the prior subsection.

3.3. Recommended Experimental Design for Assembly of Cable Harness Case Study

For a more realistic test, this subsection details an experiment devised to represent various potential assembly scenarios of this example. Such a test could be performed whenever equipment is available to physically run this experiment. This experimental design assumed manufacturing tolerance specifications of cable length between any secured connections within 15 mm of the true position of the cable and every bracket within 3 mm of its true position location. These tolerance requirements apply to the three-dimensional true positions. To test extreme cases more efficiently, image recognition test locations were set up with assemblies located about three standard deviations from the exact true positions.
High, medium, and low levels were selected for values of Cpk, scan measurement resolution, and image detectability percentage for both 2D and 3D image recognition. Columns in Table 3 associated with each of these three variables have corresponding columns labeled as Variable 1, Variable 2, and Variable 3, respectively. Design locations were changed at the different Cpk levels to correspond to three standard deviations off location at each process capability level to represent extreme cases of concern. Anomalies would be introduced for each case to represent some realistically random possible type of consequential and unusual mishap and to obtain a second dataset in the second set of nine rows. An L9 orthogonal array was used to construct the experiments to obtain both datasets. This is designed consistently with the Variable 1–3 labels shown in Table 3. Thus, eighteen different trials are represented by eighteen rows in Table 3 where measurements may be recorded whenever available to train the algorithm. Values in cells currently labeled as “high”, “middle”, or “low” can be similarly determined quantitatively from the measurements of the detection capability of the system and equipment used in an experiment.
For each trial, an assessment must be made about whether the in-tolerance condition can be correctly predicted based on the image recognition observed. This assessment can be entered in the last column in Table 3 and confirmed by actual measurements if necessary. Table 3 shows this experimental design with recommended values in each cell for each of the eighteen trials. The last two columns are left blank to accept the recorded results. It is assumed here that no anomaly will be detected in the first nine trials where none is present.
Using the model trained by the LeMIIIRC algorithm with actual data after entry into Table 3, the probabilities of correctly predicting whether within-tolerance specification may be estimated from the trained model. These probabilities may be estimated for several randomly generated sample points that are marginally close to one or both tolerance limits. The expected result is an estimated probability that a bracket and cable seen in the images are known to be within tolerance. If that test is carried out with data from manufacturing operations generated by an experiment conducted by the design recommended in this section, a comparison to the results generated by the test in Section 3.1 could reveal further insights.

4. Discussion

The overall aim of this work was to develop means able of inferring and assessing by intelligent insights whether autonomously inspected features are within tolerance specifications while minimizing an inspector’s effort and time burden. While previous studies introduced techniques to identify various types of defects, research assessing the dimensional tolerance limits of interest to industry remains rare. Given the unique scope, the contribution of this study can be evaluated in terms of its utility as a starting point for potential implementation in industry.
The schema introduced in this study should save an inspector time after the initial set up because data inputs can be autonomously populated by an image recognition system. The next question pertains to how reliable and useful the predictions from trained models can become. The answers may likely prove to differ among various applications as they are tested. However, the logic of this schema design should be useful to generate some patterns that can be learned by binary classification models. When Cpk is higher, more difficult 3D image recognition is less likely to be necessary. The simpler 2D techniques may be sufficient to learn any impactful patterns posed by typical anomalies with sufficient robustness. Thus, the orthogonal experimental design provided in Table 3 may prove to be an effective way to train models that can inform inspectors of a confidence level they can rely upon given each autonomous observation because the method provided is based on statistical probabilities. The main limitation at this stage is that more testing must be performed to better understand when such semiautonomous inspections will be that reliable.
The next steps recommended are to run a case study similar to the one presented in Section 3.2 and Section 3.3 with inspection data from various manufacturing assemblies. The physical construction and execution of the experiment designed in Table 3 was beyond the scope of this work. However, the development from this work introduces a premise that manufacturing data from a schema designed similarly to Table 3 could generate results comparable to those demonstrated in Table 1 with historical data. Machine learning by binary classification is more likely to recognize patterns in manufacturing environments and overcome the limitations of hypothesized responses as shown in Table 2. It is notable that more data might be necessary than the initial set recommended in Table 3 for adequate learning. There are eight independent variables in Table 3, compared to only three in Table 1. There are also many more data points in the dataset used in Table 1 than prescribed in Table 3.
Nonetheless, these early results could be promising in terms of the intelligent insights this work aimed to obtain. The same algorithm with data from a historical source was shown to generate very useful results [33], as demonstrated in Table 1. Enough manufacturing data may show that some variables are not highly significant and enable reduced dimensionality. Accordingly, as comparisons are made to the benchmark with trials using manufacturing data, capabilities and limitations will be increasingly understood for iteratively more optimal experimental design to achieve potential further adoption and increasingly effective use. The application demonstrated in Section 3.2 and Section 3.3 may be an ideal archetype to use to commence such trials. That example consists of components that pose some common challenges solvable by image recognition and applicable dimensional tolerance requirements. After such an implementation, these methods should be extendable to many other applications mentioned earlier in this paper.

5. Conclusions

This study addressed a need to inform assembly inspectors with intelligent insights into the likelihood that image recognition observations ensure that a tolerance requirement is met. A method and schema are introduced to learn the probability of success from a binary classification algorithm applied to inspection data. The schema is designed to utilize data that can be generated by autonomous image recognition systems and knowledge about the process capability that can be determined in advance. An experiment was designed for a representative archetype as an example that may be implemented in industry to test and compare with results from an established benchmark test case that uses historical data with a binary classification algorithm. The methods and examples provided could enable testing and further advancements toward implementation in industry over time.

Author Contributions

Conceptualization, D.E., M.W. and D.B.; methodology, D.E. and D.B.; software, D.E. and D.B.; validation, D.E.; formal analysis, D.E.; investigation, D.E., M.W. and D.B.; resources, D.E. and D.B.; data curation, D.E. and D.B.; writing—original draft preparation, D.E.; writing—review and editing, D.E.; visualization, D.E. and D.B.; supervision, M.W. and D.B.; project administration, M.W.; funding acquisition, M.W. All authors have read and agreed to the published version of the manuscript.

Funding

This material is based upon work supported by industry members of the National Science Foundation’s Industry-University Cooperative Research Center for e-Design supported by NSF grant number 1650527.

Institutional Review Board Statement

Not applicable.

Informed Consent Statement

Not applicable.

Data Availability Statement

Not applicable.

Acknowledgments

Contents from Section 1, Section 2 and Section 3.2, Figure 1, Figure 3 and Figure 4, and Table 2 are reused in this publication courtesy of the conference paper citation of Douglas Eddy, Michael White, Damon Blanchette, “Learned Manufacturing Inspection Inferences from Image Recognition Capabilities”, FAIM 2022 conference, LNME Springer.

Conflicts of Interest

The authors declare no conflict of interest. The funders had no role in the design of the study; in the collection, analyses, or interpretation of data; in the writing of the manuscript; or in the decision to publish the results.

References

  1. See, J.E.; Drury, C.G.; Speed, A.; Williams, A.; Khalandi, N. The role of visual inspection in the 21st century. In Proceedings of the Human Factors and Ergonomics Society Annual Meeting, Austin, TX, USA, 9–13 October 2017; Sage CA: Los Angeles, CA, USA; Volume 61, pp. 262–266. [Google Scholar]
  2. See, J.E. SAND2012-8590; Visual inspection: A review of the literature. Sandia Report, SAND2012-8590; Sandia National Laboratories: Albuquerque, NM, USA, 2012.
  3. Liao, H.-C.; Lim, Z.-Y.; Hu, Y.-X.; Tseng, H.-W. Guidelines of automated optical inspection (AOI) system development. In Proceedings of the 2018 IEEE 3rd International Conference on Signal and Image Processing (ICSIP), Shenzhen, China, 13–15 July 2018; pp. 362–366. [Google Scholar]
  4. Schlake, B.W.; Todorovic, S.; Edwards, J.R.; Hart, J.M.; Ahuja, N.; Barkan, C.P. Machine vision condition monitoring of heavy-axle load railcar structural underframe components. Proc. Inst. Mech. Eng. Part F J. Rail Rapid Transit 2010, 224, 499–511. [Google Scholar] [CrossRef] [Green Version]
  5. Kumar, A. Computer-vision-based fabric defect detection: A survey. IEEE Trans. Ind. Electron. 2008, 55, 348–363. [Google Scholar] [CrossRef]
  6. Ahmed, S. A review on using opportunities of augmented reality and virtual reality in construction project management. Organ. Technol. Manag. Constr. Int. J. 2018, 10, 1839–1852. [Google Scholar] [CrossRef] [Green Version]
  7. Aust, J.; Mitrovic, A.; Pons, D. Assessment of the Effect of Cleanliness on the Visual Inspection of Aircraft Engine Blades: An Eye Tracking Study. Sensors 2021, 21, 6135. [Google Scholar] [CrossRef] [PubMed]
  8. Duchowski, A.T. A breadth-first survey of eye-tracking applications. Behav. Res. Methods Instrum. Comput. 2002, 34, 455–470. [Google Scholar] [CrossRef]
  9. Pan, H.; Pang, Z.; Wang, Y.; Wang, Y.; Chen, L. A new image recognition and classification method combining transfer learning algorithm and mobilenet model for welding defects. IEEE Access 2020, 8, 119951–119960. [Google Scholar] [CrossRef]
  10. Akinci, B.; Boukamp, F.; Gordon, C.; Huber, D.; Lyons, C.; Park, K. A formalism for utilization of sensor systems and integrated project models for active construction quality control. Autom. Constr. 2006, 15, 124–138. [Google Scholar] [CrossRef] [Green Version]
  11. Hong, K.; Nagarajah, R.; Iovenitti, P.; Dunn, M. A sociotechnical approach to achieve zero defect manufacturing of complex manual assemblies. Hum. Factors Ergon. Manuf. Serv. Ind. 2007, 17, 137–148. [Google Scholar] [CrossRef]
  12. Galetto, M.; Verna, E.; Genta, G. Accurate estimation of prediction models for operator-induced defects in assembly manufacturing processes. Qual. Eng. 2020, 32, 595–613. [Google Scholar] [CrossRef]
  13. Benbarrad, T.; Salhaoui, M.; Kenitar, S.B.; Arioua, M. Intelligent machine vision model for defective product inspection based on machine learning. J. Sens. Actuator Netw. 2021, 10, 7. [Google Scholar] [CrossRef]
  14. Jaber, A.; Sattarpanah Karganroudi, S.; Meiabadi, M.S.; Aminzadeh, A.; Ibrahim, H.; Adda, M.; Taheri, H. On Smart Geometric Non-Destructive Evaluation: Inspection Methods, Overview, and Challenges. Materials 2022, 15, 7187. [Google Scholar] [CrossRef] [PubMed]
  15. Sahoo, S.; Lo, C.Y. Smart manufacturing powered by recent technological advancements: A review. J. Manuf. Syst. 2022, 64, 236–250. [Google Scholar] [CrossRef]
  16. Jarrahi, M.H. Artificial intelligence and the future of work: Human-AI symbiosis in organizational decision making. Bus. Horiz. 2018, 61, 577–586. [Google Scholar] [CrossRef]
  17. Pugna, A.; Negrea, R.; Miclea, S. Using Six Sigma methodology to improve the assembly process in an automotive company. Procedia-Soc. Behav. Sci. 2016, 221, 308–316. [Google Scholar] [CrossRef] [Green Version]
  18. Eddy, D.; Krishnamurty, S.; Grosse, I.; White, M.; Blanchette, D. A Defect Prevention Concept Using Artificial Intelligence. In International Design Engineering Technical Conferences and Computers and Information in Engineering Conference; American Society of Mechanical Engineers: New York, NY, USA, 2020; Volume 83983, p. V009T09A040. [Google Scholar]
  19. Letham, B.; Rudin, C.; McCormick, T.H.; Madigan, D. Interpretable classifiers using rules and Bayesian analysis: Building a better stroke prediction model. Ann. Appl. Stat. 2015, 9, 1350–1371. [Google Scholar] [CrossRef]
  20. Eddy, D.; White, M.; Blanchette, D. Learned Manufacturing Inspection Inferences from Image Recognition Capabilities. In Proceedings of the FAIM Conference; Detroit, MI, USA, 19–23 June 2022, LNME Springer: New York, NY, USA, 2022. [Google Scholar]
  21. Azangoo, M.; Blech, J.O.; Atmojo, U.D.; Vyatkin, V.; Dhakal, K.; Eriksson, M.; Lehtimäki, M.; Leinola, J.; Pietarila, P. Towards a 3d scanning/VR-based product inspection station. In Proceedings of the 2020 25th IEEE International Conference on Emerging Technologies and Factory Automation (ETFA), Vienna, Austria, 8–11 September 2020; Volume 1, pp. 1263–1266. [Google Scholar]
  22. Kane, S.K.; Avrahami, D.; Wobbrock, J.O.; Harrison, B.; Rea, A.D.; Philipose, M.; LaMarca, A. Bonfire: A nomadic system for hybrid laptop-tabletop interaction. In Proceedings of the 22nd Annual ACM Symposium on User Interface Software and Technology, Victoria, BC, Canada, 4 October 2009; pp. 129–138. [Google Scholar]
  23. Chaccour, K.; Badr, G. Computer vision guidance system for indoor navigation of visually impaired people. In Proceedings of the 2016 IEEE 8th International Conference on Intelligent Systems (IS), Sofia, Bulgaria, 4–6 September 2016; pp. 449–454. [Google Scholar]
  24. Yang, H.; Rudin, C.; Seltzer, M. Scalable Bayesian rule lists. In Proceedings of the International Conference on Machine Learning, Sydney, Australia, 6–11 August 2017; pp. 3921–3930. [Google Scholar]
  25. Angelino, E.; Larus-Stone, N.; Alabi, D.; Seltzer, M.; Rudin, C. Learning certifiably optimal rule lists for categorical data. arXiv preprint 2017, arXiv:1704.01701. [Google Scholar]
  26. Hu, X.; Rudin, C.; Seltzer, M. Optimal sparse decision trees. In Advances in Neural Information Processing Systems; Curran Associates, Inc.: Red Hook, NY, USA, 2019; Volume 32. [Google Scholar]
  27. Lin, J.; Zhong, C.; Hu, D.; Rudin, C.; Seltzer, M. Generalized and scalable optimal sparse decision trees. In Proceedings of the International Conference on Machine Learning, Virtual, 13–18 July 2020; Volume 119, pp. 6150–6160. [Google Scholar]
  28. Ahmed, Z.; Amizadeh, S.; Bilenko, M.; Carr, R.; Chin, W.S.; Dekel, Y.; Dupre, X.; Eksarevskiy, V.; Filipi, S.; Finley, T.; et al. Machine learning at Microsoft with ml. net. In Proceedings of the 25th ACM SIGKDD International Conference on Knowledge Discovery & Data Mining, Anchorage, AK, USA, 4–8 August 2019; pp. 2448–2458. [Google Scholar]
  29. Lee, Y.; Scolari, A.; Chun, B.-G.; Weimer, M.; Interlandi, M. From the Edge to the Cloud: Model Serving in ML. NET. IEEE Data Eng. Bull. 2018, 41, 46–53. [Google Scholar]
  30. MLContext Class for All ML.NET Operations. Available online: https://web.archive.org/web/20221230150427/https://learn.microsoft.com/en-us/dotnet/api/microsoft.ml.mlcontext?view=ml-dotnet&viewFallbackFrom=ml-dotnet* (accessed on 30 December 2022).
  31. Kumari, R.; Srivastava, S.K. Machine learning: A review on binary classification. Int. J. Comput. Appl. 2017, 160. [Google Scholar] [CrossRef]
  32. What Is Model Builder and How Does It Work? Available online: https://web.archive.org/web/20221213185459/https://learn.microsoft.com/en-us/dotnet/machine-learning/automate-training-with-model-builder (accessed on 30 December 2022).
  33. Jeffprosise-ML.NET / MLN-BinaryClassification/. Available online: http://web.archive.org/web/20221213185739/https://github.com/jeffprosise/ML.NET/tree/master/MLN-BinaryClassification (accessed on 13 December 2022).
  34. Yong-kang, J.; Yong, C.; Daquan, T. Design of an UAV simulation training and assessment system based on Unity3D. In Proceedings of the 2017 IEEE International Conference on Unmanned Systems (ICUS), Beijing, China, 27–29 October 2017; pp. 163–167. [Google Scholar]
Figure 1. High-level schematic of the method to generate LeMIIIRC, modified from [20].
Machines 11 00045 g001
Figure 2. Flowchart of software developed in ML.NET.
Machines 11 00045 g002
Figure 3. Schema design for data inputs for LeMIIIRC, reprinted from [20].
Machines 11 00045 g003
Figure 4. Partial illustration of the cable harness assembly example with (a) a cutaway view of the main structure, (b) brackets holding a cable, and (c) an electrical cable; modified from [20].
Machines 11 00045 g004
Figure 5. Results from training models in examples.
Machines 11 00045 g005
Table 1. Summary of baseline dataset utilized from [33].
Passenger ClassSexAgeSurvived
3male220
1female381
3female261
1female351
3male350
3male 0
1male540
3male20
3female271
2female141
3female41
Table 2. Data generated by random simulation for the case study, modified from [20].
Item or FOD 2D Detectability PercentageObserved Anomaly3D Point Cloud Bracket Detectability Percentage3D Point Cloud Cable Detectability PercentageMeasurement Uncertainty = std. dev. of Scan Measurement/Tolerance RangeCpkAble to Tell Whether Assembly Is In-Tolerance from Image Recognition?
78False6032281.29True
86False7431101.62True
59False6533441.97True
89False7249531.37True
82True35621101.29False
51False164881.62True
90False5328971.97True
90False74381121.37False
60True5545341.29False
74False4591711.62True
55False2282621.97True
89False1629211.37False
60False4363861.29True
65False68851081.62True
83False2048541.97True
67True3965301.37True
27True2257992.000.0%
85False6788111.000.6%
11True12231501.850.0%
Table 3. Data to be generated by the designed experiment.
Variable 1Variable 2Variable 3
CpkBracket DeviationCable DeviationScan Measurement Resolution2D Detectability Percentage3D Detectability PercentageAnomaly PresentAnomaly DetectedConfident of within Tolerance Specifications Based On Image Recognition (Yes or No)?
BracketCableBracketCable
Low = 1.003 mm15 mmLowLowLowLowLowNoNo
Middle = 1.252.4 mm12 mmMiddleHighHighHighHighNoNo
High = 1.502 mm10 mmHighMiddleMiddleMiddleMiddleNoNo
Low = 1.003 mm15 mmMiddleMiddleMiddleMiddleMiddleNoNo
Middle = 1.252.4 mm12 mmHighLowLowLowLowNoNo
High = 1.502 mm10 mmLowHighHighHighHighNoNo
Low = 1.003 mm15 mmHighHighHighHighHighNoNo
Middle = 1.252.4 mm12 mmLowMiddleMiddleMiddleMiddleNoNo
High = 1.502 mm10 mmMiddleLowLowLowLowNoNo
Low = 1.003 mm15 mmLowLowLowLowLowYes
Middle = 1.252.4 mm12 mmMiddleHighHighHighHighYes
High = 1.502 mm10 mmHighMiddleMiddleMiddleMiddleYes
Low = 1.003 mm15 mmMiddleMiddleMiddleMiddleMiddleYes
Middle = 1.252.4 mm12 mmHighLowLowLowLowYes
High = 1.502 mm10 mmLowHighHighHighHighYes
Low = 1.003 mm15 mmHighHighHighHighHighYes
Middle = 1.252.4 mm12 mmLowMiddleMiddleMiddleMiddleYes
High = 1.502 mm10 mmMiddleLowLowLowLowYes
Disclaimer/Publisher’s Note: The statements, opinions and data contained in all publications are solely those of the individual author(s) and contributor(s) and not of MDPI and/or the editor(s). MDPI and/or the editor(s) disclaim responsibility for any injury to people or property resulting from any ideas, methods, instructions or products referred to in the content.

