1. Introduction
The increasing demand for electric vehicles (VEs) is promoted by the availability of power storage systems such as LIB technology. LIBs have been recognized as the most efficient technology for storing energy due to their long lifetime, low self-discharge, high energy density, and high capacity [
1,
2].
EV applications require a high-output-power LIB pack to power the engine system under different operating conditions. An LIB pack operating for a long time needs voltage, current, and temperature control. Due to the internal construction properties of LIBs, when they are connected in series in a module, there are minor differences in the internal resistance between LIBs [
3,
4].
In addition, changes in temperature, self-discharge rate, aging degradation, and voltage imbalance occur, resulting in reliability and safety issues [
5]. To avoid these problems, a battery management system (BMS) is used, responsible for monitoring the voltage, current, and temperature parameters and controlling through software and hardware [
6,
7].
In the literature, there are several types of BMSs, highlighting the conventional BMSs that have state-of-charge (SOC), state-of-life (SOH) algorithm, passive/active equalizer, and current, voltage, and temperature protection systems. A recent study by [
8] simulated a hybrid BMS, which is active at the stack and has passive management at the module. This technique demonstrated better results when compared to other arrangements.
Typically, these BMSs are self-programmed to perform only these functions, not taking into account the degradation of LIBs over time [
9]. In addition, the traditional BMS has a complex circuit and lacks the presence of online fault diagnoses and prognoses due to the limitation of computational availability in the vehicle [
10].
Therefore, using ML combined with data-driven systems can be the way to solve these limitations. The data-driven systems allow the cloud–edge computing concept that can operate in real-time, collecting the data of the BMS and processing to update the thresholds according to the natural degradation of the cells [
11].
In this way, the edge collects, processes, and sends the information to the cloud [
11]. The cloud platform can use robust processing systems to process, build, and train complex ML algorithms that would not be possible to run in the vehicle [
12]. Then, the model can be downloaded to the edge, where the trained models make inferences in real-time without latency and allow the use of diagnosis and prognosis models on board [
11].
The cyber–physical BMSs would be more assertive in identifying the failures in the first stage to avoid the degradation’s velocity or even performance and security issues [
2]. In the literature, it is possible to find some applications of algorithms embedded in the vehicle to diagnose and provide prognoses failures in real-time. Hence, Kim et al. [
10] presented work with an IoT wireless module connected to a battery that monitors the battery and sends the data to the cloud platform. The system still supplies an onboard health monitoring battery with the application of some anomaly detection algorithms to operate cost-effectively on a large scale.
In Xia et al. [
13], an algorithm was presented with hard thresholds to detect the main failures found in the LIB. Similar to our proposed work, the authors performed several experiments to generate the dataset with four known failures. Then, they built the model with the known rules and thresholds. Finally, they made a circuit to validate the model. In the same direction, Nuhic et al. [
14] presented a diagnosis and prognosis model. It was an embedded data-driven model built with a support vector machine. The work’s main goal was to estimate the battery’s health in real-time. In order to detect a short-circuit on board, Naha et al. [
15] developed an algorithm based on the cell’s voltage, current, and temperature. Lee et al. [
16] demonstrated that the use of artificial neural networks, especially multi-layer perceptron, could predict some failures, such as thermal runaway in the pouch cells of smartphones.
Similar to the related works, this paper presents an ML system composed of two approaches (anomaly detection and classification models) to identify the abuses in the LIBs at the first moment. In this case, the idea is composed of the combination of edge–cloud computing, ML, and a BMS. As the work intends to evidence the efficacy of the ML to predict failures, the BMS is composed of an Arduino Mega, which measures the main parameters of the cell and controls two relays that change the charging and discharging process.
Then, the edge computing is connected to the BMS by the I2C protocol, which collects the data in real-time and sends them to the cloud. In the cloud, the two models are built and then downloaded to the edge. Thus, the models are fed with the data in real-time on the edge. If the models identify an anomaly or abuse, the edge sends the command to the BMS to interrupt the charging or discharging process until the failure is identified.
In order to validate the proposed idea, a methodology with three steps was proposed. In the first step, 12 cells were submitted to the main abuses found in the LIBs. These situations represent the high degradation in the cells and were used to train the ML models. In the second step, an anomaly model was applied, which could significantly reduce the degradation of the cells. Furthermore, in the third step, a combination of anomaly detection and classification algorithms was used to mitigate the consequences of the abuses.
Therefore, in
Section 2, the state-of-the-art will be presented with a description of the models used in the work. In
Section 3, the experimental setup will be described. Then, a discussion about the results and, finally, the conclusion are provided.
2. State-of-the-Art
The high capacity, long lifetime, security, and performance of LIBs made this technology the reference for storage systems in some areas such as electric mobility [
17]. Despite these characteristics, especially the high energy density, LIBs must operate in safe conditions to avoid performance and security issues [
2].
The abuses in the LIBs are segmented into three groups: mechanical, electrical, and thermal. This way, vibration, a bad connection, and external short-circuit (ESC), and others are considerable mechanical abuses. On the other side, if the BMS cannot manage the equalization, the overdischarging (OD) and overcharging (OC) abuses can appear in the LIB and cause an increase in the degradation rate. Both the ESC and OC can cause overheating (OH) in the first moment, and if it is not stopped, this results in a thermal runaway (TR) failure [
2]. TR is the worst failure that can be found in the LIB and can cause fires and explosions. In [
18], the correlation between the temperature and time during the occurrence of TR failures was presented. In this work, the higher the temperature is, the sooner a failure takes place and the more severe the effects of TR are, such as fires and explosions.
As a solution, the BMS appears to maintain the controller conditions of the voltage, current, and temperature of the cells [
2]. Despite that, the BMS is hard-programmed and operates the LIB in excellent conditions when the cells are new and in the perfect conditions of resistance and capacity. Nonetheless, the natural aging process of the LIB and, in some conditions, when the cell suffers from thermal or electrical abuse affect the efficiency of the BMS to control and equalize the cells. This results in degradation and the risk of security and performance issues [
9].
To improve the efficiency of the BMS, data-driven models support the management of the LIB. Therefore, some studies combined the concept of edge and cloud computing, when the data are collected from the vehicle and sent to the cloud to be processed. The models are built and trained in the cloud, with enough powerful computational resources to process a large volume of data. Then, the models are downloaded to edge computing, coupled with the vehicle, which can process and make real-time inferences directly in the car [
10,
11].
Data-driven models allow the use of ML algorithms. ML can be used to identify the issues in the first stage and then avoid the velocity of the degradation. Several approaches can be used from the literature to find failures and anomalies in LIBs. Identifying anomalies is an excellent way to find failures in the battery in the initial process.
The isolation forest (IF) is one anomaly detection model that has the principle of isolating anomalies from non-failure samples. This model is based on the decision tree, which isolates the outlier data in the tree’s root. Due to its working principle, this model does not work with density or distance measures. This situation allows the model to work efficiently, faster, and with lower computational costs. Despite that, it works with a small dataset. Otherwise, it is possible for the swamping and masking effects to emerge [
19].
Anomaly detection will detect anomalies by observing the temperature of the cells. This approach can be valuable and easily implemented, but working alone can find the failures already in progress. Therefore, combining the IF with some classification models is essential to identify the other failures, such as OD, OC, OH, and ESC.
In the classification models, there are several different approaches. One of them is the random forest (RF). Similar to the IF, the RF works with the decision tree principle and classifications of an event or non-event. It is considered an ensemble model because it gives weight to each output of the tree. Its ensemble learning characteristic turns this model’s robustness to problems such as over-fitting and noise in the signals [
20].
The following paragraph will demonstrate the experimental setup to show how ML can reduce the effects of failures in the LIB. In order to evaluate the efficacy of ML, a small circuit was built to monitor the main parameters of the cell. Then, the experiments were performed in the lithium-ion 18650 NCM cells with a nominal capacity equal to 2200 mAh and a nominal voltage of 3.7 V.
3. Experimental Settings
The importance of LIBs currently is equal to the need for security and performance in their operation. Therefore, it is essential to identify and diagnose issues in this technology as fast as possible. As already mentioned in this paper, the BMS plays a significant role in the management of the LIBs. Despite that, it operates with hard-programmed thresholds and needs a complex circuit to manage the main functions such as equalization, security, charging, and discharging.
Therefore, this work presents an approach composed of two ML models to help the BMS identify failures in the first stage. This way, when a failure or anomaly is detected, it interrupts the operation of the pack until the failure is solved. Coupled with ML, in this work, it is possible to identify the edge and cloud computing, which play an essential role in giving intelligence to the LIB’s operation.
In order to validate the concept, some experiments were performed to force the failures in the LIBs. The system was built with a Raspberry Pi4, an electronic circuit, an Arduino Mega, some temperature sensors, the AWS cloud provider, and some lithium-ion 18650 cells.
The Raspberry Pi4 operates as the edge computing and can collect and send data to the cloud by WiFi. In the cloud, the data are stored in the Amazon Simple Storage (S3) bucket from AWS.
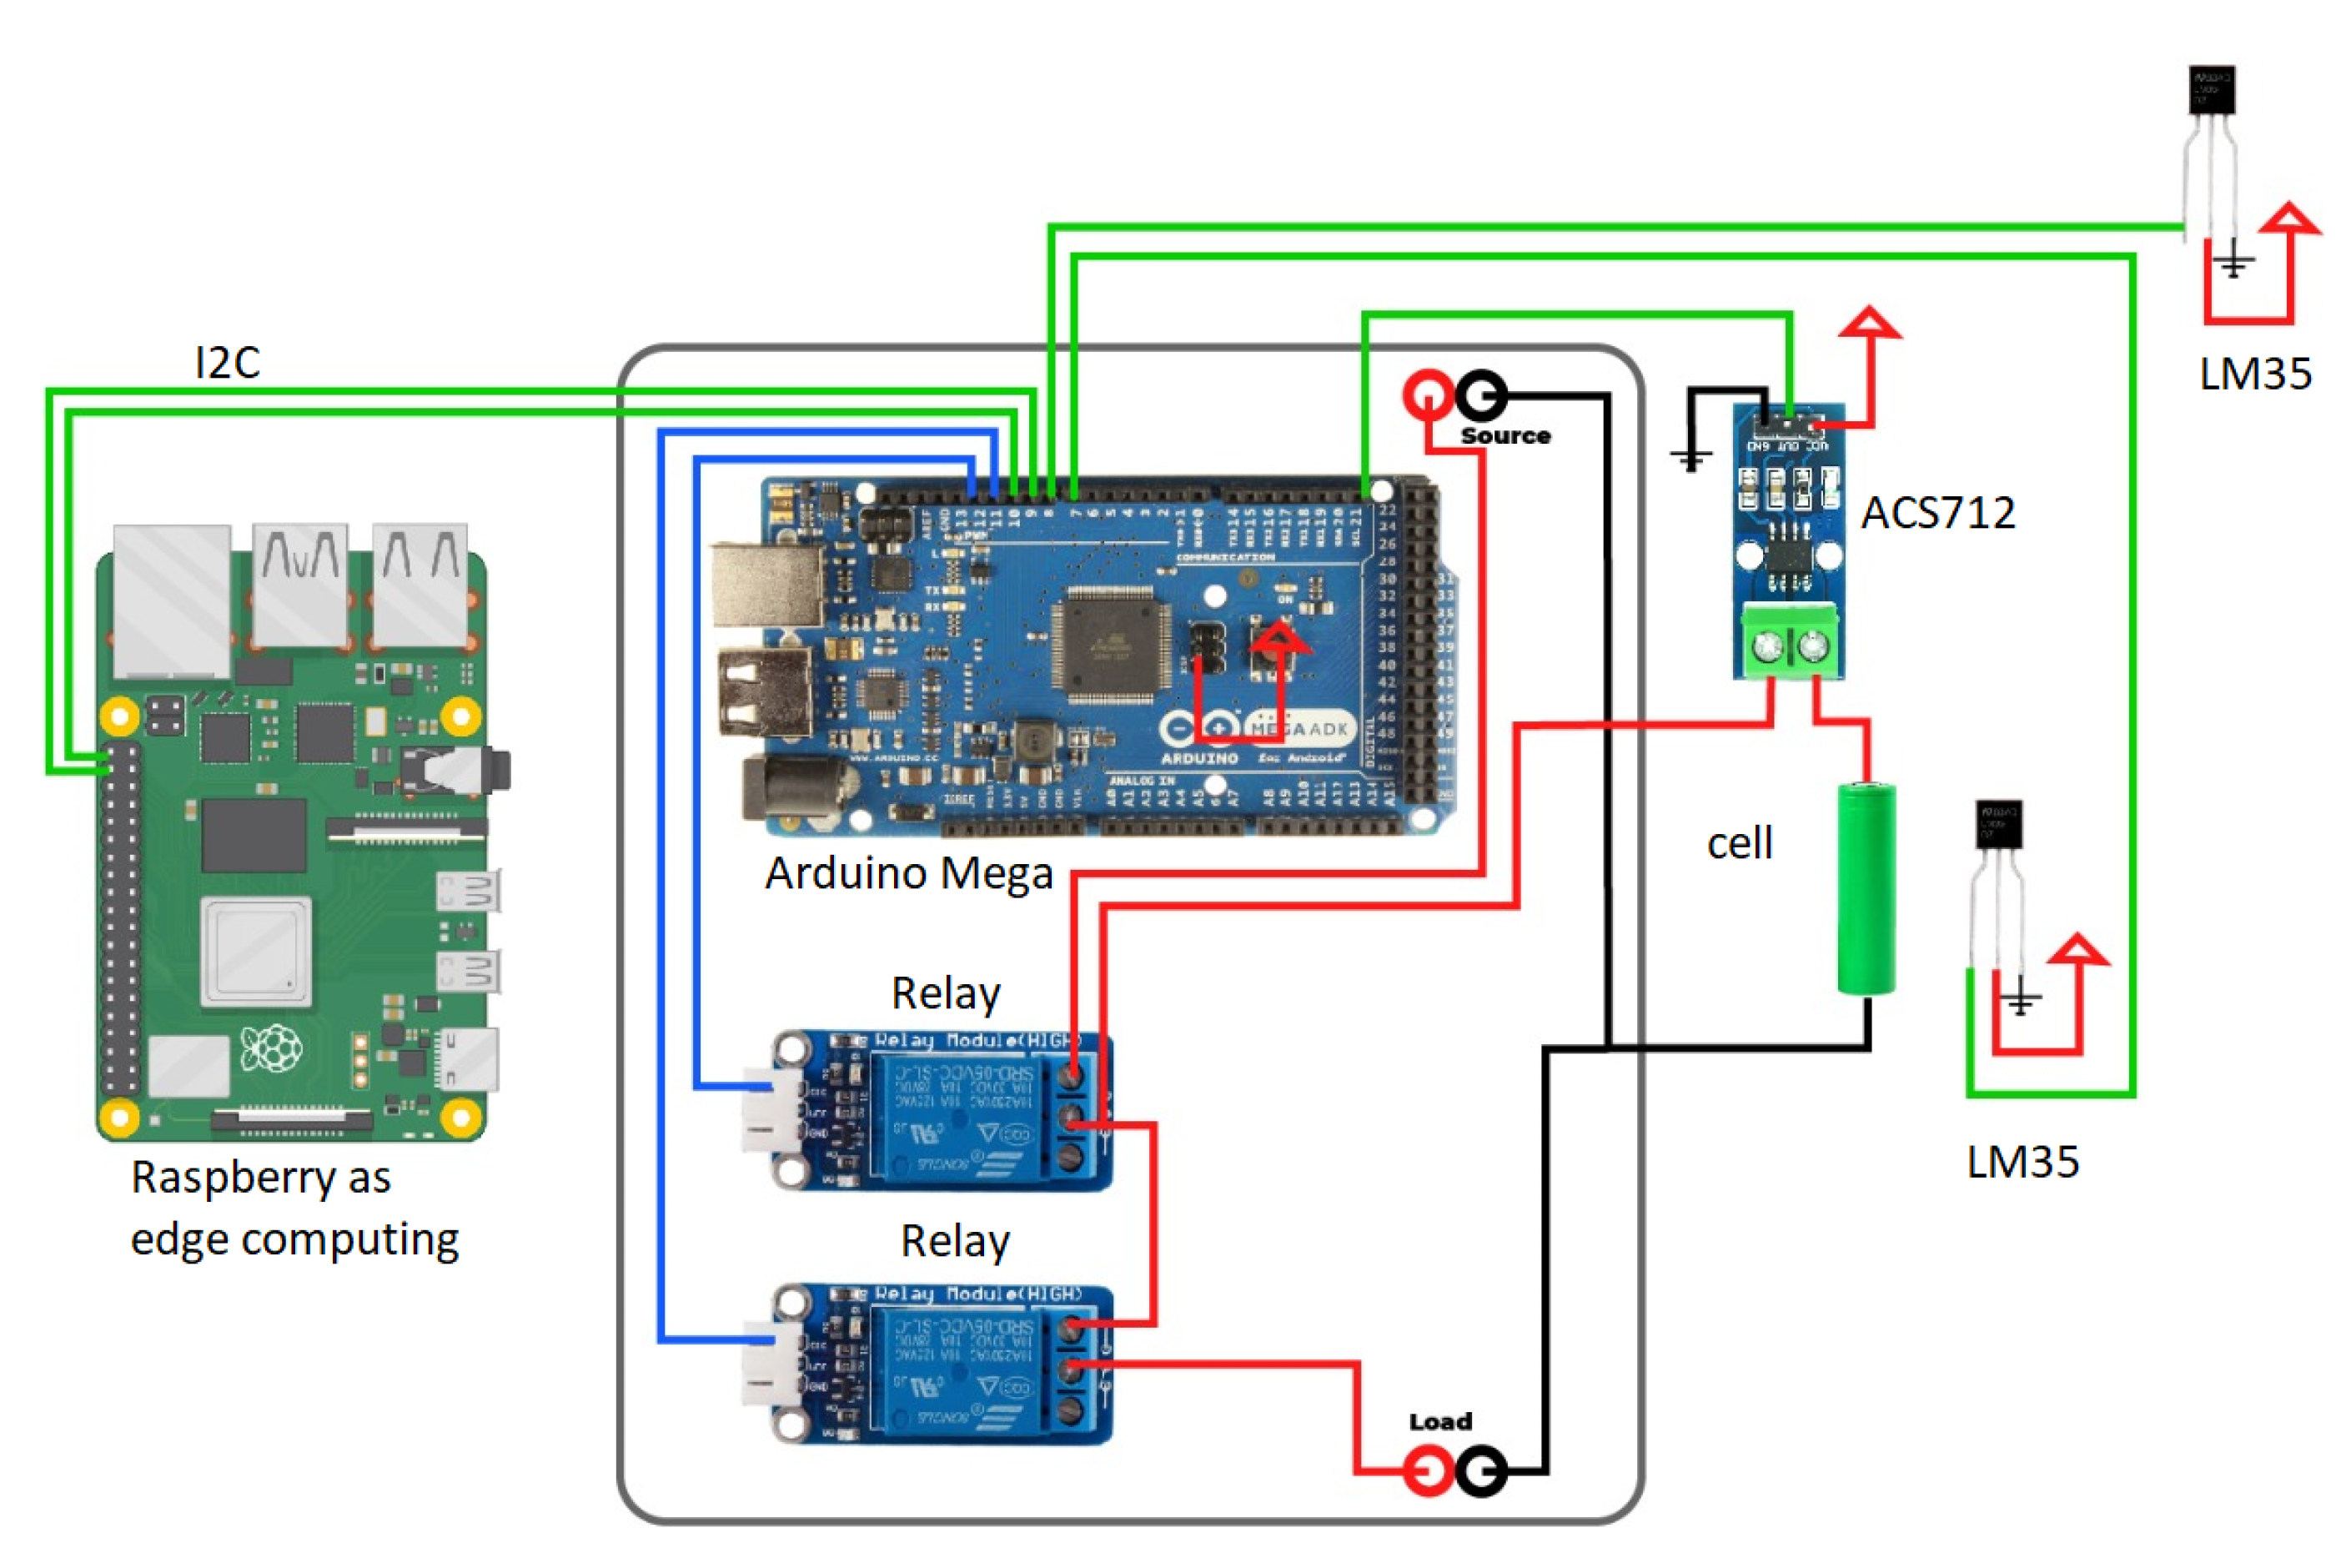
In order to monitor and collect the data, a shield (see
Figure 1) coupled with the Arduino Mega was built. The Arduino Mega measures the voltage and current of the cell in Analog Channel 0 and Analog Channel 1 as the analog input. Voltage is measured directly in Channel 0 from the Arduino, with a 10-bit resolution. On the other side, an ACS712 5A sensor was used to collect the current in the circuit. Such a type of sensor has an error equal to 1.5% at room temperature (25 °C); it works with an 80 kHz bandwidth, has an internal resistance equal to 1.2 Ω, and operates with 5 V, and the sensitivity of the output is equal to 185 mV/A.
The ambient (collected by Analog Channel 2) and cell temperature (collected by Analog Channel 3) are measured by an LM35 coupled with the Arduino. The LM35 operates at 5 V with 0.5 °C of accuracy and with a q linear transfer function that has the output sensitivity equal to 10 mV/°C.
The Arduino Mega also has two relays that control the charging and discharging process. The Arduino Mega, combined with the built circuit, operates as the BMS. It is connected to the Raspberry Pi4 by the I2C protocol.
In order to understand the impact of the failures with and without ML, the capacity of each cell involved in the test was measured before and after each experiment (see
Table 1).
"I confirm" In the present study, a cell’s capacity was used as a parameter to indicate its health status. According to [
21], both capacity and internal resistance are the direct health indicators used to reveal the cell state. In order to measure capacity, the cells were fully charged and discharged until they reached 2.75 V at a rate of 1 A. The capacity measurement was carried out three times, and the calculated mean was used in the present work.
In the tests, the cells 18650 NCM ICR 22P from Samsung with a nominal voltage of 3.7 V and capacity of 2200 mAh were used. The experiments were segmented into three steps:
The failures were applied without ML.
The IF was applied to the cells’ temperature.
The tests were performed with a combination of the IF and RF.
In the first step, the tests without ML were performed to generate the essential database for the model’s construction. Hence, the models were fed with standard and failed samples useful for learning. In order to generate the data, the tests were segmented into four groups:
The methodology of OC abuse is seen in
Figure 2. In this experiment, the test began with the charging cycle when the voltage was greater than 4.2 V. The experiment continued charging the cell until the temperature of the cell was 12 °C higher than the environment temperature or the voltage of the cell was higher than 5.5 V. After one of these conditions happened, the discharging routine started and ran until the voltage of the cell was smaller than 3.5 V. The method was also repeated three times. The charging process was performed with a current rate of 0.5 C (1.1 A).
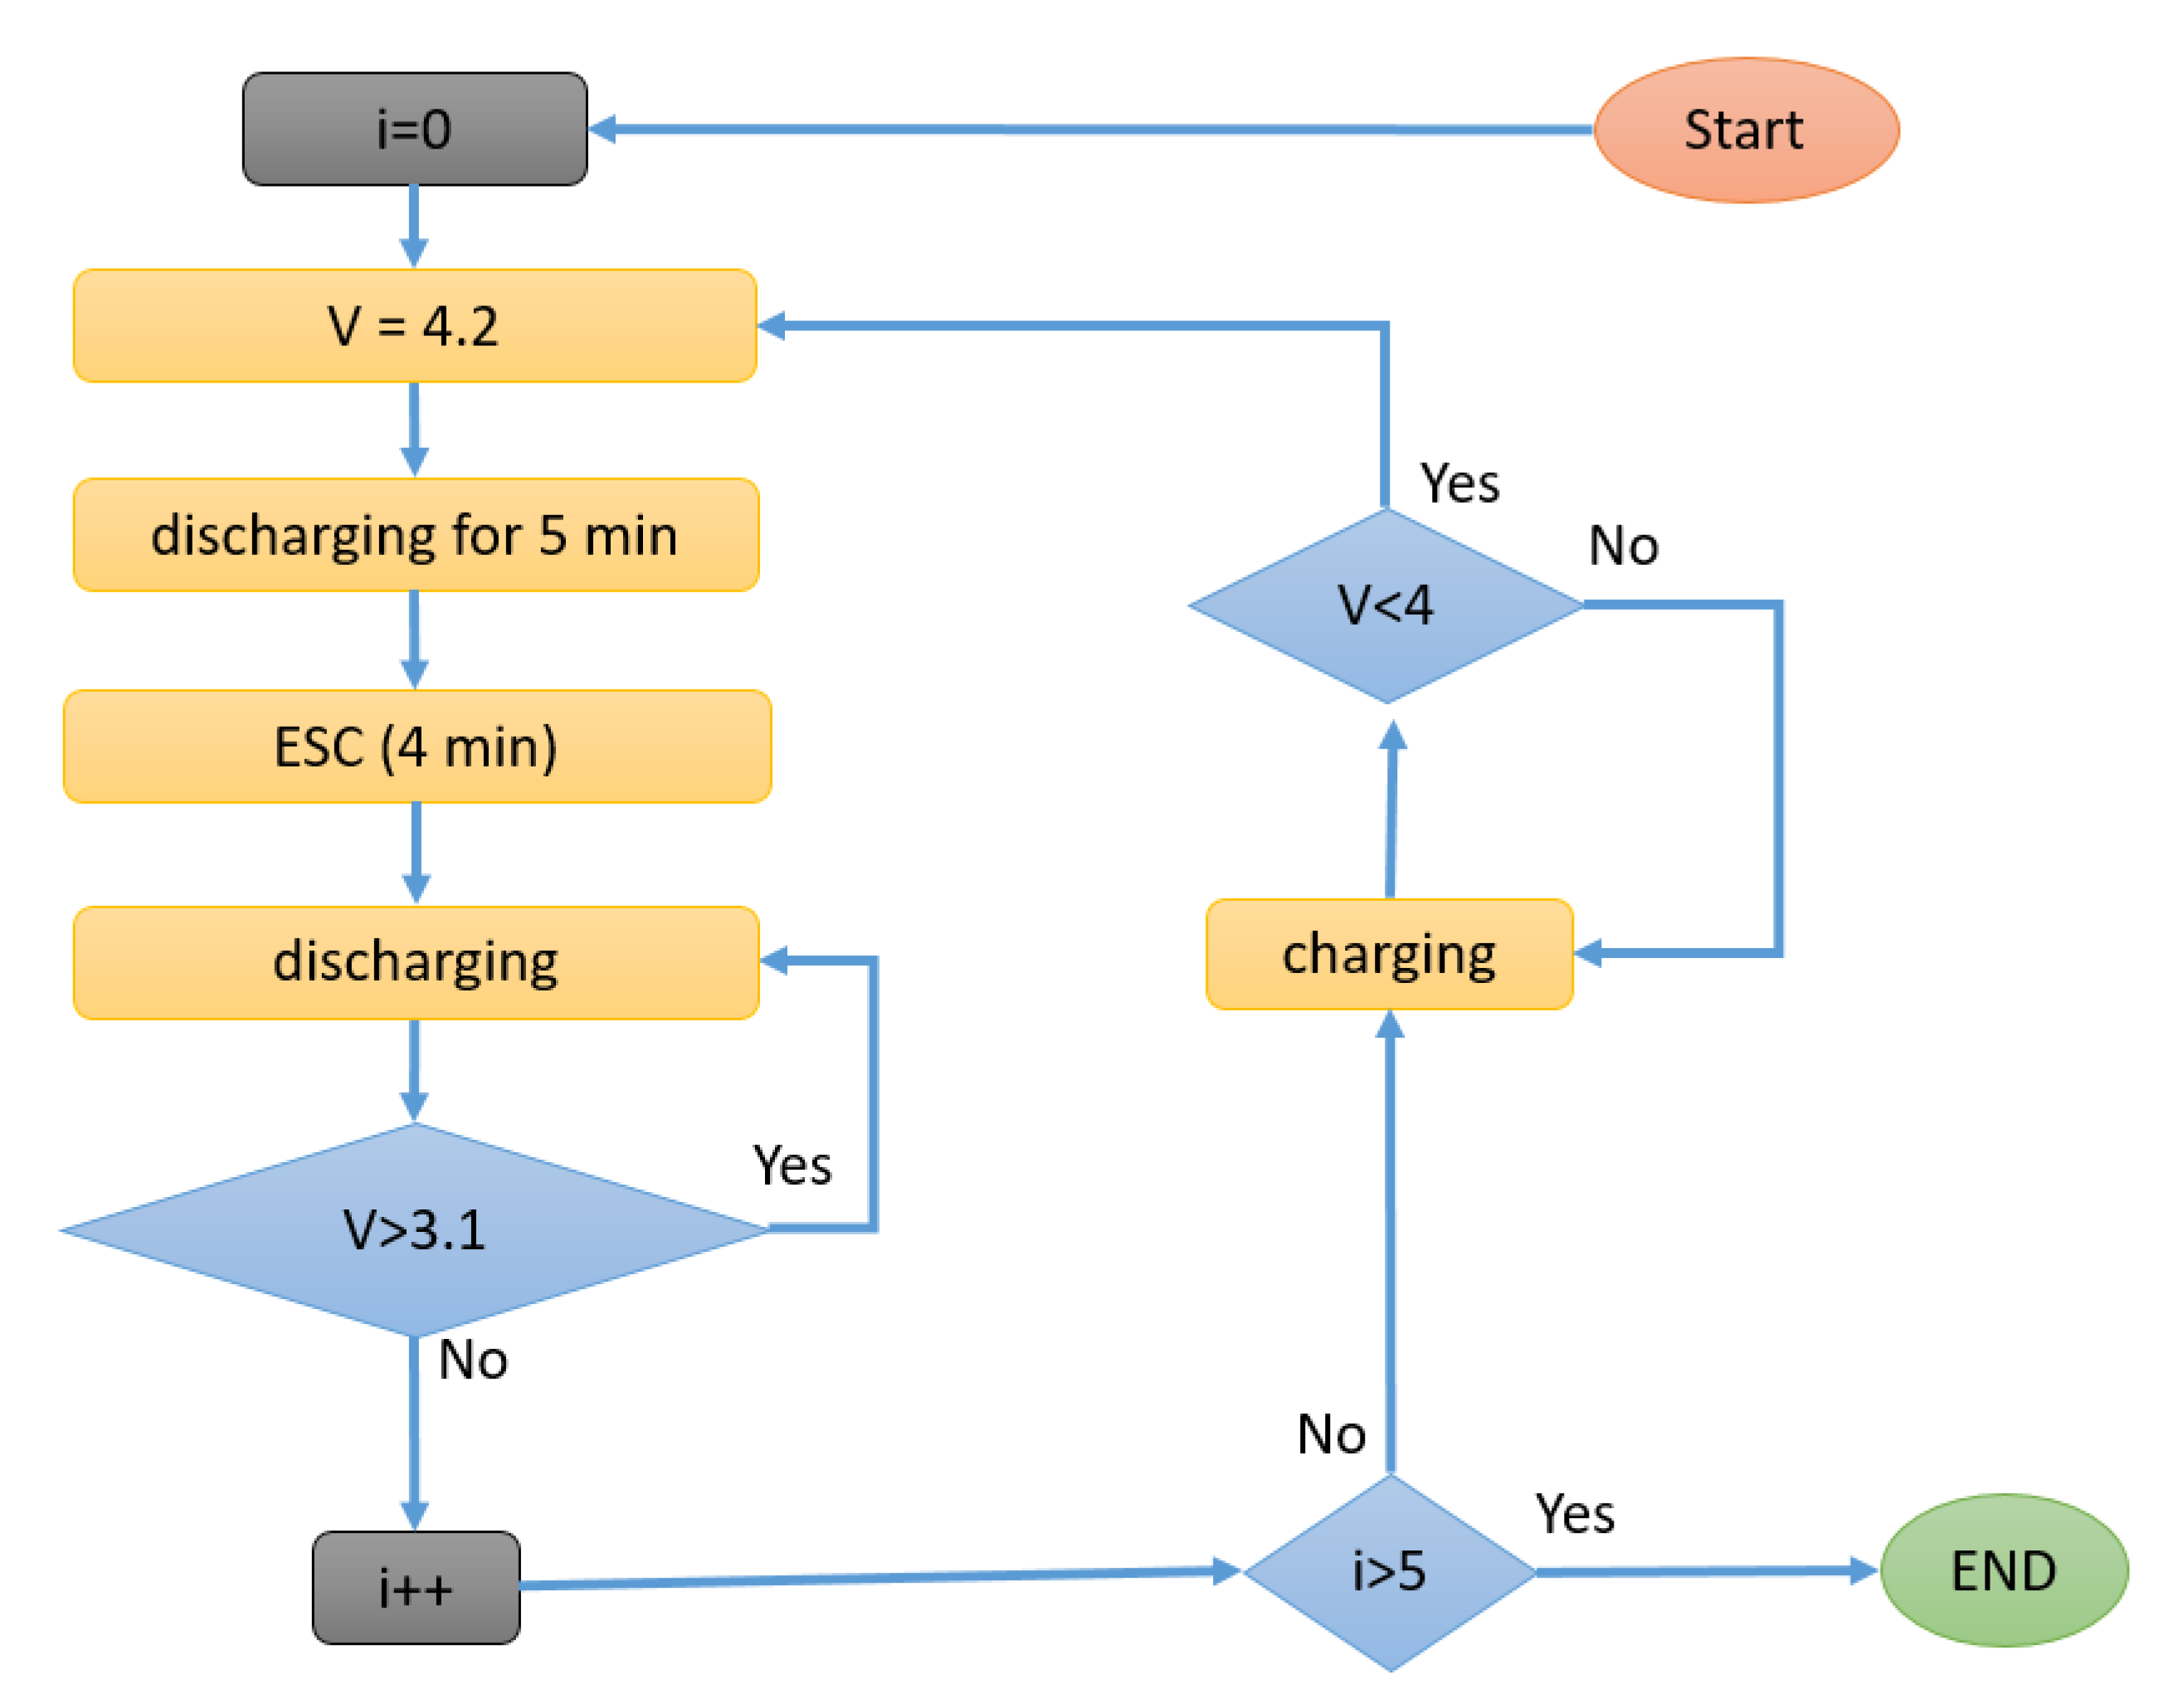
The ESC methodology is found in
Figure 3. The process began with the discharging cycle when the cell’s voltage was greater than or equal to 4.2 V. The discharging happened for 5 min, and an ESC was applied for 4 min. After that, the discharging continued until the voltage reached 3.1 V. After that, the charging ran until the voltage reached 4.2 V. In the other experiments, the routine was repeated three times. During the discharging process, the current rate was similar to that applied in the OD methodology.
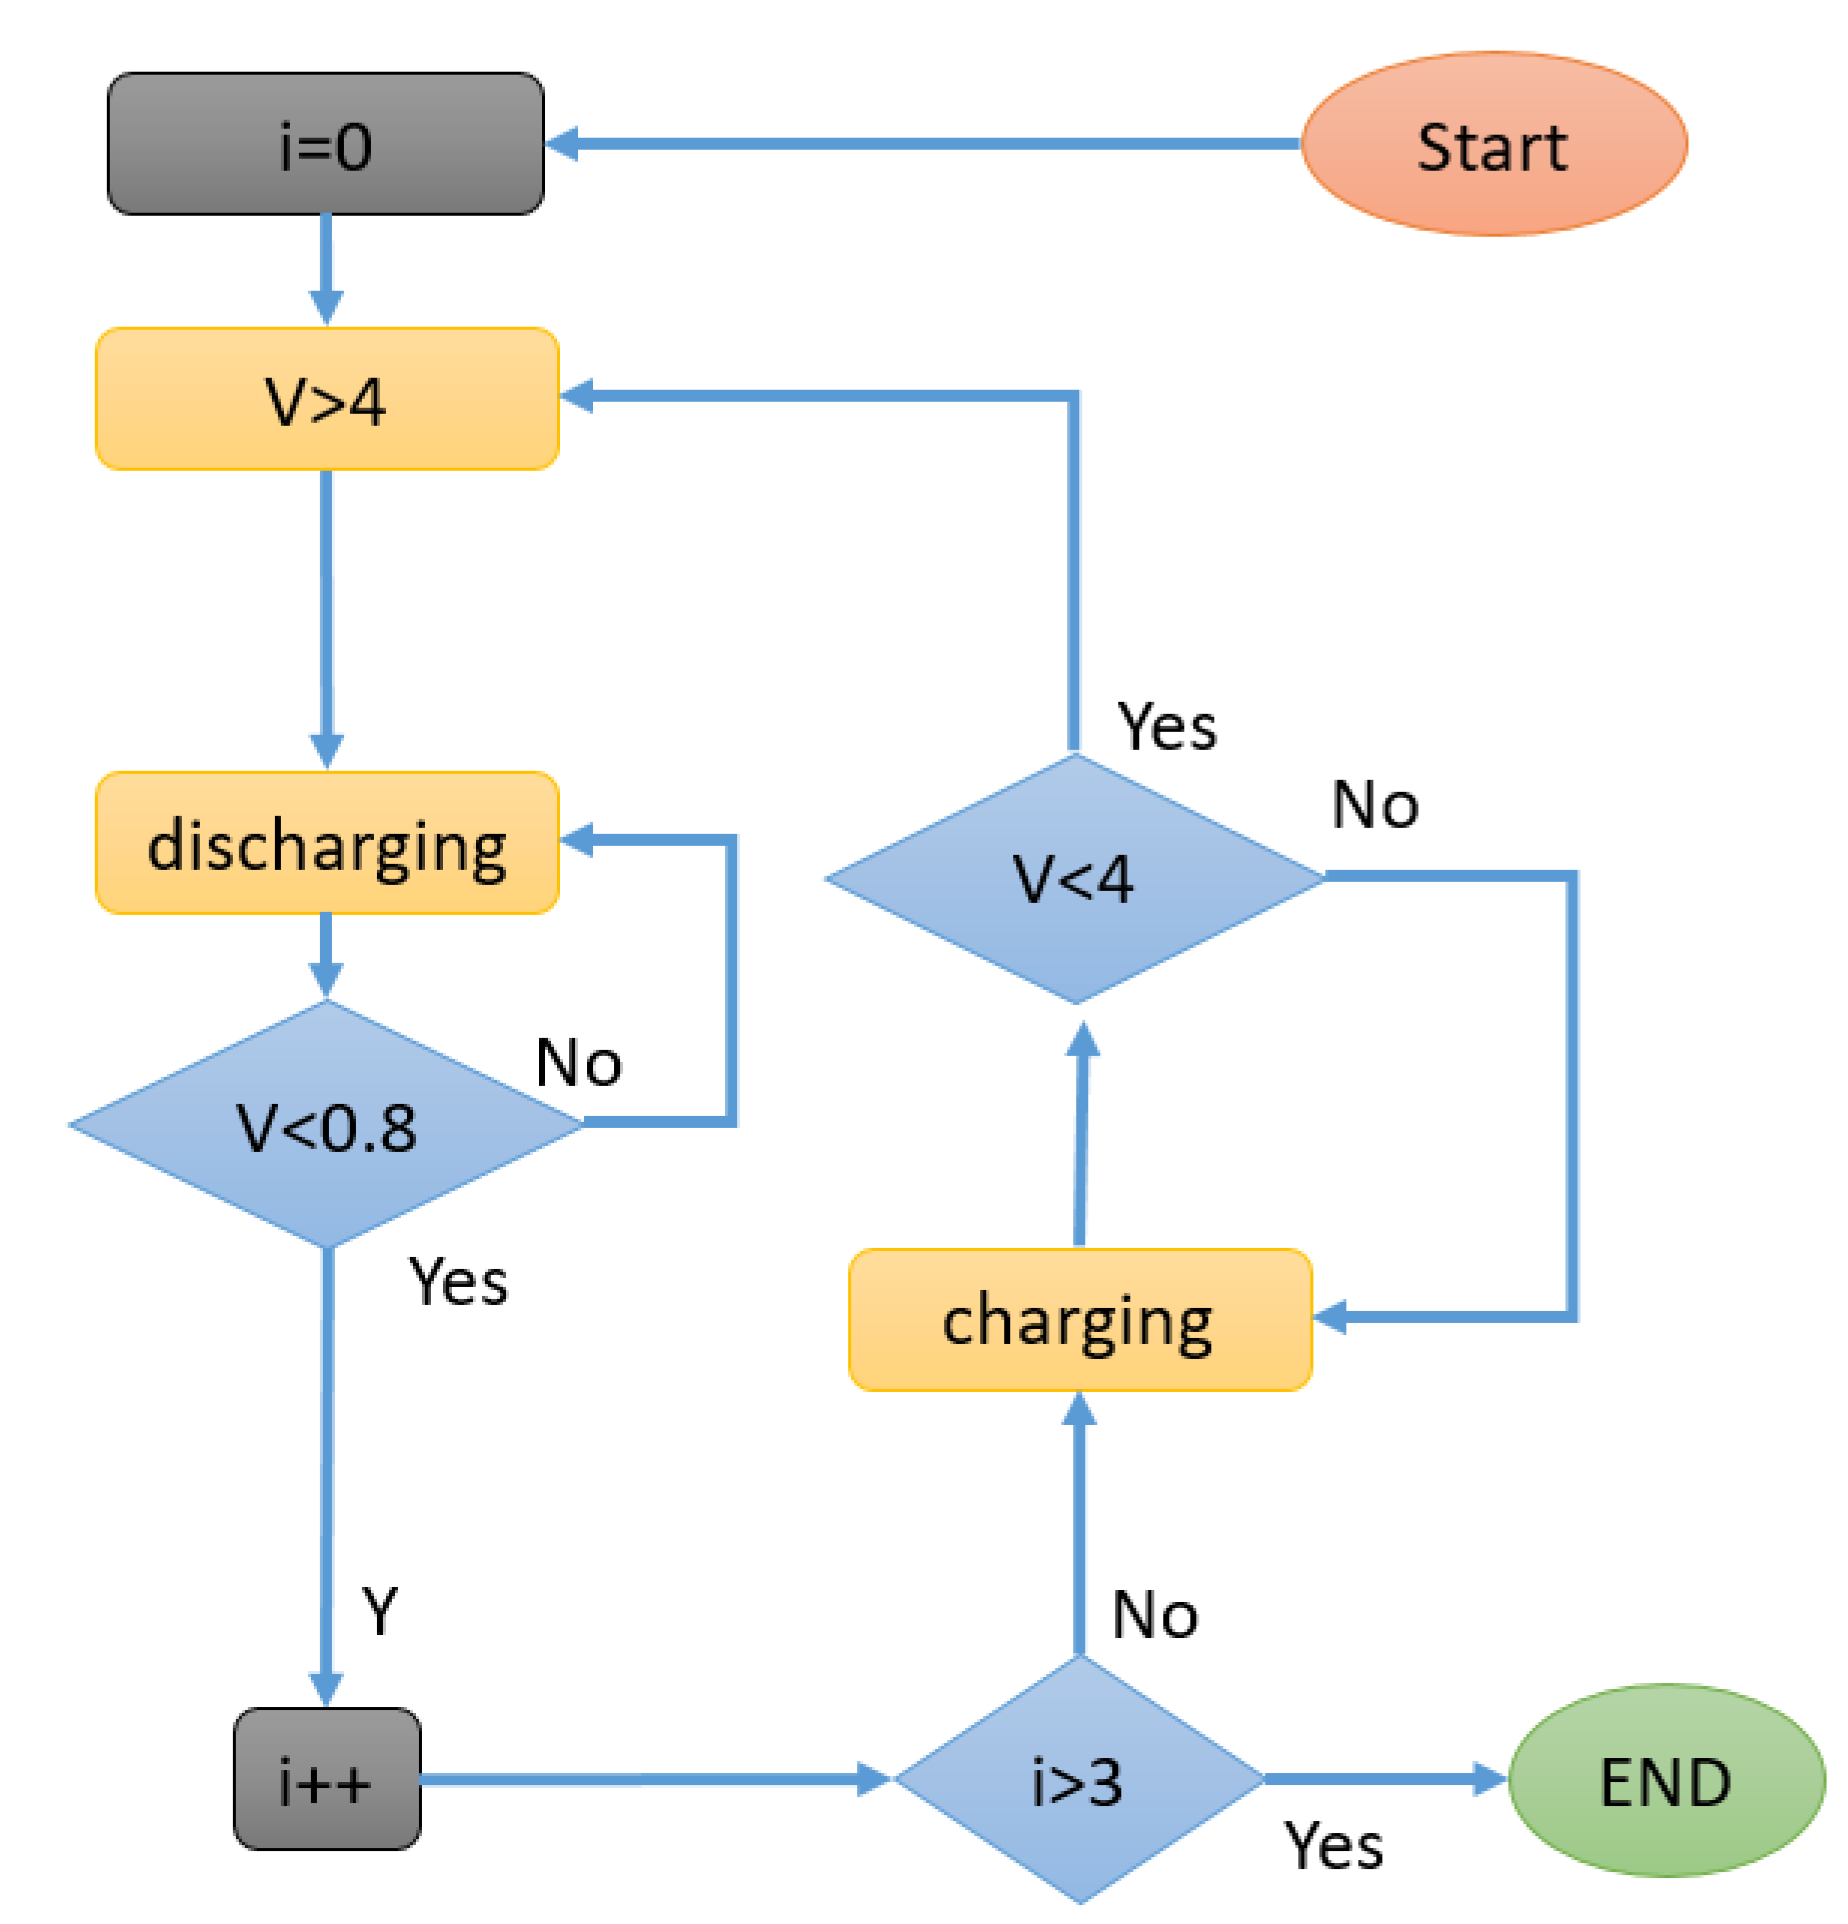
Figure 4 describes the methodology adopted to generate the data on OD abuse. In the figure, it is possible to see that the experiment began when the voltage of the cell was greater than 4 V. Then, the discharging process began and ran until the cell reached a voltage smaller than 0.8 V. Thus, the charging process ran until the voltage reached 4 V again. The process was repeated three times. The data were collected by the edge computing and sent to the cloud, where they were stored in the S3 bucket. The discharging process was performed with a 2-ohm resistance, which resulted in a current rate equal to 1 C (2.2 A) at the start, but decreasing according to the cell’s voltage consumption.
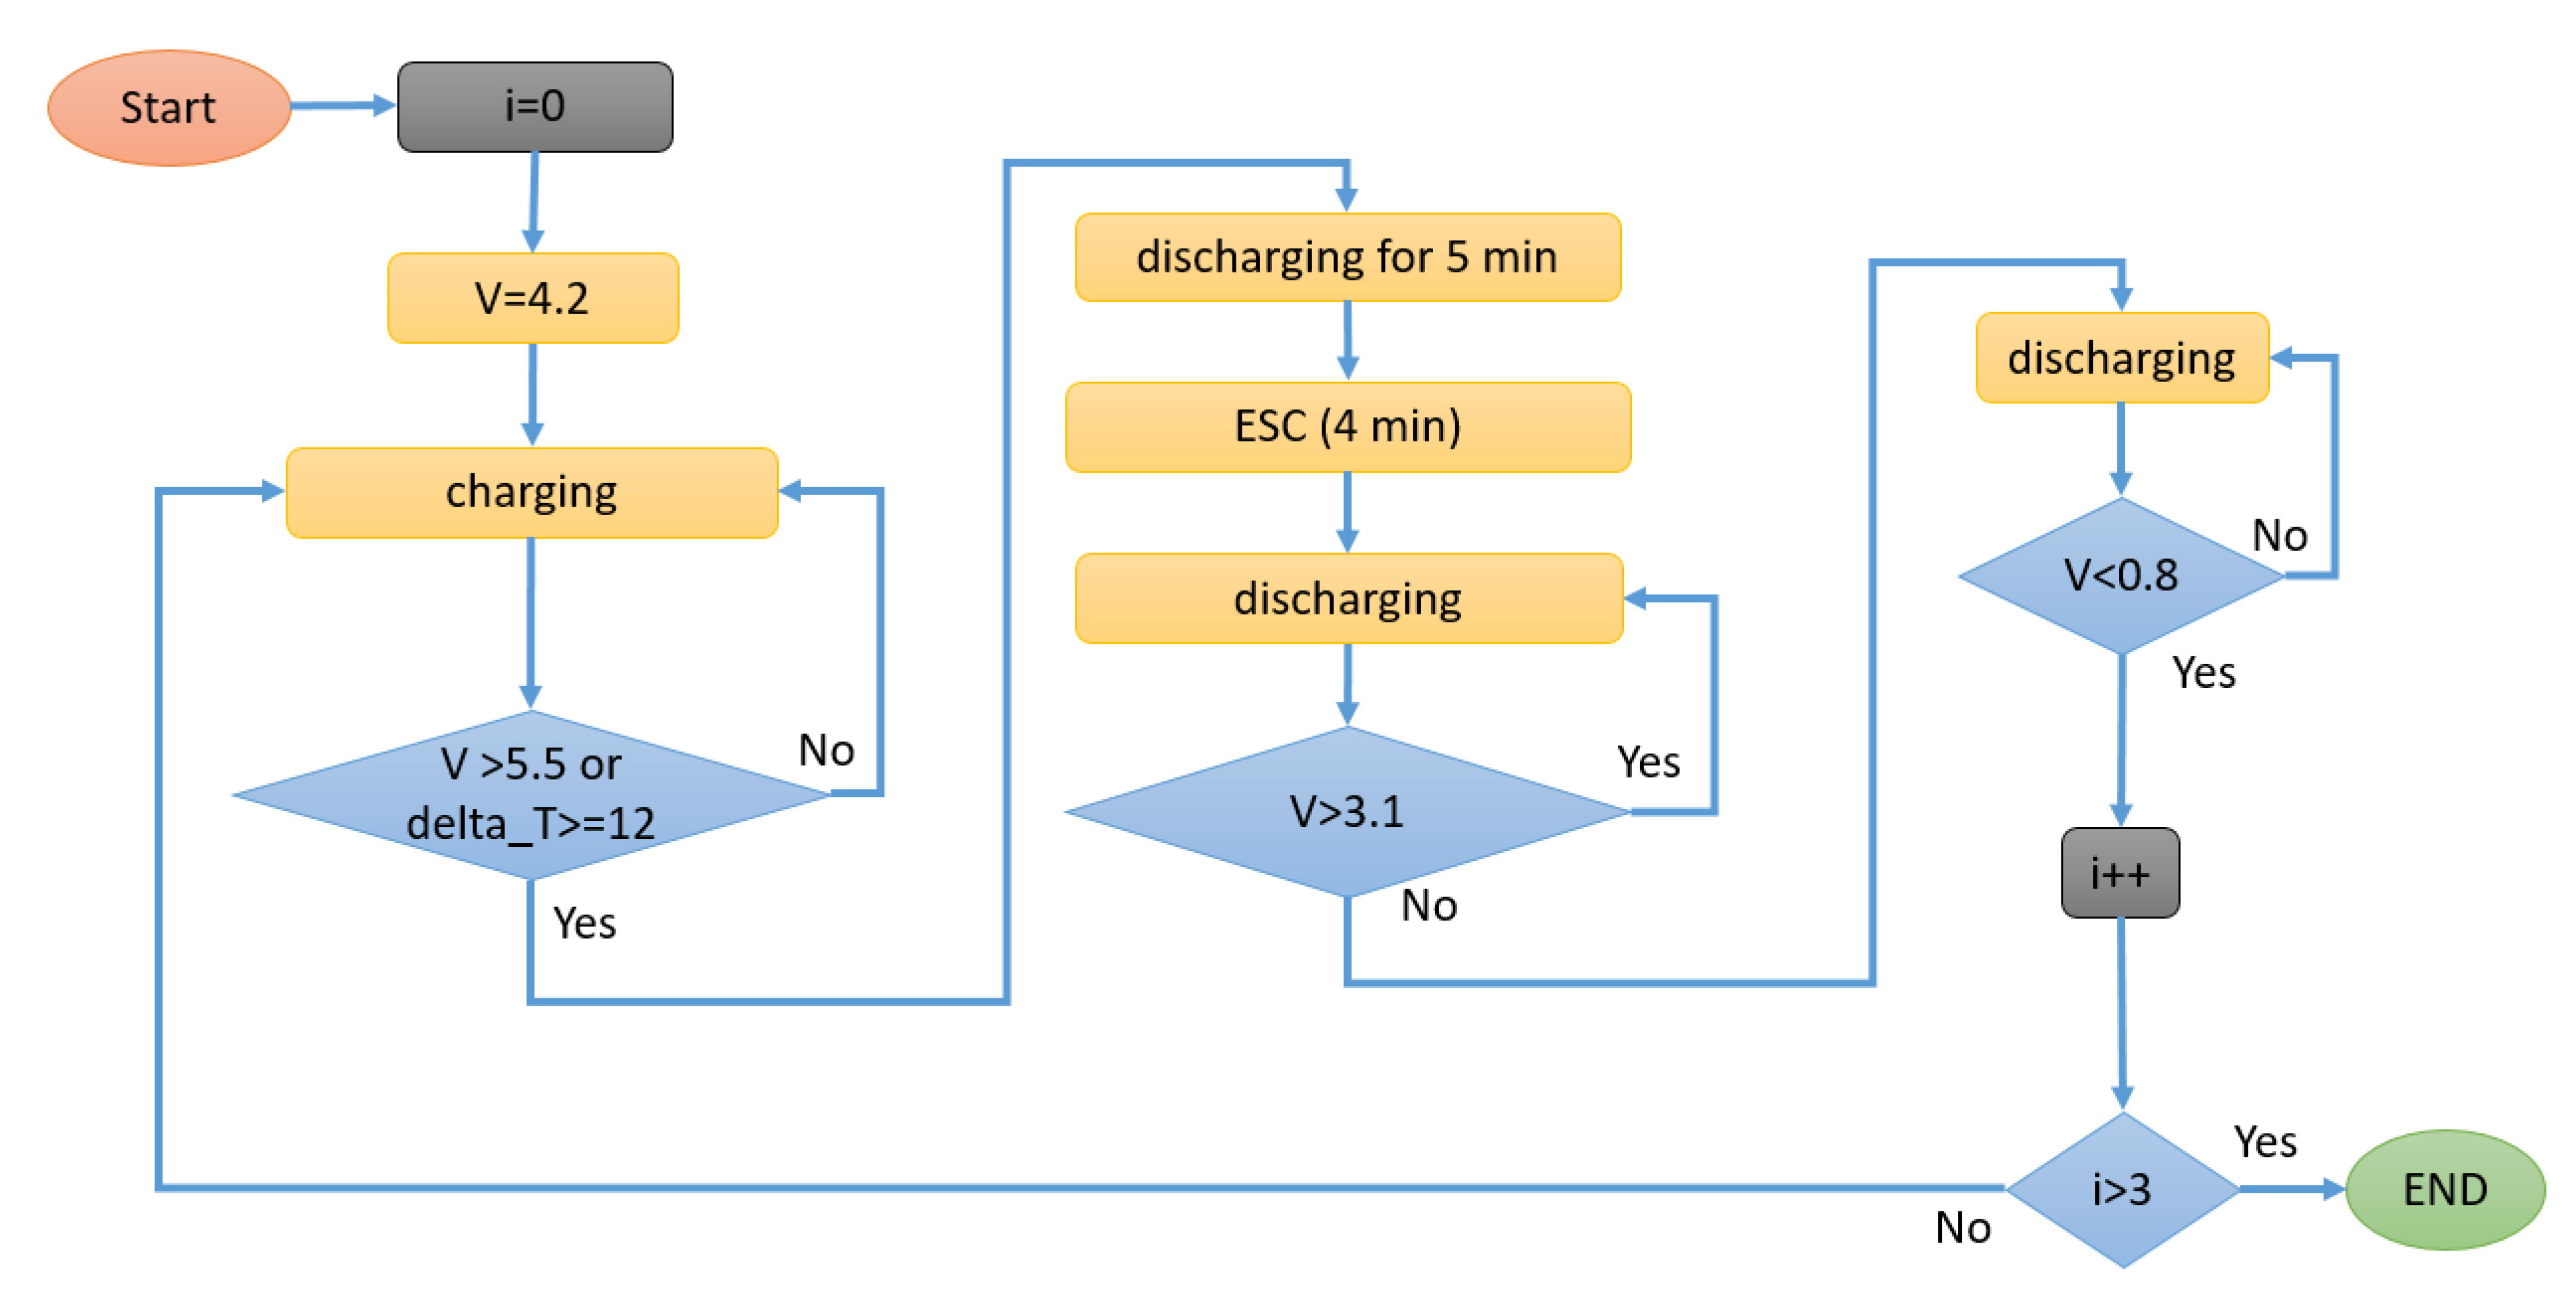
Finally,
Figure 5 shows the methodology applied in the cell to represent the application of the three cases of abuse: OD, OC, and ESC. The test began when the cell had 4.2 V. Then, the charging cycle started and continued until the voltage reached 5.5 V or the cell’s temperature was 12 °C higher than the environment temperature. After one of these conditions, the discharging operation began and ran for 5 min. In the following action, the ESC was applied for 4 min. Finally, the discharging occurred until the voltage was smaller than 0.8 V. After that, the charging process began, and the experiments were run three times.
Three experiments with different batteries for each methodology were performed without ML to generate the dataset. When the data came to the cloud, they were stored in the S3 bucket and uploaded to the Anaconda Environment. Anaconda runs on an Amazon Elastic Compute Cloud (E2C) with 16 GB of RAM. In Anaconda, a Jupyter notebook was built in the Python language to run data-engineering analyses (EDAs) for investigating the data, understanding the failures and the data, and finally, for building the models.
Two approaches were chosen for solving the problem: IF and RF. The IF was trained with the cell’s temperature. In this context, abuse will be detected if the temperature rises considerably compared to good samples. The IF was built with 10 estimators and 25% of contamination.
On the other side, the EDA showed that the three cases of abuse (OD, OC, and ESC) had a high relation with the current, the voltage, the temperature, the delta temperature of the cell, and the ambient temperature (see
Figure 6). Therefore, one model of the RF was built and trained for each abuse with the data from Step 1. Each RF model was built with 10 estimators and trained with the entire data of each abuse.
In order to verify the performance of the IF and RF, the four trained models were tested on the data from the multiple abuses as described in
Figure 5. This dataset contains tests of three cells under all three cases of abuse and contains a total of 24,692 samples segmented as follows: 451 samples of ESC abuse, 6036 samples of OD, 10,256 samples of OC abuse, and 7949 non-failures.
In order to evaluate the results, a confusion matrix (CM) was used as a metric. The CM is the most-used metric for classification problems [
22]. With this matrix, it is possible to determine sensitivity, specificity, and accuracy. Sensitivity or true-positive (TP) indicates how well a model diagnoses failures, while specificity or true-negative (TN) indicates how well a model can identify non-failures. On the other hand, accuracy shows the total percentage of hits [
23].
Table 1 shows that the accuracy of all models was high, but such a metric should not be used to indicate the ML efficiency. Therefore, sensitivity and specificity were used to validate the models.
Table 1 also brings the final results of the four models. According to the table, the IF could correctly identify most failures, as the sensitivity was 63%.
On the other hand, the model could not identify the non-failures correctly, and its specificity was poor. This was caused by the contamination rate, which depends on the data. In order to avoid several false positives, when the model ran in real-time and identifies the anomaly, a double-check was performed to compare the cell’s temperature with the ambient temperature. If the delta is higher than 5 °C, the anomaly is confirmed.
The RF could correctly identify 100% of the events for ESC and OC abuses (see
Table 1). Otherwise, the non-events of ESC are the most in the dataset. In this way, since the false negatives correspond to 15%, the specificity decayed. For OD, the TP rate was 89%, while the TN rate was 97%. In summary, all models showed sufficient performance and, therefore, can be applied to reduce capacity loss in real-time.
After the ML preparation and model building, the models were downloaded to the edge computing, where the data can be processed in real-time and inferences made.
Figure 7 shows the logic operation of the ML approach. The BMS collected the data from the sensors and sent them to the edge by I2C. Every incoming message fed the four models that were trained in the cloud as described previously. If a failure or anomaly is found, the edge sends a message to the BMS to stop the operation.
In this context, in the second step, the IF model was applied to the same experiments without ML. Therefore, three tests with OD, OC, ESC, and a mix were realized, totaling 12 experiments. The capacity of the cells was measured before and after the tests. In these tests (see
Figure 7), the IF is fed the temperature’s value every second and processes the inference. In the case of an identified anomaly, the edge sends the message to the Arduino Mega by I2C to interrupt the charging or discharging phase. The pause happens until no anomaly is present.
Then, in the third step, the RF was applied combined with the IF. As in the previous experiments, the capacity was measured before and after the tests. The tests in the same conditions and with the same methodologies were applied in this approach. If the OC-RF finds a failure during the charging stage, the edge sends a message to the BMS to cut the circuit that controls the charging relay. Similarly, if the OD-RF identifies a failure during the discharging process, the BMS receives a message sent by I2C from the Edge and cuts the discharging cycle. The ESC is cut off if the ESC-RF detects a failure. Finally, if the IF model detects an anomaly, every process is interrupted to reduce capacity loss.
The following section shows each step’s results and the ML performance for reducing the capacity loss of LIBs.
4. Results and Discussion
As mentioned before, the tests were performed with the lithium-ion 18650 ICR 22P cells from Samsung that contains the NCM chemical, and the nominal capacity is equal to 2200 mAh and the voltage equal to 3.7 V. A shield with Arduino Mega collects the data from the voltage, current, and temperature of the cell and the environment. The edge computing is connected to the shield by the I2C protocol and monitors the data in real-time. Then, it sends the data to the AWS cloud, where the samples are stored in the S3. After that, the data are uploaded to the Anaconda Environment, where the RF and IR are built. In addition, the capacity of each cell was measured before and after the tests to verify the impact not only of the failures, but also on the ML application.
Firstly, the tests without ML were performed. As in the last section, the experiments according to the methodology were performed three times for each cell and three cells for every failure, resulting in 12 experiments. The impact of the abuses is found in
Table 2.
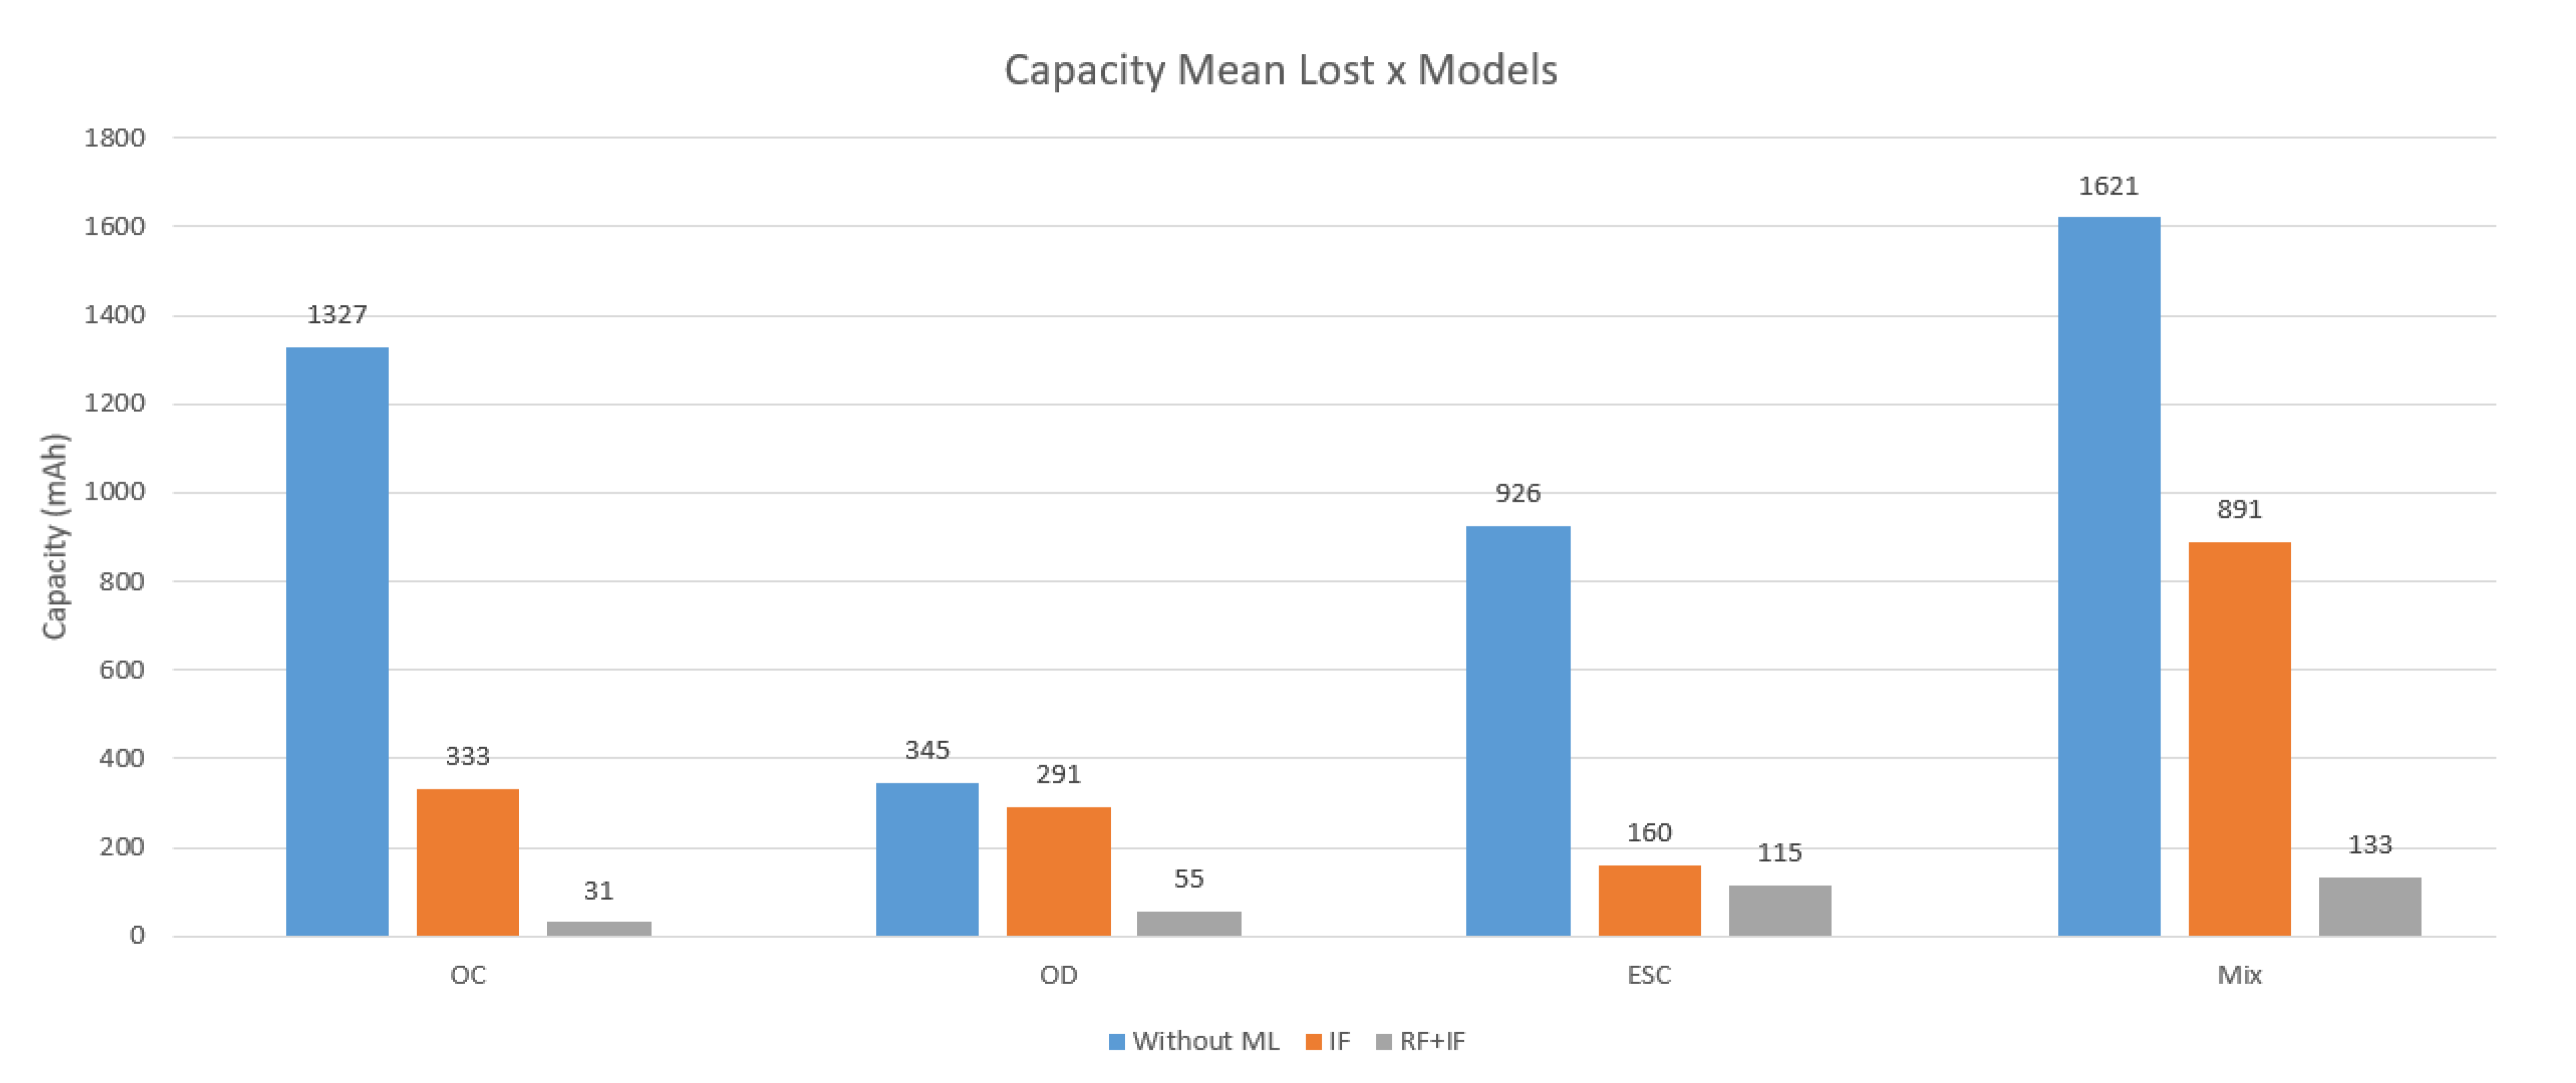
As observed in
Table 1 and
Figure 8, OC had the worst impact on the LIB’s capacity compared with the other abuses. On average, the tests with this abuse lost 1327 mAh of the cells.
Figure 9 shows that the cell’s temperature took a long time to rise under OC abuse. Then, the cell’s temperature came to 15°C, higher than the ambient temperature. In this way, the cell was submitted to a high voltage for a long time, resulting in the most significant lost capacity.
Similar to OC, ESC also caused a rising of the temperature. Nevertheless, as observed in
Figure 10, the temperature rose immediately when an ESC was applied. This behavior results in the second-worst lost capacity, as observed in
Table 1 for the three experiments, and on average, the lost capacity was about 926 mAh (see
Figure 8). The lost capacity was lower than OC because the cell spent less time compared with the OC abuse under the failure. Even though with only 12 min, it is possible to see a high degradation in the cell.
Although ESC was interrupted, the temperature rose a little due to the chemical reaction in the cell. This high-temperature resulted in an overheating failure, as observed in
Figure 11, where the temperature was greater than 45 ºC in some cases. As OH is the first evidence of a probable TR, it is essential to avoid this abuse.
Conversely, OD had a more negligible negative impact, as observed in
Table 2. On average, the failure caused 345 mAh of lost capacity (see
Figure 8). The low capacity loss compared with other abuses is observed in the temperature curve. The temperature of the cell increased less compared with other failures. In some tests, the temperature increased by 8 °C. This behavior occurs in the first stage of the OD failure when the resistance of the cell increases due to the low available energy in the cell, as observed in
Figure 12. Besides that, OH was never observed in the experiments with OD failures.
Finally, the experiments with the combination of the three cells lost on average 1621 mAh, as observed in
Figure 8. The impact was observed due to the three cases of abuse applied in the cells according to the methodology mentioned in
Figure 5.
In order to elaborate on the second step, as observed in the experiments without ML, the rising temperature is the consequence of the three abuses. Due to this conclusion, the IF model was chosen to find anomalies in the temperature by applying the same abuses in the cells. The model was trained and uploaded in the edge computing. Then, a python script was written to collect the actual data and make the inferences. When the model found an anomaly, it interrupted the charging or discharging process until the anomaly was no longer observed. This approach reduced the capacity loss of the cells.
For the experiments with OC abuses, as observed in
Table 2 and
Figure 8, the lost average capacity decayed from 1327 to 333 mAh. This behavior happened because, when the temperature starts rising, the IF detects it and stops the charging process. The impact is observed in
Figure 13, where the temperature delta is lower than the process without ML.
In the ESC process, the IF could avoid the overheating failure, as observed in
Figure 14. The temperature rose, but the IF could stop ESC and save the lost capacity from 926 to 160 mAh, as observed in
Figure 8.
Finally, despite the rising temperature in OD, the IF could not identify the presence of a failure in the cell’s temperature. Therefore, the lost mean capacity was similar with and without the IF, as observed in
Figure 8. The experiments were performed with an ambient temperature between 20 and 25 °C. In this way, if the ambient temperature were higher, the IF could perform better and even detect the OD abuse.
For the experiments with the three types of abuse, the IF could reduce the average capacity loss from 1621 to 891 mAh, i.e., the reduction was equal to 45%.
The IF reduced the capacity loss, but the model could identify the abuses only when the temperature was considered an anomaly, i.e., the cells suffered from abuses until the identification reduced the cell’s capacity. Therefore, the RF model was trained to identify the OC, ESC, and OD abuses. According to data engineering (see
Figure 6), the voltage, current, delta temperature, and cell temperature are the features needed to build and train the model.
After the training, the models were uploaded in the edge computing and, combined with the IF, made inferences in real-time. The same 12 experiments were performed, and the capacity was measured before and after the tests. The capacity loss is observed in
Table 2 and the average capacity loss in
Figure 8.
The combination of the IF and RF could perform exceptionally well to identify the failures in the first stage. On average (see
Figure 8), the models reduced the capacity loss from 1327 to 31 mAh for the OC abuses. In the same direction, the reduction for ESC was on average from 925 to 115 mAh, for OD was from 345 to 55 mAh, and finally, for the mix of failures from 1621 to 133 mAh, i.e., the total reduction was equal to 91%.
With the RF combined with the IF, the capacity loss of OC was the lowest compared with other failures, which is the opposite of the experiments without ML. This behavior is because OC is observed before it can harm the cell. On the other side, according to
Figure 14, ESC happens and increasingly softens the temperature, which causes a slight loss of capacity in the cell, but is higher than the OC abuse. The reductions in the OD abuses were also observed as observed in the delta temperature (see
Figure 15).
In conclusion, as expected, the abuses in the LIB caused several consequences for the performance and security of the battery. The results showed that OC generated the most significant capacity loss compared with ESC and OD. Therefore, the IF was applied and could reduce the time of the abuses in the LIB and save the capacity of the cells significantly. Despite that, the IF could identify only the cells’ anomalies, indicating that the abuses had already begun. Therefore, the combination of the IF and RF performed better in reducing the capacity loss of the batteries.
5. Conclusions
LIBs represent the state-of-the-art technology in capacity, storage, long lifetime, and density for storage systems. However, they must operate under controlled conditions to avoid security and performance problems.
The BMS manages the cells. Despite that, it is hard-programmed and dependent on complex hardware circuits to control the cells. This way, the natural aging process will update the cells’ thresholds without communicating to the BMS, resulting in a loss of capacity of the BMS with time. Therefore, this paper presented a case study of applying the RF and IF to help BMS anticipate failures and abuses in real-time. The study case was segmented into three steps. The 18650 NMC cells with 2200 mAh were used for the tests.
Firstly, 12 experiments with OD, OC, ESC, and a combination of them were realized to generate the data for the ML training. Then, the models were built with the dataset. In the second step, only the IF was applied for 12 experiments, similar to the first step. As the IF detected the anomaly by observing the temperature, the abuse was identified with a delay, which impacted the degradation. Despite that, the degradation rate was 45% lower than Step 1.
Finally, the same 12 experiments were applied to the combination of the IF and RF. In these experiments, the reaction time of the identified abuse was almost instantaneous. This approach reduced the cells’ capacity loss in about 90%. Thus, it is possible to guarantee that ML can help the BMS control the LIBs to avoid failures and prolong the batteries’ lifetime. For future works, it is expected to work with an actual situation where the system can work onboard in the electric vehicle to identify failures online.

 ,
, 


