Article

Fuel Consumption Comparison between Hydraulic Mechanical Continuously Variable Transmission and Stepped Automatic Transmission Based on the Economic Control Strategy

1
Department of Vehicle Engineering, Nanjing Forestry University, Nanjing 210037, China
2
College of Engineering, Nanjing Agricultural University, Nanjing 210031, China
*
Author to whom correspondence should be addressed.
Machines 2022, 10(8), 699; https://doi.org/10.3390/machines10080699
Submission received: 13 July 2022 / Revised: 10 August 2022 / Accepted: 14 August 2022 / Published: 17 August 2022
(This article belongs to the Special Issue Advances in Automation, Industrial and Power Engineering)

Abstract

:
Hydraulic mechanical continuously variable transmission (HMCVT) is a transmission system combining mechanical and hydraulic power flow. The matching and design of the power source and transmission system contribute to the energy-saving and emission reduction of vehicles, and meet the requirements of modern society for environmental protection and energy-saving. This paper takes the transmission system of the pickup truck as a research object to research the transmission ratio control strategy of a self-designed new HMCVT with the goal of minimizing fuel consumption. The research compares it with the standard stepped automatic transmission (SAT). The vehicle model was based on CarSim and MATLAB/Simulink. The simulation was carried out under the EPA cycle, NEDC, and the six-mode cycle. The fuel consumption of SAT and that of HMCVT were compared. The results show that the average fuel savings of the pickup truck with HMCVT are 4.52% in the EPA cycle, 7.01% in the NEDC, and 4.84% in the six-mode cycle compared to the eight-speed SAT. In conclusion, HMCVT is more economically efficient than SAT.

1. Introduction

The rapid development of the automobile industry brings great opportunities for the economy, but also poses challenges to energy sources and the environment. The automobile industry is one of the biggest consumers of oil. In 2011, transportation consumed about 59% of the world’s fuel. With the fuel consumption of automobiles, the carbon dioxide produced by transportation accounts for about 22% of the total global carbon dioxide emissions, and the CO, HC, NOx, and PM emissions are the primary sources of air pollutants [1]. The China Mobile Source Environmental Management Annual Report indicated that in 2018, diesel trucks accounted for 7.9% of the total vehicle population in China, and their NOx emissions and PM emissions accounted for 60.0% and 84.6% of total emissions, respectively. This situation makes the diesel truck the main point of vehicle pollution control. In the face of increasingly severe global energy and environmental problems, reduction in fuel consumption by fossil-fueled vehicles should be the primary trend of development for today’s automobile industry while developing new energy vehicles. To properly mitigate this problem, systems consisting of power batteries [2,3] and electric motors [4] have been widely used in all types of vehicles. In addition, a certain scale of research has been carried out on battery (lithium battery [5,6] and fuel cell [7,8], etc.) characteristics, motor characteristics, electric vehicle powertrain designs, and energy management strategies. However, at present, the use of vehicles equipped with internal combustion engines is still largely in the majority.
The fuel economy is an important evaluation index of vehicles. The engine plays a decisive role in vehicle fuel consumption [9]. Transmission is a vital part of the powertrain system. The more gears the transmission has, the more likely the engine will work under the best fuel-economic conditions. Reasonable matching of transmission and engine can reduce the fuel consumption of vehicles [10]. Transmission can be divided into stepped transmission and continuously variable transmission (CVT), according to whether the transmission ratio can continuously change.
Stepped transmission often adopts electronic controls, so stepped transmission is mostly stepped automatic transmission (SAT). SAT mainly consists of hydraulic automatic transmission (AT), automated mechanical transmission (AMT), and dual-clutch automatic transmission (DCT), featuring advantages of simple structure, high efficiency, and high reliability. Trucks equipped with SAT are often designed with more gears to reduce the frustration of shifting and to reduce fuel consumption. The shifting timing of SAT is determined by control parameters, and it has a direct impact on vehicle performance [11]. Gao et al. [12] took the minimizing energy consumption as the objective for optimization and used the dynamic programming method to formulate the AMT two-parameter gear-shifting rule under five different driving cycles of the electric bus. Foffina et al. [13] comprehensively considered the economy, power performance, and transmission durability, and applied multi-objective genetic algorithms to optimize the shifting rule. Bracard et al. [14] adopted the method of global optimization of the power transmission system to formulate the shift rule, which could reduce fuel consumption while meeting the requirements of power performance. Ngo et al. [15] developed a design methodology to optimize a gear shift strategy of AMT, which can improve the economy while taking into account the dynamic performance. Qin et al. [16] used fuzzy reasoning to identify seven driving intentions and three braking intentions of the driver, respectively. They then adopted different energy management strategies based on the recognition results to achieve a better energy economy.
CVT has the characteristics of a stepless change in transmission ratio, which improves ride comfort and makes the engine always work in the best condition. Compared with vehicles equipped with SAT, CVT has an excellent economy record in principle. Fandzyana et al. [17] proposed a CVT and drive control design. Through nested optimization of the framework, this strategy can enable the vehicle to achieve the best fuel-saving performance in the selected driving cycle, and minimize the CVT weight while tracking error and controlling the workload. Lee et al. [18] developed a speed ratio control method for CVT, which can calculate the engine working point with the minimum instantaneous brake-specific fuel consumption, and determine the engine target torque and target transmission ratio based on the calculation results. The response lag and transmission loss of CVT are taken into account in the control process, which improves the fuel economy of the vehicle system.
According to the transmission mode, CVT can be divided into mechanical CVT, electric CVT, and hydraulic CVT. Within mechanical CVT, metal v-belt CVT has become the focus of research and application in recent years [19,20,21]. The metal v-belt CVT relies on the friction torque generated by the friction between the metal belt and the belt wheel to achieve power transmission. Its transmission power is limited, and its efficiency and service life are low, so it is rarely used in agricultural vehicles and trucks. The electric CVT consists of a generator, a control system, and a traction motor. It has the advantages of large transmission power range and high transmission efficiency. However, due to its significant weight, high cost, and complex controller structure, it is only used in mining dump trucks, large scrapers, and wheel loaders. Hydraulic CVT uses hydraulic pressure to transfer power. It has a smooth transmission and a strong bearing capacity. The disadvantage is low transmission efficiency.
In order to overcome the shortcomings of CVT, the hydraulic mechanical continuously variable transmission (HMCVT) integrates the advantages of both mechanical transmission and hydraulic transmission. Its mechanical power flow ensures the high efficiency and high-power transmission of the system, and the hydraulic power flow enables the continuous change of transmission ratio to ensure that the engine works in the optimal economic working zone. It plays an important role in improving the power performance and economic performance, and in reducing fuel consumption. It is effectively applied in agricultural vehicles in complex and harsh environments.
HMCVT has obvious advantages over mechanical or hydraulic transmission in its transmission working principle, but the actual performance of vehicles equipped with HMCVT is also affected by the HMCVT control strategy. Macor et al. [22] studied the fuel economy of the HMCVT system and proposed an HMCVT control strategy, which can effectively reduce the brake-specific fuel consumption. According to the relationship between the efficiency of HMCVT and the input speed, Ahn et al. [23] studied the coordinated control strategy of the hydraulic mechanical transmission and the engine. Luo et al. [24] studied and analyzed the optimal economy of CVT vehicles and proposed the integrated control strategy of the engine and transmission. Hao et al. [25] studied the overall optimization control strategy of the HMCVT. In order to optimize the overall performance of the CVT system, they discussed the optimal control strategy for the overall performance of the vehicle under instantaneous working conditions based on the power demand and the method for calculating the comprehensive optimization of the overall efficiency of the engine and transmission. Zhang et al. [26] proposed the HMCVT variable speed rule based on the maximum traction power. They formulated the control strategy taking the speed adjustment position, engine speed, working section number, and actual transmission ratio as parameters. Hu et al. [27] designed, simulated, and experimented with the control strategy of a tractor HMCVT. A fuzzy control system based on the optimal economic curve of the engine was designed. Wang et al. [28] studied the fuzzy adaptive PID control of multi-stage HMCVT tractors. Lu et al. [29] designed the speed-tracking controller of the HMCVT pump-controlled motor system to realize real-time tracking of the motor speed. They proposed an improved particle swarm algorithm to optimize the parameters of the fuzzy PID controller. Zheng et al. [30] analyzed a type of HMCVT and proposed a speed ratio control algorithm flow that can avoid repeated stage switching, and effectively shorten the speed-ratio tracking control time.
At present, the research and application of HMCVT are mainly focused on tractors, and the variable speed control strategy is put forward according to the operating requirements of tractors, while there are few studies on trucks carrying HMCVT [31]. In the stage of the conceptual design of HMCVT, a single software is selected to build a simulation platform for simulation in most cases, while multiple software can combine the different advantages of each software to obtain more reliable simulation results. Because CVT can make the engine work in the optimal economic working zone at all times, theoretically it has a better economy than SAT, so there are few studies on the comparison between SAT and CVT in terms of their fuel consumption. In terms of their control strategy acquisition, there are great differences between SAT and CVT. The transmission efficiency of SAT is relatively high and does not change significantly with the transmission ratio, while the efficiency of CVT changes greatly with the transmission ratio. Therefore, the overall efficiency characteristics of “engine-transmission” need to be taken into consideration when formulating the strategy, so the comparison between the two in terms of their fuel economy needs to be further explored.
In order to solve the above problems, we proposed a method for comparing fuel consumption characteristics of HMCVT and SAT based on Matlab/Simulink and Carsim co-simulation in the stage of the conceptual design. The powertrain of the truck (pickup truck) was taken as the research object in the paper. The transmission ratio variation and efficiency characteristics of the self-designed new HMCVT were discussed and analyzed. The transmission ratio control strategies of SAT and HMCVT were developed with the aim of minimizing fuel consumption. On this basis, the whole vehicle model was constructed based on CarSim and MATLAB/Simulink. And the fuel consumption simulation tests were carried out in the EPA cycle, NEDC, and six-mode cycle. Finally, the system and the transmission ratio control strategy developed were verified, and the fuel consumption of SAT and that of HMCVT were compared. The research paper aims to provide a valuable reference for the selection, design, and control strategy development of HMCVT and SAT. In addition, this study also provides a certain degree of reference for the performance evaluation of HMCVT and SAT applied to vehicle systems at the conceptual design stage.

2. A Novel 5-Stage HMCVT

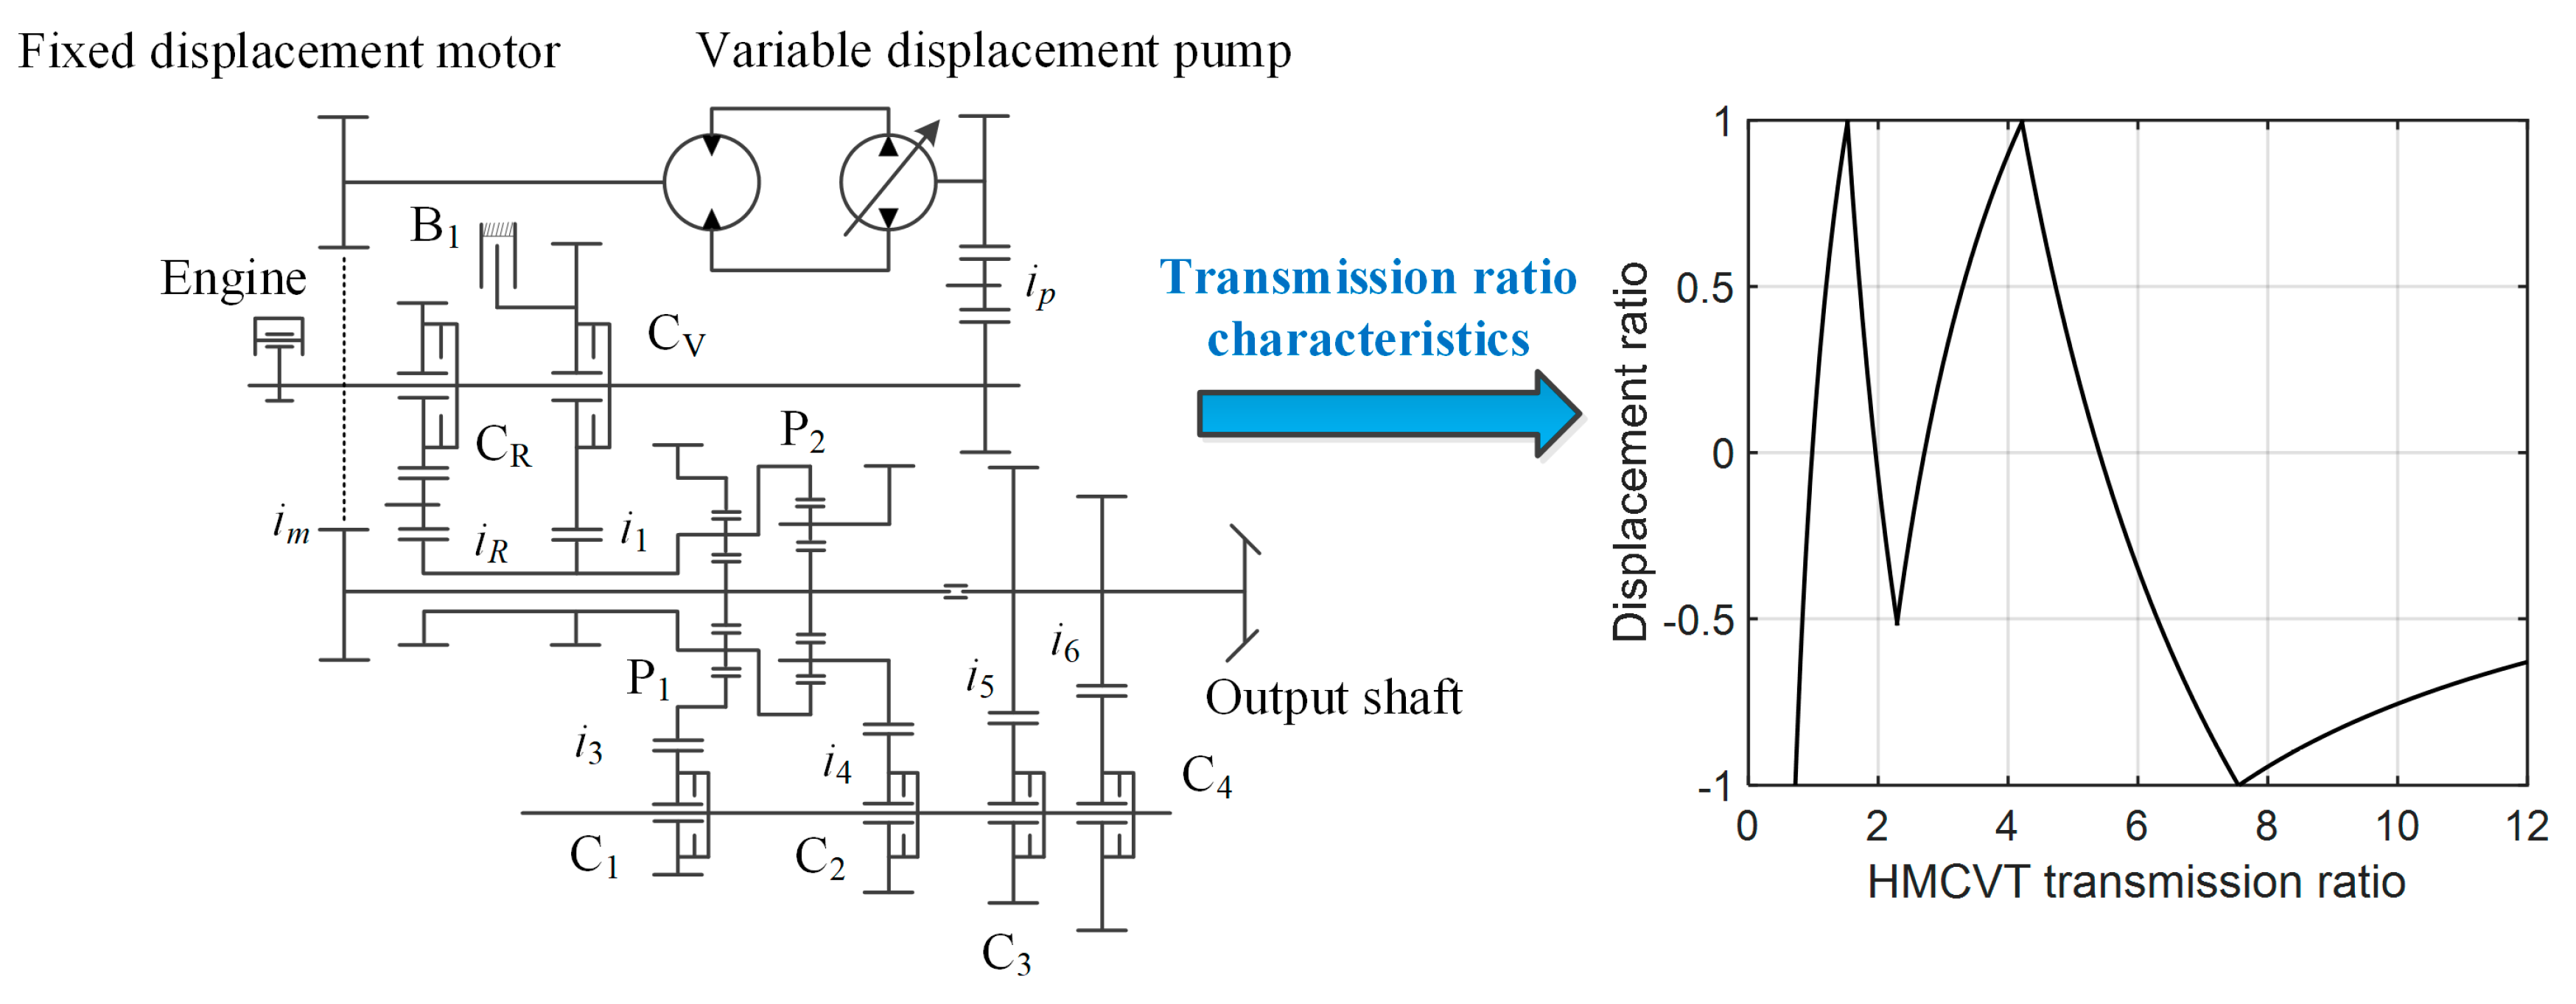
2.1. The Working Principle of HMCVT

HMCVT is composed of hydraulic power flow and mechanical power flow. One part of the output power of the engine enters the hydraulic power flow, and the other part enters the mechanical power flow, and then outputs through the confluence mechanism. The paper studies a self-designed new five-stage hydro-mechanical CVT, and its transmission scheme diagram and transmission ratio characteristics are shown in Figure 1.
The hydraulic transmission system consists of a “variable pump-fixed motor” system. One part of the engine output power, through the gear pair ip input to the variable pump. When HMCVT works, the displacement can be adjusted by controlling the swash plate inclination of the variable pump, and the speed of the fixed motor can be changed to realize stepless speed regulation.
The mechanical transmission system is mainly composed of planetary gears. The confluence mechanism of the transmission is composed of planetary gears P1 and P2. The power output by the hydraulic transmission system is input to the sun gear of P1 and P2 through im, and the remaining power output by the engine is input to the planet gear of P1 and the gear ring of P2 through i1 or iR (the clutch CV engages in the forward stage, and the clutch CR engages in the backward stage) to achieve convergence. Engage or disengage clutches C1, C2, C3 and C4 so that power is output through i3 or i4, i5 or i6 to form different stages. There are five working stages in the forward stage (named H0, HM1, HM2, HM3, and HM4). When the clutch CV is disengaged and the brake B1 is engaged, the power of the engine is only input into the hydraulic transmission system, which is a pure hydraulic working stage, so that the vehicle can start smoothly. When the clutch CV is engaged, it is the hydraulic-mechanical coupling working stage. The backward stage has the same five stages as the forward stage.

2.2. Transmission Ratio Variation Characteristics of HMCVT

According to the HMCVT transmission scheme studied in this paper, the transmission ratio of each stage of the HMCVT can be calculated as follows:
i H 0 = k 1 i p i m i 3 i 5 ε
i H M 1 = ( 1 + k 2 ) i p i m i 1 i 4 i 5 k 2 i p i m + ε i 1
i H M 2 = k 1 i p i m i 1 i 3 i 5 ( 1 + k 1 ) i p i m + ε i 1
i H M 3 = ( 1 + k 2 ) i p i m i 1 i 4 i 6 k 2 i p i m + ε i 1
i H M 4 = k 1 i p i m i 1 i 3 i 6 ( 1 + k 1 ) i p i m + ε i 1
where ε is the displacement ratio of the variable pump to the fixed motor, k1 and k2 are the transmission characteristic constants of planetary gears P1 and P2.
The transmission design parameters of the mechanism are shown in Table 1 [32]. Substitute the parameters in the table into Equations (1)–(5), as shown in Figure 1. ε changes continuously between −1 and +1, so that the transmission ratio of each stage changes continuously. When the ε changes from −1 to +1, the clutch C2 engages, the power is output from the planet gear of the planetary gear P2, and the transmission ratio decreases. When the ε changes from +1 to −1, the clutch C1 engages and the power is output from the ring of planetary gear P1, but the transmission ratio still decreases. The transmission ratio range of adjacent stages overlaps, so that the overall transmission ratio can change continuously.

2.3. HMCVT Efficiency Characteristics

HMCVT has complex factors affecting efficiency characteristics [33]. Based on the transmission system model of the five-stage HMCVT established by previous studies [32], the full factorial test was used for simulation. The single-factor, two-factor, and three-factor were taken as independent variables to establish the efficiency characteristic piecewise model of HMCVT. And the improved genetic algorithm (I-GA) was used to solve the unknown parameters in the models.
After parameter identification, the fitness of the single-factor model, two-factor model, and three-factor model based on the I-GA algorithm are 3.1375%, 1.8293%, and 1.6884%, all of which have high precision and can meet the research needs of formulating energy-saving strategies. Therefore, in order to reduce the number and workload of tests, the single-factor model can be used to provide a basis for the formulation of control strategies in the paper. Its expression is:
η c v t = { a 1 + a 2 x 1 ,   ε 0 b 1 + b 2 x 1 ,   ε > 0
where ηcvt is the efficiency characteristic model of HMCVT, x1 is the influencing factor, a1, a2, b1, b2 are all coefficients (see Table 2).

3. Formulation of Transmission Ratio Control Strategy
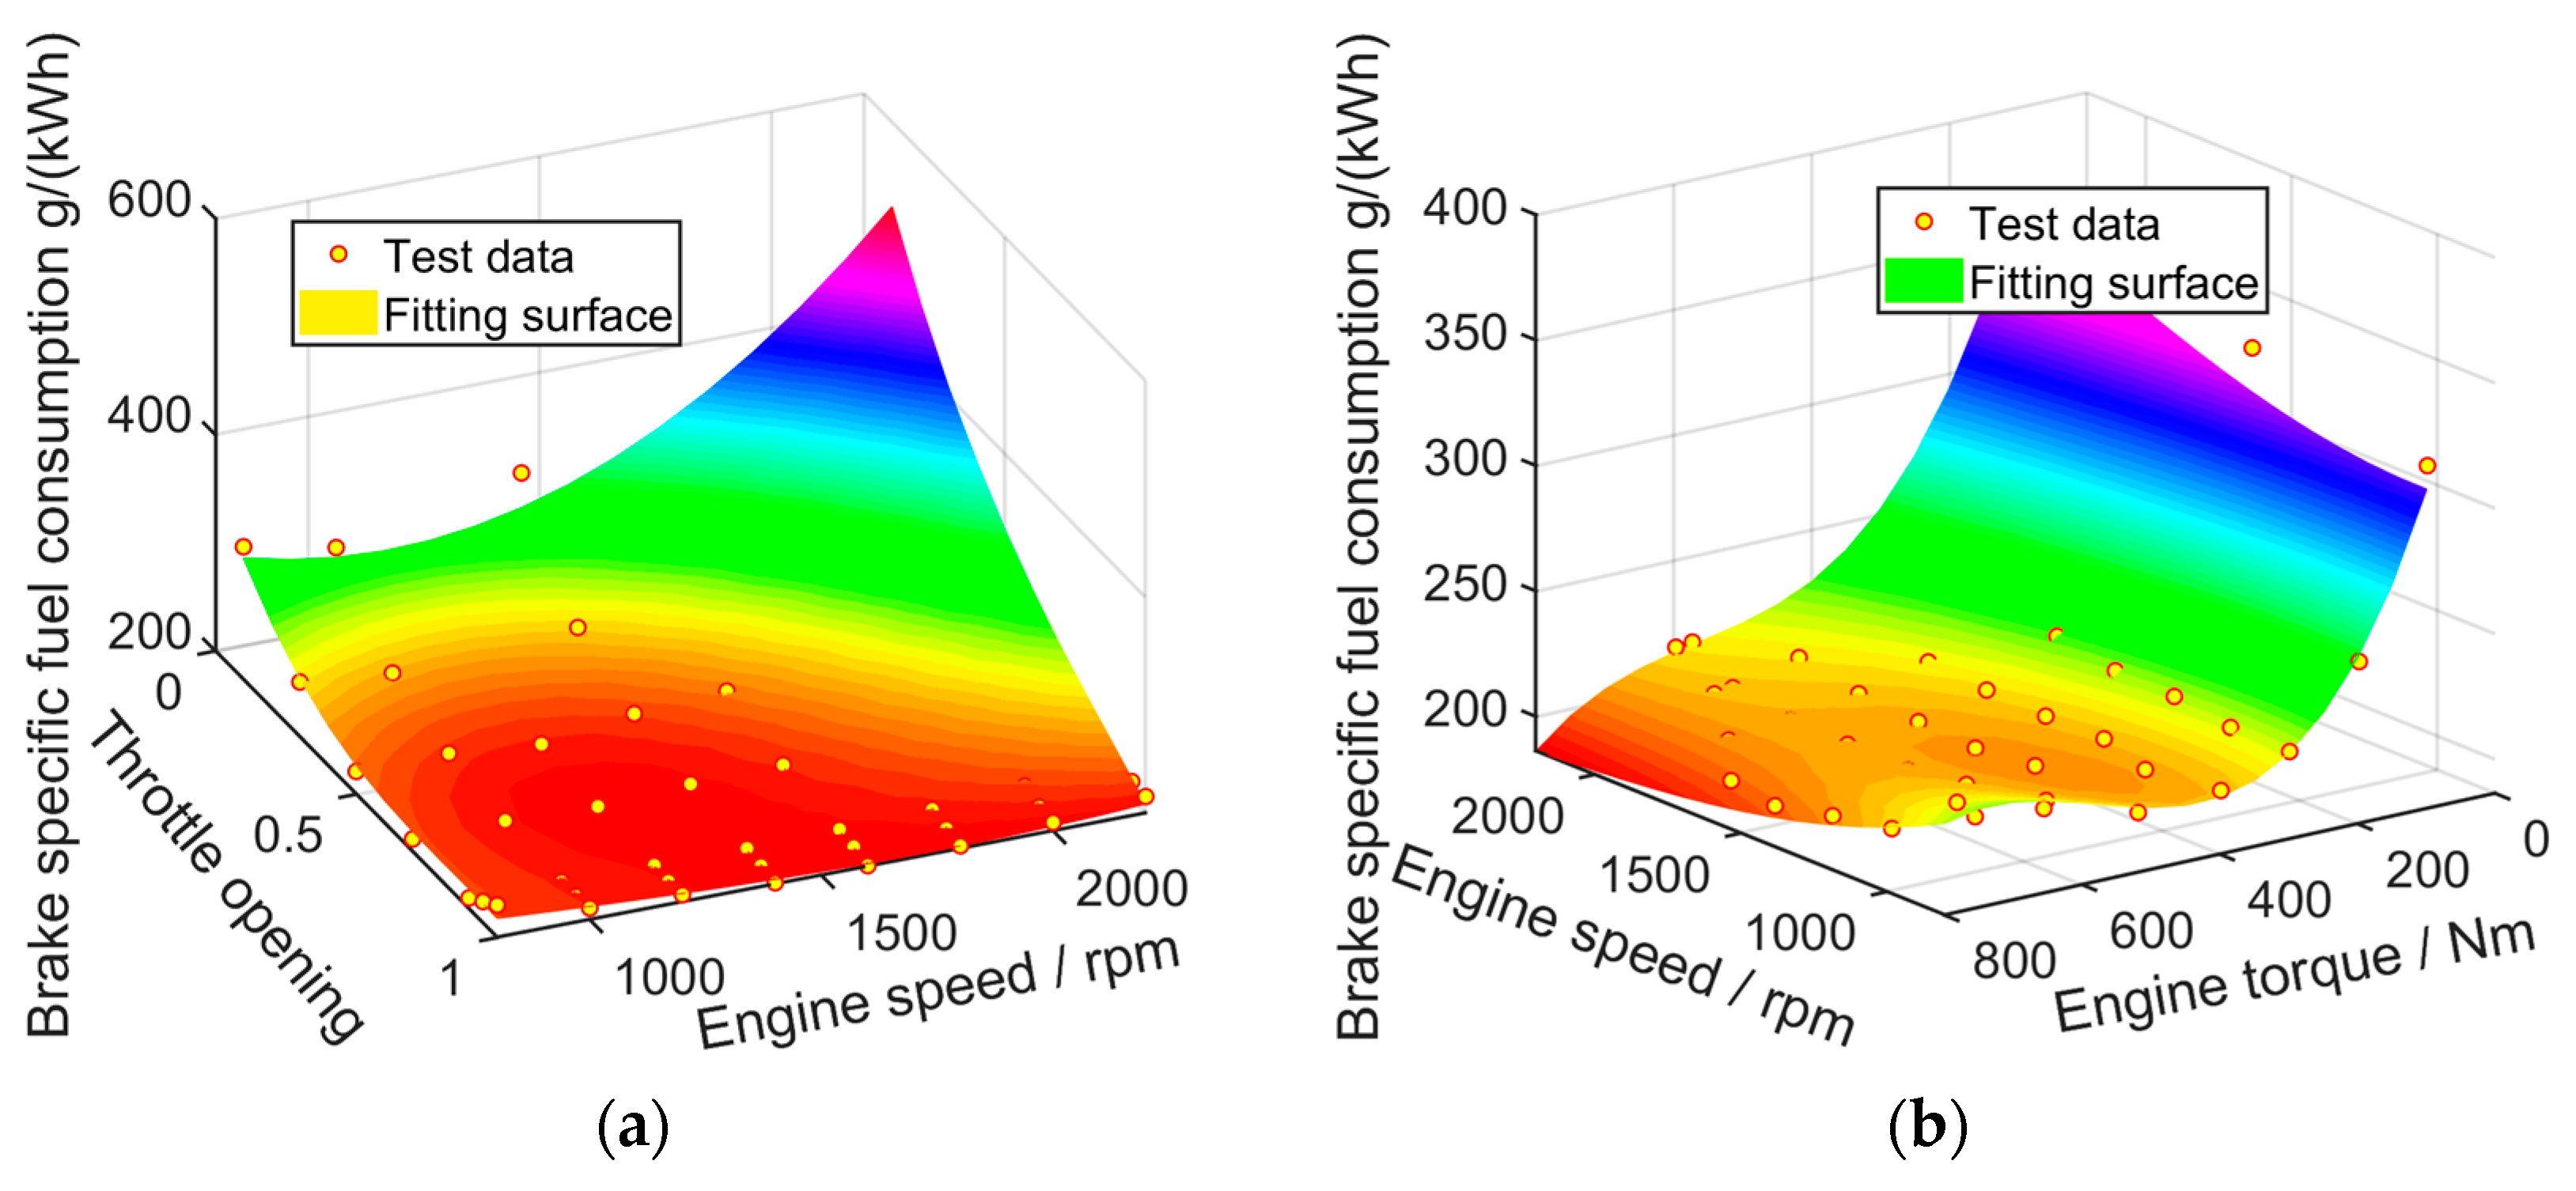
3.1. Engine Model

Vehicles with HMCVT generally use diesel engines. A LR6105ZWT3 engine was selected for this paper, with an operating speed range of 800~2200 r/min and a rated power of 132 kW. According to the test data of the engine [34], the brake-specific fuel consumption model of the engine is obtained by polynomial regression as follows:
g e = 239.757 α 3 + 0.0352 α 2 n 1.940 × 10 4 α n 2 + 5.989 × 10 9 n 3 + 574.183 α 2 + 0.369 α n + 1.866 × 10 4 n 2 673.165 α 0.432 n + 580.341
g e = 8.491 × 10 9 n 3 2.695 × 10 9 n 2 T 4.537 × 10 8 n T 2 1.238 × 10 6 T 3 + 5.963 × 10 5 n 2 3.936 × 10 5 n T + 2.192 × 10 3 T 2 0.0766 n 1.133 T + 437.331
where, ge is the brake-specific fuel consumption of the engine, α is the throttle opening, T is the engine torque, and n is the engine speed.
The test data and polynomial regression model are shown in Figure 2.

3.2. Transmission System Model

In order to facilitate comparison with the five-stage HMCVT studied in this paper, the transmission ratio range of SAT should be the same as that of HMCVT. The range of transmission ratio variation is equally divided into eight gears, and the transmission ratio of each gear is in accordance with the following relationship:
i g 1 i g 2 = i g 2 i g 3 = = i g k 1 i g k = q
where igk represents the transmission ratio of gear k, and q is the common ratio.
Table 3 shows the gear ratio of the eight-speed SAT.
This paper selected the pickup truck model in CarSim for simulation. Set the maximum vehicle speed uamax as 120 km/h and wheel radius rd as 0.34 m. According to the minimum transmission ratio of the transmission in the paper, 0.72, the transmission ratio of the final drive can be calculated by the equation (Reference for the calculation formula of the physical quantity related to the vehicle when the vehicle is running [35]):
i 0 = 0.377 n max r d u a max i min
where imin is the minimum transmission ratio of the transmission, nmax is the maximum engine speed, and 0.377 is used for unit conversion.
The transmission ratio of the final drive ratio i0 is 3.264.

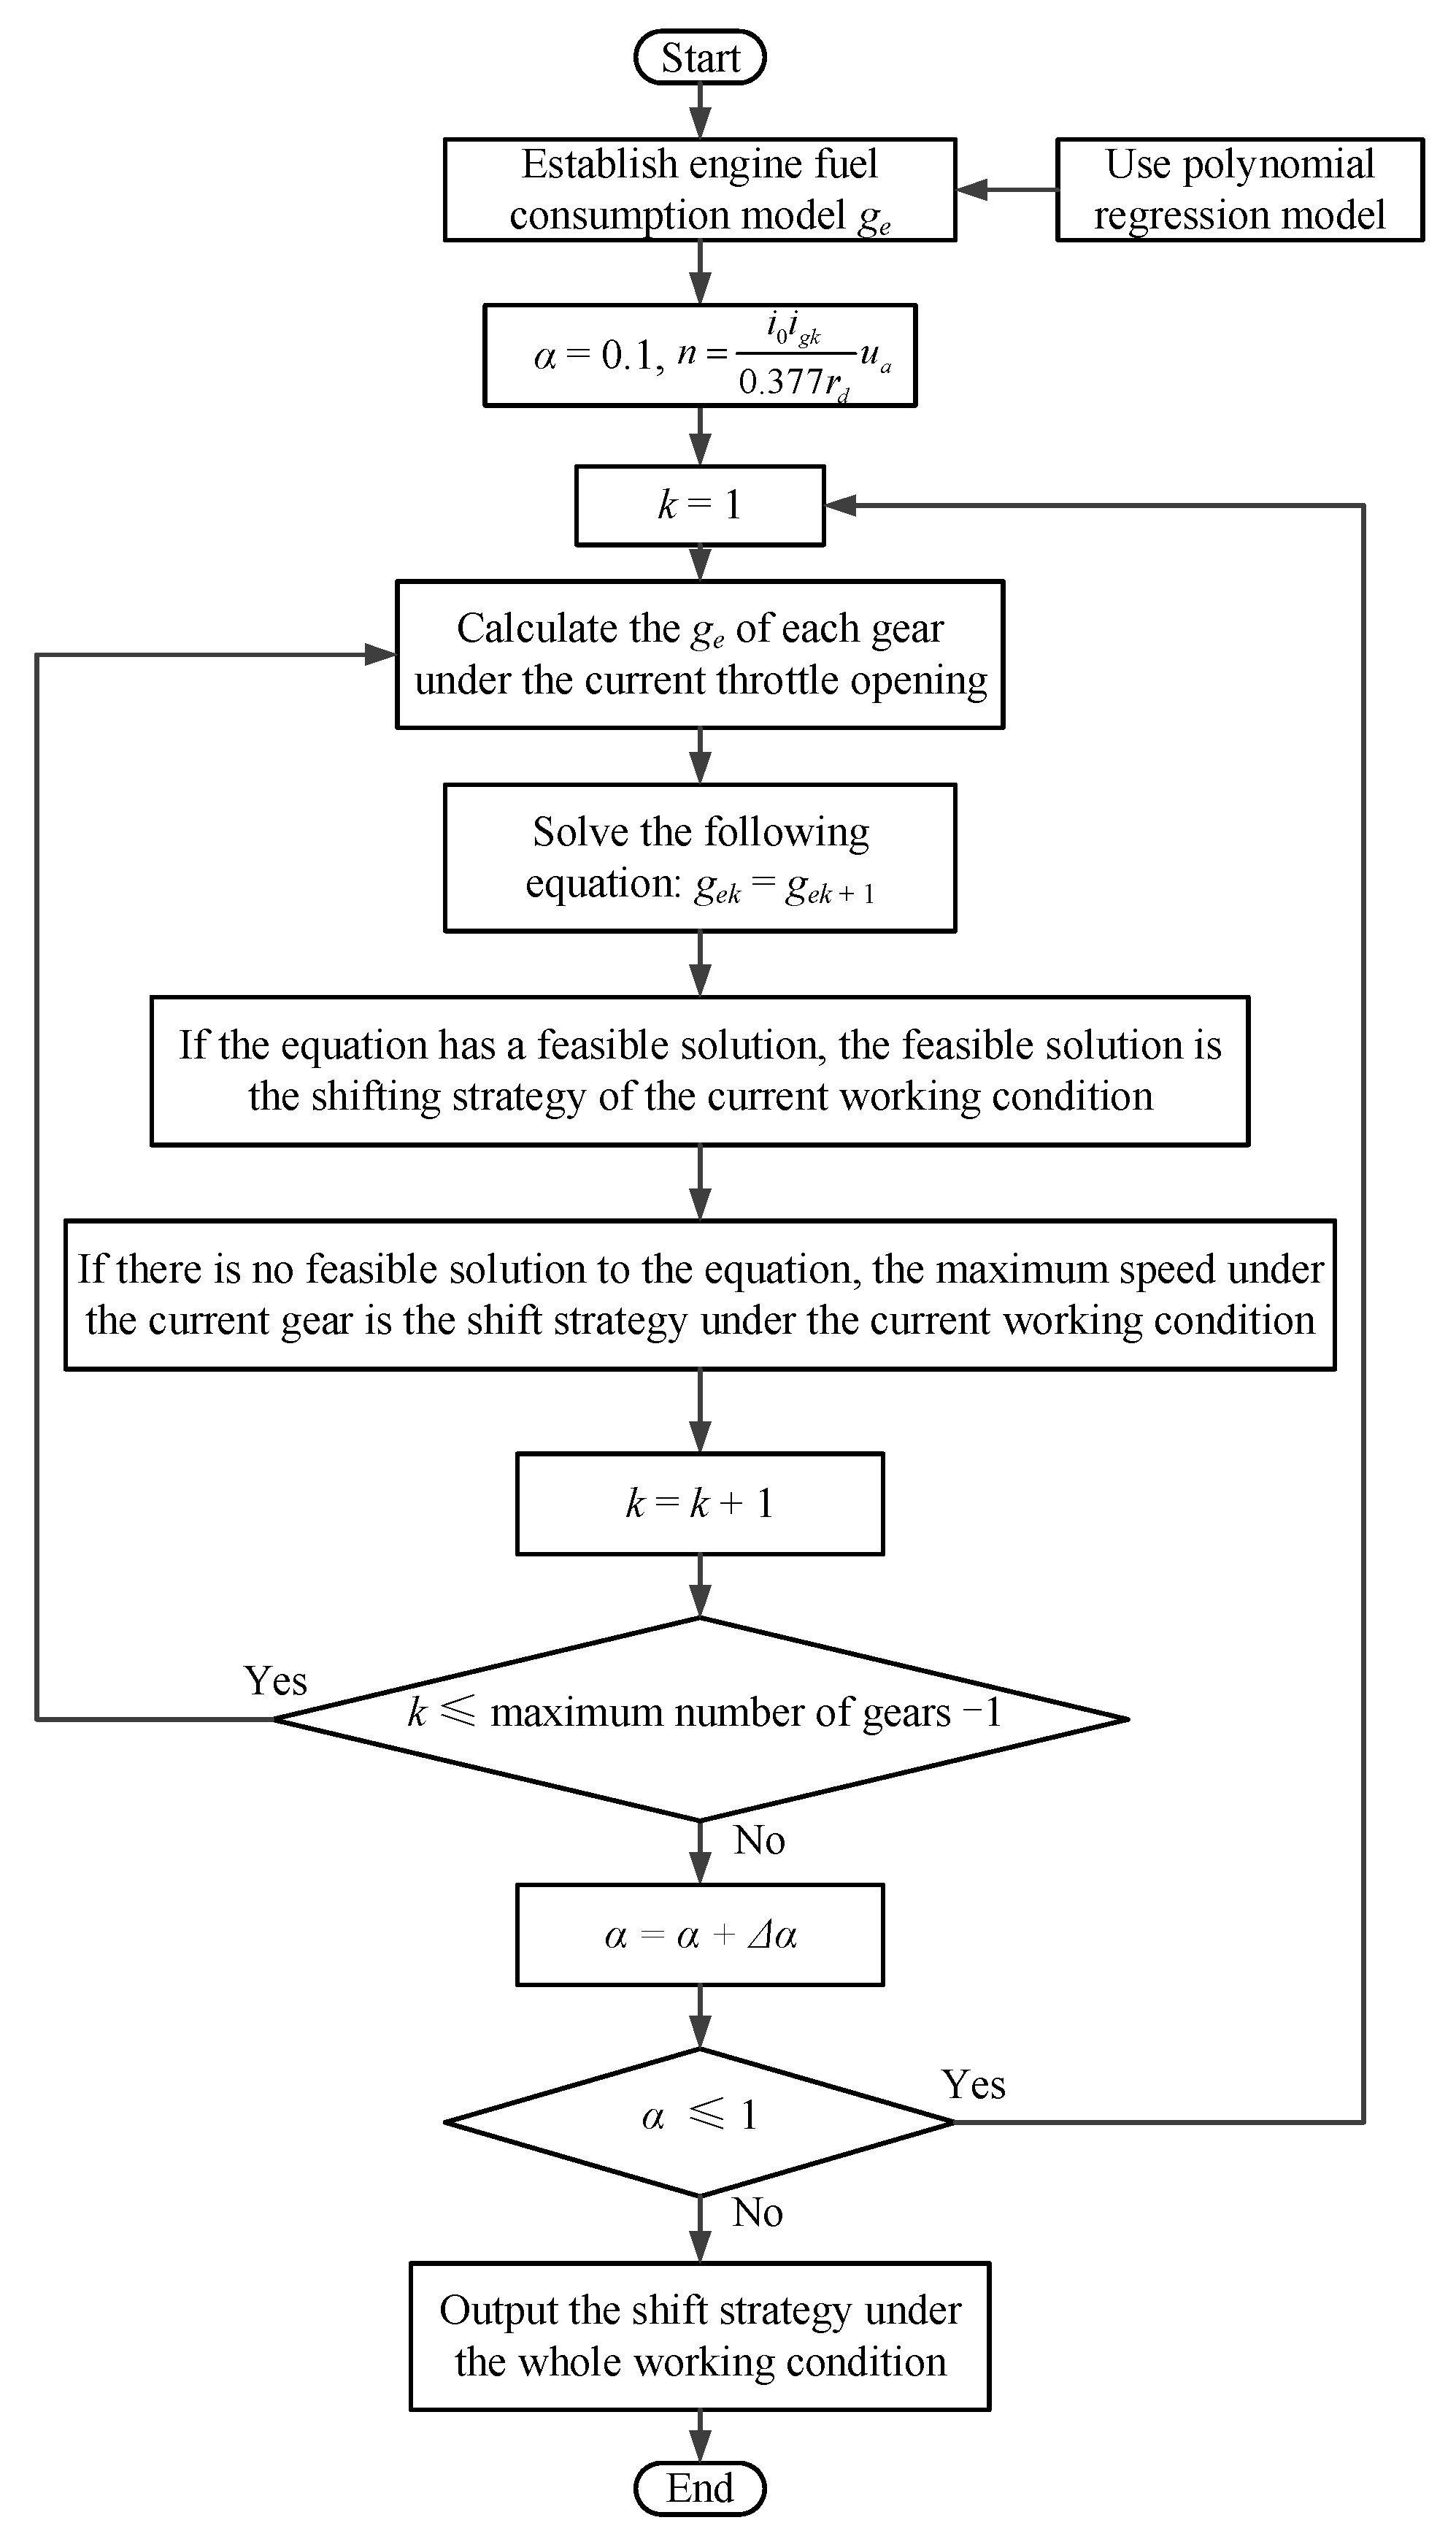
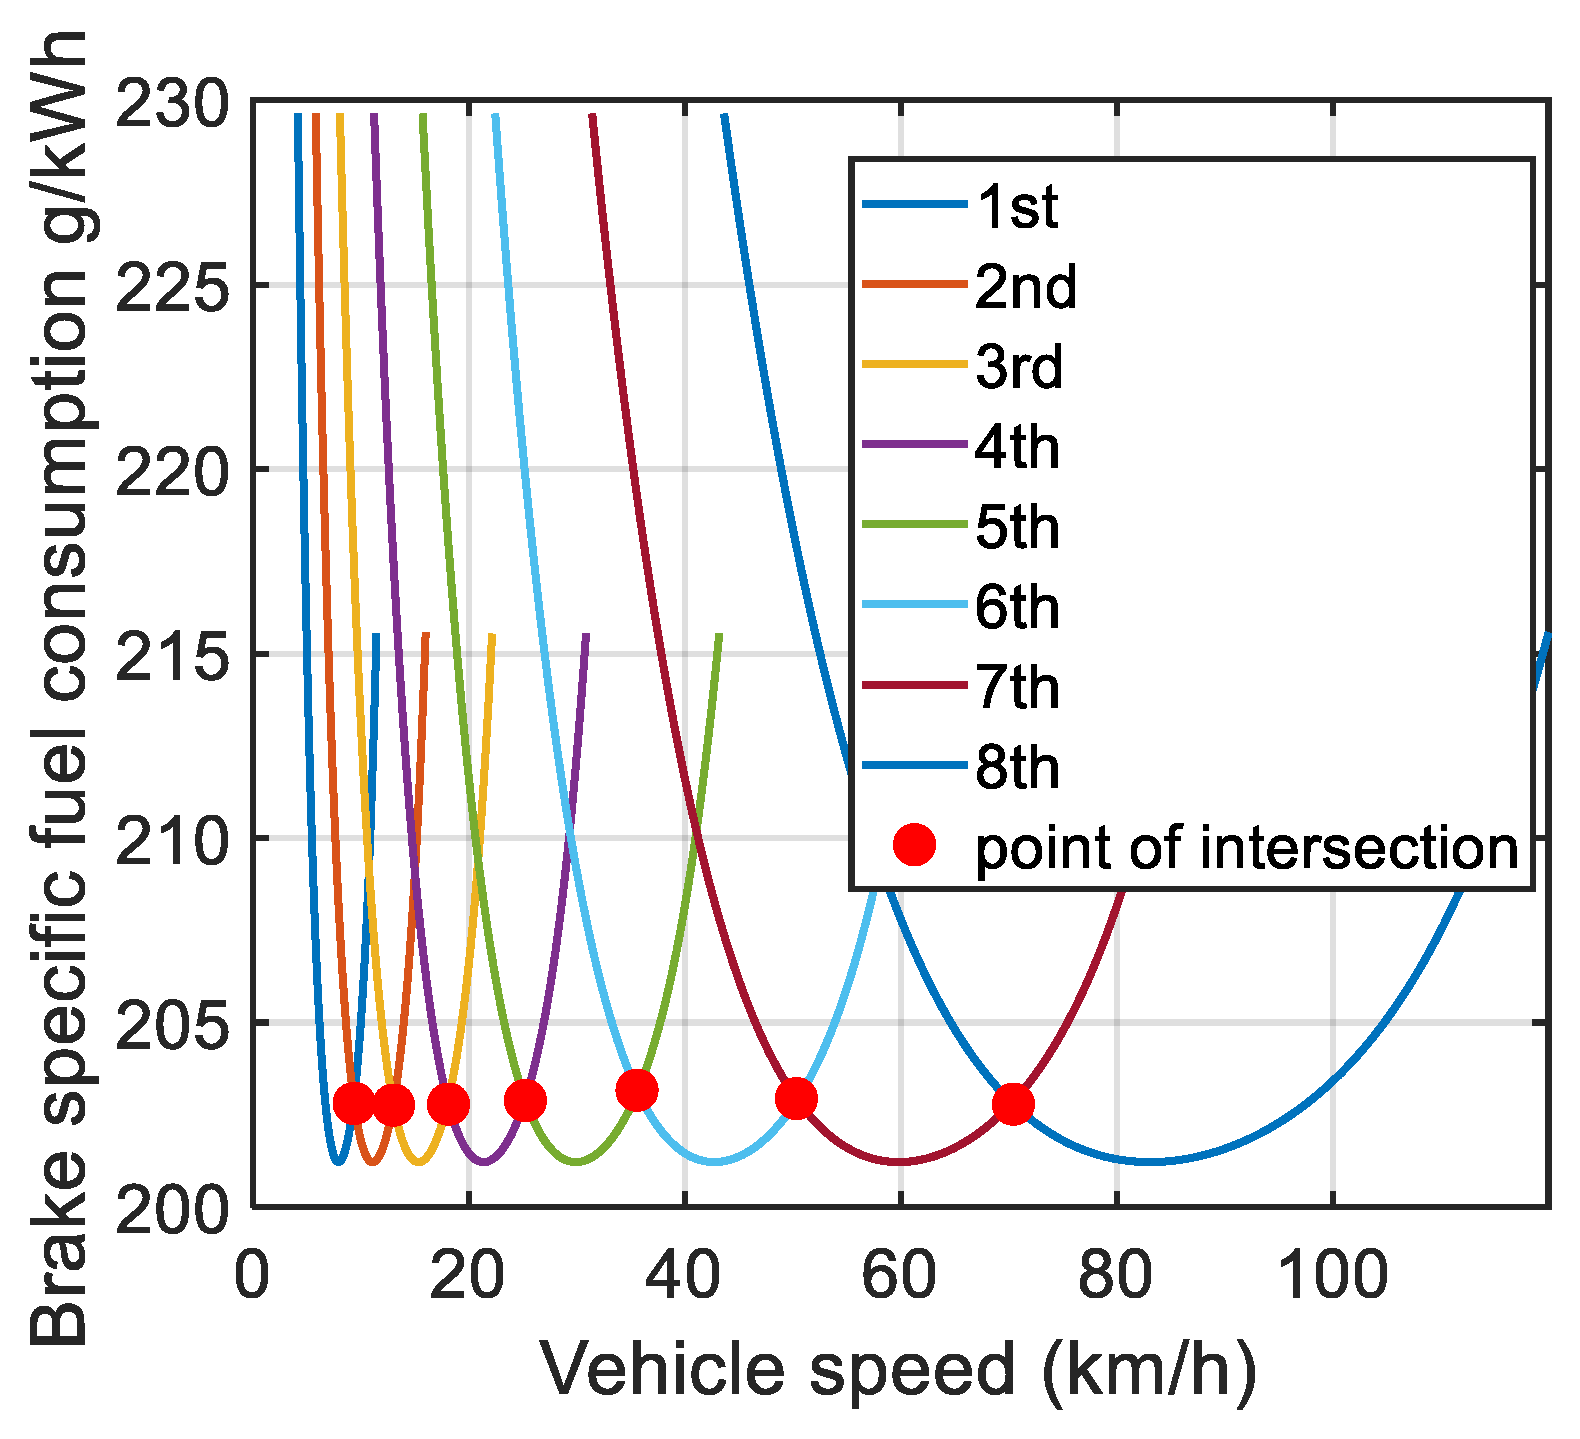
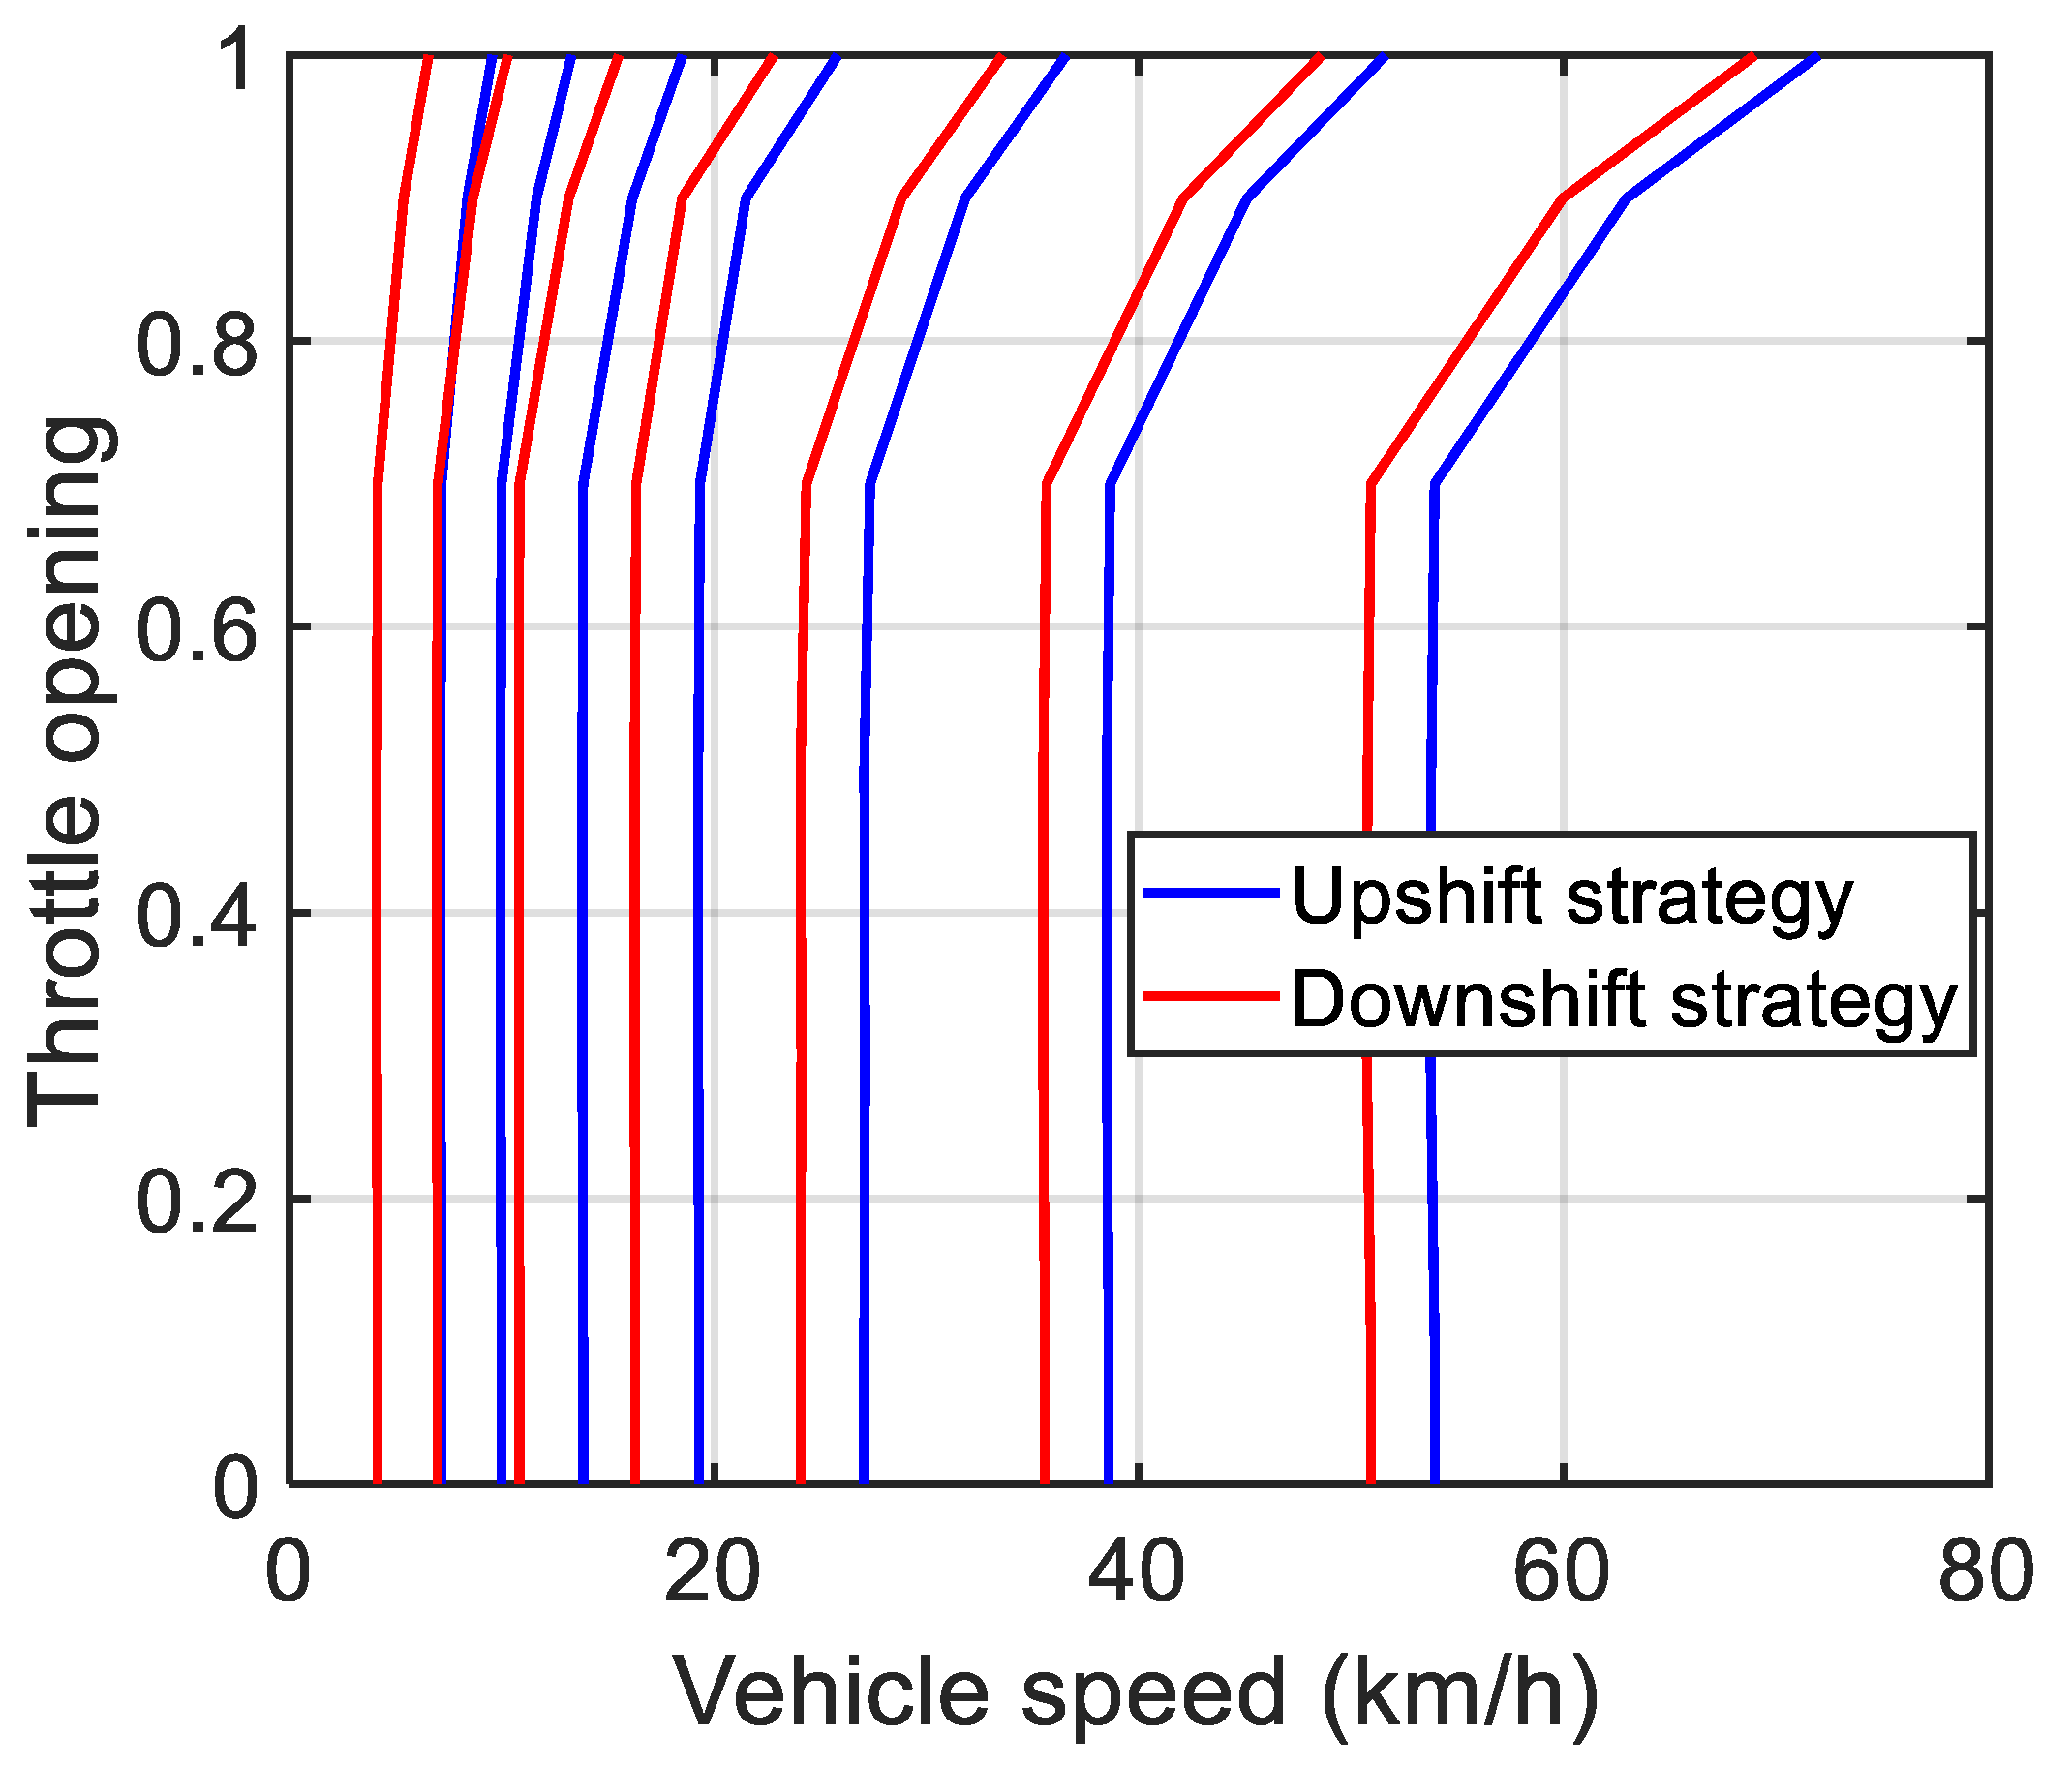
3.3. Economical Optimal Transmission Ratio Control Strategy of SAT

Economic optimal two-parameter transmission ratio control strategy is generally based on throttle opening and speed two parameters to control the transmission ratio. At the same throttle opening and vehicle speed, the smaller the brake-specific fuel consumption, the better the economy. The transmission control unit according to the established shift curve, corresponding to the current throttle opening and speed, controls the actuator to select the corresponding gear.
The relationship between engine speed and vehicle speed in each gear position is as follows:
n = i 0 i g k 0.377 r d u a
By substituting Equation (11) for Equation (7), the functional relation between brake-specific fuel consumption of each gear and speed at any throttle opening can be obtained as follows:
g e = 6.105 × 10 3 α 3 + 0.897 α 2 i g k u a 4.940 × 10 3 α i g k 2 u a 2 + 1.525 × 10 7 i g k 3 u a 3 + 1.462 × 10 4 α 2 + 9.407 α i g k u a + 4.752 × 10 3 i g k 2 u a 2 1.714 × 10 4 α 11.012 i g k u a + 1.478 × 10 4
At the same throttle opening, the brake-specific fuel consumption equation of adjacent gears can be given as follows:
g e k = g e k + 1
where gek is the equation of the brake-specific fuel consumption in k gear and the speed obtained is the shifting speed with the lowest brake-specific fuel consumption under the throttle opening.
If there is no solution to the equation, the maximum speed of k gear is used as the shift opportunity. The shift rule curve can be obtained by connecting the shift speed of the adjacent gear under each throttle opening. Figure 3 shows the flow chart of the method for obtaining the SAT gear shift strategy.
Figure 4 shows the “speed-brake specific fuel consumption” curve of the eight-speed transmission when α = 1. If the vehicle works in front of the intersection of the first gear curve and second gear curve, the first gear curve is below the second gear curve, and the brake-specific fuel consumption of the first gear is currently lower. When the vehicle works at the intersection of the first gear curve and second gear curve, the first gear curve is above the second gear curve, so the brake-specific fuel consumption of the second gear is lower.
Therefore, if there is an intersection point between the curves of two adjacent gears, the vehicle economy can be optimized by switching gears at this throttle opening and speed. If there is no intersection between adjacent gear curves, the speed of gear shift is at the boundary of the curve. According to the above method, taking the pickup truck provided by CarSim as the model, according to the variable speed range of the five-stage HMCVT studied in this paper and the fuel consumption characteristics of the LR6105ZWT3 engine (see Section 3), the shift rule curves of eight-speed SAT based on the principle of minimum brake specific fuel consumption are drawn. In order to avoid the phenomenon of frequent shifts when the vehicle drives at the shift speed, the downshifting speed should be 2–8 km/h lower than the corresponding upshifting speed [36]. In this paper, 3 km/h is selected as the shift delay, and an equal delay type is selected to design the shift downshift curve. When the throttle opening is 0.1, 0.3, 0.5, 0.7, 0.9, and 1, the shifting speed between gears is calculated, and the shifting rule curves of the SAT are shown in Figure 5.

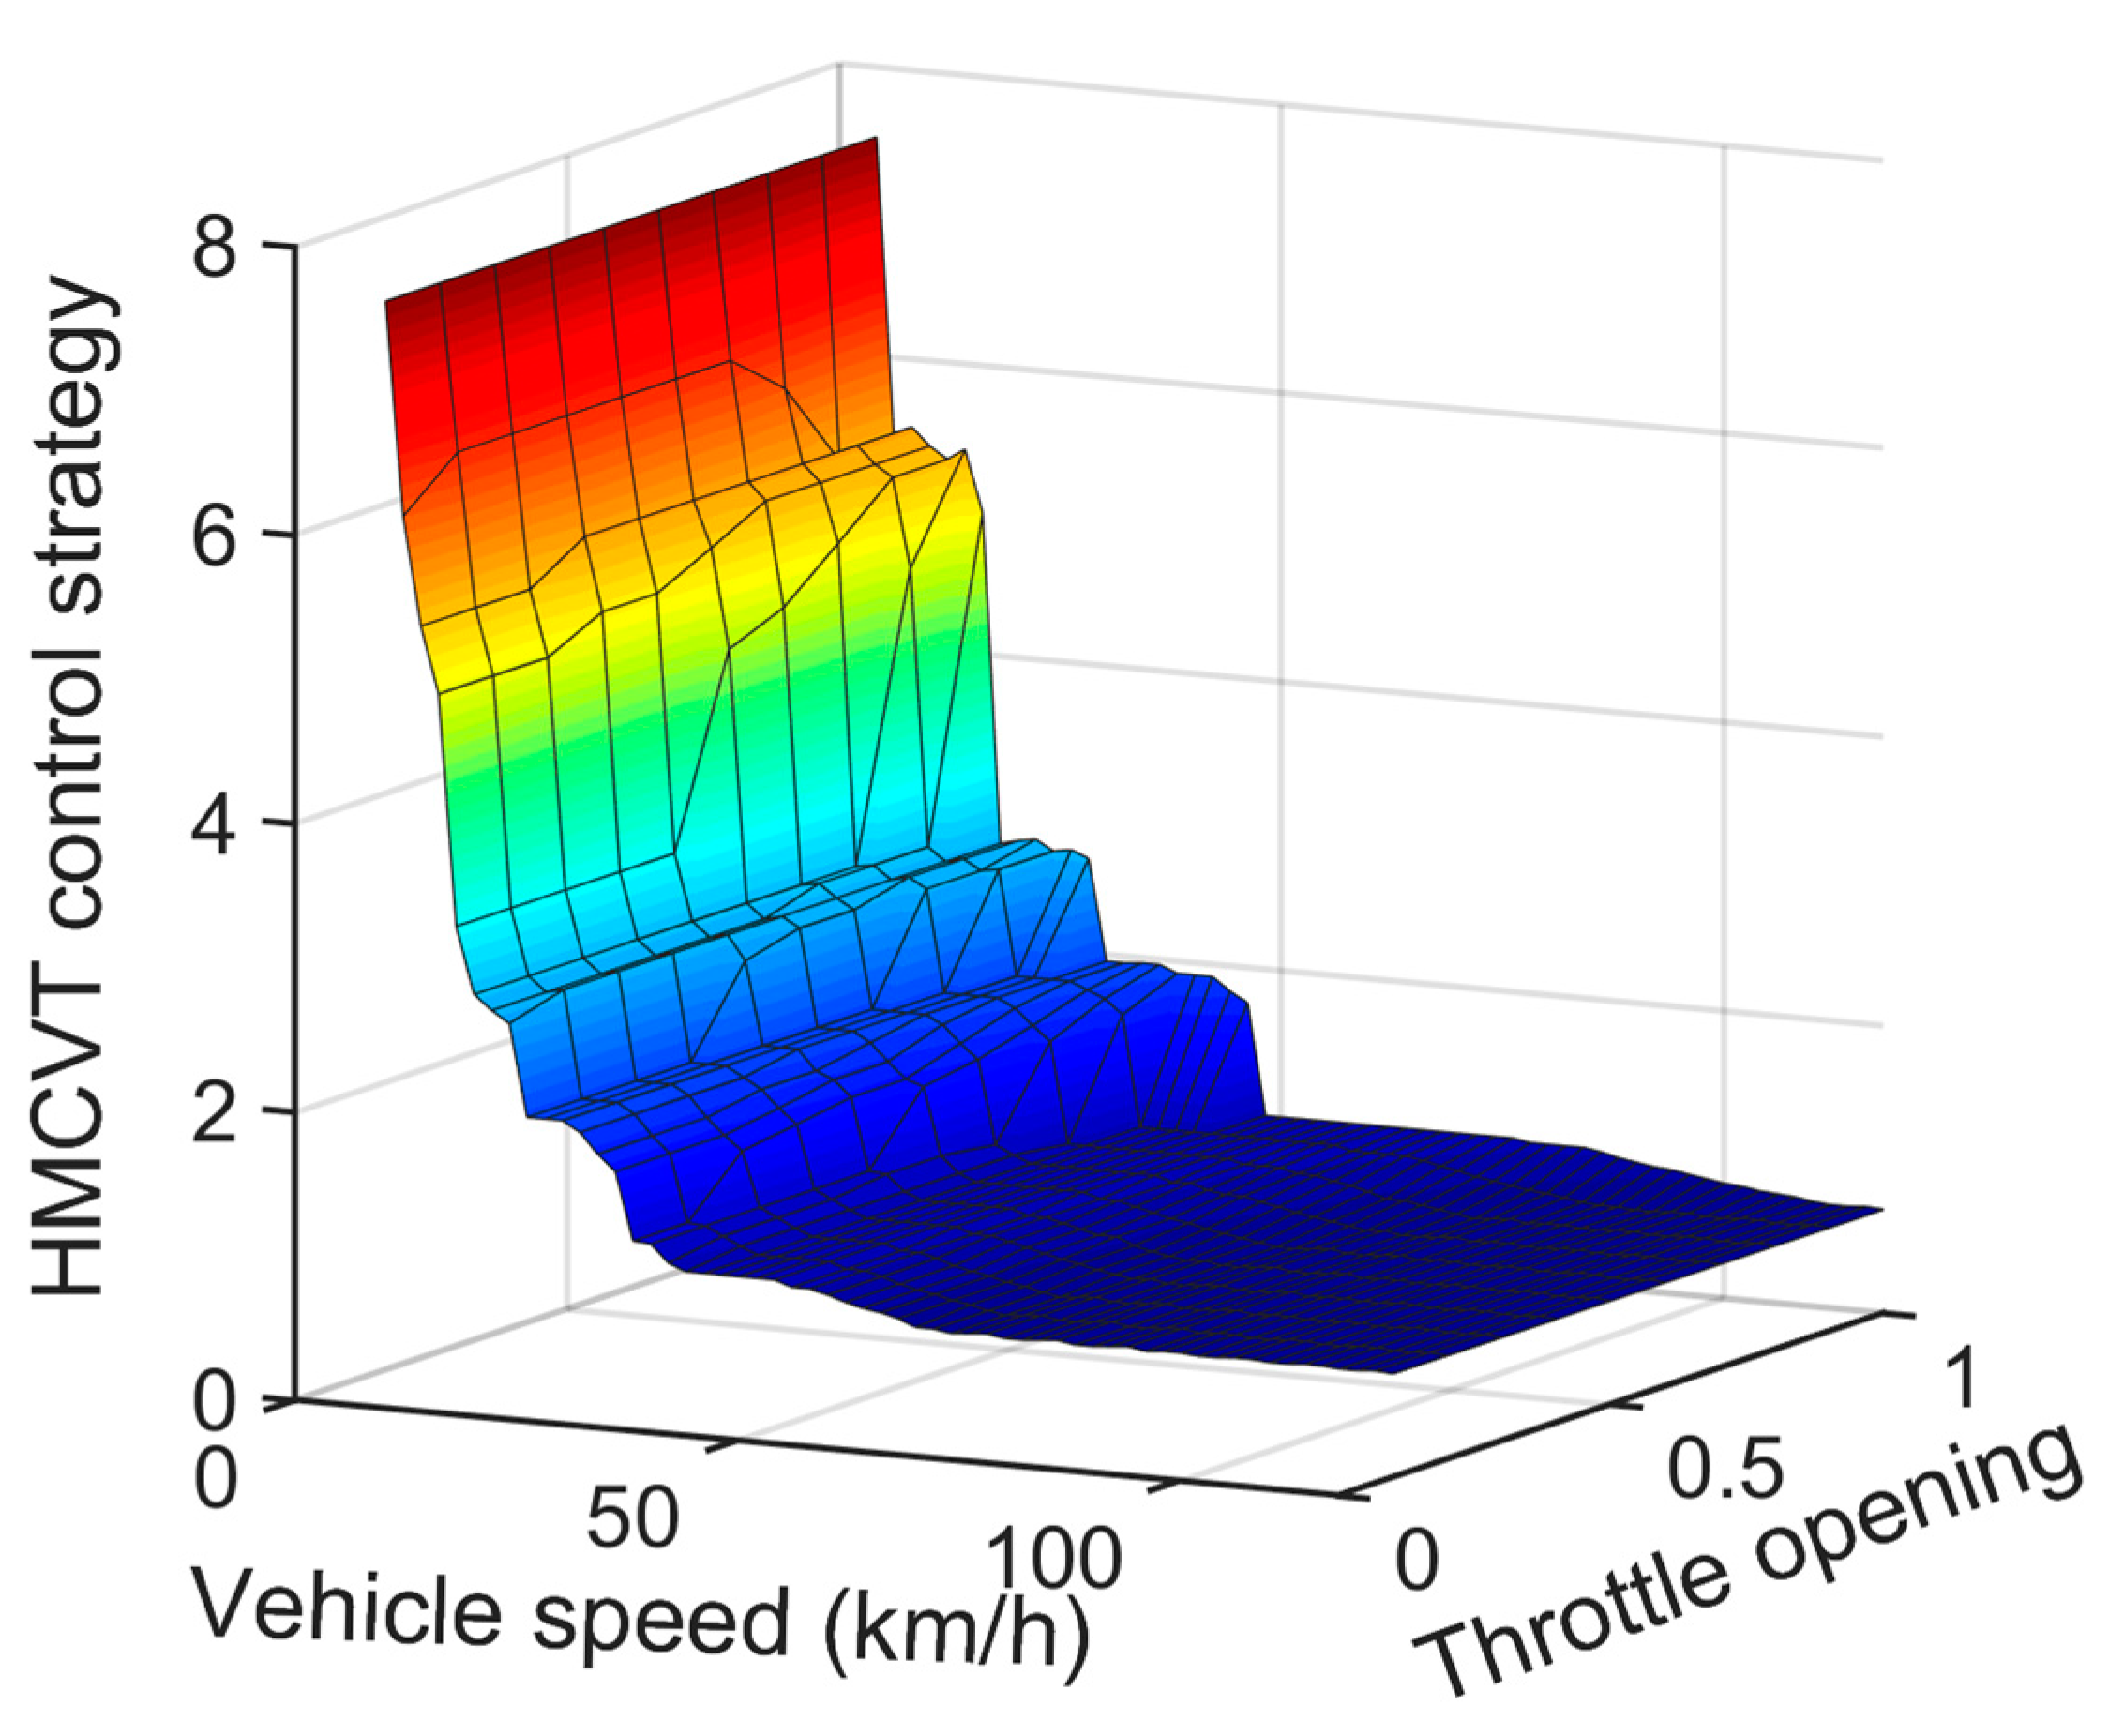
3.4. Economic Optimal Transmission Ratio Control Strategy of HMCVT

CVT can be thought of as SAT with an infinite number of gears. Therefore, the strategy formulation method of CVT is similar to that of SAT. The transmission ratio range of CVT can be discretized into enough gears, and then the economic optimal shift curve can be made. The economic optimal transmission ratio control strategy map of CVT can be obtained by combining these curves. Considering the transmission efficiency of HMCVT, the brake-specific fuel consumption gP of the pickup truck is calculated as follows:
g P = g e η T η c v t
where η’T is the total transmission efficiency of the transmission system except the HMCVT, and ηcvt is the transmission efficiency of the five-stage HMCVT studied in this paper (see Section 2.3).
According to the formulation method of the map of the economic optimal shift rule of CVT mentioned above, the map of the economic optimal shift rule of HMCVT can be obtained according to the brake-specific fuel consumption characteristics of the LR6105ZWT3 engine and the throttle opening is divided by a 10% interval, as shown in Figure 6.

4. Establishment of a Simulation Test Platform

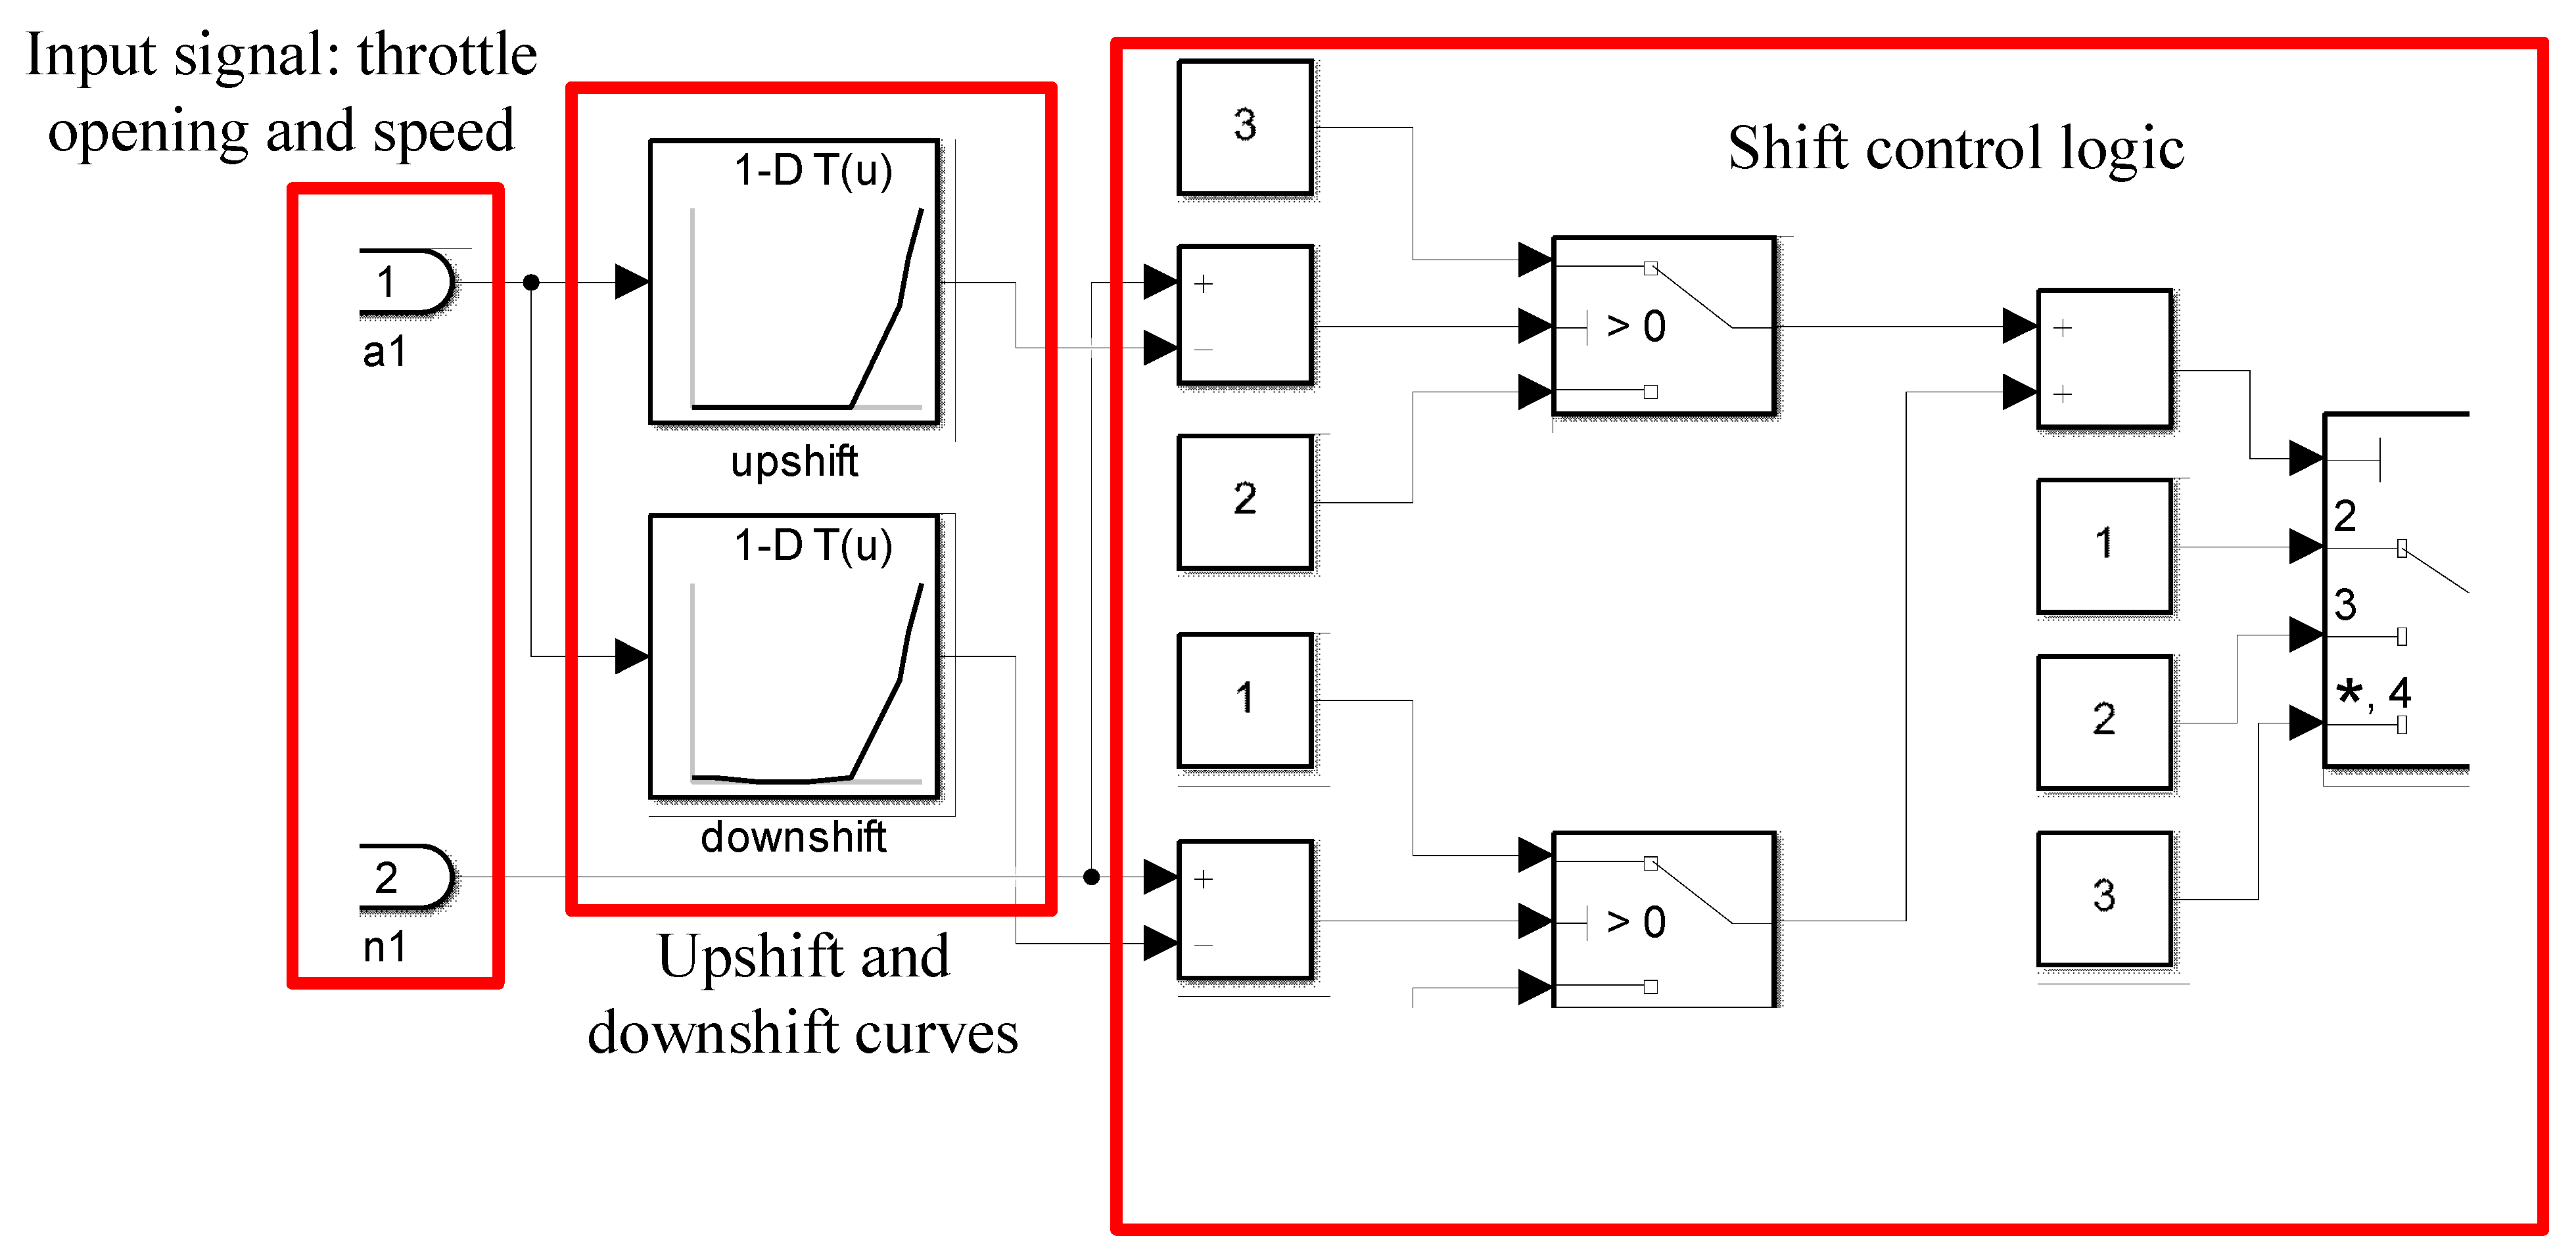
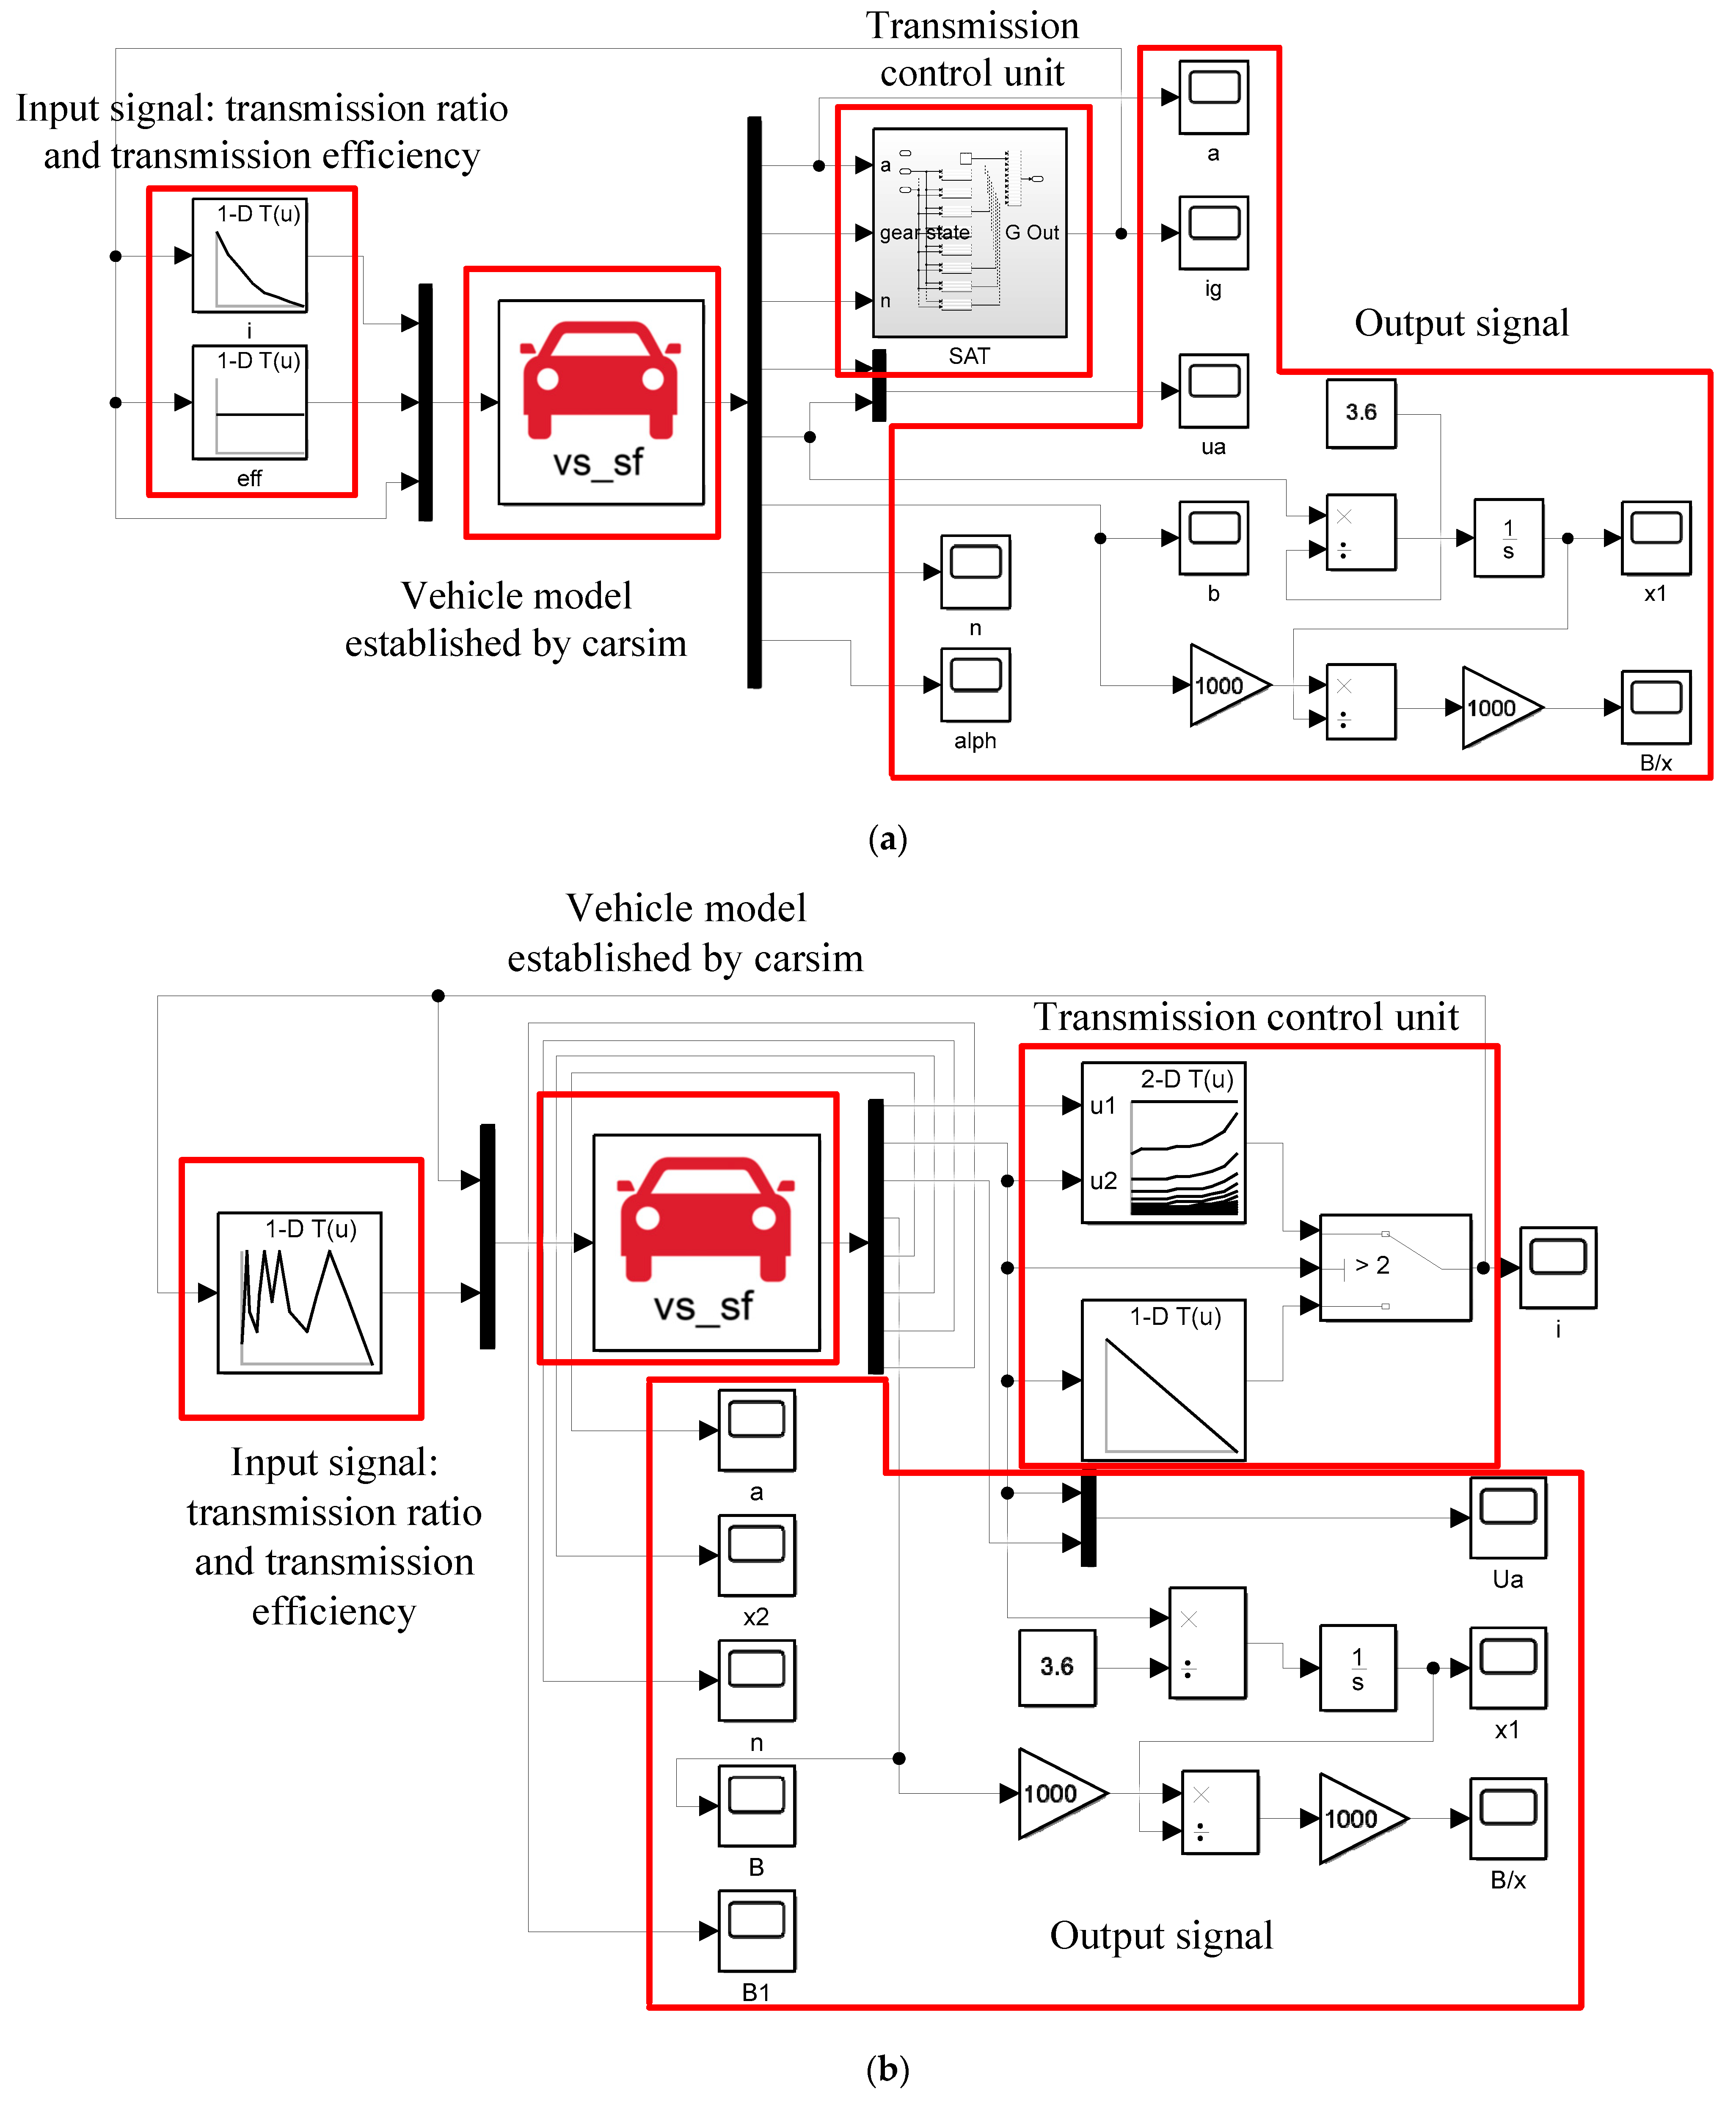
4.1. Transmission Ratio Control Model of SAT

A subsystem of the SAT transmission ratio control model and its overall model are shown in Figure 7 and Figure 8. Assuming that the input information of the current gear is the second gear, the throttle opening, and speed signals are input into the subsystem to output the gear at the next moment. Based on the upshift curve from second gear to third gear and the downshift curve from second gear to first gear, the position of the driving condition in the shift curve coordinate system is judged according to the input signal. If the position is below the downshifting curve, shift into first gear; If it is between the downshift curve and upshift curve, stay in second gear; If it is above the upshift curve, shift into third gear. When other gear signals are input, the judgment process of gear shift is similar. The transmission ratio and transmission efficiency of the corresponding gear position are obtained via a reference table.

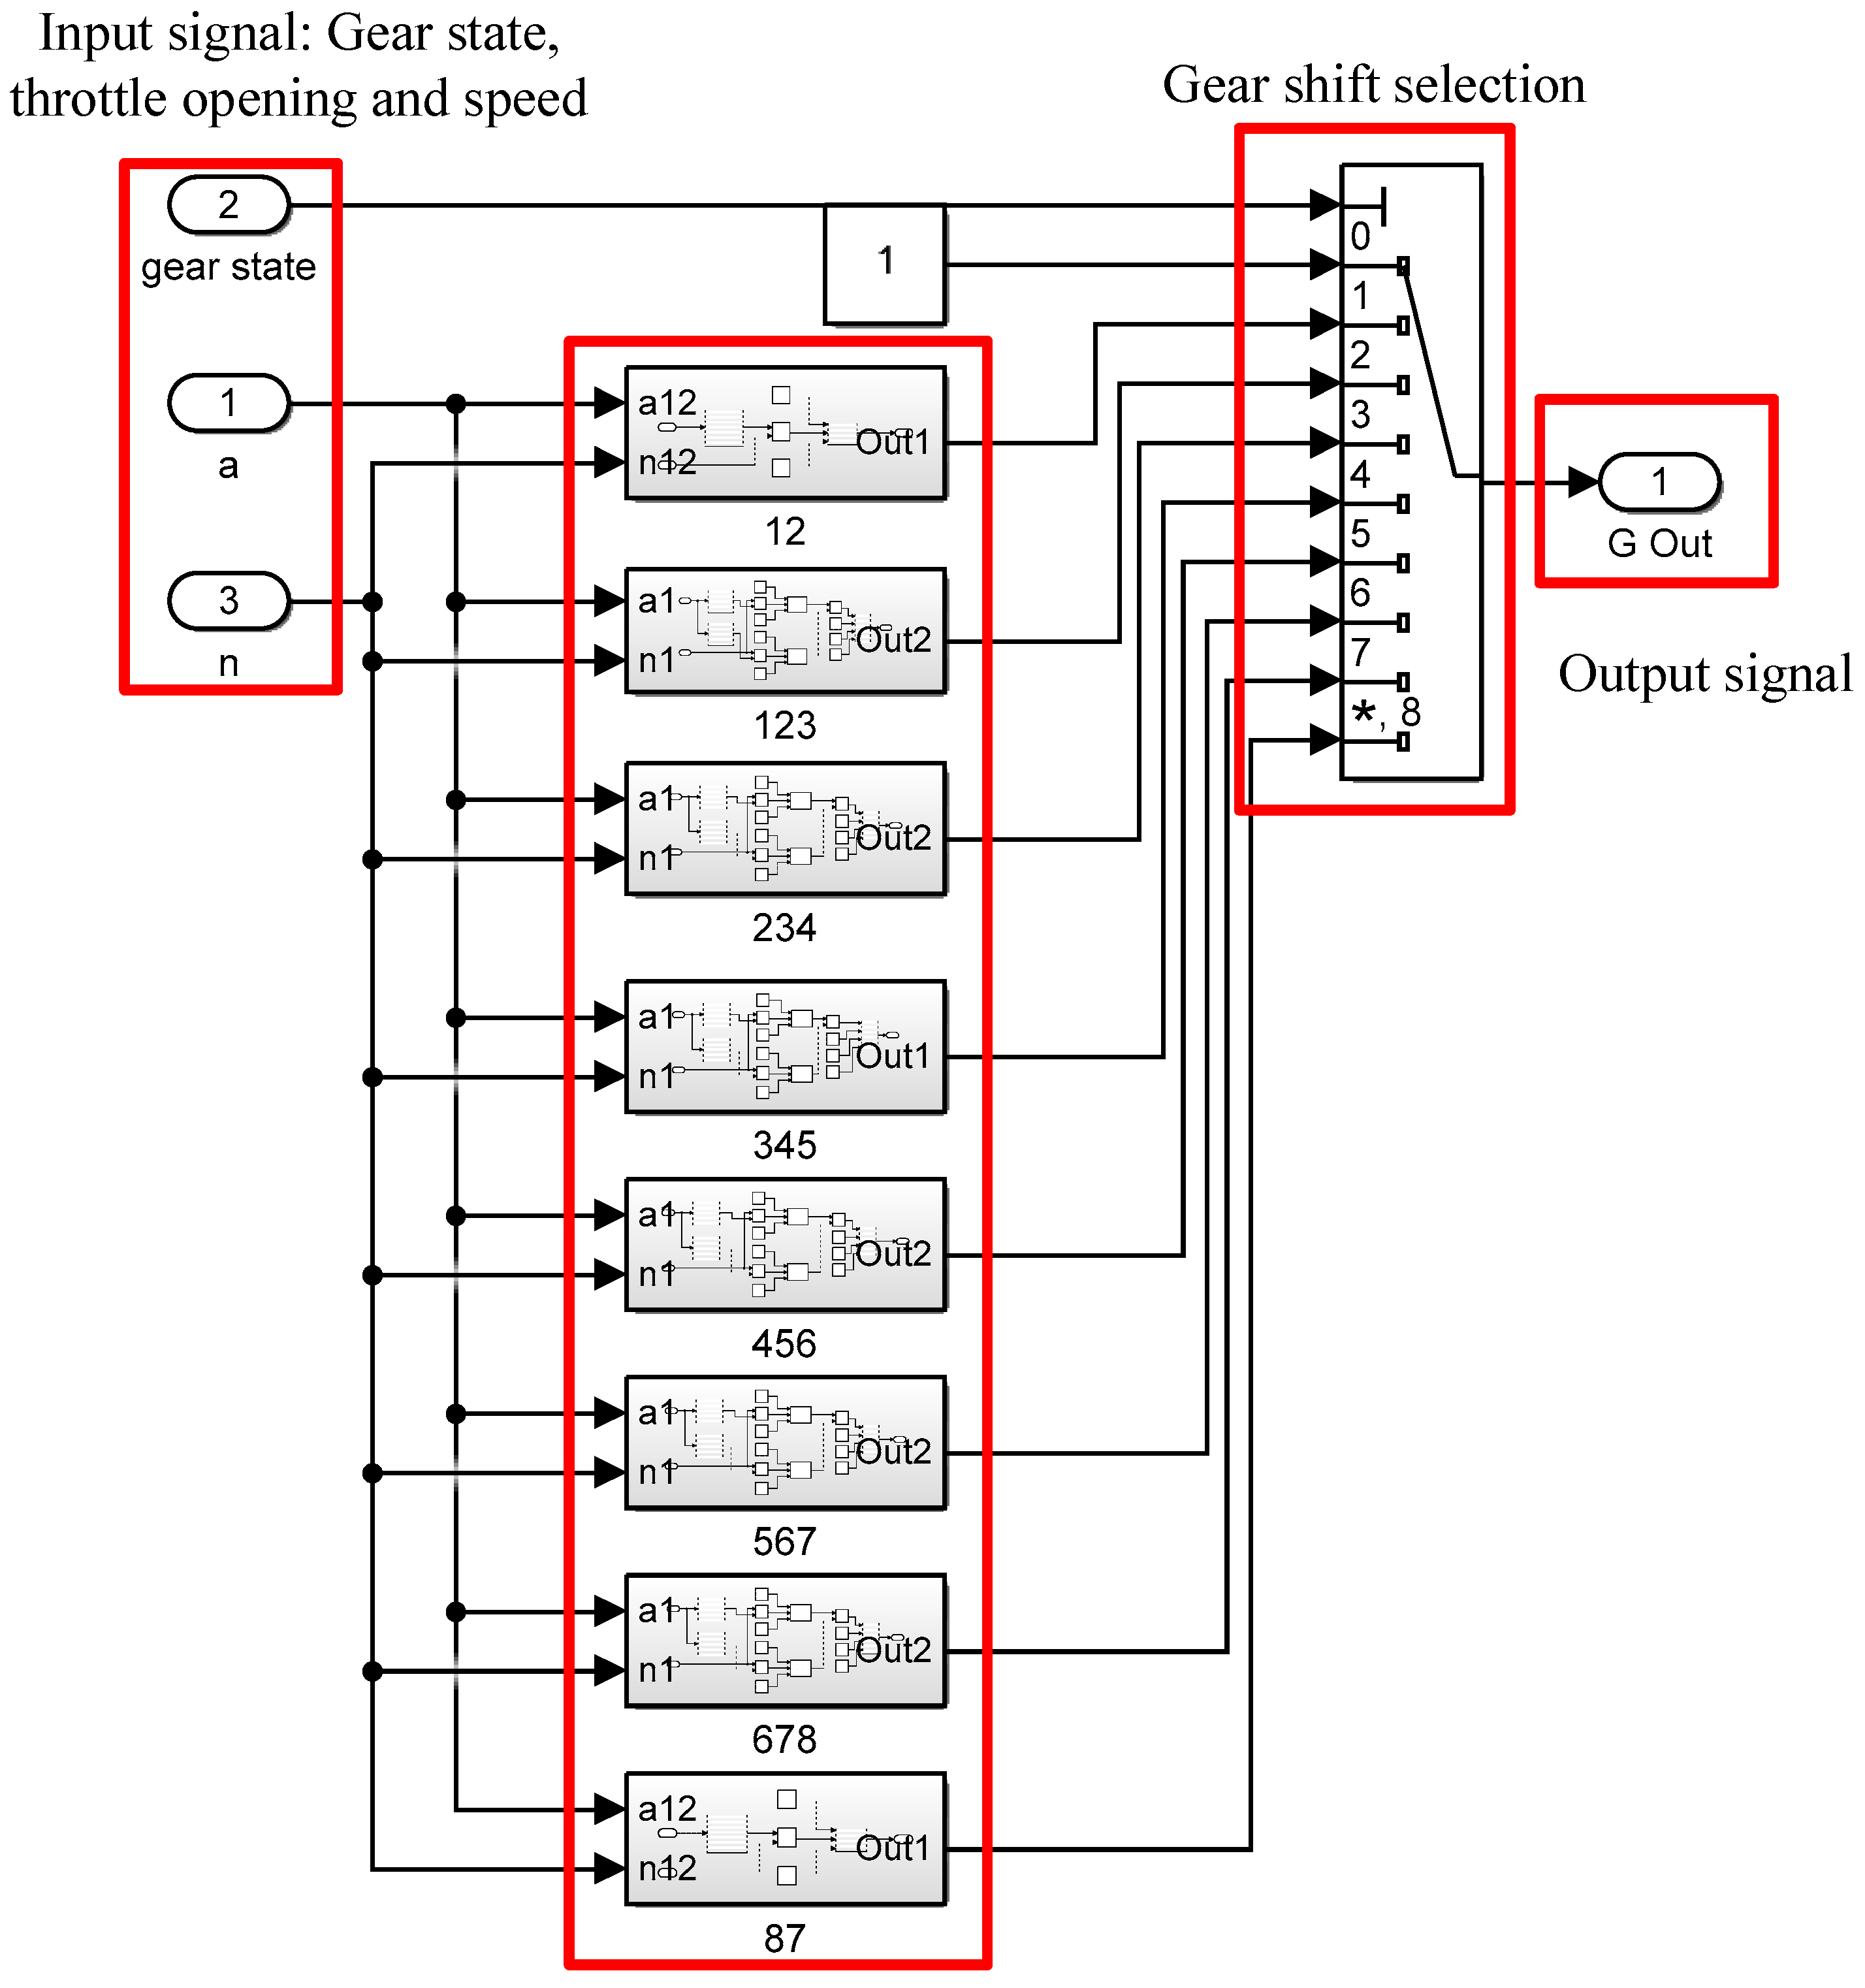
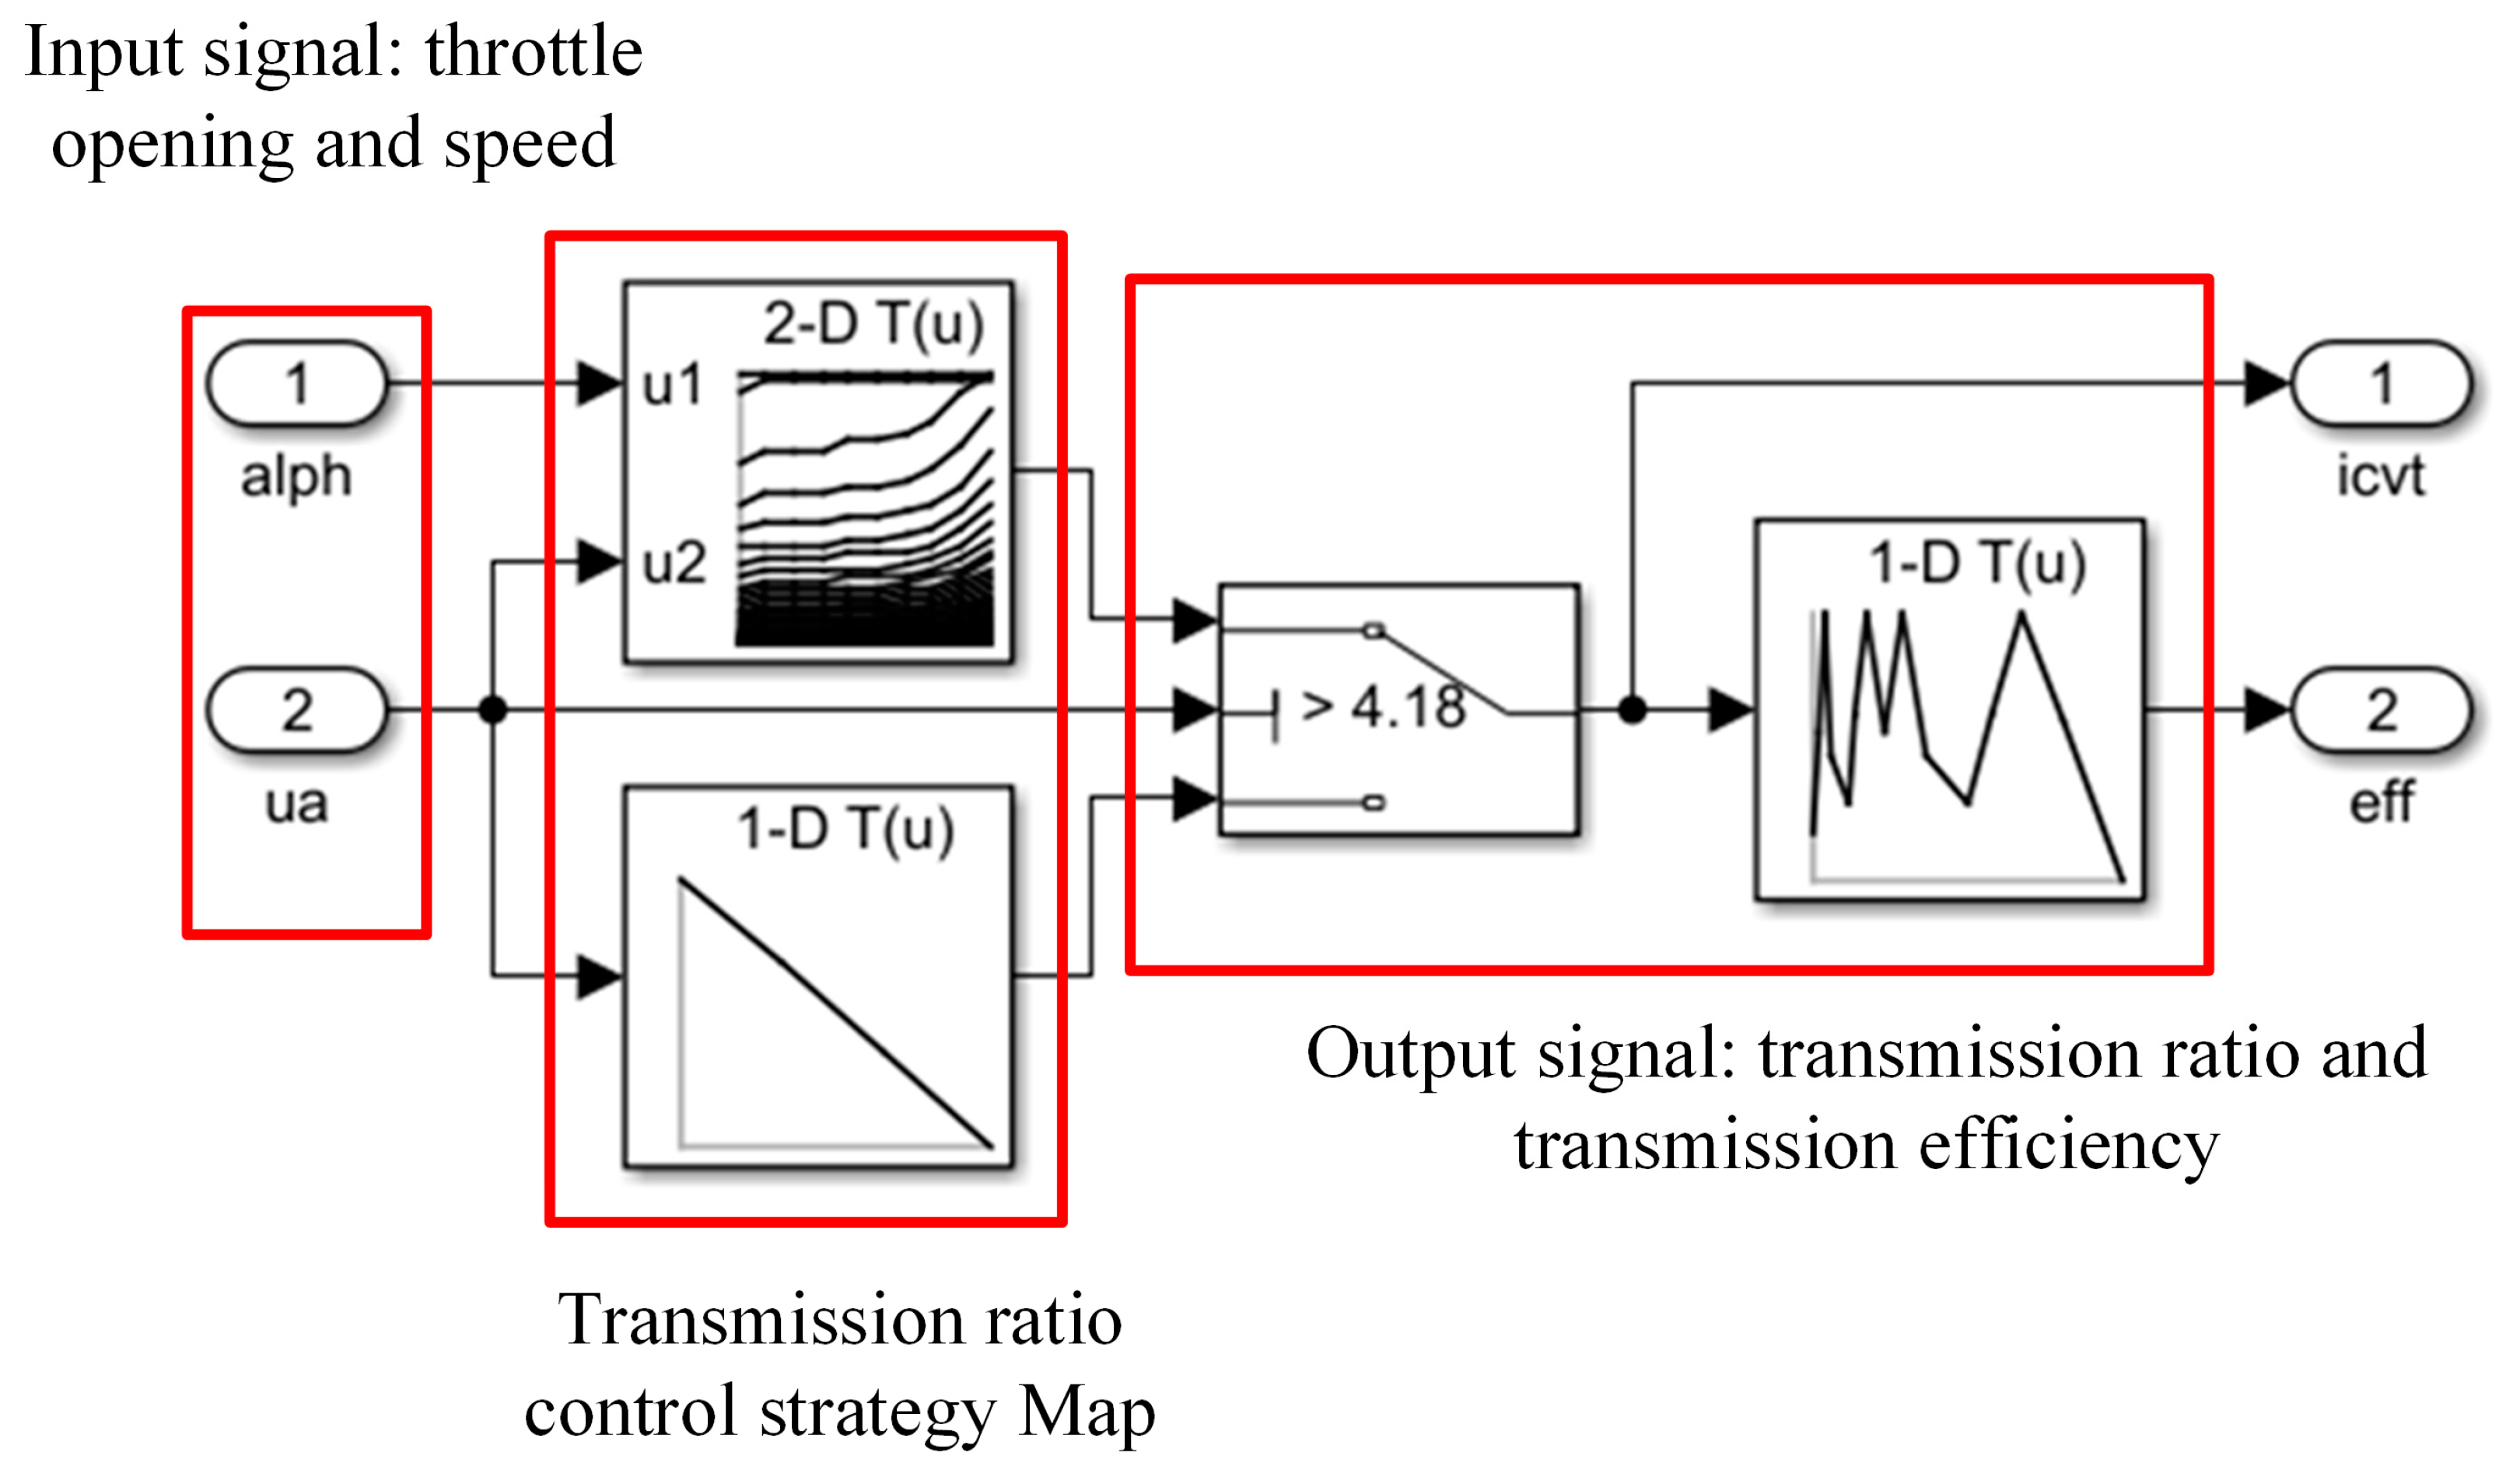
4.2. Transmission Ratio Control Model of HMCVT

Figure 9 shows the HMCVT transmission ratio control model. When the vehicle starts, HMCVT works in the starting working stage H0. According to Equation (1), theoretically the transmission ratio in the stage of H0 can reach infinity. In this model, the range of H0 is 7.55–20. If the vehicle speed is lower than the minimum speed, the vehicle is judged to be in the starting stage, and the transmission ratio is controlled according to the map of the H0 stage. If the speed is greater than the minimum speed, the map of the HM1- HM4 stage is used to control the transmission ratio (see Figure 6). The transmission efficiency corresponding to the transmission ratio is shown in Section 2.

4.3. Vehicle Parameters

CarSim is a commercial software designed to study vehicle dynamics, and its vehicle models are widely recognized [37,38]. This paper takes the pickup truck model provided by CarSim as the research object. Table 4 lists the vehicle parameters.

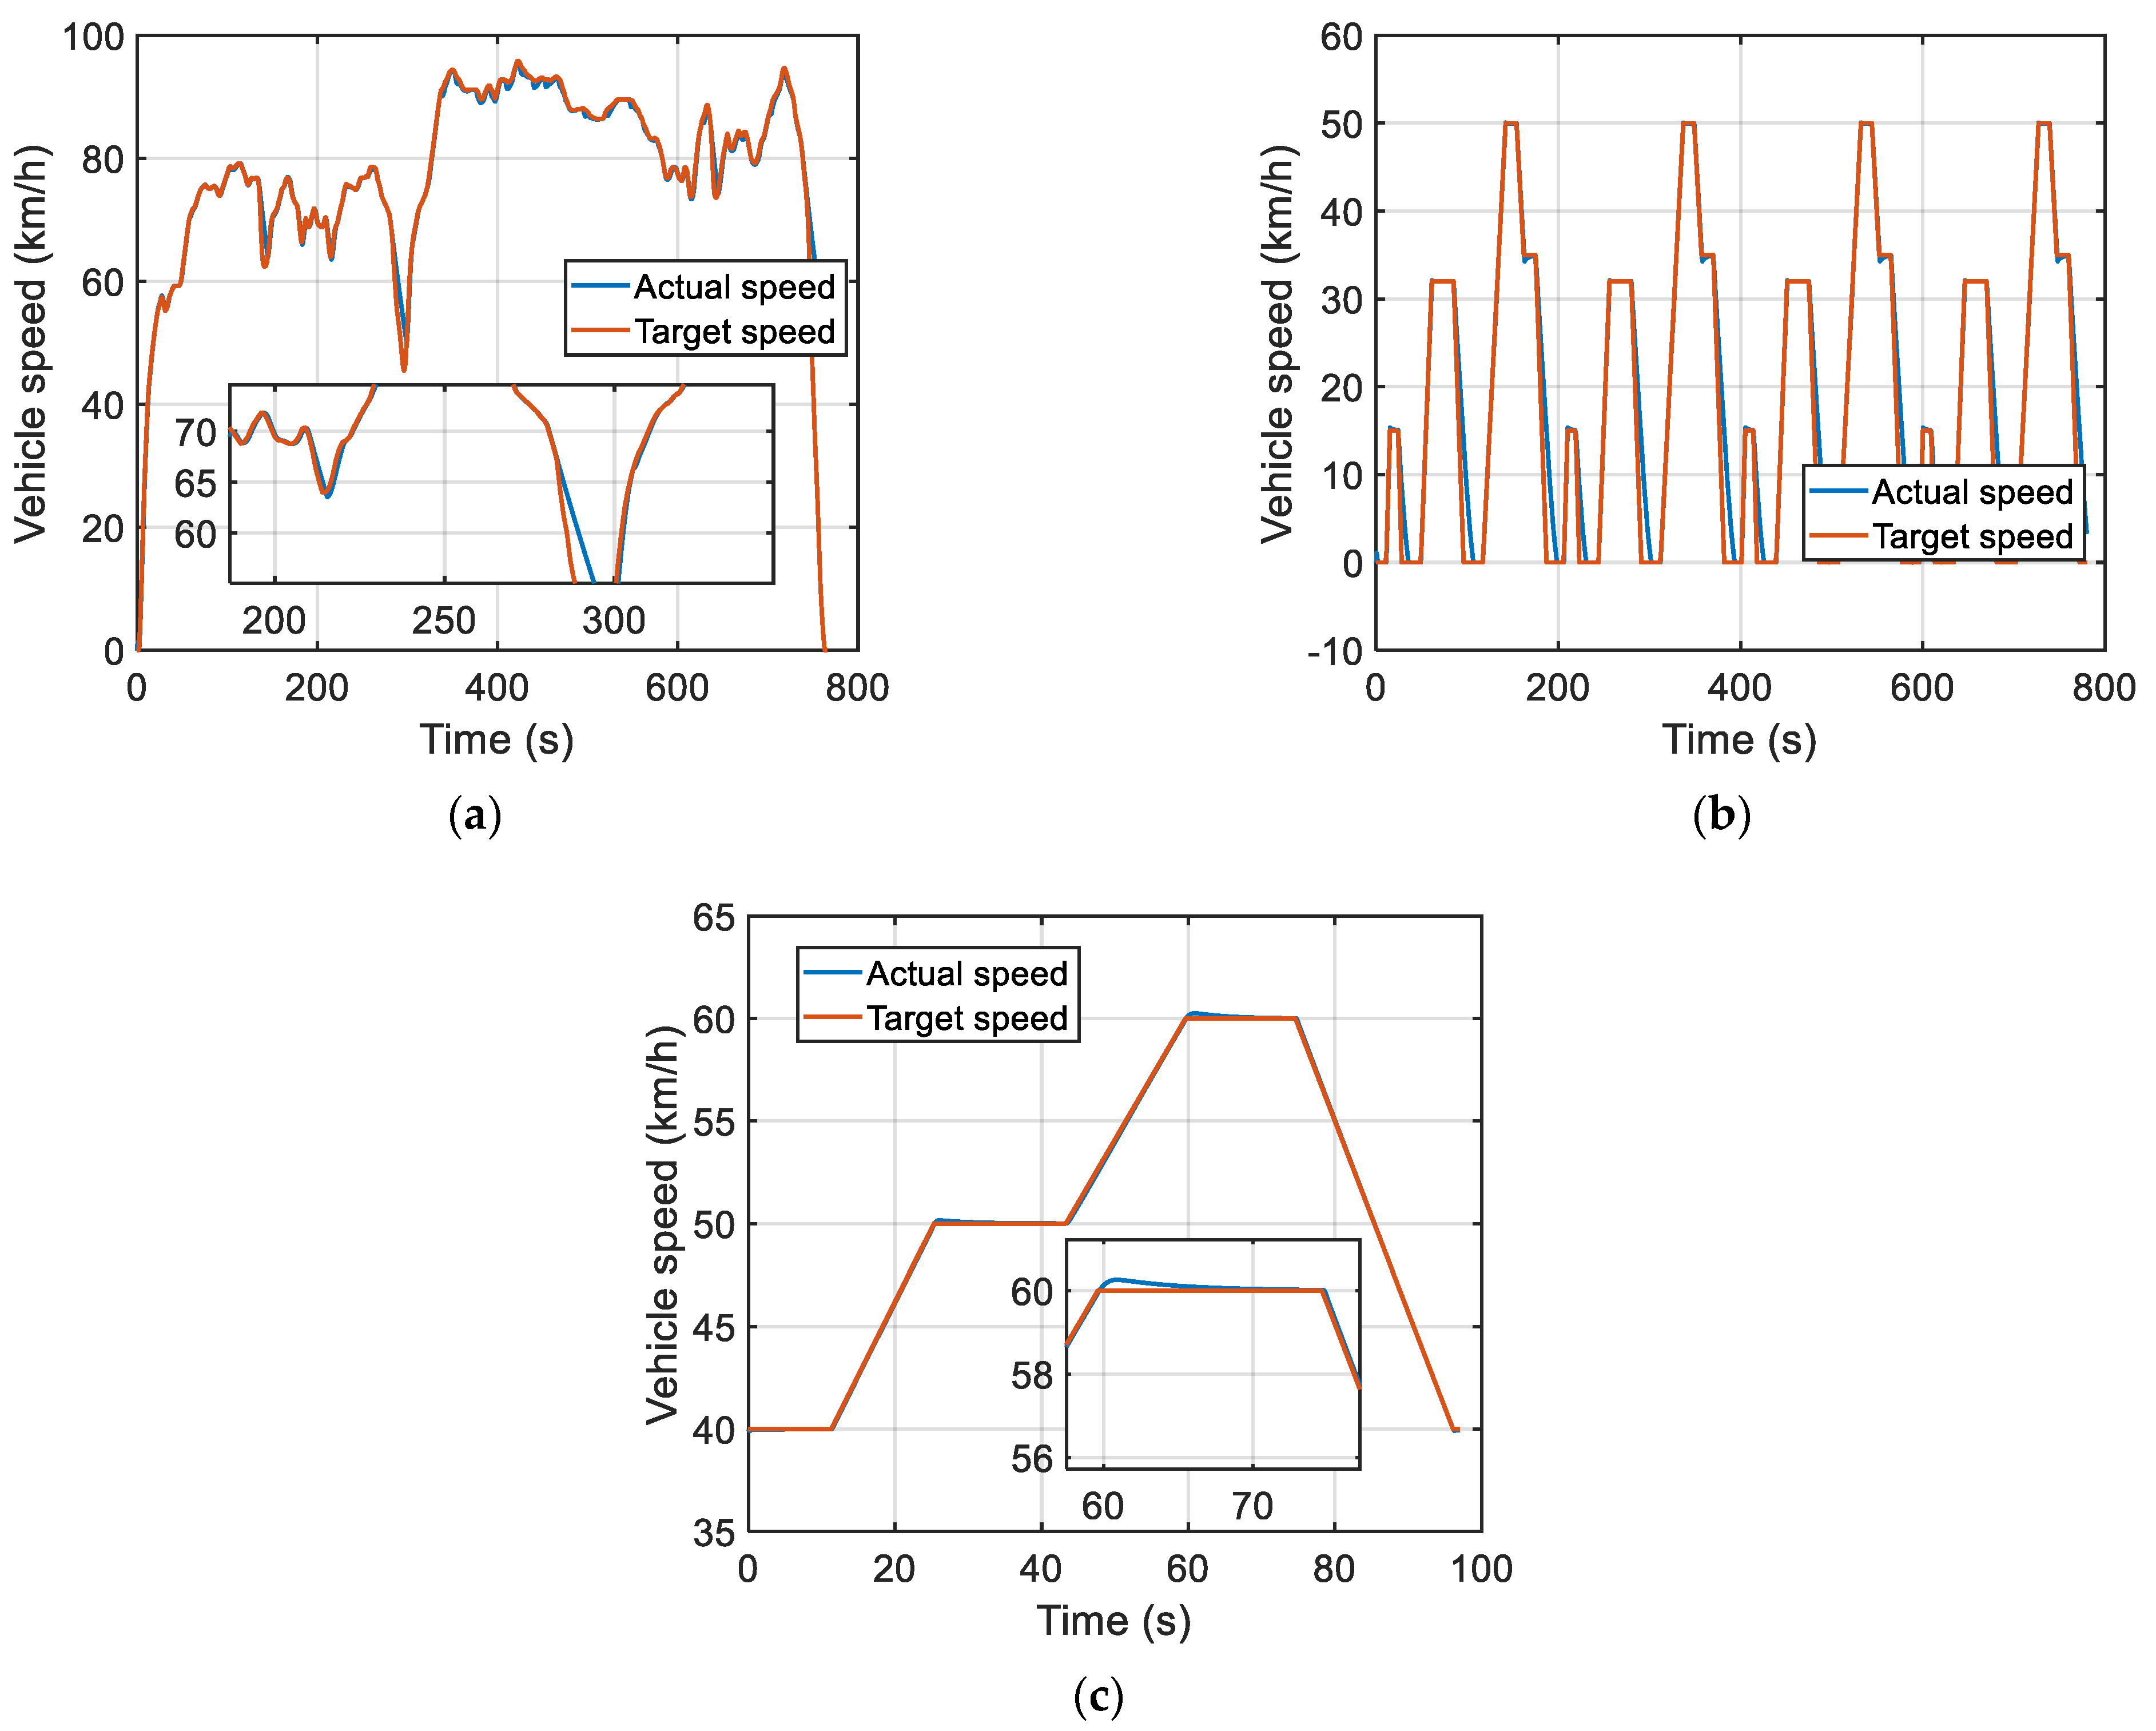
4.4. United Simulation Test

CarSim can generate S-function modules in MATLAB/Simulink for united simulation with Simulink. By combining the above models, the simulation systems as shown in Figure 10 can be obtained. Fuel consumption per unit distance QS is used as an economic evaluation index, and its expression is as follows:
Q S = Q S
where S is distance and Q is fuel consumption.

4.5. Setting of Driving Cycle

In order to make the experimental results more reliable, this paper selected a multiple driving cycle, including the EPA cycle [39], NEDC [40], and 6-mode cycle [41], to obtain more realistic fuel consumption data. The simulation results of the EPA suburban cycle of the pickup truck are shown in Figure 11. It can be seen from the figure that the actual speed follows the target speed well, which proves that the model is reliable.

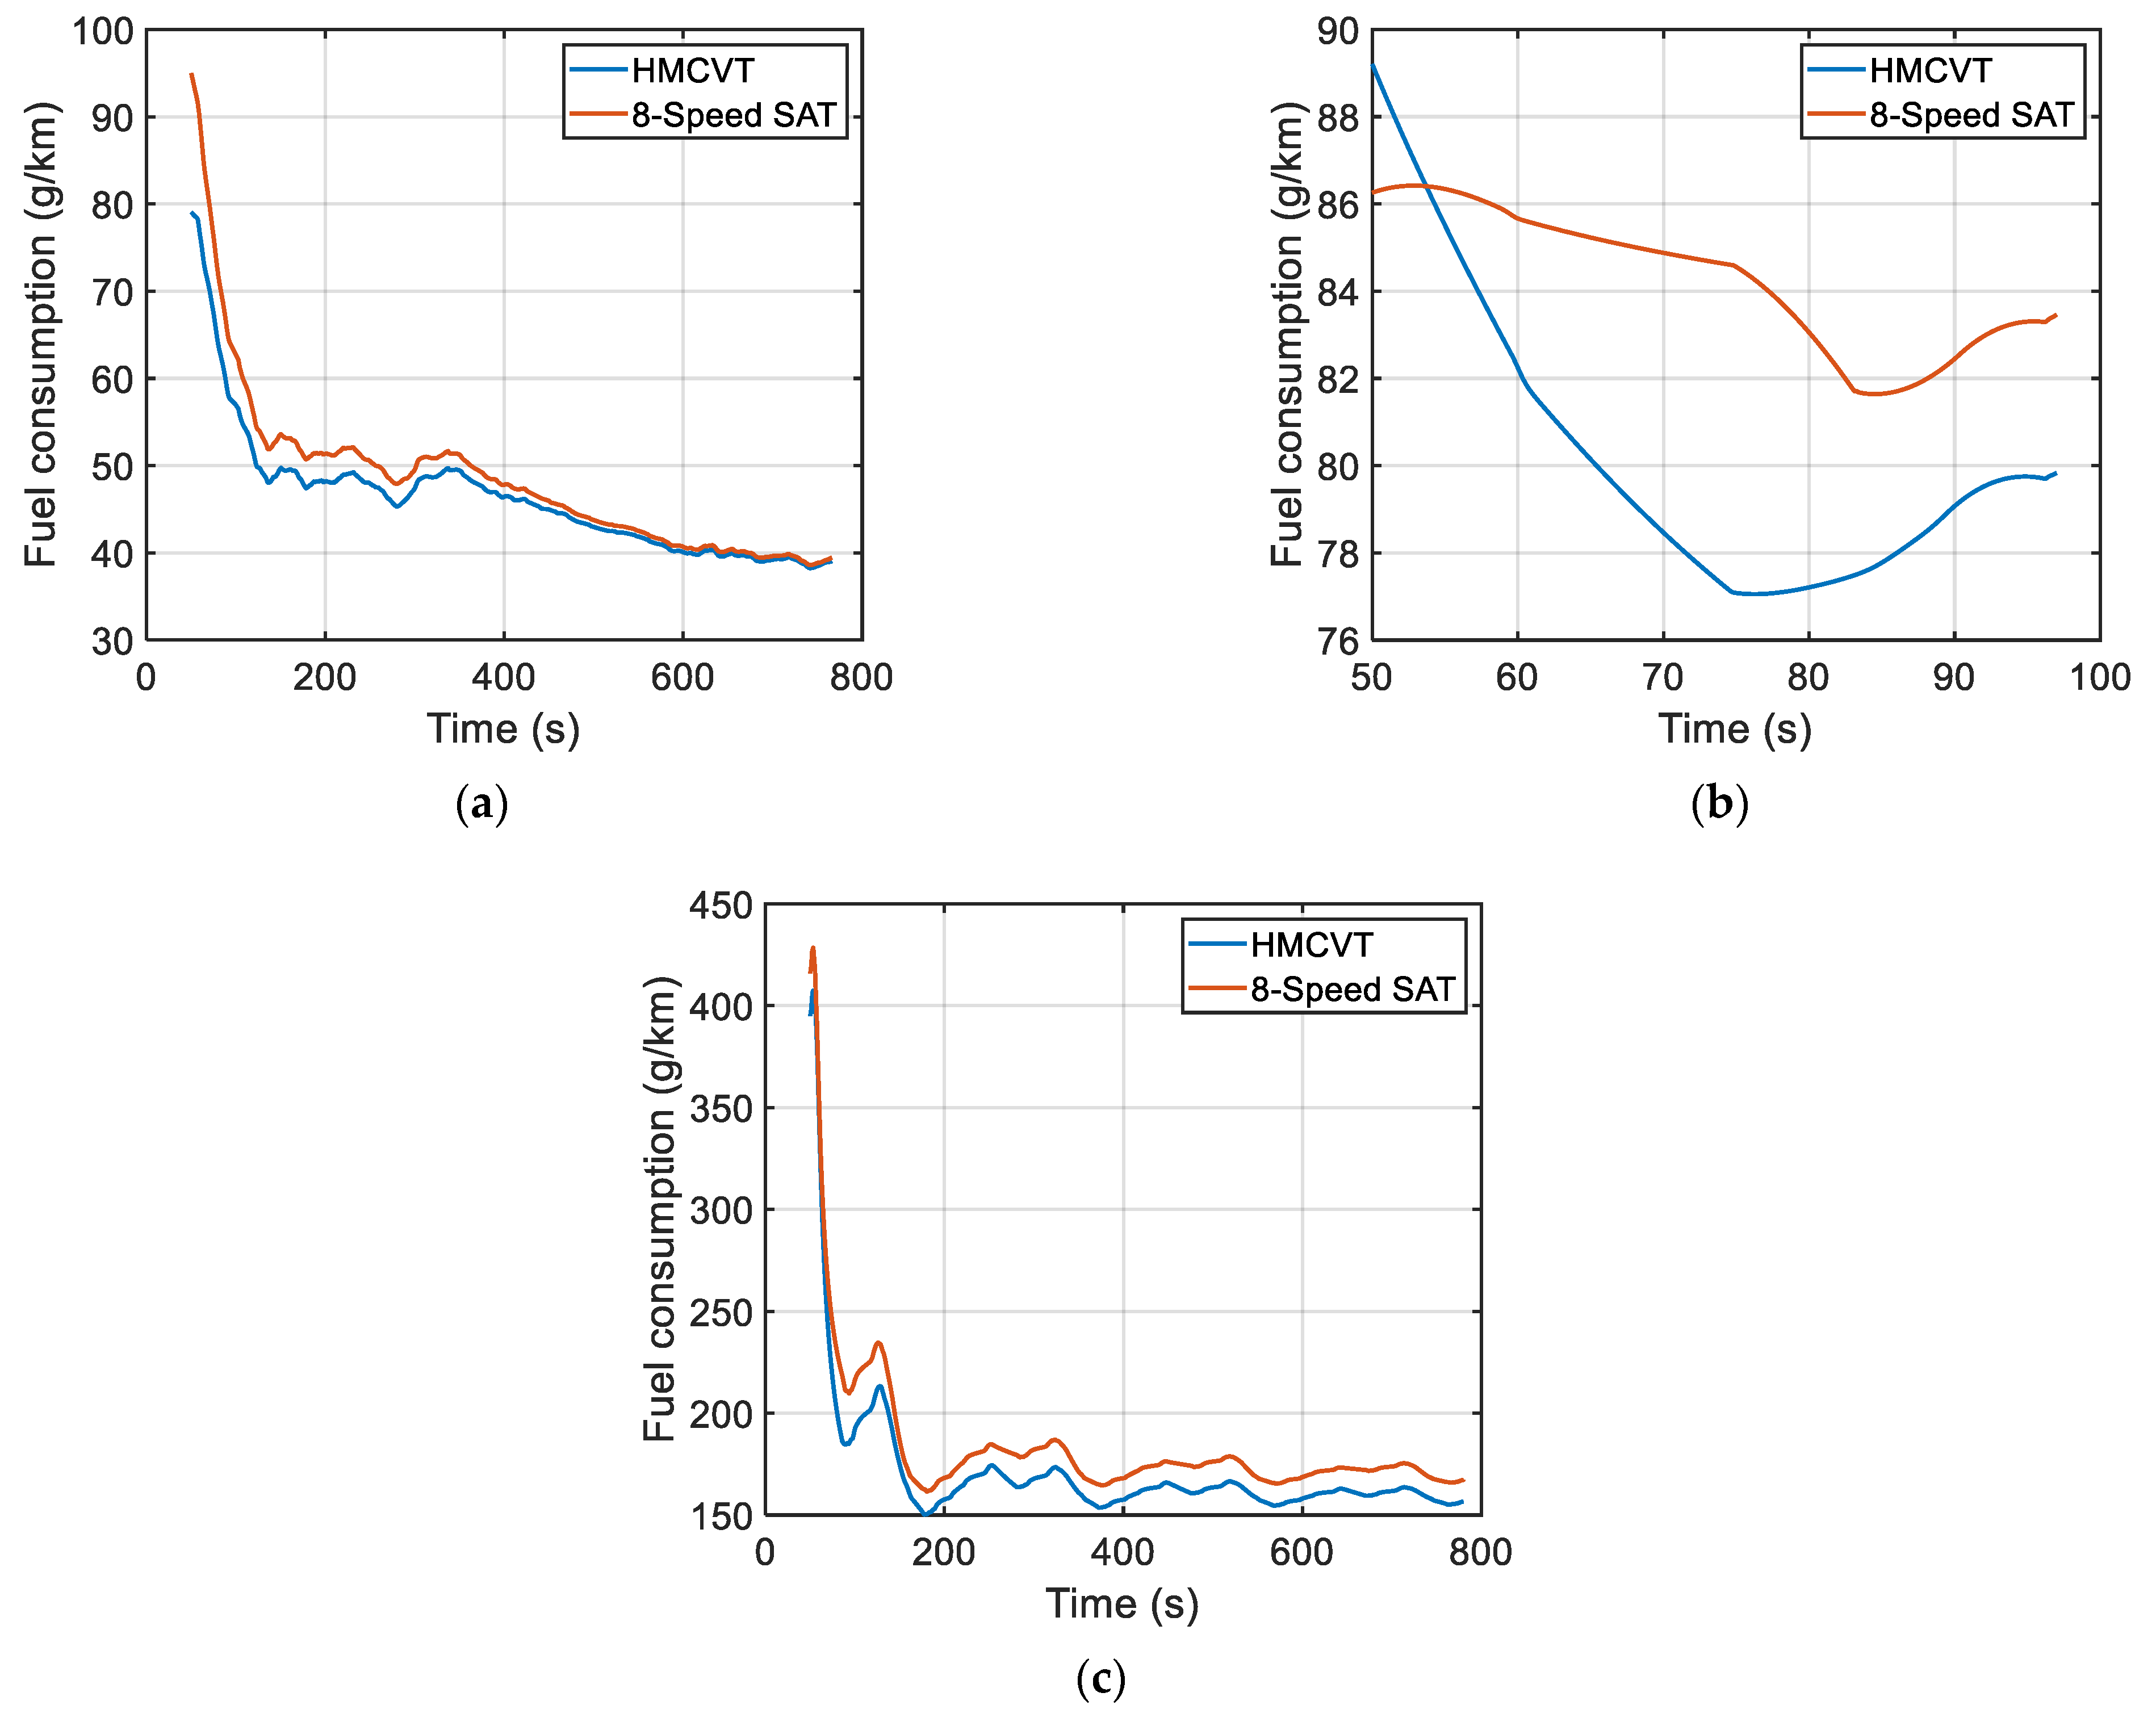
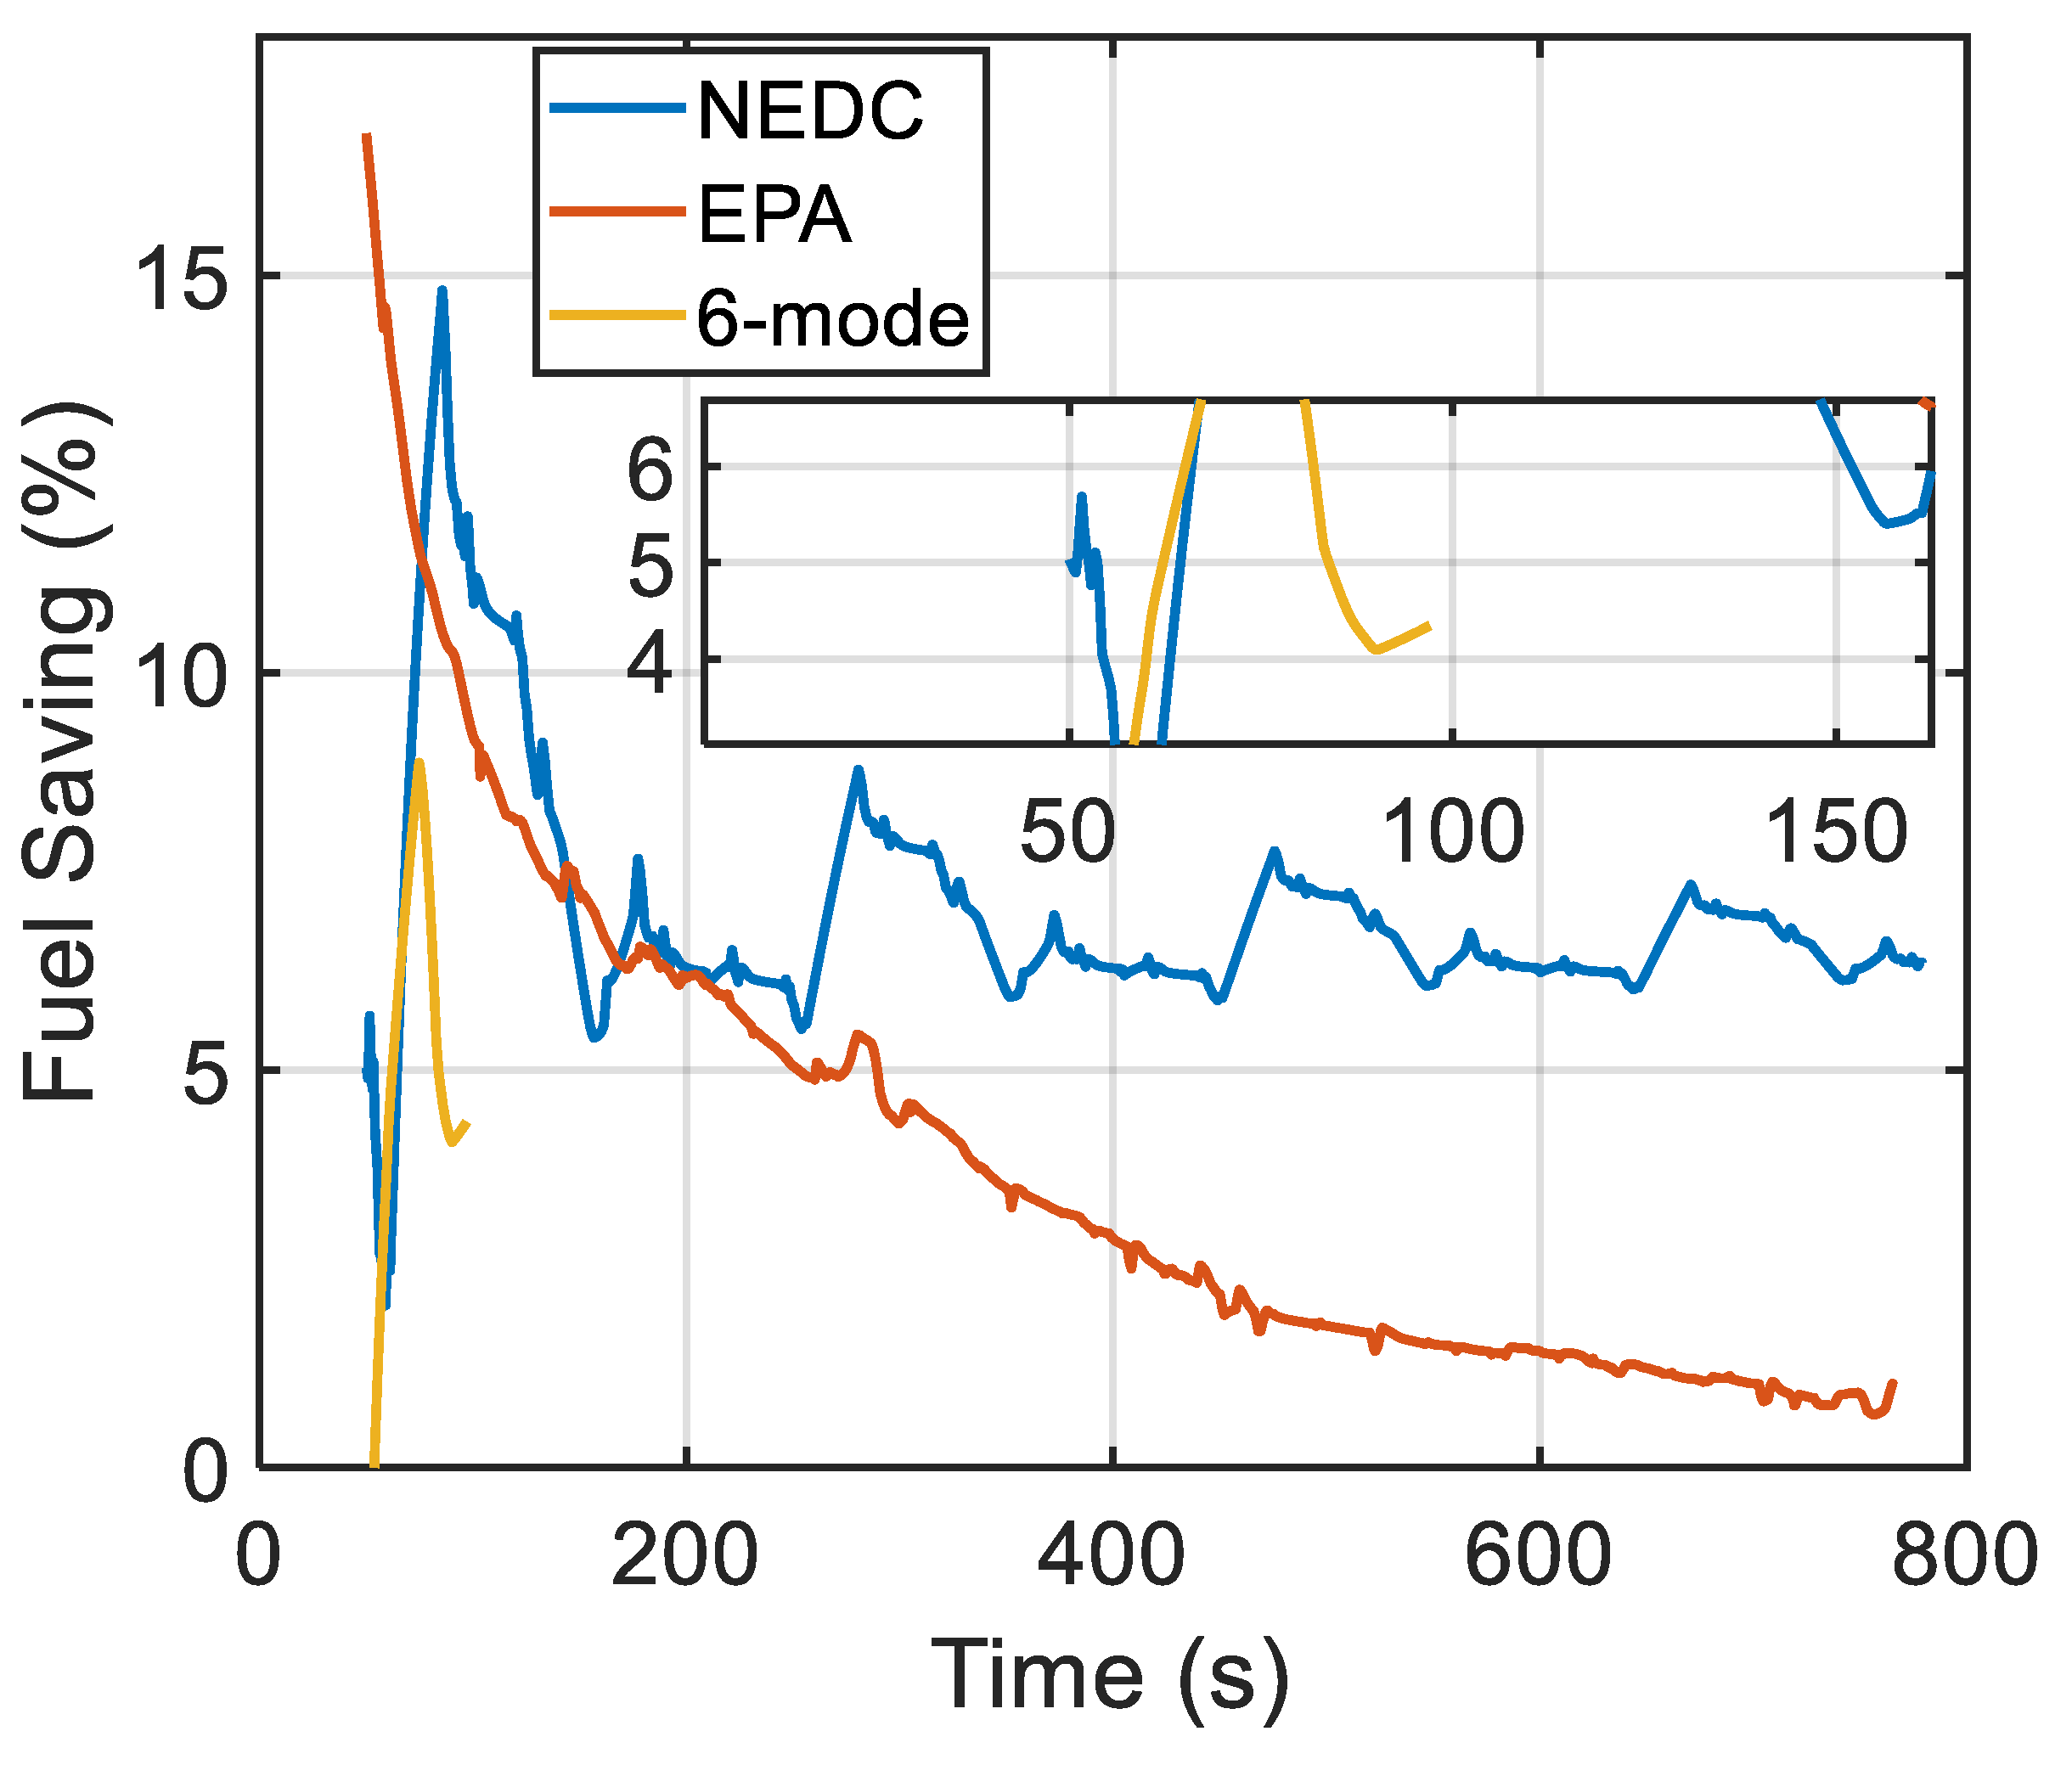
5. Results and Discussion of Fuel Consumption Comparison

In order to verify that HMCVT is superior to SAT in terms of economy, the vehicle model established above is used to carry out simulation with eight-speed SAT and HMCVT, respectively. And the corresponding simulation results are obtained. Figure 12 shows the comparison of simulation results QS between SAT and HMCVT from the 50th second after the test started.
As can be seen from the figure, the variation trend of fuel consumption of the two transmissions under the same cycle is similar, and the QS of HMCVT is lower than that of SAT. Combined with the data in Figure 11, in the EPA cycle, the speed was lower than 80 km/h before the 327th second, and the QS of HMCVT was significantly lower. However, as the speed increased to more than 80 km/h, the QS gap between the two transmissions was narrow. The QS gap of NEDC is larger and more stable. In the six-mode cycle, HMCVT gradually showed advantages in the acceleration process before the 75th second.
The comparison results of fuel saving between HMCVT and the eight-gear SAT during vehicle driving are shown in Figure 13. The fuel-saving value flattens over time. The fuel saving of the EPA cycle continued to decrease from its initial 16.78%, accumulating a larger value only during the acceleration phase. The change period of fuel saving of NEDC is the same as that of the vehicle speed. Fuel saving keeps rising in the stages of 32 km/h and 35 km/h, with a maximum value of 14.81%. In the deceleration stage, it drops because fuel cannot be saved. The fuel saving of the six-mode cycle increases to a maximum of 8.87% by the 75 s and falls back to 4.35% during the subsequent deceleration.
Therefore, it can be concluded that when the vehicle is running at a low or medium speed, or the speed changes frequently, because the transmission ratio can be adjusted steplessly, the engine has more opportunities to work in the optimal economic zone. Therefore, HMCVT has obvious advantages in fuel saving. However, when the vehicle is running at a high speed (such as the part of the EPA cycle between 327–765 s), the advantage of HMCVT is no longer obvious. The main reason is that the transmission ratio is always at a minimum and does not need to be adjusted frequently.
Table 5 shows the Qs when three cycles are completed. It can be seen that HMCVT is superior to SAT in the economic performance. Although the fuel savings are not significant in some of the test results, large fuel savings can be achieved over the full lifecycle of the vehicle, and even greater savings can be achieved across the entire vehicle population. So even small increases make sense.

6. Conclusions

The paper studies the acquisition method of economic control strategy for the transmission ratio of the truck powertrain. This method can obtain the control strategy MAP effectively by solving the fuel consumption equation of two adjacent transmission ratios (CVT) or two adjacent gears (SAT). The economic control strategy of HMCVT needs to consider its own efficiency more.
The paper presents a simulation model-building method for trucks with different types of transmissions. The method combined with CarSim and MATLAB/Simulink can effectively carry out simulation tests of vehicle fuel consumption under different conditions. The mean absolute percentage errors between target speed and actual speed in the EPA cycle, NEDC, and six-mode cycle are 4.38%, 9.81%, and 0.12%, respectively.
Although the average transmission efficiency of HMCVT is lower than that of SAT, it can make better use of the optimal economic working zone of the engine. Under three driving conditions (EPA, NEDC, and six-mode cycle) of the truck, the averages of fuel consumption of the HMCVT are 4.52%, 7.01%, and 4.84% lower than that of the eight-speed SAT. Compared with SAT, HMCVT has excellent fuel-saving capacity at medium and low speeds. The maximum value of fuel saving under three working conditions (EPA, NEDC, and six-mode cycle) is 16.78%, 14.81%, and 8.87%, respectively. The fuel-saving effect of the truck with HMCVT is most significant when driving in conditions similar to NEDC. Trucks are more suitable for carrying HMCVT.

Author Contributions

Methodology, Y.C. and Z.C.; software, Z.C. and Y.C.; validation, Y.C.; investigation, Y.C., Y.Q. and Z.C.; resources, Z.C.; writing—original draft preparation, Y.C.; writing—review and editing, Z.C., Y.Q. and Y.C.; supervision, Z.C.; and project administration, Z.C. All authors have read and agreed to the published version of the manuscript.

Funding

This research was funded by the National Natural Science Foundation of China (grant number: 52105063).

Institutional Review Board Statement

Not applicable.

Informed Consent Statement

Not applicable.

Data Availability Statement

The data presented in this study are available on demand from the corresponding author or first author at (edward_2022@126.com or cz38@njfu.edu.cn).

Acknowledgments

The authors thank the National Natural Science Foundation of China (grant number: 52105063) for funding. We also thank the anonymous reviewers for providing critical comments and suggestions that improved the manuscript.

Conflicts of Interest

The authors declare no conflict of interest.

References

  1. Zhou, M. Research on the Fuel Economy of Automatic Transmission Vehicles for Running on the Hilly Roads. Master’s Thesis, Beijing Institute of Technology, Beijing, China, 2016. [Google Scholar]
  2. Zhou, W.L.; Zheng, Y.P.; Pan, Z.J.; Lu, Q. Review on the Battery Model and SOC Estimation Method. Processes 2021, 9, 1685. [Google Scholar] [CrossRef]
  3. Wang, H.; Zheng, Y.P.; Yu, Y. Lithium-Ion Battery SOC Estimation Based on Adaptive Forgetting Factor Least Squares Online Identification and Unscented Kalman Filter. Mathematics 2021, 9, 1733. [Google Scholar] [CrossRef]
  4. Tian, J.; Wang, Q.; Ding, J.; Wang, Y.Q.; Ma, Z.S. Integrated control with DYC and DSS for 4WID electric vehicles. IEEE Access 2019, 7, 124077–124086. [Google Scholar] [CrossRef]
  5. Wang, H.; Zheng, Y.P.; Yu, Y. Joint estimation of soc of lithium battery based on dual Kalman filter. Processes 2021, 9, 1412. [Google Scholar] [CrossRef]
  6. Chang, C.C.; Zheng, Y.P.; Yu, Y. Estimation for battery state of charge based on temperature effect and fractional extended Kalman filter. Energies 2020, 13, 5947. [Google Scholar] [CrossRef]
  7. Li, D.X.; Li, Y.J.; Ma, Z.S.; Zheng, M.; Lu, Z.H. Exergetic performance coefficient analysis and optimization of a high-temperature proton exchange membrane fuel cell. Membranes 2022, 12, 70. [Google Scholar] [CrossRef]
  8. Li, Y.J.; Li, D.X.; Ma, Z.S.; Zheng, M.; Lu, Z.H. Thermodynamic modeling and performance analysis of vehicular high-temperature proton exchange membrane fuel cell system. Membranes 2022, 12, 72. [Google Scholar] [CrossRef]
  9. Wang, X. Research of Automobile Fuel Economy Based on Transmission Efficiency. Master’s Thesis, Chongqing University, Chongqing, China, 2010. [Google Scholar]
  10. Wang, J.X.; Wang, Q.N.; Zhou, Y.S.; Wang, X.Y. Research on CVT speed ratio control method based on external characteristics of engine. Automot. Technol. 2009, 10, 1–4. [Google Scholar]
  11. Yin, X.F.; Chen, Q.S. Progress in gearshift schedule for automotive stepped automatic transmissions. J. Xihua Univ. 2020, 39, 66–72. [Google Scholar]
  12. Gao, W.; Zou, Y.; Sun, F.C. Two-parameter optimal shifting control for the AMT of a battery electric bus. Automot. Eng. 2016, 38, 344–349+361. [Google Scholar]
  13. Foffina, A.; Hass, O.; Ersanilli, V.; Burnham, K.; Mahtani, J.; Woolley, C.; Vithanage, K. Multi-objective genetic algorithm for an automatic transmission gear shift map. IFAC-PapersOnLine 2016, 49, 123–128. [Google Scholar] [CrossRef]
  14. Bracard, S.; Laguitton, O.; Rouge, M. Diesel engine and automated transmission-powertrain global optimisation under multiple constraints. In Proceedings of the 31st FISITA World Automotive Congress, Yokohama, Japan, 22–27 October 2006; p. 318. [Google Scholar]
  15. Ngo, V.D.; Hofman, T.; Steinbuch, M.; Serrarens, A. Gear shift map design methodology for automotive transmissions. Proc. Inst. Mech. Eng. Part D J. Automob. Eng. 2014, 228, 50–72. [Google Scholar] [CrossRef]
  16. Qin, T.; Yang, G.L.; Hu, M.H.; Liu, Y.G.; Lin, Y.P. Energy management strategy of plug-in hybrid electric system based on driving intention. J. Jilin Univ. 2015, 45, 1743–1750. [Google Scholar]
  17. Fandzyana, C.A.; Hofman, T. Integrated design for a CVT: Dynamical optimization of actuation and control. IFAC PapersOnLine 2019, 52, 393–398. [Google Scholar] [CrossRef]
  18. Lee, H.; Sung, J.; Lee, H.; Zheng, C.; Lim, W.; Cha, S.W. Model-based integrated control of engine and CVT to minimize fuel use. Int. J. Automot. Technol. 2018, 19, 687–694. [Google Scholar] [CrossRef]
  19. Onumata, Y.; Zhao, H.Y.; Wang, C.; Morina, A.; Neville, A. Interactive effect between organic friction modifiers and additives on friction at metal pushing V-belt CVT components. Tribol. Trans. 2018, 61, 474–481. [Google Scholar] [CrossRef]
  20. Ji, J.; Park, J.; Kwon, O.; Chai, M.; Lee, D.; Kim, H. Macroslip detection and clamping force control for a metal V-belt continuously variable transmission. Proc. Inst. Mech. Eng. Part D J. Automob. Eng. 2014, 228, 943–954. [Google Scholar] [CrossRef]
  21. Gauthier, J.P.; Micheau, P. Adaptive control of a continuously variable transmission subject to wear. Control. Eng. Pract. 2012, 20, 569–574. [Google Scholar] [CrossRef]
  22. Macor, A.; Rossetti, A. Fuel consumption reduction in urban buses by using power split transmissions. Energy Convers. Manag. 2013, 71, 159–171. [Google Scholar] [CrossRef]
  23. Ahn, S.; Choi, J.; Kim, S.; Lee, J.; Choi, C.; Kim, H. Development of an integrated engine-hydro-mechanical transmission control algorithm for a tractor. Adv. Mech. Eng. 2016, 7, 1–18. [Google Scholar] [CrossRef]
  24. Luo, Y.; Sun, D.Y.; Qin, D.T.; Chen, R.; Hu, F.B. Fuel optimal control of CVT equipped vehicles with consideration of CVT efficiency. J. Mech. Eng. 2010, 46, 80–86. [Google Scholar] [CrossRef]
  25. Hao, Y.Z.; Sun, D.Y.; Lin, Y.P.; Liu, S. Overall optimization control strategy of continuously variable transmission system. J. Mech. Eng. 2013, 49, 84–91. [Google Scholar] [CrossRef]
  26. Zhang, M.Z.; Wang, Q.S.; Bai, D.Y.; Yin, Y.X.; Hao, X.Y. Speed changing law of hydro-mechanical CVT based on maximum efficiency of tractors. Trans. Chin. Soc. Agric. Eng. 2016, 32, 74–78. [Google Scholar]
  27. Hu, H.F.; Shi, L.X.; Zhang, S.Q. Simulation and experiment of hydro-mechanical CVT control strategy for tractors. Control. Eng. China 2017, 24, 2290–2295. [Google Scholar]
  28. Wang, Q.S.; Zhang, M.Z.; Bai, D.Y.; Yin, Y.X.; Hao, X.Y. Fuzzy adaptive PID control for multi-range hydro-mechanical continuously variable transmission in tractor. J. Mech. Transm. 2016, 40, 23–26+37. [Google Scholar]
  29. Lu, Z.; Lu, Z.X.; Cheng, Z. Research on tracking speed control of HMCVT stepless segment. Mech. Sci. Technol. Aerosp. Eng. 2021, 40, 518–526. [Google Scholar]
  30. Zheng, X.Z.; Ren, H.L.; Sun, W. Research on speed ratio control strategy of hydro-mechanical continuously variable transmission. Agric. Equip. Veh. Eng. 2017, 55, 24–27. [Google Scholar]
  31. Zhao, J.; Yin, X.F.; Li, X.Y. A research on the starting characteristics and its control strategy for a heavy truck with HMCVT. Automot. Eng. 2014, 36, 715–719. [Google Scholar]
  32. Cheng, Z.; Chen, Y.T.; Li, W.J.; Liu, J.H.; Li, L.; Zhou, P.F.; Chang, W.J.; Lu, Z.X. Full factorial simulation test analysis and I-GA based piecewise model comparison for efficiency characteristics of hydro mechanical CVT. Machines 2022, 10, 358. [Google Scholar] [CrossRef]
  33. Zhou, G.Q.; Zhang, H.T.; Ge, Y.Y.; Qiu, W.; Xiao, M.H.; Xu, X.M.; Zhou, M.H. Mechanical efficiency of HMCVT under steady-state conditions. Shock. Vib. 2021, 2021, 4275922. [Google Scholar]
  34. Fu, R. Shift Schedule Research on Power Gearshift Transmission of Tractor. Master’s Thesis, Henan University of Science and Technology, Luoyang, China, 2015. [Google Scholar]
  35. Li, D.X.; Xu, B.; Tian, J.; Ma, Z.S. Energy Management strategy for fuel cell and battery hybrid vehicle based on fuzzy logic. Processes 2020, 8, 882. [Google Scholar] [CrossRef]
  36. Jin, G.Y.; Li, M.Y.; Zhu, B.Y. Model-based optimal gearshift strategy design for pure electric bus AMT. J. Mech. Transm. 2021, 45, 105–111. [Google Scholar]
  37. Chen, J.B.; Xiang, Q.Q. Establishing Simulink/Carsim co-simulation platform for distributed drive electric vehicle. Mech. Sci. Technol. Aerosp. Eng. 2018, 37, 1496–1500. [Google Scholar]
  38. So, J.J.; Park, B.B.; Yun, I. Classification modeling approach for vehicle dynamics mode-integrated traffic simulation assessing surrogate safety. J. Adv. Transp. 2015, 49, 416–433. [Google Scholar] [CrossRef]
  39. Zhuo, H.T. Analysis of American automobile emission regulations. Auto Maint. Repair 2021, 12–20. [Google Scholar] [CrossRef]
  40. Li, R.Y. Energy recovery of electric vehicle base on NEDC cycle. Automob. Appl. Technol. 2021, 46, 1–4. [Google Scholar]
  41. Ren, C.Z.; Wang, C.B.; Chang, X.Z.; Xie, Y.; Gao, L.C. Application study on CAN data bussing system in energy saving and emission reduction of automobile. Henan Sci. 2017, 35, 1801–1805. [Google Scholar]
Figure 1. Transmission scheme and transmission ratio characteristics of a novel five-stage HMCVT.
Machines 10 00699 g001
Figure 2. Engine fuel consumption model. (a) ge = f (α, n); (b) ge = f (n, T).
Machines 10 00699 g002
Figure 3. Flow chart of the method for obtaining SAT gear-shift strategy.
Machines 10 00699 g003
Figure 4. “Speed—Brake-specific fuel consumption” curve.
Machines 10 00699 g004
Figure 5. Shifting rule curves of SAT.
Machines 10 00699 g005
Figure 6. Optimal economic transmission ratio control strategy map of HMCVT.
Machines 10 00699 g006
Figure 7. A transmission ratio control strategy subsystem of SAT.
Machines 10 00699 g007
Figure 8. Transmission ratio control strategy model of SAT. Transmission ratio control strategy model of SAT. Transmission ratio control strategy subsystems refer to Figure 7.
Machines 10 00699 g008
Figure 9. Transmission ratio control strategy model of HMCVT.
Machines 10 00699 g009
Figure 10. Simulation model of pickup. (a) pickup with SAT; (b) pickup with HMCVT.
Machines 10 00699 g010
Figure 11. Simulation results of EPA suburban cycle for pickup. (a) EPA cycle; (b) NEDC; (c) 6-mode cycle.
Machines 10 00699 g011
Figure 12. Simulation test results comparison of fuel consumption between HMCVT and 8-speed SAT. (a) EPA cycle; (b) 6-mode cycle; (c) NEDC.
Machines 10 00699 g012
Figure 13. Comparison results of fuel saving during vehicle driving.
Machines 10 00699 g013
Table 1. Design values of transmission system parameters [32].
Parameteripimi1iRi3i4i5i6k1k2
Value1.181.271.271.161.222.761.002.003.79
Table 2. The coefficients of the efficiency characteristic model.
a1a2b1b2
HM10.92360.058080.9215−0.04164
HM20.92110.048140.9264−0.08895
HM30.92380.058460.9217−0.04208
HM40.92150.048620.9267−0.08928
Table 3. The gear ratio of the eight-speed SAT.
SATig1ig2ig3ig4ig5ig6ig7ig8
8-speed7.555.403.862.761.971.411.010.72
Table 4. Vehicle Parameters.
Parameter or IndicatorValue
Sprung Mass/kg1306
Frontal Area/m23
Wheel Base/m2.78
Final Drive Ratio3.264
Total Driveline Efficiency excluding Transmission0.9
Wheel Radius/m0.34
Maximum Speed/(km/h)120
Table 5. Economy comparison between HMCVT and SAT.
Averages of Fuel Consumption per Unit Journey of a Pickup Truck
EPANEDC6-Mode
HMCVT (g/km)46.29170.5280.17
8-Speed SAT (g/km)48.48183.3884.25
Averages of Fuel Saving4.52%7.01%4.84%
Publisher’s Note: MDPI stays neutral with regard to jurisdictional claims in published maps and institutional affiliations.

