
Assessment of Surface Roughness in Milling of Beech Using a Response Surface Methodology and an Adaptive Network-Based Fuzzy Inference System

Abstract
:1. Introduction
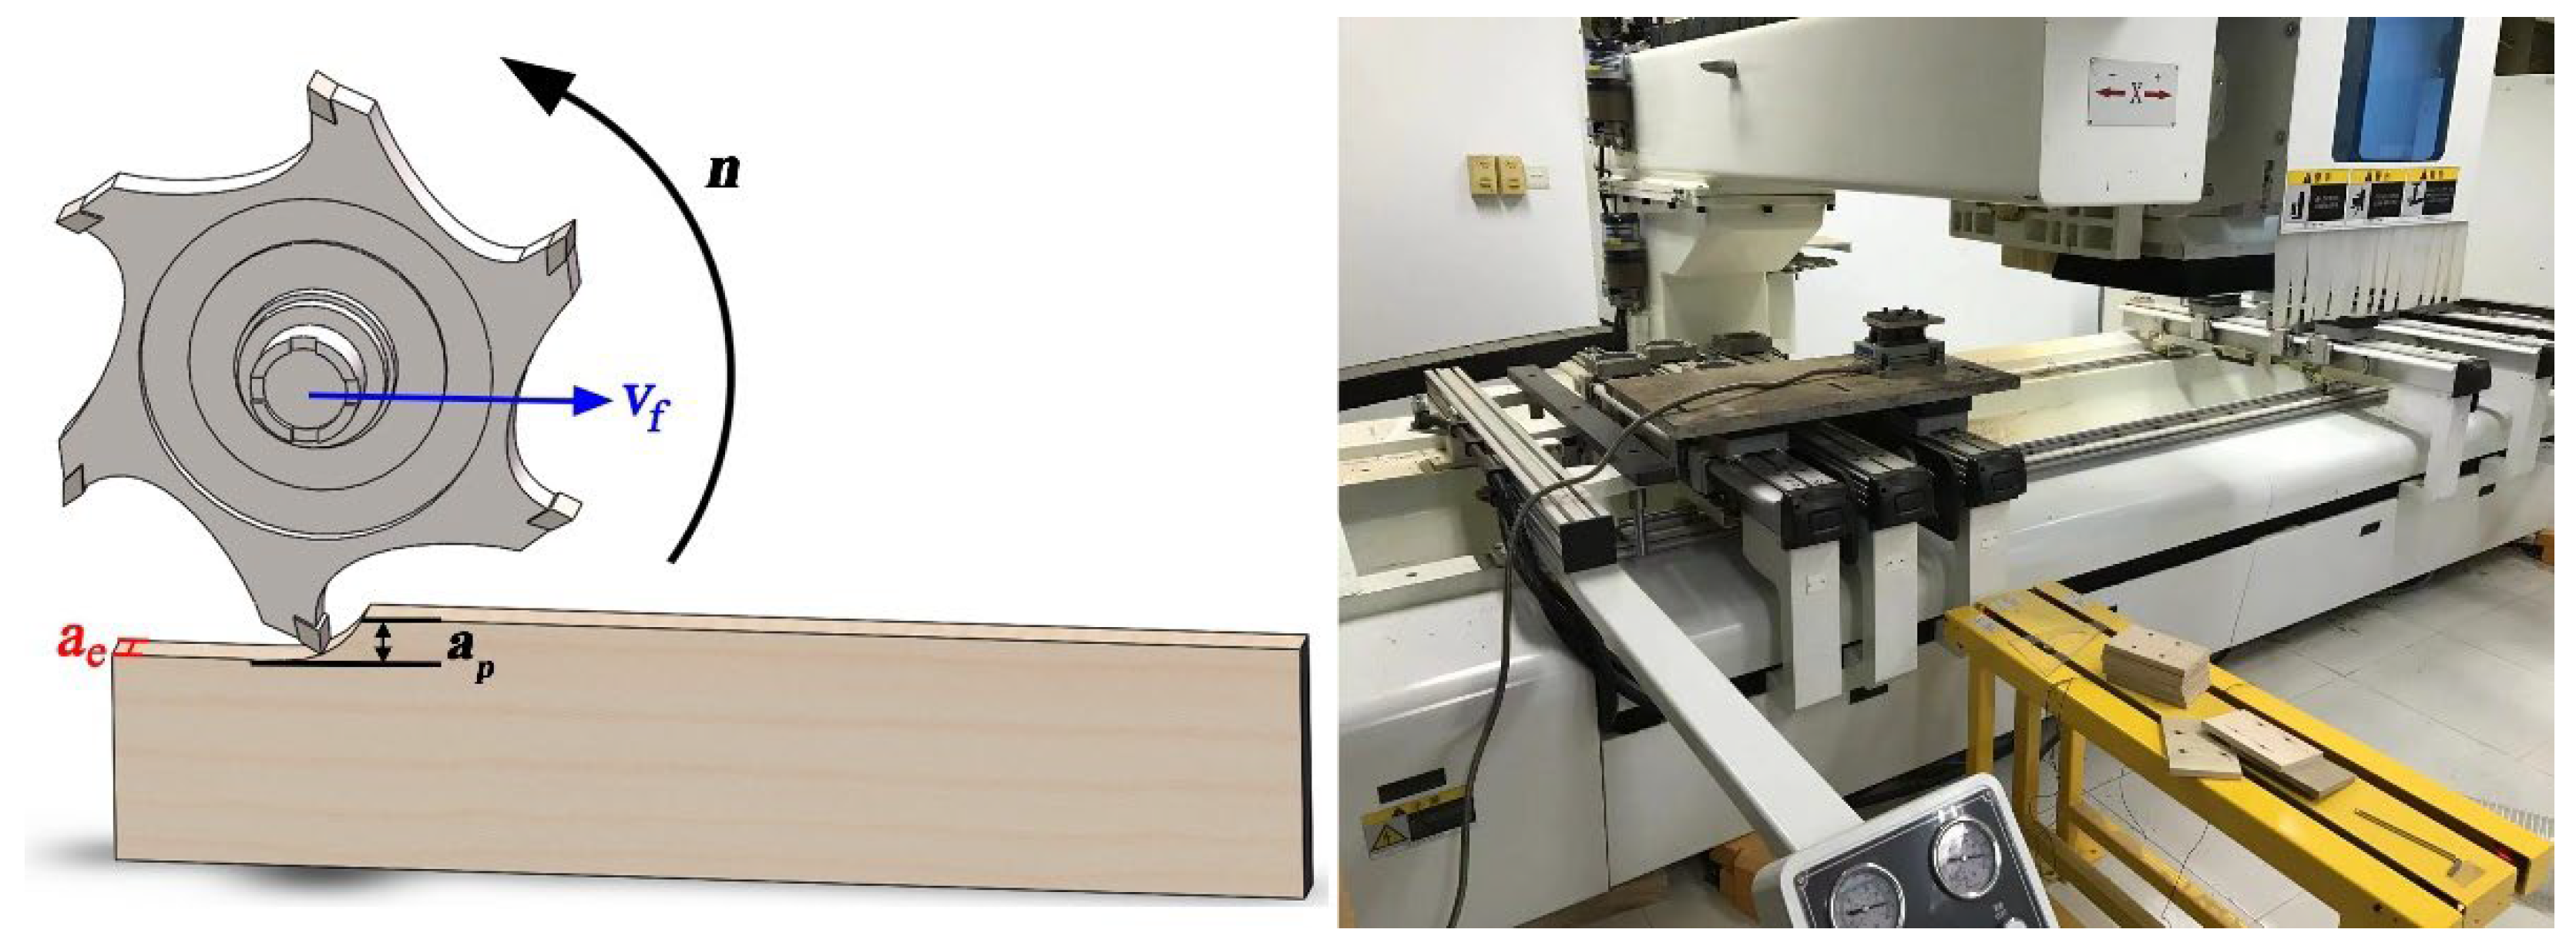
2. Materials and Methods
3. Results and Discussion
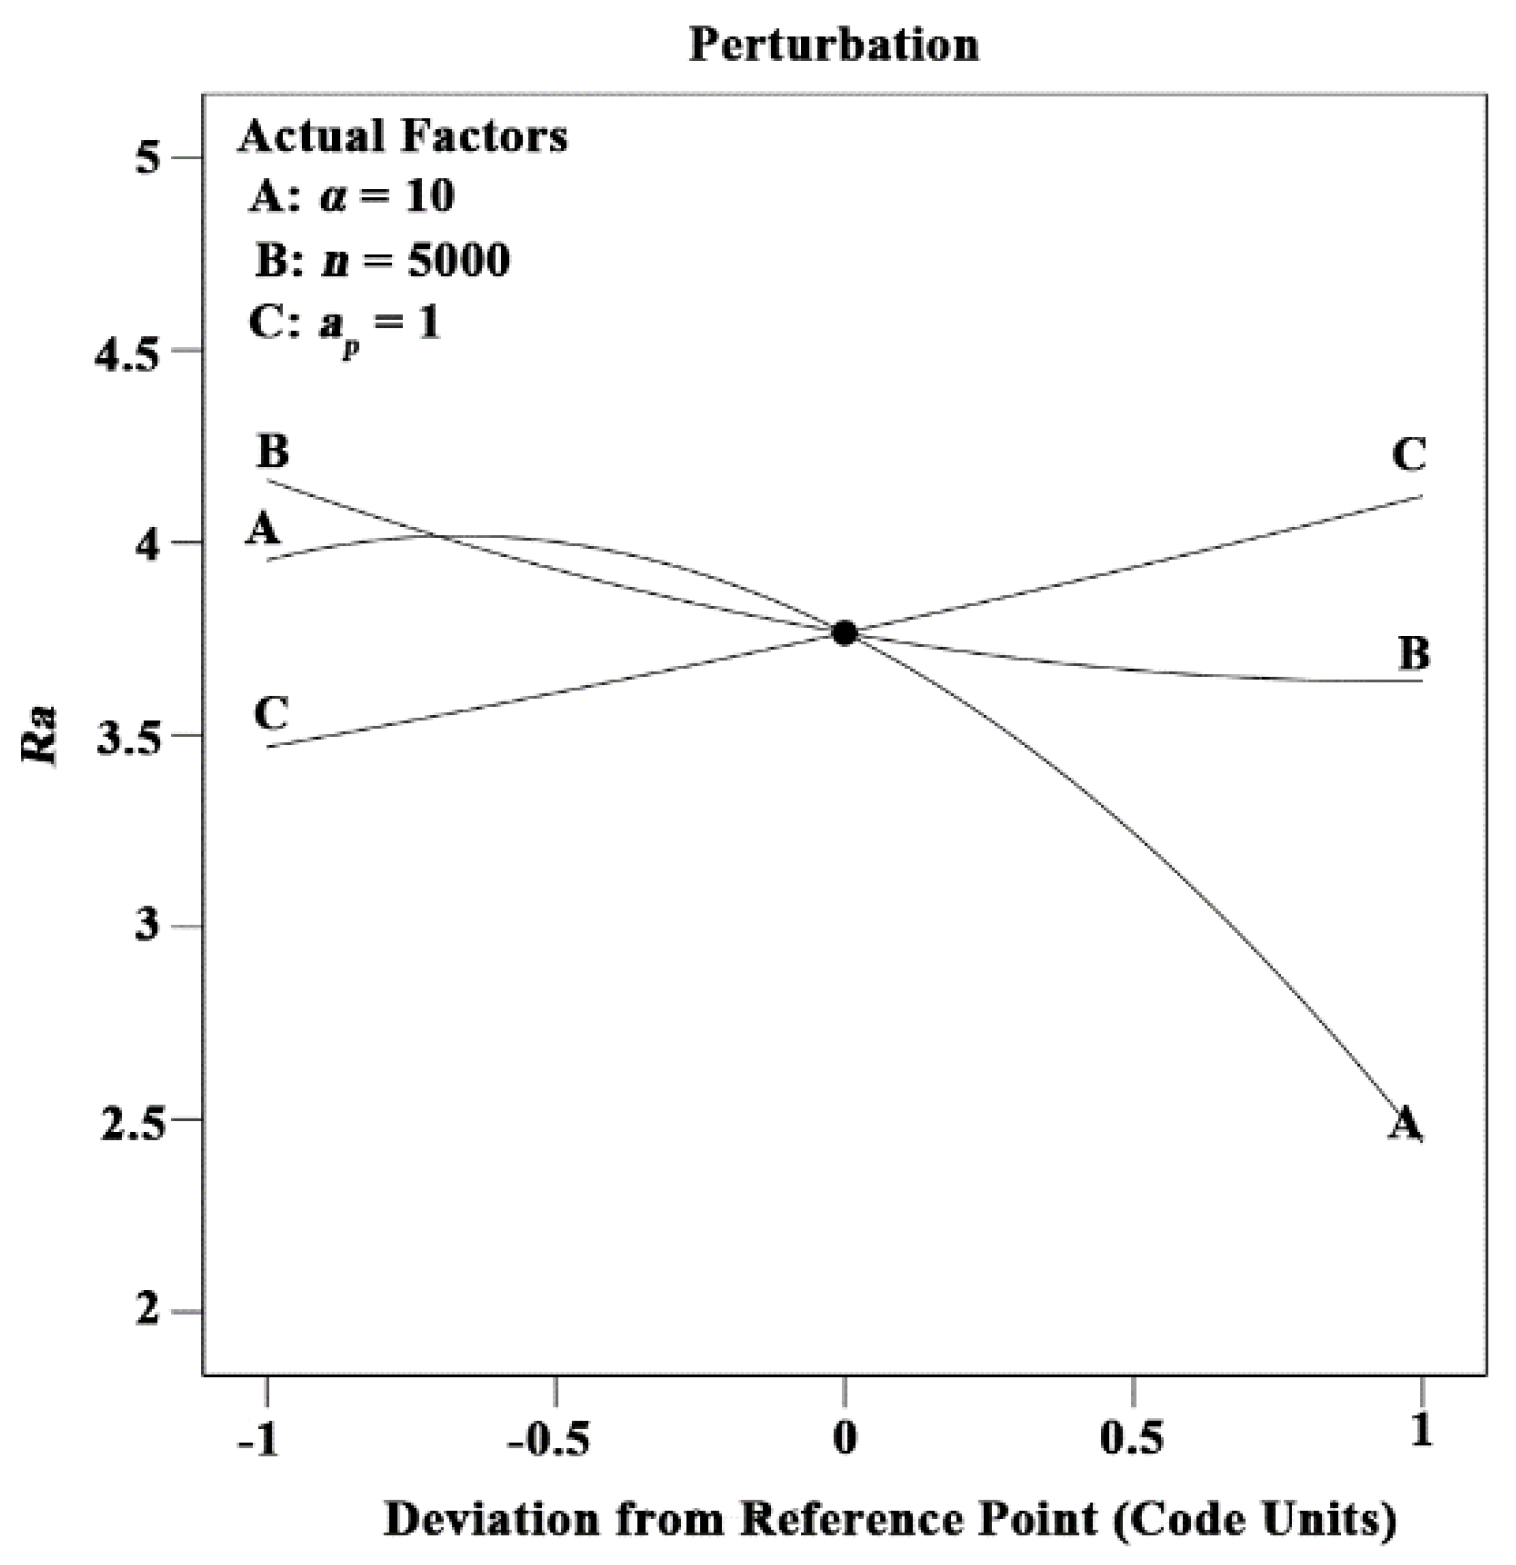
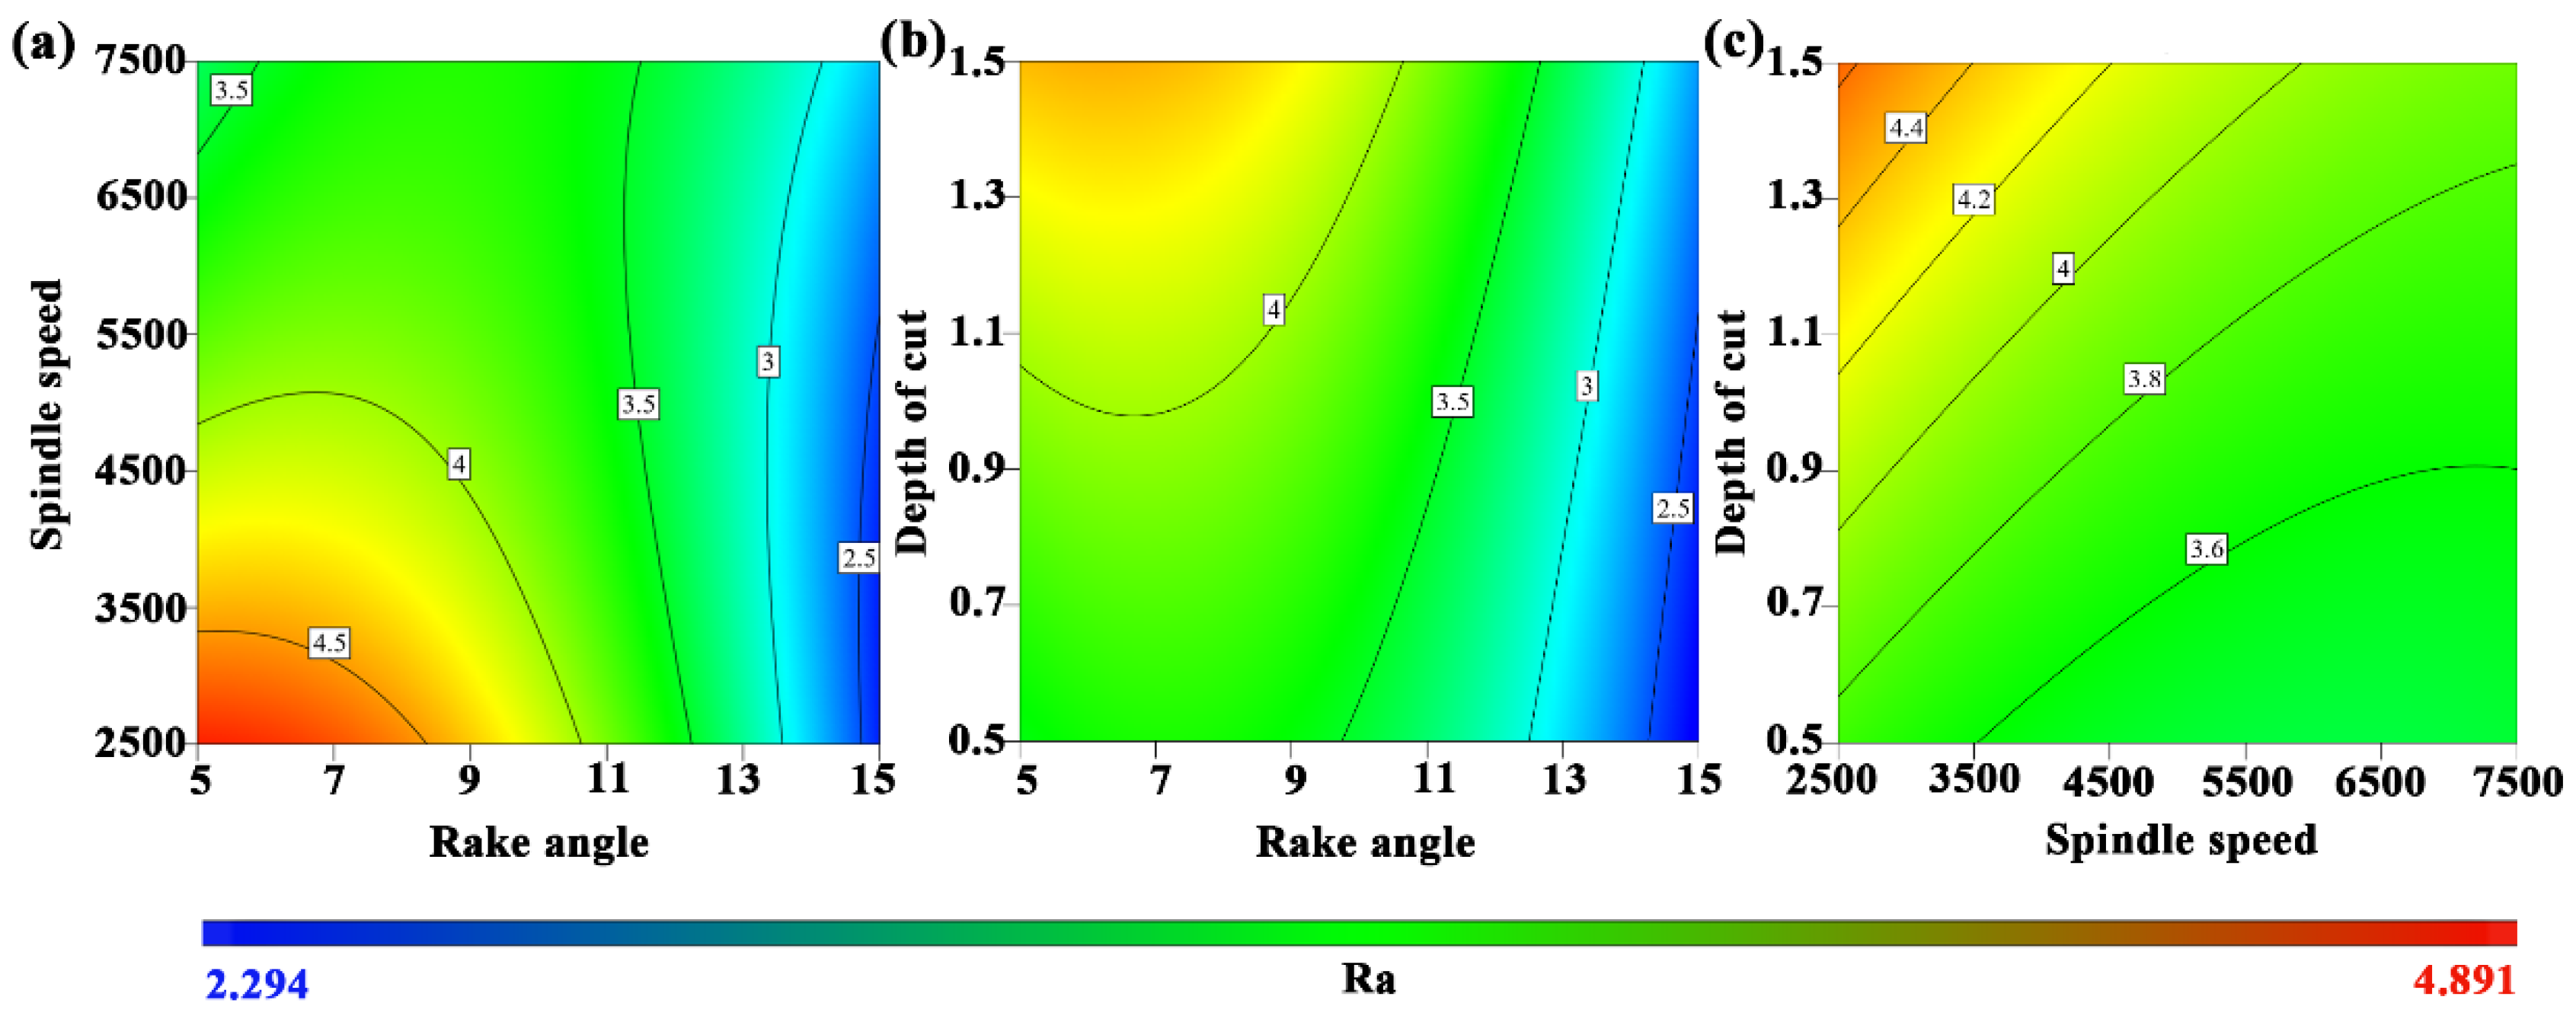
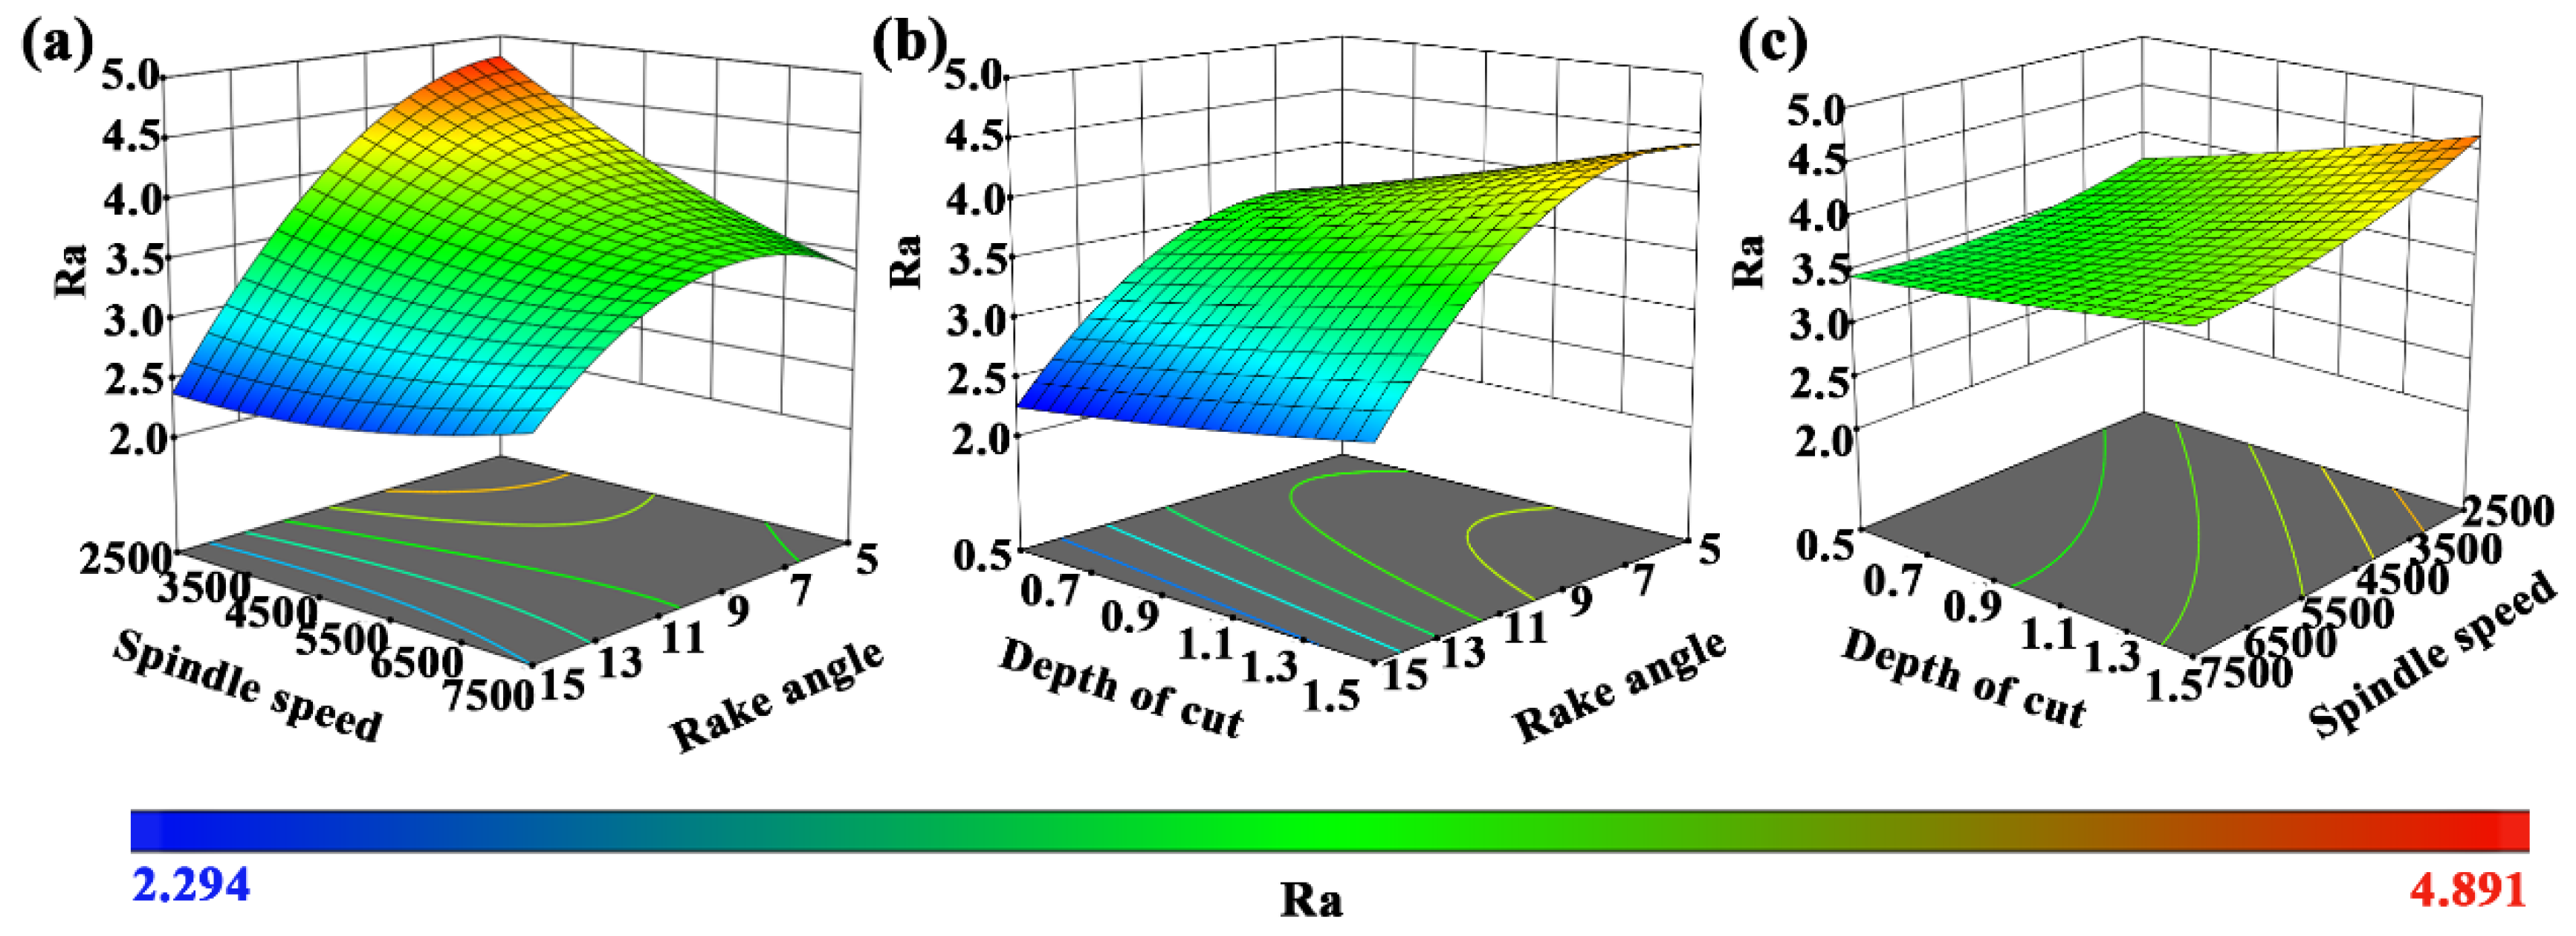
3.1. A RSM for Surface Roughness
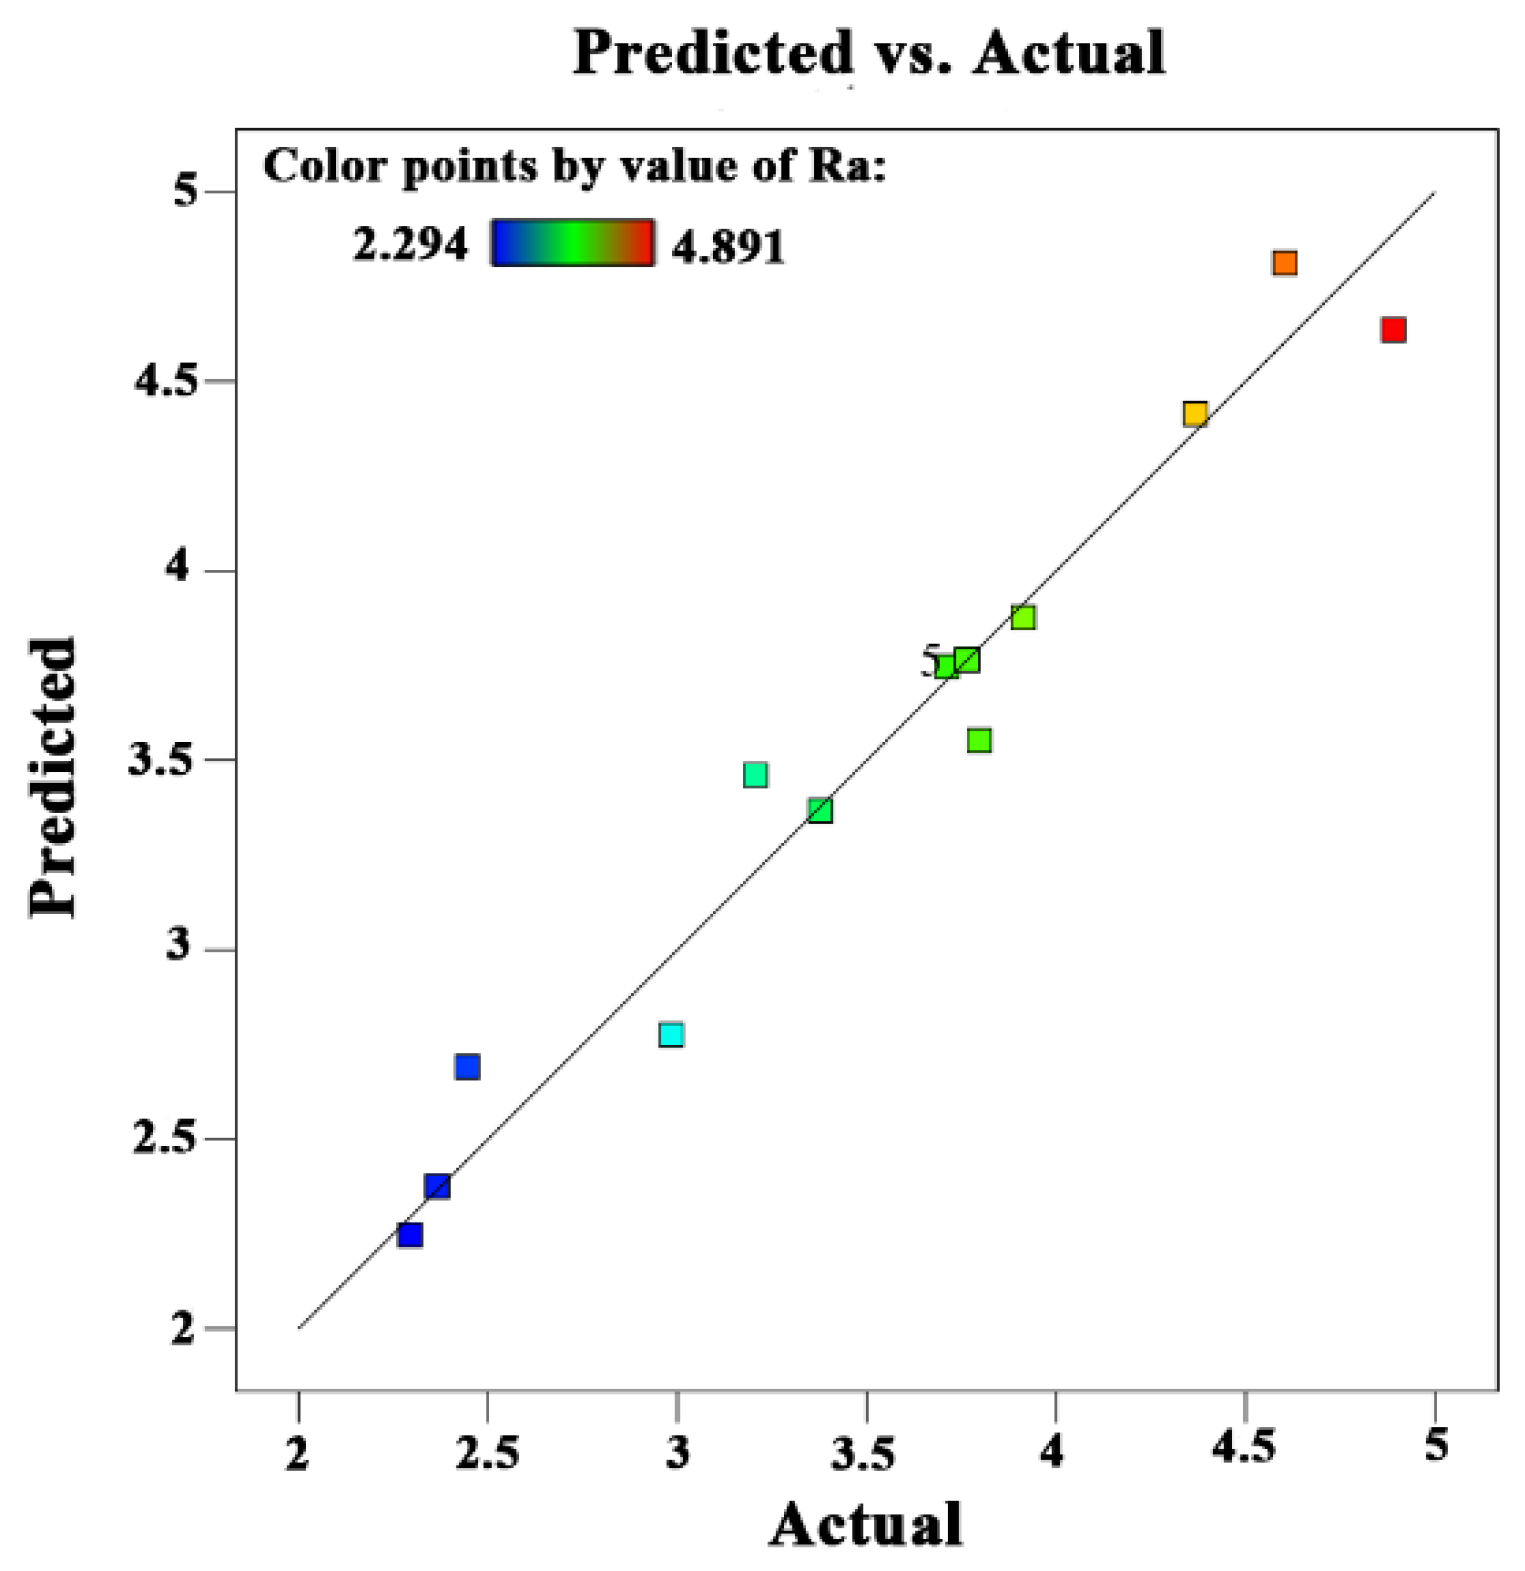
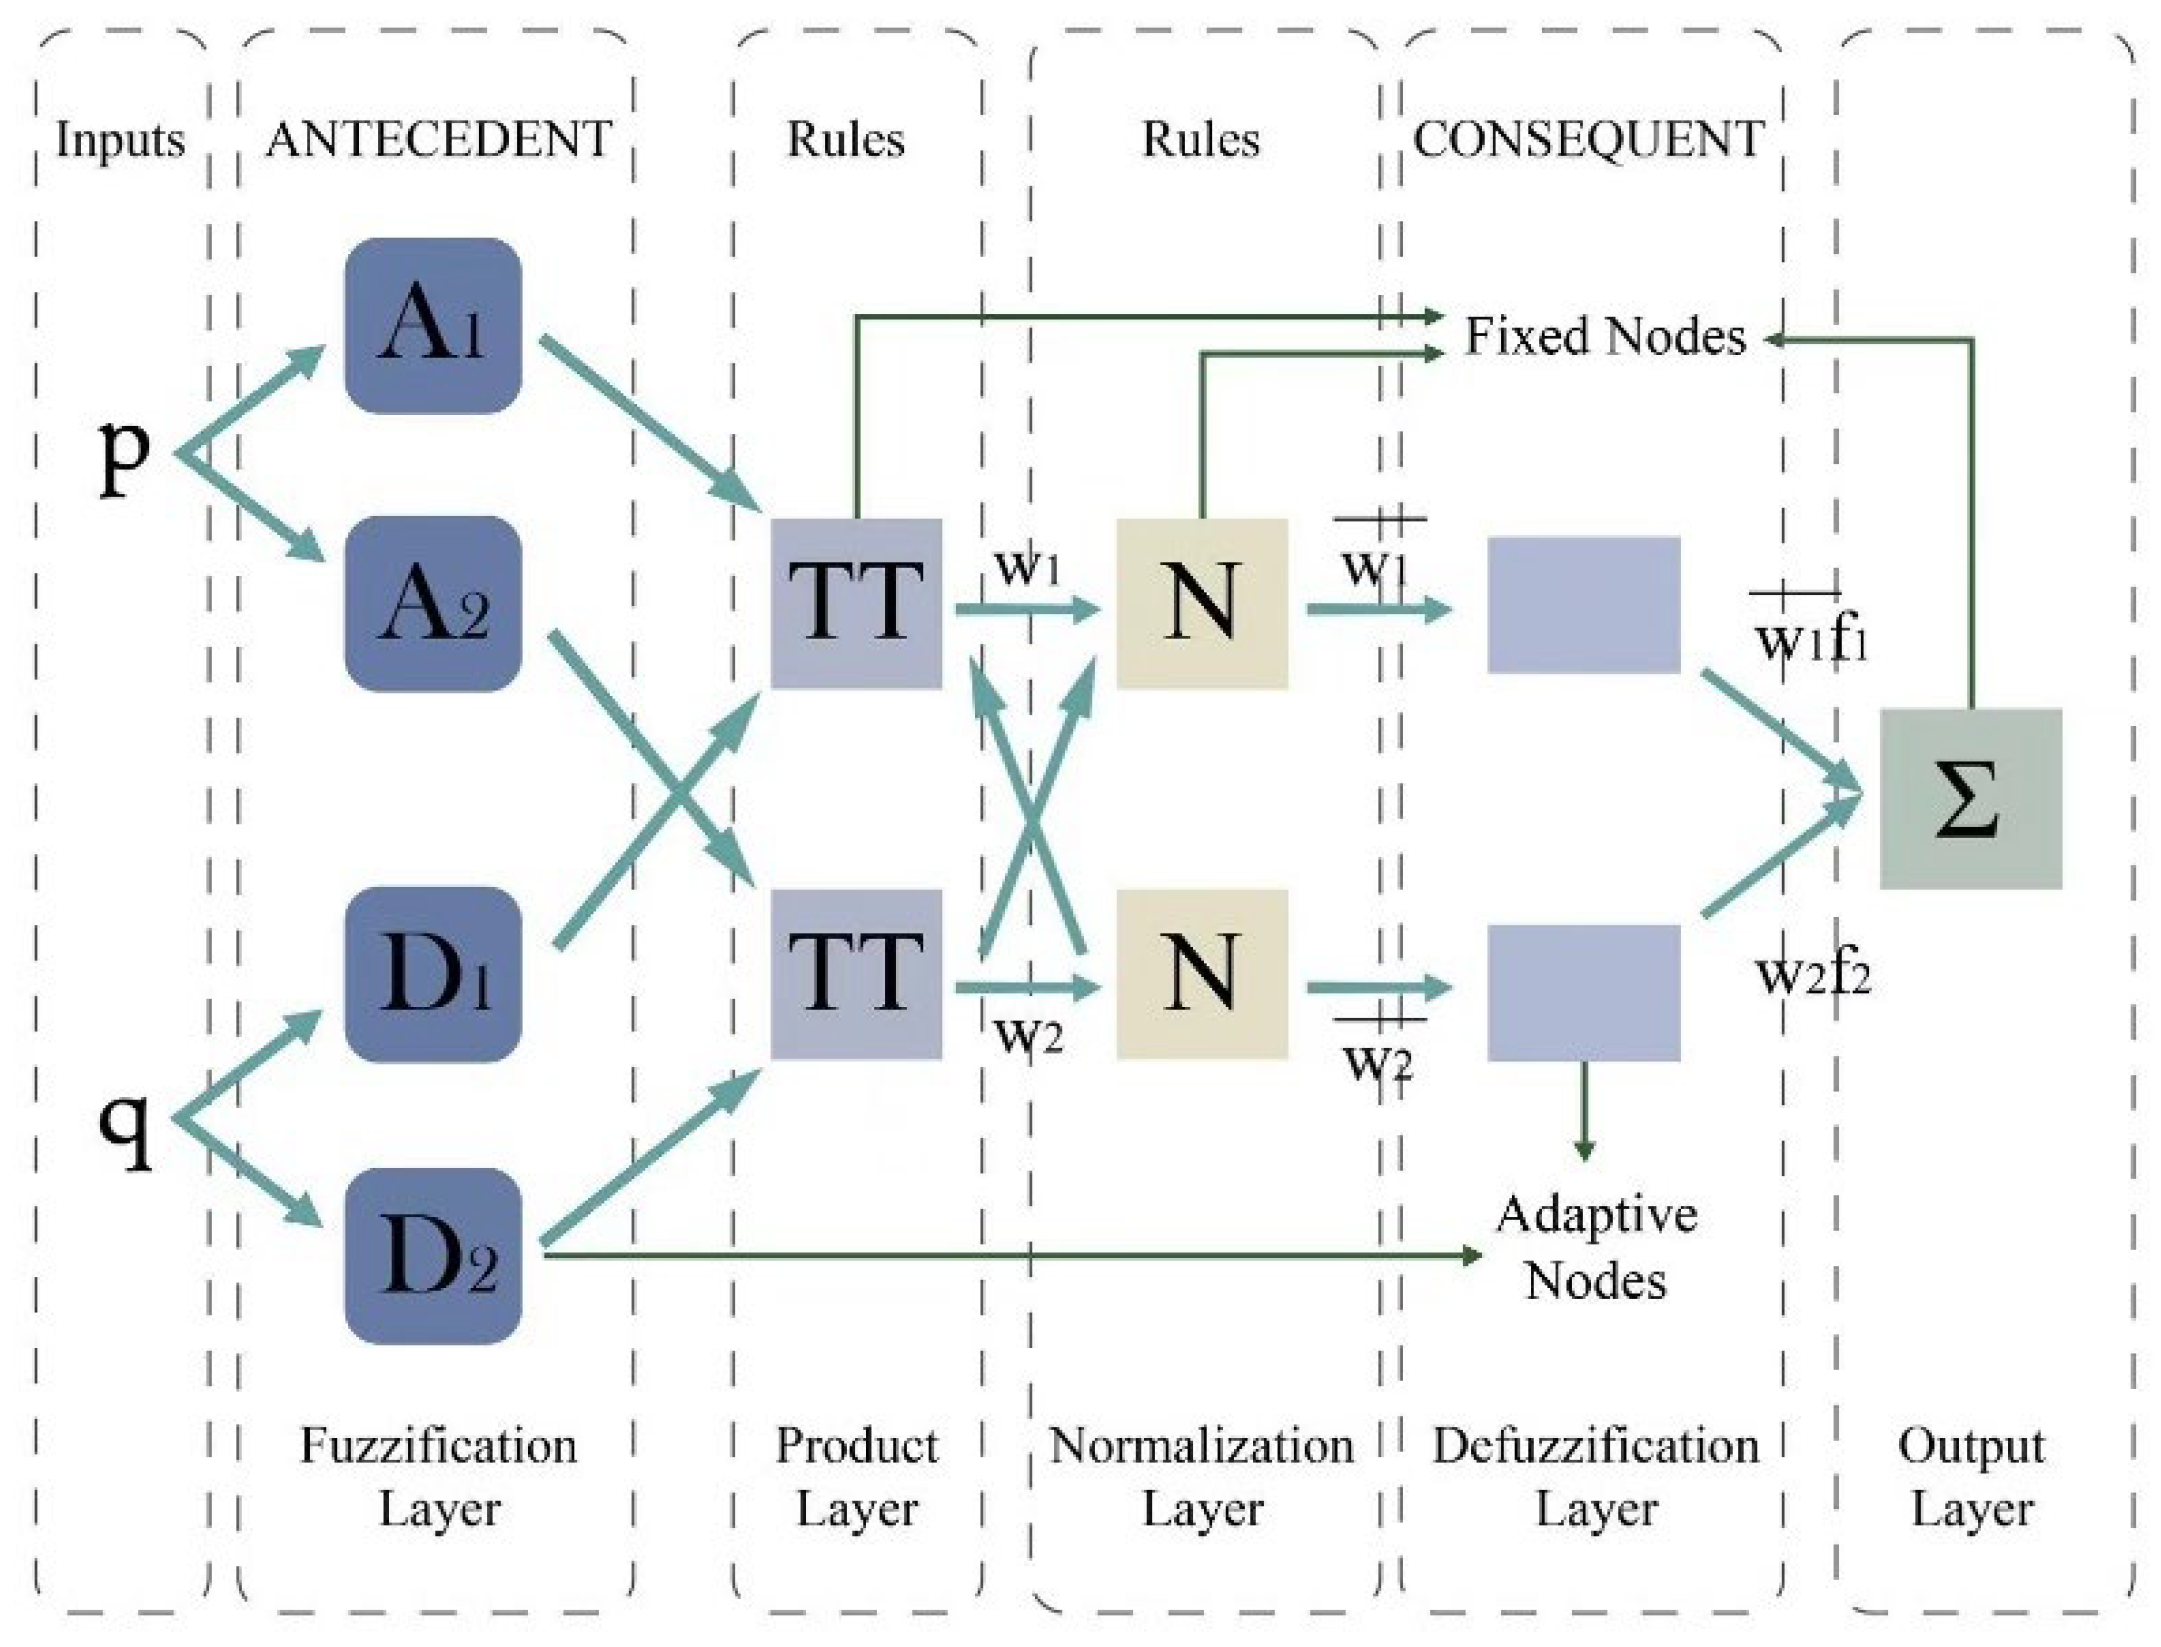
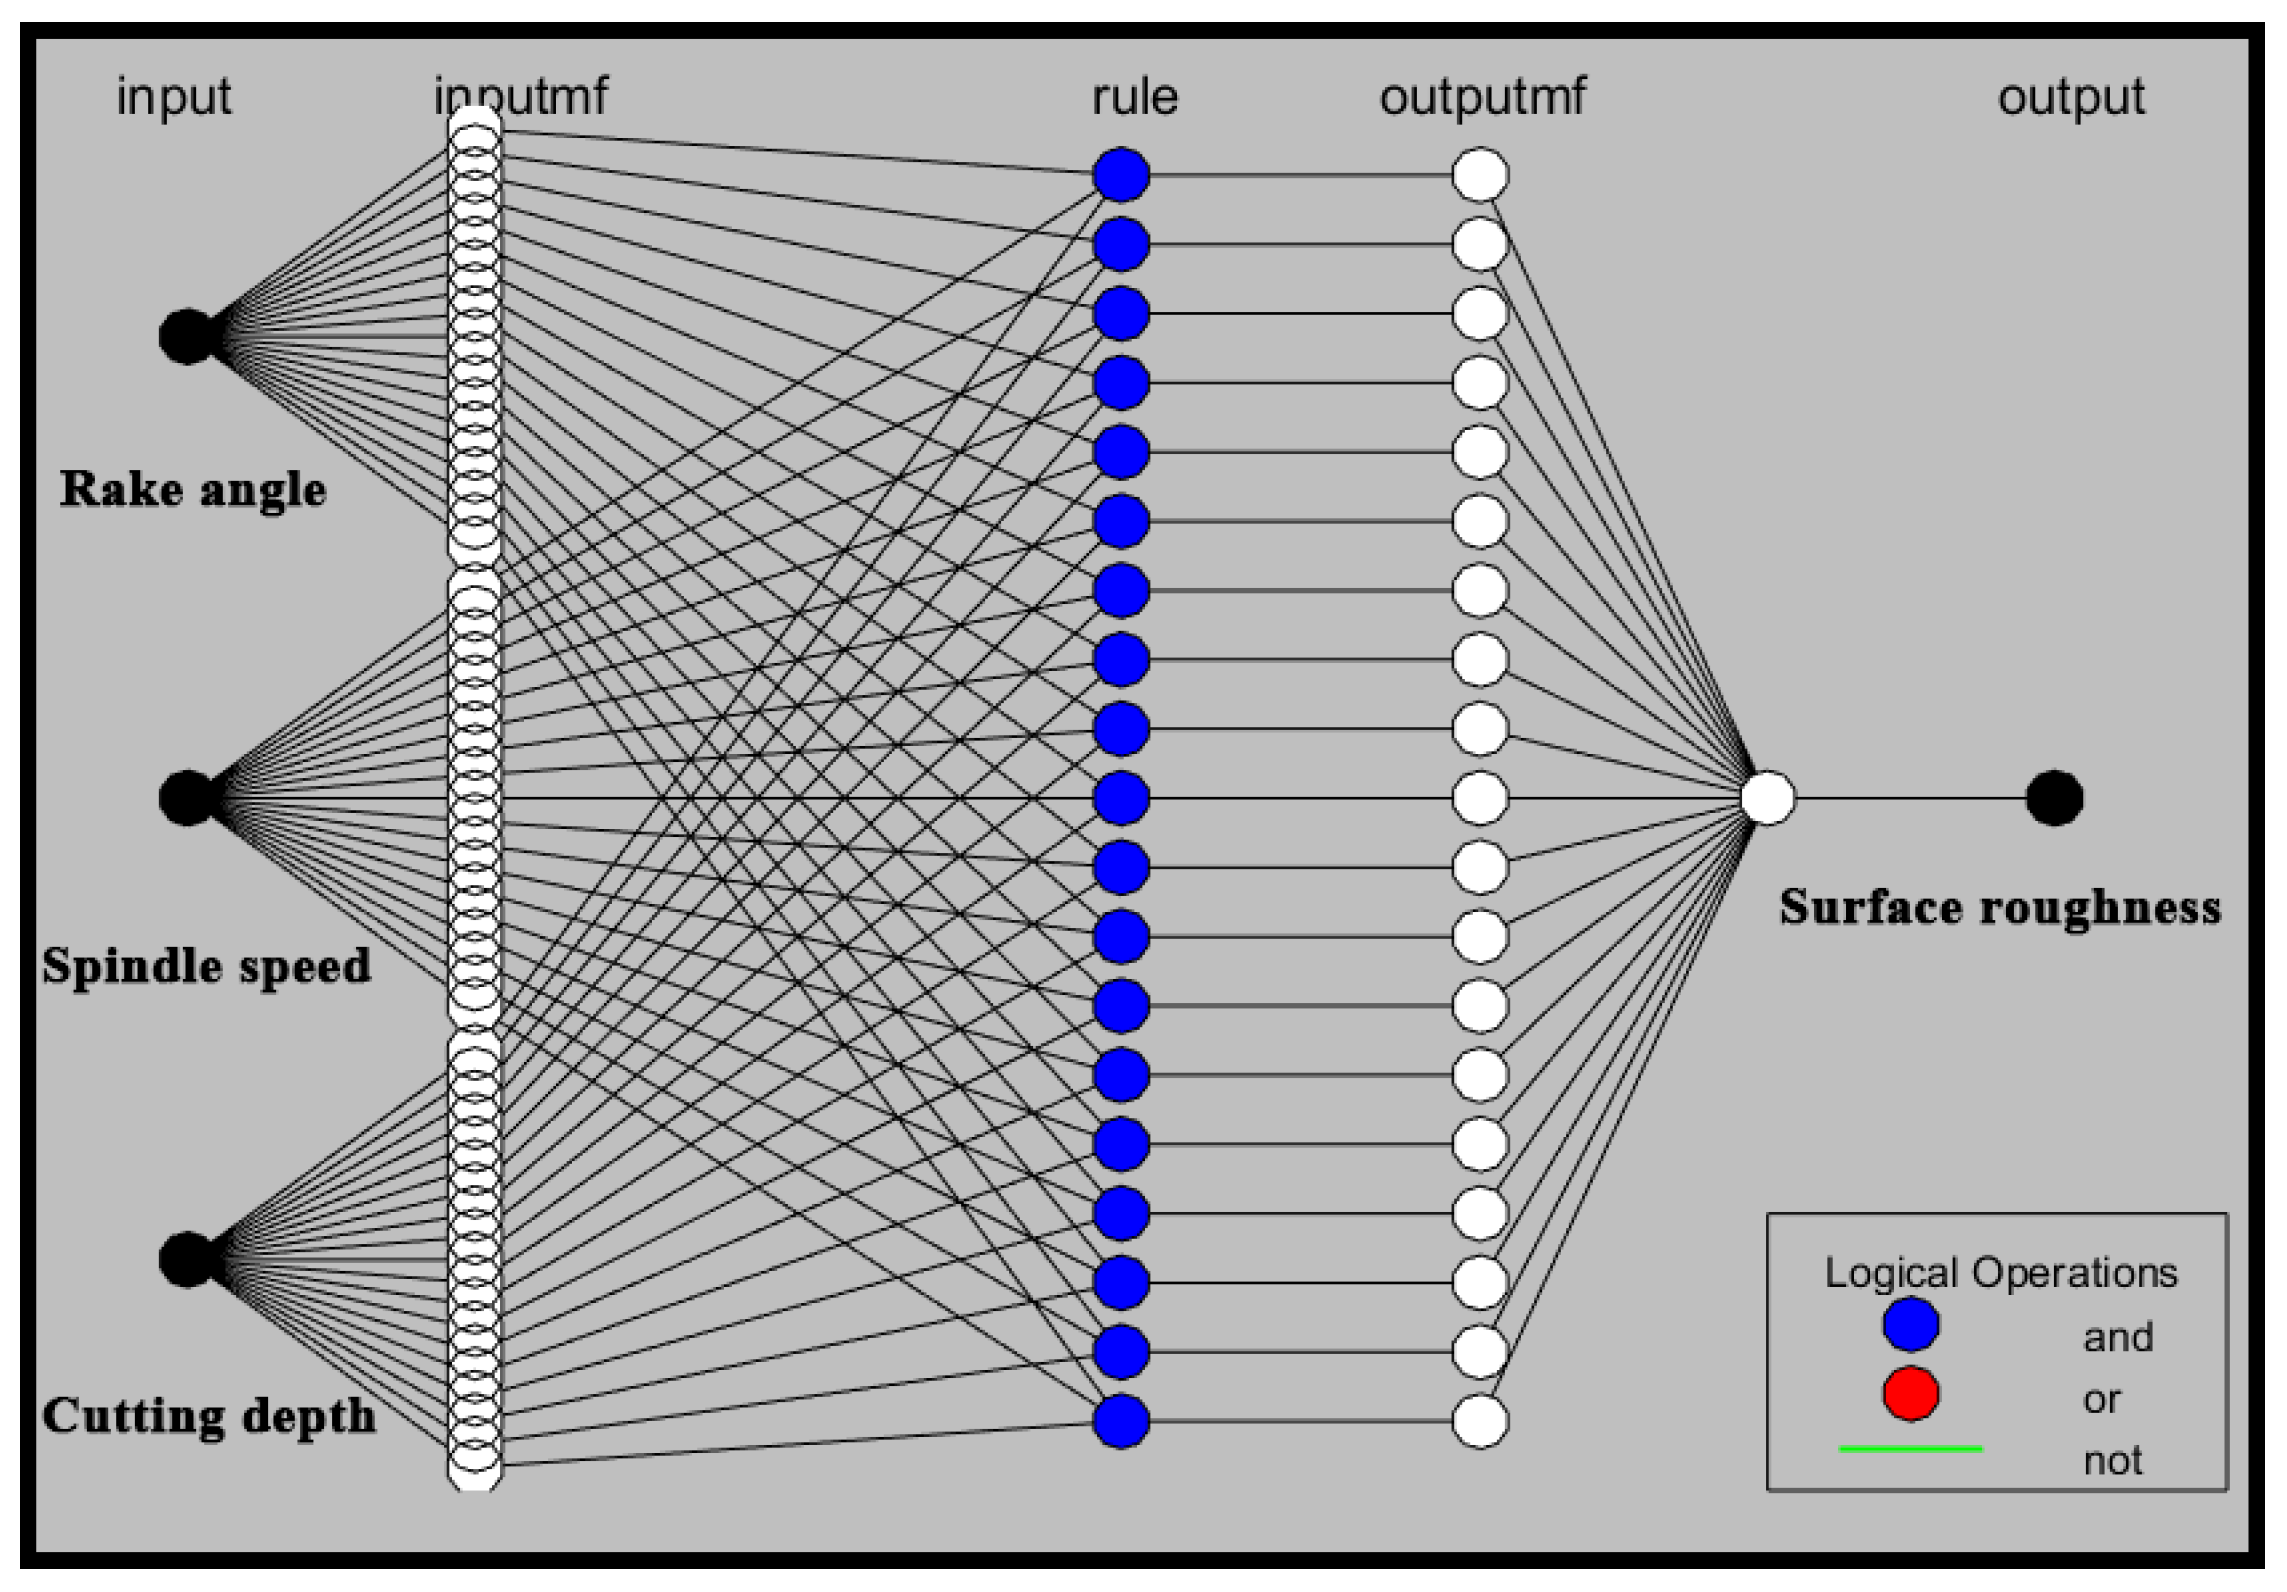
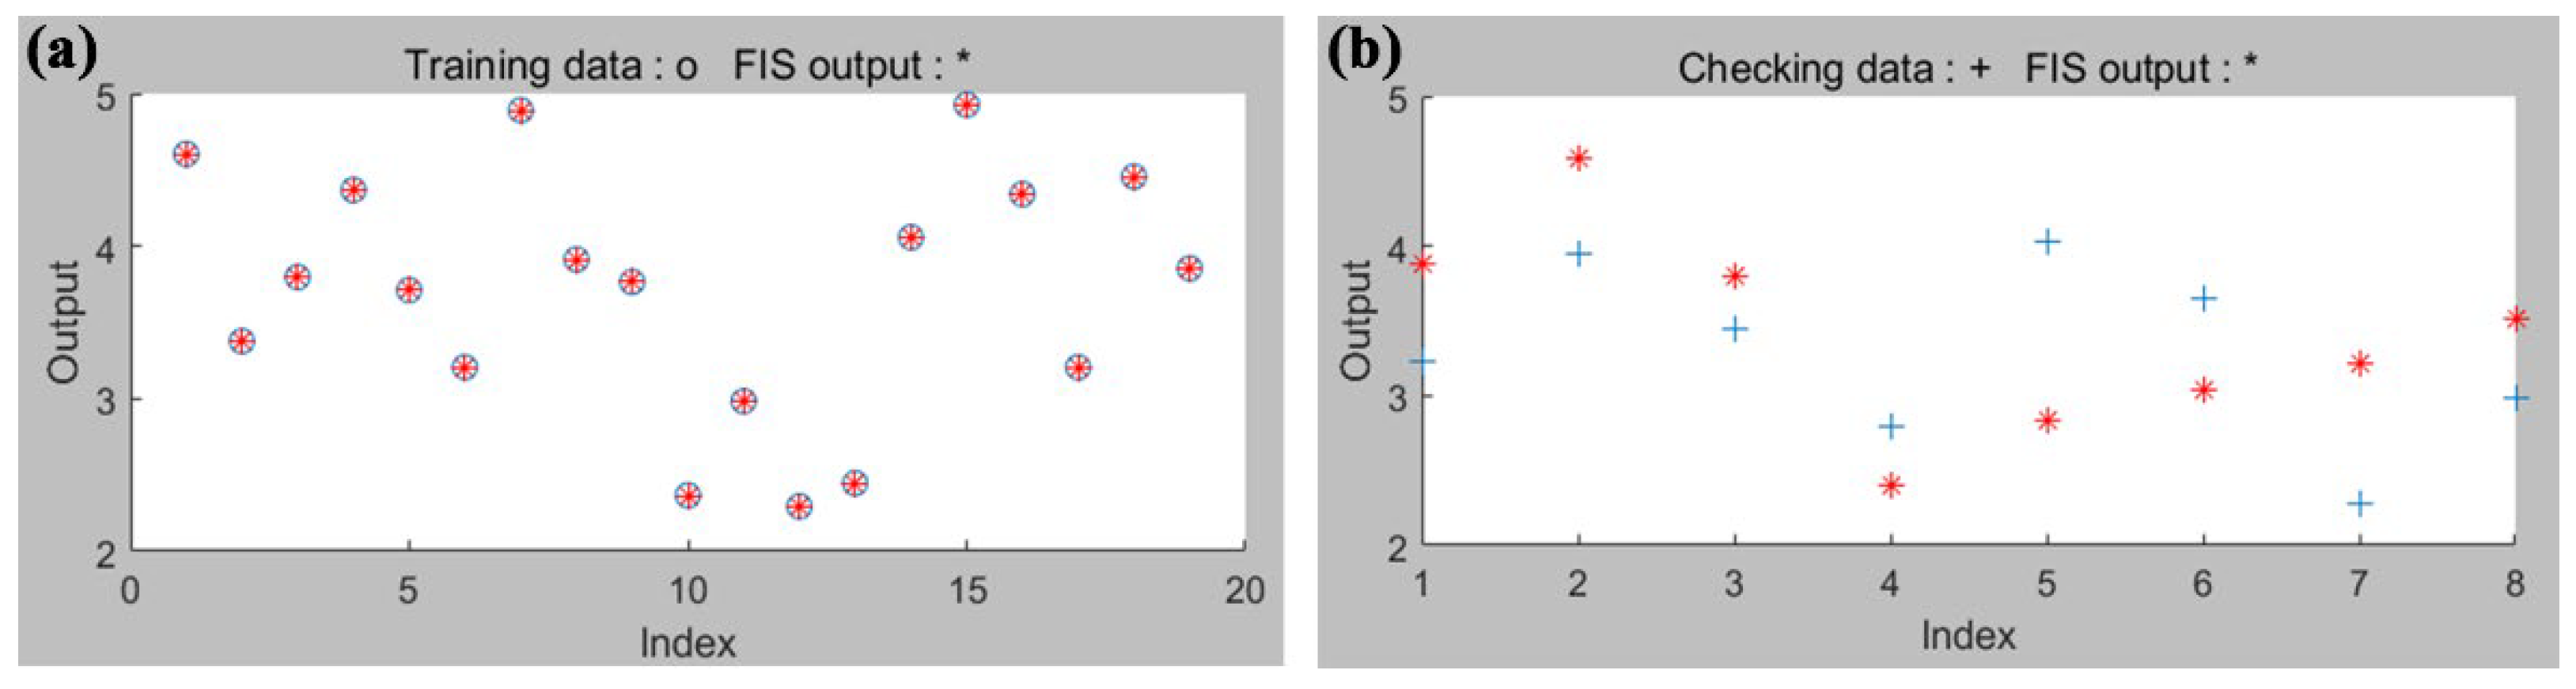
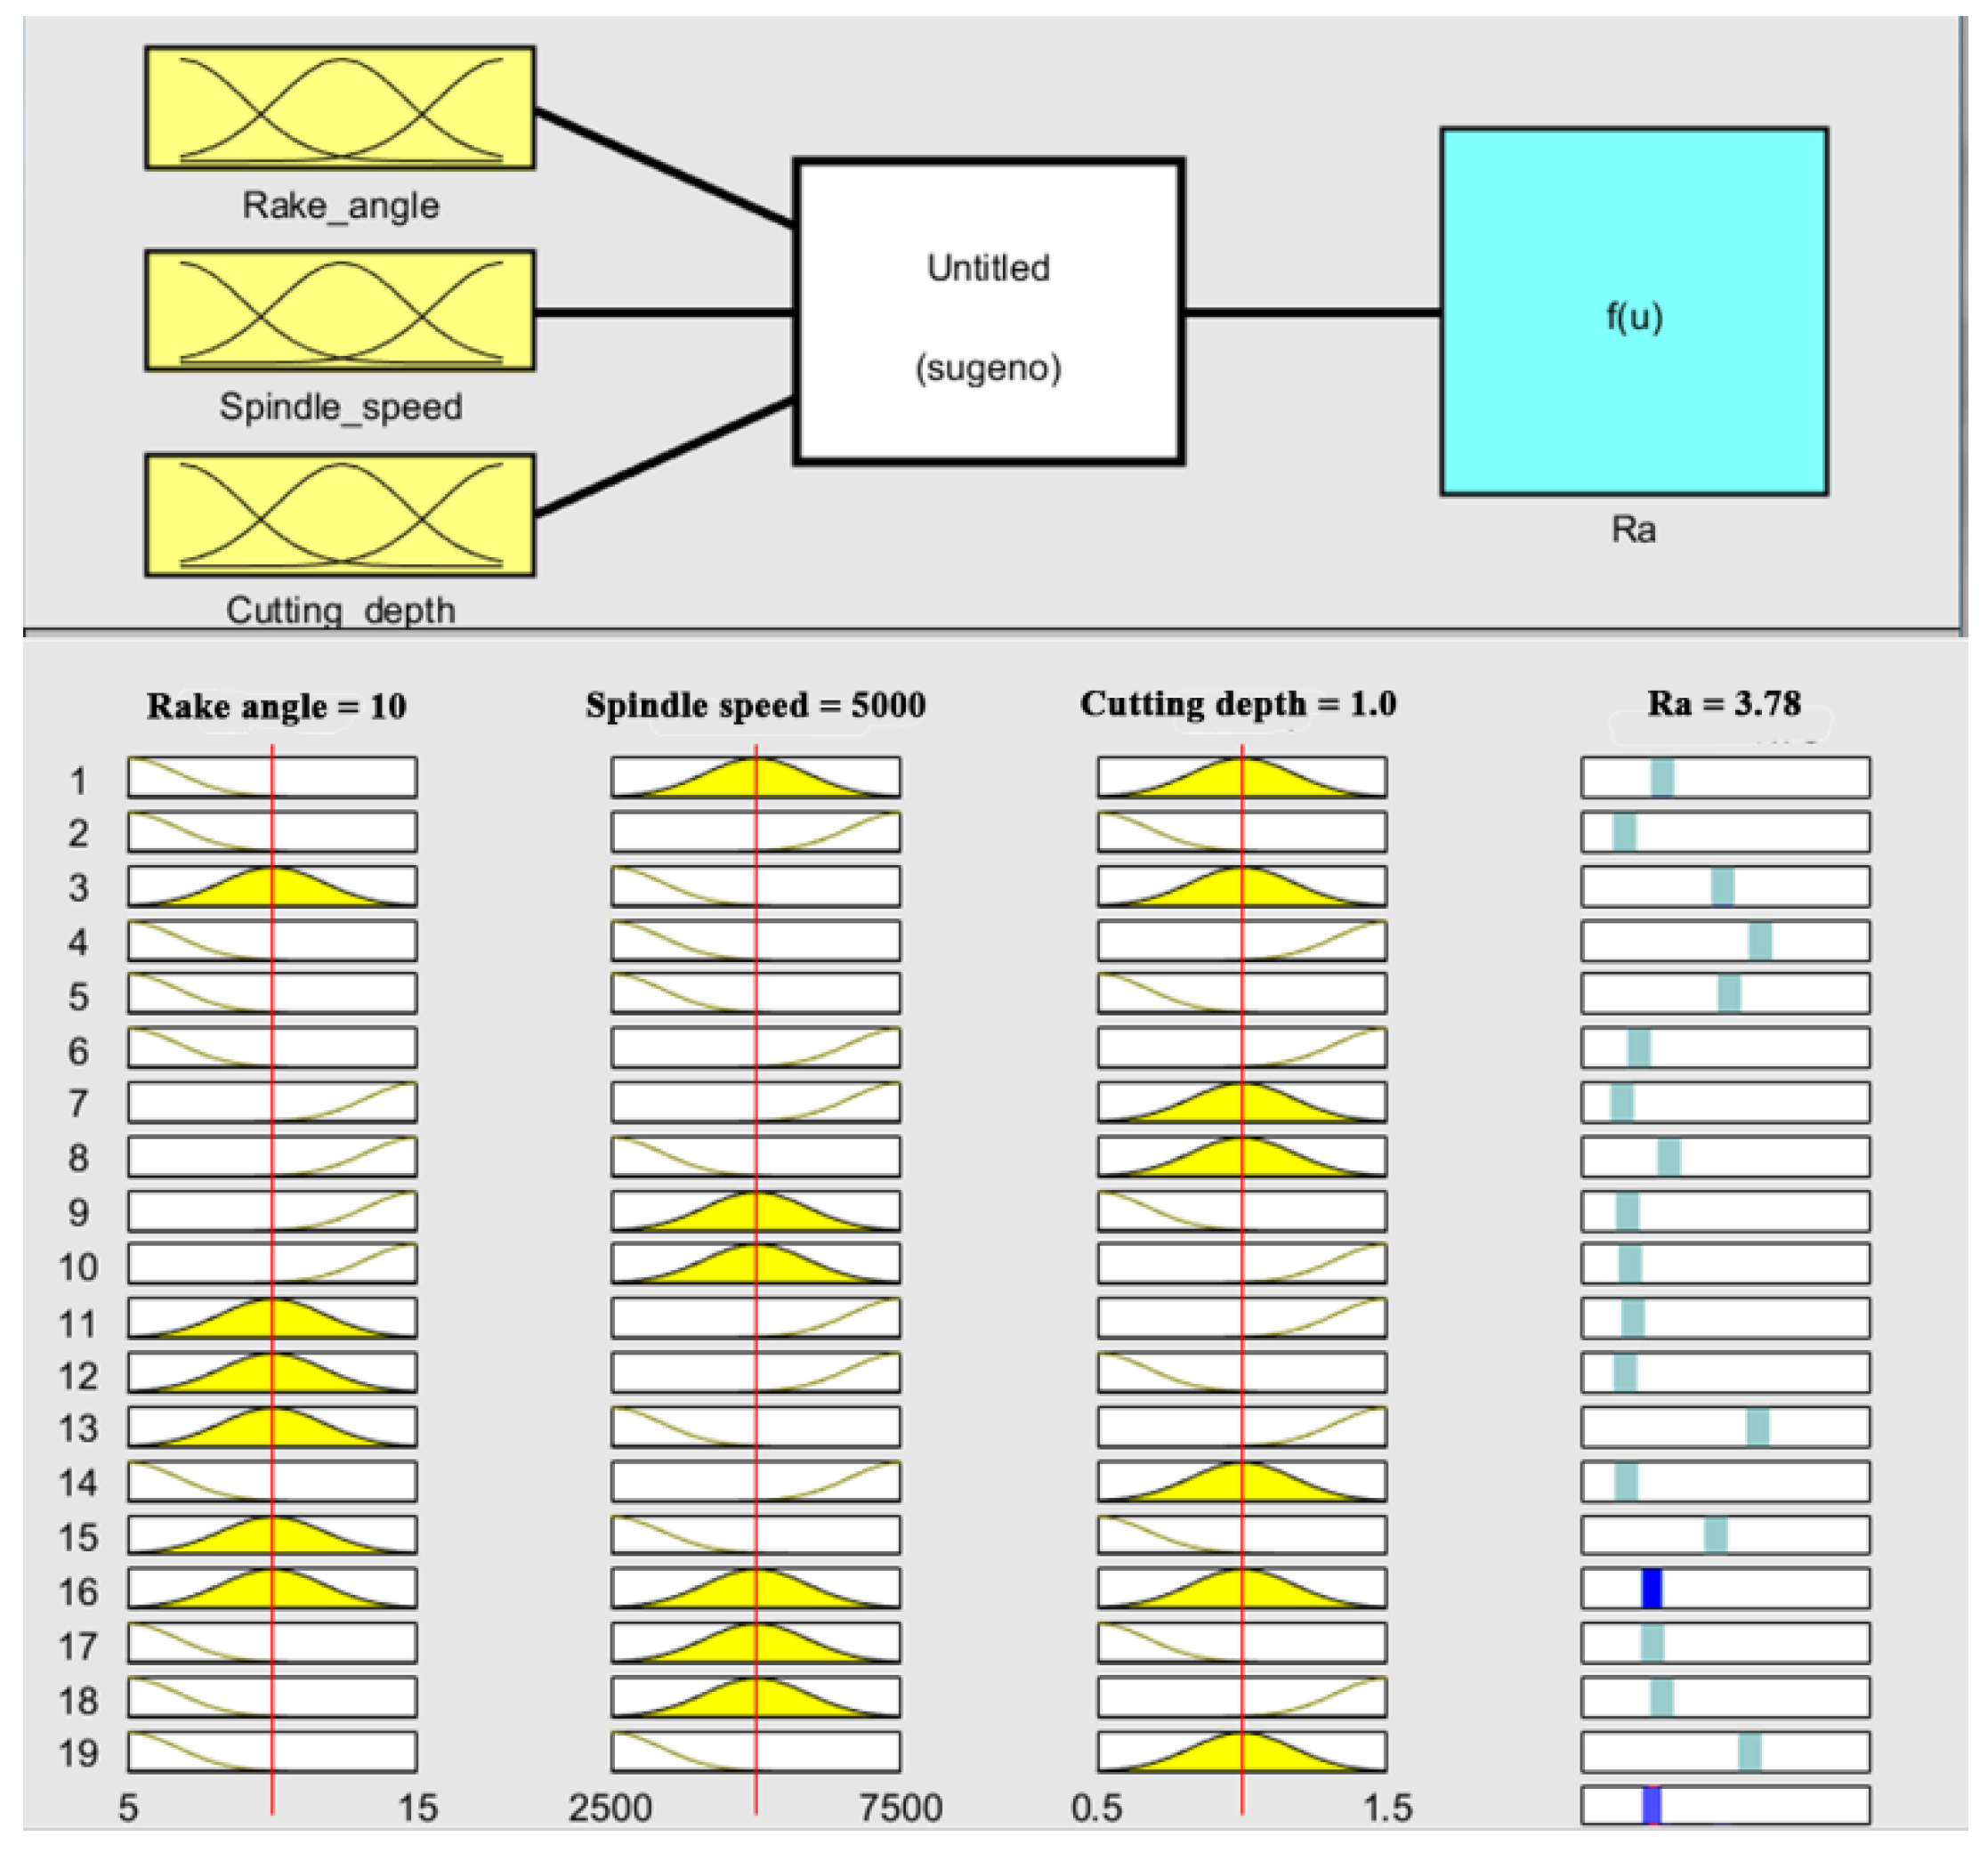
3.2. ANFIS Methodology for Surface Roughness
3.3. Optimization and Verification for High-Quality Machining
4. Conclusions
- (1)
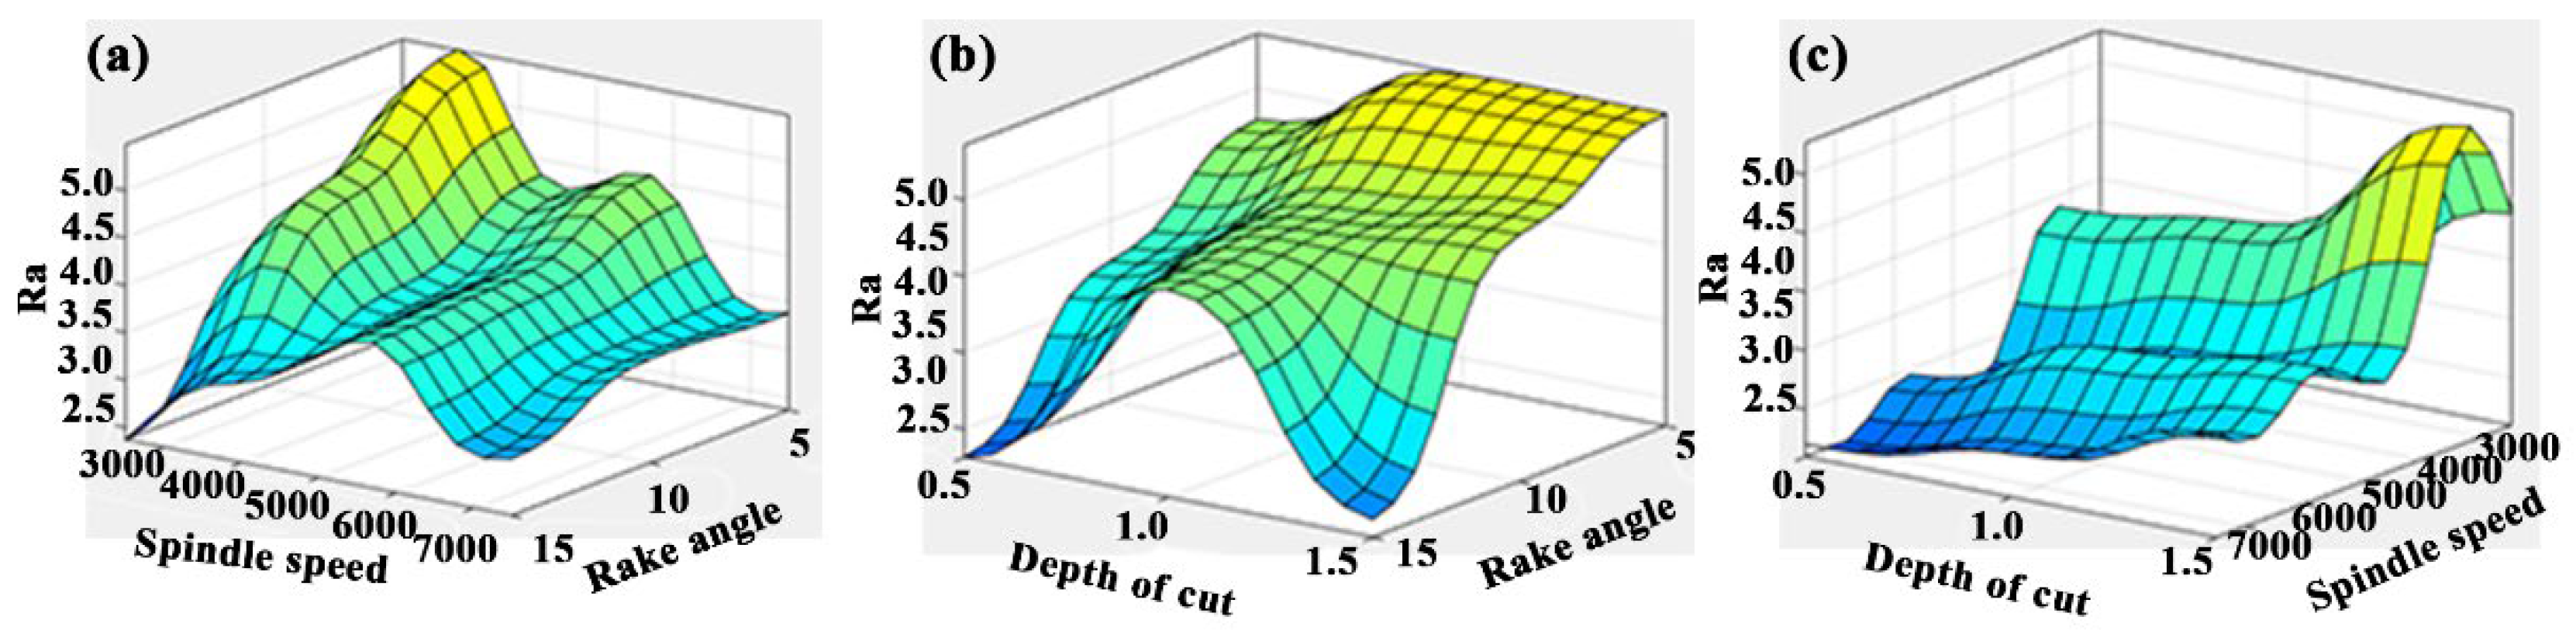
- Ra is positively correlated with depth of cut, and negatively correlated with spindle speed and tool rake angle; meanwhile, the degree of influence of the cutting parameter on Ra was ranked as α > ap > n; the degree of influence of the interaction term on Ra was ranked as α×n > n×ap > α×ap; the order of influence of the quadratic term of the cutting parameters was α2 > n2 > ap2.
- (2)
- The established ANFIS model is reliable for Ra prediction. Based on the Sugeno inference system, the non-linear modeling prediction becomes simple and reliable.
- (3)
- The relationship between the influence of each cutting parameter on Ra obtained by RSM and ANFIS is highly consistent, which not only proves the reliability of the model, but also the reliability of the obtained influence law.
- (4)
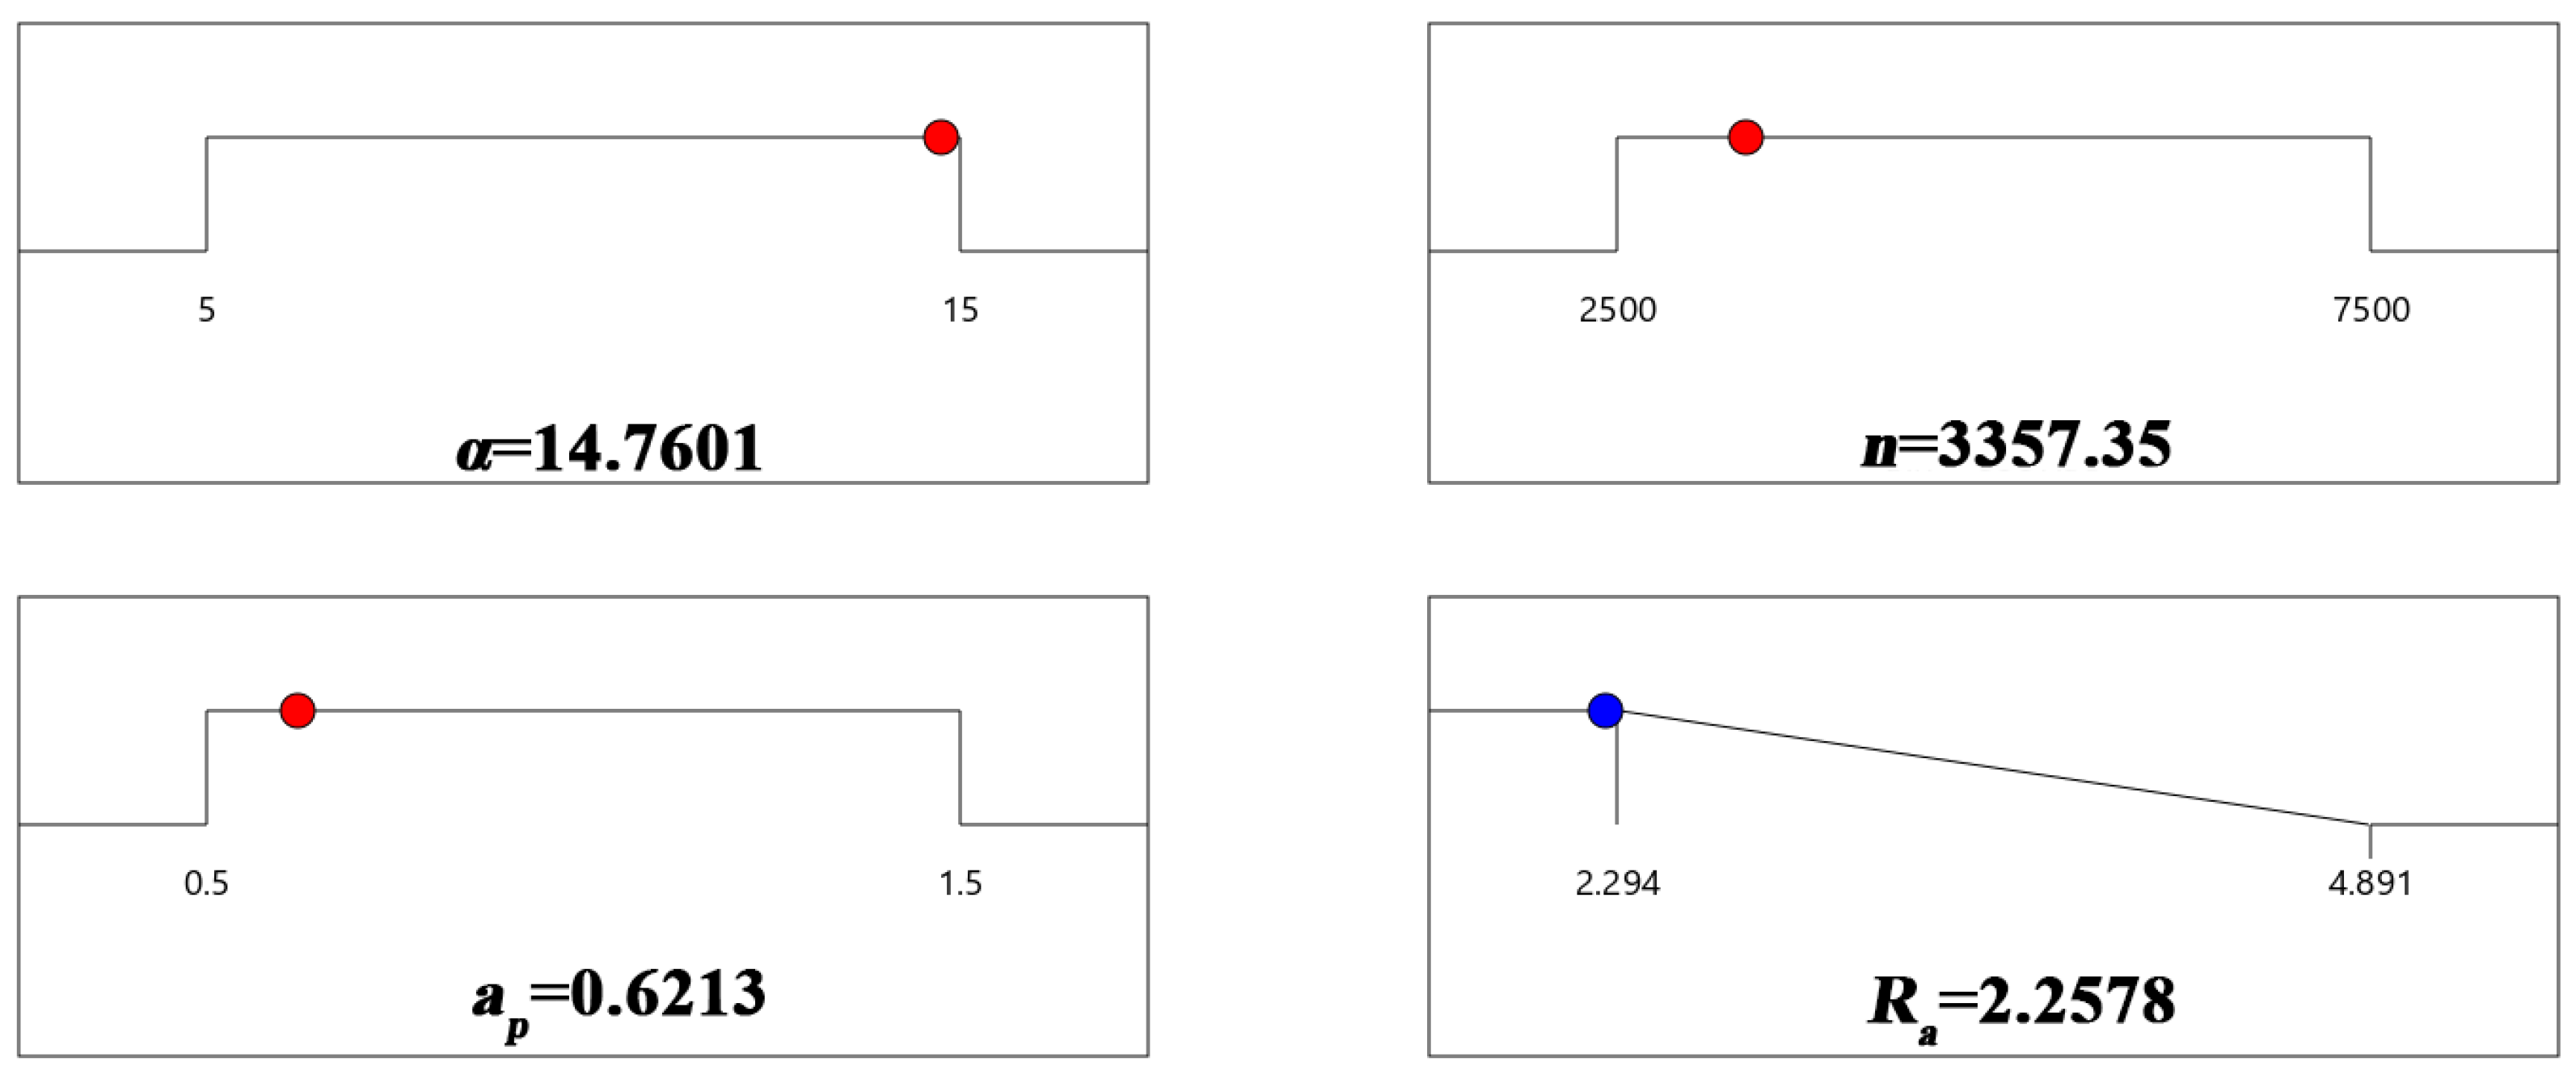
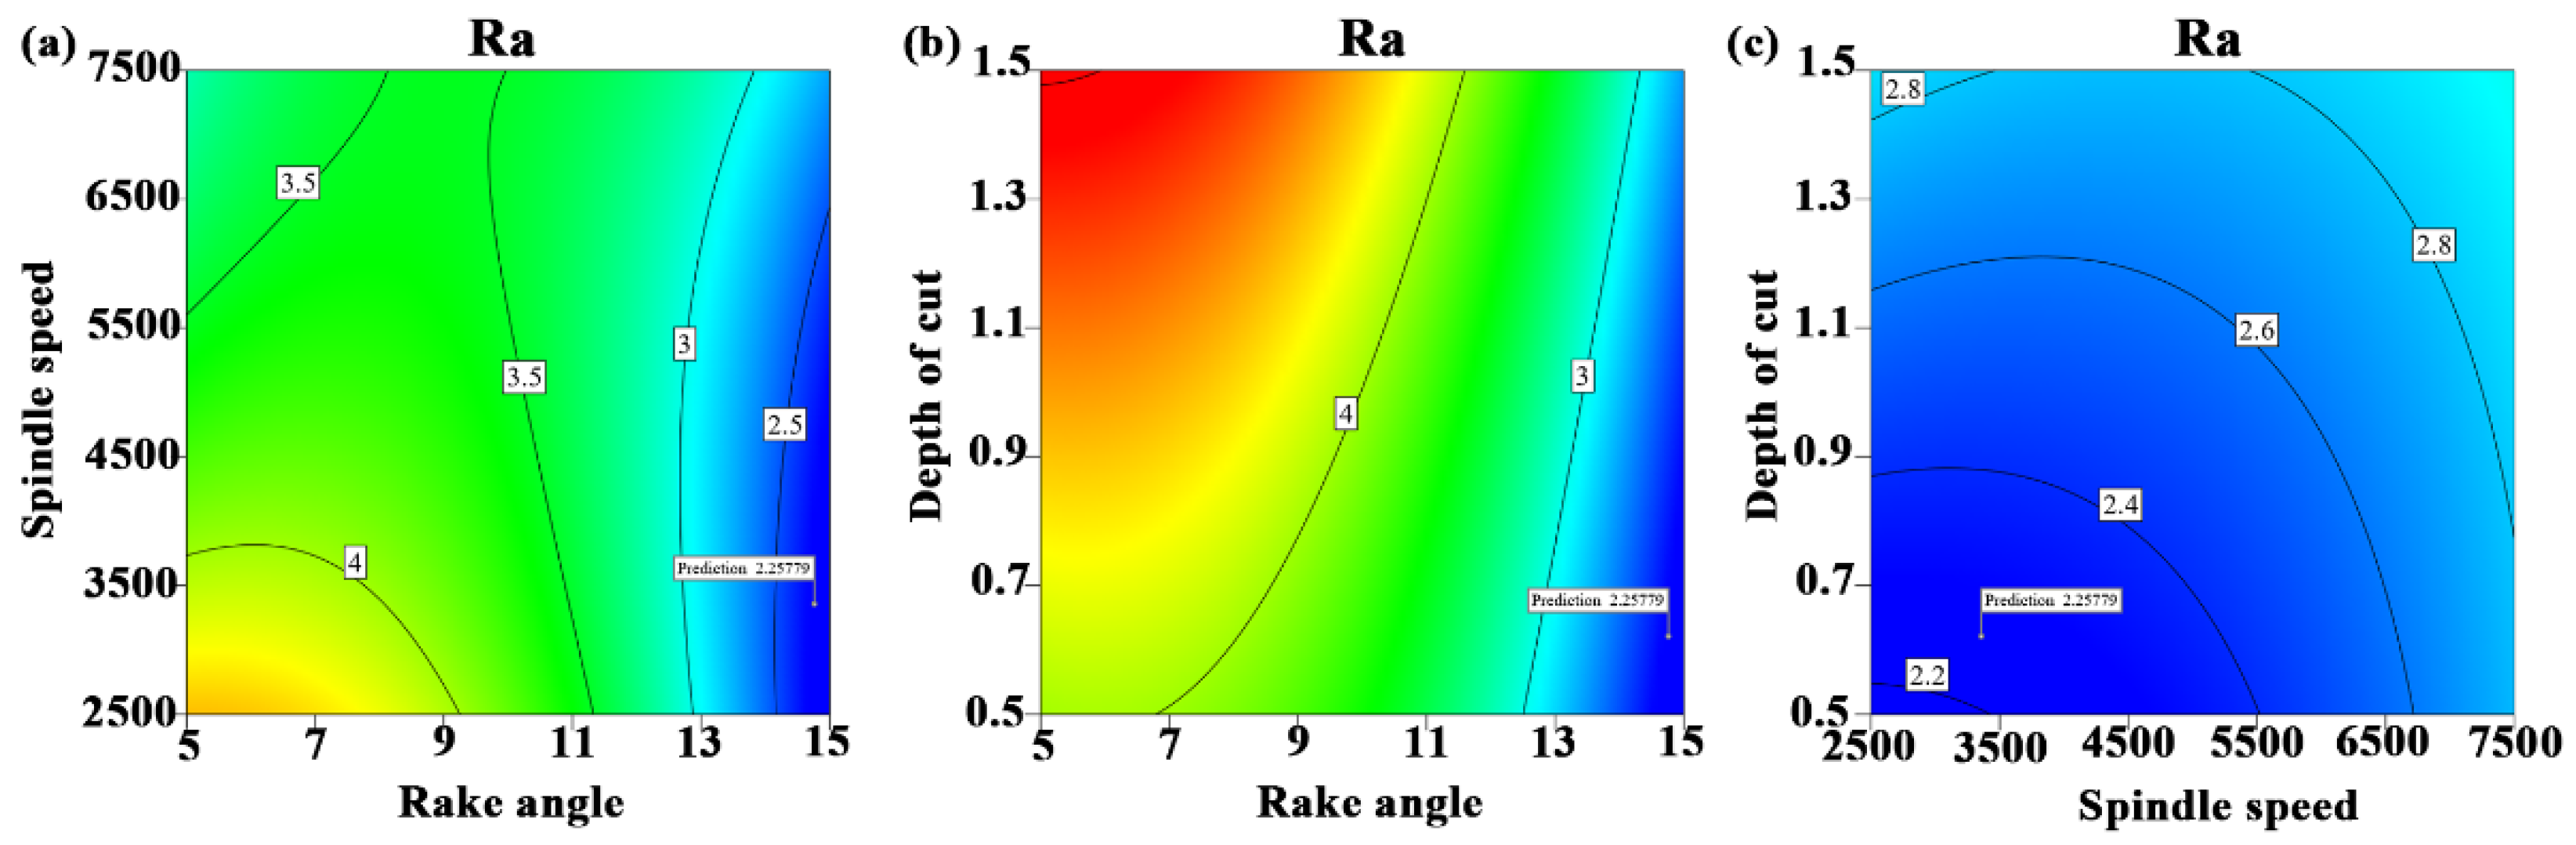
- With the optimal cutting quality as the goal, the optimal milling condition is a tool with a rake angle of 15°, a spindle speed of 3357 r/min and a depth of cut of 0.62 mm.
Author Contributions
Funding
Institutional Review Board Statement
Informed Consent Statement
Data Availability Statement
Conflicts of Interest
References
- Zeng, K.; Gauthier, D.; Lu, J.; Flamant, G. Parametric study and process optimization for solar pyrolysis of beech wood. Energy Convers. Manag. 2015, 106, 987–998. [Google Scholar] [CrossRef]
- Xiong, X.; Yue, X. Research and application progress of home intelligent manufacturing technologies in China. J. For. Eng. 2022, 7, 26–34. [Google Scholar]
- Zhang, F.; Wu, Z.; Ding, J.; Guo, X.; Cao, P.; Zhu, Z. Milling performance of stone-plastic composite with diamond cutters. Mater. Werkst. 2021, 52, 1307–1318. [Google Scholar] [CrossRef]
- Ren, J.; Xiong, X.; Zhao, J.; Fei, J.; Zhang, J. Research on standardized design of solid wood customized cabinet doors. J. For. Eng. 2022, 7, 197–204. [Google Scholar]
- Yang, X.; Xiong, X. Information collection and application of furniture production line using radio frequency identification technology. J. For. Eng. 2022, 7, 180–186. [Google Scholar]
- Kvietkova, M.; Gasparik, M.; Gaff, M. Effect of thermal treatment on surface quality of beech wood after plane milling. Bioresources 2015, 10, 4226–4238. [Google Scholar] [CrossRef]
- Kminiak, R.; Gasparik, M.; Kvietkova, M. The dependence of surface quality on tool wear of circular saw blades during transversal sawing of beech wood. Bioresources 2015, 10, 7123–7135. [Google Scholar] [CrossRef] [Green Version]
- Fotin, A.; Cismaru, I.; Cismaru, M.; Cosereanu, C.; Curtu, I. The influence of the profiled milling parameters to the quality of the surface. Ann. DAAAM Proc. 2010, 20, 413–414. [Google Scholar]
- Sütçü, A. Investigation of parameters affecting surface roughness in cnc routing operation on wooden EGP. Bioresources 2013, 8, 795–805. [Google Scholar] [CrossRef]
- Hu, W.; Liu, Y.; Li, S. Characterizing mode I fracture behaviors of wood using compact tension in selected system crack propagation. Forests 2021, 12, 1369. [Google Scholar] [CrossRef]
- Fang, L.; Zeng, J.; Zhang, X.; Wang, D. Effect of veneer initial moisture content on the performance of polyethylene film reinforced decorative veneer. Forests 2021, 12, 102. [Google Scholar] [CrossRef]
- Zhong, Z.W.; Hiziroglu, S.; Chan, C. Measurement of the surface roughness of wood based materials used in furniture manufacture. Measurement 2013, 46, 1482–1487. [Google Scholar] [CrossRef]
- Fang, L.; Zhang, X.; Zhang, Y.; Tang, Q. Manufacturing and interfacial bonding behavior of EVA film reinforced flexible decorative veneer. Wood Fiber Sci. 2021, 53, 194–205. [Google Scholar] [CrossRef]
- Li, R.; Yang, F.; Wang, X. Modeling and Predicting the Machined Surface Roughness and Milling Power in Scot’s Pine Helical Milling Process. Machines 2022, 10, 331. [Google Scholar] [CrossRef]
- Jin, D.; Wei, K. Machinability of Scots Pine during Peripheral Milling with Helical Cutters. Bioresources 2022, 16, 8172–8183. [Google Scholar] [CrossRef]
- Li, R.; He, C.; Xu, W.; Wang, X. Prediction of surface roughness of CO2 laser modified poplar wood via response surface methodology. Maderas-Cienc. Tecnol. 2022, 24. [Google Scholar]
- Li, R.; He, C.; Xu, W.; Wang, X. Modeling and optimizing the specific cutting energy of medium density fiberboard during the helical up-milling process. Wood Mater. Sci. Eng. 2022, 1–8. [Google Scholar] [CrossRef]
- Jang, J.S. ANFIS: Adaptive-network-based fuzzy inference system. IEEE Trans. Syst. Man Cybern. 1993, 23, 665–685. [Google Scholar] [CrossRef]
- Ren, J.; Xiong, X.; Tang, Y.; Zhao, J.; Fei, J.; Zhang, J. Furniture part family division of customized wooded cabinet doors using multi-attribute cross clustering. J. For. Eng. 2022, 7, 187–193. [Google Scholar]
- Shekarian, E.; Gholizadeh, A.A. Application of adaptive network based fuzzy inference system method in economic welfare. Knowl. Based Syst. 2013, 39, 151–158. [Google Scholar] [CrossRef]
- Karaboga, D.; Kaya, E. Adaptive network based fuzzy inference system (ANFIS) training approaches: A comprehensive survey. Artif. Intell. Rev. 2019, 52, 2263–2293. [Google Scholar] [CrossRef]
- Yang, H.; Hasanipanah, M.; Tahir, M.M.; Bui, D.T. Intelligent prediction of blasting-induced ground vibration using AN FIS optimized by GA and PSO. Nat. Resour. Res. 2020, 29, 739–750. [Google Scholar] [CrossRef]
- Zhou, J.; Li, C.; Arslan, C.A.; Hasanipanah, M.; Amnieh, H.B. Performance evaluation of hybrid FFA-ANFIS and GA-ANFIS models to predict particle size distribution of a muck-pile after blasting. Eng. Comput. 2021, 37, 265–274. [Google Scholar] [CrossRef]
- Mo, X.; Zhang, X.; Fang, L.; Zhang, Y. Research progress of wood-based panels made of thermoplastics as wood adhesives. Polymers 2021, 14, 98. [Google Scholar] [CrossRef] [PubMed]
- Nalbant, M.; Gokkaya, H.; Sur, G. Application of taguchi method in the optimization of cutting parameters for surface roughness in turning. Mater. Design 2007, 28, 1379–1385. [Google Scholar] [CrossRef]


| No. | Rake Angle | Clearance Angle | Coefficient of Thermal Expansion | Thermal Conductivity | Hardness |
|---|---|---|---|---|---|
| 1 | 5° | 8° | 1.18 × 10⁻⁶ | 560 W∙m−1K−1 | 8000 HV |
| 2 | 10° | 8° | |||
| 3 | 15° | 8° |
| Density | Modulus of Elasticity | Moisture Content | Bending Strength |
|---|---|---|---|
| 0.7 g/cm3 | 9681.3 MPa | 11.2% | 92.5 MPa |
| No. | Rake Angle (°) | Spindle Speed (r/min) | Depth of Cut (mm) | Ra (Actual) (μm) | Ra (RSM) (μm) | Pred. Error (RSM) | Ra (ANFIS) (μm) | Pred. Error (ANFIS) |
|---|---|---|---|---|---|---|---|---|
| 1 | 5 | 2500 | 0.5 | 4.058 | 4.293 | 5.47% | 4.047 | −0.28% |
| 2 | 5 | 5000 | 0.5 | 3.797 | 3.552 | −6.98% | 3.802 | 0.14% |
| 3 | 5 | 7500 | 0.5 | 3.206 | 3.084 | −3.96% | 3.225 | 0.58% |
| 4 | 5 | 2500 | 1.0 | 4.604 | 4.813 | 4.34% | 4.611 | 0.15% |
| 5 | 5 | 5000 | 1.0 | 4.341 | 3.954 | −9.79% | 4.339 | −0.05% |
| 6 | 5 | 7500 | 1.0 | 3.377 | 3.367 | −0.30% | 3.394 | 0.51% |
| 7 | 5 | 2500 | 1.5 | 4.927 | 5.391 | 8.61% | 4.924 | −0.05% |
| 8 | 5 | 5000 | 1.5 | 4.368 | 4.414 | 1.04% | 4.357 | −0.26% |
| 9 | 5 | 7500 | 1.5 | 4.456 | 3.709 | −0.14% | 4.429 | −0.61% |
| 10 | 10 | 2500 | 0.5 | 3.711 | 3.747 | 0.96% | 3.706 | −0.16% |
| 11 | 10 | 5000 | 0.5 | 3.231 | 3.468 | 6.83% | 3.880 | 20.09% |
| 12 | 10 | 7500 | 0.5 | 3.206 | 3.461 | 7.37% | 3.241 | 1.08% |
| 13 | 10 | 2500 | 1.0 | 3.854 | 4.162 | 7.40% | 3.854 | 0.01% |
| 14 | 10 | 5000 | 1.0 | 3.765 | 3.765 | 0.00% | 3.779 | 0.36% |
| 15 | 10 | 7500 | 1.0 | 3.447 | 3.639 | 5.28% | 3.809 | 10.51% |
| 16 | 10 | 2500 | 1.5 | 4.891 | 4.636 | −5.50% | 4.887 | −0.08% |
| 17 | 10 | 5000 | 1.5 | 3.951 | 4.121 | 4.13% | 4.593 | 16.25% |
| 18 | 10 | 7500 | 1.5 | 3.913 | 3.877 | −0.93% | 3.921 | 0.21% |
| 19 | 15 | 2500 | 0.5 | 2.793 | 2.066 | −35.19% | 2.402 | −14.00% |
| 20 | 15 | 5000 | 0.5 | 2.294 | 2.248 | −2.05% | 2.288 | −0.28% |
| 21 | 15 | 7500 | 0.5 | 2.28 | 2.702 | 15.62% | 3.218 | 41.12% |
| 22 | 15 | 2500 | 1.0 | 2.366 | 2.376 | 0.42% | 2.368 | 0.08% |
| 23 | 15 | 5000 | 1.0 | 3.652 | 2.440 | −49.67% | 3.037 | −16.83% |
| 24 | 15 | 7500 | 1.0 | 2.984 | 2.776 | −7.49% | 2.986 | 0.08% |
| 25 | 15 | 2500 | 1.5 | 4.033 | 2.745 | −46.92% | 2.831 | −29.82% |
| 26 | 15 | 5000 | 1.5 | 2.446 | 2.691 | 9.10% | 2.453 | 0.30% |
| 27 | 15 | 7500 | 1.5 | 2.984 | 2.908 | −2.61% | 3.524 | 18.09% |
| Source | Std. Dev. | R2 | Adjusted R2 | |
|---|---|---|---|---|
| Linear | 0.46 | 0.69 | 0.62 | Suggested |
| 2FI | 0.42 | 0.80 | 0.68 | / |
| Quadratic | 0.22 | 0.96 | 0.91 | Suggested |
| Model | Std. Dev. | Mean | C.V.% | R2 | Adjusted-R2 | Adeq Precision |
|---|---|---|---|---|---|---|
| Ra | 0.2216 | 3.58 | 6.2 | 0.9604 | 0.9095 | 15.0924 |
| Source | Sum of Squares | df | Mean Square | F-Value | p-Value | |
|---|---|---|---|---|---|---|
| Model | 8.34 | 9 | 0.9267 | 18.88 | 0.0004 | Significant |
| A-α | 4.58 | 1 | 4.58 | 93.38 | <0.0001 | Significant |
| B-n | 0.5471 | 1 | 0.5471 | 11.14 | 0.0125 | Significant |
| C-ap | 0.8515 | 1 | 0.8515 | 17.34 | 0.0042 | Significant |
| AB | 0.851 | 1 | 0.851 | 17.33 | 0.0042 | Significant |
| AC | 0.0439 | 1 | 0.0439 | 0.894 | 0.3759 | Insignificant |
| BC | 0.0559 | 1 | 0.0559 | 1.14 | 0.3212 | Insignificant |
| A2 | 1.36 | 1 | 1.36 | 27.68 | 0.0012 | Significant |
| B2 | 0.0777 | 1 | 0.0777 | 1.58 | 0.2486 | Insignificant |
| C2 | 0.0036 | 1 | 0.0036 | 0.074 | 0.7934 | Insignificant |
| Pure Error | 0 | 4 | 0 | |||
| Total | 8.68 | 16 |
| Tests | Rake Angle (°) | Spindle Speed (r/min) | Depth of Cut (mm) | Surface Roughness (μm) |
|---|---|---|---|---|
| Prediction | 15 | 3357 | 0.62 | 2.258 |
| Verification | 15 | 3357 | 0.62 | 2.383 |
| Error rate | \ | \ | \ | −5.24% |
Publisher’s Note: MDPI stays neutral with regard to jurisdictional claims in published maps and institutional affiliations. |
© 2022 by the authors. Licensee MDPI, Basel, Switzerland. This article is an open access article distributed under the terms and conditions of the Creative Commons Attribution (CC BY) license (https://creativecommons.org/licenses/by/4.0/).
Share and Cite
Zhu, Z.; Jin, D.; Wu, Z.; Xu, W.; Yu, Y.; Guo, X.; Wang, X. Assessment of Surface Roughness in Milling of Beech Using a Response Surface Methodology and an Adaptive Network-Based Fuzzy Inference System. Machines 2022, 10, 567. https://doi.org/10.3390/machines10070567
Zhu Z, Jin D, Wu Z, Xu W, Yu Y, Guo X, Wang X. Assessment of Surface Roughness in Milling of Beech Using a Response Surface Methodology and an Adaptive Network-Based Fuzzy Inference System. Machines. 2022; 10(7):567. https://doi.org/10.3390/machines10070567
Chicago/Turabian StyleZhu, Zhaolong, Dong Jin, Zhanwen Wu, Wei Xu, Yingyue Yu, Xiaolei Guo, and Xiaodong (Alice) Wang. 2022. "Assessment of Surface Roughness in Milling of Beech Using a Response Surface Methodology and an Adaptive Network-Based Fuzzy Inference System" Machines 10, no. 7: 567. https://doi.org/10.3390/machines10070567