1. Introduction
As one of the most important components in transmission, gears are widely used in various mechanical equipment. They are conducive to high efficiency, smooth movement, and compact structure in the transmission process. With the rapid development of the high-end manufacturing industry, the demand for high-precision gears has increased. Therefore, it is more necessary to accurately measure important parameters, such as the gear tooth profile, pitch, and helix angle. Gear precision measurement methods are divided into contact type and non-contact type. To date, contact detection is the most widely used. It mainly contains the CNC (Computerized Numerical Control) three-coordinate measurement and the gear single-mesh instrument measurement, while the non-contact measurement includes laser measurement, holographic image measurement, and speckle interferometry [
1]. Compared with contact measurement, the non-contact measurement method achieves a higher efficiency, accuracy, and wider application scope. For this reason, more and more research work has been put into the non-contact measurement field of gears.
Shi et al. established digital images of the upper and lower ends of a helical gear based on the holographic influence system and processed the image morphologically to obtain accurate helical angle parameters of the helical gear more quickly [
2]. Song et al. used the dual CMOS (Complementary Metal Oxide Semiconductor) camera to collect image information of the end and side of the gear, and applied computer image processing to obtain various parameters of the gear to improve the reliability of non-contact measurement [
3]. Xu et al. employed visual image sensors to capture the position of gears in the gearbox, and then use laser displacement sensors to precisely measure the gear chamfering [
4]. This method does not need to design specific detection fixtures, which can effectively improve the detection efficiency and achieve automatic measurement. However, there are still some drawbacks in the analysis and expression of data acquisition accuracy and deviation results. Song et al. put forward a non-contact detection method of gear tooth accuracy based on the laser displacement sensor [
5]. However, this method cannot realize the horizontal movement of the laser sensor. The gear to be measured needs to be calibrated manually, which will directly affect the reliability and efficiency of data collection [
6]. Marc Pillarz et al. experimented with a triangular measuring sensor and confocal color difference sensor to analyze the effect of various uncertainty errors in the data acquisition process [
7]. Su et al. proved through experiments that the specific influence of the inclination and roughness of gear surface on the acquisition accuracy of the laser triangulation method, and put forward a linear interpolation correction method based on spot distribution [
8]. However, the calculation process of this method is very cumbersome and requires a great deal of data analysis and calculation. Li et al. improved the laser triangulation method by adjusting the incident laser angle to reduce the inclination error in the data acquisition process [
9]. This method needs to be calculated according to the range of the inclination angle of the surface to be measured to select the optimum laser incident angle. Therefore, it is tedious of the preparation process in the early stage of measurement.
In terms of the calculation and expression of gear deviation, Shi et al. carried out a zonal non-contact measurement of gears and obtained the error curve and cross-correlation function of the whole gear to evaluate the gear deviation comprehensively [
10]. However, this result can only be expressed comprehensively for the deviations in a particular region, and the representation is still limited to the graphical form. To date, the optical metrology equipment of Klingelnberg can also measure the gears in an overall way. However, the results of measurement and analysis are still limited to a certain section of the gear, and the overall situation of the gear deviations cannot be fully expressed.
Aiming at the current research deficiencies, this paper proposes a method for the non-contact overall measurement of the deviation of important parameters, such as the tooth profile, pitch, and helix angle of gears. In this method, the tooth surface is measured by a laser displacement sensor and the inclination error is compensated directly by algorithm. Compared with using offset or tilt measurements to reduce error, this method is more convenient and can effectively improve the accuracy of measurement data [
11]. Then, based on the principle of B-spline surface fitting, the actual tooth profile surface and its normal vector model are established, and various deviation values of any point on the gear are obtained. Finally, the deviation points are refined by the Newton difference method, and the overall deviation surface model and corresponding color map are established. Compared with the current gear deviation analysis method generally based on a specific section [
12], this method for gear analysis as a whole obtains more comprehensive data. The deviation value at any point on the tooth surface can also be obtained to make the deviation evaluation more comprehensive and accurate. In addition, the software for measuring motion control and overall error analysis is developed to realize the precise movement of laser probes in space and to realize automatic centering and data acquisition according to the gear to be measured. The accurate measurement and visual expression of the multiple deviations on the full tooth surface of the gear are realized. The measurement results are accurate and reliable, and the visual expression results are clear.
3. Error Compensation and 3D Coordinate Transformation of the Collected Data
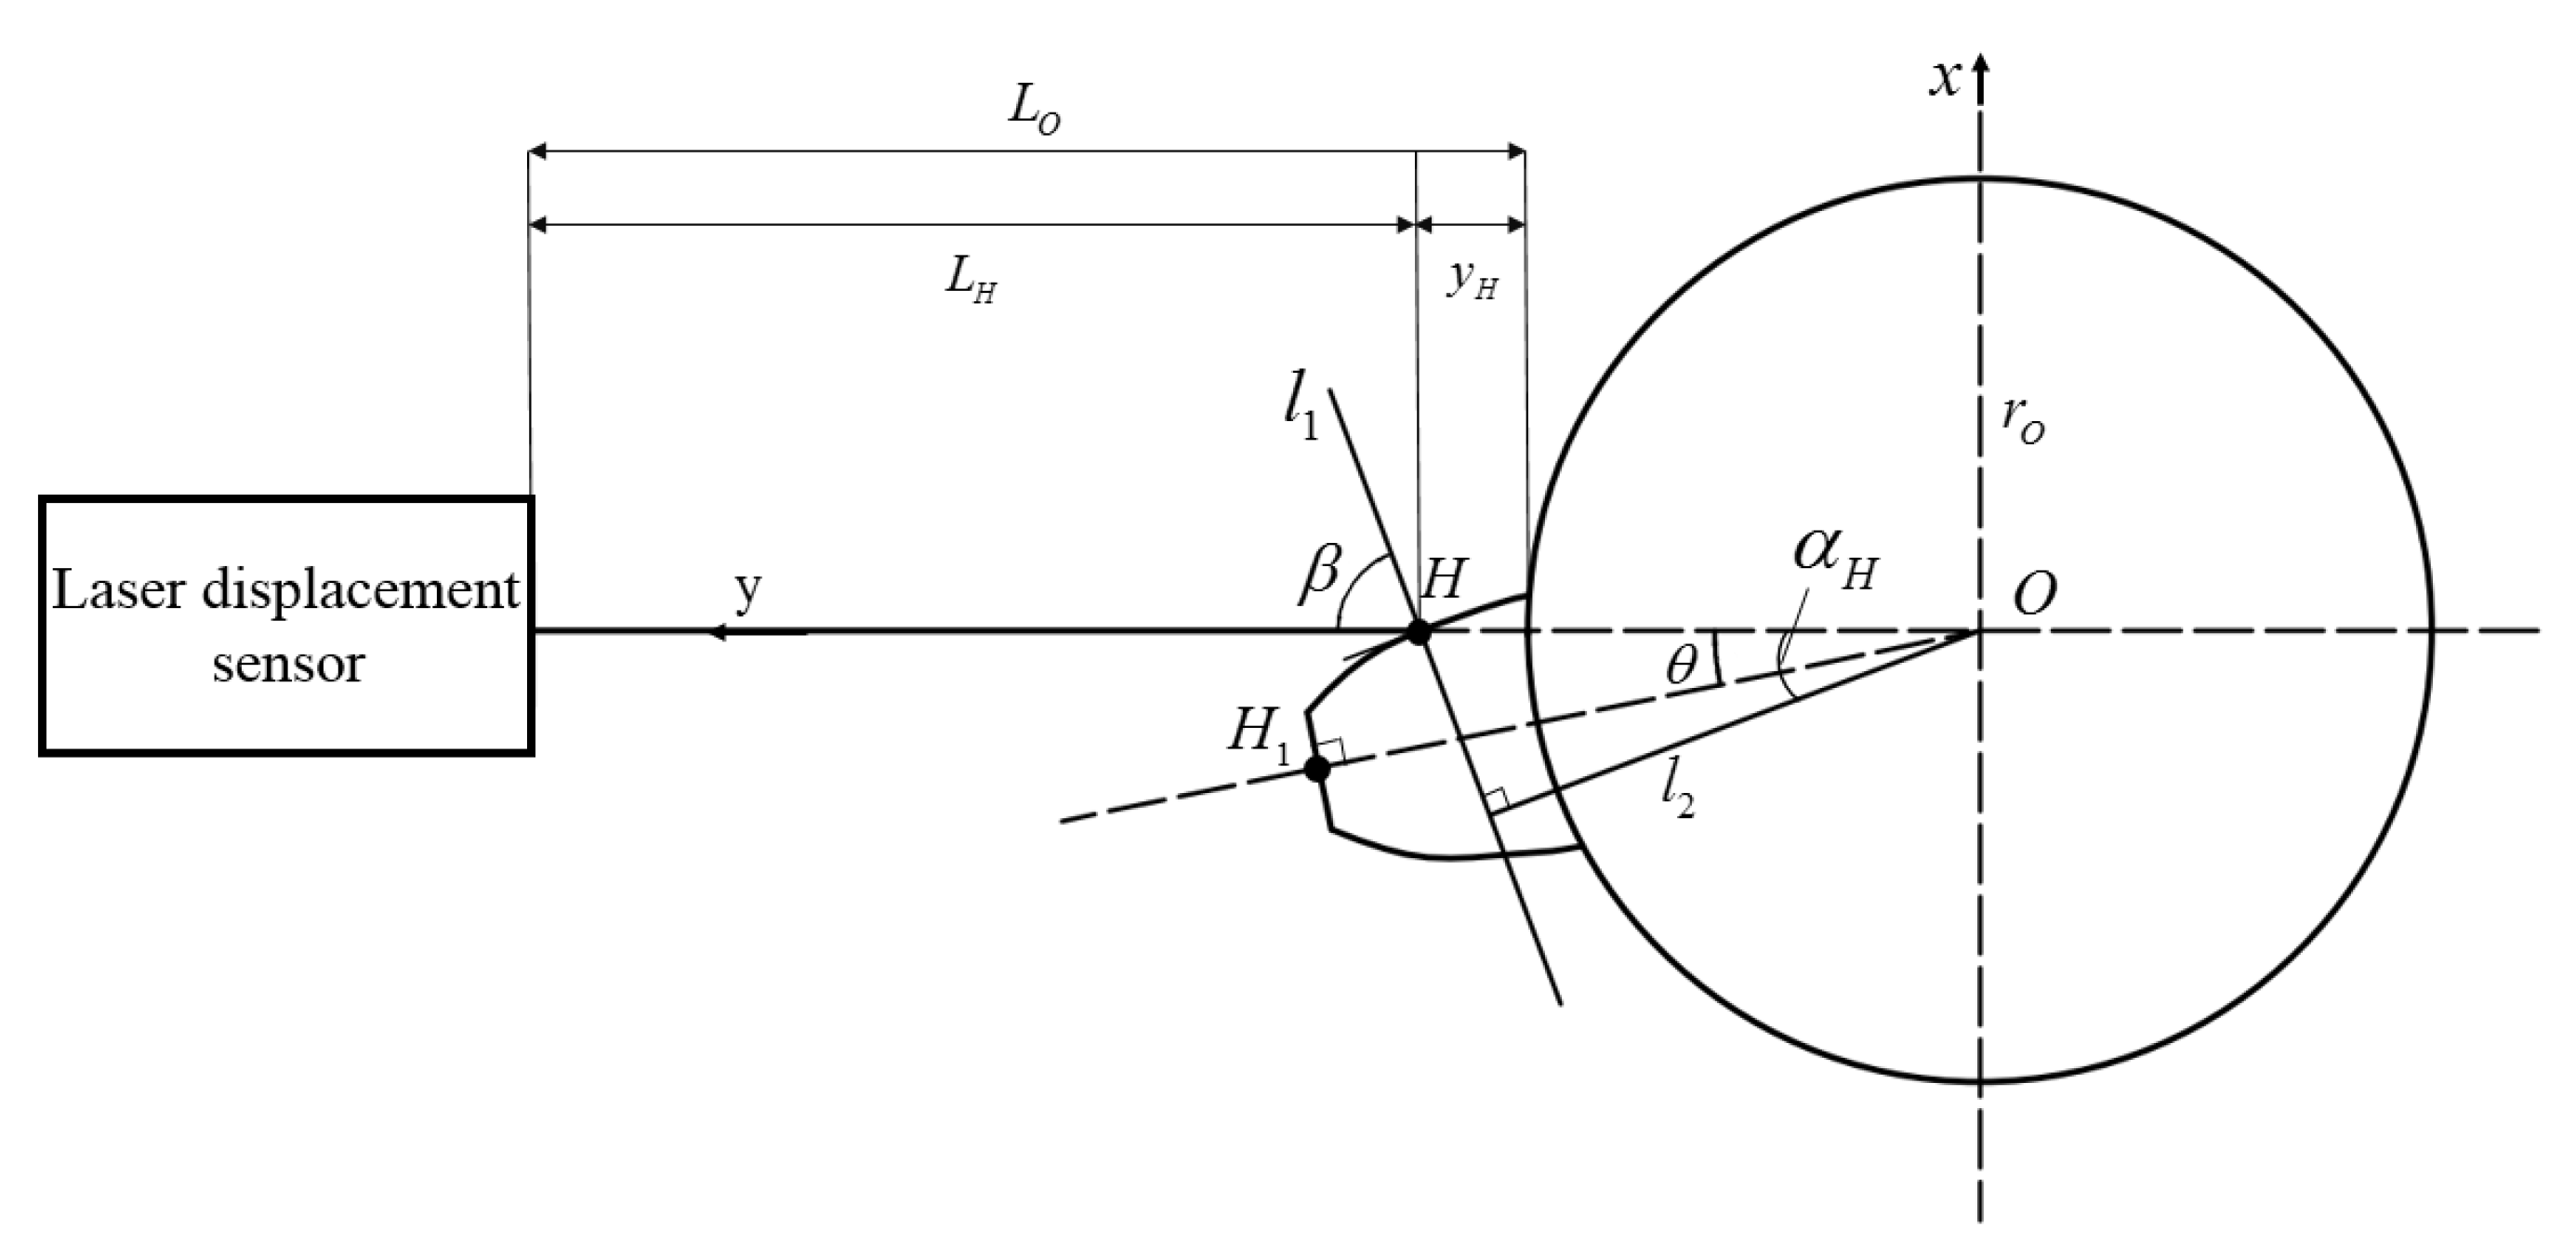
As shown in
Figure 3,
is any point on the involute of the gear,
is the center of the root circle,
is the radius of the root circle, and
is the pressure angle at point H on the tooth profile.
is the starting point of the laser measurement,
is the angle of gear rotation during the measurement.
is the normal line at the point
on the involute, and
is the angle between the incident laser and the normal
.
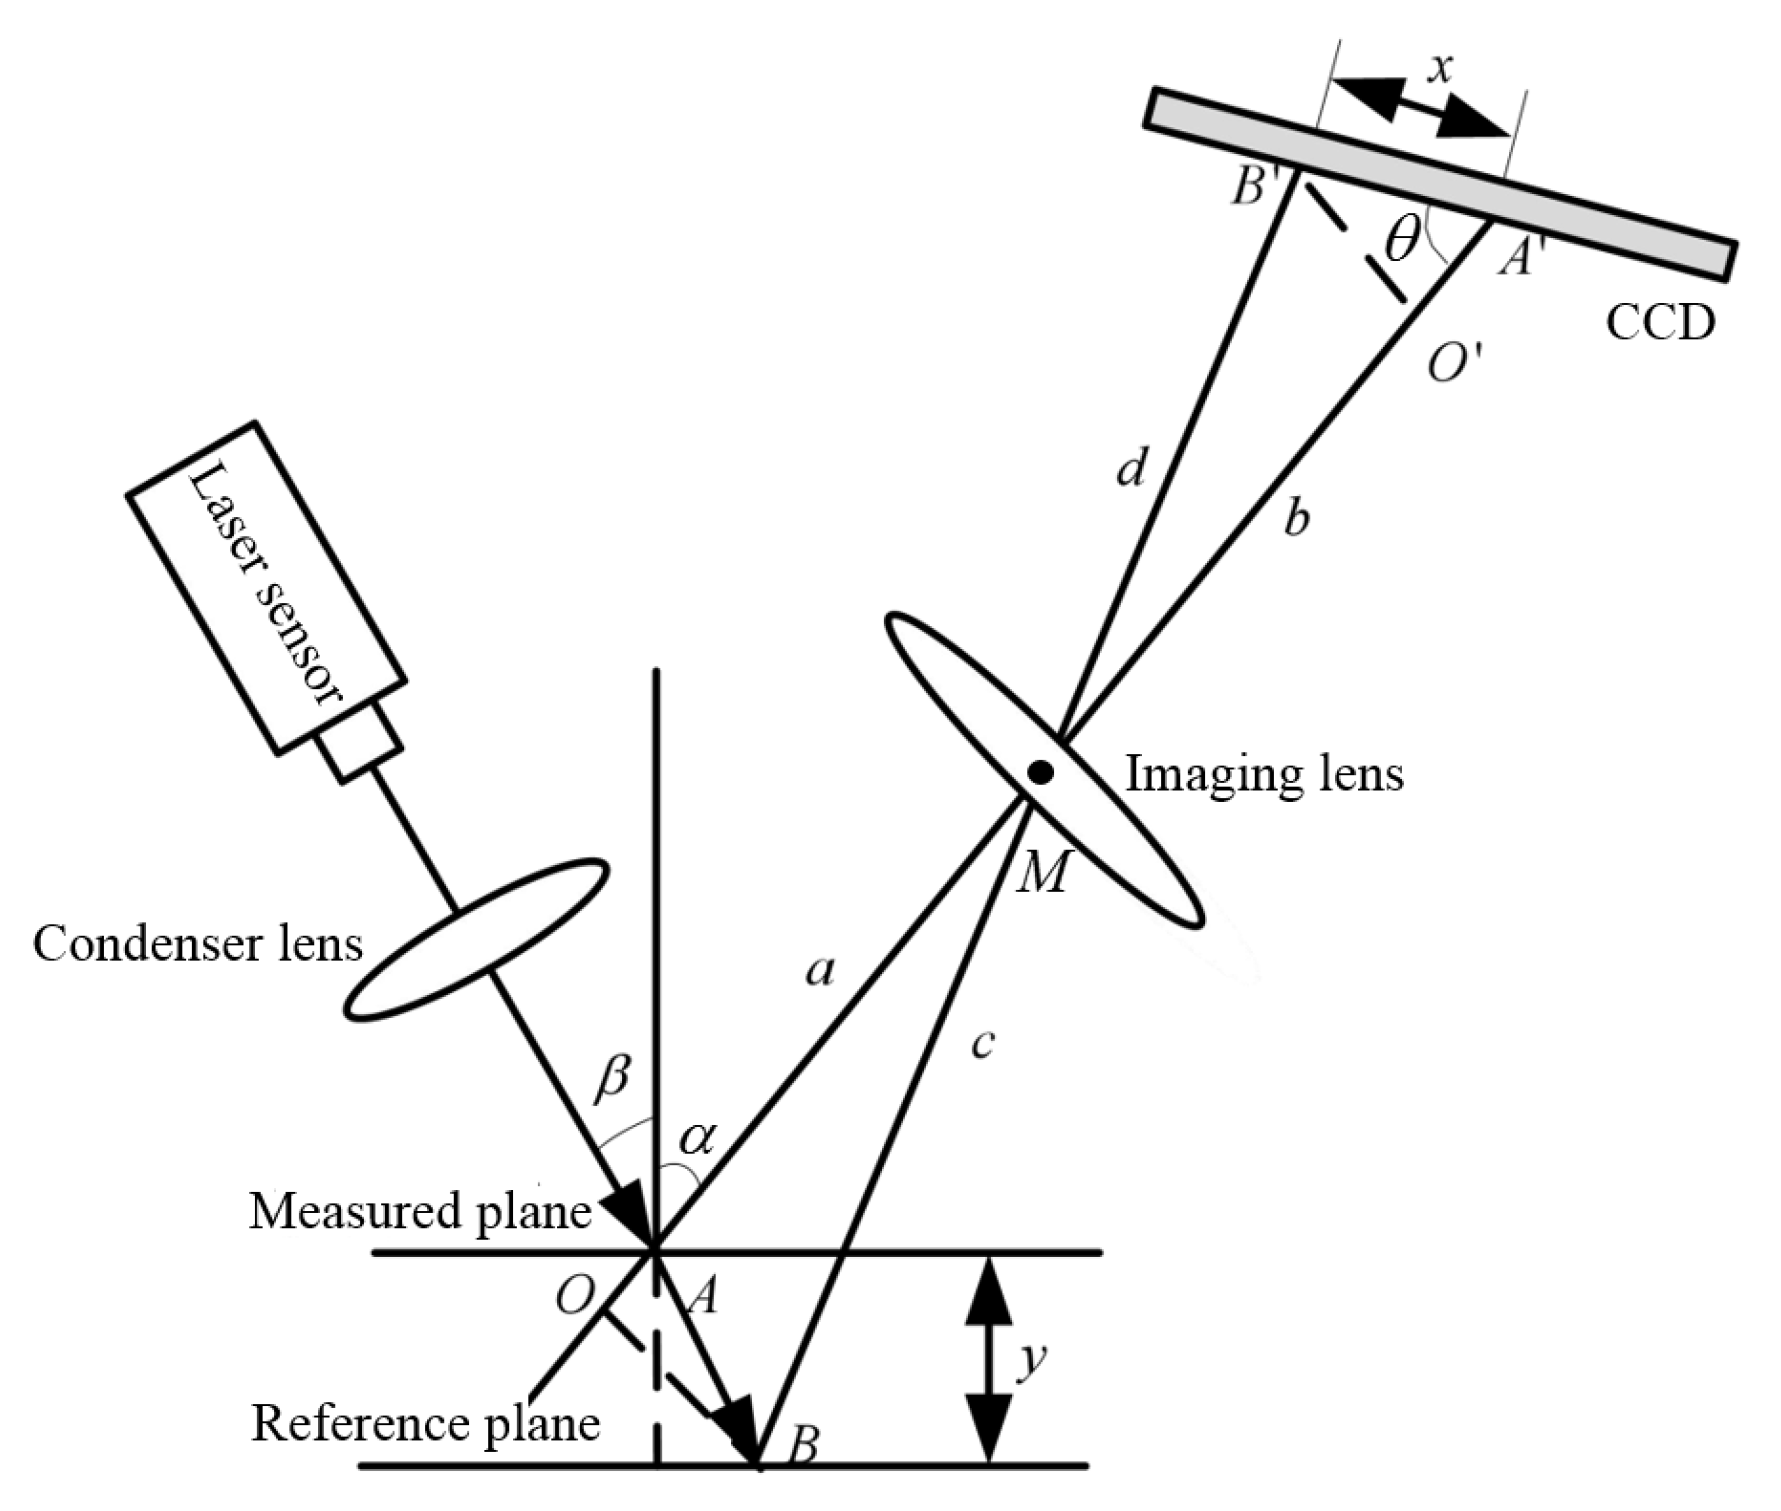
During the data acquisition, there is a certain angle between the incident laser and the normal line of the tooth profile surface, resulting in some deviation in the center of the mass between the actual spot and the ideal spot. An inclination error will occur and affect data acquisition accuracy [
14]. The relationship between the inclination error
and angle
during the laser probe acquisition can be deduced by consulting the relevant data [
8]. Its equation expression is as follows:
In the formula, is the relative displacement of the measured surface, is the angle between the incident laser and the normal line of the measuring plane, is the angle between the reflected laser, is the actual working distance of the laser probe, and is the radius of the imaging lens.
According to the involute structure equation, the normal equation of
at any point on the involute can be deduced as follows:
From
Figure 3, we can see that the incident angle of the laser is fixed and always coincides with the X-axis, which means
, and that the angle of error of
at point
can be obtained by introducing it into the error formula of the tilt angle (1). After compensating for the data
collected at point H, the relative displacement
at point H can be obtained, that is,
.
To facilitate the analysis of gear deviations, the measured relative displacement data need to be converted into corresponding points in a three-dimensional space coordinate system. As can be seen from
Figure 3,
is the starting point for measurement, and the distance from
to the center of the gear wheel is
, whose coordinates can be expressed as
.
is the vertical distance from the laser point
on the tooth profile surface to the lower end face of the gear wheel. The point
is the laser spot on the profile of the gear after rotating the o angle from the initial measuring point, and the distance from the point
to the gear center is
. Therefore, the three-dimensional coordinate of any point,
, on the tooth profile can be expressed as
.
4. Calculation and Expression Principle of the Overall Deviation
4.1. The Establishment of the Real 3D Surface Model of the Gear
Based on the transformation method of the three-dimensional space coordinate point set described in the previous section, this paper proposes to use the principle of non-uniform rational B-splines (NURBSs) to perform cubic surface fitting on the transformed tooth profile coordinate points. This method allows for an optimal tooth surface function model based on a large number of collected tooth profile coordinate points, and then establishes the actual surface model of the gear according to the optimal function. The generated gear surface can accurately approximate the real gear surface. According to the actual surface model, the tooth profile curve on any section of the gear and its corresponding deviations can be obtained. The specific process of establishing the actual surface model of the gear is as follows.
The recurrence formula of the DeBoolean–Coxsky function
of the
k-th B-spline is as follows [
15]:
In the above formula,
is the node on the B-spline curve,
is the degree of fitting the curve, and
is the vector in the direction of the node
parameter. To improve the smoothness of the final fitting curve and ensure the approximation degree between the characteristic polygon and the real curve, this paper selects the most widely used 3-order B-spline basis function
as the recursive basis for curve fitting [
16]. According to the definition of the 3 × 3 order non-uniform rational B-spline surface [
17], it is easy to know that the general rational basis function of the real tooth profile surface can be expressed as:
m and
n are the times of fitting B-spline curves in the direction of parameter
and
, respectively, and
.
Based on the expression (4), the three-dimensional coordinate form of the acquisition point on the tooth profile needs to be converted into the form of the three-dimensional data point matrix, that is:
Formulas and in Formula (5) represent the row and column serial numbers of the data point matrix, respectively. By transforming the collected data into a matrix form through Formula (5) and carrying it into Formula (4) for recursive calculation and analysis, the functional model of the actual gear surface can be obtained.
4.2. Analysis of the Tooth Profile Deviation on a Single Section
According to the actual gear surface model established in the previous section, the tooth profile curve on any section above can be obtained, and the corresponding deviations can be obtained. The specific calculation principle is as follows:
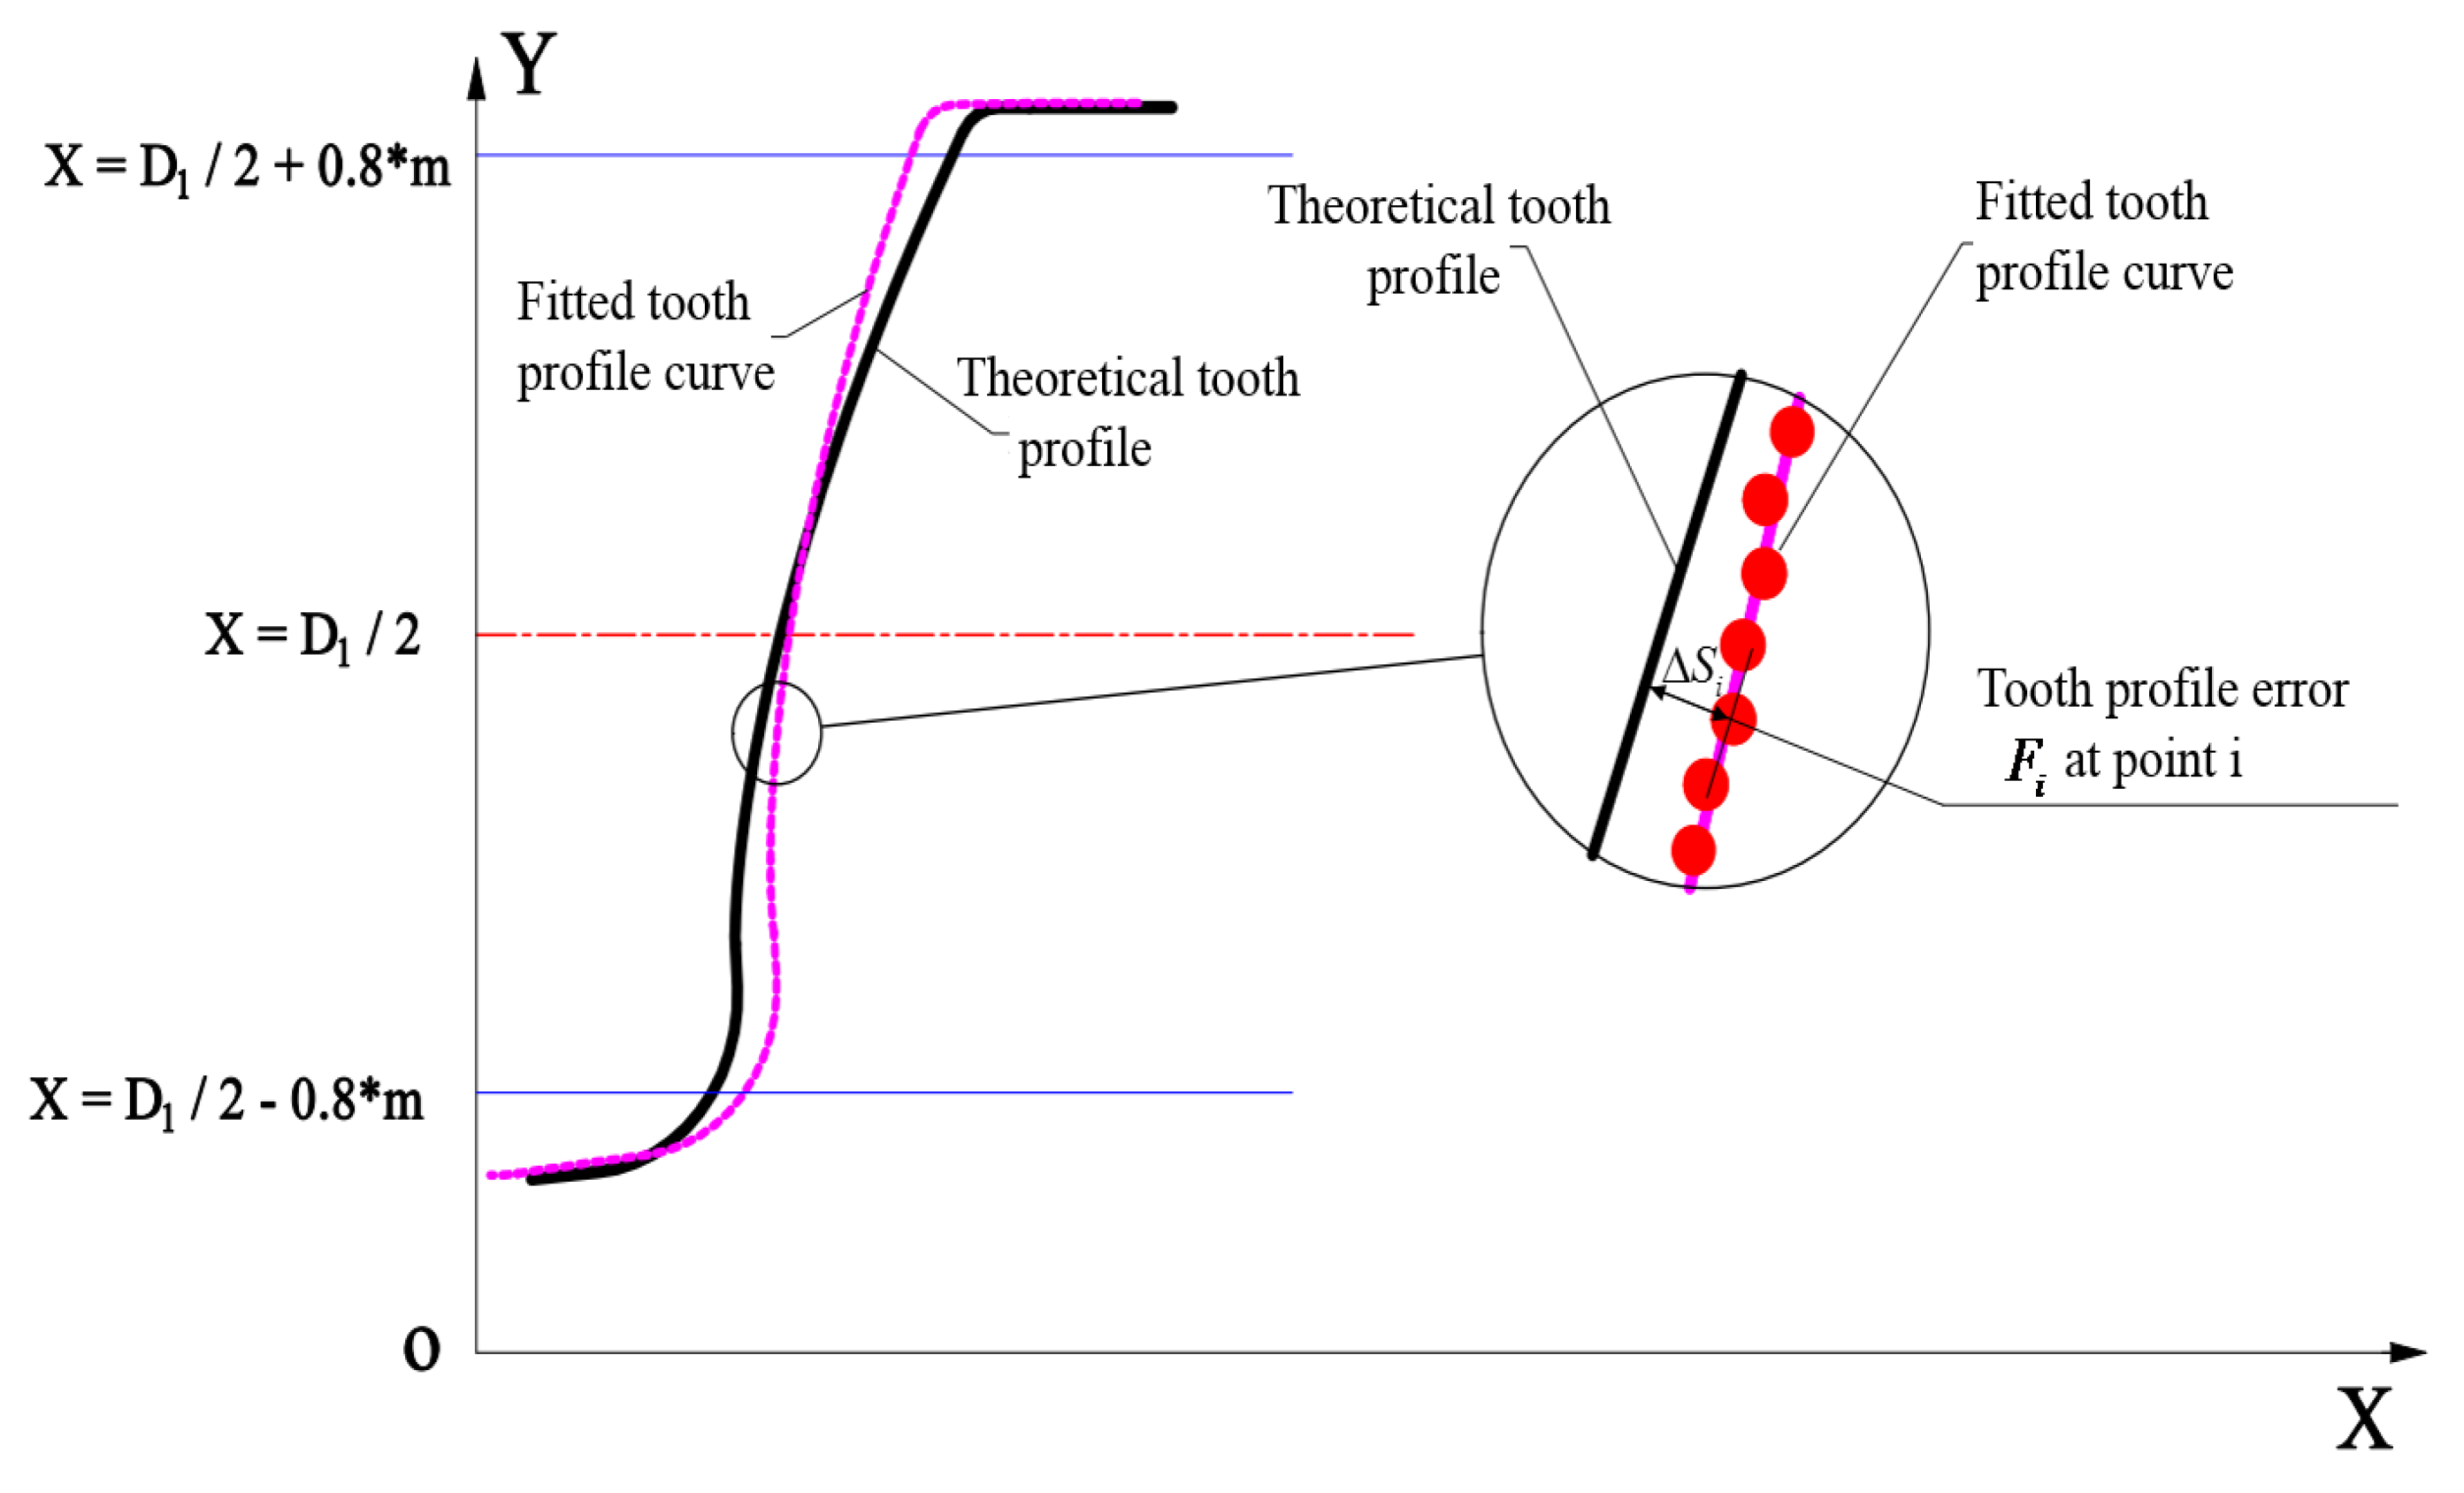
Define the known tooth profile deviation as the relative deviation between the actual and theoretical tooth profiles [
18]. The deviation is parallel to the end plane of the gear and perpendicular to the theoretical tooth profile involute of the plane in which it is located.
Figure 4 is a schematic diagram of the tooth profile deviation calculation on a single section. As shown in the figure, the tooth profile deviation
at the point,
i-th, on the actual tooth profile curve is the normal distance
to the theoretical tooth profile curve. However, in the actual measurement process, some defects on the gear surface cause the normal distance, s, at the corresponding acquisition point to easily be constant. Therefore, the singular points in the data need to be removed before the deviation calculation and replaced by the arithmetic average of the five points before and after the point. Thereafter, the total deviation within the effective length of the tooth profile curve is:
However, the distance between the two adjacent data acquisition points,
and
, on the actual tooth profile is very small, so the tooth profile curve formed by the two adjacent data acquisition points can be approximated as a small line segment connecting the two points. Assuming that the intersection point between the normal line at any point,
, on the theoretical tooth profile and the actual small line segment is
, then the tooth profile deviation,
, at the point
is the distance,
, from point
to point
, that is,
. The normal equation at any point on the tooth profile derived from the combined equation (2) can also be used to derive the coordinate equation of the intersection point, h, on the small line segment as follows:
Therefore, the tooth profile deviation at the H point on the actual tooth profile can be expressed as:
When the intersection point, , on the actual tooth profile is outside the ideal profile curve, the tooth profile deviation at is positive, and when is inside the ideal profile, the tooth profile deviation is negative.
Therefore, the total tooth profile deviation on any section can be expressed as:
4.3. Overall Deviation Analysis of the Tooth Profile
To obtain a more accurate overall deviation of the gear profile, the coordinate points of the tooth profile on a single section need to be refined by Newton’s cubic interpolation principle [
19]. Select four adjacent tooth profile coordinate points,
in turn, and perform the interpolation according to the differential evolution algorithm. The difference quotient result can be expressed as:
According to the definition of the Newton interpolation [
20], the interpolation expression of the tooth profile coordinate point is:
In formula (11), is the normal distance from point to the theoretical tooth profile, and then the iterative calculation is performed with as the interpolation search range condition, and the Newton cubic interpolation of the tooth profile point can be realized.
Calculate the tooth profile deviation of all the interpolated tooth profile coordinate points according to formula (8), and then perform 3 × 3 B-spline surface fitting for the tooth profile deviation on all the sections according to formula (4). The fitting surface model of the overall tooth profile deviation of the gear can be obtained, and the overall tooth profile deviation can be expressed on the actual gear surface in the form of color mapping by color calibration according to the size of the tooth profile deviation.
4.4. Analysis of the Pitch Deviation on a Single Section
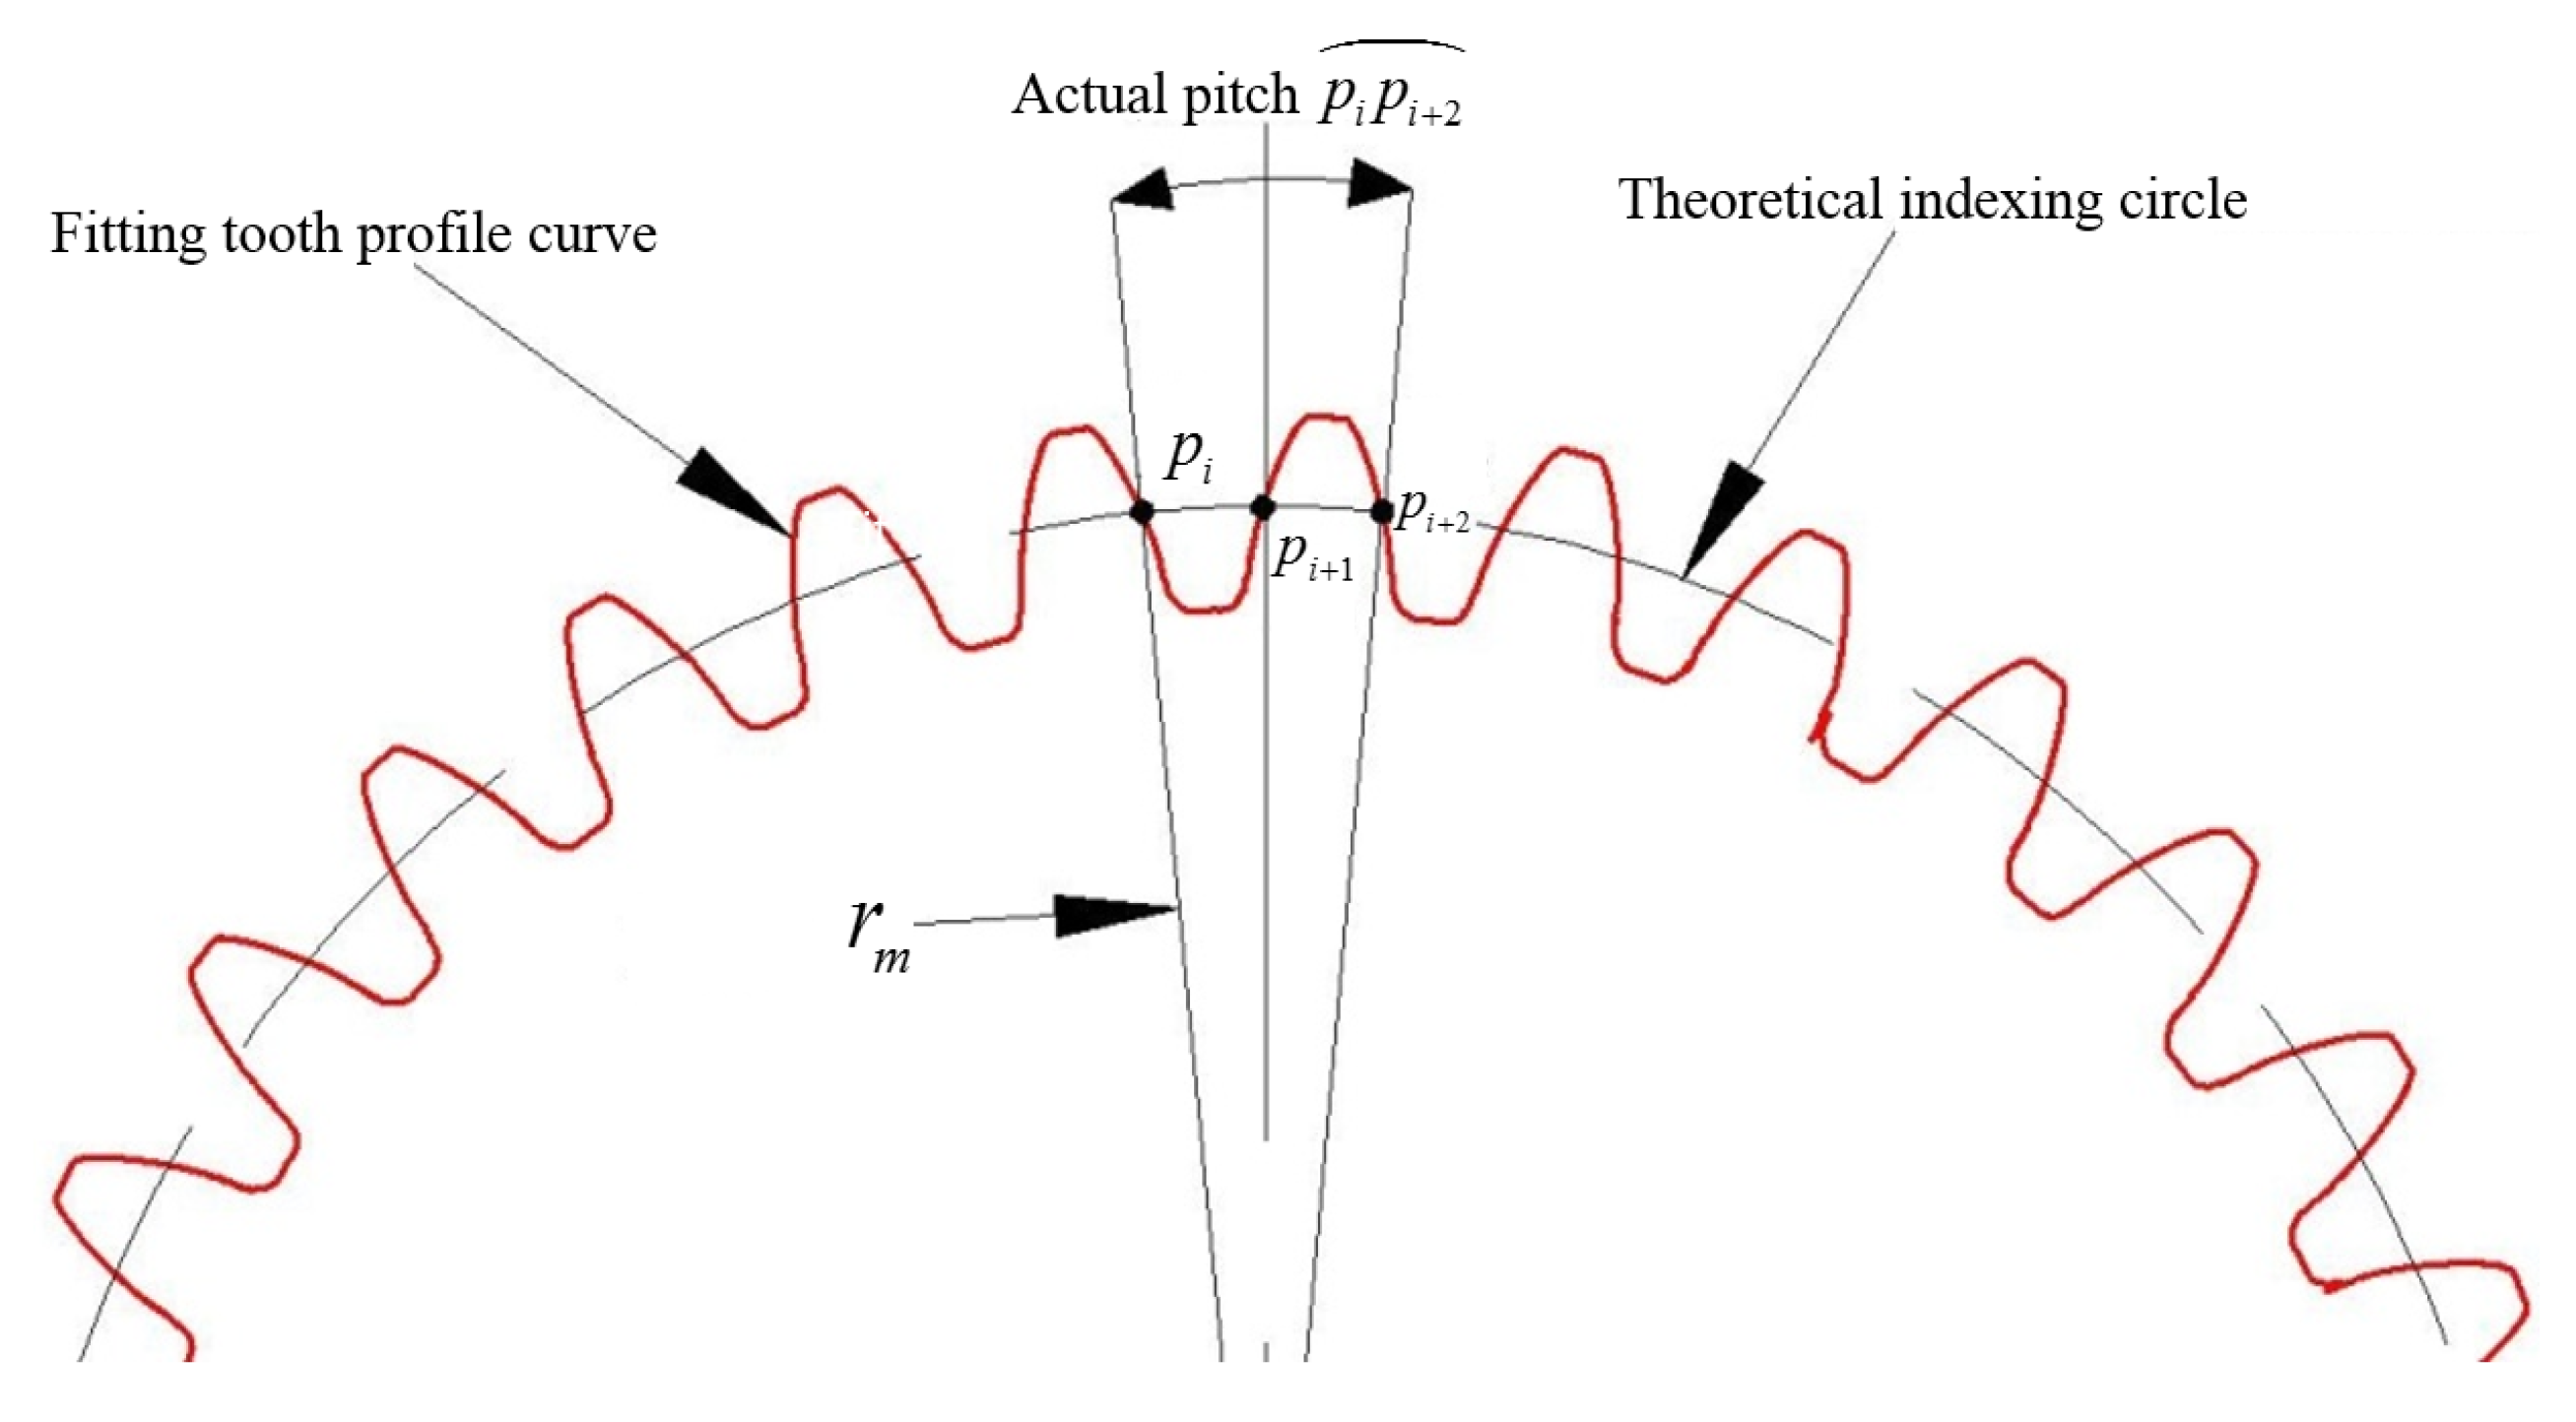
Pitch deviation refers to the difference between the actual pitch and the nominal pitch of one gear tooth at the indexing circle [
21]. Based on the actual curve expression of any section of the previous gear, the coordinate,
, of any intersection point of the actual profile curve at the indexing circle can be obtained by solving it in conjunction with the theoretical indexing circle equation. As shown in
Figure 5, point
and point
are any two adjacent points on the same side profile curve and the theoretical indexing circle radius is
, then the actual pitch of any two adjacent profiles on this section can be expressed as:
Given that the theoretical pitch deviation of the measured gear is
, the pitch deviation of the gear at any two adjacent tooth profiles can be expressed as:
4.5. Overall Deviation Analysis of Pitch
Similar to the overall error analysis of the tooth profile, all coordinate points need to be refined by Newton’s cubic interpolation principle before calculating the deviation of the tooth pitch. From the definition of the pitch deviation, all pitch errors on a single section can be obtained by finding the intersection of all the actual curves of the tooth profile and the theoretical indexing circle. Therefore, to simplify the data processing process and improve the efficiency of pitch deviation analysis, only four adjacent tooth profile data acquisition points that most closely approximate the theoretical indexing circle are selected as the Newton interpolation intervals on each tooth profile curve, and the four data points selected are . The four selected tooth profile points must be on both sides of the theoretical indexing circle. The expression of interpolated tooth profile curve is the same as that of point P of the intersection of indexing circle (11), where the range condition becomes , is the theoretical radius of the indexing circle in the formula above, and is also iterated as the range condition to find the optimal interpolation point.
By this method, a more accurate pitch deviation and cumulative pitch deviation can be obtained. After fitting the cumulative deviation of the pitch on all the tooth profile sections into a surface model and calibrating it in the actual model of the gear in the form of color mapping. Finally, the color mapping of the overall deviation of the gear pitch can be obtained.
4.6. The Helix Angle Calculation for Any Tooth Profile
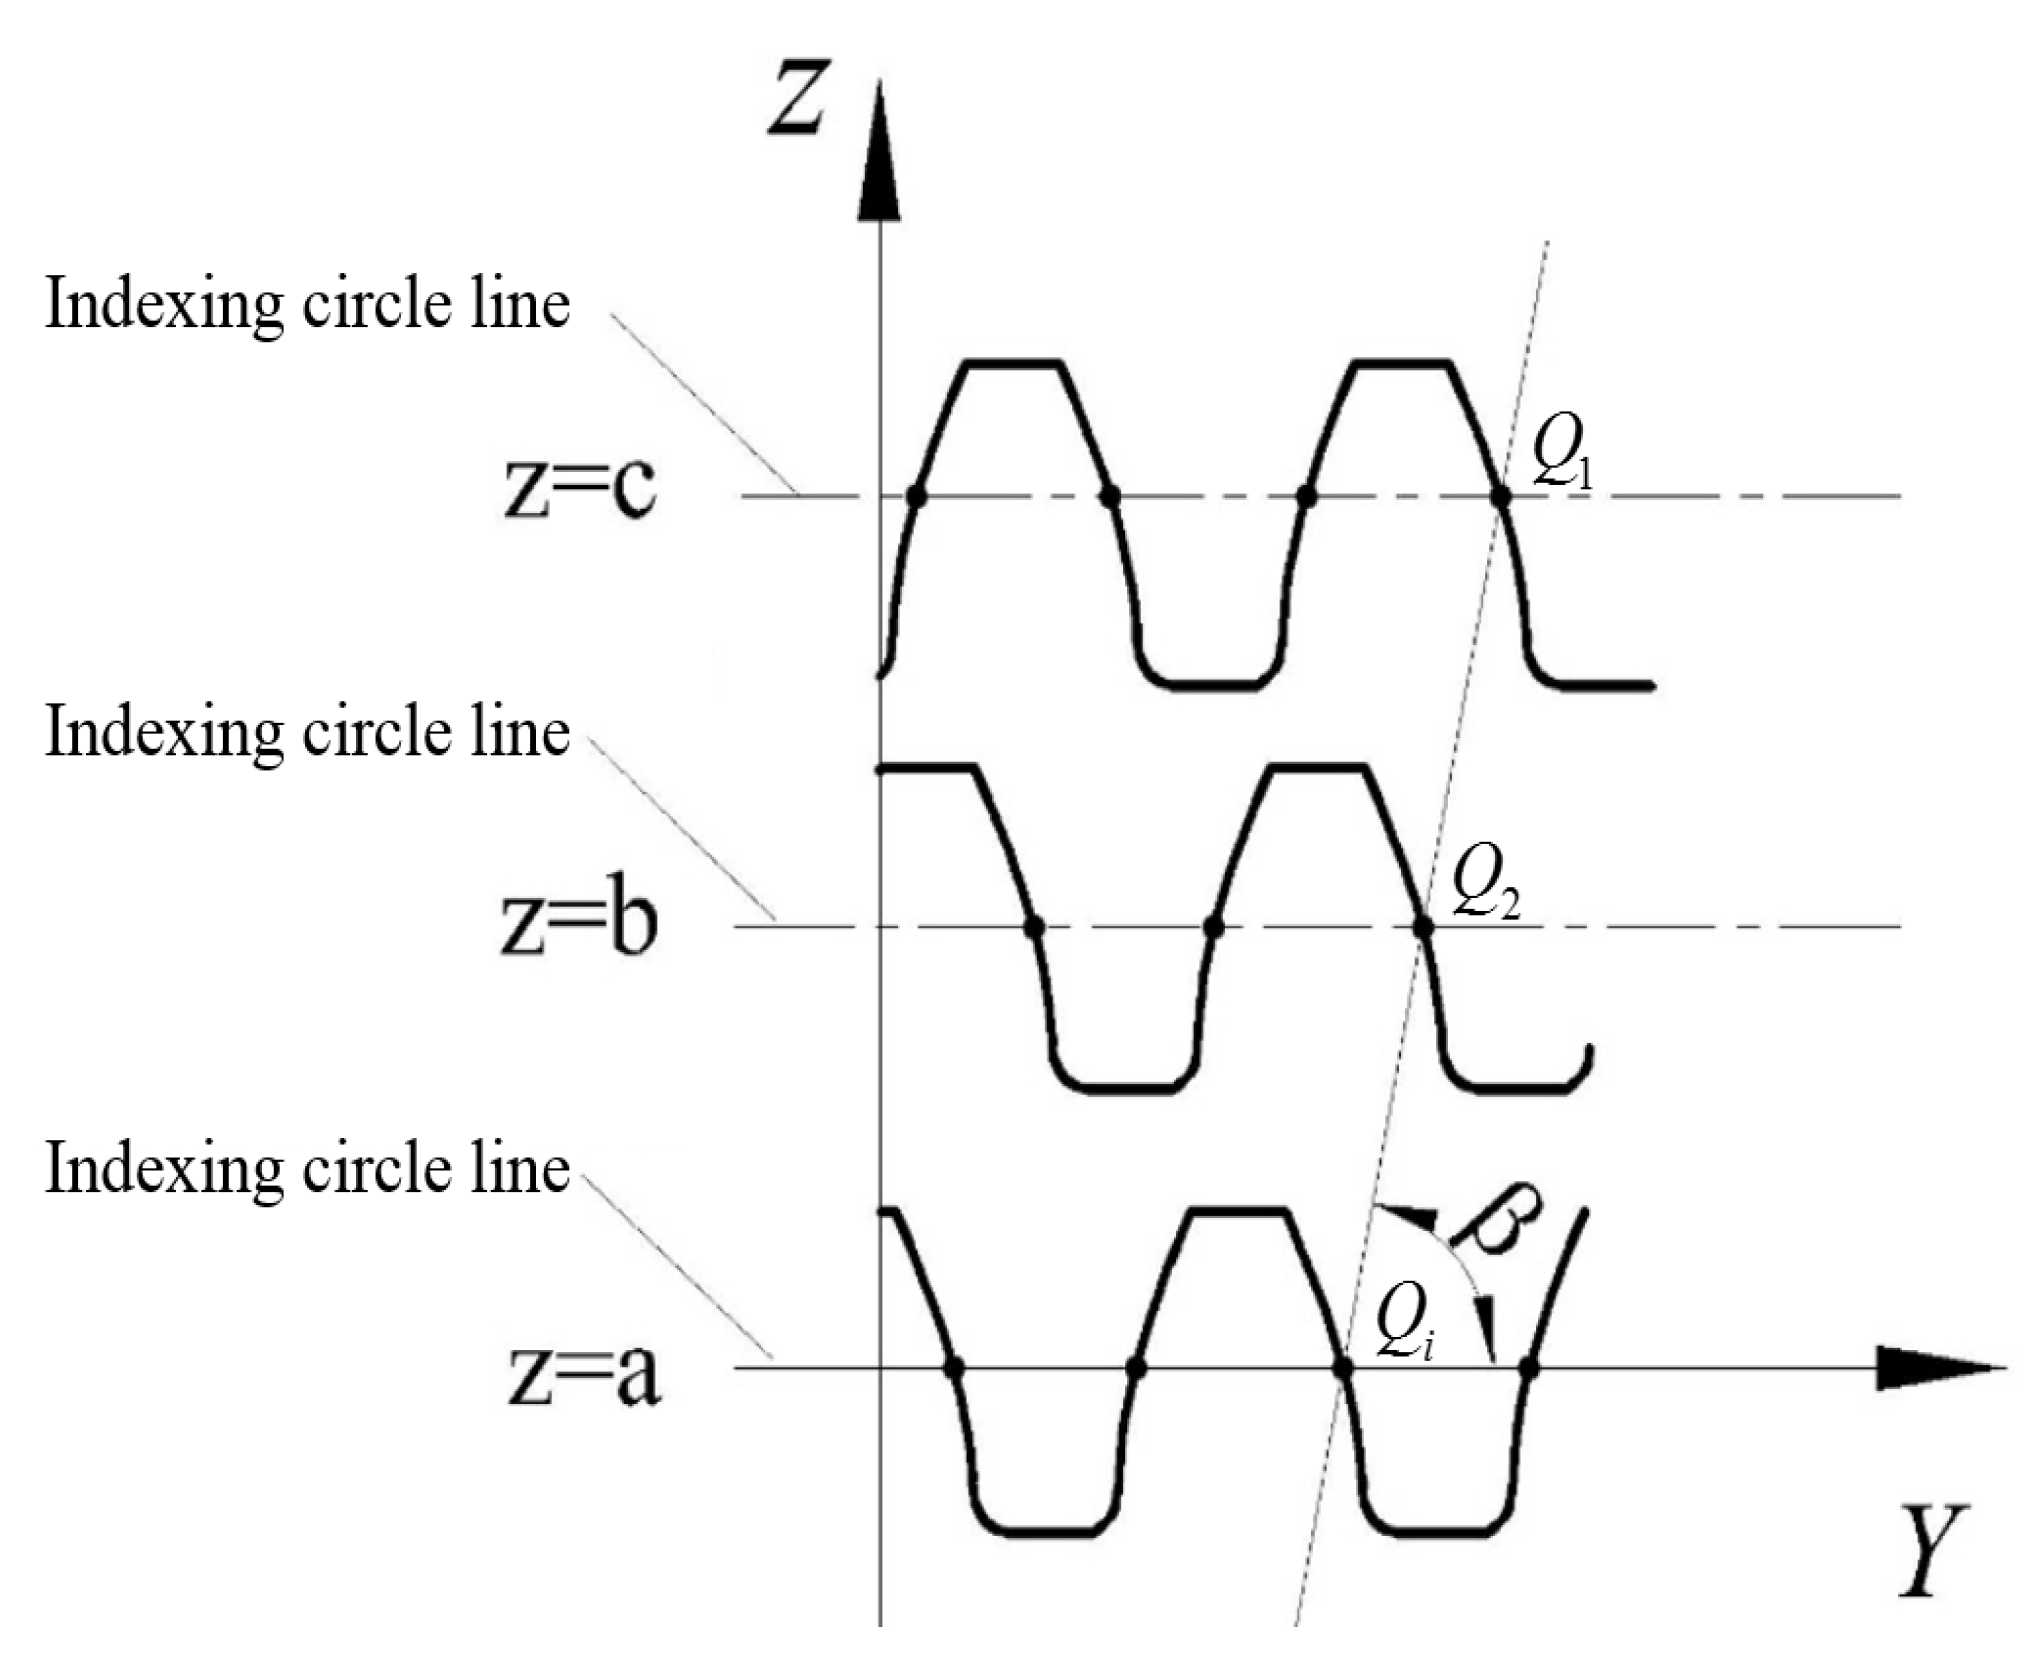
It can be observed from the definition that the helix angle of a gear is the angle between the helix formed by the intersection of the tooth profile surface and the cylindrical surface where the index circle is located and the gear end plane [
22]. Through the established actual model of the gear, any number of tooth profile sections can be intercepted, and all the sections can be converted into the same plane coordinate system, as shown in
Figure 6. The set of intersections formed by the intersection of the indexing cylindrical surface and all tooth profile curves on a certain tooth surface is
. In this paper, the least-squares method is used to fit the point set
, and the angle between the fitting line and the gear end plane is the helix angle,
, of the helical gear. The equation can be expressed as
, and the sum of the squares of the deviations from the intersections on all tooth profiles to the fitted straight line can be expressed as:
Taking the derivation of formula (13), the matrix equation system can be obtained:
From Equation (15), the helix angle can be expressed as .
5. Experiment Platform Construction and Software Development
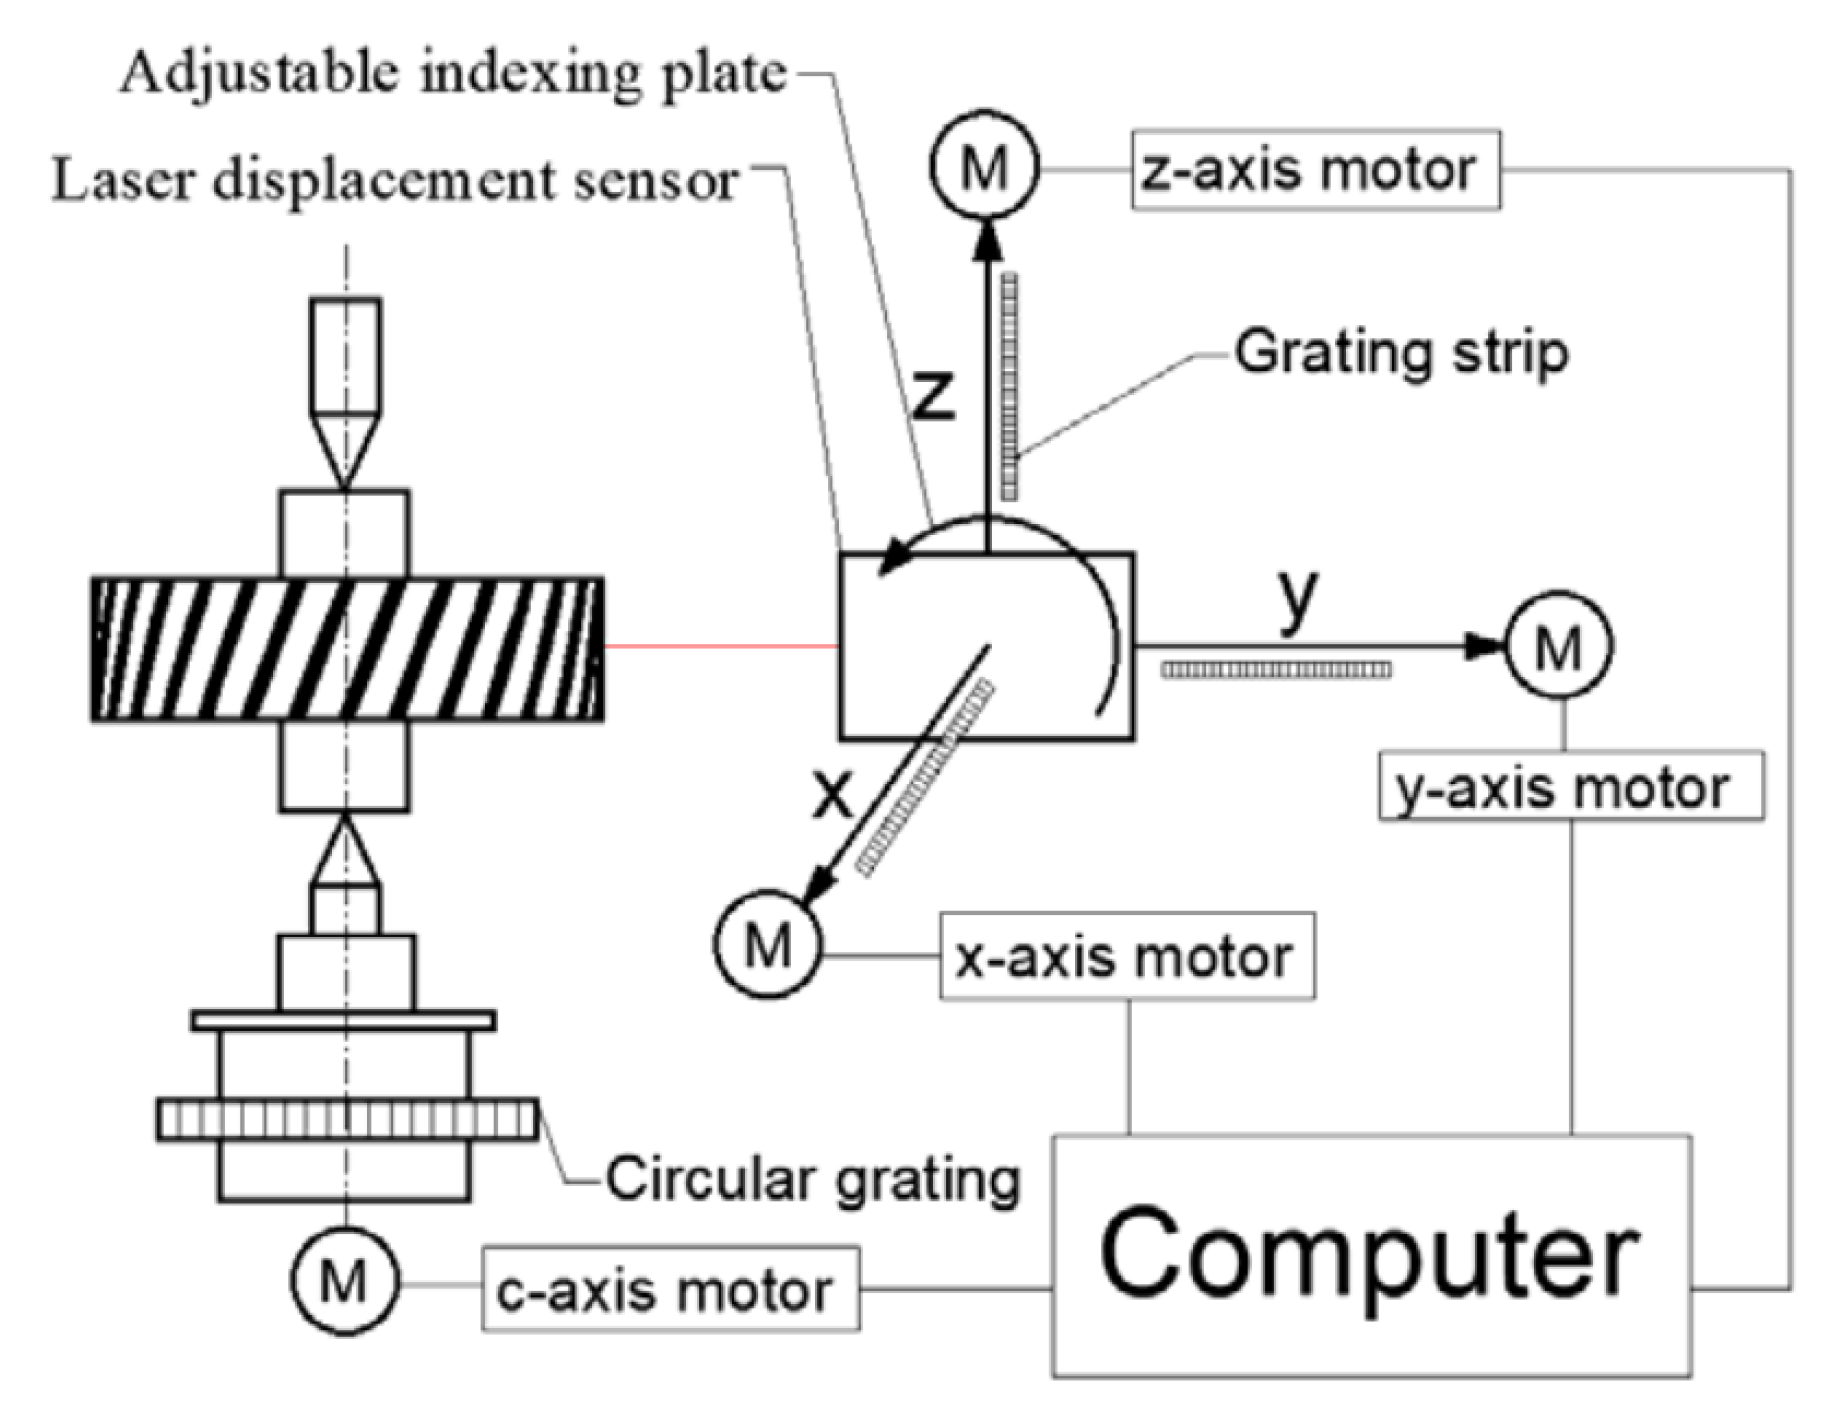
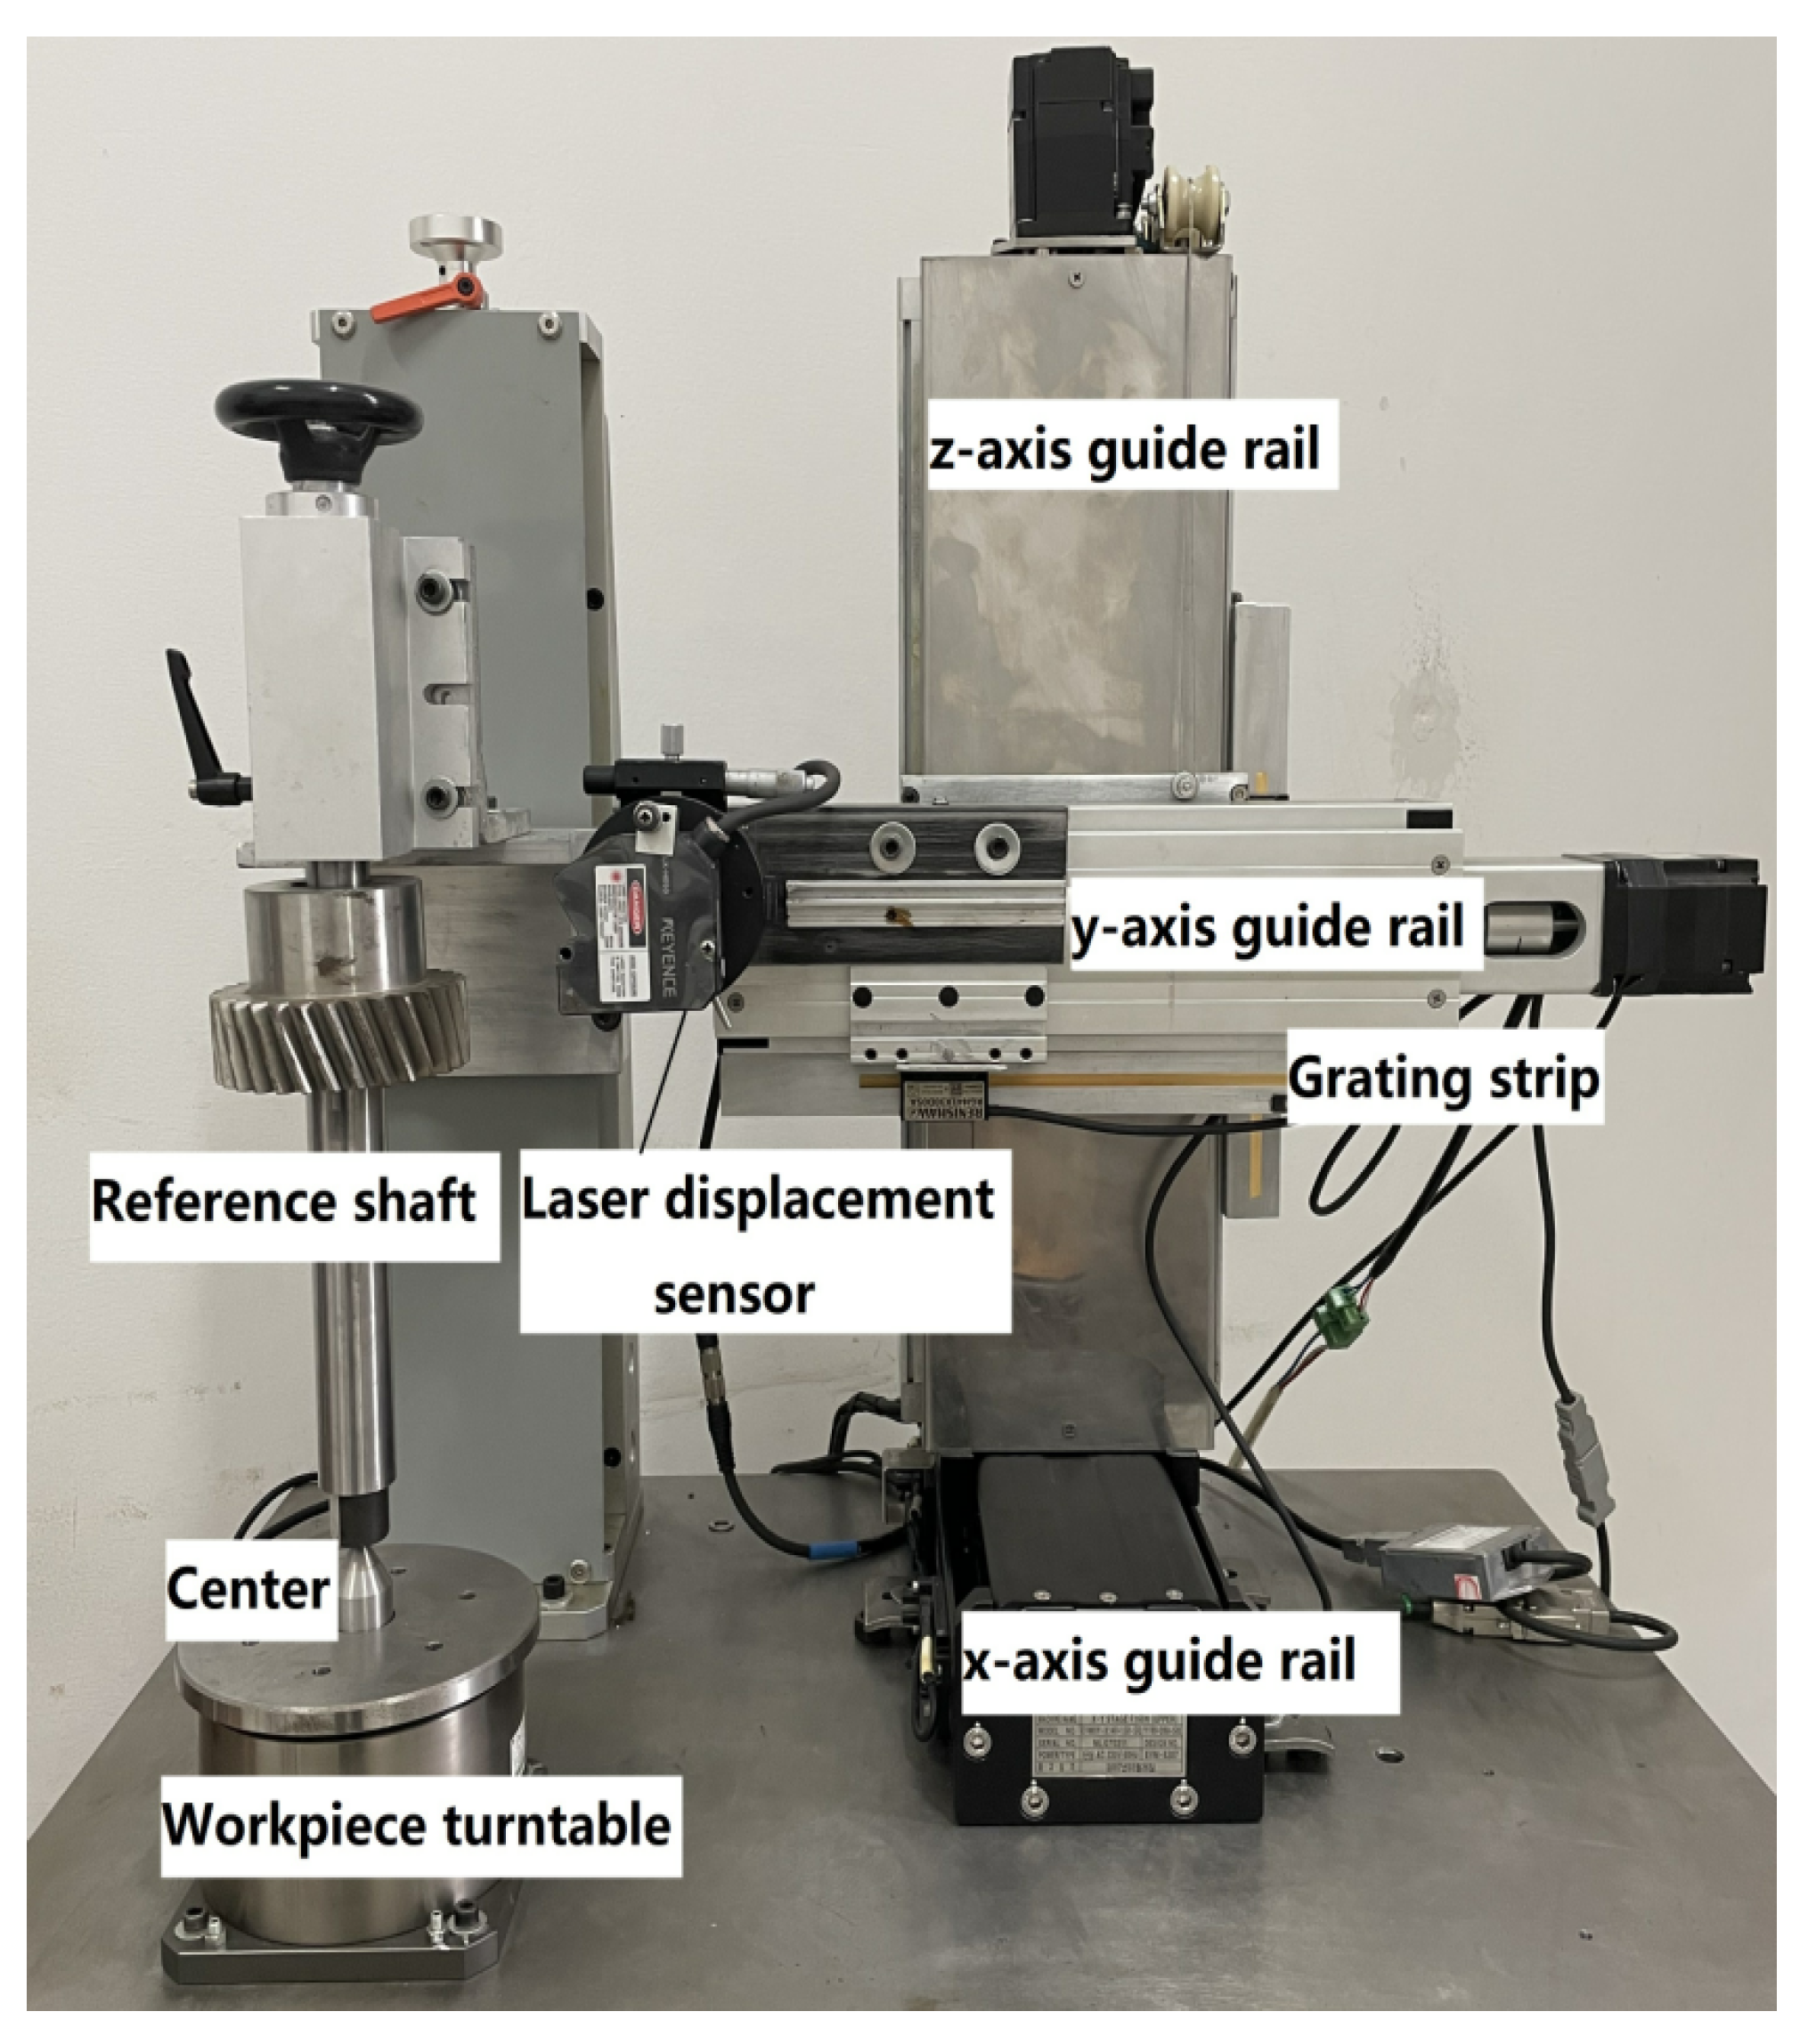
In this experiment, according to the measuring platform design schematic diagram shown in
Figure 2, the experimental platform for the gear deviation laser measurement is built, and the completed physical drawing is shown in
Figure 7.
In the measuring platform shown in
Figure 7, the rotating chuck and the three-axis motion control mechanism are driven by a high-precision direct-drive motor. The grating is installed at the bottom of the positioning rotary chuck and the side of the three-axle motion guide, and the pulse drive is realized by coding with ADT850 four-axle control. The rotating precision of positioning rotary chuck can reach
and the linear motion precision of three-axle motion guide can reach
, At the same time, a Keynes LK-H050 sensor is used for data acquisition. Its linearity is <0.02% F.S (F.S = 20 mm), repeatability is
, measurement resolution is
, and sampling period is
. Combined with the high precision motion control system, the accuracy and reliability of data acquisition can be greatly improved.
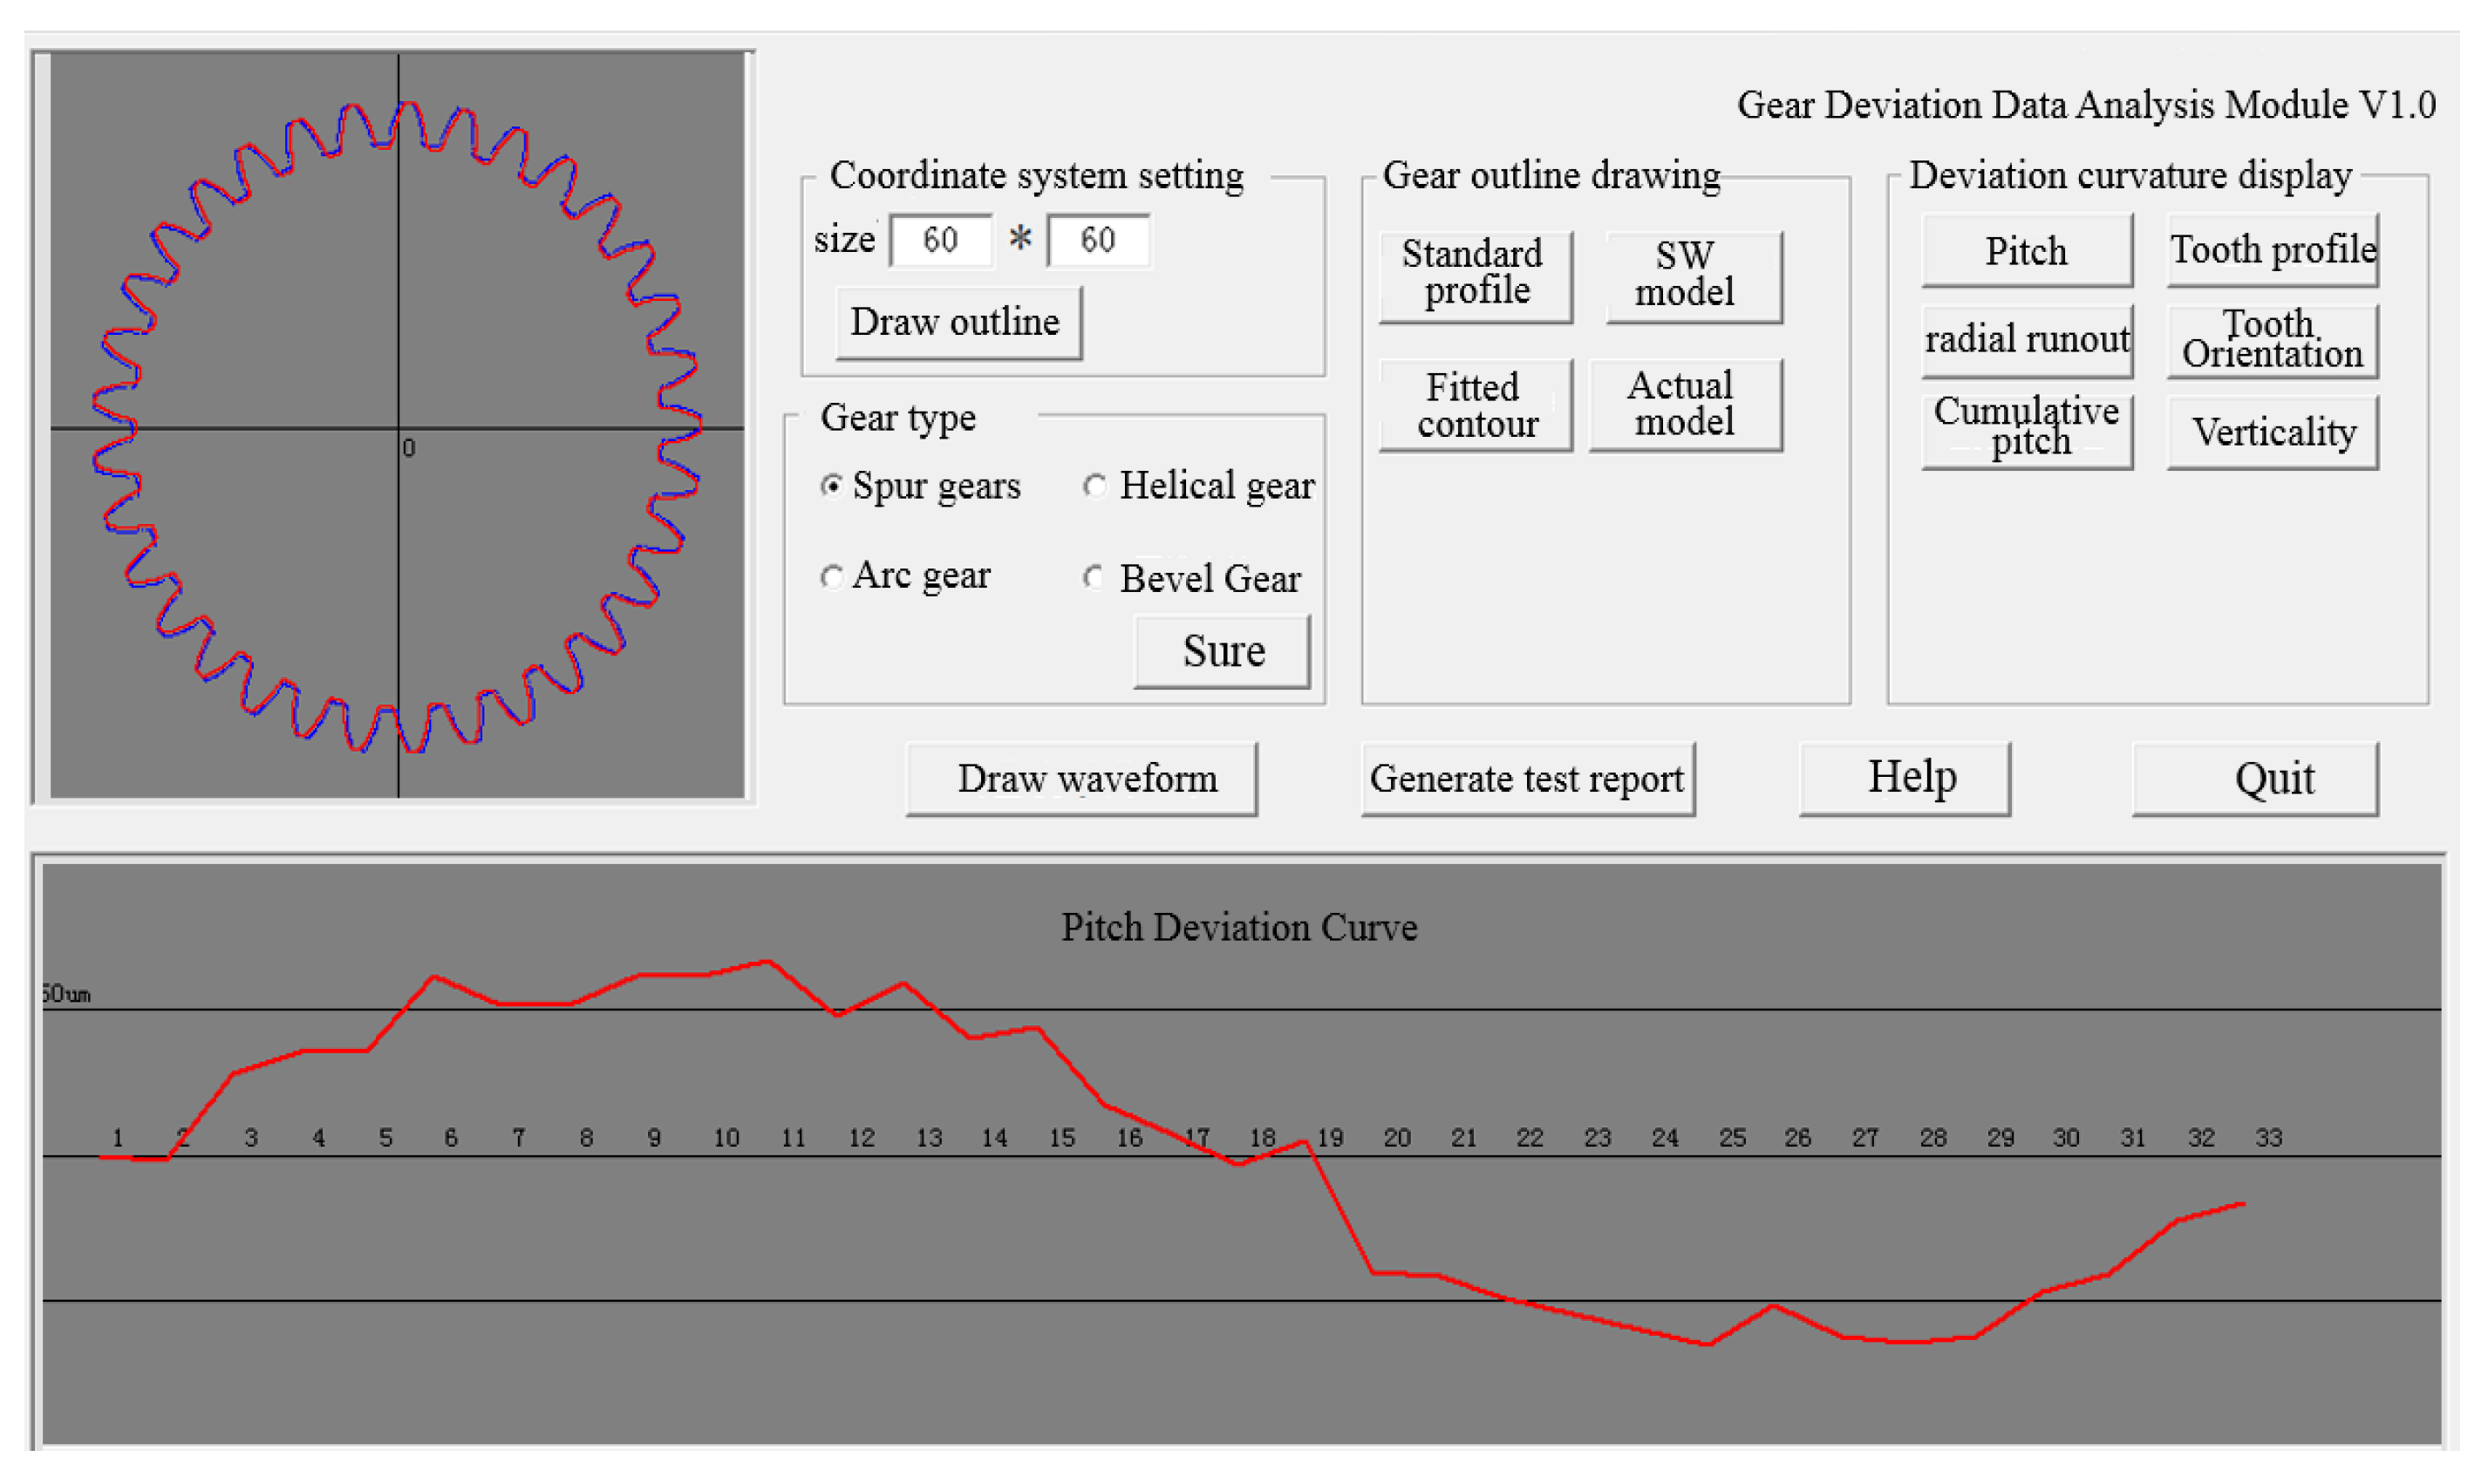
Based on the principle of coordinate transformation of space points from the measurement data, the principle of establishing the actual three-dimensional surface of tooth shape, and the calculation method of gear deviation analysis, this paper develops the software for measurement control and deviation analysis. This software can control the operation of the turntable and the sliding guide to realize the data acquisition of the laser probe. The data acquisition can automatically compensate for the errors and coordinate transformation, to realize the establishment of the actual surface of the gear and the calculation, analysis, and visual expression of various deviations. The interface of the software is shown in
Figure 8.
6. Gear Overall Deviation Measurement Experiment
The method of gear actual model establishment and gear overall deviation analysis proposed above is general and applicable to all kinds of cylindrical gears. To verify the correctness of the theoretical derivation of gear deviation measurement in this paper, as well as the accuracy and reliability of the deviation analysis of the built measurement platform, a 6th-grade gear was used as the measurement material, and the measurement was carried out on this platform. The relevant parameters of the adopted 6-stage gear were as follows: the module was 3, the number of teeth was 30, the pressure angle of the end face was , the tooth thickness was 30 mm, and the left helix angle was .
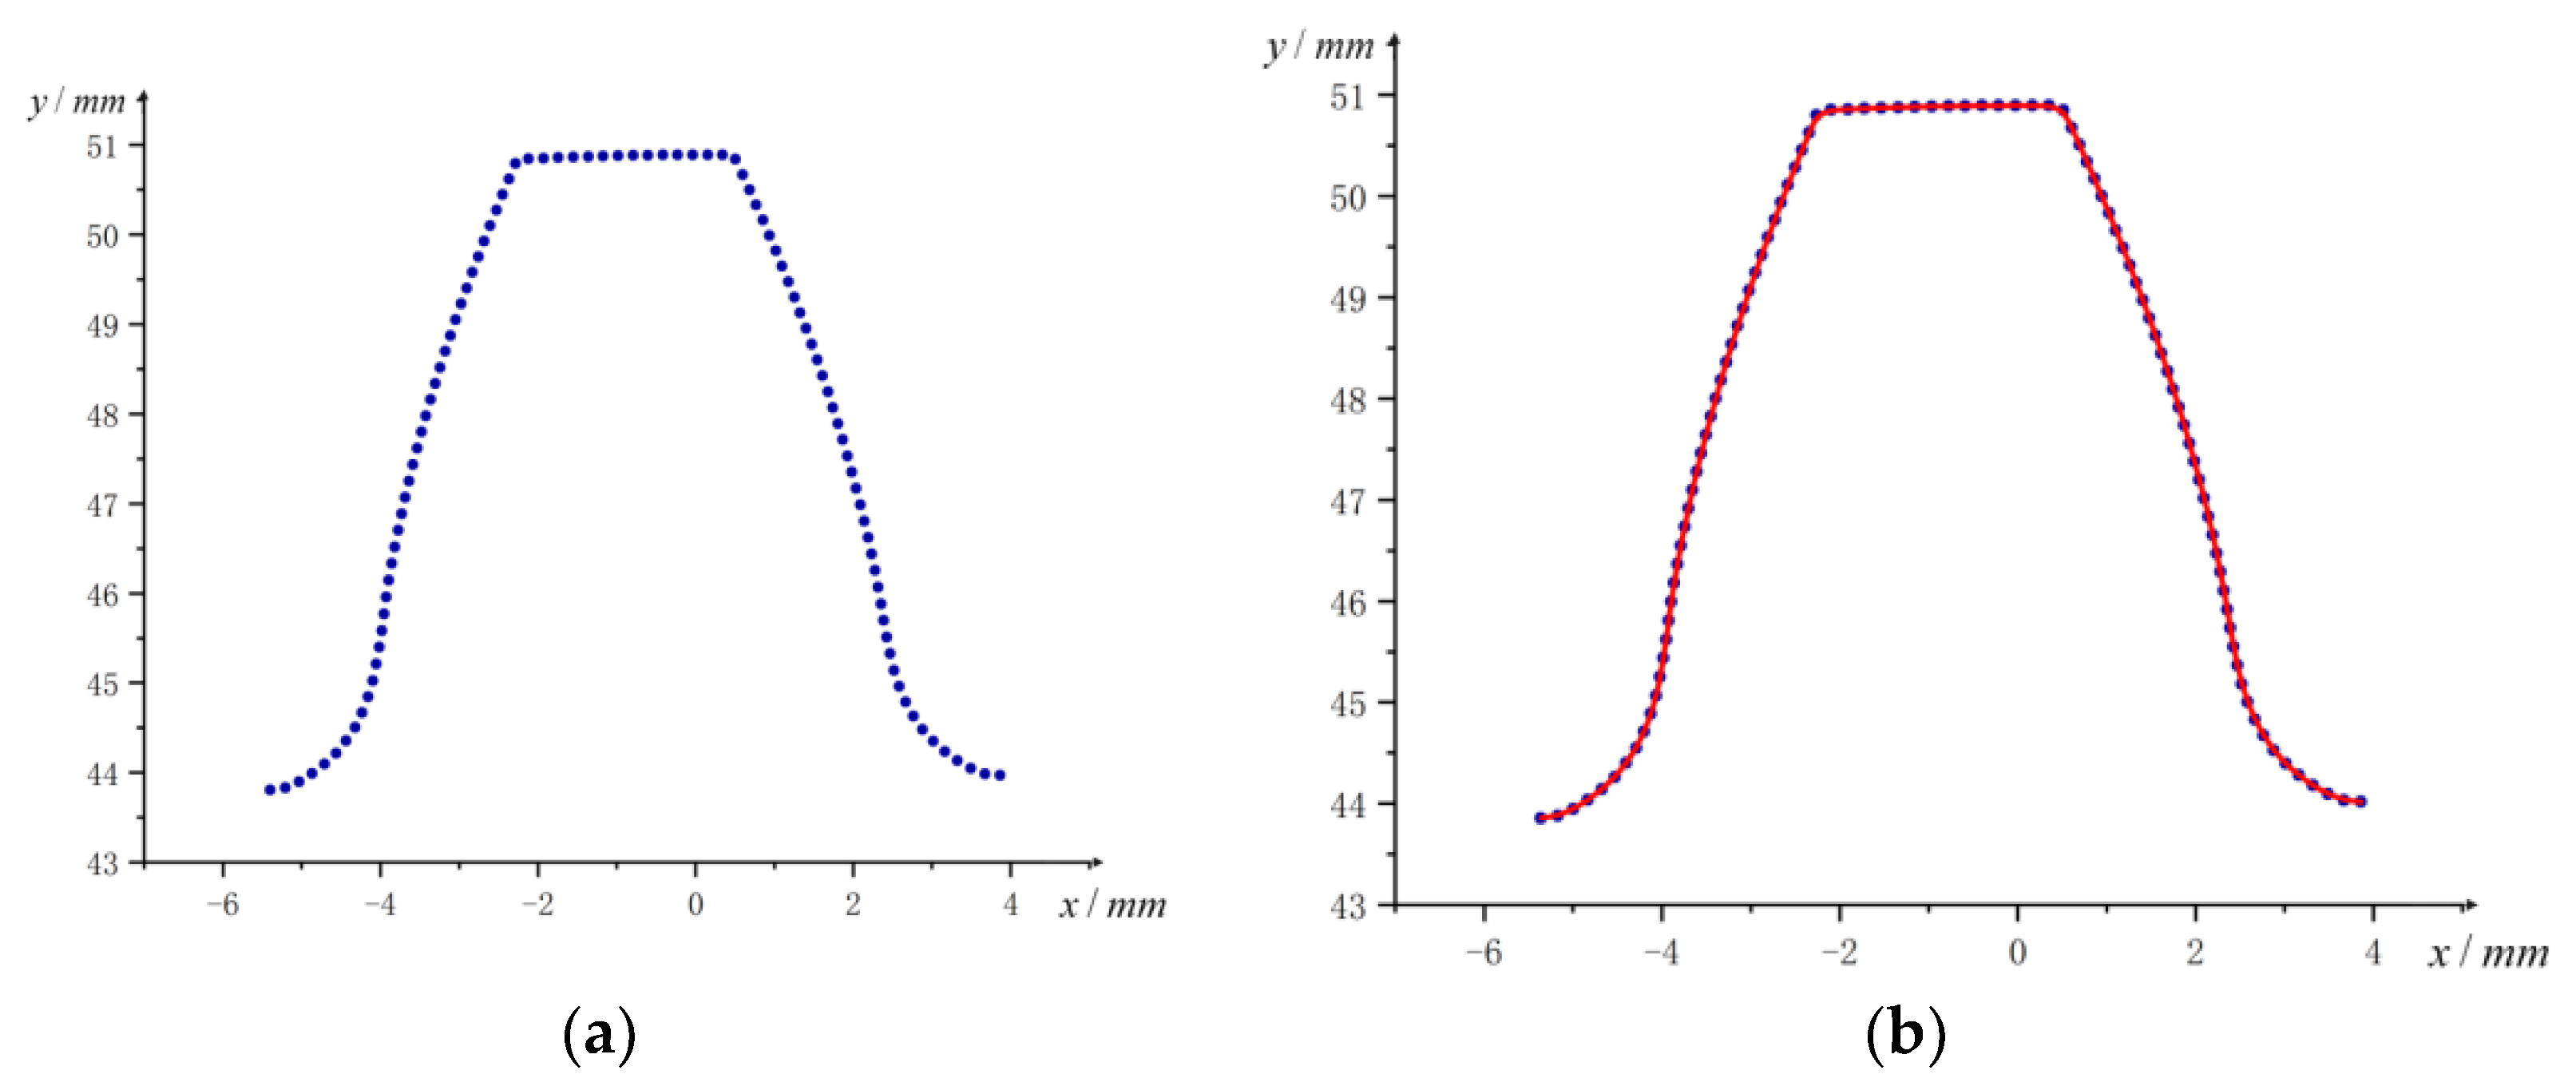
Install the measured gear on the rotating chuck of the measuring platform, use the developed measuring software to automatically center the laser probe before measuring, and then set a rated pulse amount to the rotating chuck to make it rotate at a constant speed. Then, turn on the laser probe through the measurement software and store the measured relative displacement and its corresponding rotation angle. In this experiment, 12 radial sections of the helical gear were selected for measurement, and the measurement data were converted into a three-dimensional space coordinate point set through the above theory, and the converted coordinate points first used Newton’s cubic interpolation principle to carry out coordinate points. One of the refined tooth profile point sets is shown in
Figure 9a, which is fitted by the cubic B-spline principle, as shown in
Figure 9b.
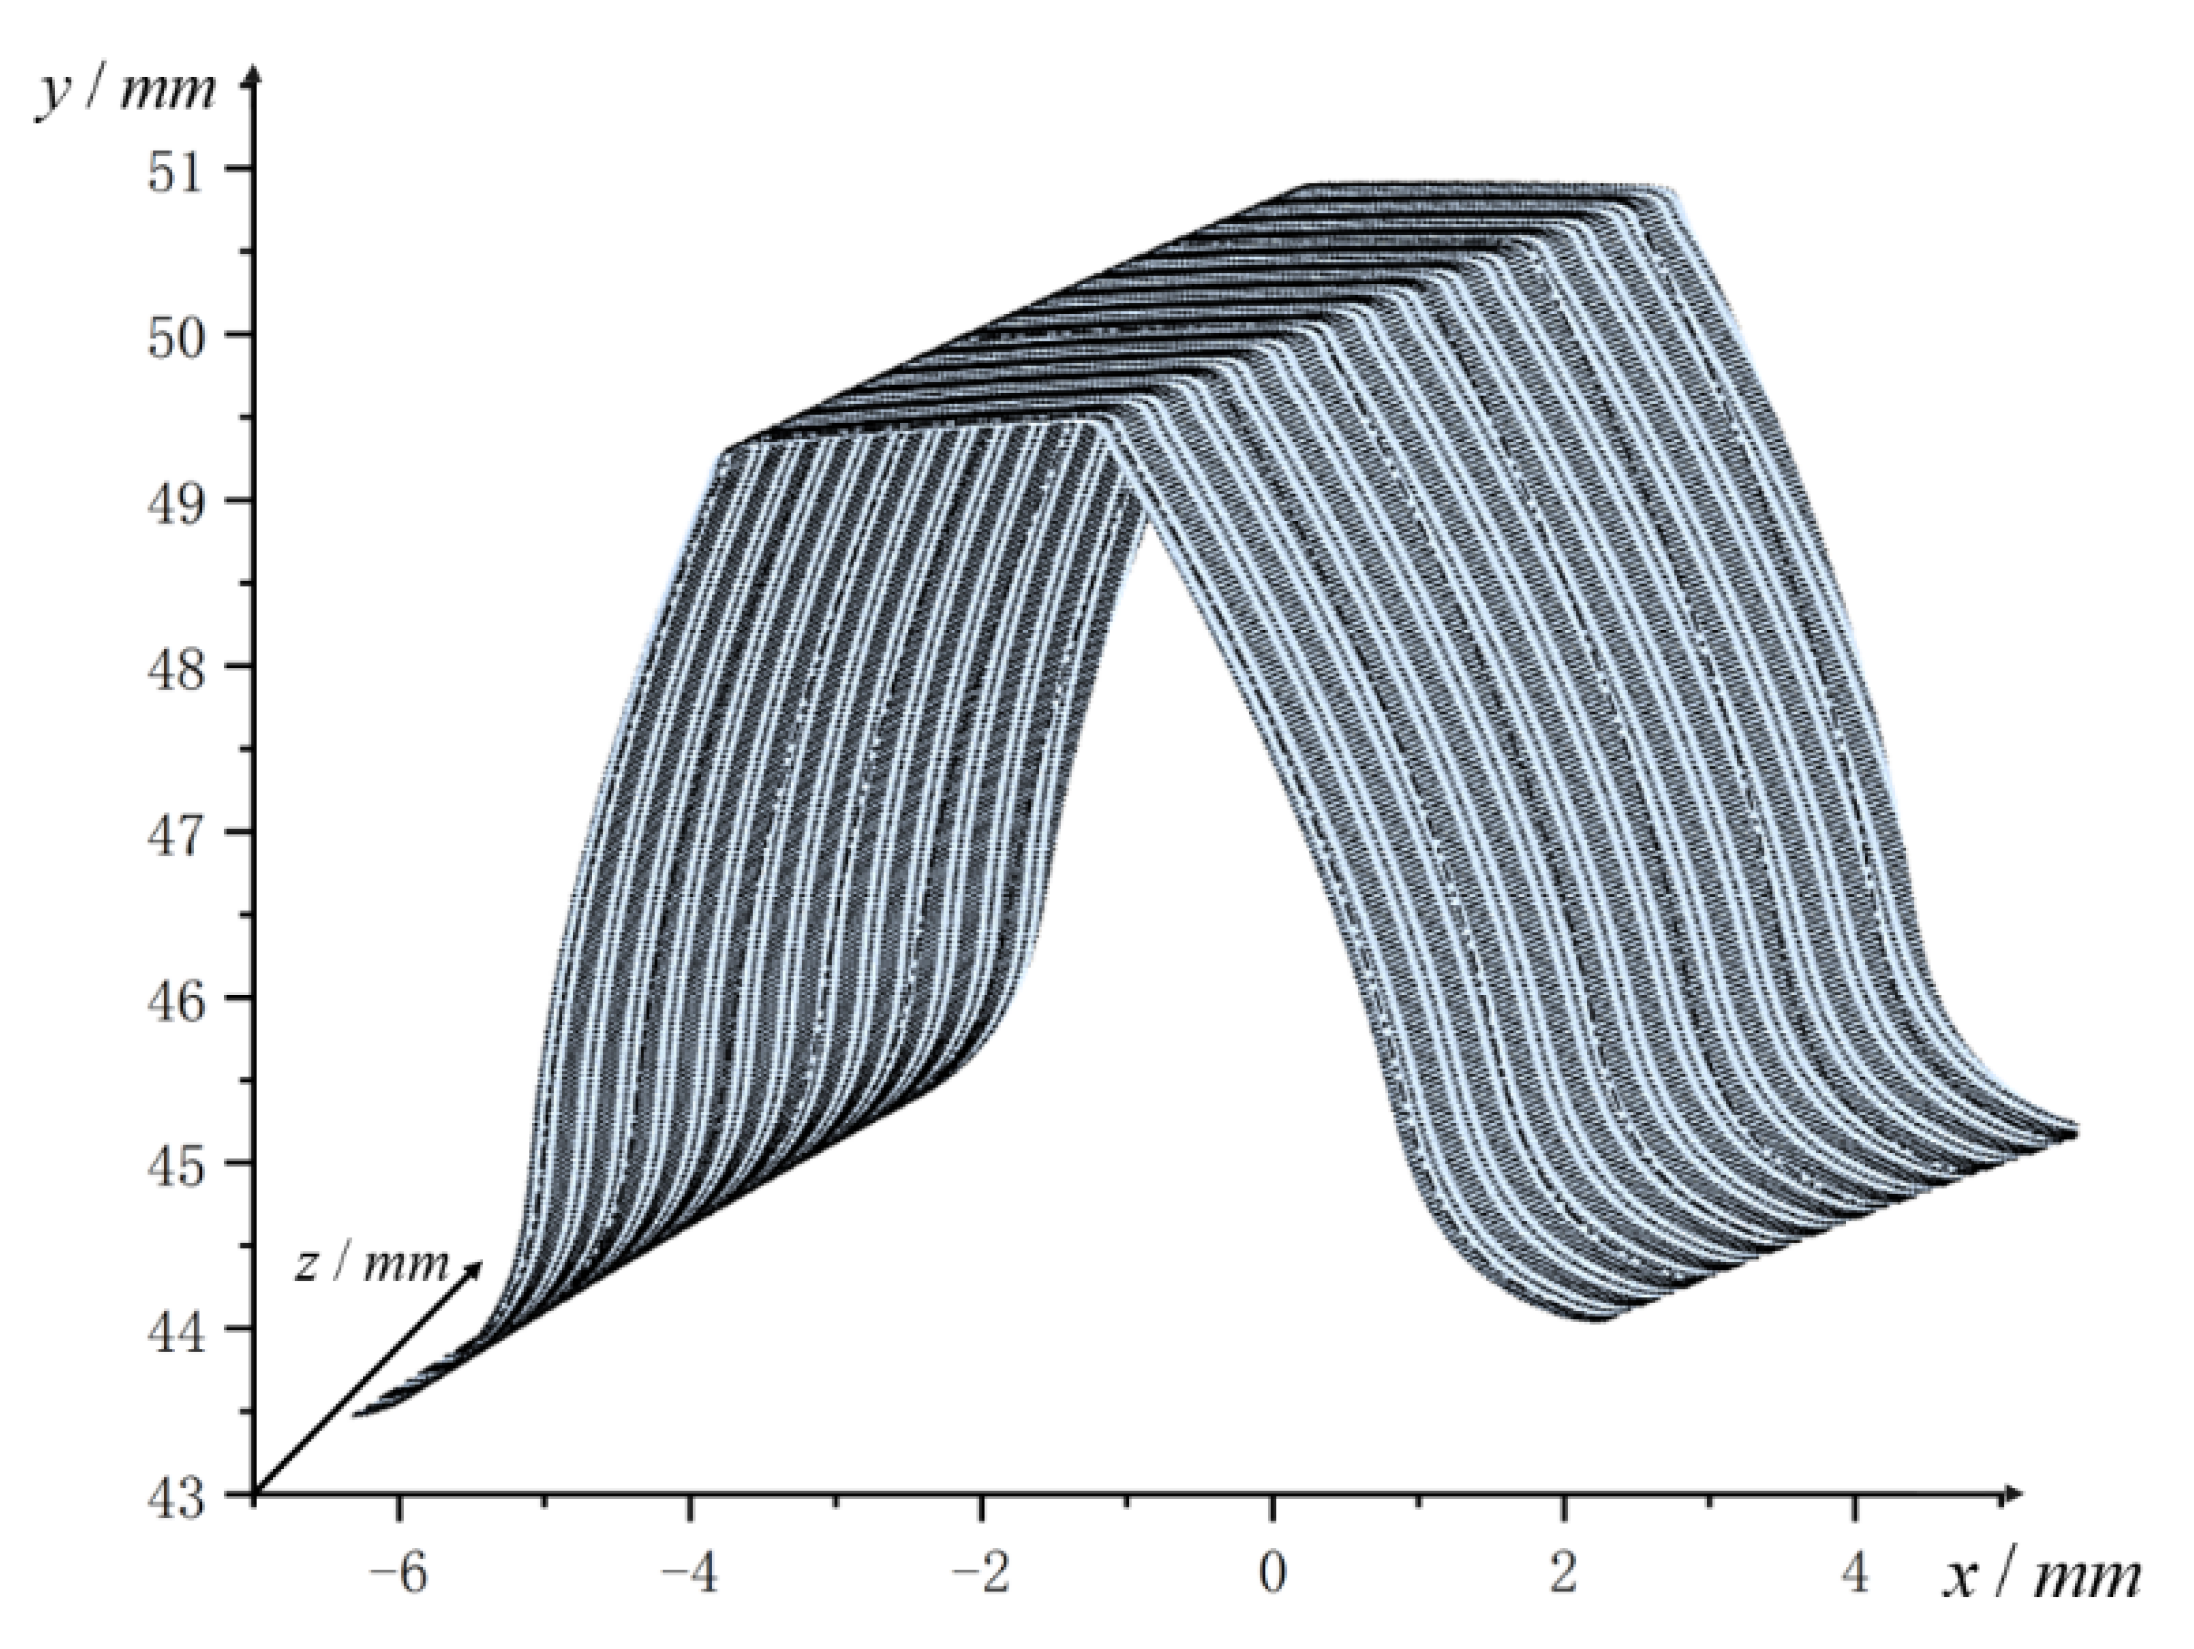
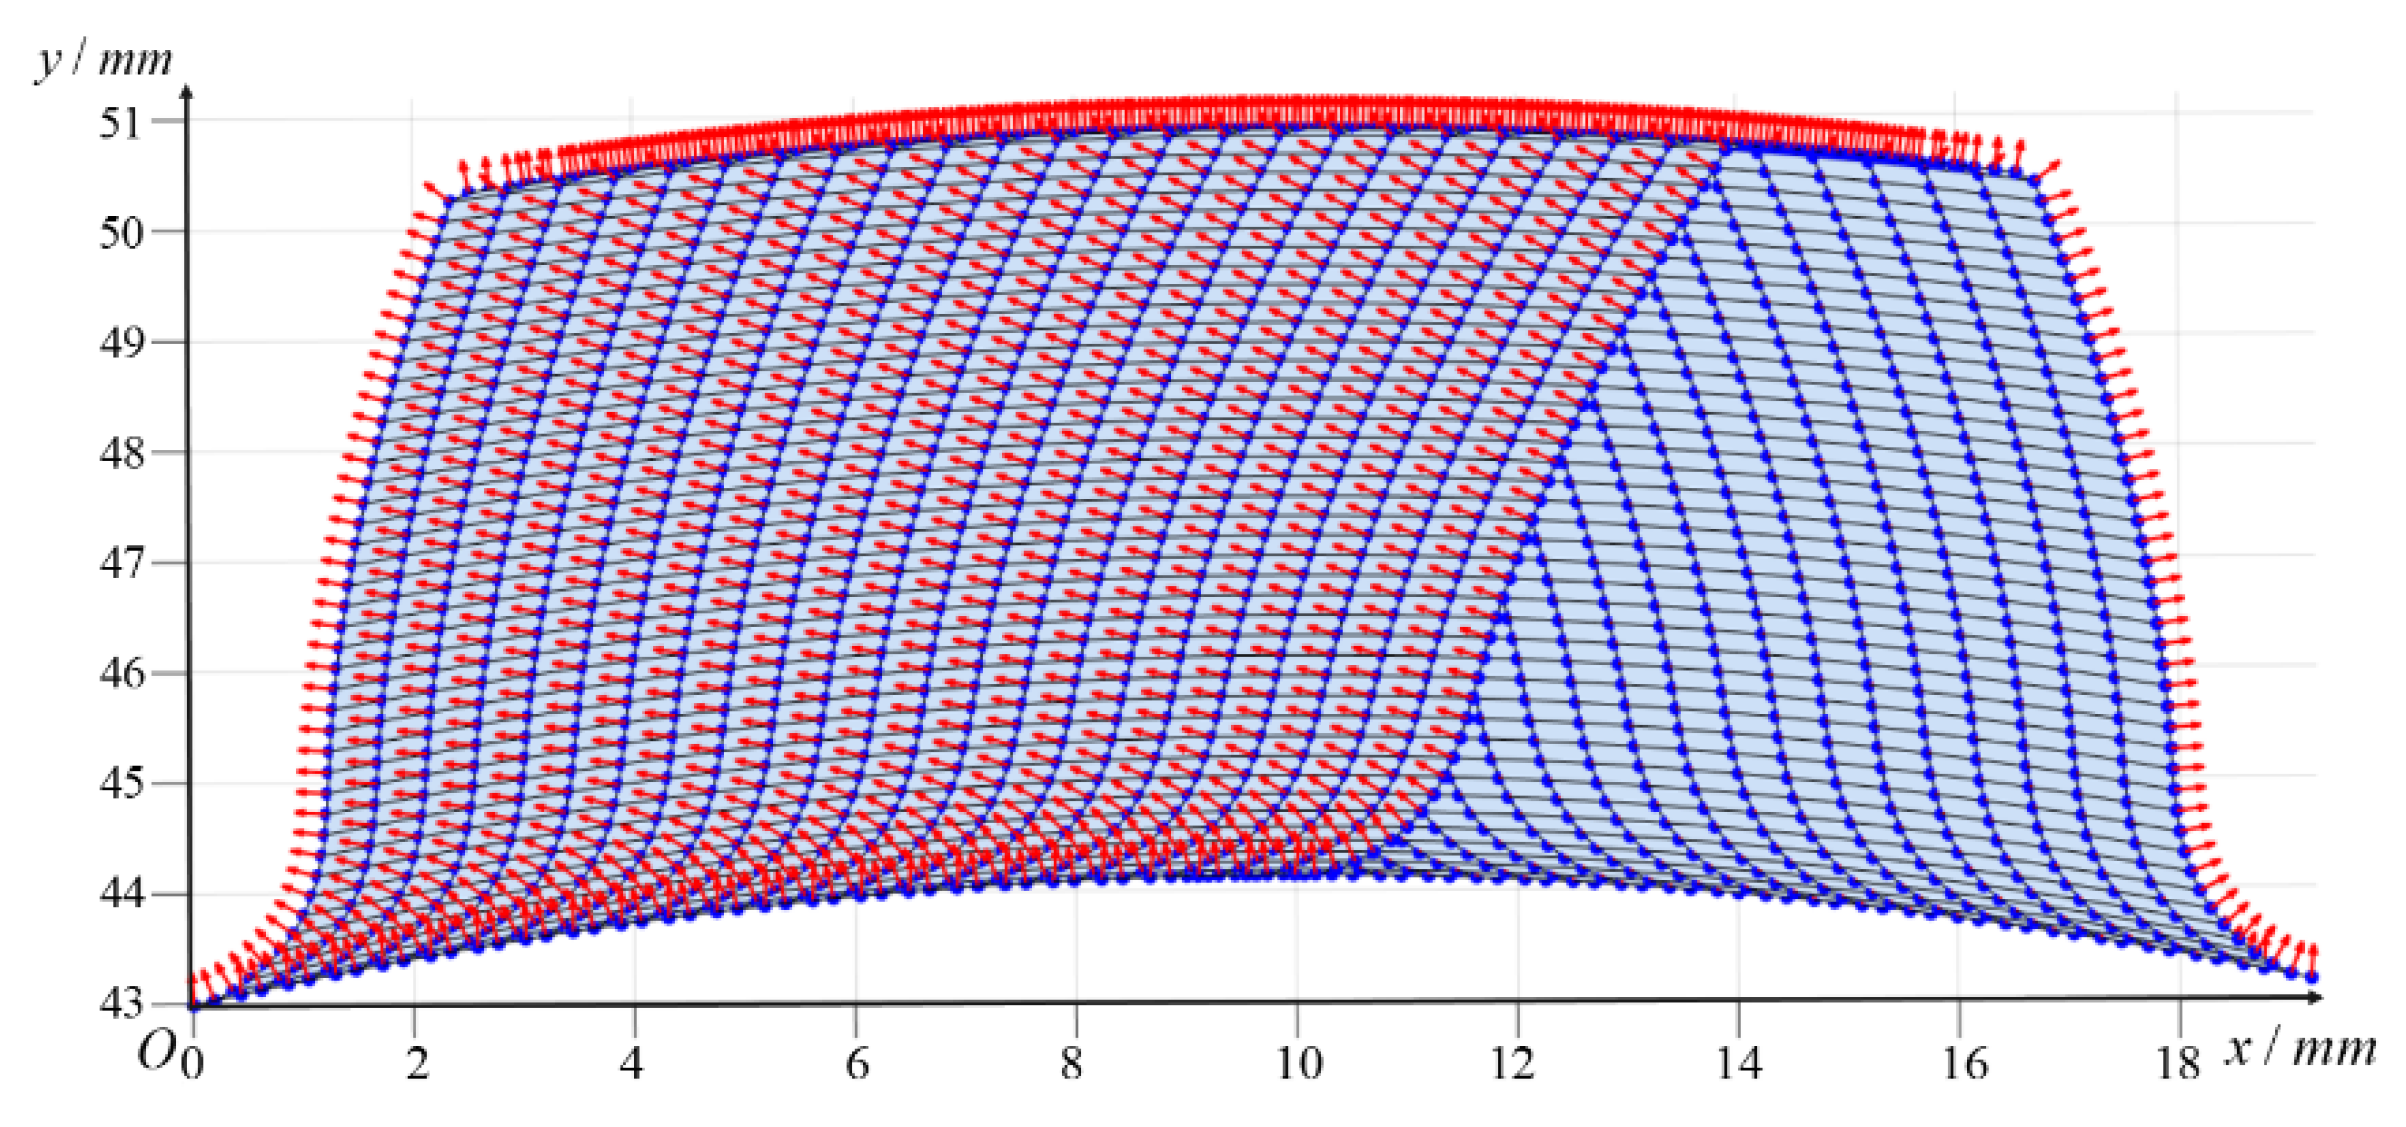
Perform 3 × 3 B-spline surface fitting on all the fitted tooth profile curves according to formula (4), to establish the surface model of the actual tooth profile, as shown in
Figure 10. Then, the tooth profile normal vector model is established according to the actual tooth profile model, as shown in
Figure 11.
Based on the established normal vector model of the tooth profile surface, the tooth profile deviation at any point on the tooth profile can be solved, and then all the deviations on the section can be fitted to obtain the tooth profile deviation curve of the corresponding section. The deviation curve on one of the tooth profile sections is shown in
Figure 12:
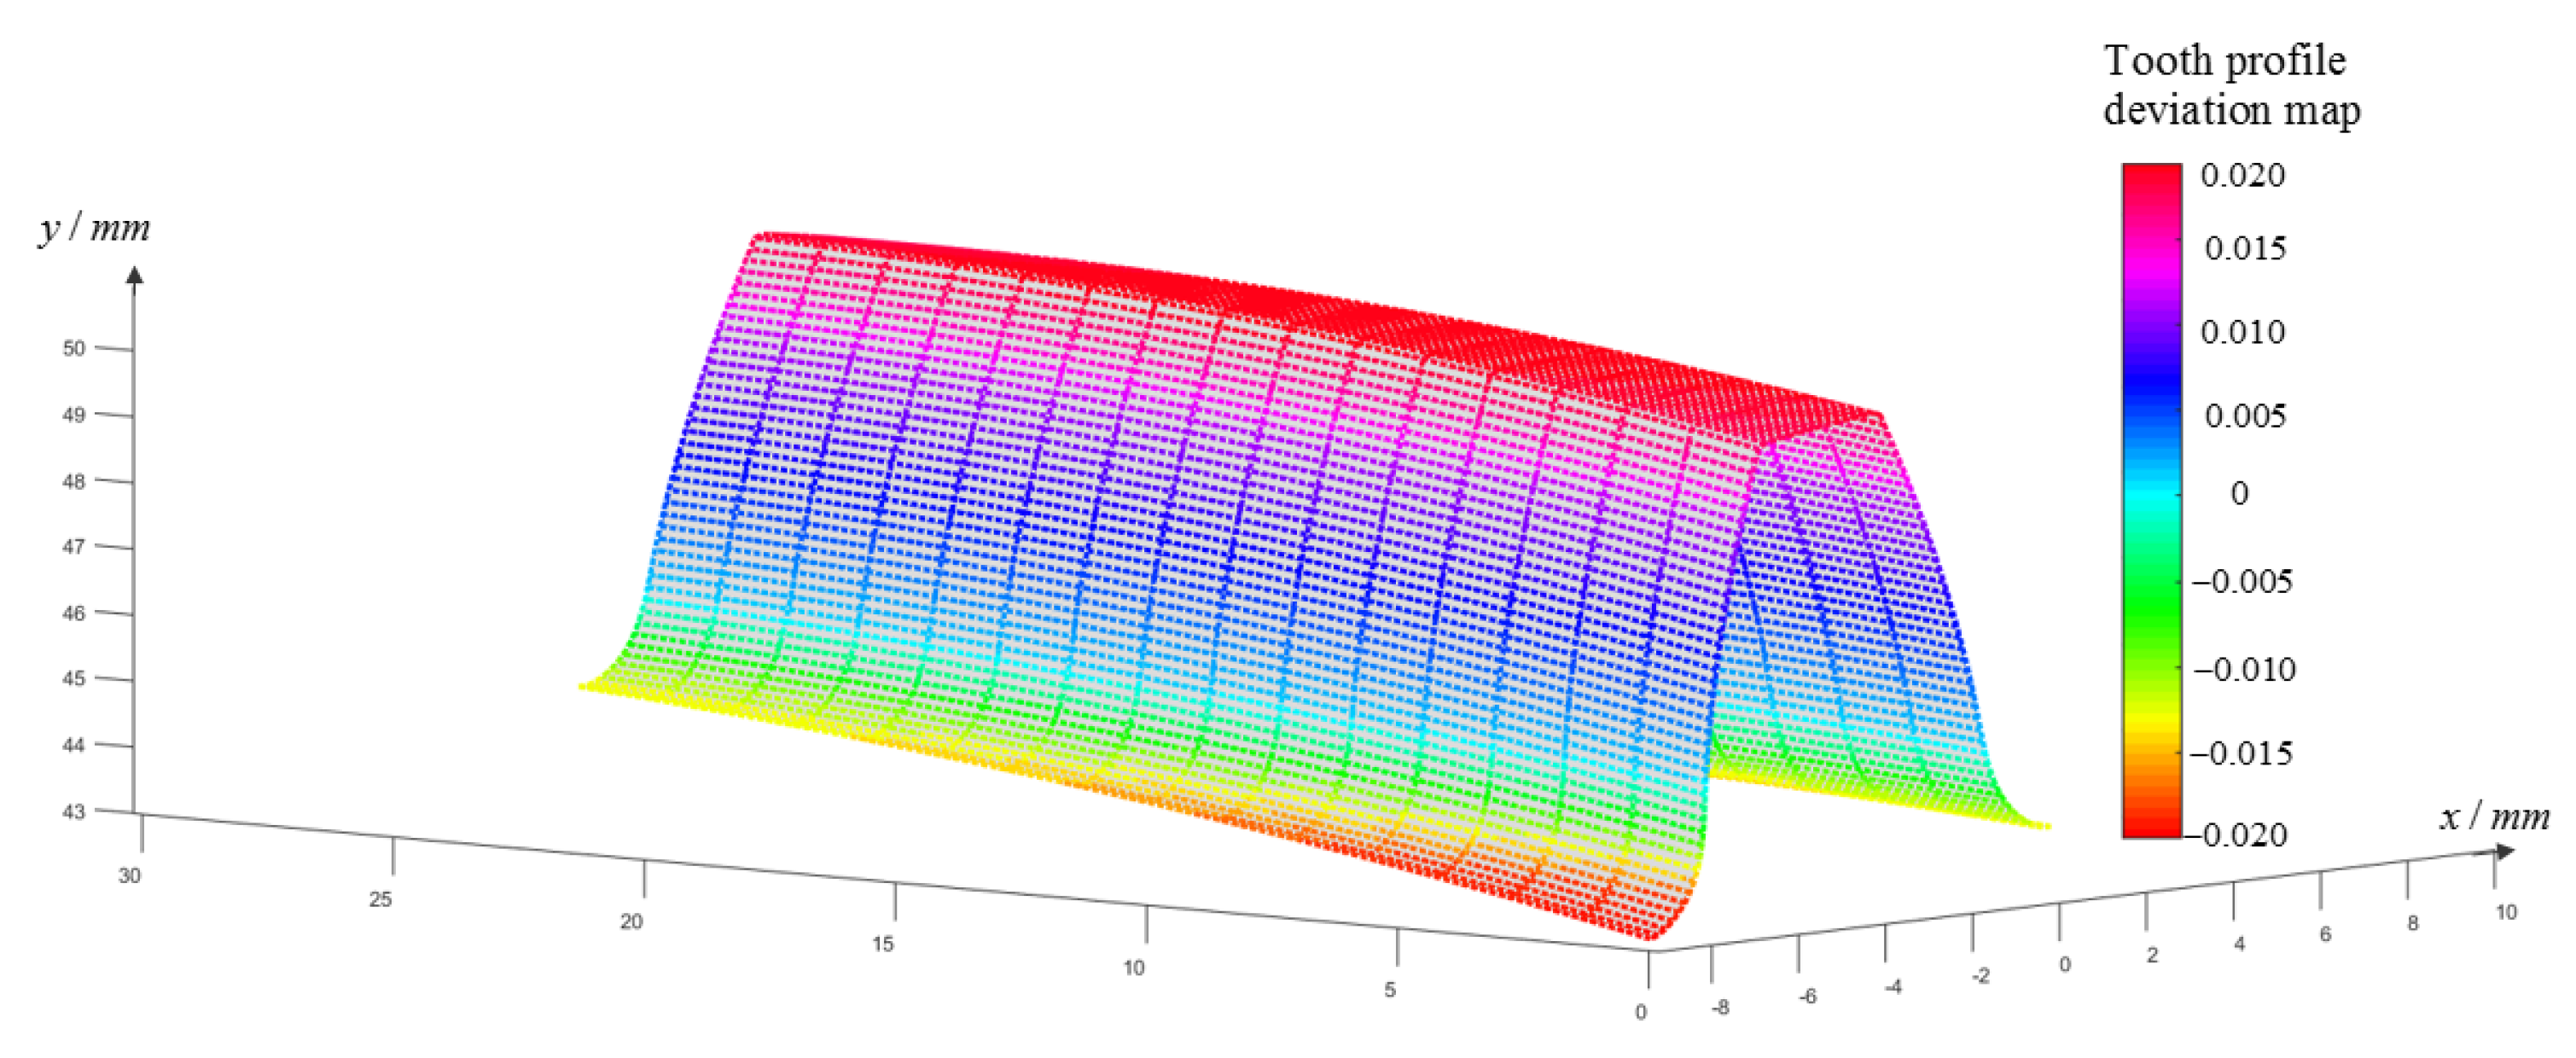
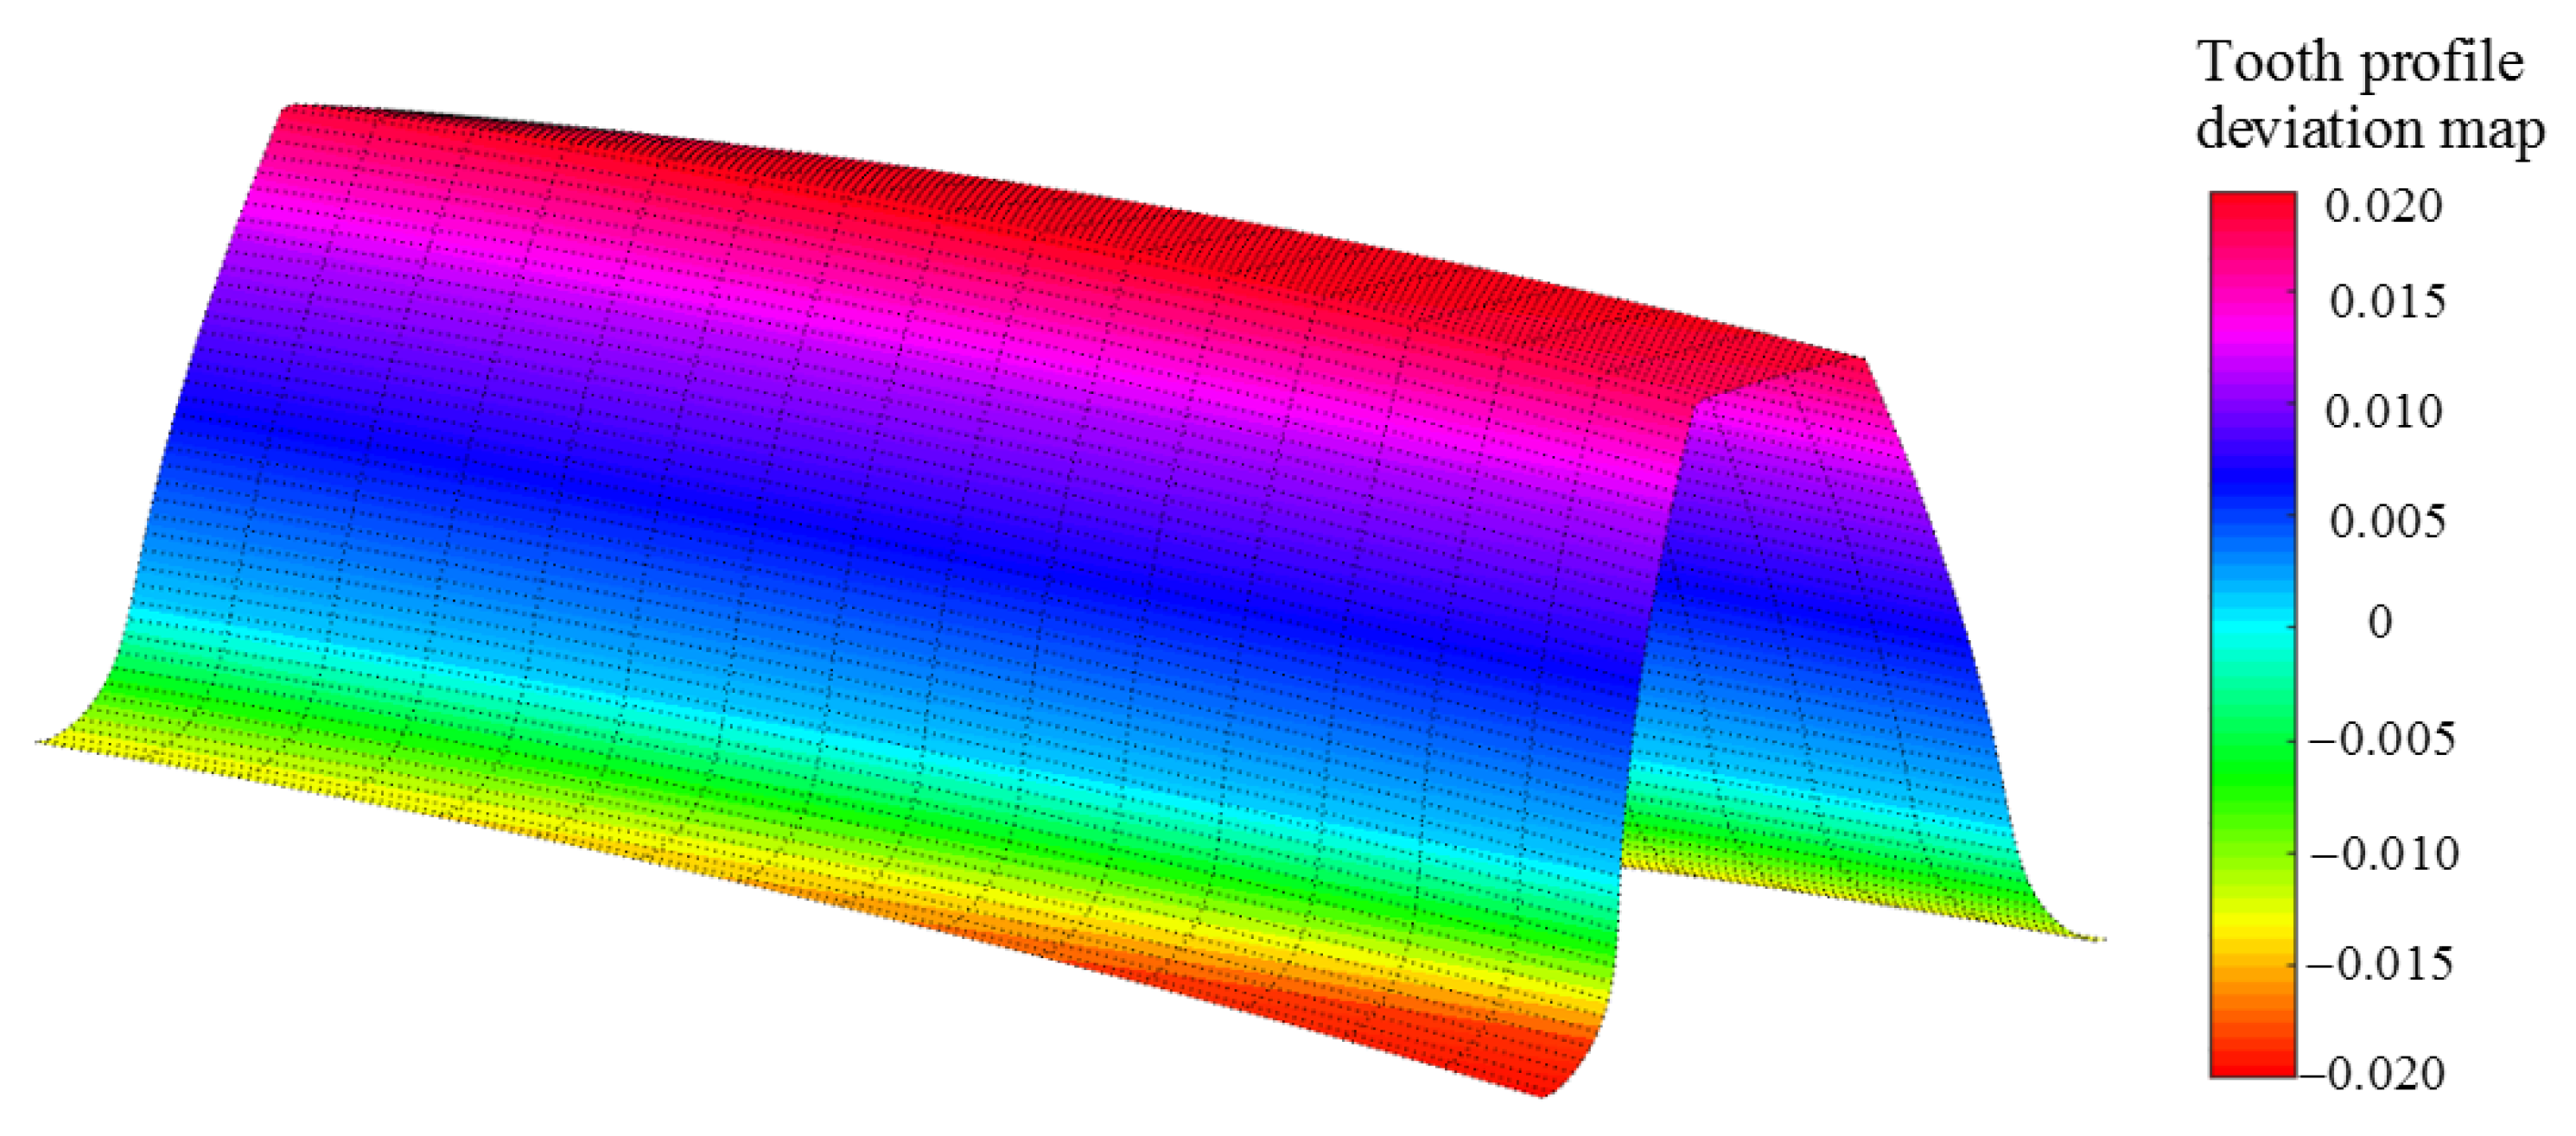
In this experiment, 16 tooth profile sections were selected at equal intervals to draw the corresponding tooth profile deviation curve, and the corresponding color map was drawn up according to the required deviation range. As shown in
Figure 13, the deviations at all the calculated points on the tooth profile deviation curve are marked with the colors in the corresponding color map. After that, 3 × 3 B-spline surface fitting is performed on all tooth profile deviation curves, and the overall deviation color map of the entire tooth profile surface is established, as shown in
Figure 14.
It can be observed from
Figure 14 that the tooth profile deviation has a larger value at the tip and root, while the deviation value at the index circle is smaller. By analyzing the deviation color map, it can be determined that the section with the largest tooth profile deviation is the tooth profile section where z = 0, that is, the front end face of the gear. From the calculation, it can be observed that the total deviation of the tooth profile on it is
, which meets the accuracy requirements of the 6th-grade gear by GB/T10095.1-2008.
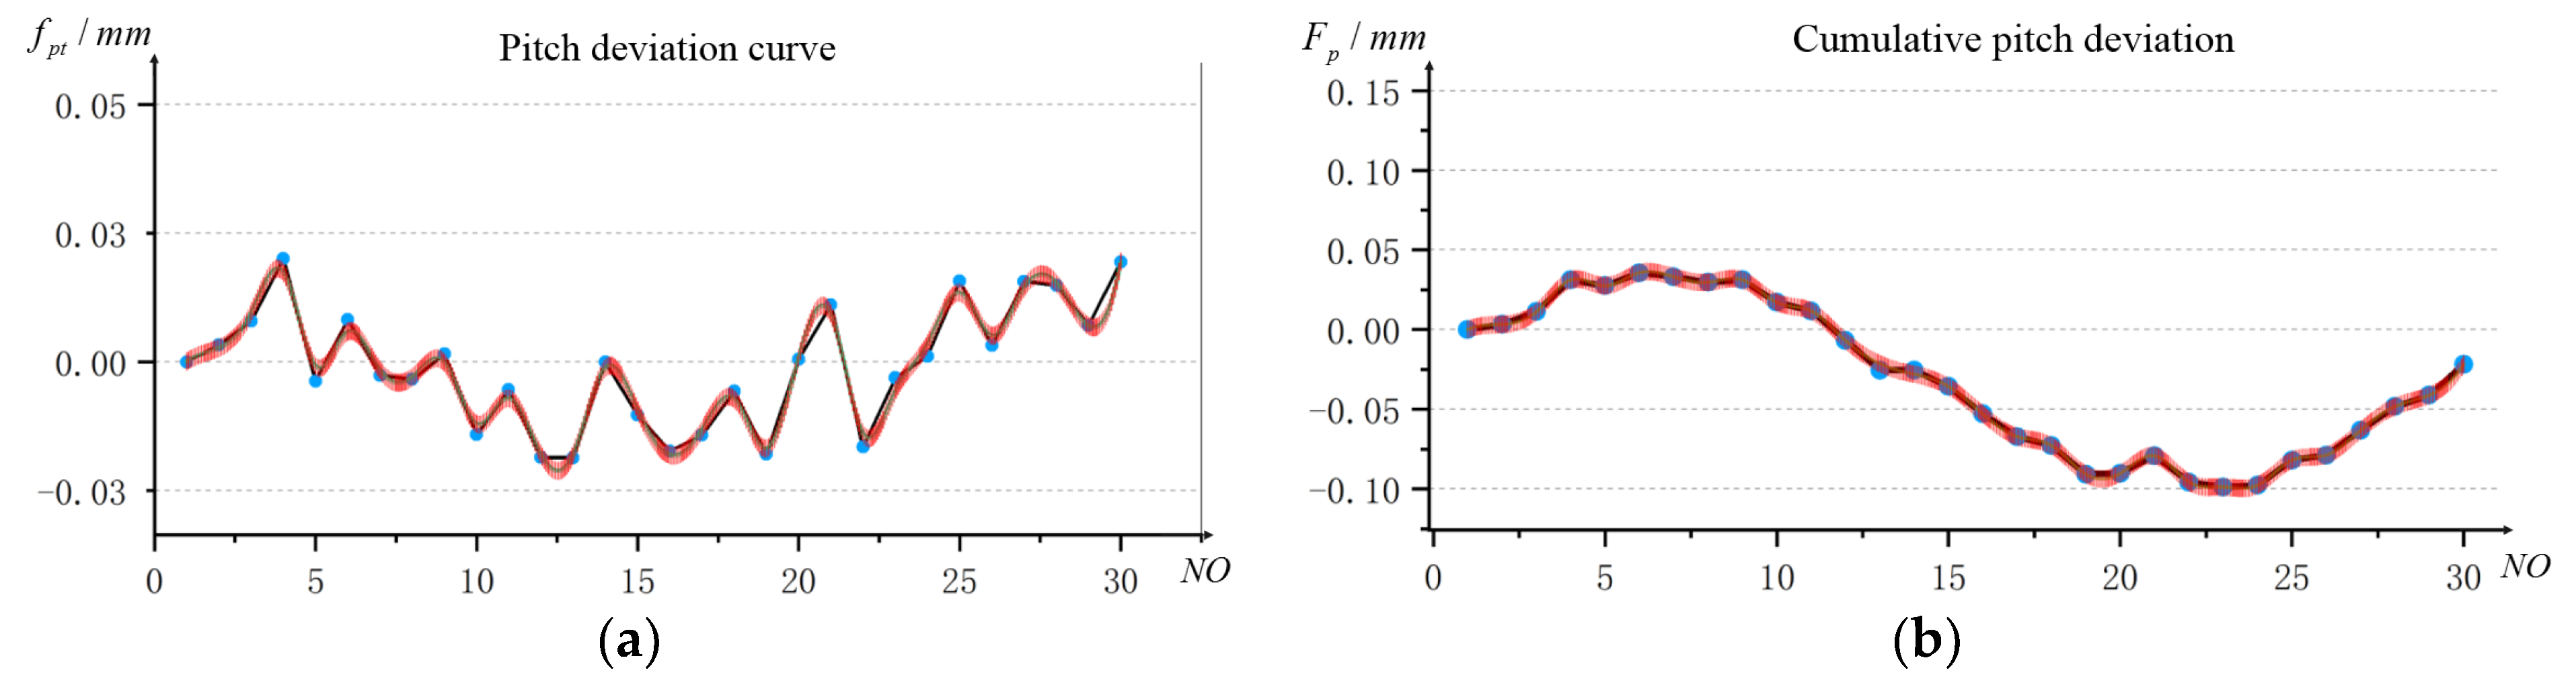
The color mapping of the overall pitch deviation is shown in the same way as above. Based on the actual model of gear and the formula of the pitch deviation deduced from the third section, the pitch deviation of each gear teeth can be calculated separately. Then, interpolate and fit the deviation data, as shown in
Figure 15a, calculate the accumulated deviation of the pitch on 30 equal-pitch gear sections according to the pitch deviation on a single tooth, and fit the curve based on the cubic B-spline principle, as shown in
Figure 15b.
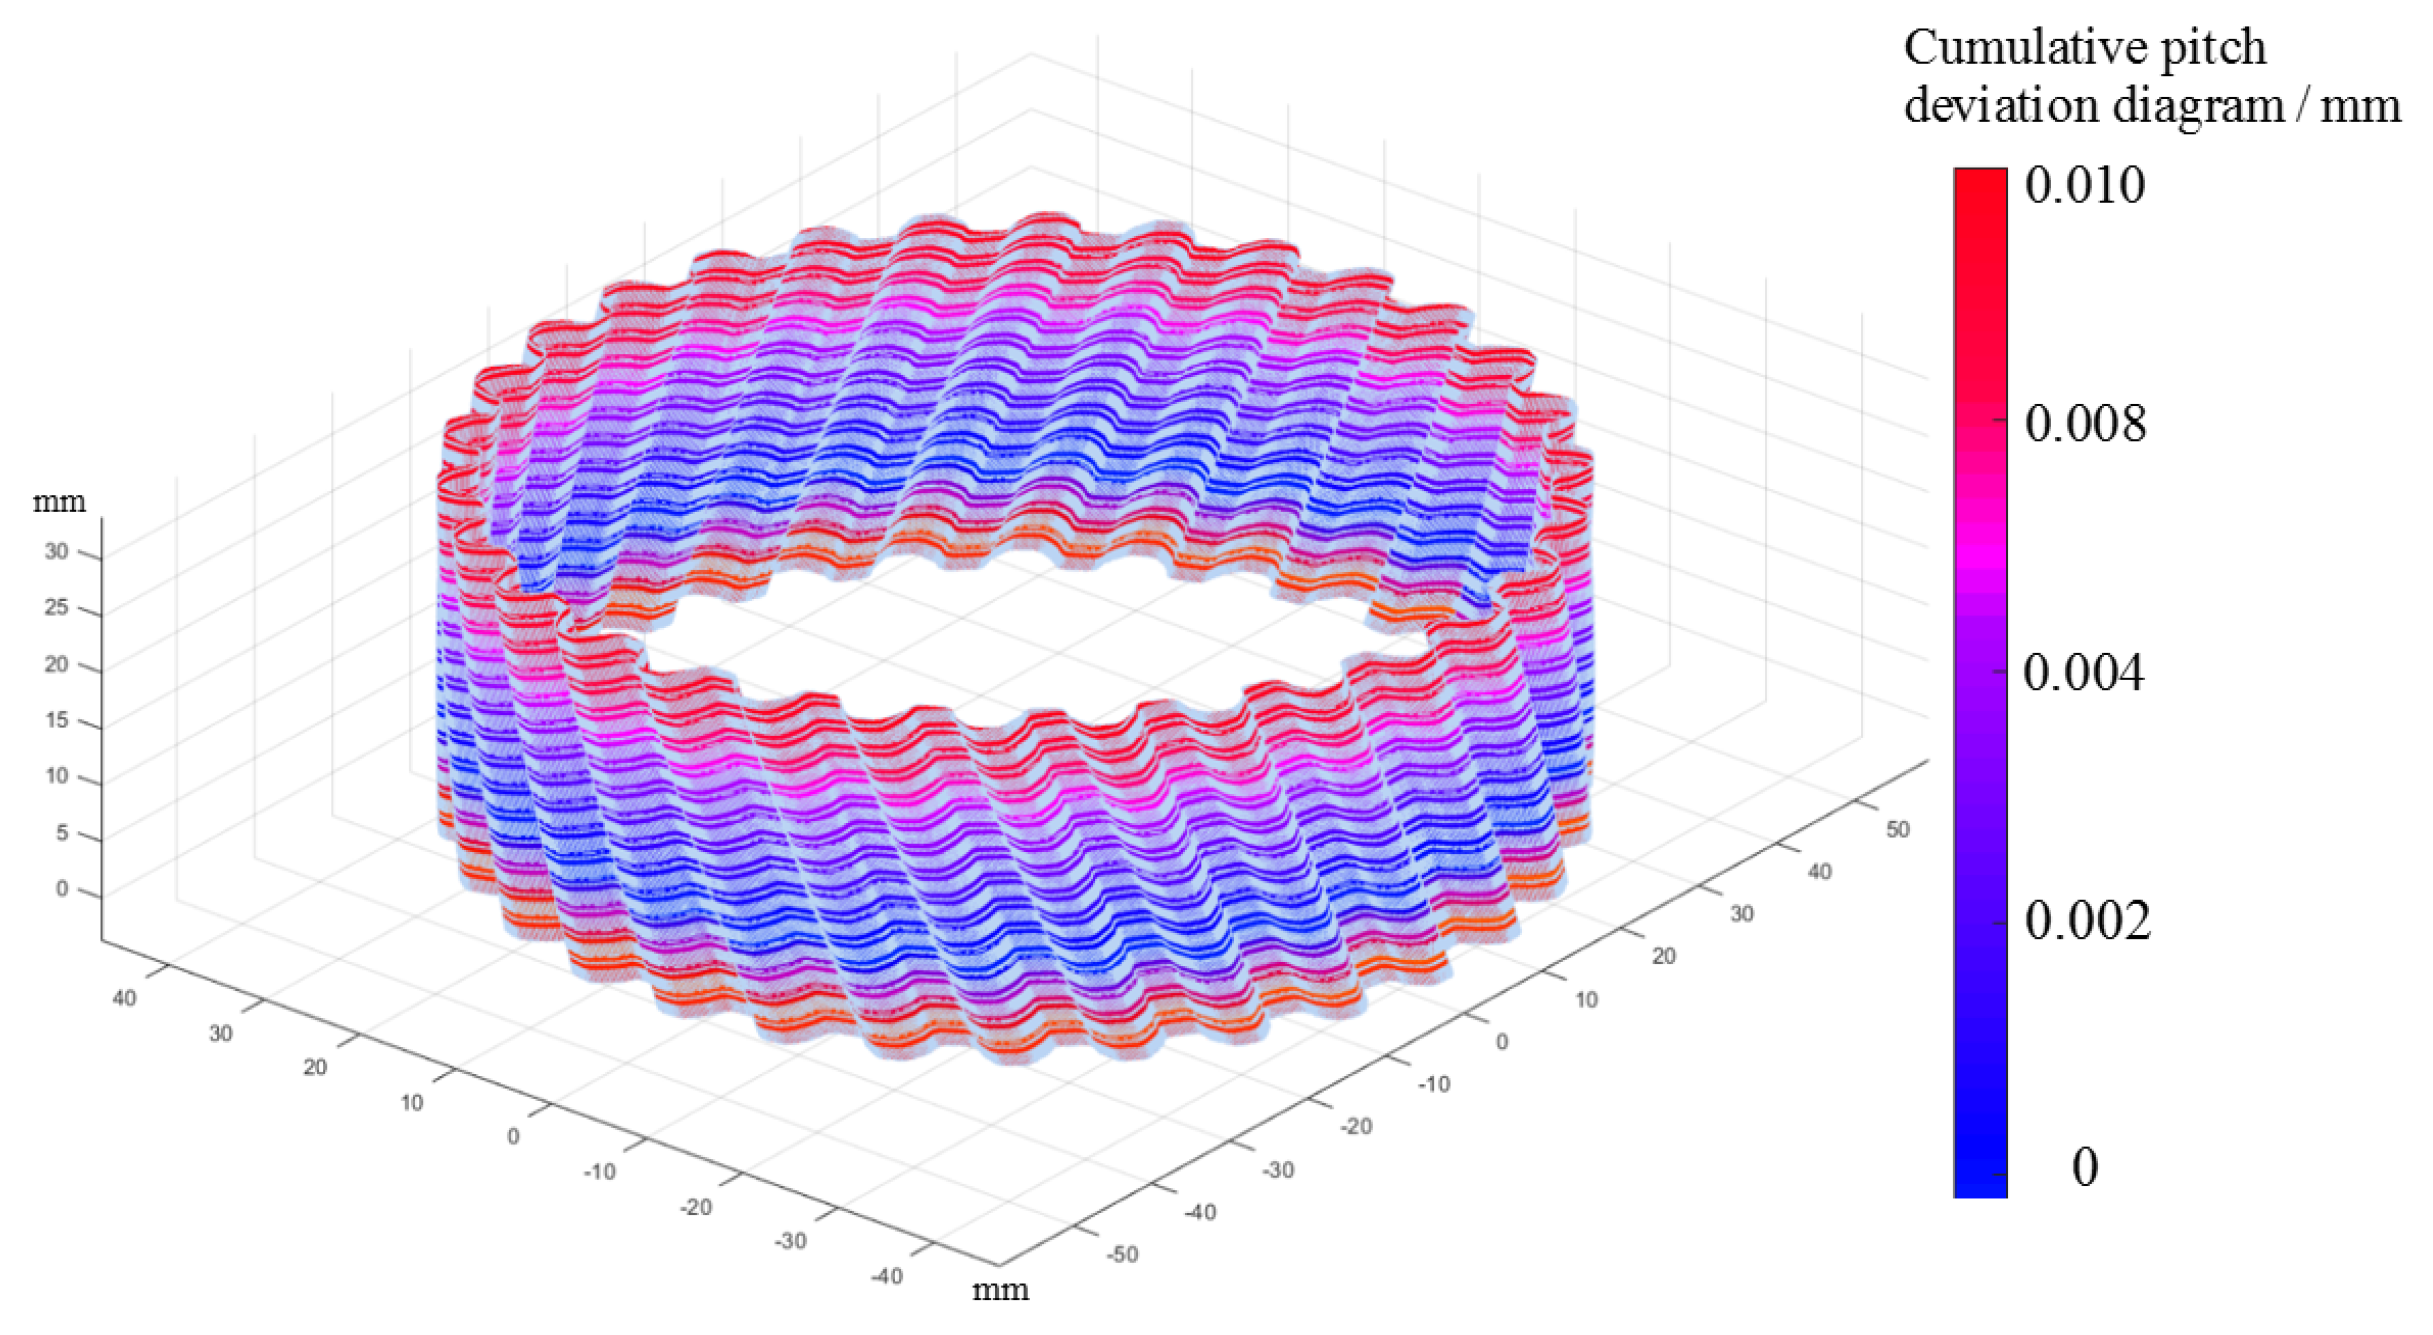
To facilitate the analysis of the overall deviation of the pitch, the absolute value of all the pitch deviations is taken first. Then, according to
Figure 15b, the cumulative deviation of the tooth pitch on the selected 30 gear sections is marked on the actual surface of the gear in the form of color mapping, as shown in
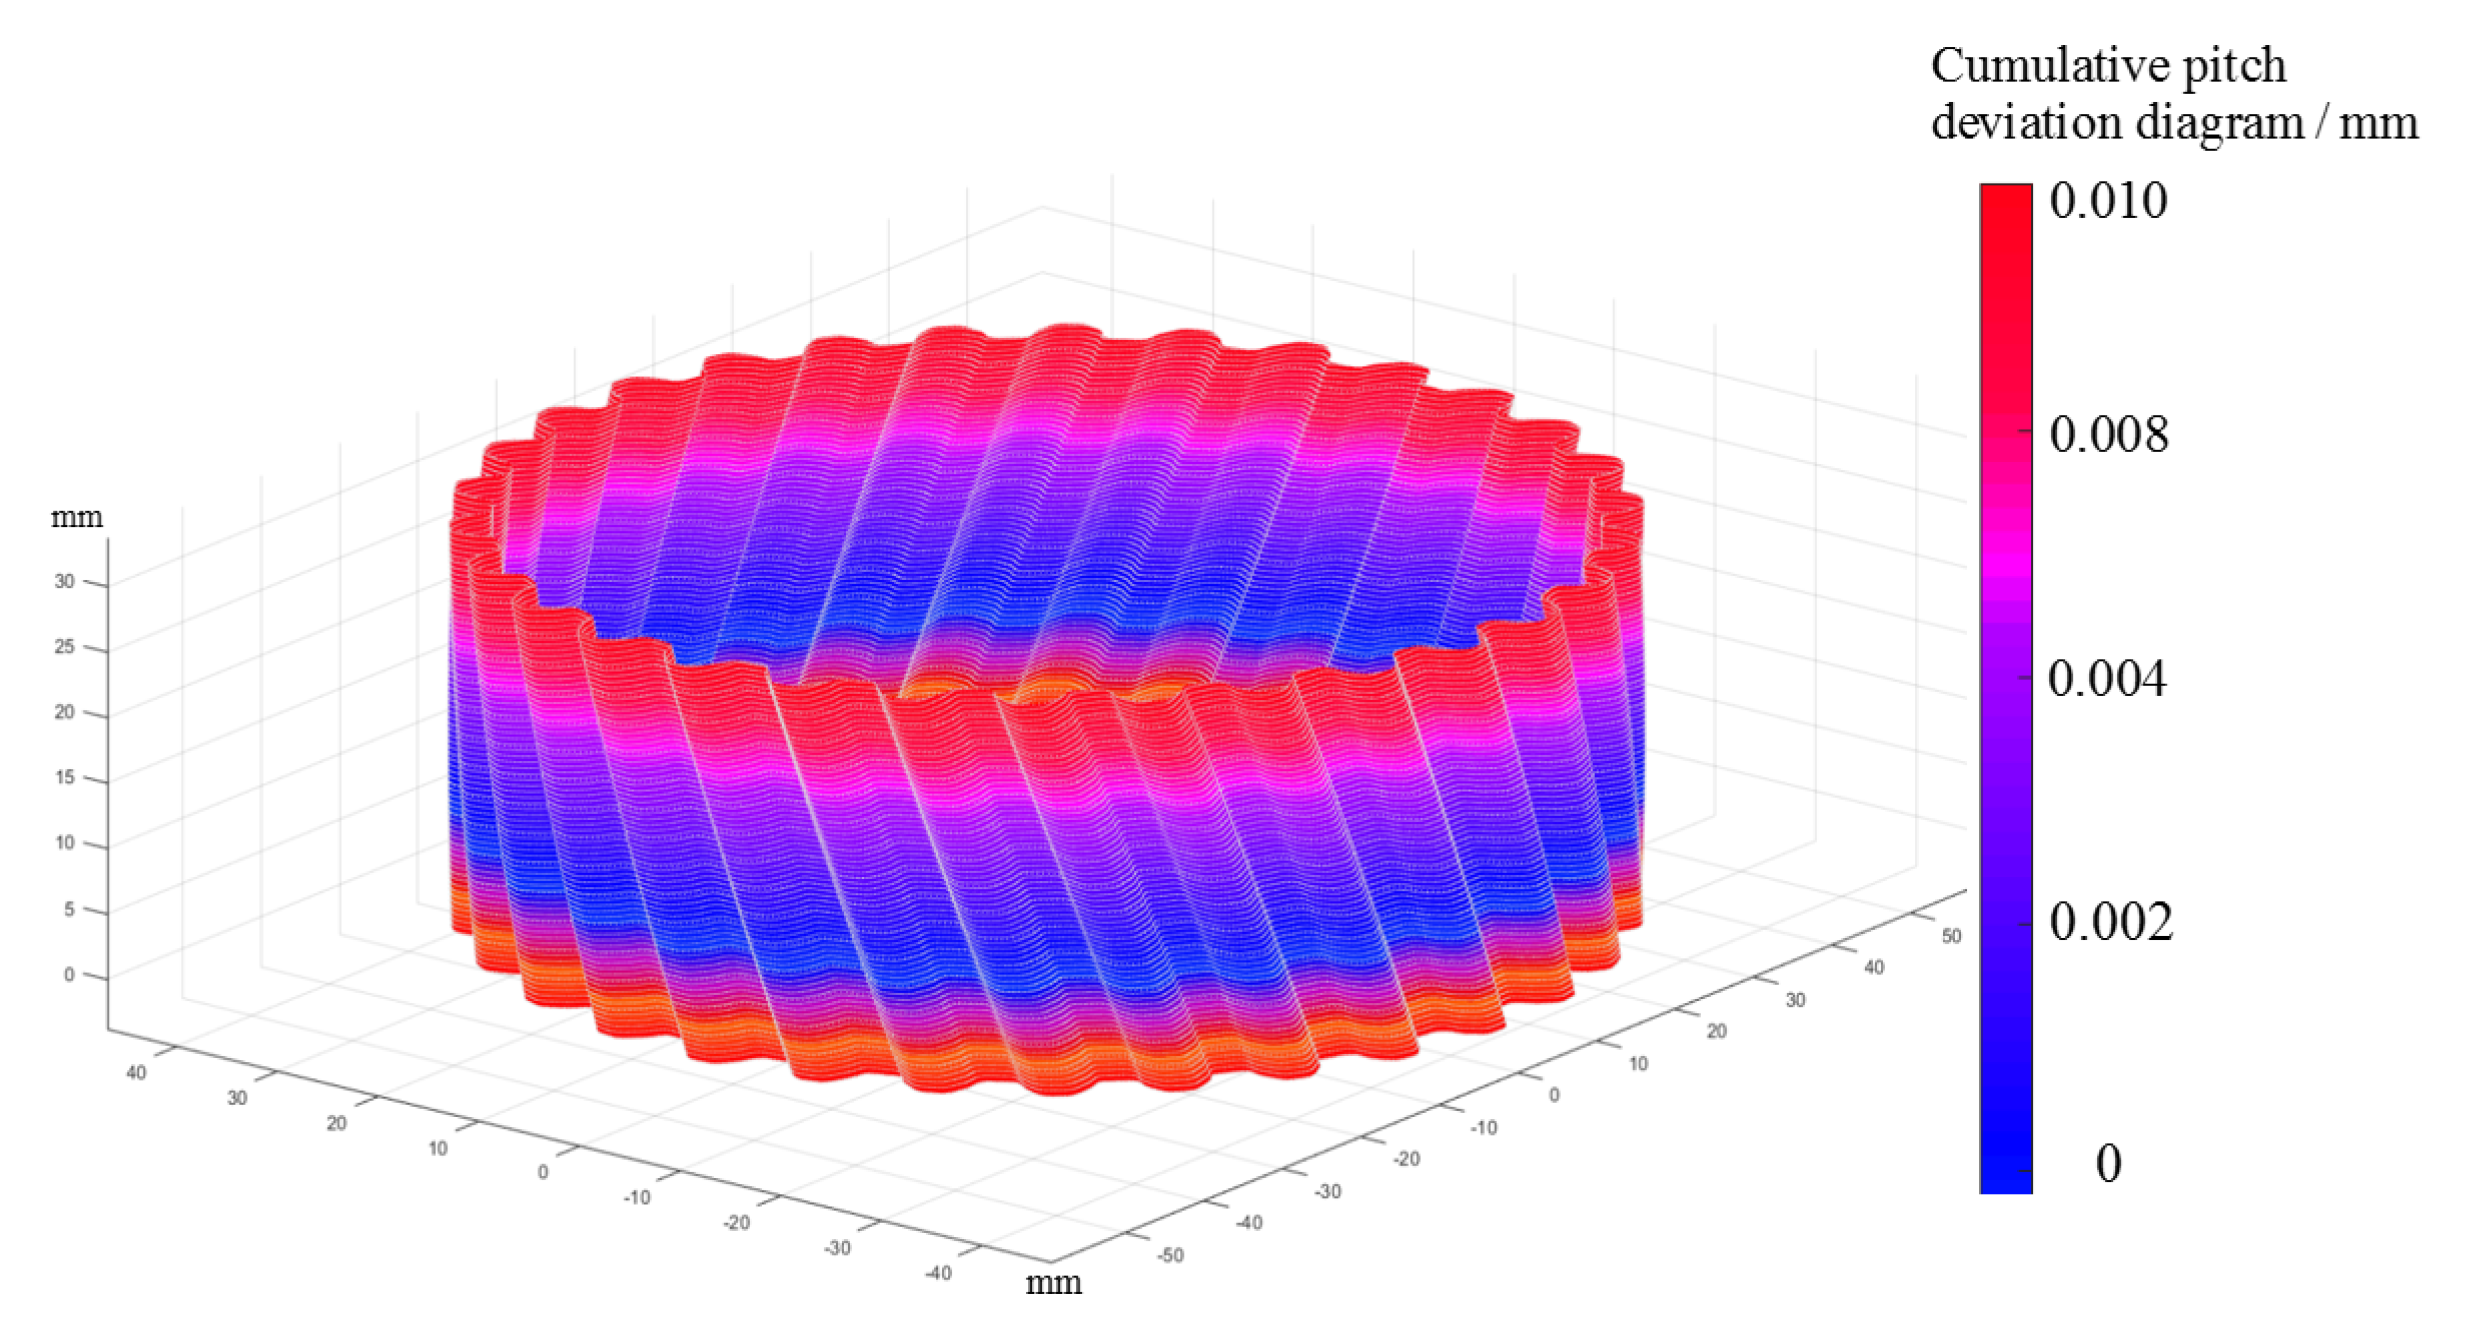
Figure 16. According to the cumulative deviation curve of the pitch, the color mapping surface of the overall deviation of the pitch on the whole tooth surface is established, as shown in
Figure 17.
It can be observed from the deviation color map in
Figure 17 that the cumulative deviation of the pitch is larger near the end face of the gear, while the deviation in the middle part of the gear is relatively small and the value tends to zero. According to the color map of the pitch deviation, the gear section with the largest cumulative deviation of the pitch is selected for analysis. The calculation shows that the maximum tooth pitch deviation on the selected tooth profile is
, the minimum tooth pitch deviation is
, and the cumulative pitch deviation is
. The deviation meets the accuracy requirements of the six-stage cylindrical gear.
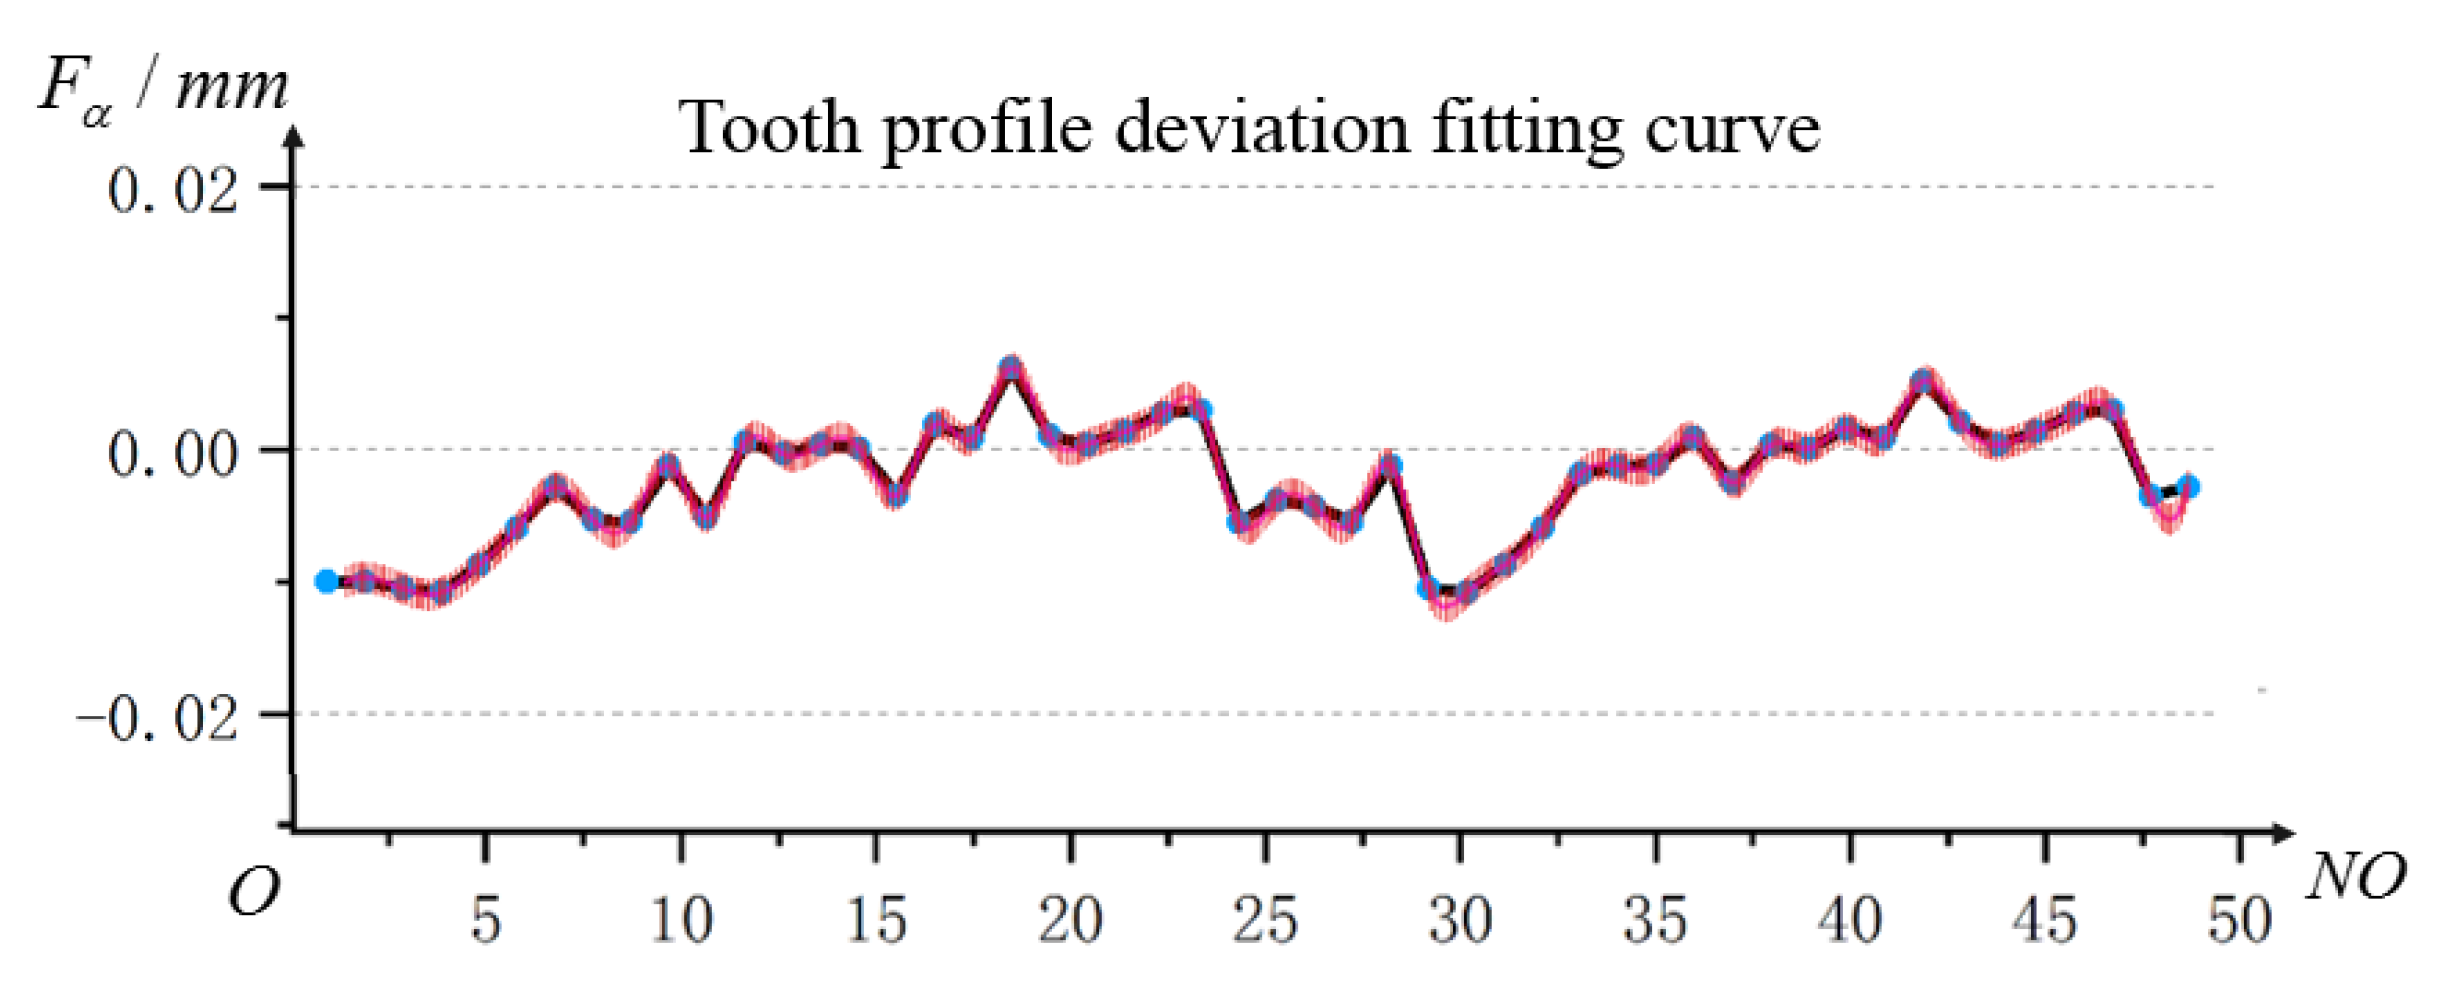
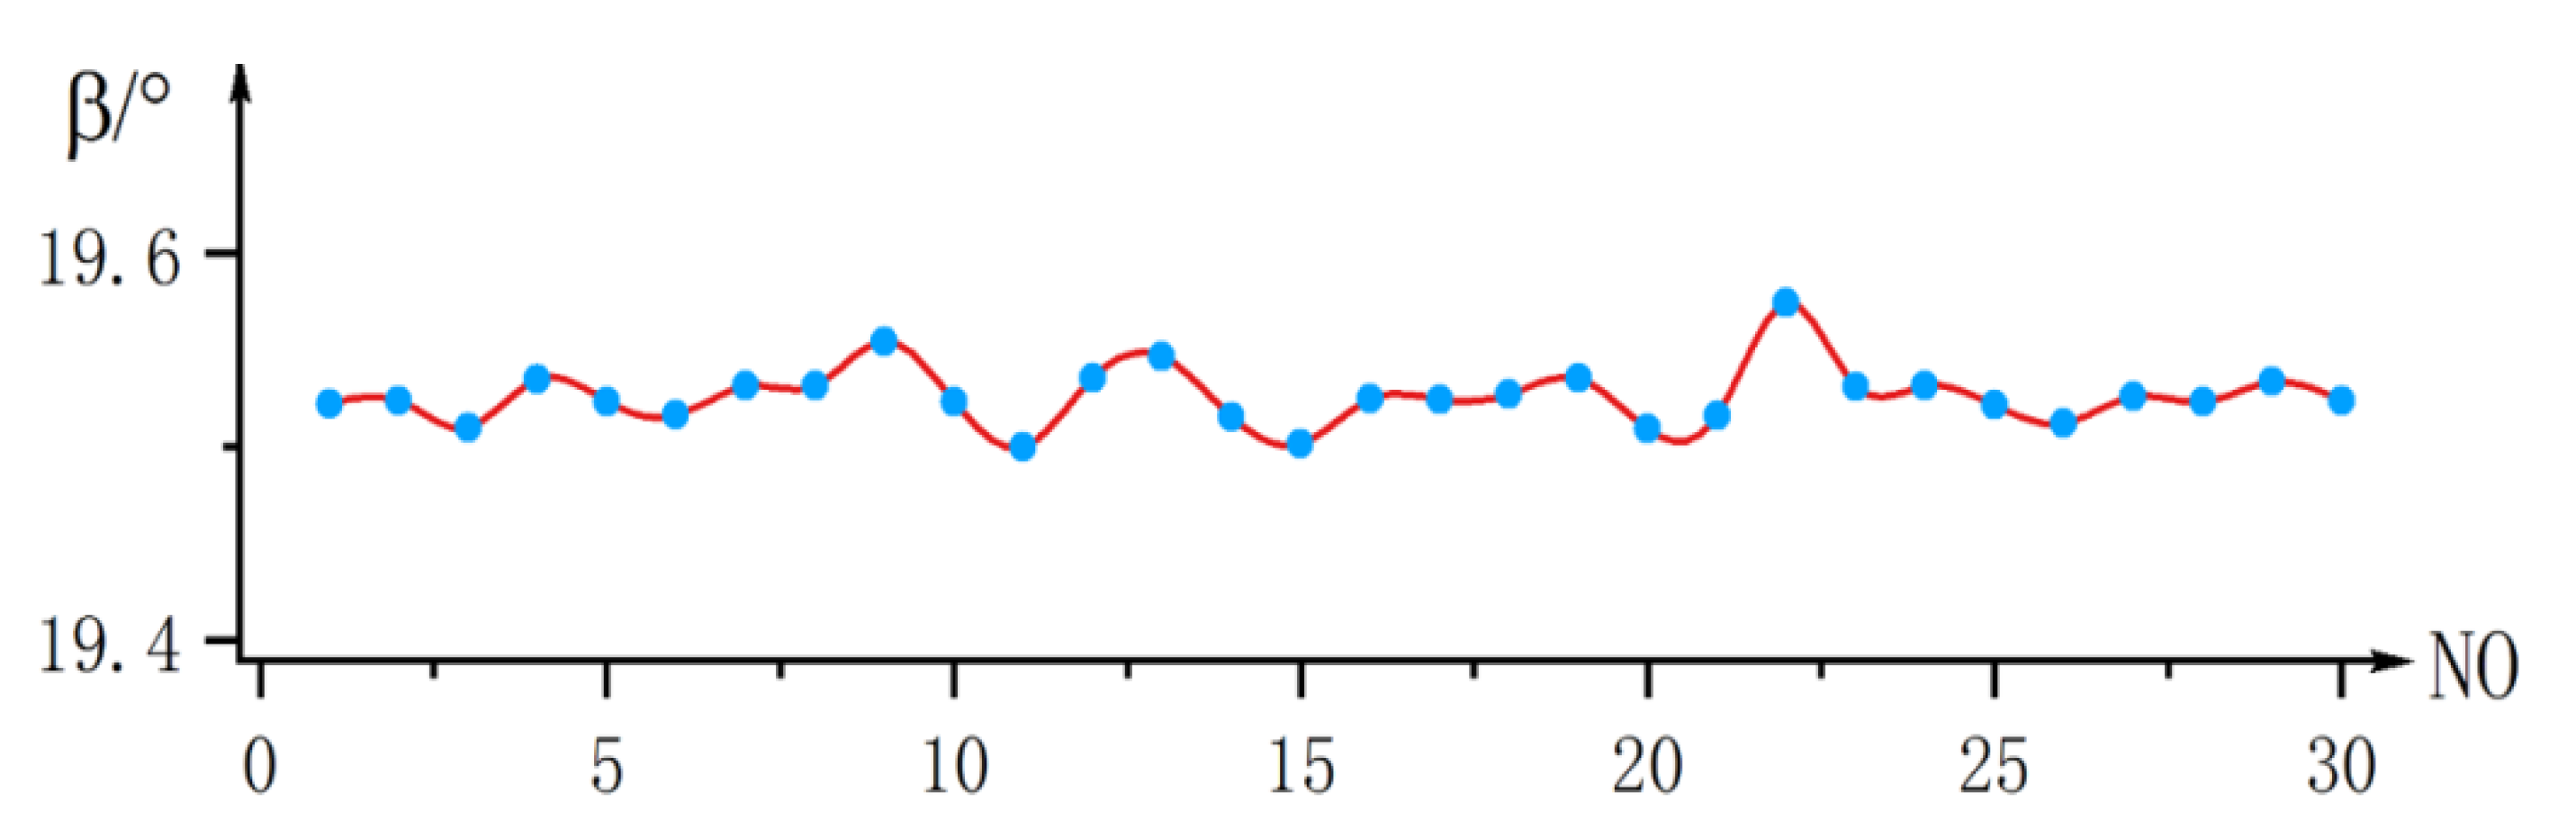
In the same way, this paper also calculates the helix angle of the tooth profile based on the actual tooth profile surface model established. The results are shown in
Figure 18. The number of helix angles is stable in the range of
.
Combine all kinds of deviations of the helical gears measured and check according to the various accuracy evaluation standards of cylindrical gears. It can be observed that the measured deviations of the tooth profile, pitch, and helix angle of the helical gears are all within the 6th-grade gear accuracy range. It also verifies the correctness of the theoretical innovation and the reliability of the measurement software.
7. Conclusions
In this paper, we proposed an innovative method for measuring and visualizing the integral deviation of a non-contact gear based on a laser displacement sensor. On the basis of the theory in this paper, a measurement platform was built and the deviation measurement analysis software was developed, which realized the precise measurement and visual expression of various deviations of gears, and effectively improved the accuracy and efficiency of measurement. At the same time, it also made the deviation evaluation process more convenient. Compared with the current measurement methods of gear deviation, the method proposed in this paper has the following characteristics:
(1) Based on the principle of laser triangulation, the inclination error of the collected data is compensated by an algorithm. Compared with reducing the data acquisition error by changing the structure of the measurement platform, this method of reducing the data error through an algorithm is more efficient. It can effectively improve the efficiency and accuracy of data collection, and make the data collected by the laser probe more accurate and reliable.
(2) The data measured by the laser probe is converted into three-dimensional space coordinate points by an algorithm, and the coordinate points are fitted to the actual surface of the gear through the 3 × 3 B-spline basis function, and then the actual tooth profile curve on any section of the gear can be obtained. Through this surface fitting method, the collected coordinate points can be further refined to obtain more comprehensive tooth profile data, which provides more data support for subsequent deviation analysis and calculation. The result of the deviation calculation is more real and reliable.
(3) The deviation curves on all the gear sections are surface-fitted to establish the overall deviation model on the gear surface, and then the deviation values are expressed on the actual surface of the gear by color mapping. The overall analysis and visual expression of the gear deviation can reflect the size and distribution of the gear more accurately and comprehensively, so that the process of machining accuracy and quality of gear is more convenient and accurate.
(4)Based on the above theory, a laser measurement platform was built and the gear measurement control and deviation analysis software was developed. The experiment shows that the measuring platform can quickly locate, neutralize, and measure the gear. Moreover, there is no need to plan the measurement path in advance and the measurement accuracy reaches the micron level. In addition, the detection results can be expressed visually, making the process of deviation evaluation more convenient.
In general, the method proposed in this paper is more suitable for the accurate measurement of the deviation of some standard gears, but it is difficult to measure the deviation of some special gears and large gears. In addition, this paper only compensates for the inclination error that has the greatest impact on the data acquisition error. In fact, there are many factors affecting the acquisition accuracy of the laser sensor. In the future, the method will further optimize the accuracy of data acquisition and the applicability of special gears.


