Article

3D Reconstruction of High Reflective Welding Surface Based on Binocular Structured Light Stereo Vision

1
School of Mechanical Engineering, University of Jinan, Jinan 250022, China
2
School of Computing and Engineering, University of Huddersfield, Huddersfield HD1 3DH, UK
3
EPSRC Advanced Metrology Hub, University of Huddersfield, Huddersfield HD1 3DH, UK
4
College of Mechanical Engineering, Zhejiang University, Hangzhou 310027, China
*
Author to whom correspondence should be addressed.
Machines 2022, 10(2), 159; https://doi.org/10.3390/machines10020159
Submission received: 14 January 2022 / Revised: 10 February 2022 / Accepted: 17 February 2022 / Published: 20 February 2022
(This article belongs to the Special Issue Precision Measurement and Machines)

Abstract

:
The inspection of welding surface quality is an important task for welding work. With the development of product quality inspection technology, automated and machine vision-based inspection have been applied to more industrial application fields because of its non-contact, convenience, and high efficiency. However, challenging material and optical phenomena such as high reflective surface areas often present on welding seams tend to produce artifacts such as holes in the reconstructed model using current visual sensors, hence leading to insufficiency or even errors in the inspection result. This paper presents a 3D reconstruction technique for highly reflective welding surfaces based on binocular style structured light stereo vision. The method starts from capturing a fully lit image for identifying highly reflective regions on a welding surface using conventional computer vision models, including gray-scale, binarization, dilation, and erosion. Then, fringe projection profilometry is used to generate point clouds on the interested area. The mapping and alignment from 2D image to 3D point cloud is then established to highlight features that are vital for eliminating “holes”—large featureless areas—caused by high reflections such as the specular mirroring effect. A two-way slicing method is proposed to operate on the refined point cloud, following the concept of dimensionality reduction to project the sliced point cloud onto different image planes before a Smoothing Spline model is applied to fit the discrete point formed by projection. The 3D coordinate values of points in the “hole” region are estimated according to the fitted curves and appended to the original point cloud using iterative algorithms. Experiment results verify that the proposed method can accurately reconstruct a wide range of welding surfaces with significantly improved precision.

1. Introduction

With the improvement and development of the modern industrial level, welding has become an important industrial processing technology, and welding quality inspection is an important method to ensure the quality of welding. However, a variety of welding defects may occur in the welding process, mainly due to welding workers’ technical level, welding materials, processing environment, and other factors. Welding quality inspection affects not only the appearance of the product, but also the structure and strength of the product, and even causes potential safety hazards [1].
Challenging material and optical phenomena such as high reflective surface areas often present on welding seams tend to produce artifacts such as holes in the reconstructed model using current visual sensors, hence leading to insufficiency or even errors in the inspection result. This research aims at devising an innovative 3D reconstruction technique for high reflective welding surfaces based on binocular style structured light stereo vision. The method starts from extracting a fully lit image for identifying highly reflective regions on a welding surface using conventional computer vision models, including gray-scale, binarization, dilation, and erosion. Then, fringe projection profilometry is introduced to generate point clouds on the interested area.

2. Literature Review

There are many sensors that can be used for welding quality inspection, such as arc audible sound, magneto-optical sensors, radiographic [2], and vision sensors [3].
The arc audible sound method is based on the sound characteristics emerging during the welding process to determine whether the defect is generated. Yusof et al. proposed a method to research the relationship between arc audible sound and weld defect information using wavelet transform [4]. This method can estimate the location of the defect, but its accuracy is not high compared with other inspection methods, and it cannot detect the defects of welds that have already been welded because it relies on sound signals collected during the welding process.
The magneto-optical imaging method is a method based on Faraday’s magneto-optical rotation effect, which inspects the defective condition by detecting the magnetic leakage phenomenon of the weld under magnetic field excitation. Gao et al. compared magneto-optical images of different weld defects by alternating and rotating magnetic fields and found that the optimal excitation magnetic voltage and lift-off value of a rotating magnetic field are 120 V and 20 mm [5]. Although possessing the unique advantage of balanced speed and accuracy, the disadvantage of this method is the complexity of the equipment and its setup.
Radiographic inspection mainly detects defects inside parts by analyzing the attenuation changes of the recording film, which takes advantage of the photosensitive properties of X-rays. Zou et al. proposed an X-ray-based method to detect weld defects in spiral pipes [6]. Although this method has a good detection effect, it can cause harm to the human body due to the nature of X-rays.
In contrast, machine vision-based inspection is a method of detecting defects by calculating the surface topography information of welding seams from the image taken by the industrial camera. Because of the convenience and efficiency of visual inspection technology, it can replace manual detection in many fields, and its application is becoming wider [7,8]. The visual inspection can be used to detect various defects on welded surfaces, such as uneven surface and press marks, and can also detect parameters such as width and height of weld in real time [9,10]. Visual inspection can be divided into passive visual inspection and active visual inspection according to different image acquisition methods and feature extraction methods. Passive visual inspection is similar to manual inspection. The defects are detected by comparing the images of welds collected by the camera with the standard welds [11]. Active visual inspection is a method to obtain a series of 3D parameters by projecting coded patterns onto the measured object, such as binocular structured light stereo vision technology [12].
The 3D reconstruction technology based on structured laser is a method to calculate the surface topography of the measured object according to the modulation of projected laser stripes on the surface. The performance of its reconstruction is affected by the method used to extract the laser stripes, because it is a challenge to accurately extract the center locations of the detected laser stripes. At the same time, in order to reconstruct the entire surface, it needs to add additional mechanical motion to ensure that the laser stripes cover the measured object, which is a disadvantage [13].
The 3D reconstruction technology and defect inspection method based on binocular structured light are applied by many industrial enterprises because of its high efficiency, accuracy, and no damage to the detected parts [
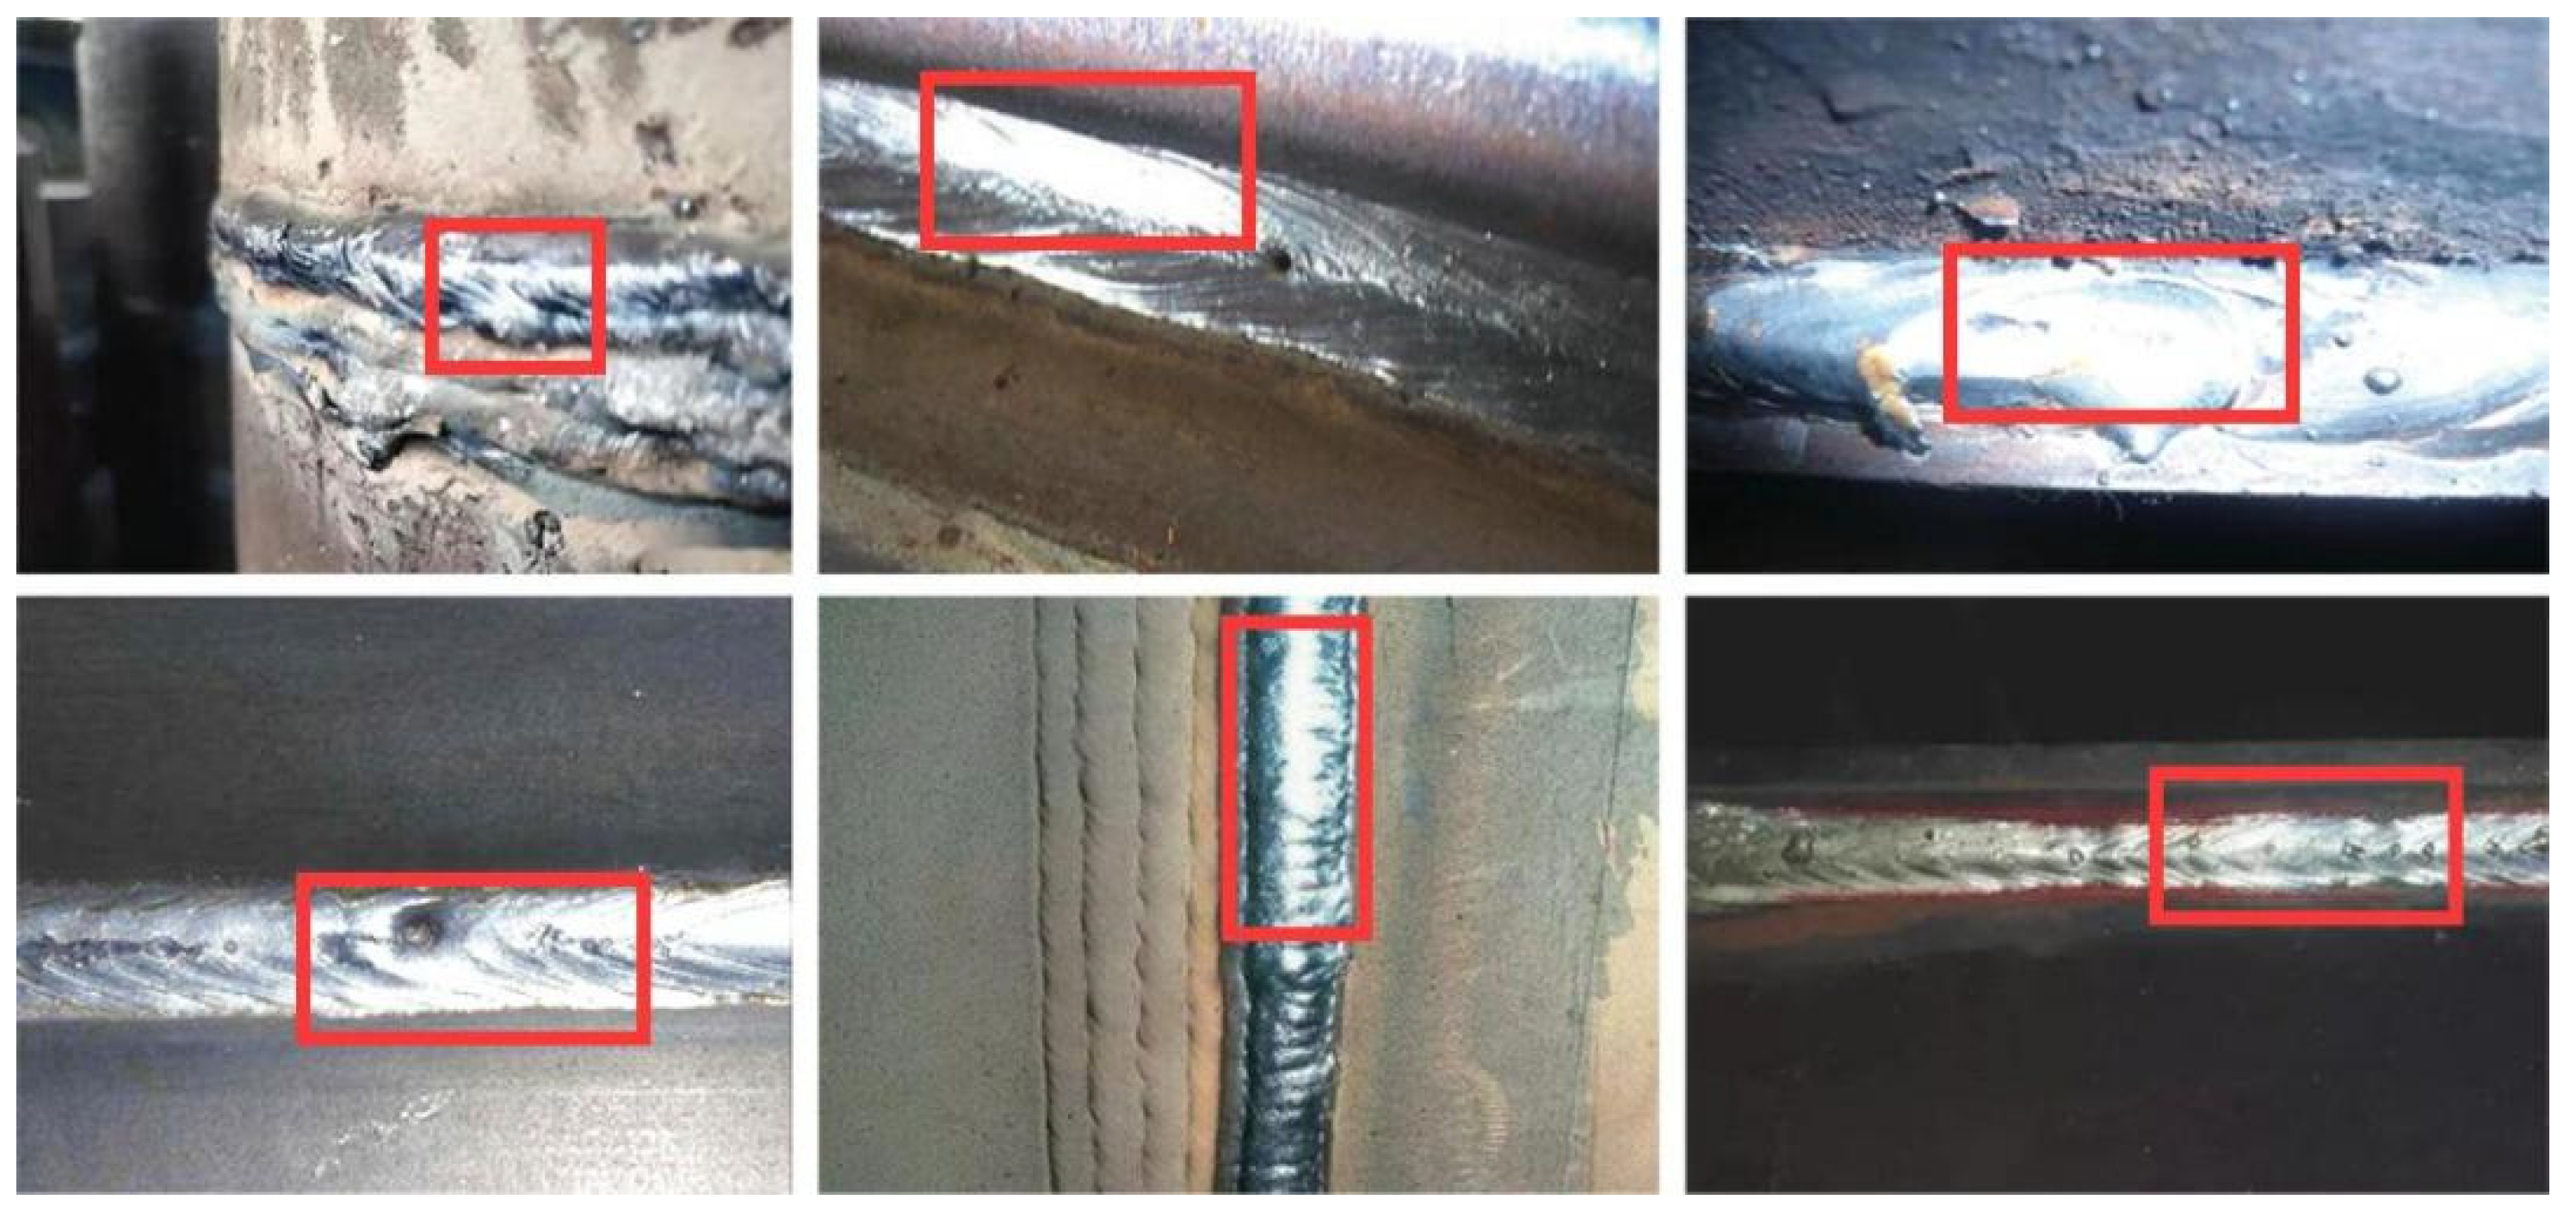
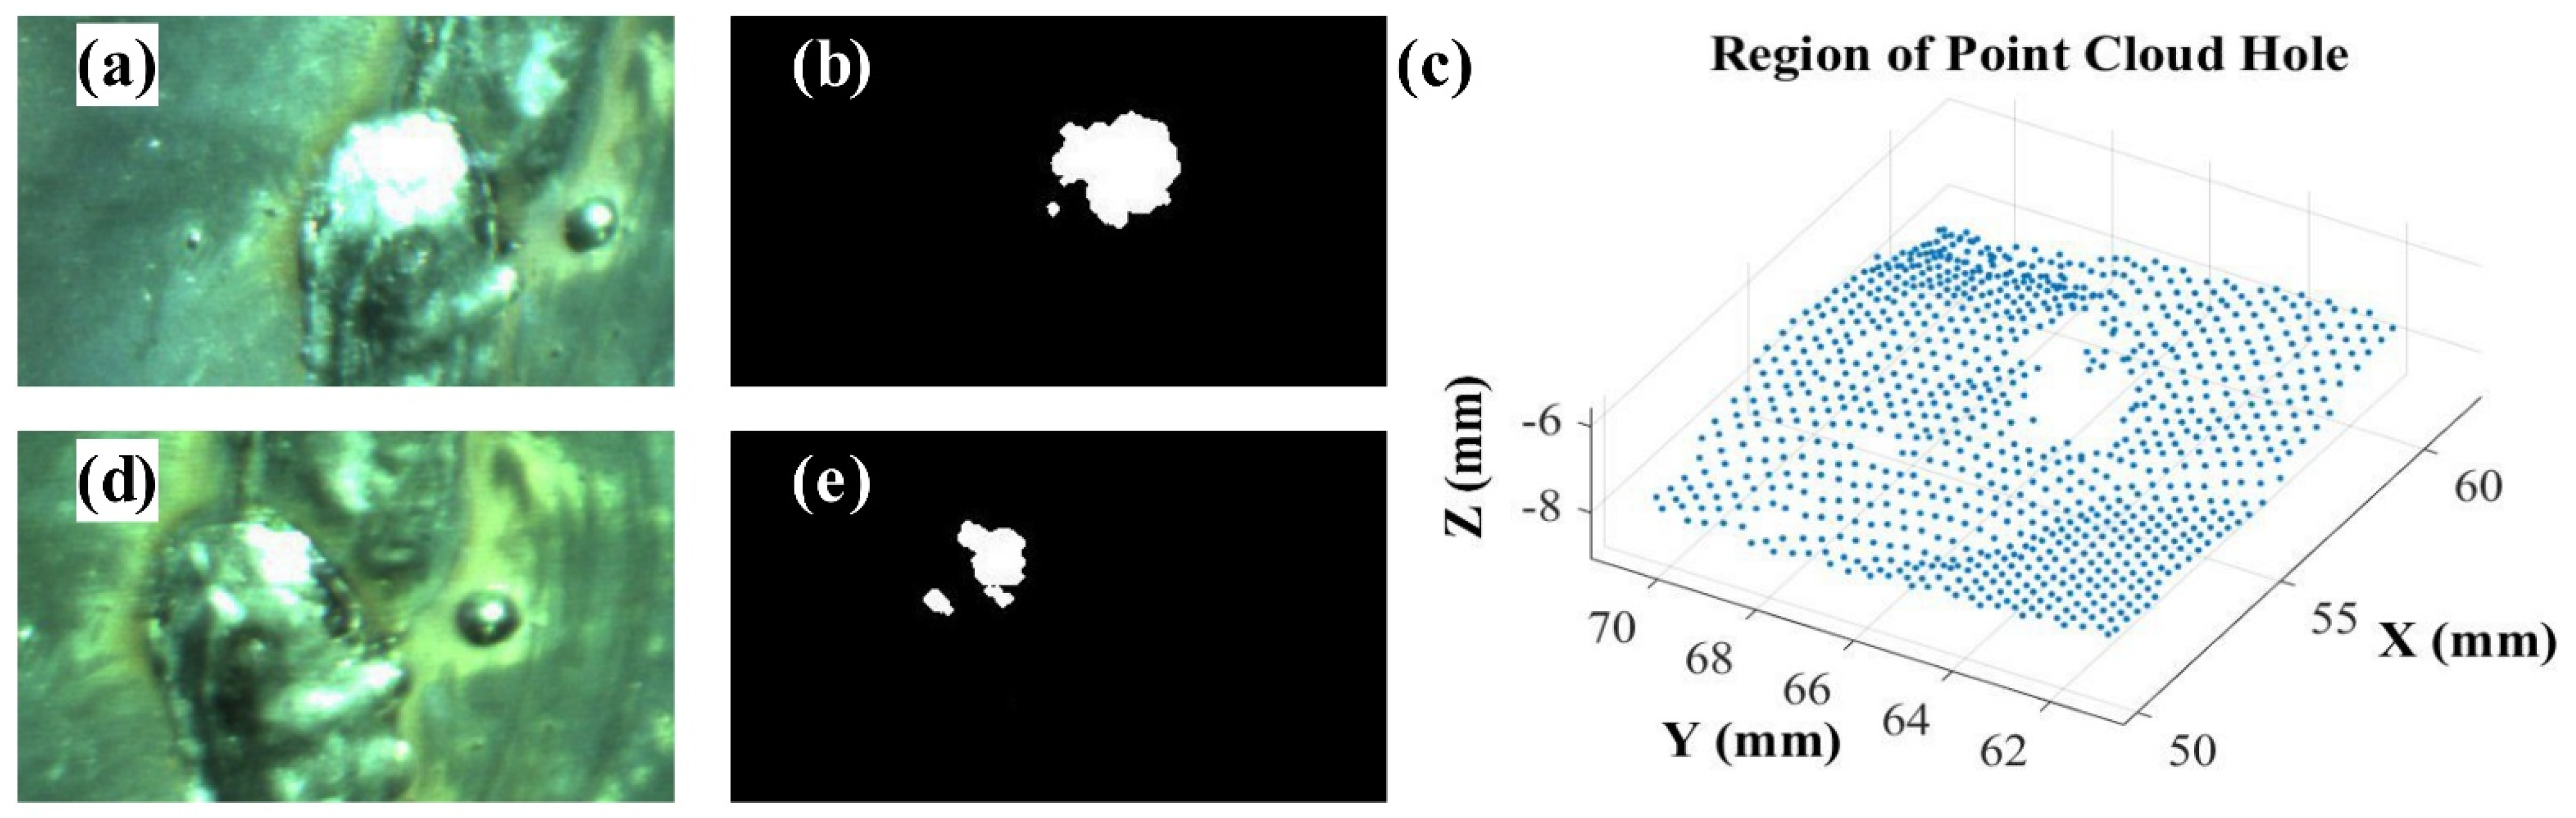
14]. However, binocular stereo vision technology is not ideal for object reconstruction with high reflection on the surface, because it is a method based on 2D images taken by the camera. Due to the phenomenon of overexposure in the high reflection region, as shown in Figure 1, the quality of images taken by the camera will be affected, which will cause the loss of point cloud data, forming holes, and reducing the accuracy of subsequent data analysis. According to the characteristics of the welding process, welding objects in many cases are metal parts of high surface reflection, and the shape of welding surface is mostly curved. Additionally, in some weld surfaces, there will often be some uneven bumps or pits, which aggravate the phenomenon of light reflection. All of these increase the difficulty of applications of visual methods in welding quality inspection [15].
Currently, there are some attempts for 3D reconstruction of highly reflective objects, namely, a few multiple exposure methods, polarization technology, separation of saturated pixels using RGB channels, and machine learning technology. For example, the multiple exposure method is a method to determine suitable projection patterns in different exposure times. Zhang et al. proposed a method to generate a new and suitable fringe pattern by selecting the best pixels from patterns with different exposure times. This method works well but takes a lot of time [16]. Polarization technology refers to the method of using polarizers to filter projected and captured images respectively, so as to obtain better images. However, this method increases the cost of the equipment [17]. The method of the separation of saturated pixels using RGB channels utilizes the different performance of pixels in color space to remove the highly reflective areas [18]. However, sensor noise poses a big challenge for this method. With the development of machine learning technology, the combination of machine learning and fringe projection technology provides a new solution for the 3D reconstruction of high reflective objects. Liu et al. used machine learning to train the exposure time of different surfaces and the number of saturated pixels to solve the problem of high reflection. Although this method achieved good results, the acquisition of training samples has always been a difficult problem for machine learning [19].
This research investigates techniques and models to enable precision 3D reconstruction of complex welding surfaces based on an innovative binocular structured light stereo vision technique. The proposed technique focuses on the analysis and identification of high reflection regions on the welding surface and devising a fitting algorithm for filling the point cloud “holes”—featureless regions—caused by specular or mirroring reflections, hence significantly improving the accuracy of the reconstructed 3D models for manufacturing applications.
This paper is structured as follows: The theories and working principles of the proposed method are described in Section 3; experimental design and benchmarking have been presented in Section 4. Key knowledge contributions and envisaged future works have been highlighted in Section 5.

3. Binocular Structured Light for 3D Reconstruction

3.1. 3D Reconstruction Based on Binocular Structured Light Stereo Vision

Binocular structured light stereo vision technology is an important branch of machine vision. It is a method to obtain 3D geometric information of objects based on the relationship between disparity and depth, which needs to calculate the position deviation of the same point in different images obtained from different cameras. One advantage of this method is that the calibration of the projector is not necessary [20]. The measurement based on binocular structured light stereo vision is described in Figure 2 [21]. In industrial applications, fringe projection profilometry is often used for 3D shape measurement. It can improve the accuracy of 3D reconstruction by projecting structured light with different codes to the measured object to add feature points on the object surface. At present, the commonly used structured light coding methods are gray code, phase shift, and the multi-frequency heterodyne method.

3.2. Identification of High a Reflective Region

It is always a challenge for visual inspection to solve the phenomenon of high reflection on the surface of the measured object because it causes supersaturation of the image taken by the camera, resulting in the loss of effective data and reducing the inspection accuracy. For the binocular structured light stereo vision system proposed in this research, the contour of the welding surface is supposed relatively smooth and the occlusion situation non-existent. Hence, the data loss caused by high reflection is the main reason for the formation of point cloud holes. Therefore, the identification of a high reflective region is a prerequisite in order to improve the visual inspection accuracy of welding seams.

3.2.1. Design the Coding of the Projection Pattern

In order to identify the high reflection region of the object being measured accurately, a fully lit image that can completely illuminate the object is added before the projected coding pattern, as shown in Figure 3. Through the fully lit projection pattern, the camera can take all the high reflective regions of the measured object under the current visual angle, which provides a good foundation for further research. The effect of the first fully lit projection pattern is shown in Figure 4.

3.2.2. Identification of a High Reflective Region on 2D Images

The difficulty of identifying the high reflective region on 2D images is evident because the current image processing technology is very mature. Due to the different position and angle of the two cameras in the binocular stereo vision system, the high reflective region in the image taken by each camera has a certain deviation. In the process of 3D reconstruction, the high reflective phenomenon in the images will lead to the decoding failure of the corresponding region, causing the reconstruction failure of the region and the formation of point cloud holes. Therefore, according to the coding rules of projected patterns, the first images captured by the two cameras are taken as the analysis target, respectively (shown in Figure 5a,d), and the processing results will provide a data basis for subsequent point cloud data processing.
In order to identify the high reflective region in the image, the process is as follows: Firstly, the image is converted to a gray-scale image. Secondly, an appropriate threshold is selected for binarization operation. Then, the noise points in the image are filtered by the dilation and erosion operation, which can make the high reflective region completely closed inside and facilitate the extraction of the region. Finally, the identified high reflective region is expanded by 20 to 30 pixels to the surrounding region as the final high reflective region (shown in Figure 5b,e), of which the aim is to make the region contain enough effective data to facilitate the subsequent hole completion of the point cloud.

3.2.3. Establish the Mapping between 2D Image and 3D Point Cloud

In this research, a key task was to rapidly determine the approximate location of holes in a point cloud using a 2D image to 3D point cloud data. There are two schemes for establishing the mapping between 2D images and 3D point clouds. The first scheme is to use the intrinsic and extrinsic parameters of the camera calculated during camera calibration to build the mapping as described in Equation (1).
zc [ u v 1 ] = K · [ R T 0 1 ] [ Xw Yw Zw 1 ]
where R and T represent the extrinsic parameters of a camera, K denotes the intrinsic parameters, and zc is the depth of a camera. By using Equation (1), a 3D coordinate (Xw, Yw, Zw) in space can be converted to a 2D coordinate (u, v) on the image.
The second scheme is to design a new point cloud data format in which the data not only record the 3D coordinates of a point but also record the coordinate value of the point in each image captured by each camera. The theoretical basis of this design is that the 3D coordinates of the point cloud are calculated using triangulation principles based on the coordinate values of the same target points taken in both cameras in the binocular stereo vision system. Therefore, the coordinate value of the point in the two images can be recorded while the coordinates of the point cloud are recorded. In this way, the mapping between the 2D images and the 3D point cloud can be easily determined through the way of query. The second scheme was adopted in the research. An example of an extracted point cloud is shown in Figure 5c.

3.3. Two-Way Slicing

The slicing method is used by researchers for its advantages of high efficiency and easy operation when analyzing point clouds with a large amount of data and complex shapes. Based on the mapping of the image to point cloud, this paper proposes a two-way slicing method (X and Y directions) to perform dimensionality reduction, fitting through estimation.
According to the coordinate value of the image of the high reflective region determined in Section 3.2.2, the point cloud data were cut and the point cloud information with holes generated due to high reflection was extracted. According to the corresponding 2D coordinate (X, Y) of this point cloud, slices were obtained along with the X and Y directions, respectively, with the width of 1 to 2-pixel values, as shown in Figure 6.

3.4. Curve Fitting

3.4.1. Determine the Method of Curve Fitting

The slice contains many discrete points in space. The best way to deal with these points is to project them onto a 2D image plane, which can reduce the difficulty of data processing by adopting the idea of dimensionality reduction.
Since the slice thickness is only 1 to 2 pixels, the projected point cloud plane data can basically reflect the morphology of the slice. Curve fitting is generally used to analyze 2D discrete points after projection. At present, the popular curve fitting methods are Cubic Spline Interpolation, Nearest Neighbor Interpolation, Linear Interpolation, and Smoothing Spline method. In this research, essential steps of the aforementioned techniques were used to fit the discrete points. In order to find the most appropriate curve fitting method, the curves fitted by different methods were compared. The results are shown in Figure 7.
The curve fitted by the Cubic Spline Interpolation method has great fluctuation and cannot reflect the real surface topography of the measured object. The reason is that the data mutation of discrete points appears, which is because the distance of some points becomes very close after dimensionality reduction. The curves fitted by the Nearest Neighbor Interpolation and Linear Interpolation are not smooth, which does not correspond to the characteristics of continuous and smooth on highly reflective surfaces. The curve fitted by the Smoothing Spline method has no abnormal fluctuation and is very smooth, which can reflect the real surface topography of the measured object. Thus, the Smoothing Spline method Was adopted as our curve fitting method.

3.4.2. Slice Projection in the XY Plane and Calculate the Intersection of the Fitted Curves

The two slices processed according to the two-way slicing method proposed in Section 3.3 were projected onto the XY plane, respectively, and then the Smoothing Spline method was used for curve fitting to obtain two intersecting curves. The intersection of the two curves was calculated, which can be used as the estimated X and Y of the coordinate of the missing data in the hole region of the point cloud. The results of the projection and the intersection were shown in Figure 8.

3.4.3. Slice Projection in the XZ/YZ Plane and Estimate the Value of Z

The slice in the X direction was projected to the XZ plane, and the projection points were fitted to the curve through the Smooth Spline method. Using the X value of the intersection calculated in Section 3.4.2, we estimated the Z value of this point as Z1. Similarly, the slice in the Y direction was projected to the YZ plane, and Z2 was estimated using the intersection point. Combining the estimated values Z1 and Z2 of the two plane curves, we finally considered Z = (Z1 + Z2) as the final estimated value of this point.
After the curve fitting of the two-way slice on the XY, XZ, and YZ plane, through the calculation of the coordinate value of the intersection point (X, Y) and the estimation of the Z value, the 3D coordinate value of the point at the intersection of the two directions slice was finally estimated as: (X, Y, Z).
It should be noted that when extracting cloud data with holes, the region is expended by 20 to 30 pixels, and the aim is to obtain enough effective points to serve our fitting algorithm. In order to reduce the calculation amount of the program, only the value in the highly reflective region determined in the 2D image was calculated in estimating the point cloud coordinates.

3.5. Point Cloud Complement

In order to make the result of point cloud hole completion closer to the real situation, an iterative algorithm for point cloud completion was designed. The point cloud data estimated by the above method were added to the extracted point cloud. In estimating the next point cloud data, the previous added point cloud estimation value was used as a true value for calculation. Although this increases the complexity of the algorithm, the effect of complement is better. The point cloud after complement is shown in Figure 9.
Through the above process, a point cloud without holes can be obtained. The overall process is shown in Figure 10.

4. Experiment Design and Verification

4.1. Setup of the Binocular Structured Light Stereo Vision System

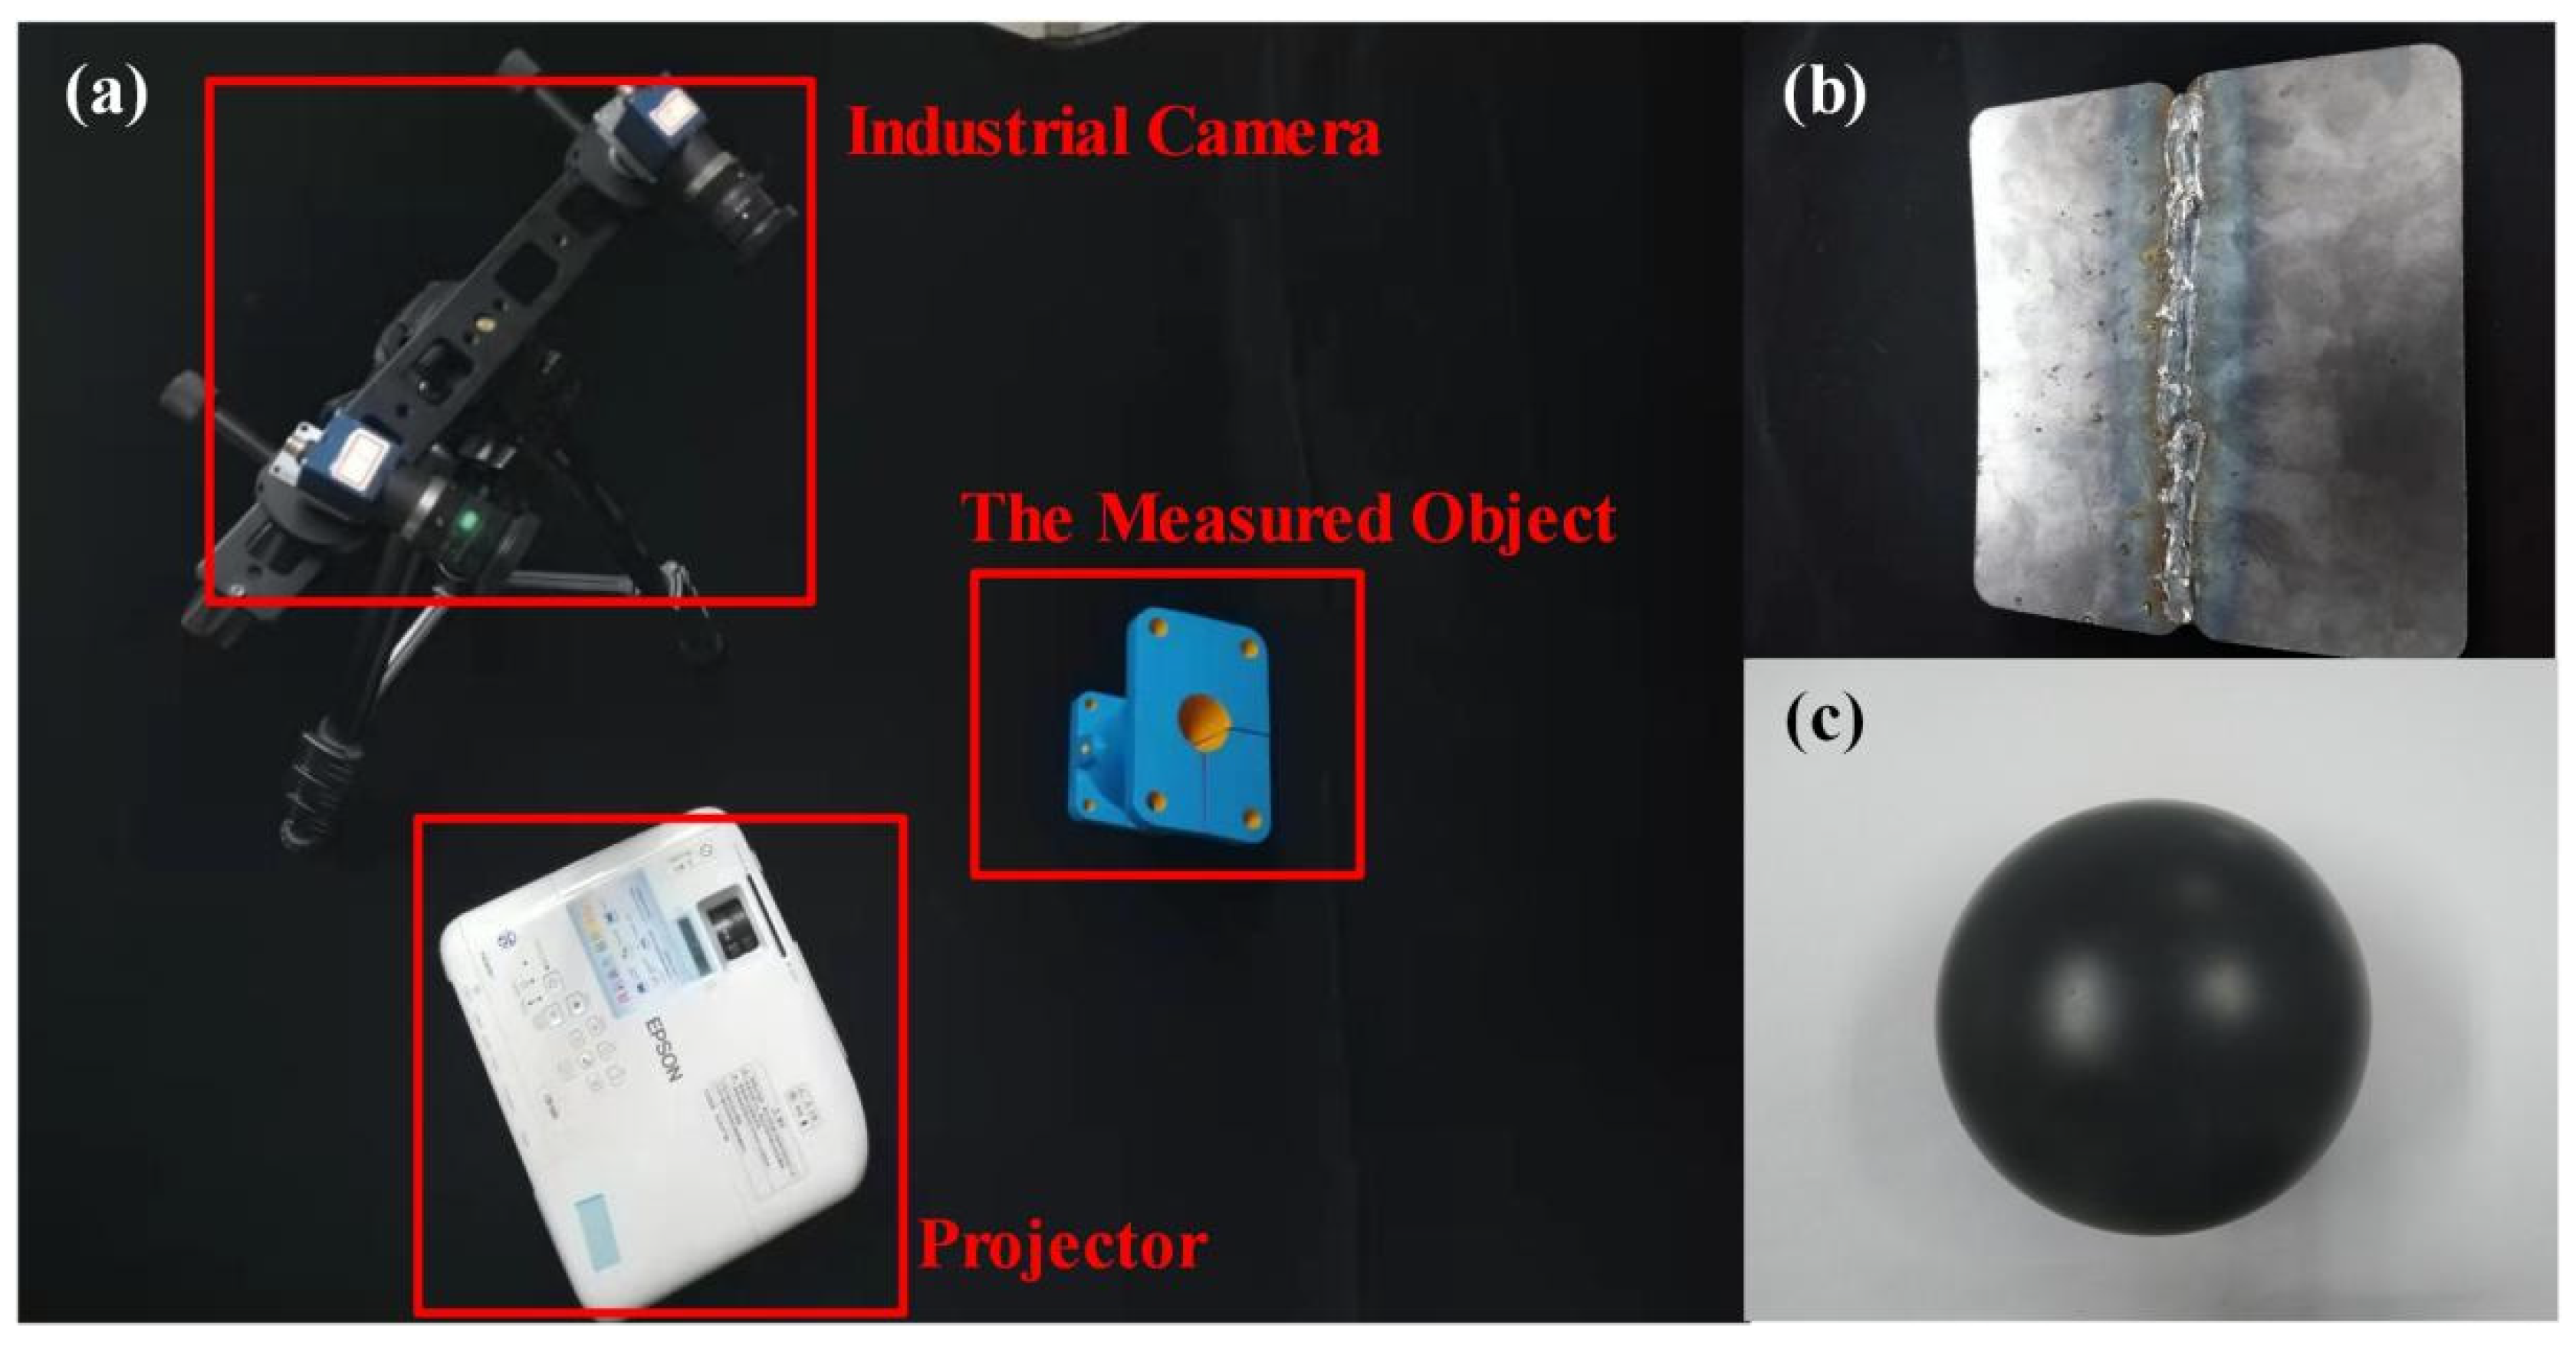
The experimental setup consisted of a projector with a resolution of 1024 × 176 and two industrial cameras with a resolution of 4608 × 3288 shown in Figure 11a. Firstly, the 3D reconstruction system based on the binocular stereo was calibrated, and the internal and external parameters of the two cameras were obtained to calculate the relative position and direction between them. Zhang’s calibration method was used for system calibration, and projection patterns were encoded and decoded with gray codes.

4.2. Measurement Pipeline of a Weld Surface

In order to verify the effectiveness and robustness of the proposed method, a 3D reconstruction of the surface of a weld shown in Figure 11b was performed using the proposed method. In this section, the whole measurement pipeline will be described in detail, including the following steps.
Step 1:
Data collection
The coded structured light pattern is projected to the surface of the measured weld in sequence using a projector, and then two industrial cameras are used to take each pattern modulated by the surface of the measured weld.
Step 2:
Identify the high reflective region
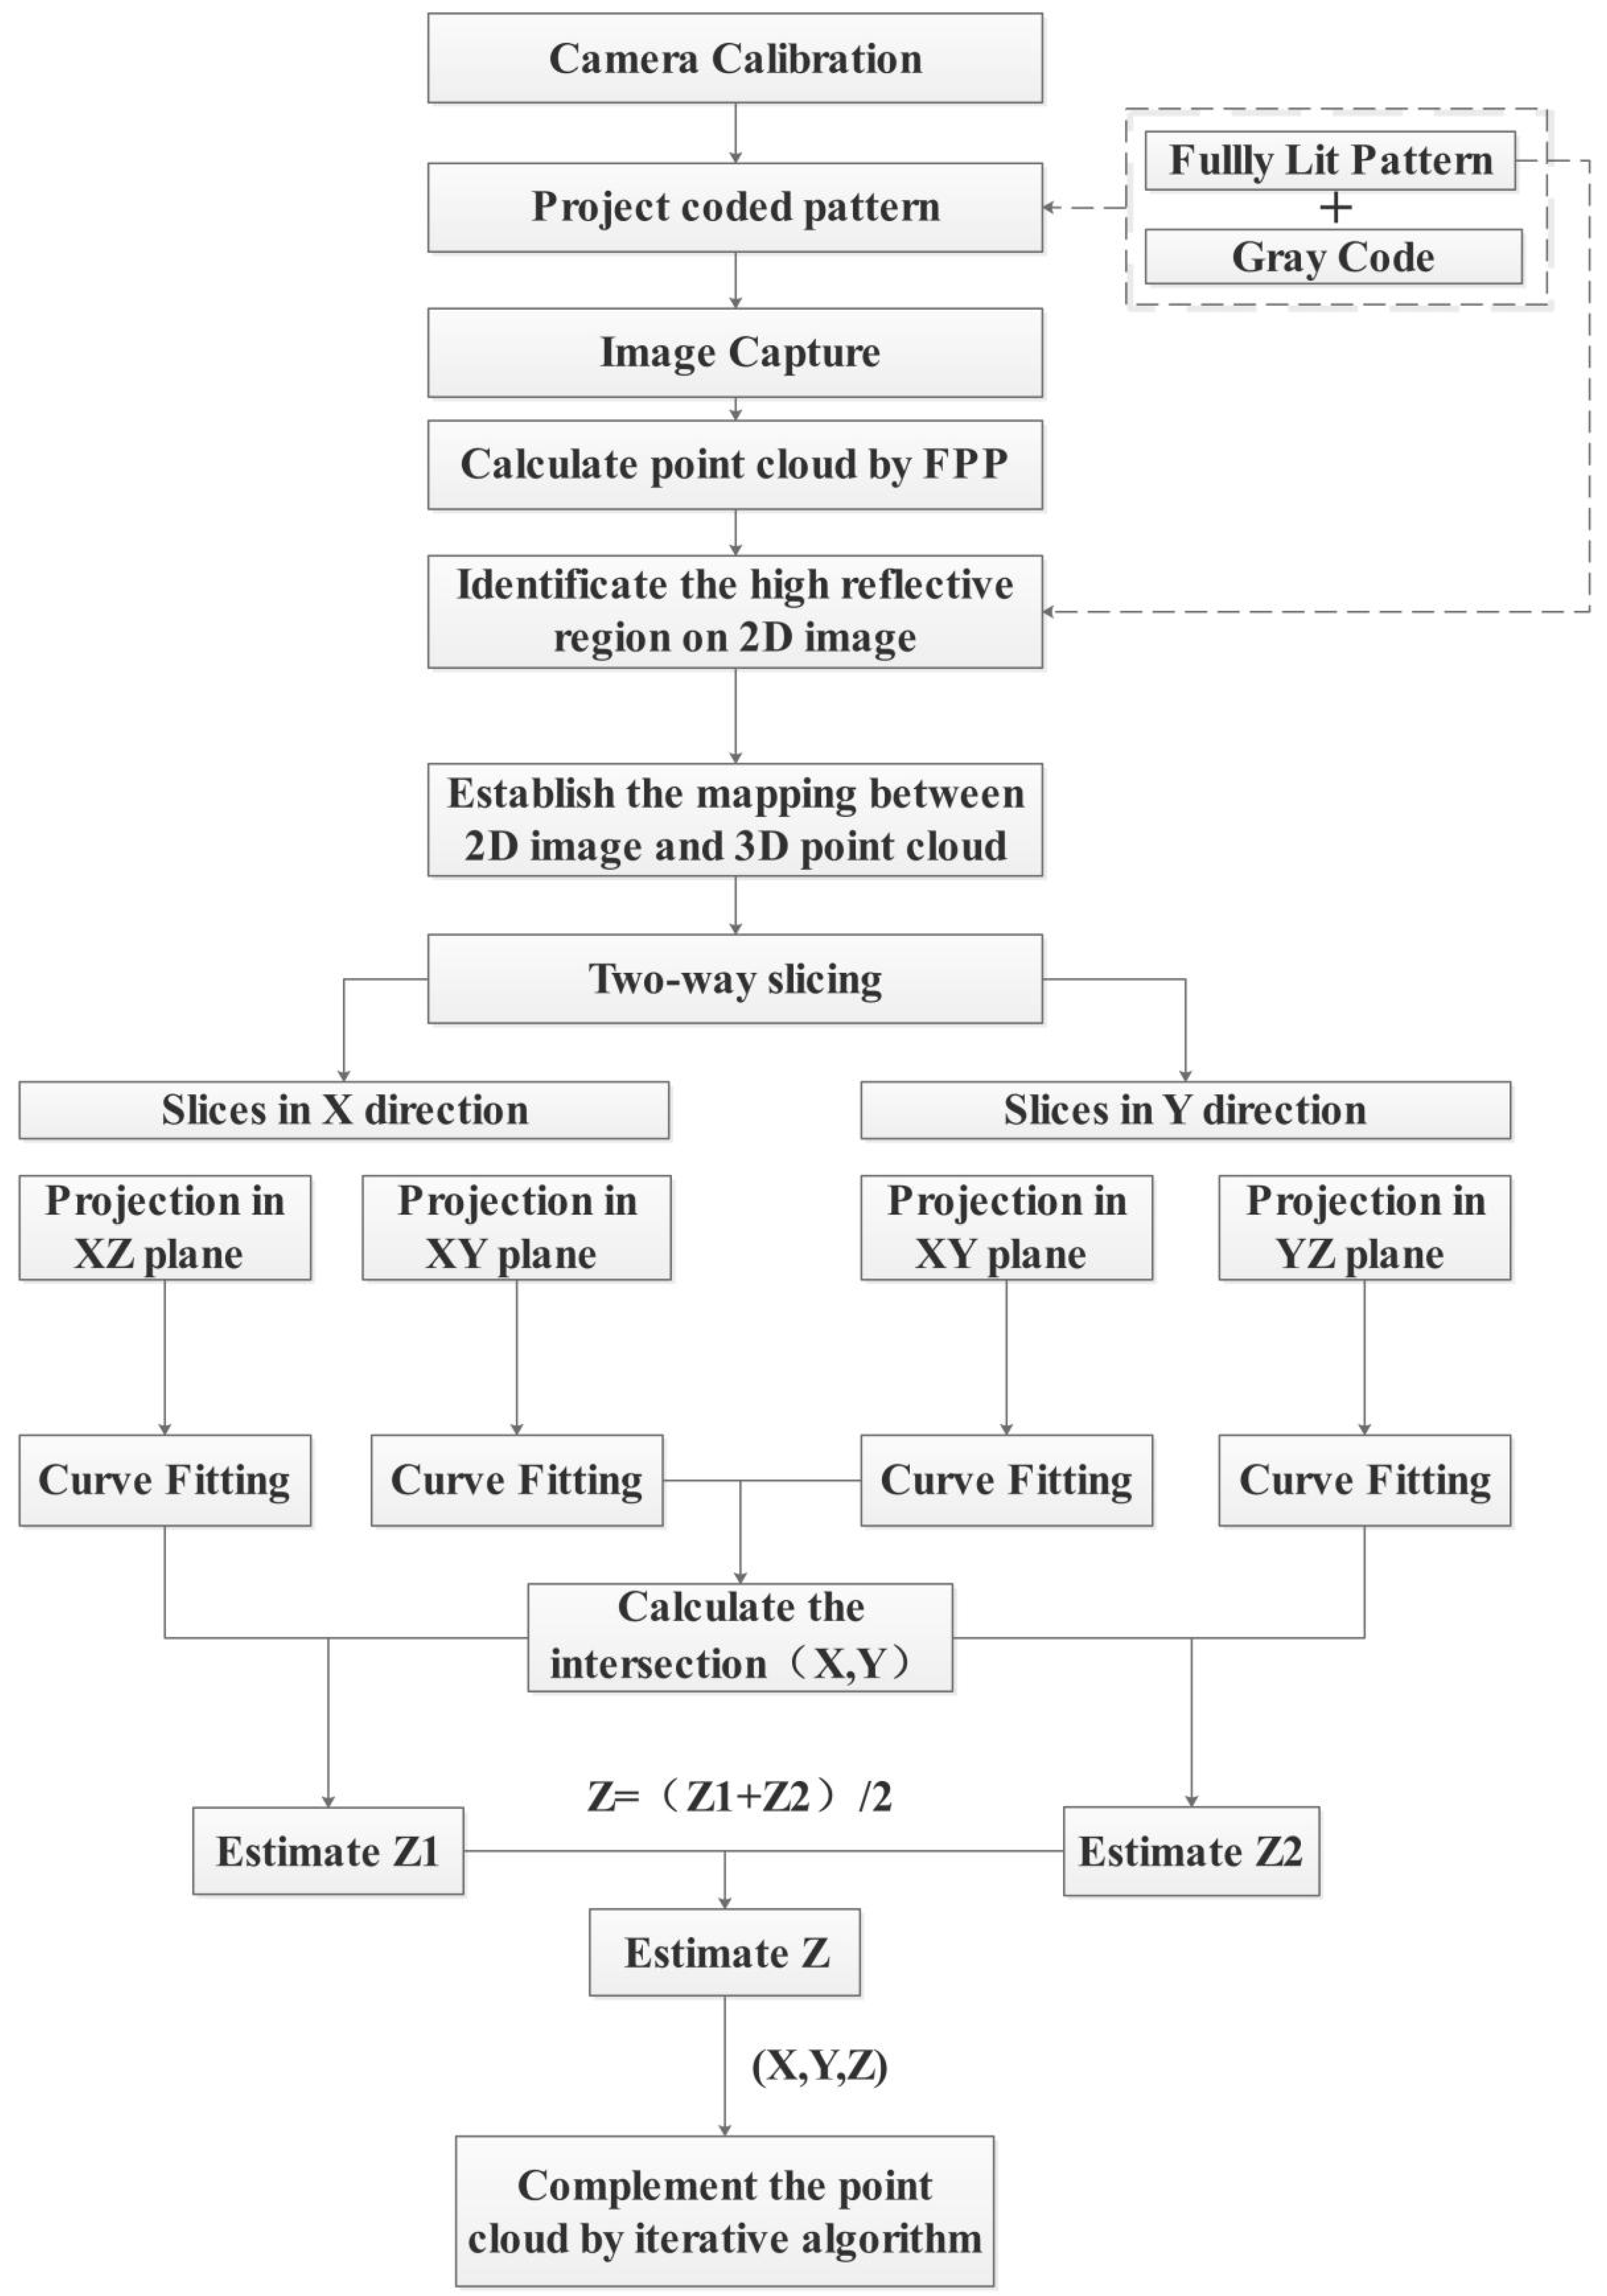
According to the algorithm pipeline, the first image collected by the two cameras is extracted for analysis. Through image processing operations such as gray-scale, binarization, dilation, and erosion, the coordinate set of images in a highly reflective region is obtained. The xy coordinate range of the point cloud of the high reflective region is determined by expanding the high reflective region by 30 pixels in 2D images. Based on this coordinate range, the point cloud that needs to be complemented is extracted.
Step 3:
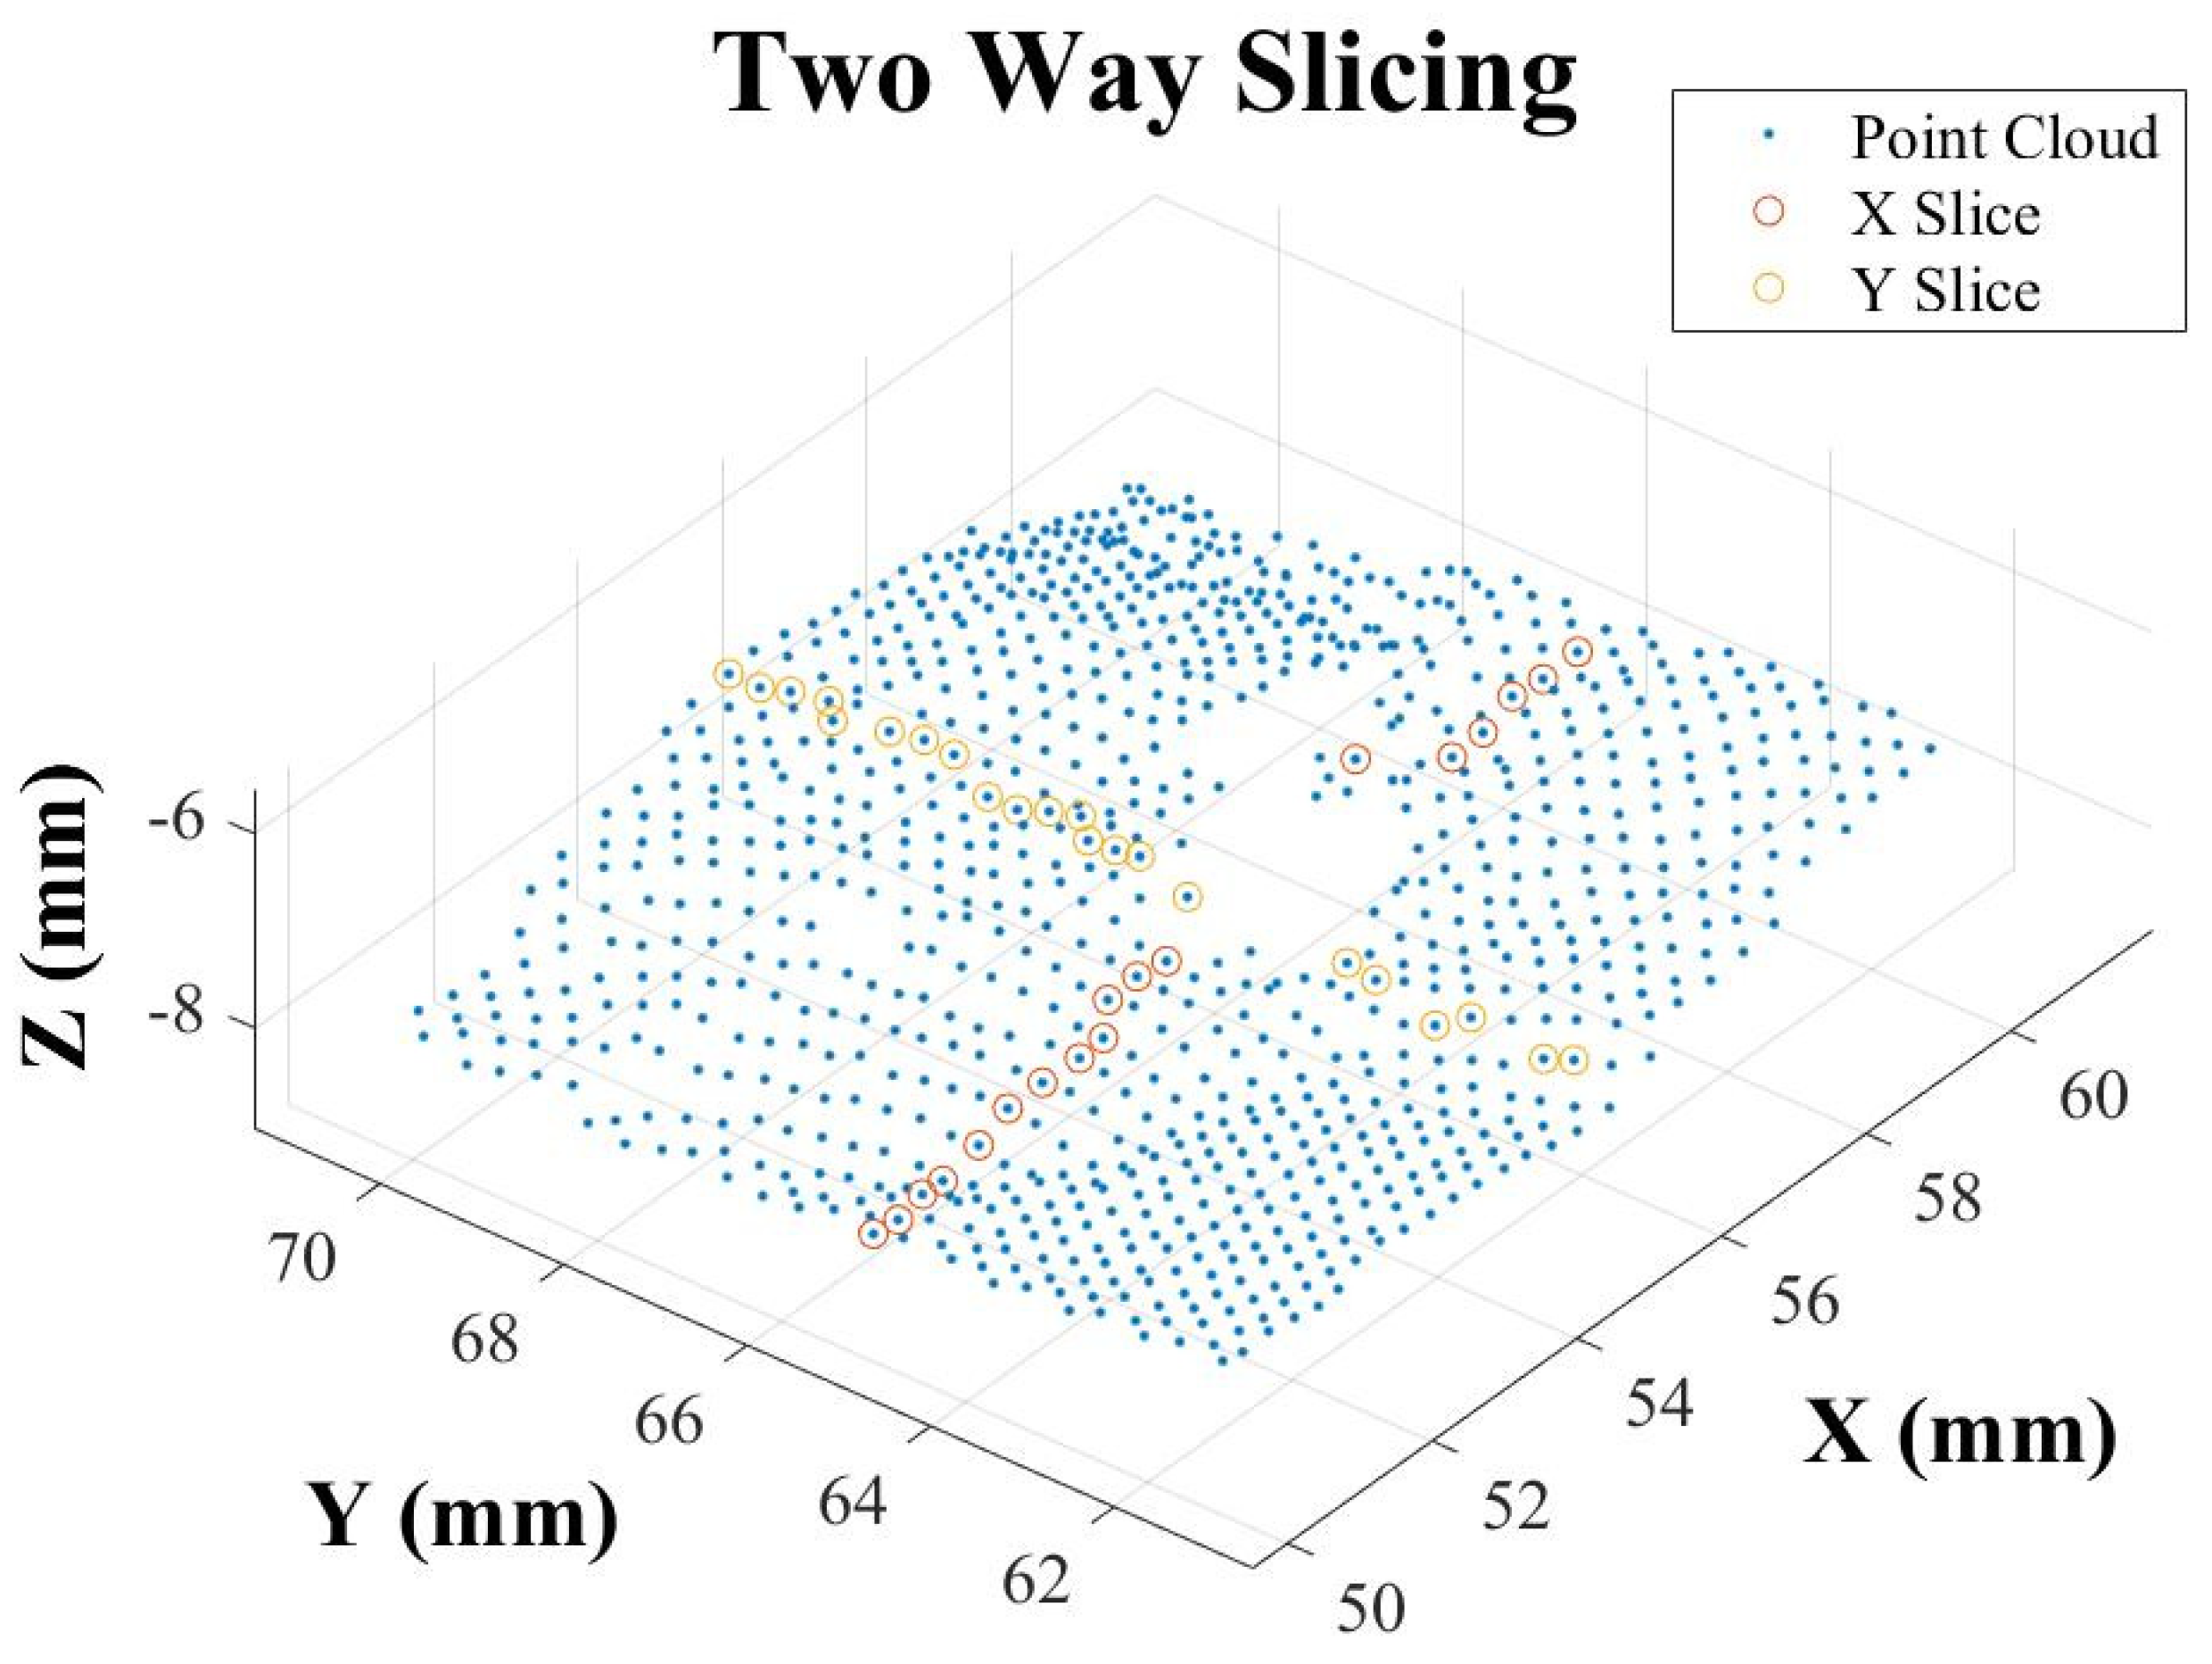
Data estimation of point cloud in hole region
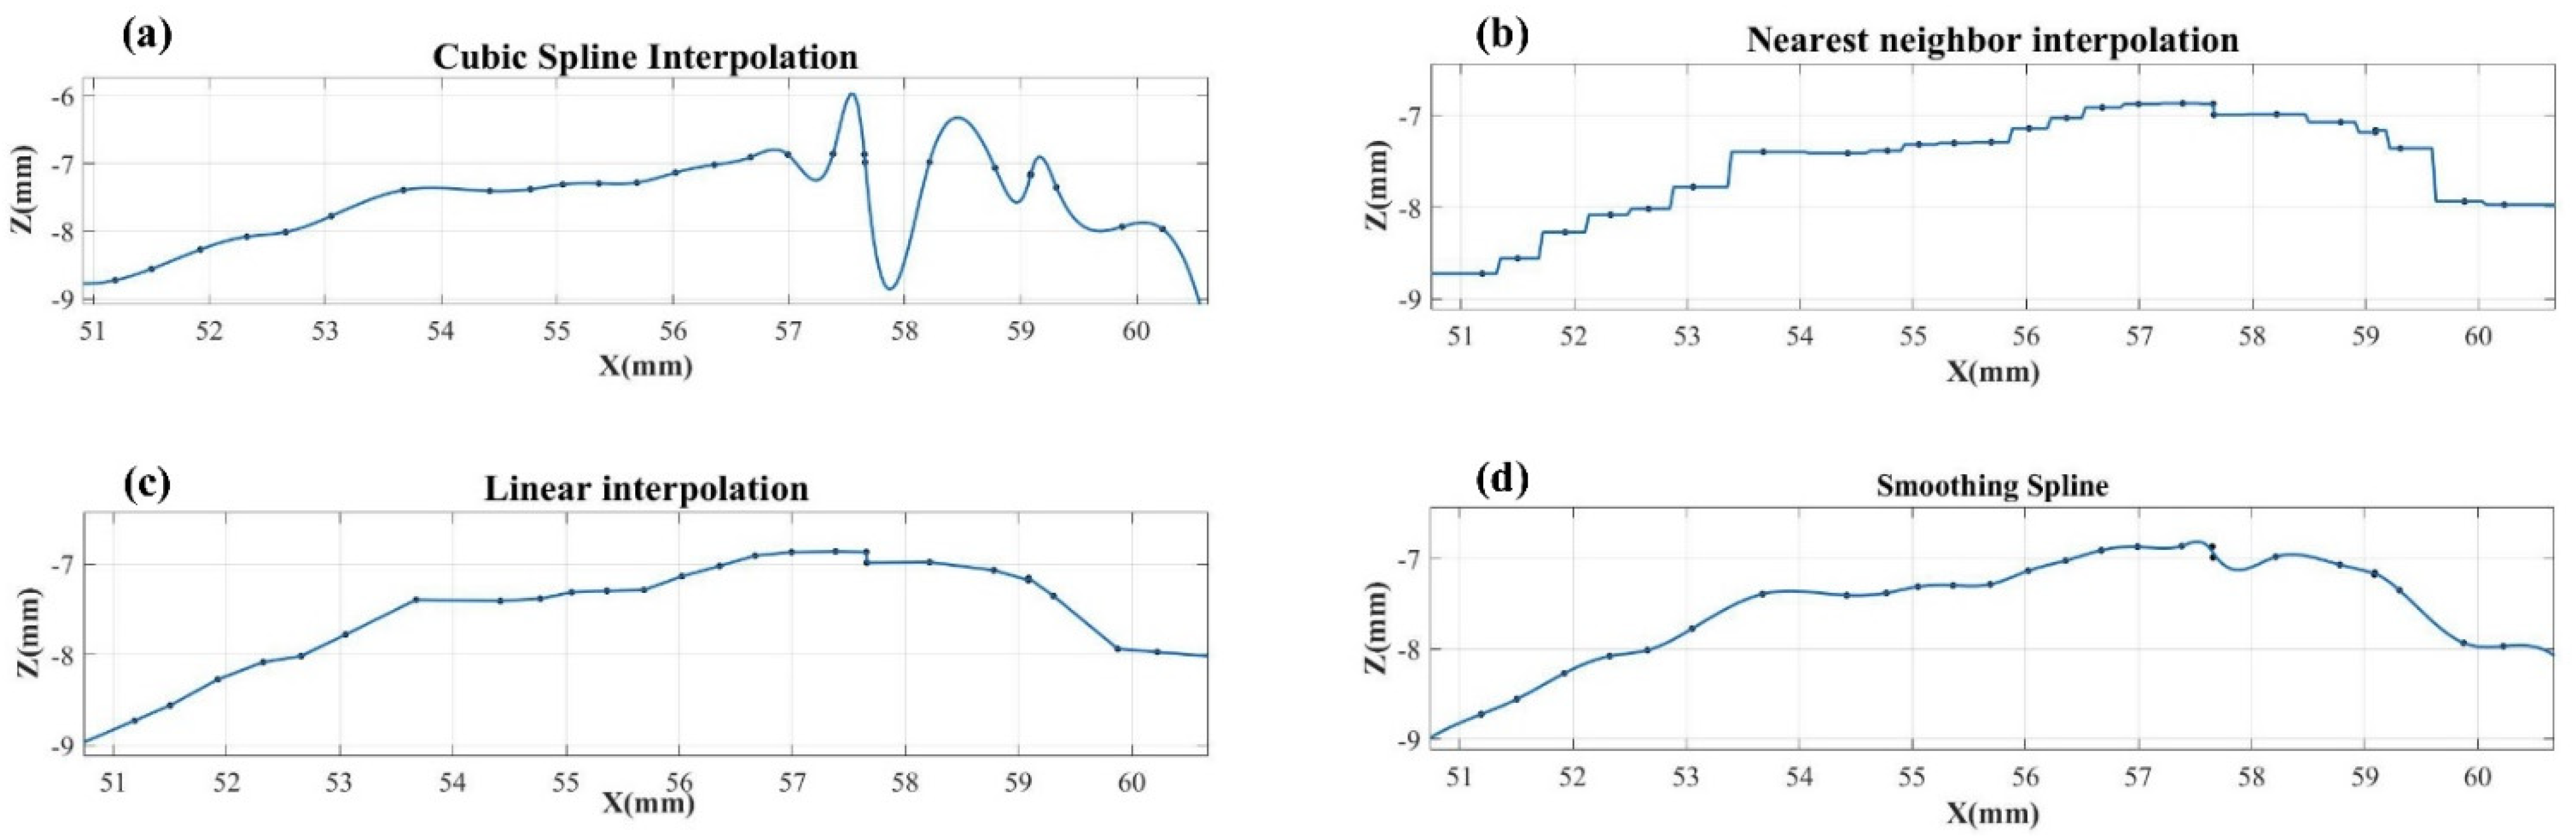
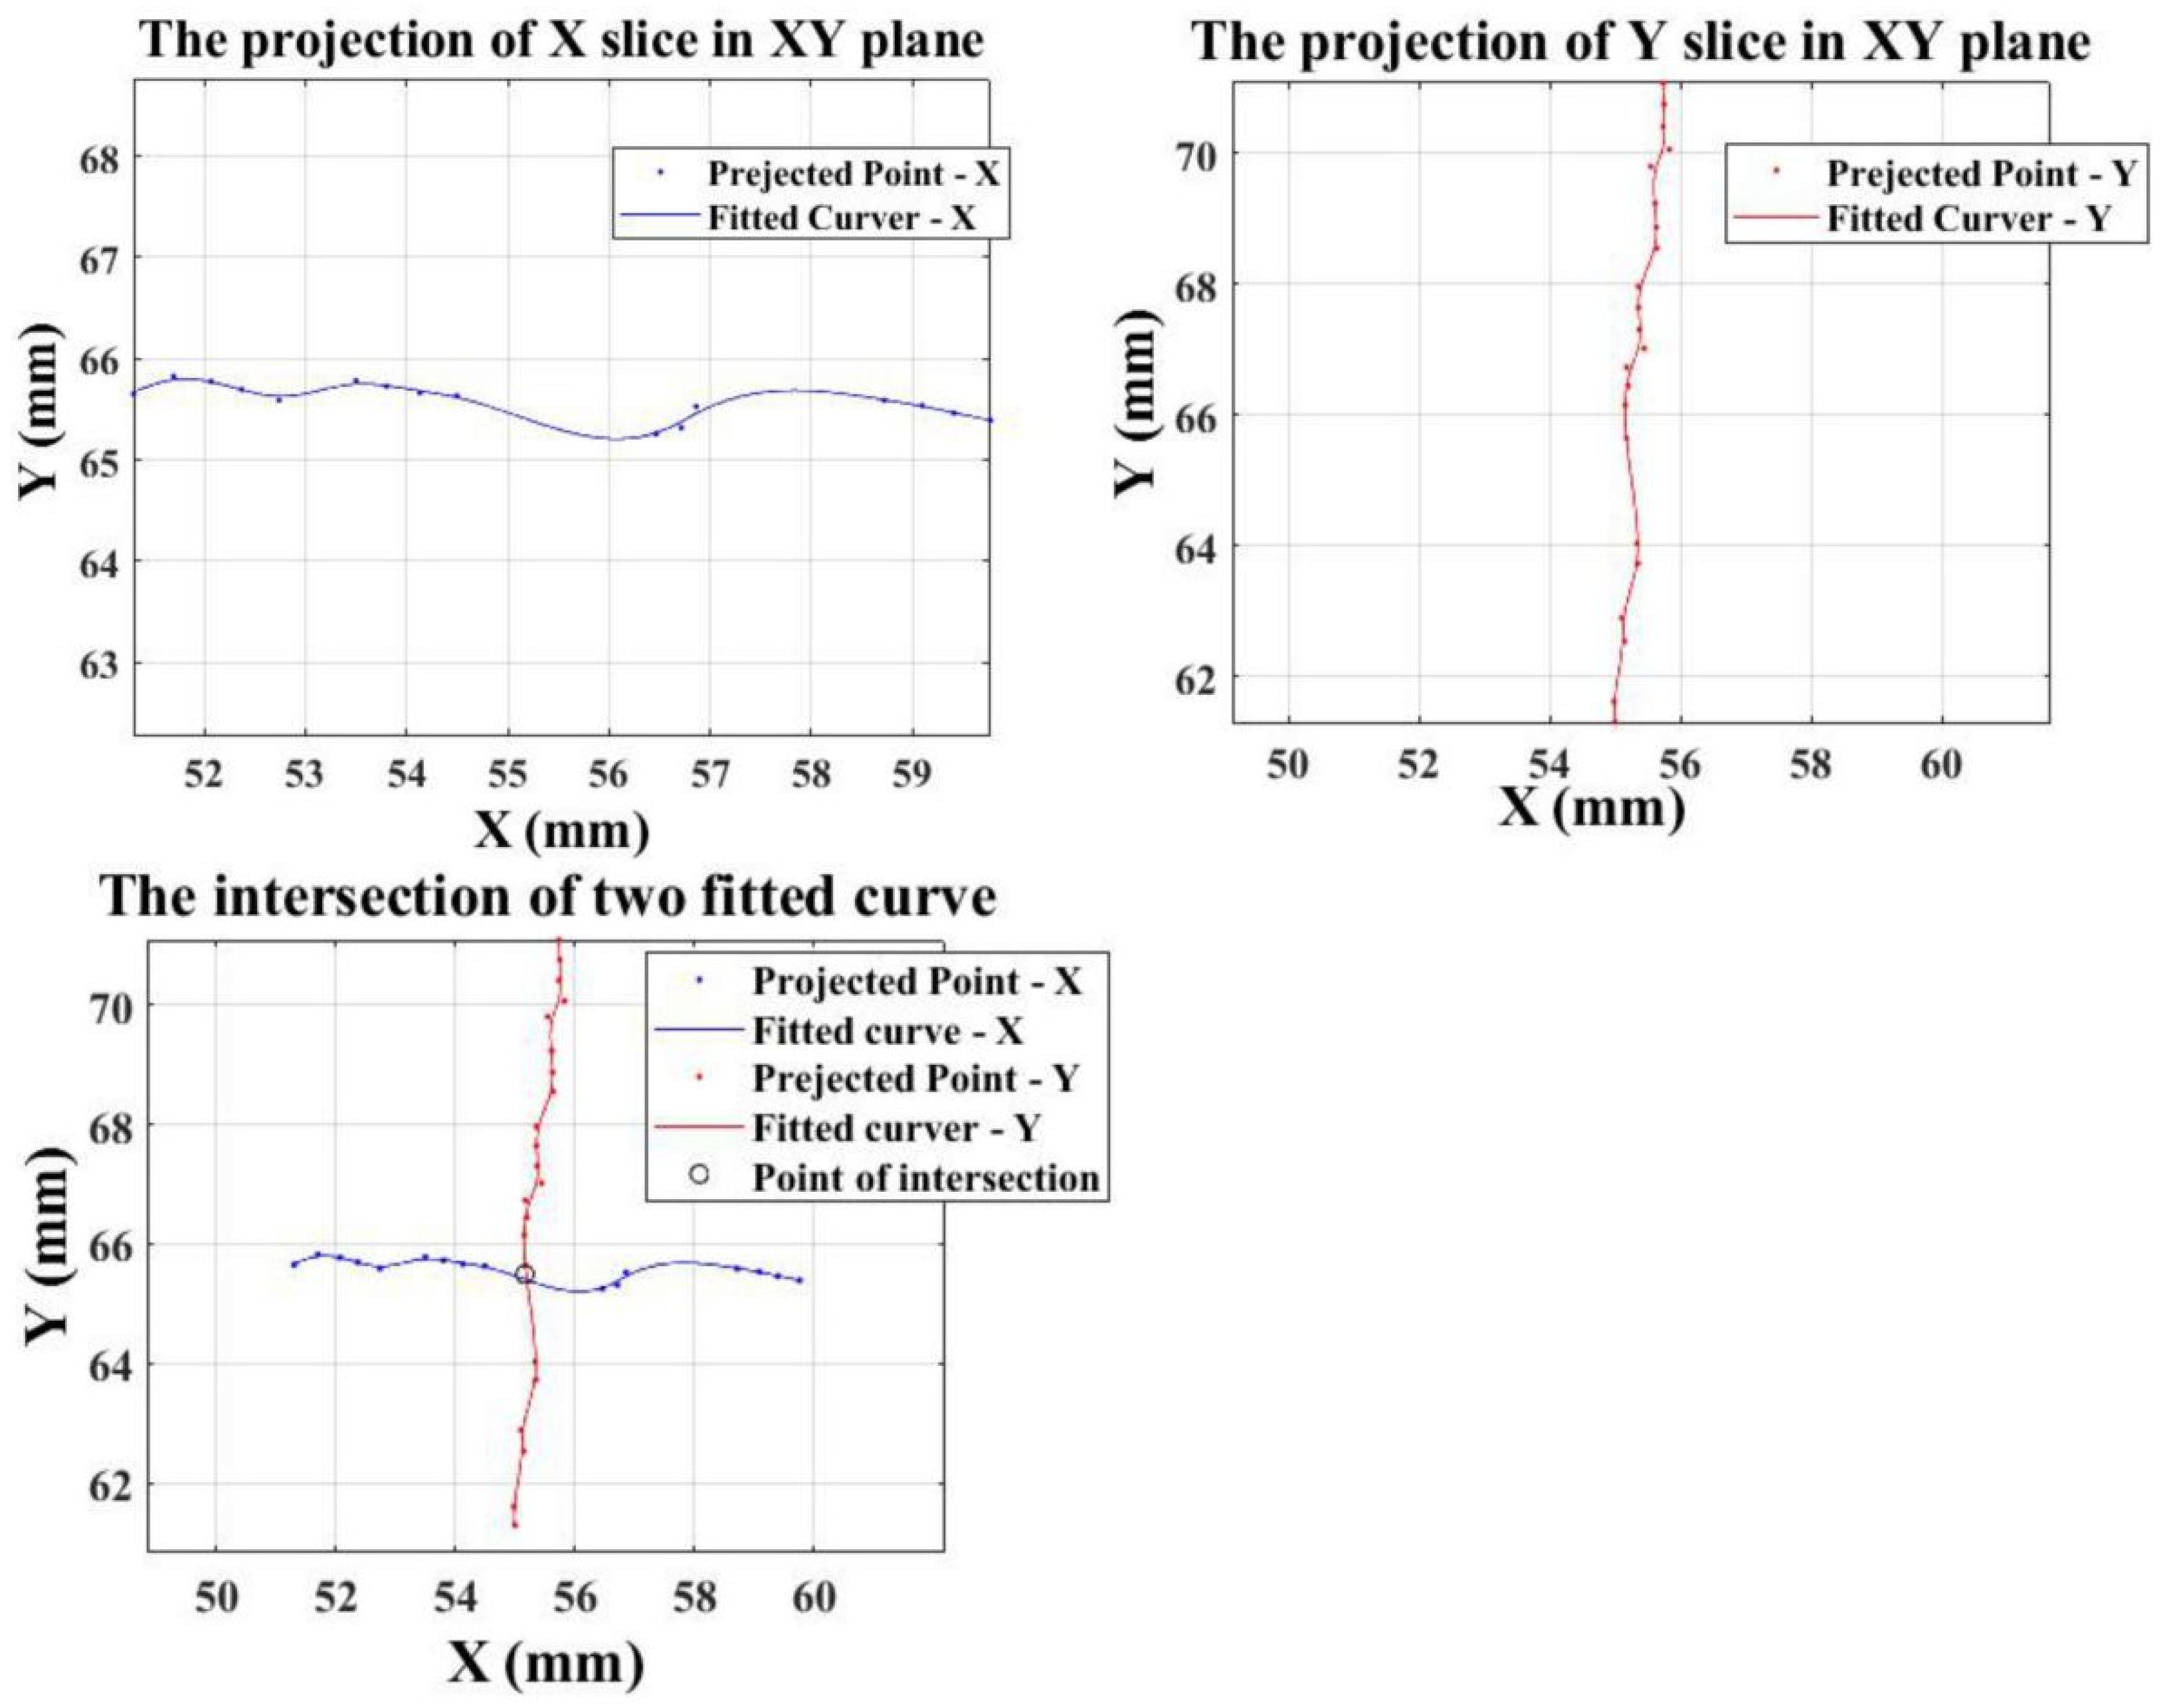
Firstly, the extracted point clouds with holes are sliced in X and Y directions. Secondly, the slices are projected to the XY plane, XZ plane, and YZ plane, respectively. Thirdly, the projected discrete points are fitted to the curve using the Smooth Spline method. Finally, calculate the intersection (X, Y) of the fitted curve on the XY plane and estimate the Z value.
Step 4:
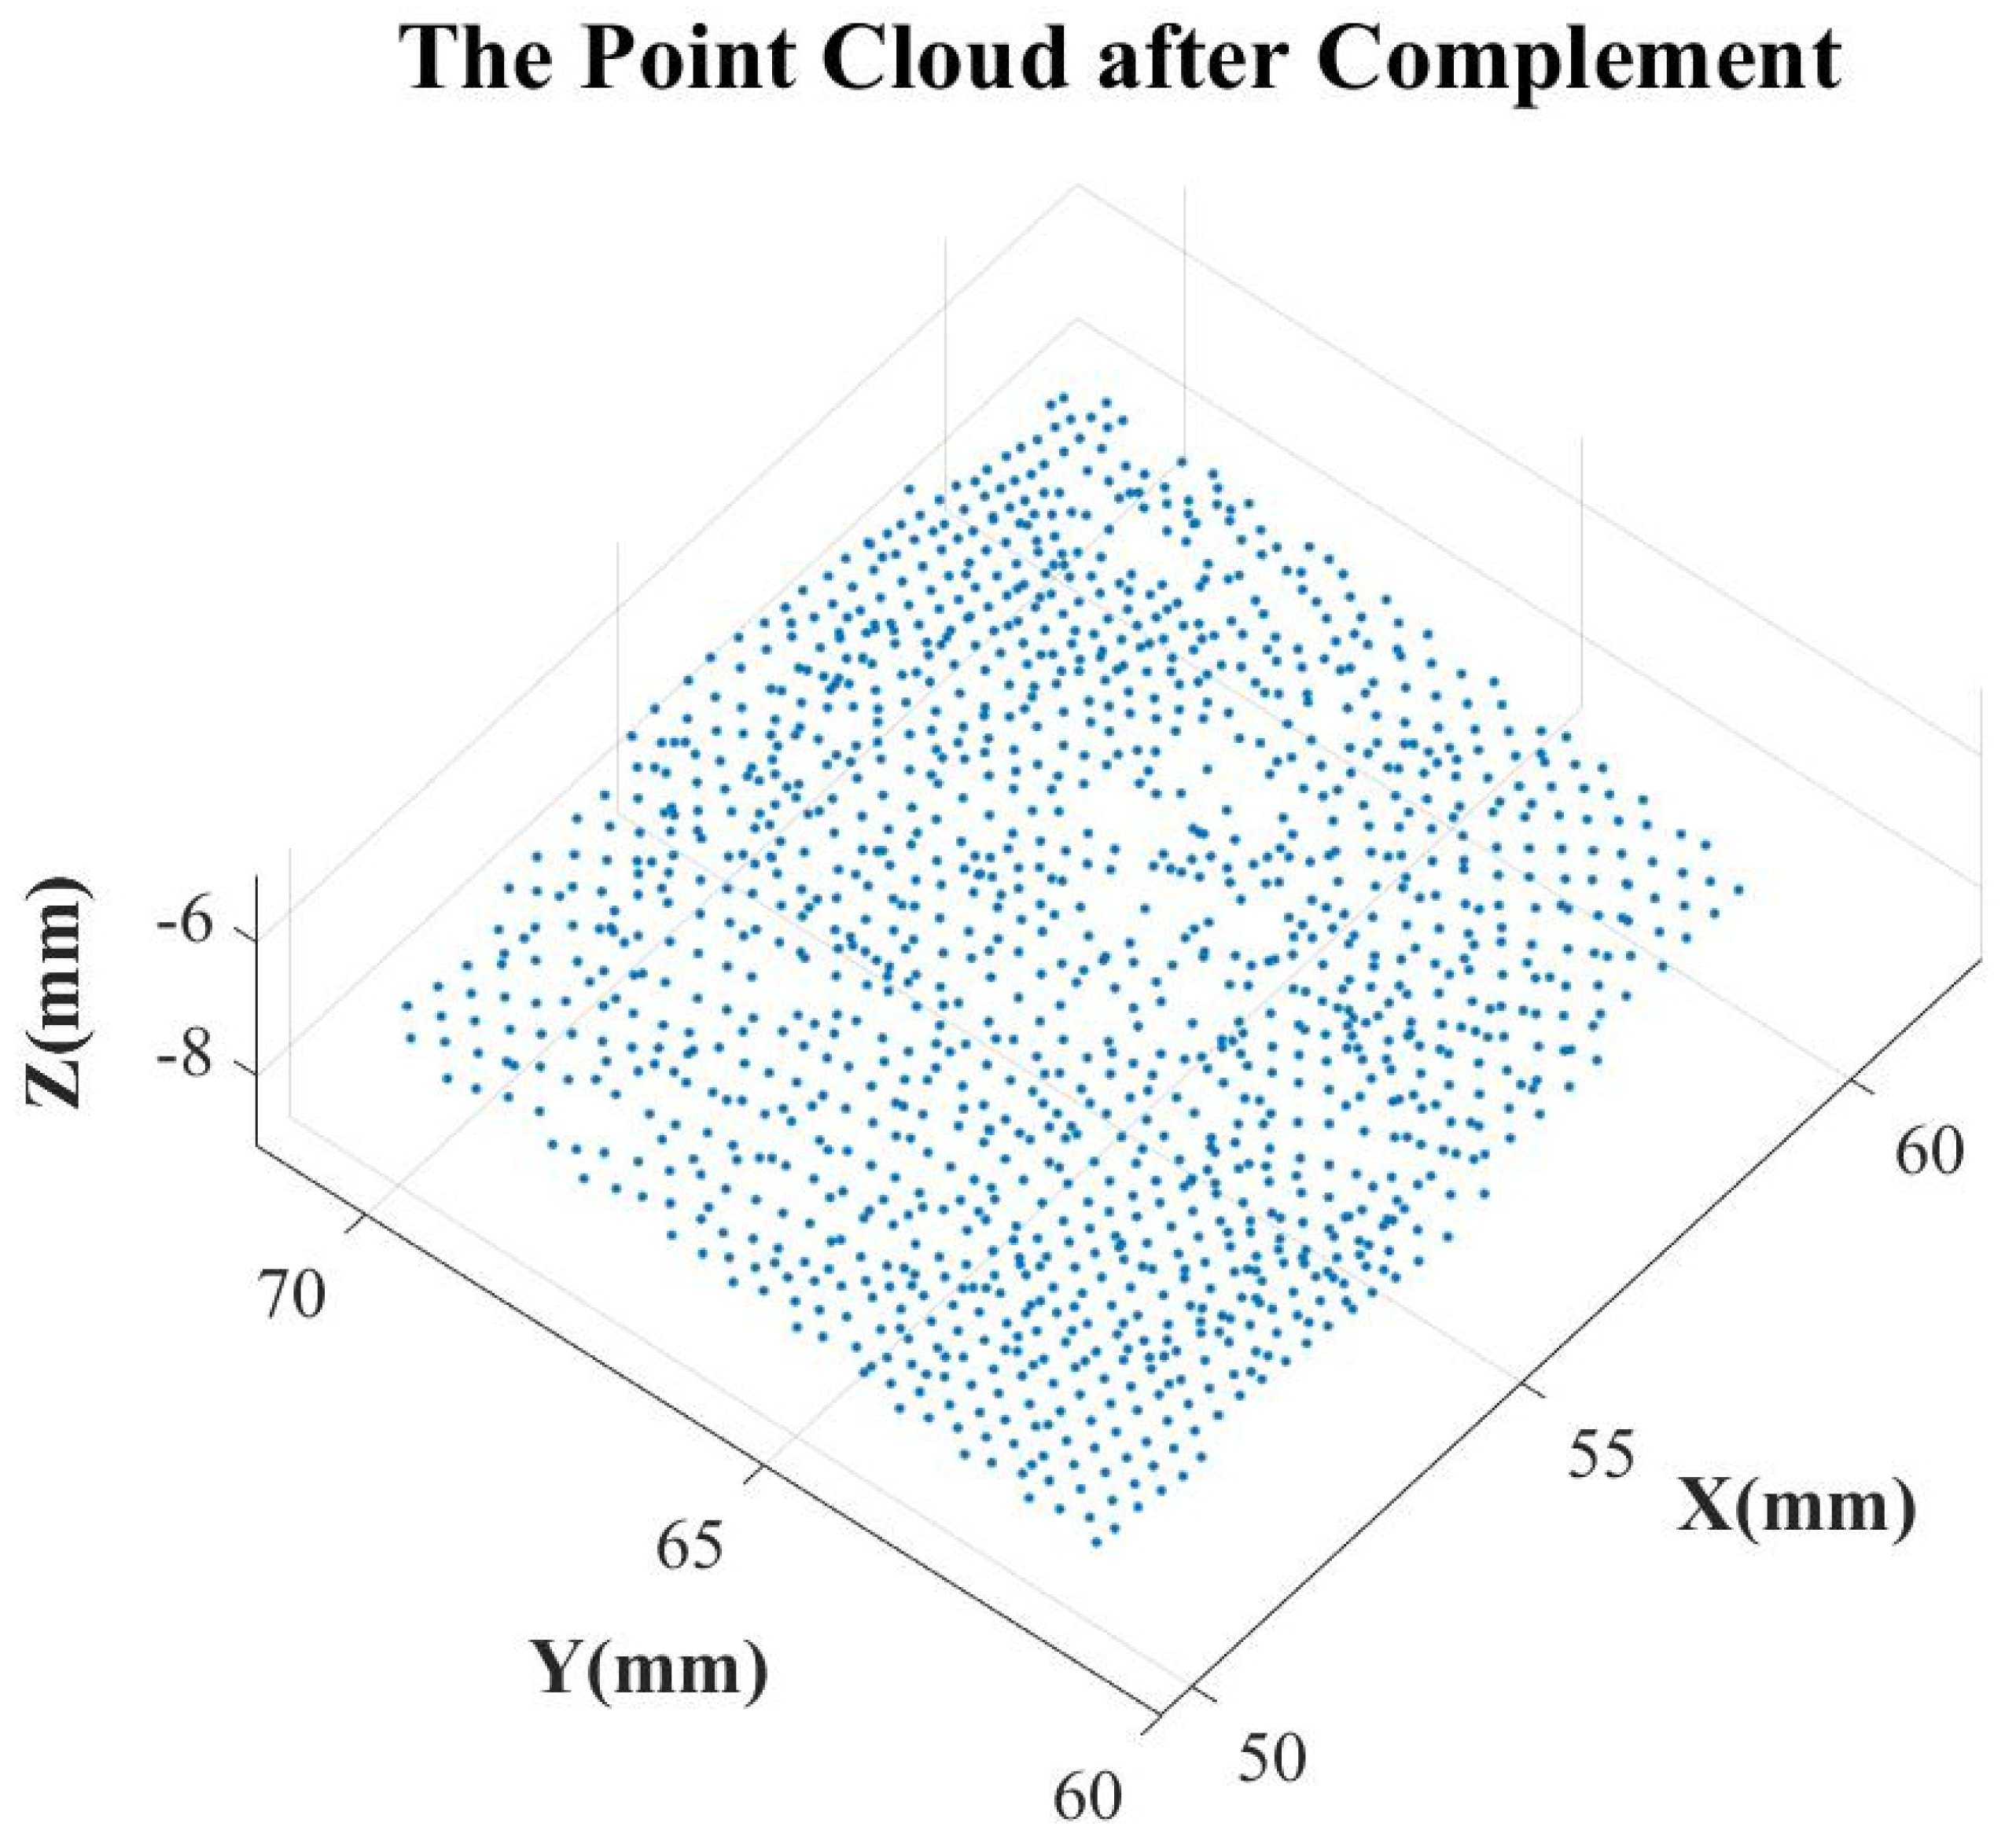
Complement the point cloud hole
The coordinate value of the point estimated in Step 3 is added to the origin cloud data, and iterative operations are carried out until the estimation of all points is completed.
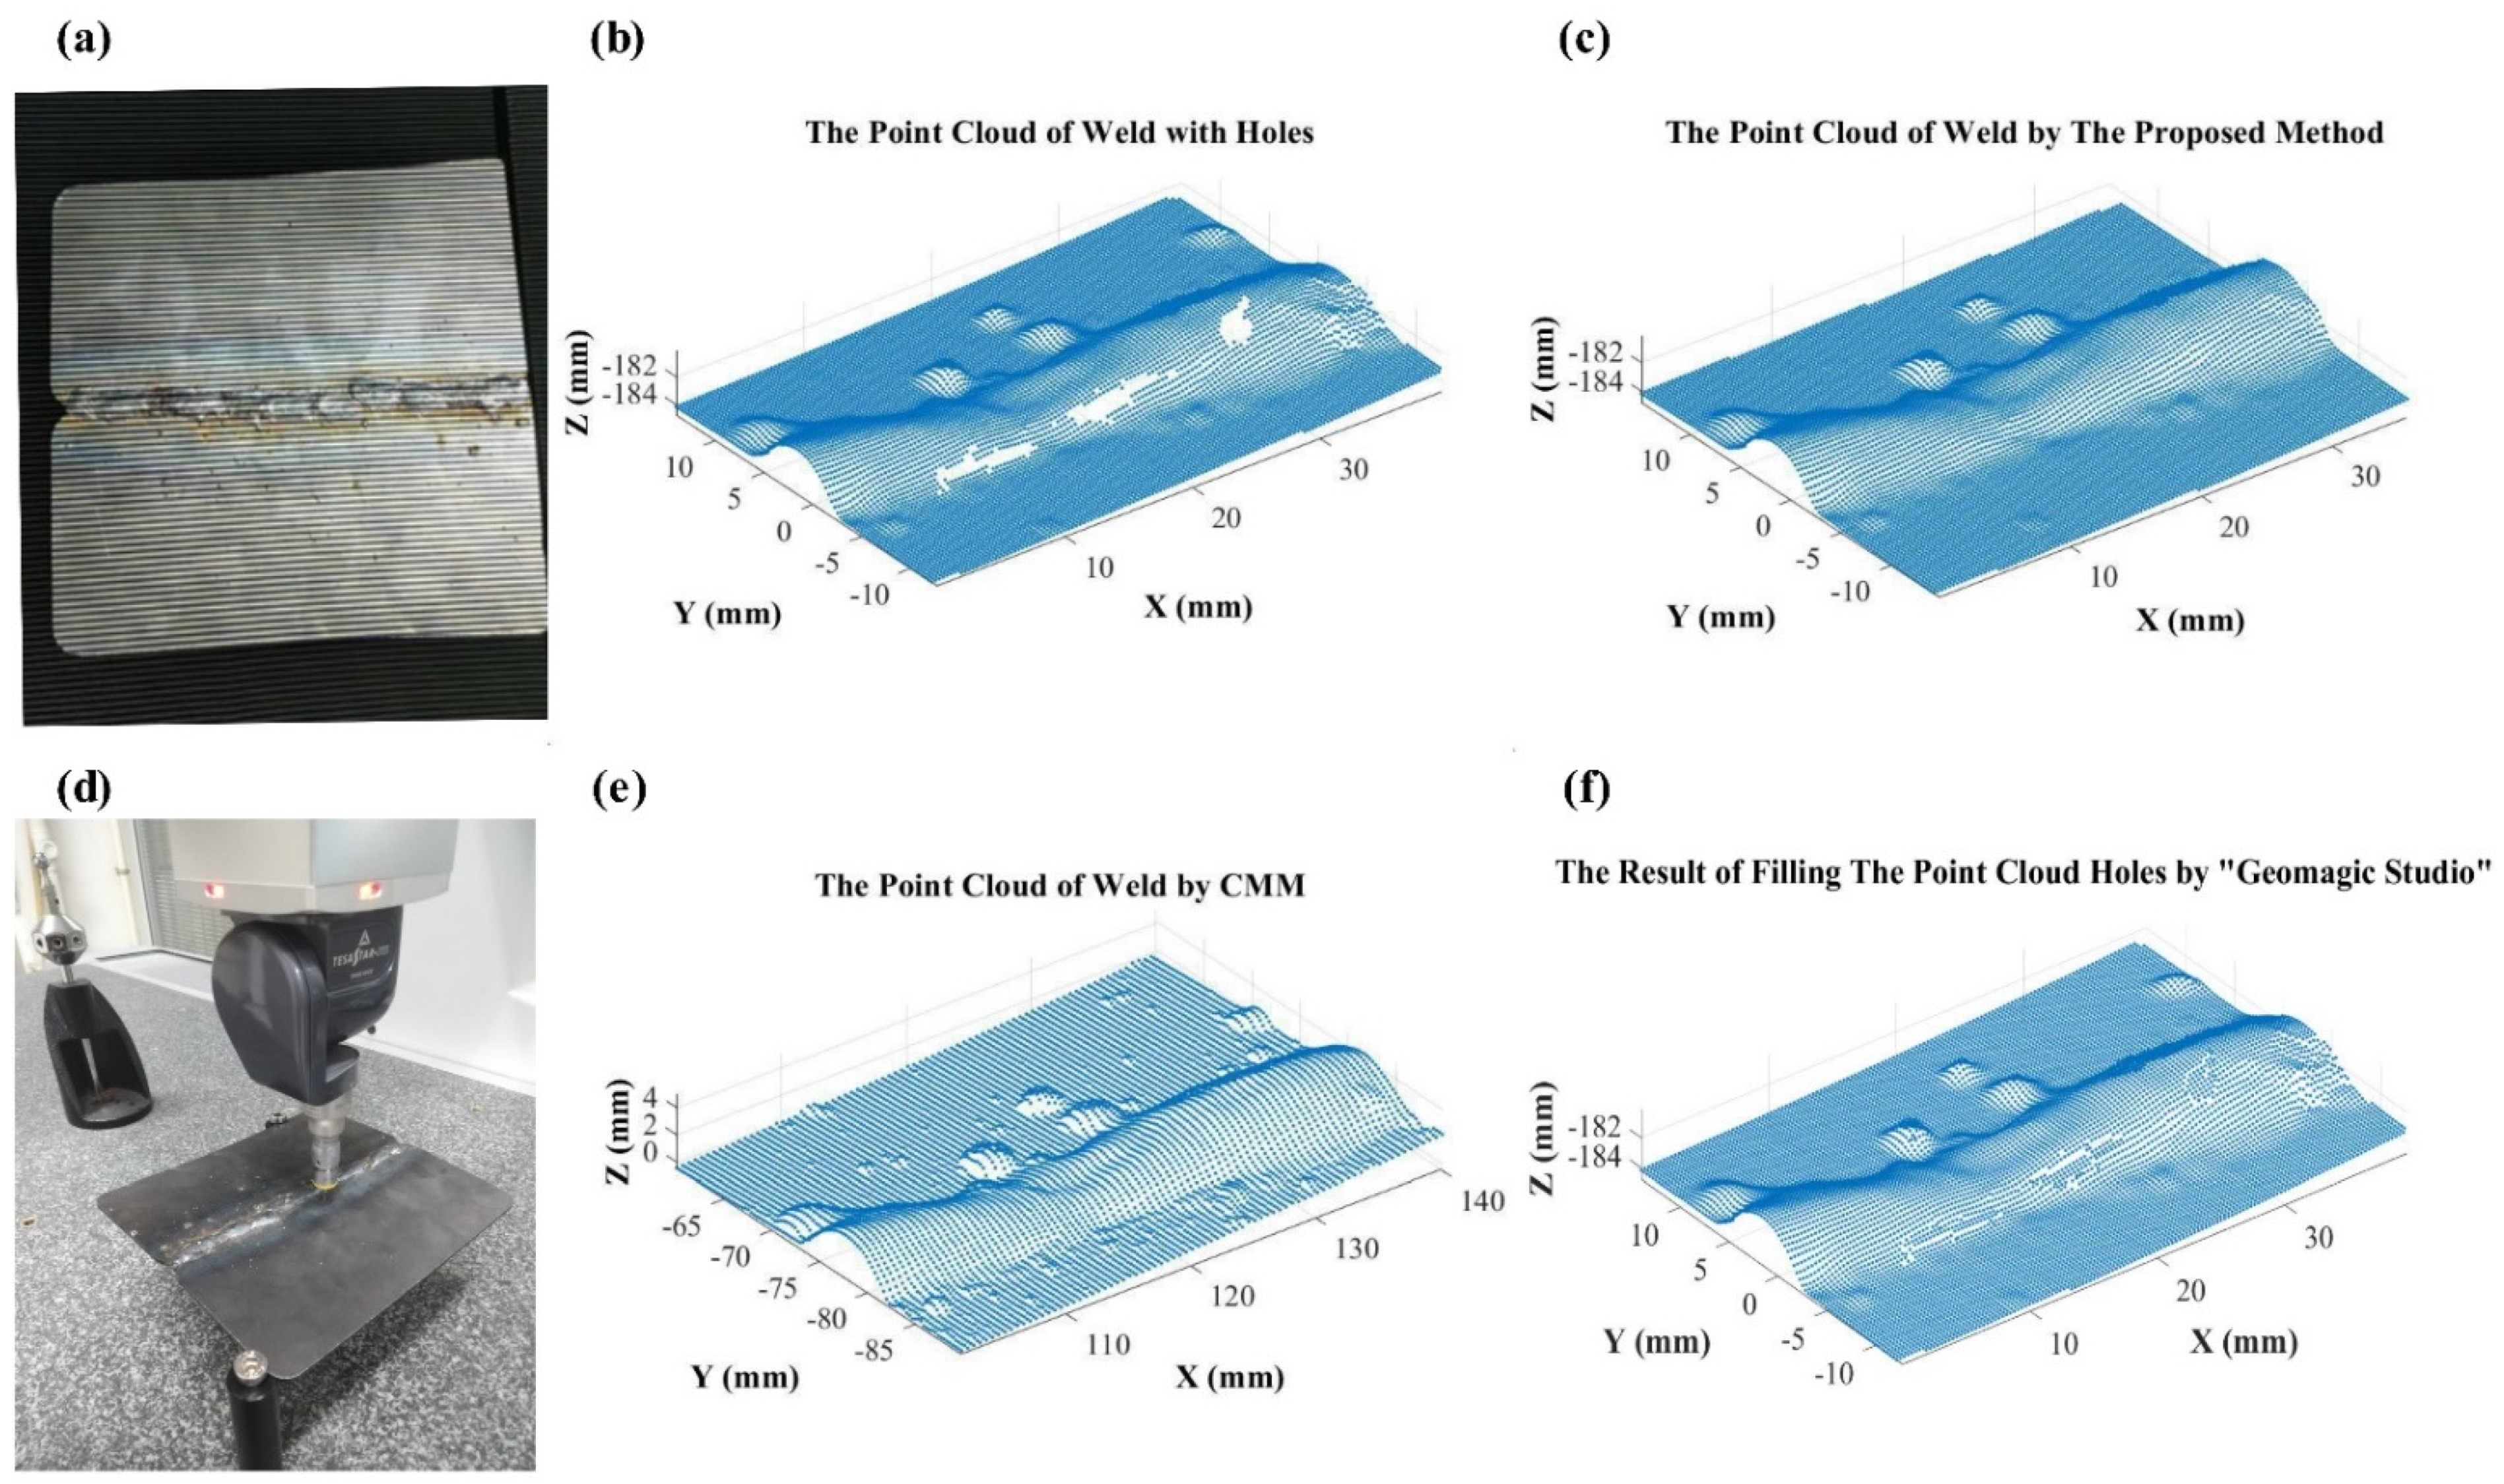
In order to accurately evaluate the effect of the proposed method, a coordinate measuring machine (CMM) was used to scan and measure the weld due to its high precision, and the point clouds with holes were automatically filled by Geomagic Studio, which is a very popular and effective software in the field of point cloud processing.
The 3D reconstruction of the weld with high reflectivity by the proposed method, the result of measurement by CMM, and the effect of the holes filling by Geomagic Studio are shown in Figure 12. Figure 12b shows the 3D reconstruction result of the welding surface with high reflectivity by traditional binocular structured light, which obviously has some holes. Figure 12c is the result of processing by the proposed method. It can be concluded that the proposed method has a good effect by comparing with the CMM measurement result shown in Figure 12e and the filling result by Geomagic Studio shown in Figure 12f.

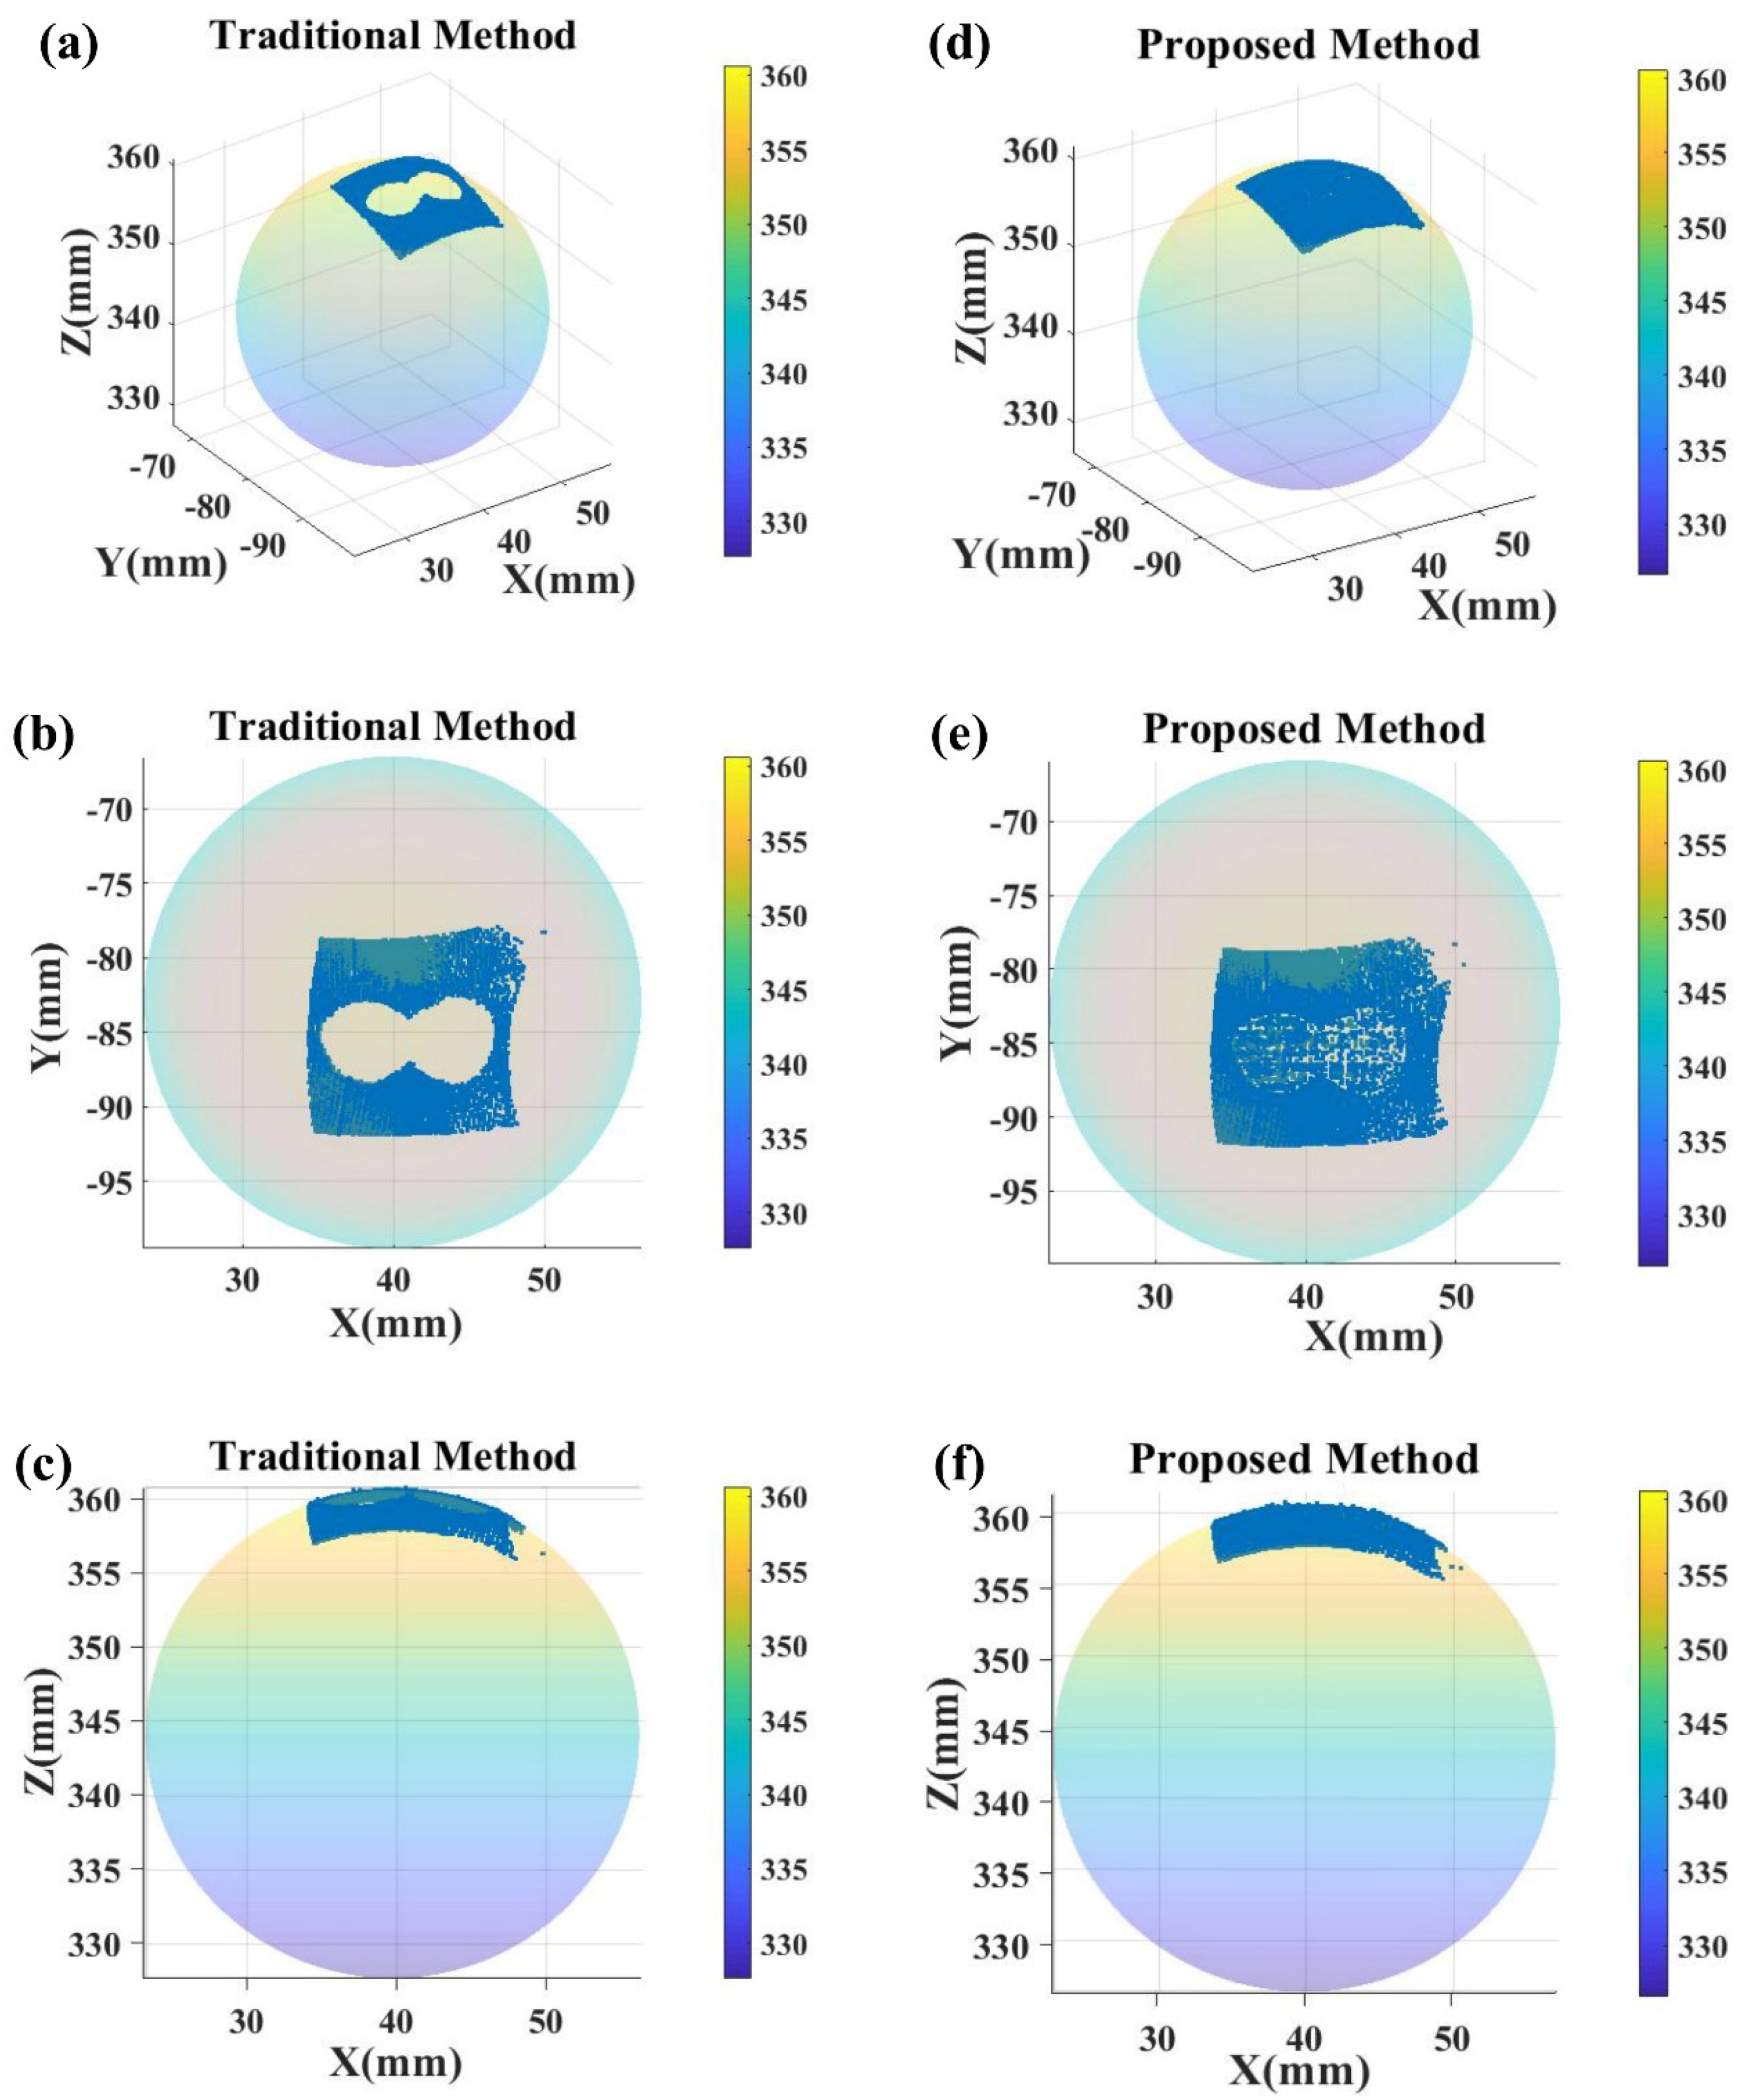
4.3. Measurement of Standard Sphere

In order to prove that the proposed method can lead to good reconstruction results for objects with high reflective surfaces, a standard sphere with highly reflective surfaces shown in Figure 11c was reconstructed using this method. Since the surface of the standard sphere is reflective, there are holes in the point cloud generated by the traditional binocular structured light stereo vision method. By using the method proposed in this paper, the 3D reconstruction of the standard sphere has no holes. The point clouds generated by the traditional method and the method proposed in this paper were respectively fitted into spheres, and the results are shown in Figure 13.

5. Conclusions and Future Work

This research proposes a 3D reconstruction method based on a binocular structured light stereo vision for the weld surface with high reflection, which can effectively complement the point cloud holes caused by high reflection. This method designed a structured light coding form, which can effectively help the system to identify the high reflective region. The 2D coordinates of the high reflective area were determined by the operations of gray-scale, binarization, dilation, and erosion of the first images taken by the two cameras. According to the mapping from the 2D image to the 3D point cloud, the hole of the point cloud was determined. A two-way slicing method of point cloud based on 2D image pixels was designed. The point cloud of the hole was estimated by the Smoothing Spline method. Experimental results show that this method can accurately reconstruct the surface of the object with a high reflective phenomenon. The reconstructed surface topography is highly consistent with the object being measured and has good smoothness.
The hole identification and two-way slicing methods proposed in this paper are based on 2D images; in other words, these methods are only suitable for the 3D reconstruction schemes that can acquire 2D images and are not suitable for the other 3D reconstruction schemes such as radar and TOF. In the future, further research can be conducted in point cloud slicing and curve fitting to reduce the dependence on 2D images and increase the universality of this method.

Author Contributions

Conceptualization, B.L.; methodology, Z.X.; software, B.L.; validation, Q.D.; formal analysis, Y.C.; investigation, F.G.; resources, Q.D.; data curation, Z.X.; writing—original draft preparation, B.L.; writing—review and editing, Z.X. and F.G.; visualization, B.L.; supervision, Z.X., F.G. and Y.C.; project administration, B.L.; funding acquisition, Q.D. All authors have read and agreed to the published version of the manuscript.

Funding

This research was funded by the Key R&D project of Shandong Province, grant number 2020CXGC010206.

Institutional Review Board Statement

Not applicable.

Informed Consent Statement

Not applicable.

Data Availability Statement

The data presented in this study are available on request from the corresponding author. The data are not publicly available due to the privacy policy of the organization.

Conflicts of Interest

The authors declare no conflict of interest.

References

  1. Zhang, Y.; You, D.; Gao, X.; Zhang, N.; Gao, P.P. Welding defects detection based on deep learning with multiple optical sensors during disk laser welding of thick plates. J. Manuf. Syst. 2019, 51, 87–94. [Google Scholar] [CrossRef]
  2. Nacereddine, N.; Goumeidane, A.B.; Ziou, D. Unsupervised weld defect classification in radiographic images using multivariate generalized Gaussian mixture model with exact computation of mean and shape parameters. Comput. Ind. 2019, 108, 132–149. [Google Scholar] [CrossRef]
  3. Yang, L.; Wang, H.; Huo, B.; Li, F.; Liu, Y. An automatic welding defect location algorithm based on deep learning. NDT E Int. 2021, 120, 102435. [Google Scholar] [CrossRef]
  4. Yusof, M.; Kamaruzaman, M.; Zubair, M.; Ishak, M. Detection of defects on weld bead through the wavelet analysis of the acquired arc sound signal. J. Mech. Eng. Sci. 2016, 10, 2031–2042. [Google Scholar]
  5. Gao, X.; Du, L.; Ma, N.; Zhou, X.; Wang, C.; Gao, P.P. Magneto-optical imaging characteristics of weld defects under alternating and rotating magnetic field excitation. Opt. Laser Technol. 2019, 112, 188–197. [Google Scholar] [CrossRef]
  6. Zou, Y.; Du, D.; Chang, B.; Ji, L.; Pan, J. Automatic weld defect detection method based on Kalman filtering for real-time radiographic inspection of spiral pipe. NDT E Int. 2015, 72, 1–9. [Google Scholar] [CrossRef]
  7. Zuo, C.; Huang, L.; Zhang, M.; Chen, Q.; Asundi, A. Temporal phase unwrapping algorithms for fringe projection profilometry: A comparative review. Opt. Lasers Eng. 2016, 85, 84–103. [Google Scholar] [CrossRef]
  8. Zuo, C.; Feng, S.; Huang, L.; Tao, T.; Yin, W.; Chen, Q. Phase shifting algorithms for fringe projection profilometry: A review. Opt. Lasers Eng. 2018, 109, 23–59. [Google Scholar] [CrossRef]
  9. Xu, Y.; Wang, Z. Visual sensing technologies in robotic welding: Recent research developments and future interests. Sensors Actuators A: Phys. 2021, 320, 112551. [Google Scholar] [CrossRef]
  10. Nizam, M.S.H.; Zamzuri, A.R.M.; Marizan, S.; Zaki, S.A. Vision based identification and classification of weld defects in welding environments: A Review. Indian J. Sci. Technol. 2016, 9, 1–5. [Google Scholar]
  11. Kumar, G.S.; Natarajan, U.; Ananthan, S.S. Vision inspection system for the identification and classification of defects in MIG welding joints. Int. J. Adv. Manuf. Technol. 2012, 61, 923–933. [Google Scholar] [CrossRef] [Green Version]
  12. Li, Y.; Li, Y.F.; Wang, Q.L.; Xu, D.; Tan, M. Measurement and defect detection of the weld bead based on online vision inspection. IEEE Trans. Instrum. Meas. 2009, 59, 1841–1849. [Google Scholar]
  13. Al-Temeemy, A.A.; Al-Saqal, S.A. Laser-based structured light technique for 3D reconstruction using extreme laser stripes extraction method with global information extraction. Opt. Laser Technol. 2021, 138, 106897. [Google Scholar] [CrossRef]
  14. Gorthi, S.S.; Rastogi, P. Fringe projection techniques: Whither we are? Opt. Lasers Eng. 2010, 48, 133–140. [Google Scholar] [CrossRef] [Green Version]
  15. Yang, L.; Li, E.; Long, T.; Fan, J.; Liang, Z. A Novel 3-D path extraction method for arc welding robot based on stereo structured light sensor. IEEE Sens. J. 2019, 19, 763–773. [Google Scholar] [CrossRef]
  16. Song, Z.; Shing-Tung, Y. High dynamic range scanning technique. Opt. Eng. 2009, 48, 1–7. [Google Scholar]
  17. Salahieh, B.; Chen, Z.; Rodriguez, J.J.; Liang, R. Multi-polarization fringe projection imaging for high dynamic range objects. Opt. Express 2014, 22, 10064–10071. [Google Scholar] [CrossRef]
  18. Gudrun, J.K.; Steven, A.S.; Takeo, K. Image segmentation and reflection analysis through color. Proc. SPIE 1988, 937, 229–244. [Google Scholar]
  19. Liu, Y.; Blunt, L.; Gao, F.; Jiang, X. High-dynamic-range 3D measurement for E-beam fusion additive manufacturing based on SVM intelligent fringe projection system. Surf. Topogr. 2021, 9, 034002. [Google Scholar] [CrossRef]
  20. Xu, F.; Zhang, Y.; Zhang, L. An effective framework for 3D shape measurement of specular surface based on the dichromatic reflection model. Opt. Commun. 2020, 475, 126210. [Google Scholar] [CrossRef]
  21. Yin, W.; Feng, S.; Tao, T.; Huang, L.; Trusiak, M.; Chen, Q.; Zuo, C. High-speed 3D shape measurement using the optimized composite fringe patterns and stereo-assisted structured light system. Opt. Express 2019, 27, 2411–2431. [Google Scholar] [CrossRef] [PubMed]
Figure 1. Welding surface with high reflectivity.
Machines 10 00159 g001
Figure 2. The principle of binocular structured light stereo vision; (a) hardware structure; (b) algorithm flow chart.
Machines 10 00159 g002
Figure 3. The design of the projection pattern coding.
Machines 10 00159 g003
Figure 4. The effect of the first fully lit projection pattern.
Machines 10 00159 g004
Figure 5. Determine the extent of the holed point cloud due to high reflection; (a) image of the left camera; (b) processed image of the left camera; (d) image of the right camera; (e) processed image of the right camera; (c) extracted point cloud with holes.
Machines 10 00159 g005
Figure 6. Two-way slicing of point cloud.
Machines 10 00159 g006
Figure 7. The result of curve fitting by different methods; (a) Cubic Spline Interpolation; (b) Nearest Neighbor Interpolation; (c) Linear Interpolation; (d) Smoothing Spline.
Machines 10 00159 g007
Figure 8. Slice projection in the XY plane and calculation of the intersection of the fitted curves.
Machines 10 00159 g008
Figure 9. The point cloud after complementing operations.
Machines 10 00159 g009
Figure 10. The flowchart of the proposed measurement framework.
Machines 10 00159 g010
Figure 11. Experimental environment; (a) hardware composition of binocular stereo vision system; (b) weld for inspection; (c) standard ball with high reflective surface.
Machines 10 00159 g011
Figure 12. The 3D reconstruction of the weld with high reflectivity; (a) the weld to be measured; (b) the point cloud generated by traditional binocular structured light; (c) the point cloud generated by the proposed method; (d) the measurement of the weld by CMM; (e) the point cloud generated by CMM; (f) the result of filling the point cloud holes by Geomagic Studio.
Machines 10 00159 g012
Figure 13. Measurement of a standard sphere. (ac) The results measured by the traditional method; (df) the results measured by the proposed method.
Machines 10 00159 g013
Publisher’s Note: MDPI stays neutral with regard to jurisdictional claims in published maps and institutional affiliations.

