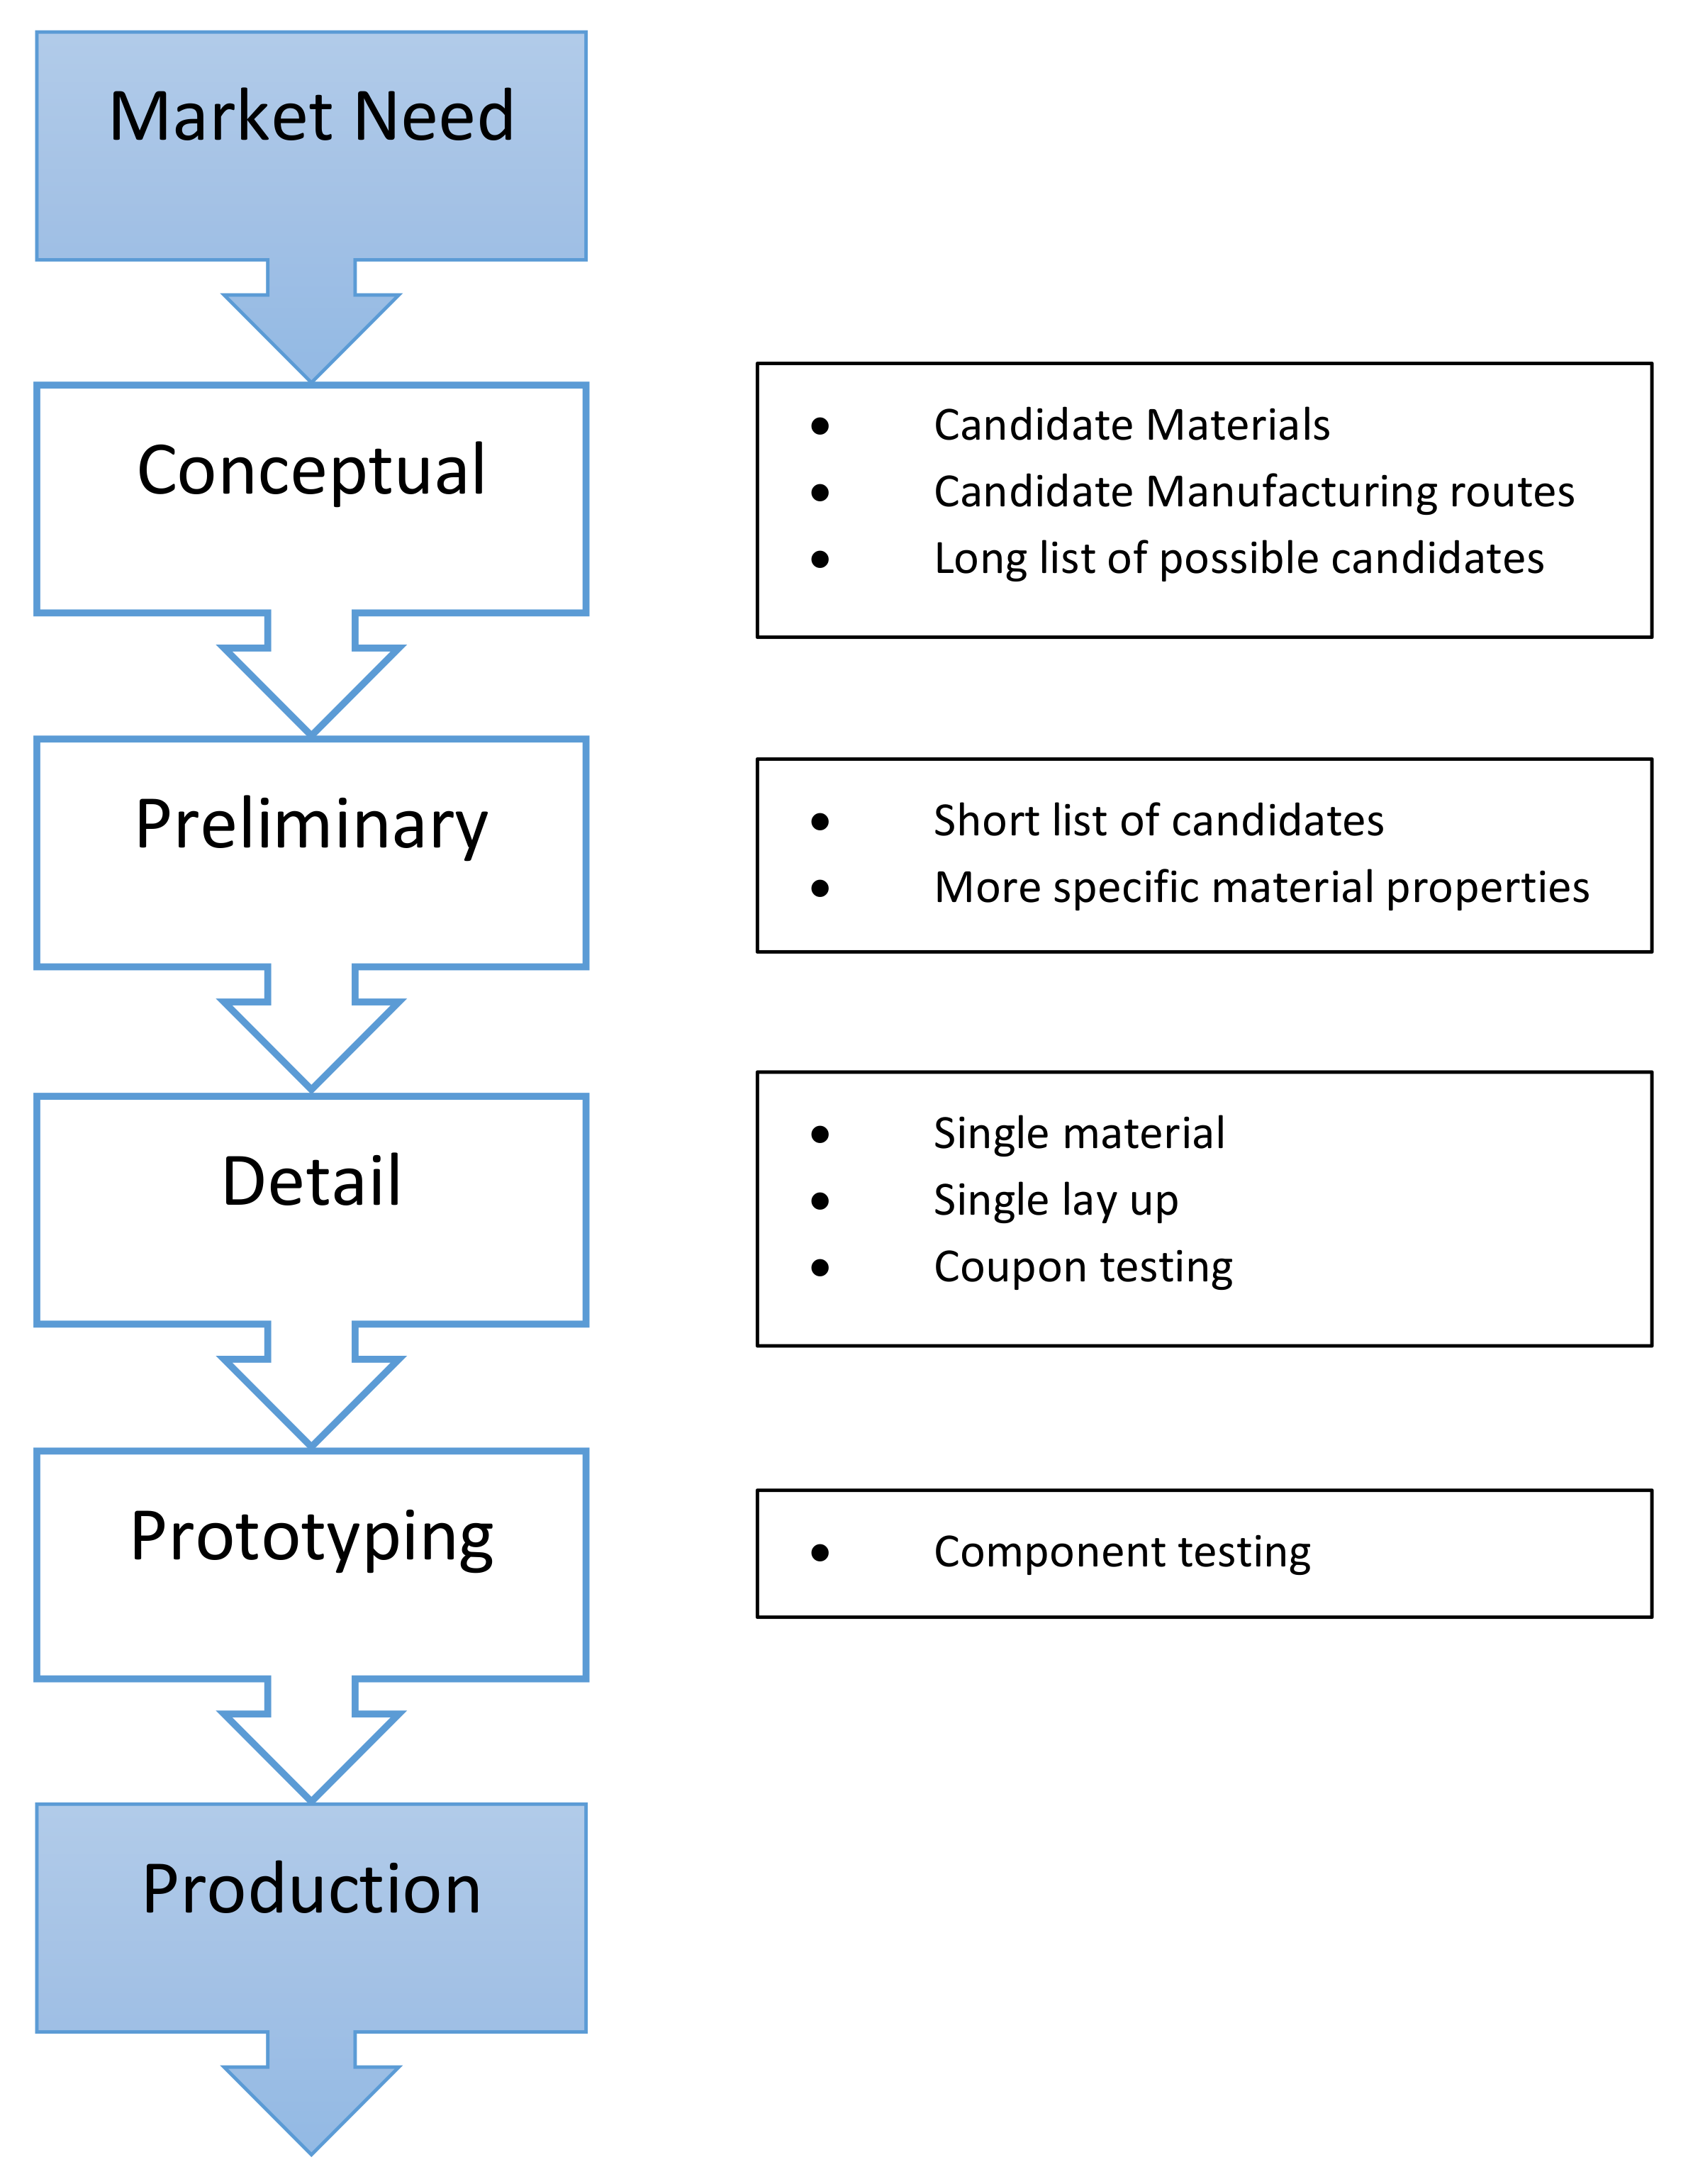
Figure 1.
Designing process flow chart adapted from [
29].
Figure 1.
Designing process flow chart adapted from [
29].
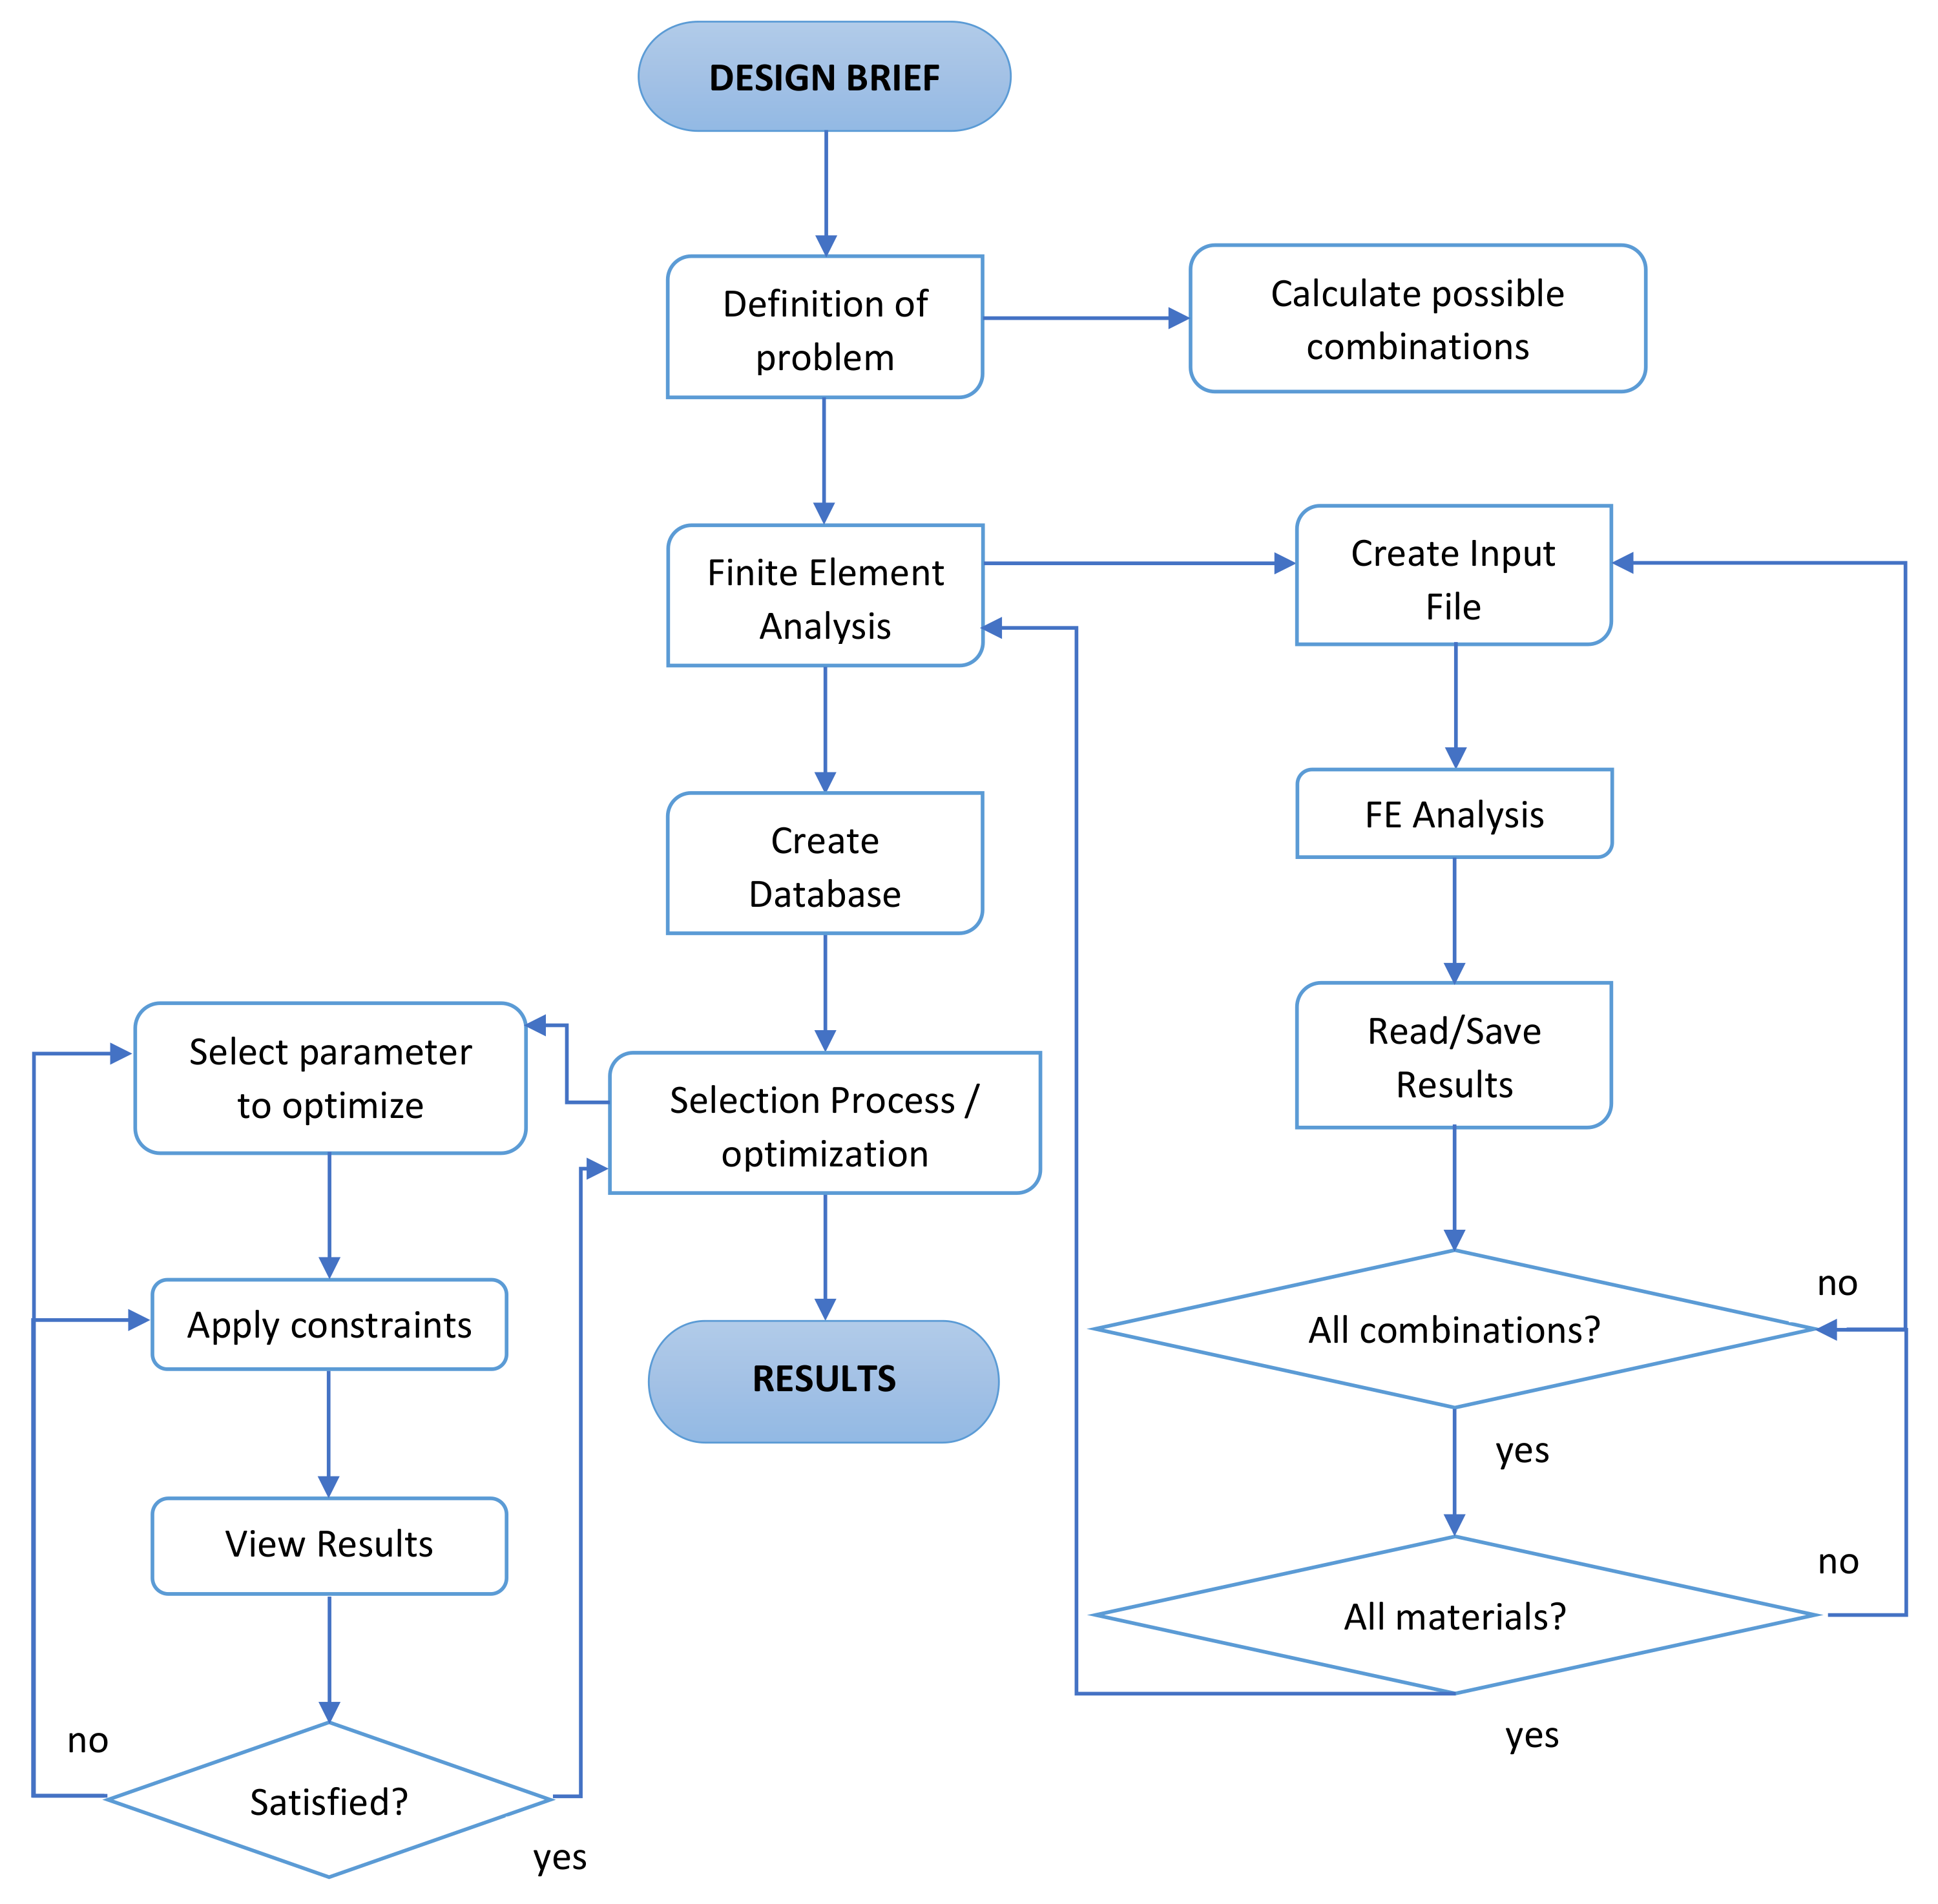
Figure 2.
Design and FEA process flowchart adapted from [
29].
Figure 2.
Design and FEA process flowchart adapted from [
29].
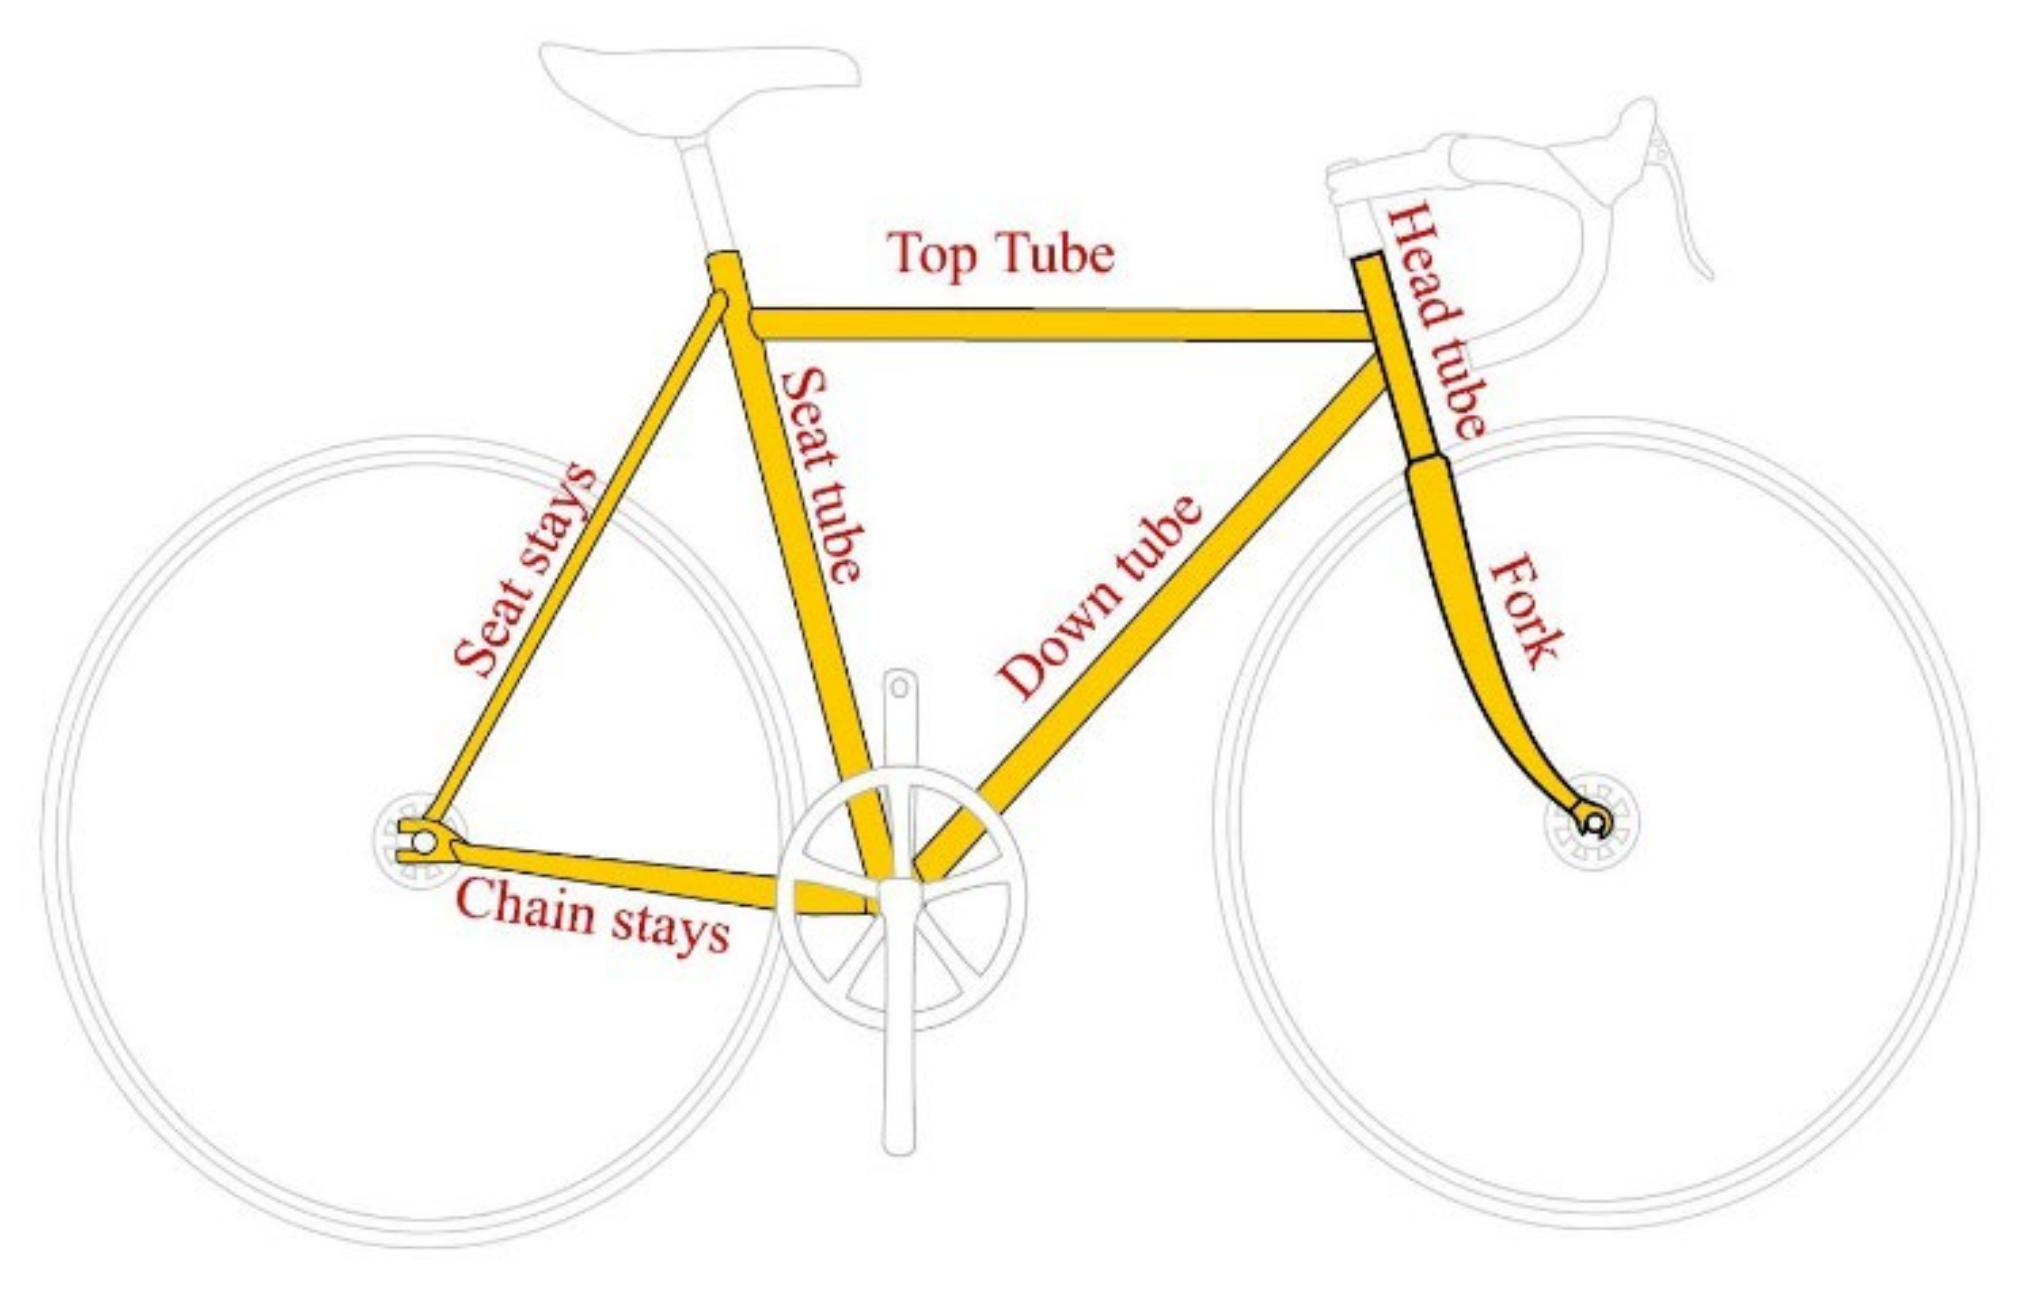
Figure 3.
Basic tube diagram of a typical frame [
30]. No changes were made to the original illustration (Keithonearth, CC BY 3.0).
Figure 3.
Basic tube diagram of a typical frame [
30]. No changes were made to the original illustration (Keithonearth, CC BY 3.0).
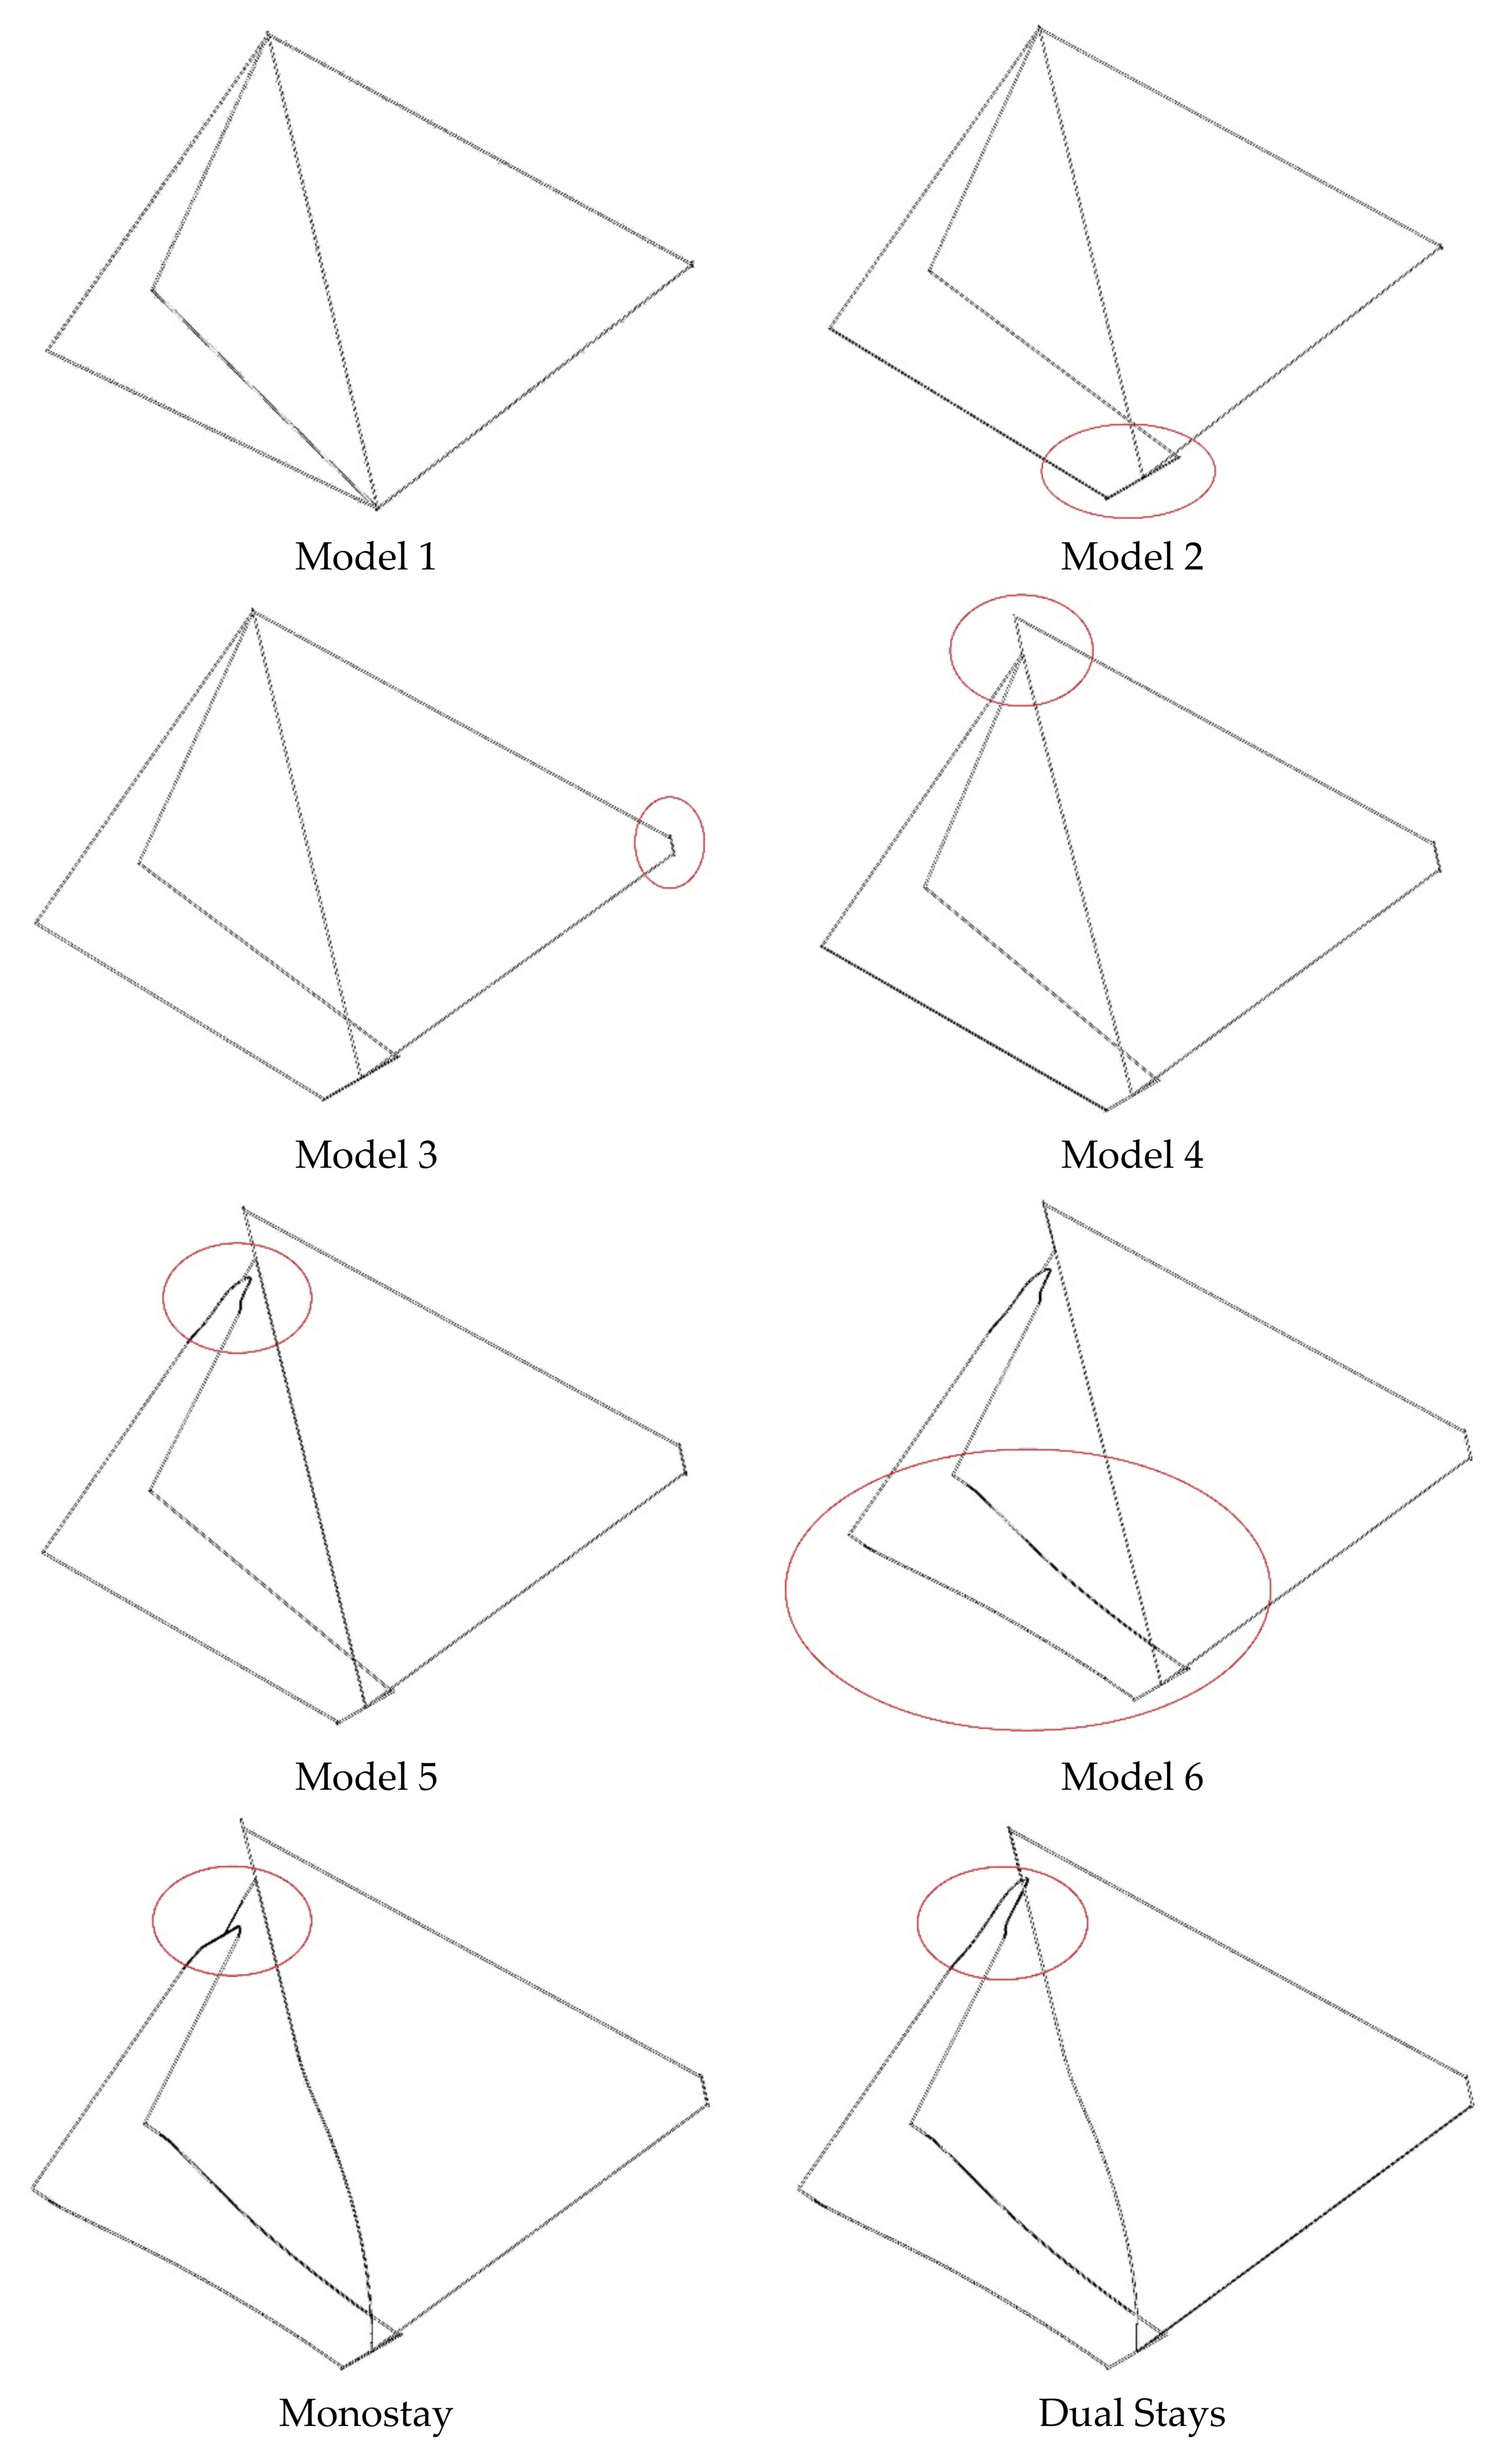
Figure 4.
Sequence of simple spaceframe design.
Figure 4.
Sequence of simple spaceframe design.
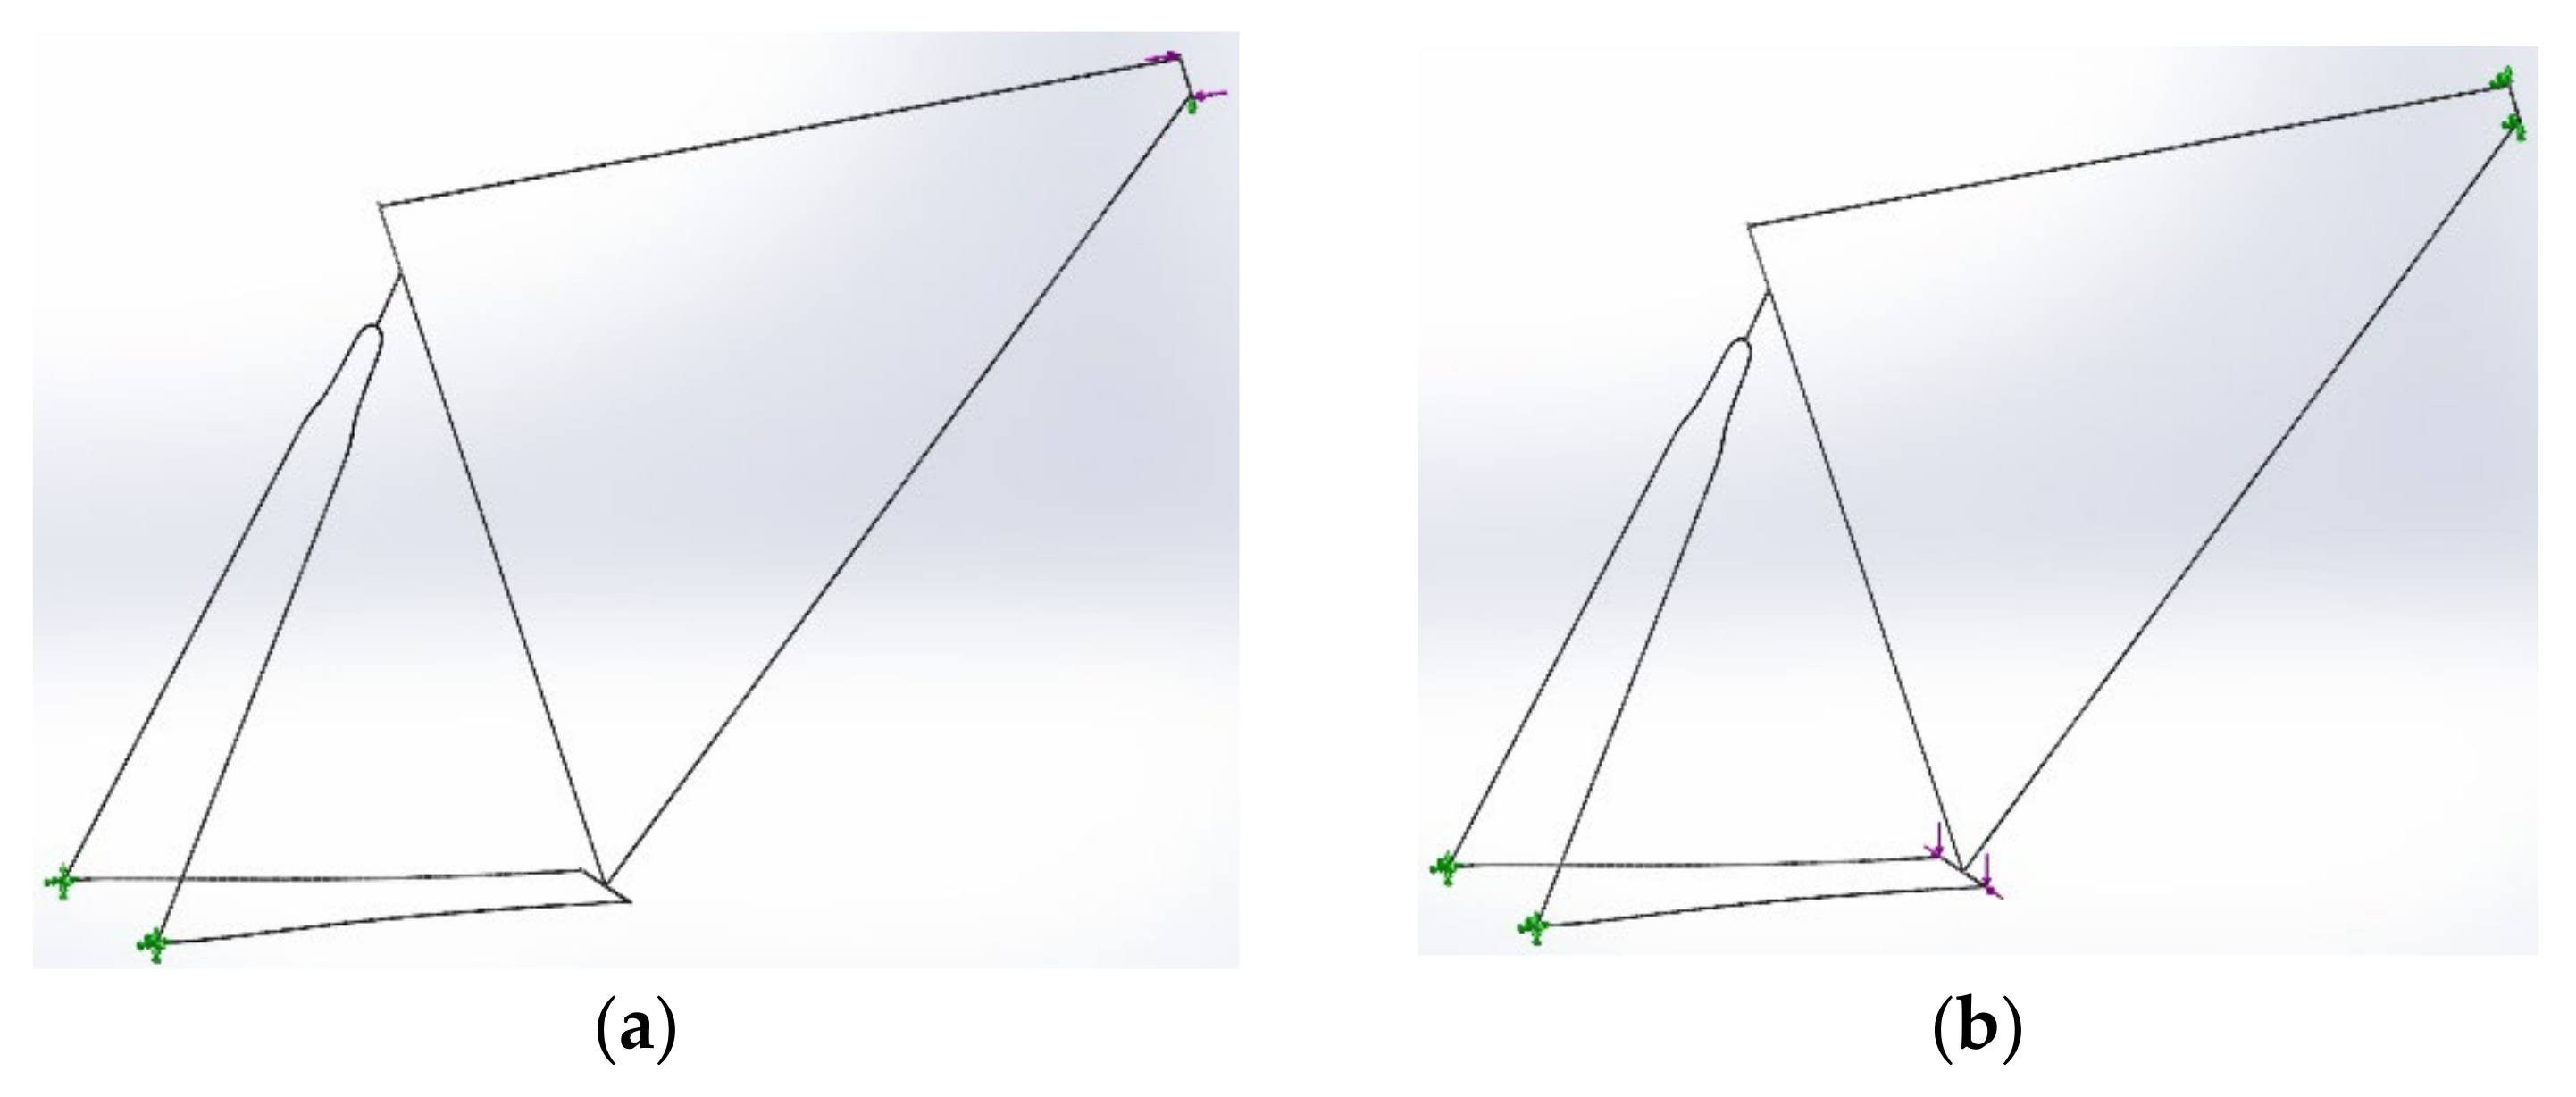
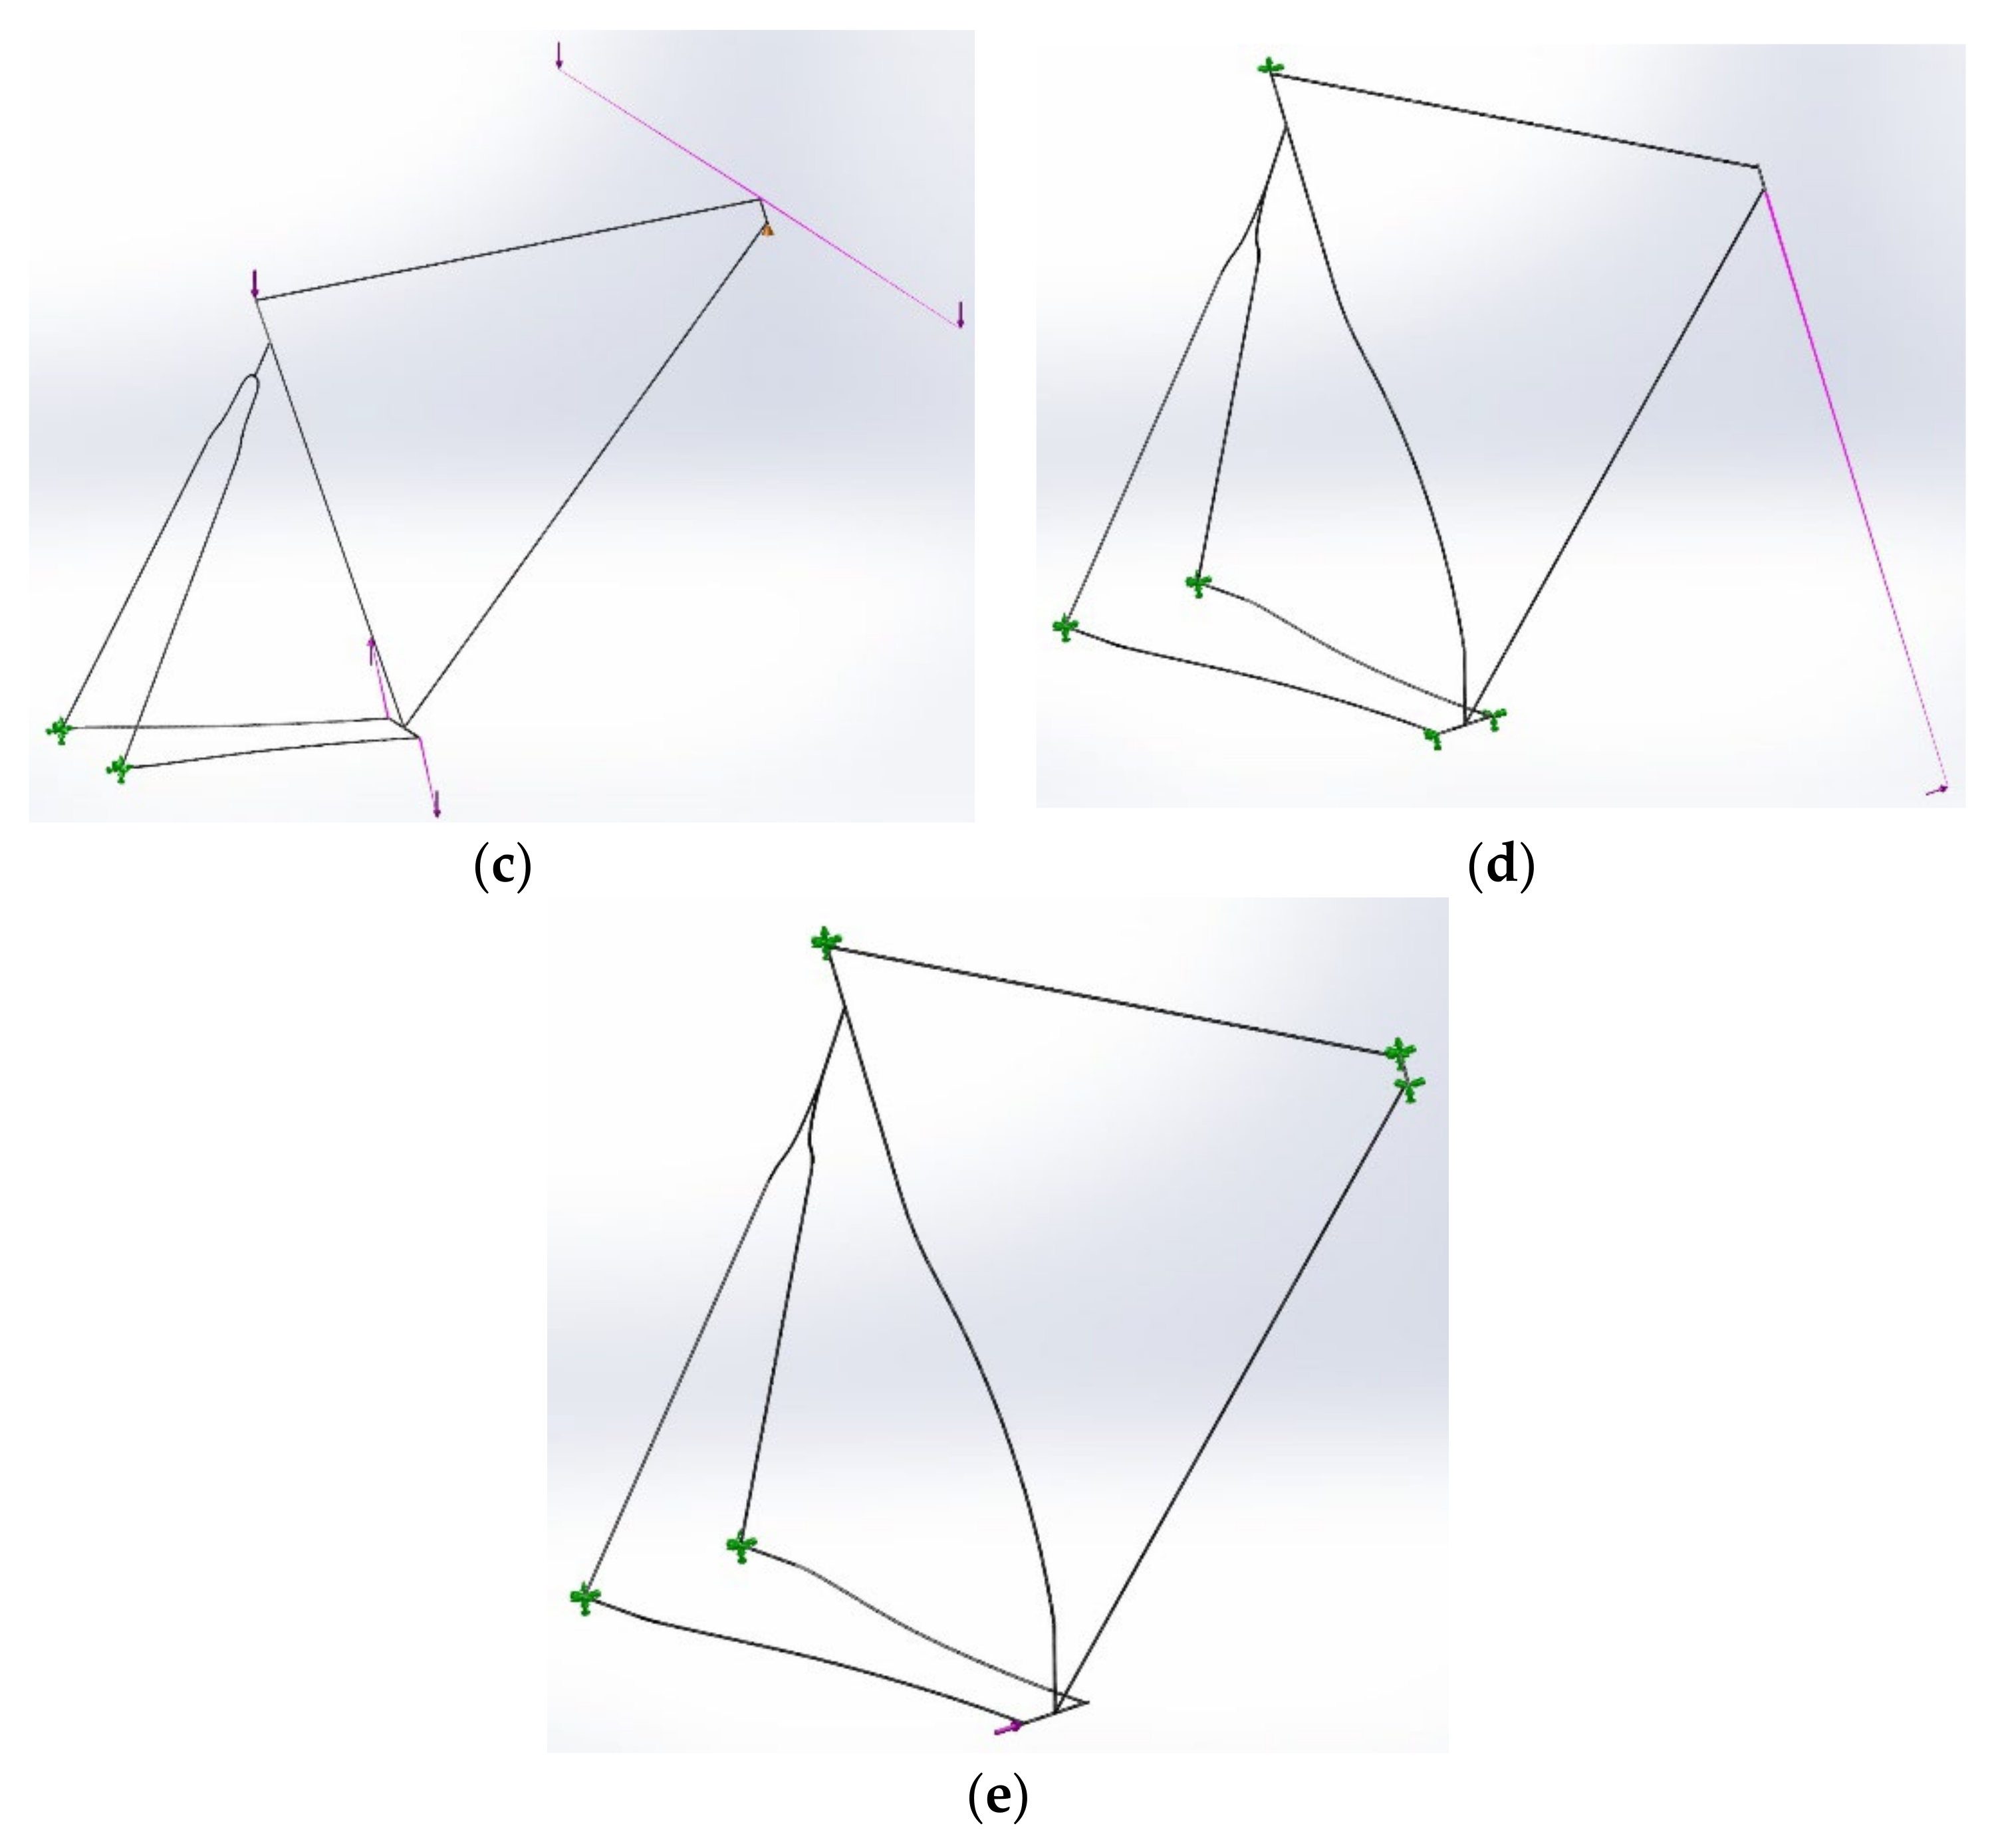
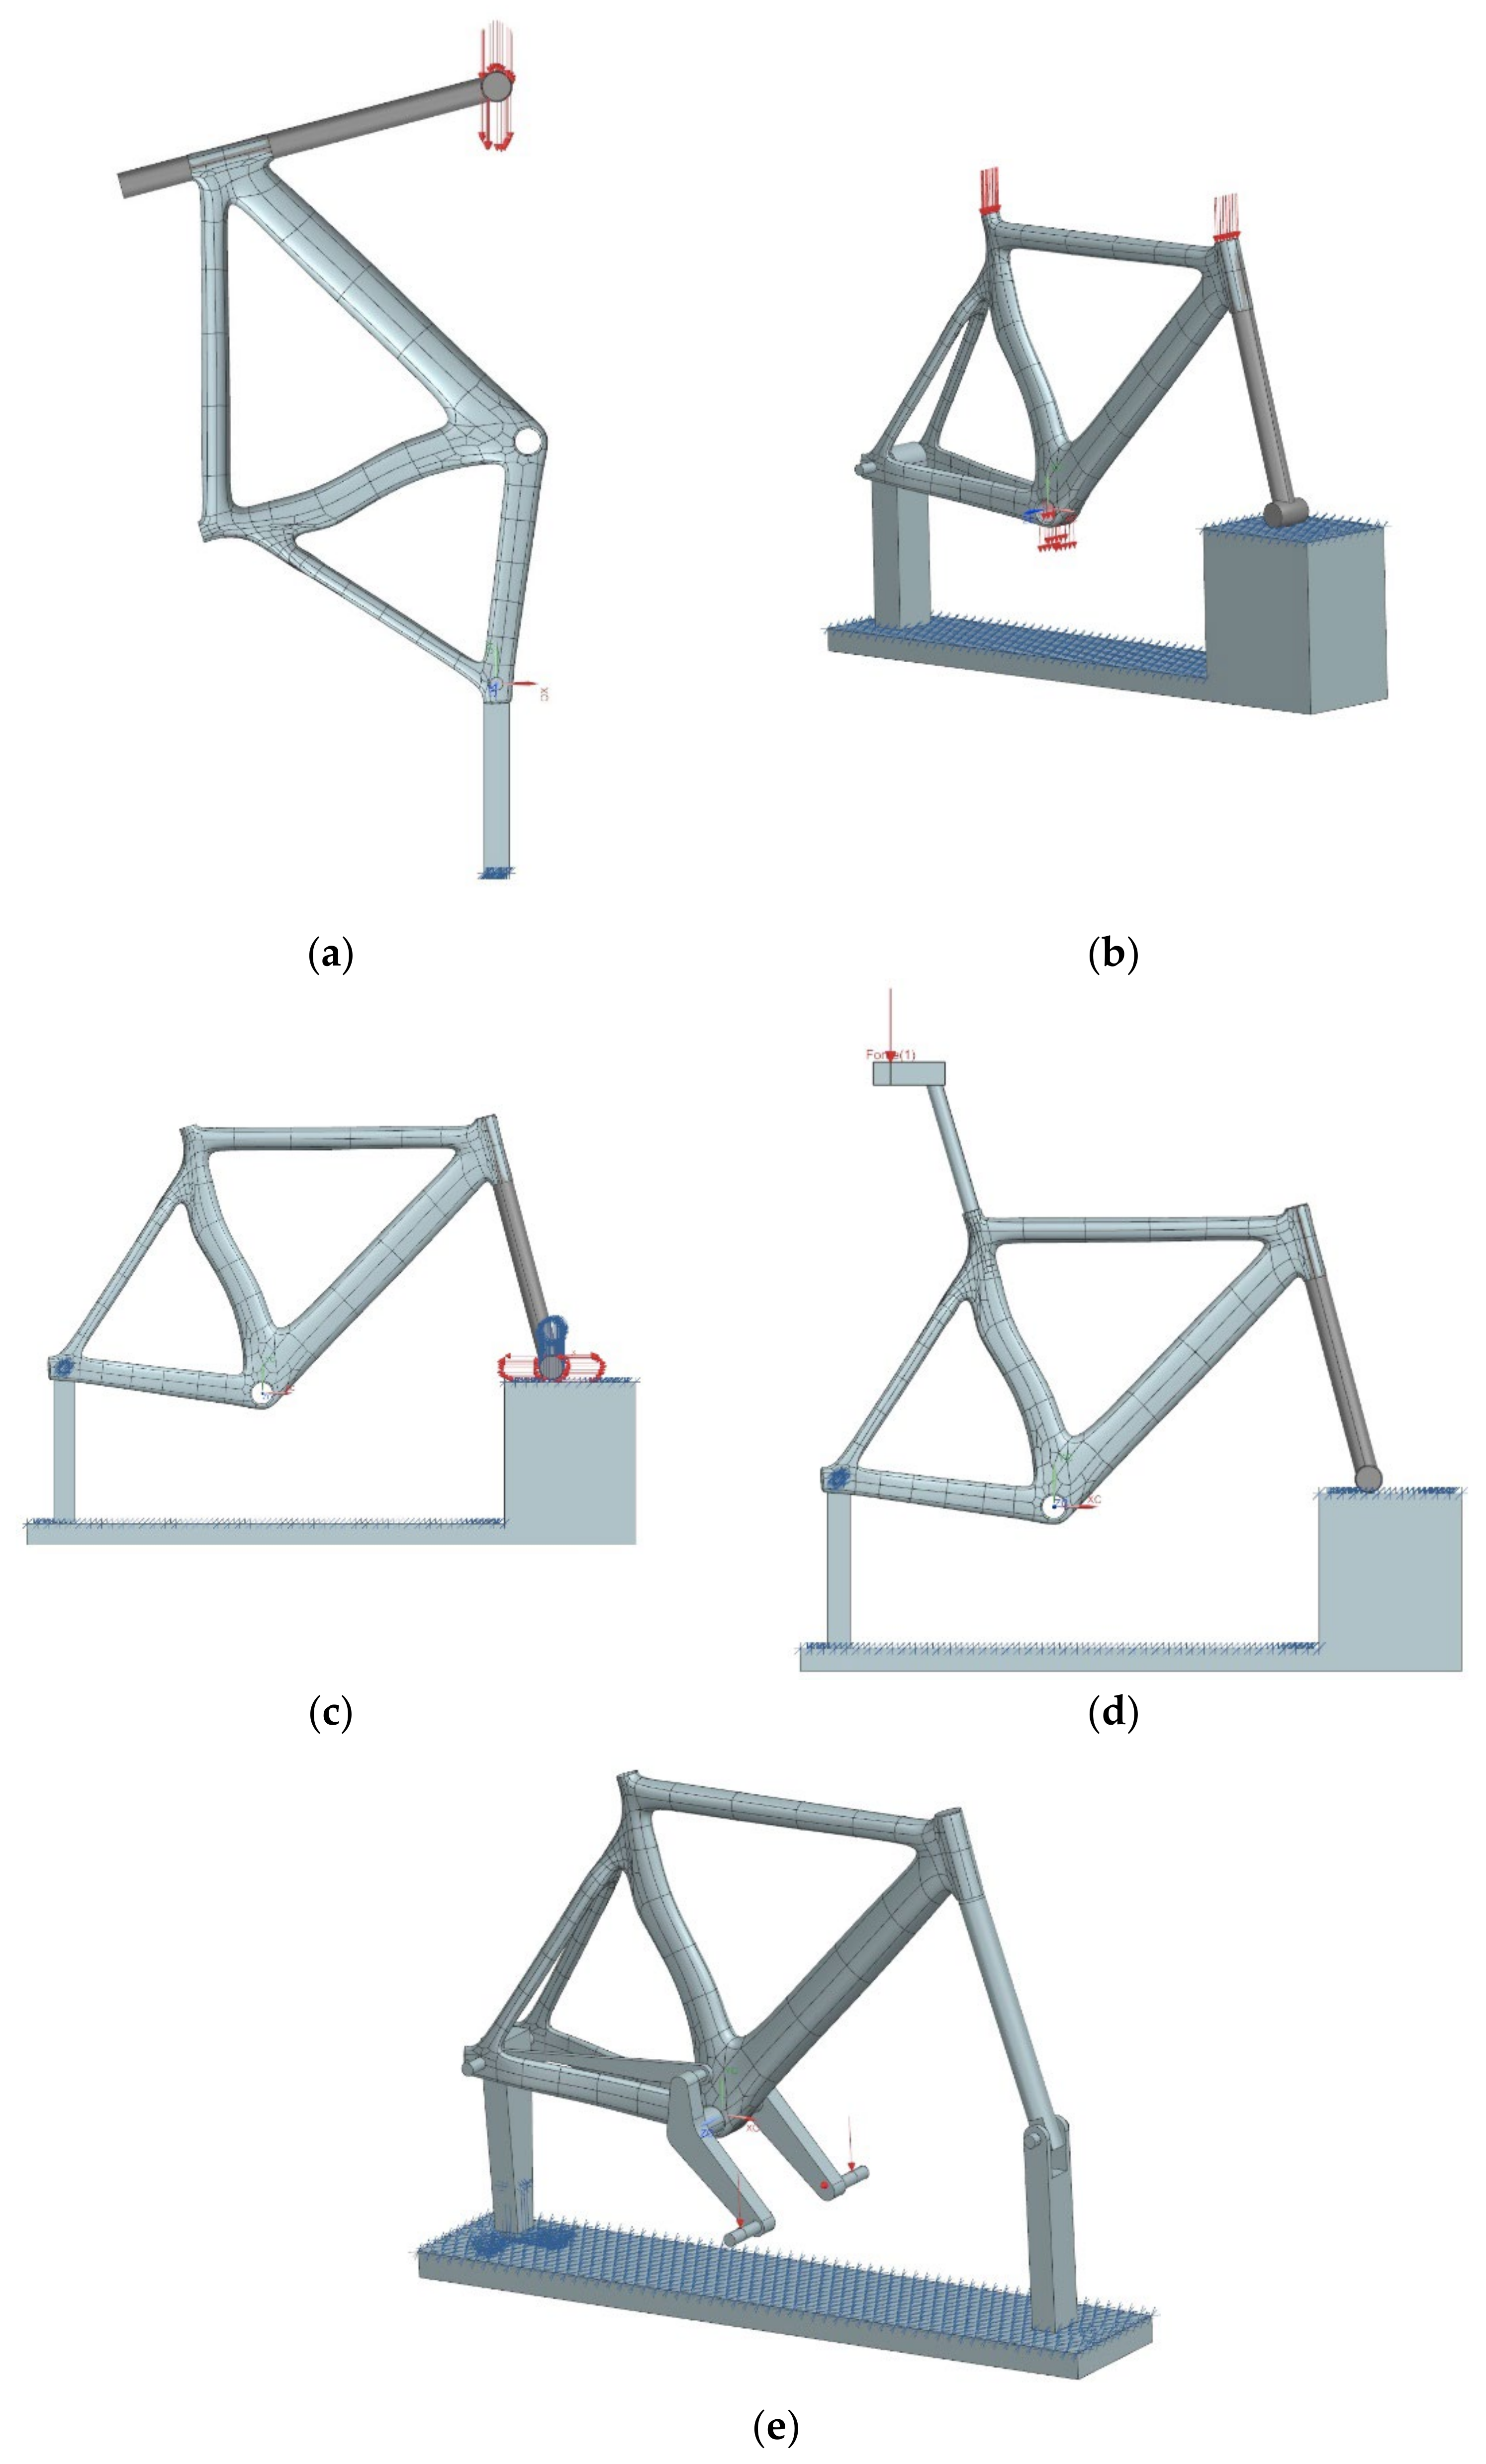
Figure 5.
Tested loading scenarios: (a) horizontal forces scenario with fixed constraints on the rear ends of the stays, simple support on the bottom end of the head tube, and forces on either end of the head tube; (b) static start-up scenario with fixed constraints on the rear ends of the stays and either end of the head tube, and loads on either end of the bottom bracket shell; (c) riding scenario with fixed constraints on the ends of stays, simple support on the bottom end of the head tube, and forces on the top of the seat tube, either end of the handlebar and the crankset; (d) out-of-plane load to head tube scenario with fixed constraints on the ends of the stays, top of seat tube, and bottom bracket shell; (e) out-of-plane load to bottom bracket shell scenario with fixed constraints on the ends of the stays and head tube.
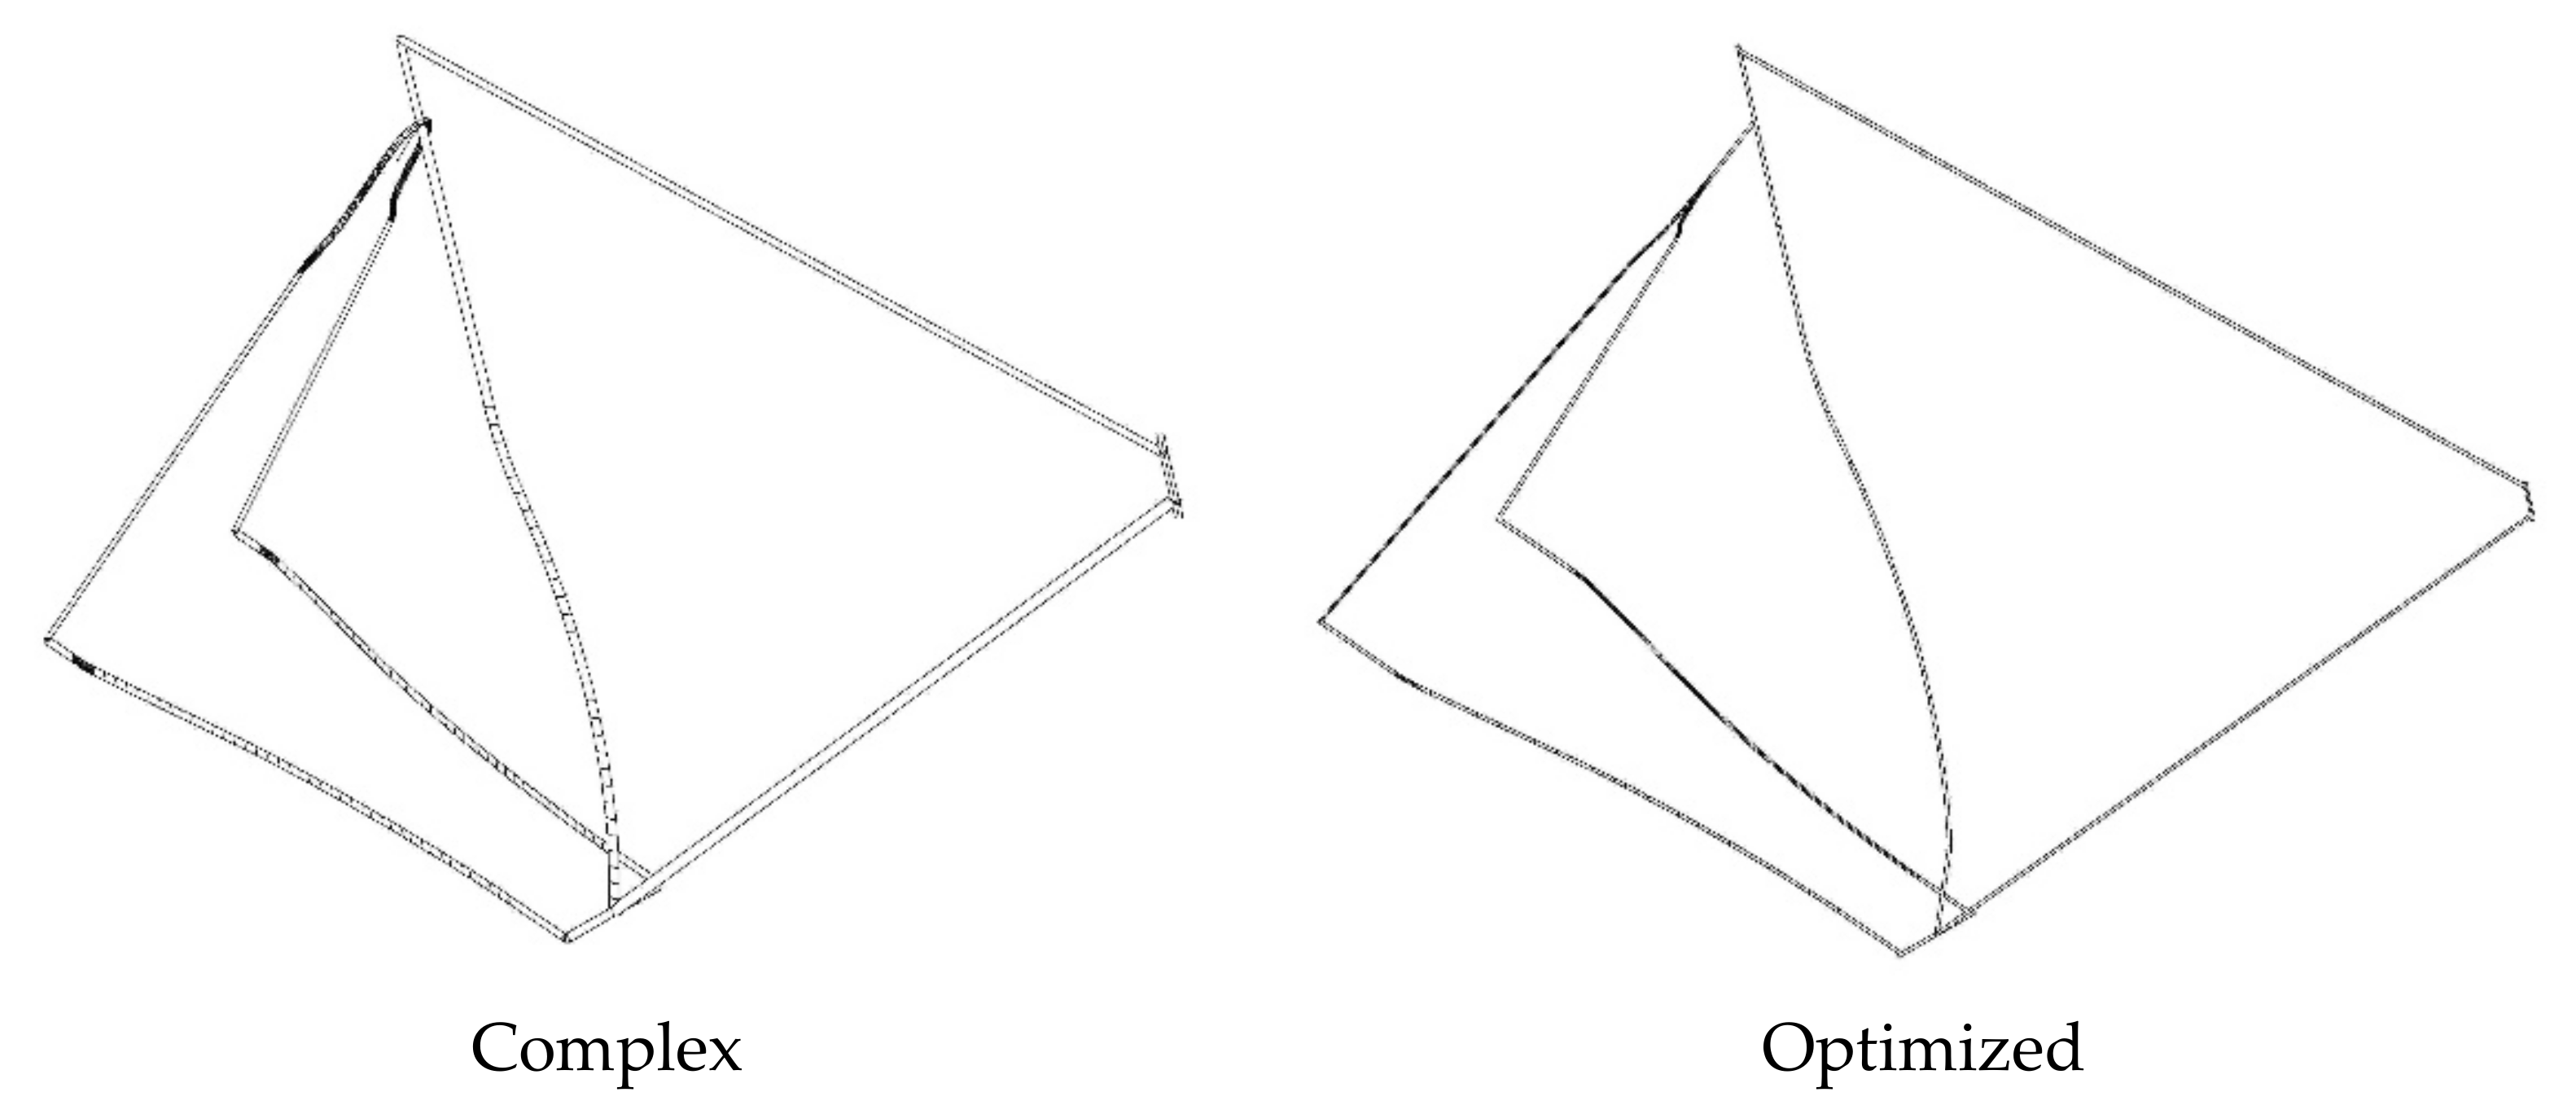
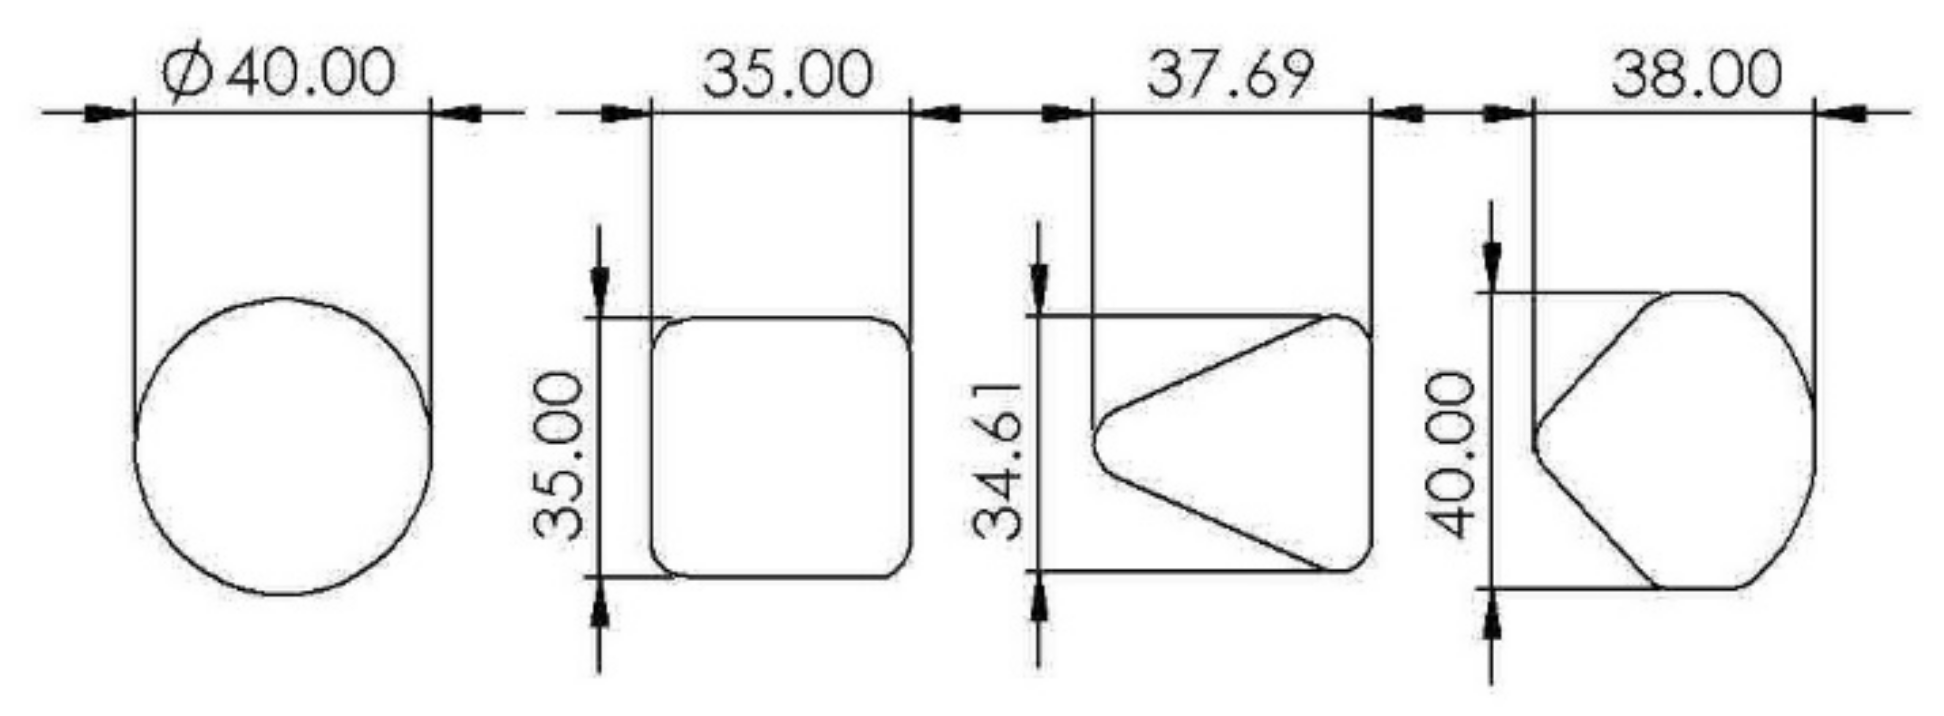
Figure 6.
Top tube cross-sections from left to right: circular 40 mm, rectangular 35 × 35 mm, triangular, and complex.
Figure 6.
Top tube cross-sections from left to right: circular 40 mm, rectangular 35 × 35 mm, triangular, and complex.
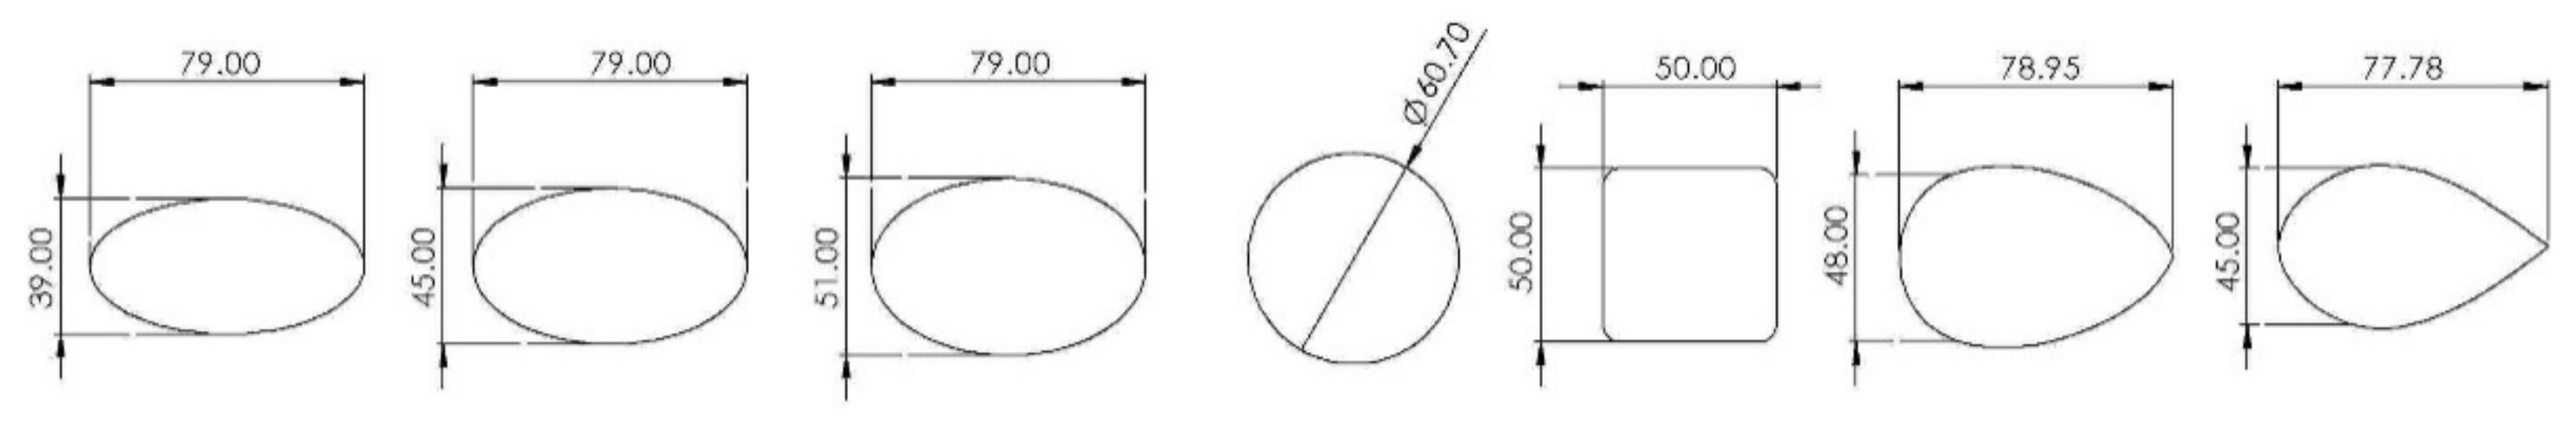
Figure 7.
Down tube cross-sections from left to right: oval 39 × 79, oval 45 × 79, oval 51 × 79, circular 60.7 mm, rectangular 50 × 50, complex 1, and complex 2.
Figure 7.
Down tube cross-sections from left to right: oval 39 × 79, oval 45 × 79, oval 51 × 79, circular 60.7 mm, rectangular 50 × 50, complex 1, and complex 2.
Figure 8.
Seat tube cross-sections from left to right: complex 1, complex 2, complex 3, complex 4, and circular 34.9 mm and 53 mm.
Figure 8.
Seat tube cross-sections from left to right: complex 1, complex 2, complex 3, complex 4, and circular 34.9 mm and 53 mm.
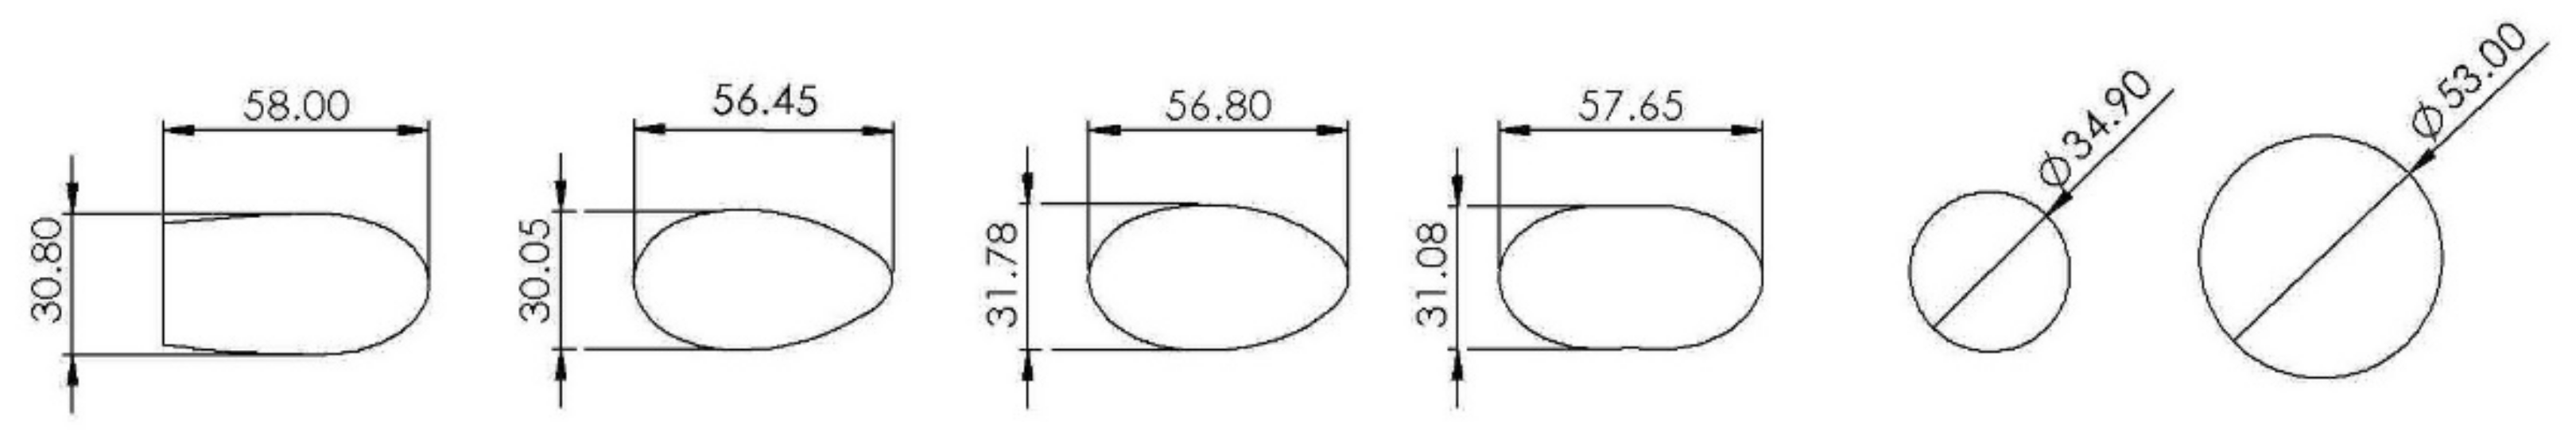
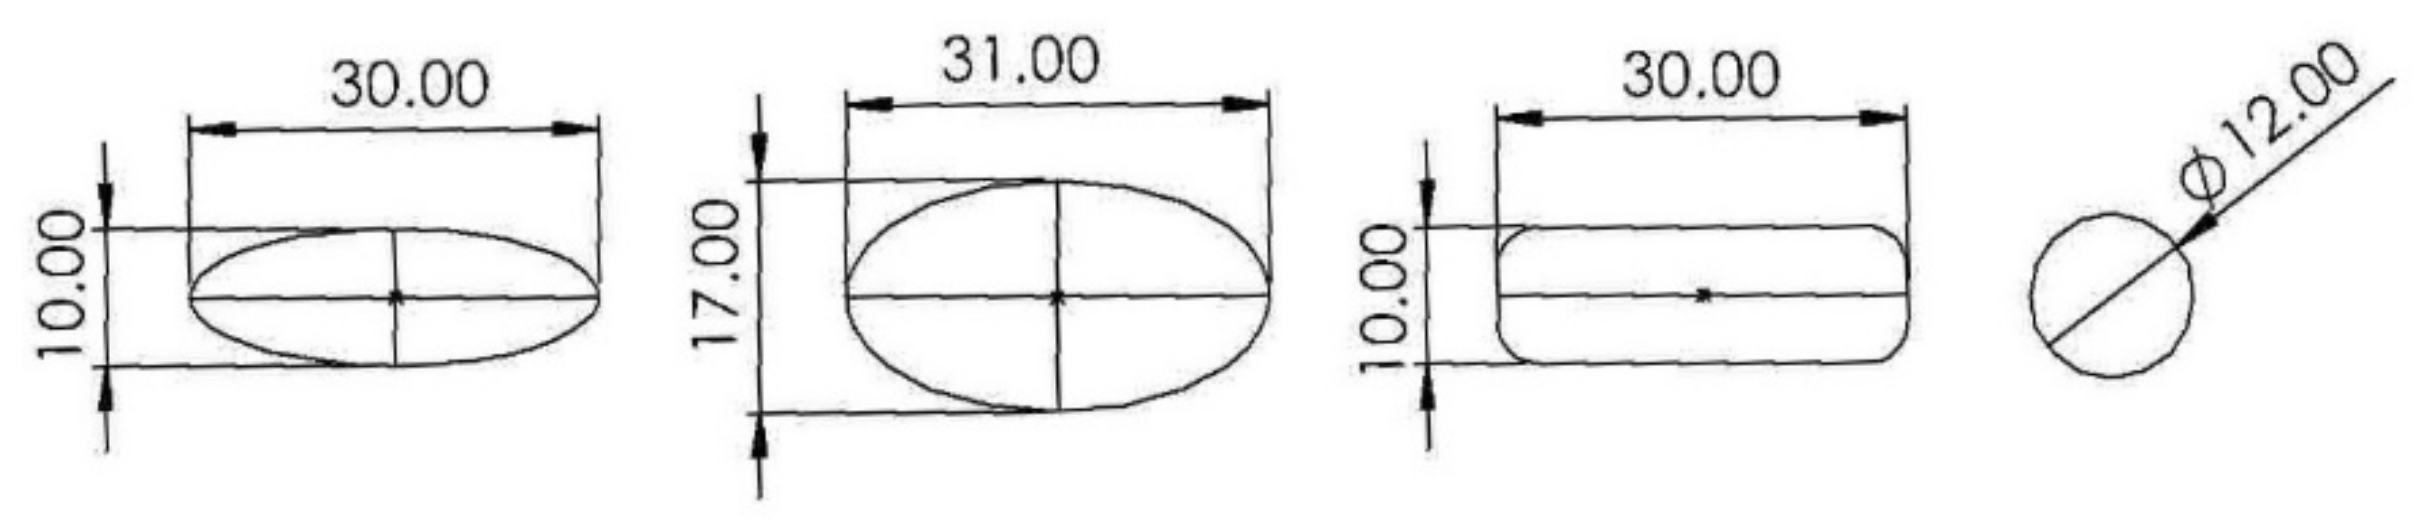
Figure 9.
Seat stay cross-sections from left to right: oval 10 × 30, oval 17 × 30, rectangular 10 × 30, and circular 12 mm.
Figure 9.
Seat stay cross-sections from left to right: oval 10 × 30, oval 17 × 30, rectangular 10 × 30, and circular 12 mm.
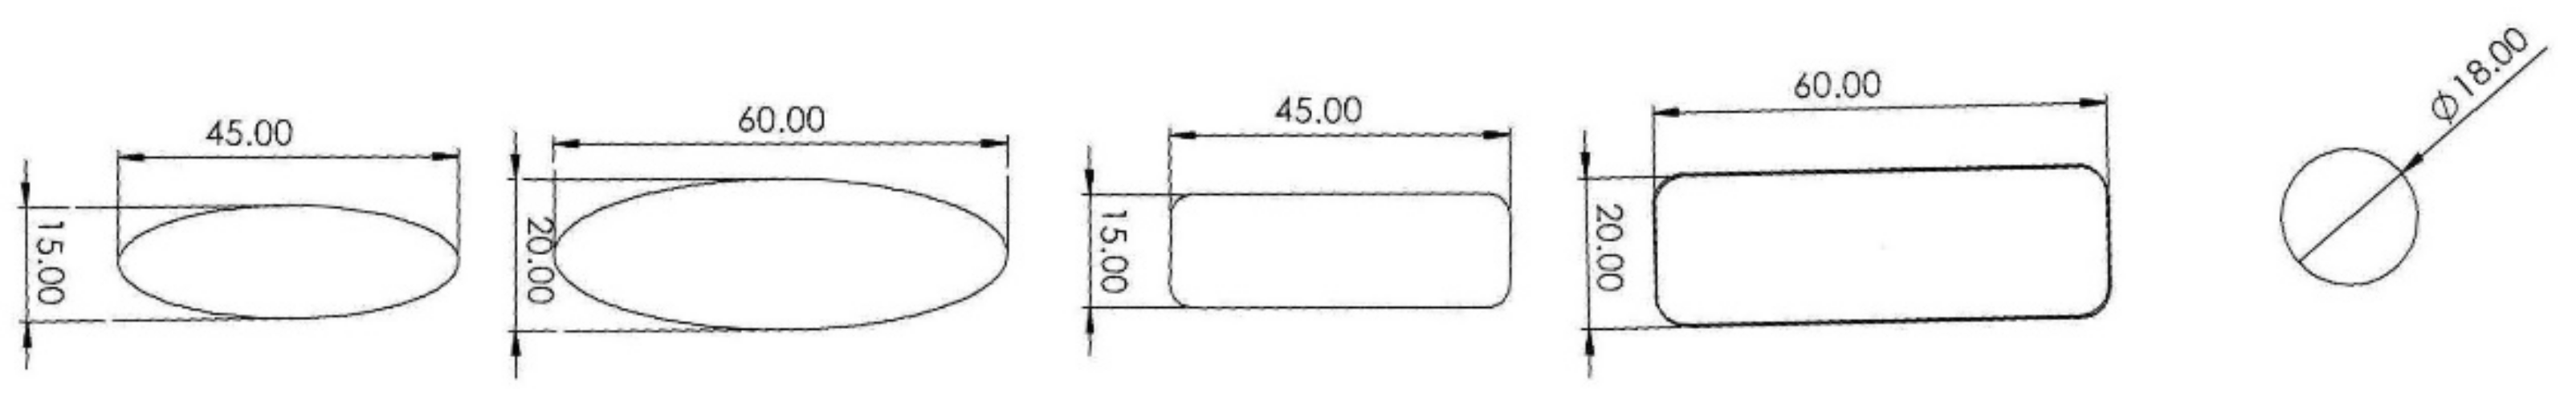
Figure 10.
Chain stay cross-sections from left to right: oval 15 × 45, oval 20 × 60, rectangular 15 × 45, rectangular 20 × 60, and circular 18 mm.
Figure 10.
Chain stay cross-sections from left to right: oval 15 × 45, oval 20 × 60, rectangular 15 × 45, rectangular 20 × 60, and circular 18 mm.
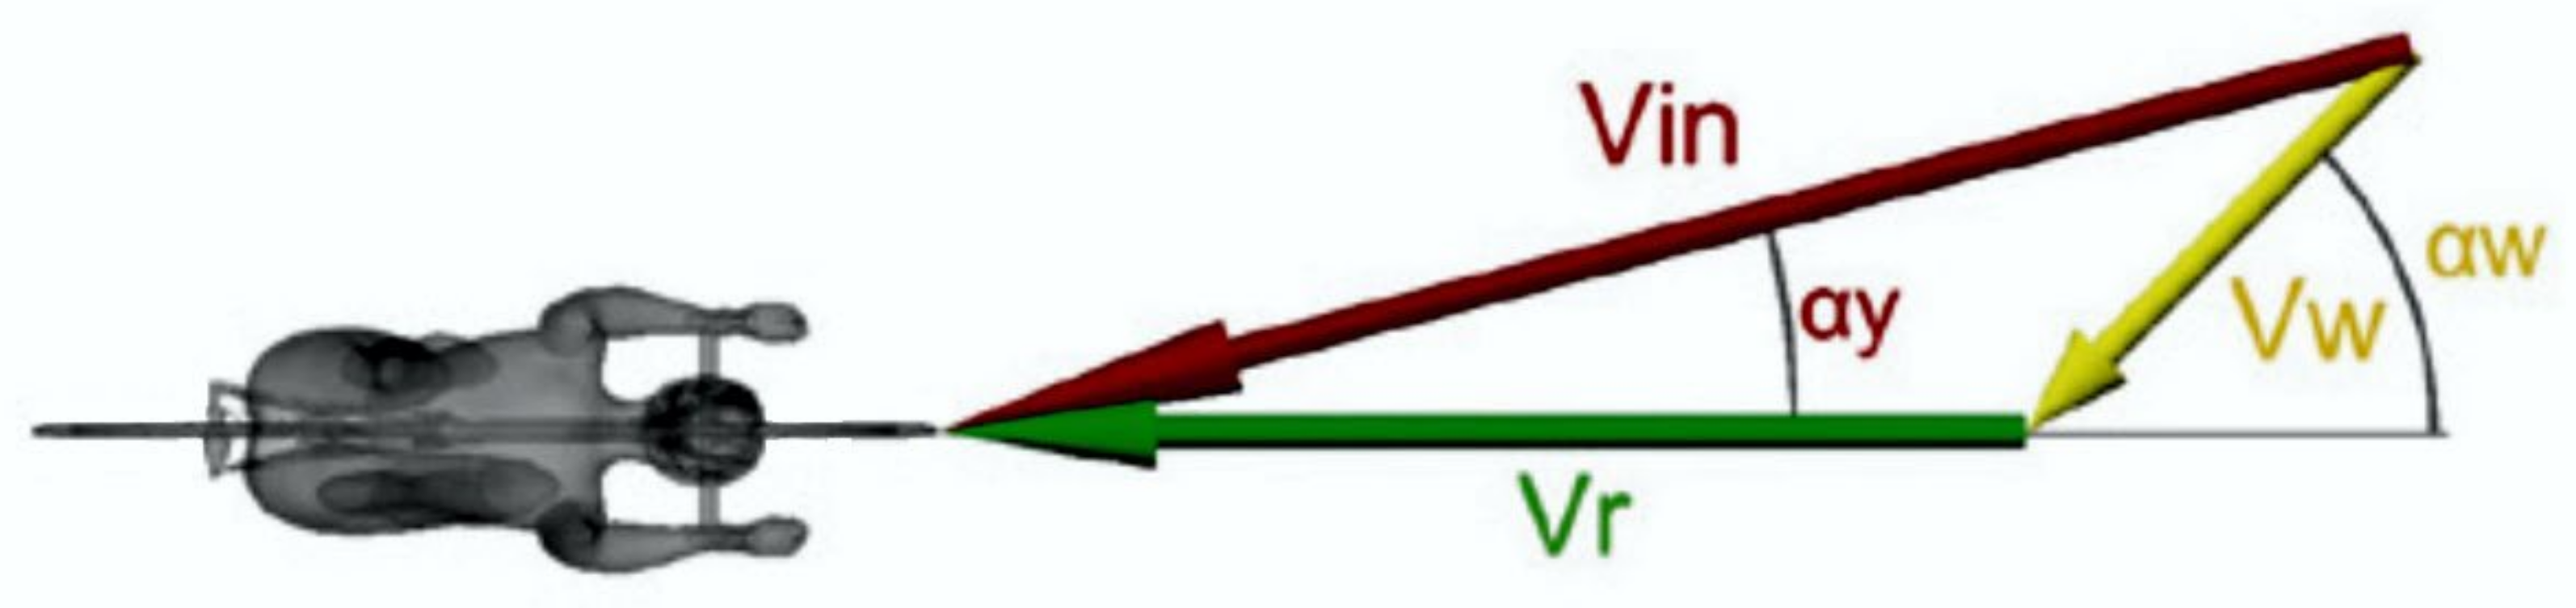
Figure 11.
Total wind velocity as perceived by the rider.
Figure 11.
Total wind velocity as perceived by the rider.
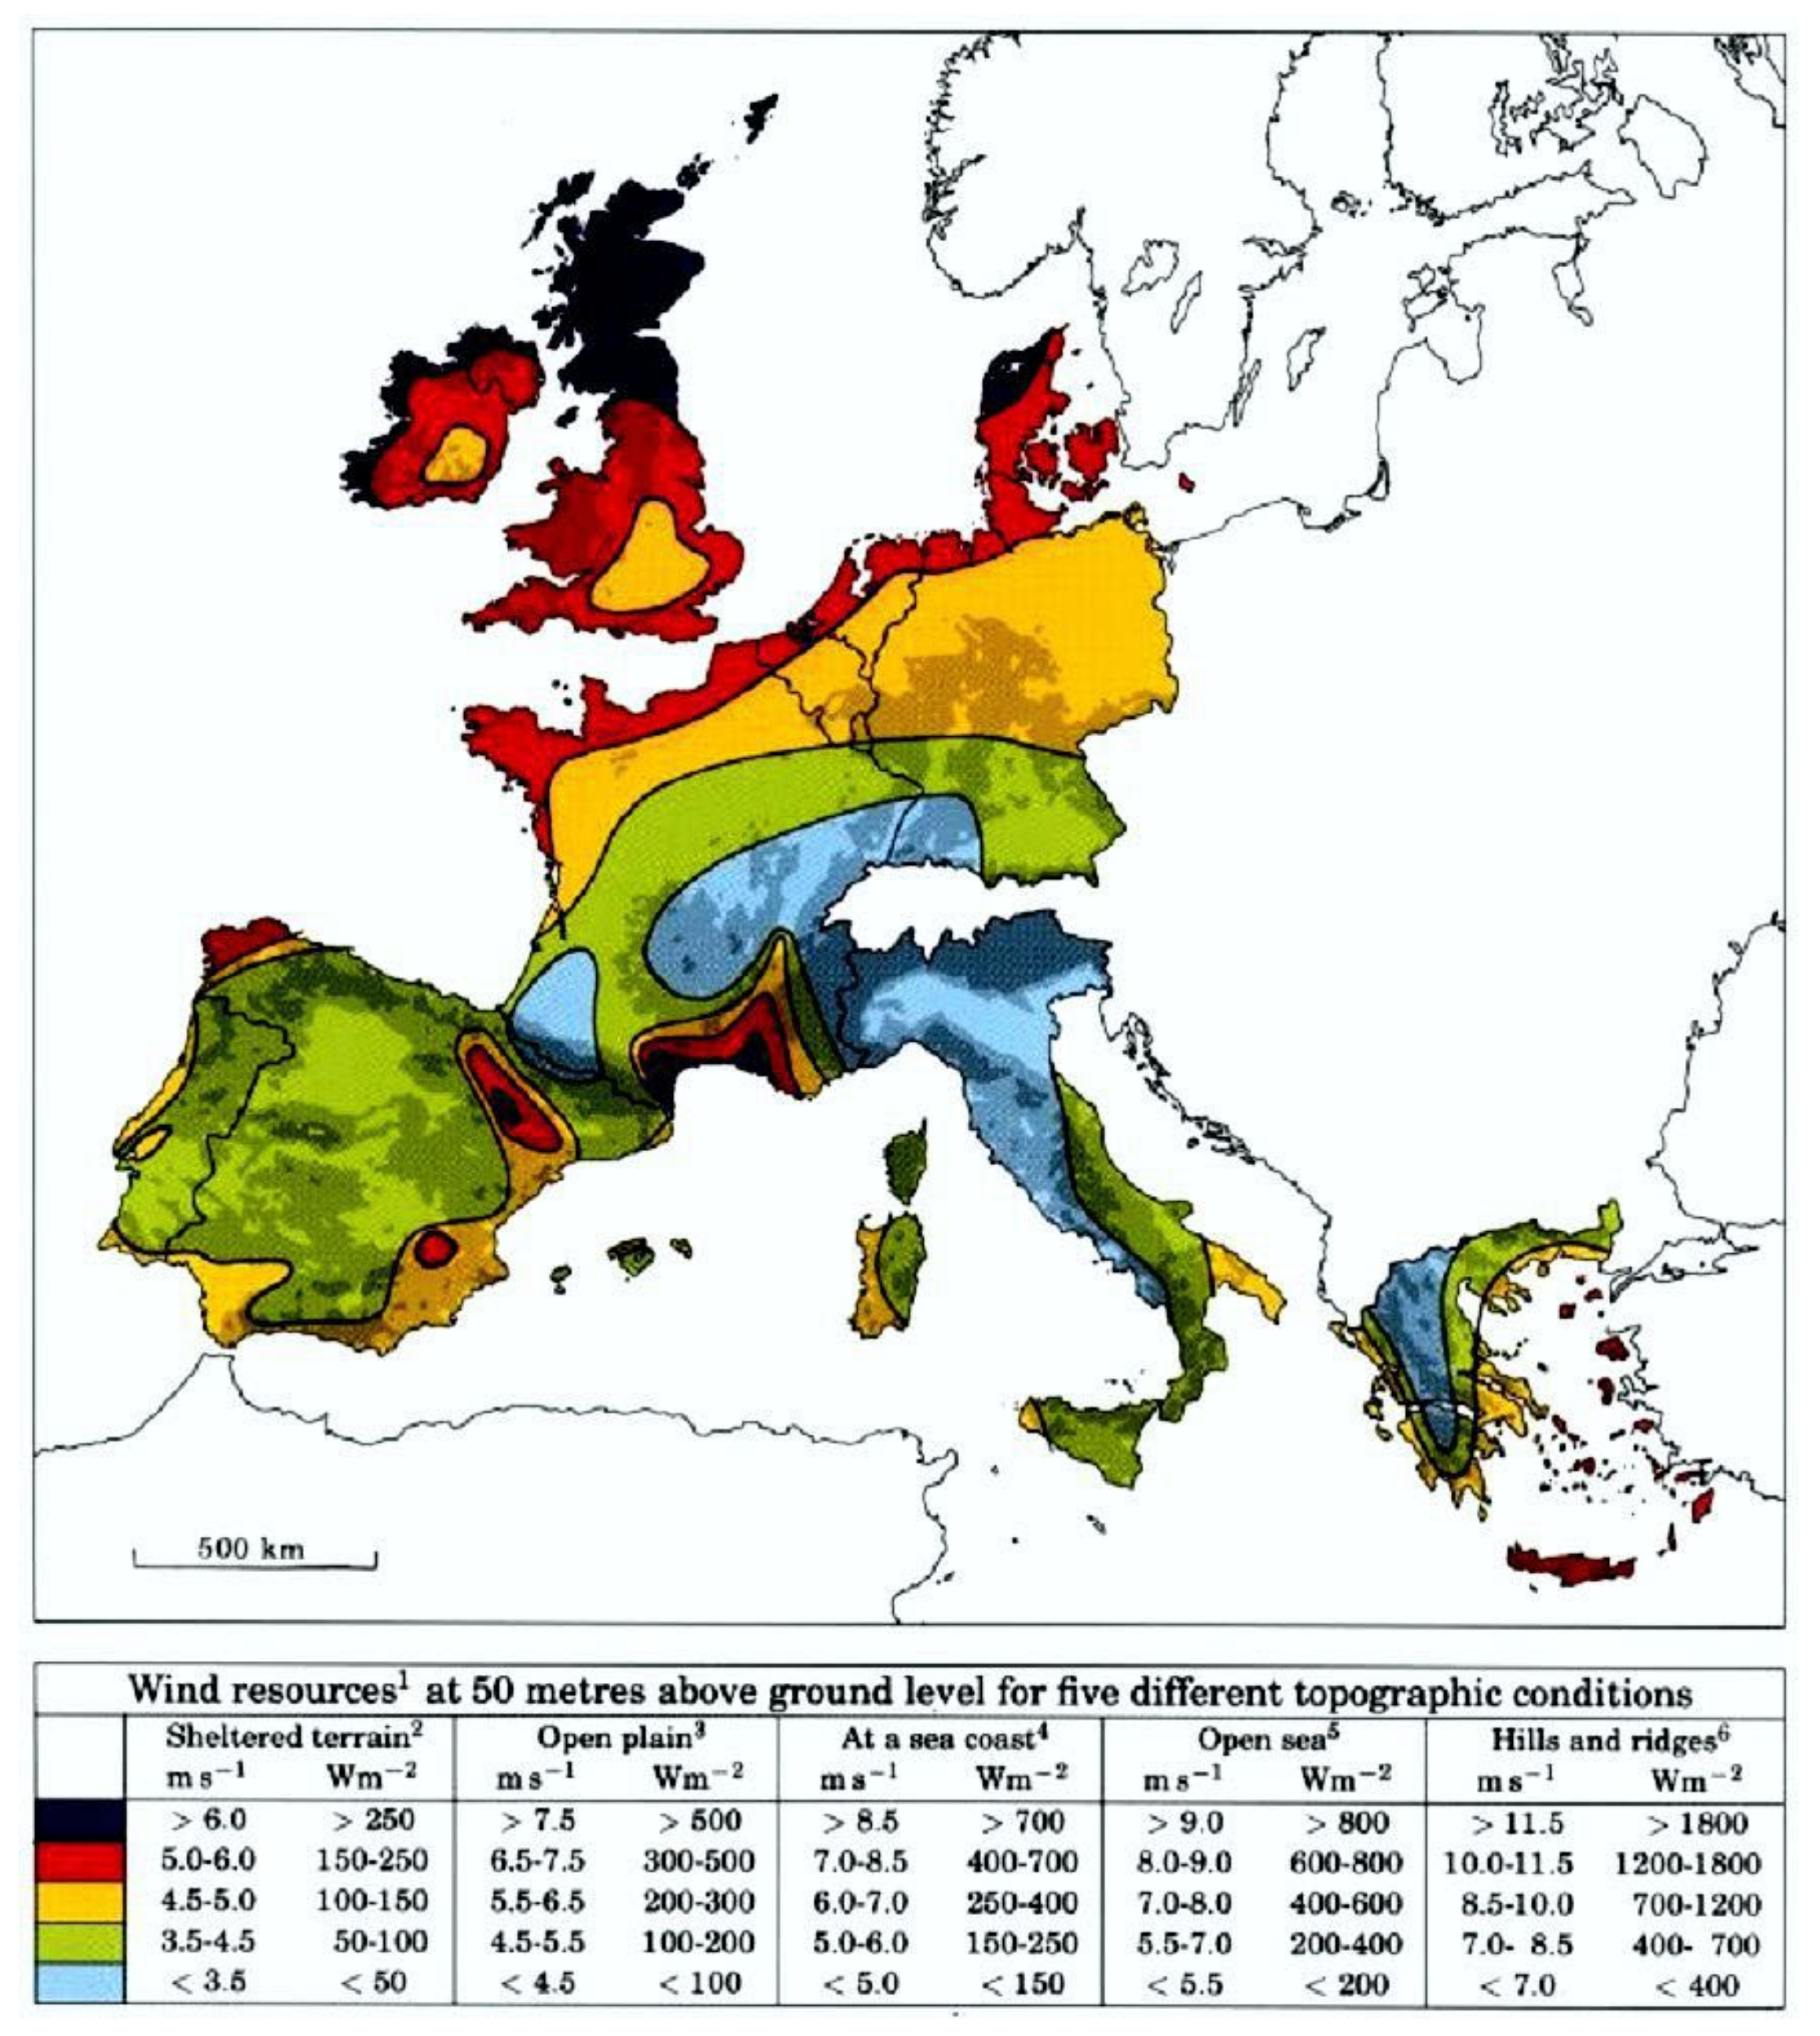
Figure 12.
Wind atlas of Europe [
33] 1989 DTU Wind Energy, formerly Risø National Laboratory.
Figure 12.
Wind atlas of Europe [
33] 1989 DTU Wind Energy, formerly Risø National Laboratory.
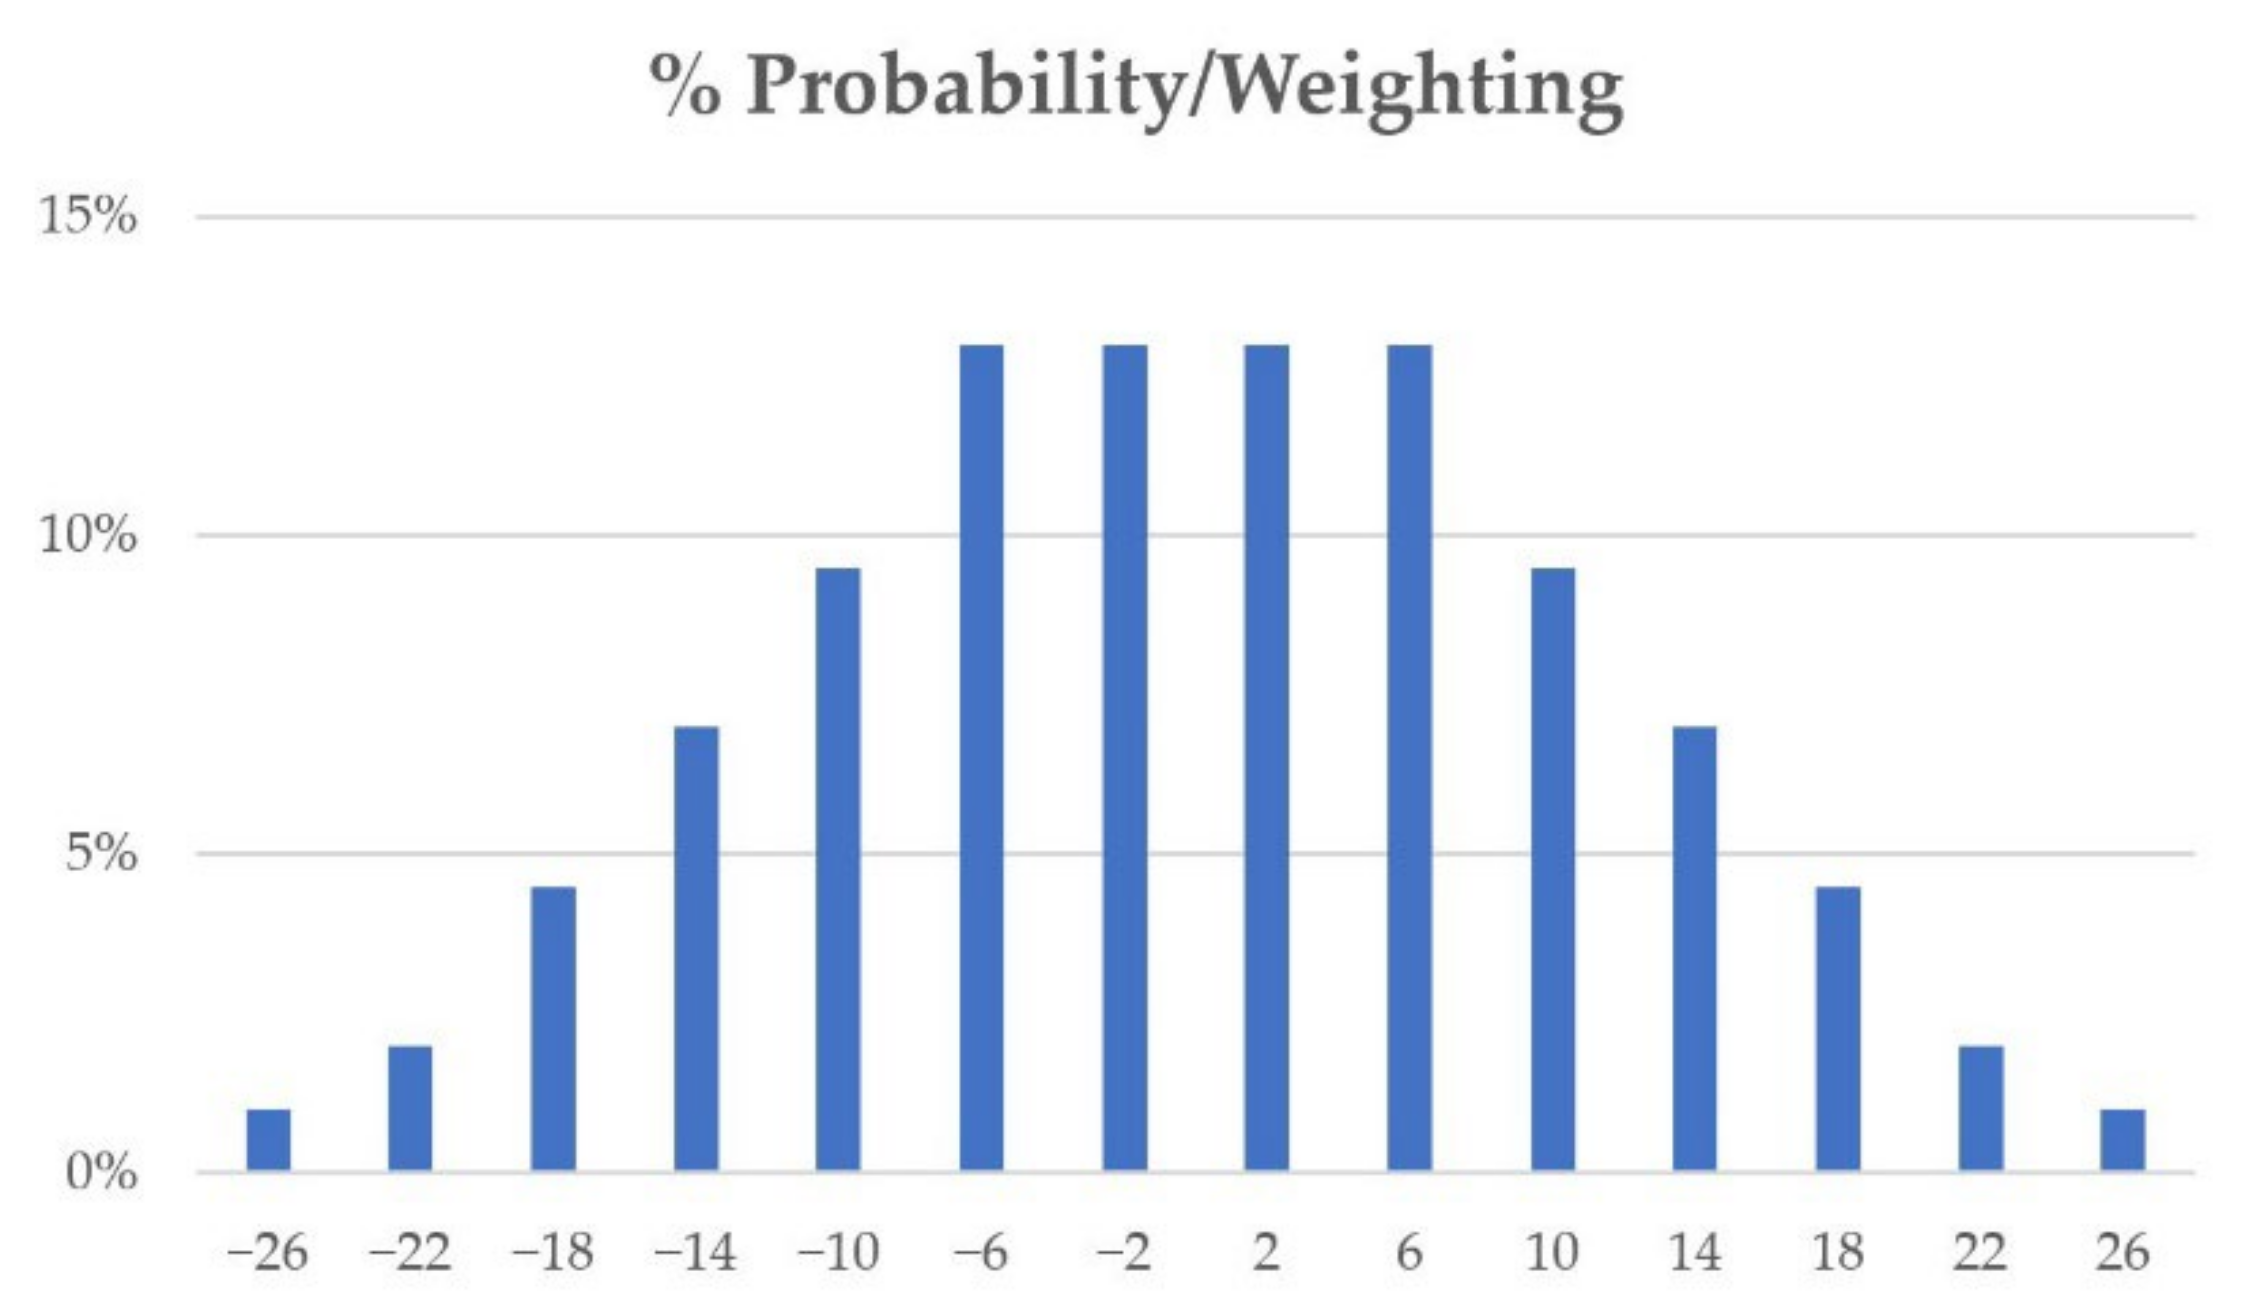
Figure 13.
Probability/weighting of each yaw angle.
Figure 13.
Probability/weighting of each yaw angle.
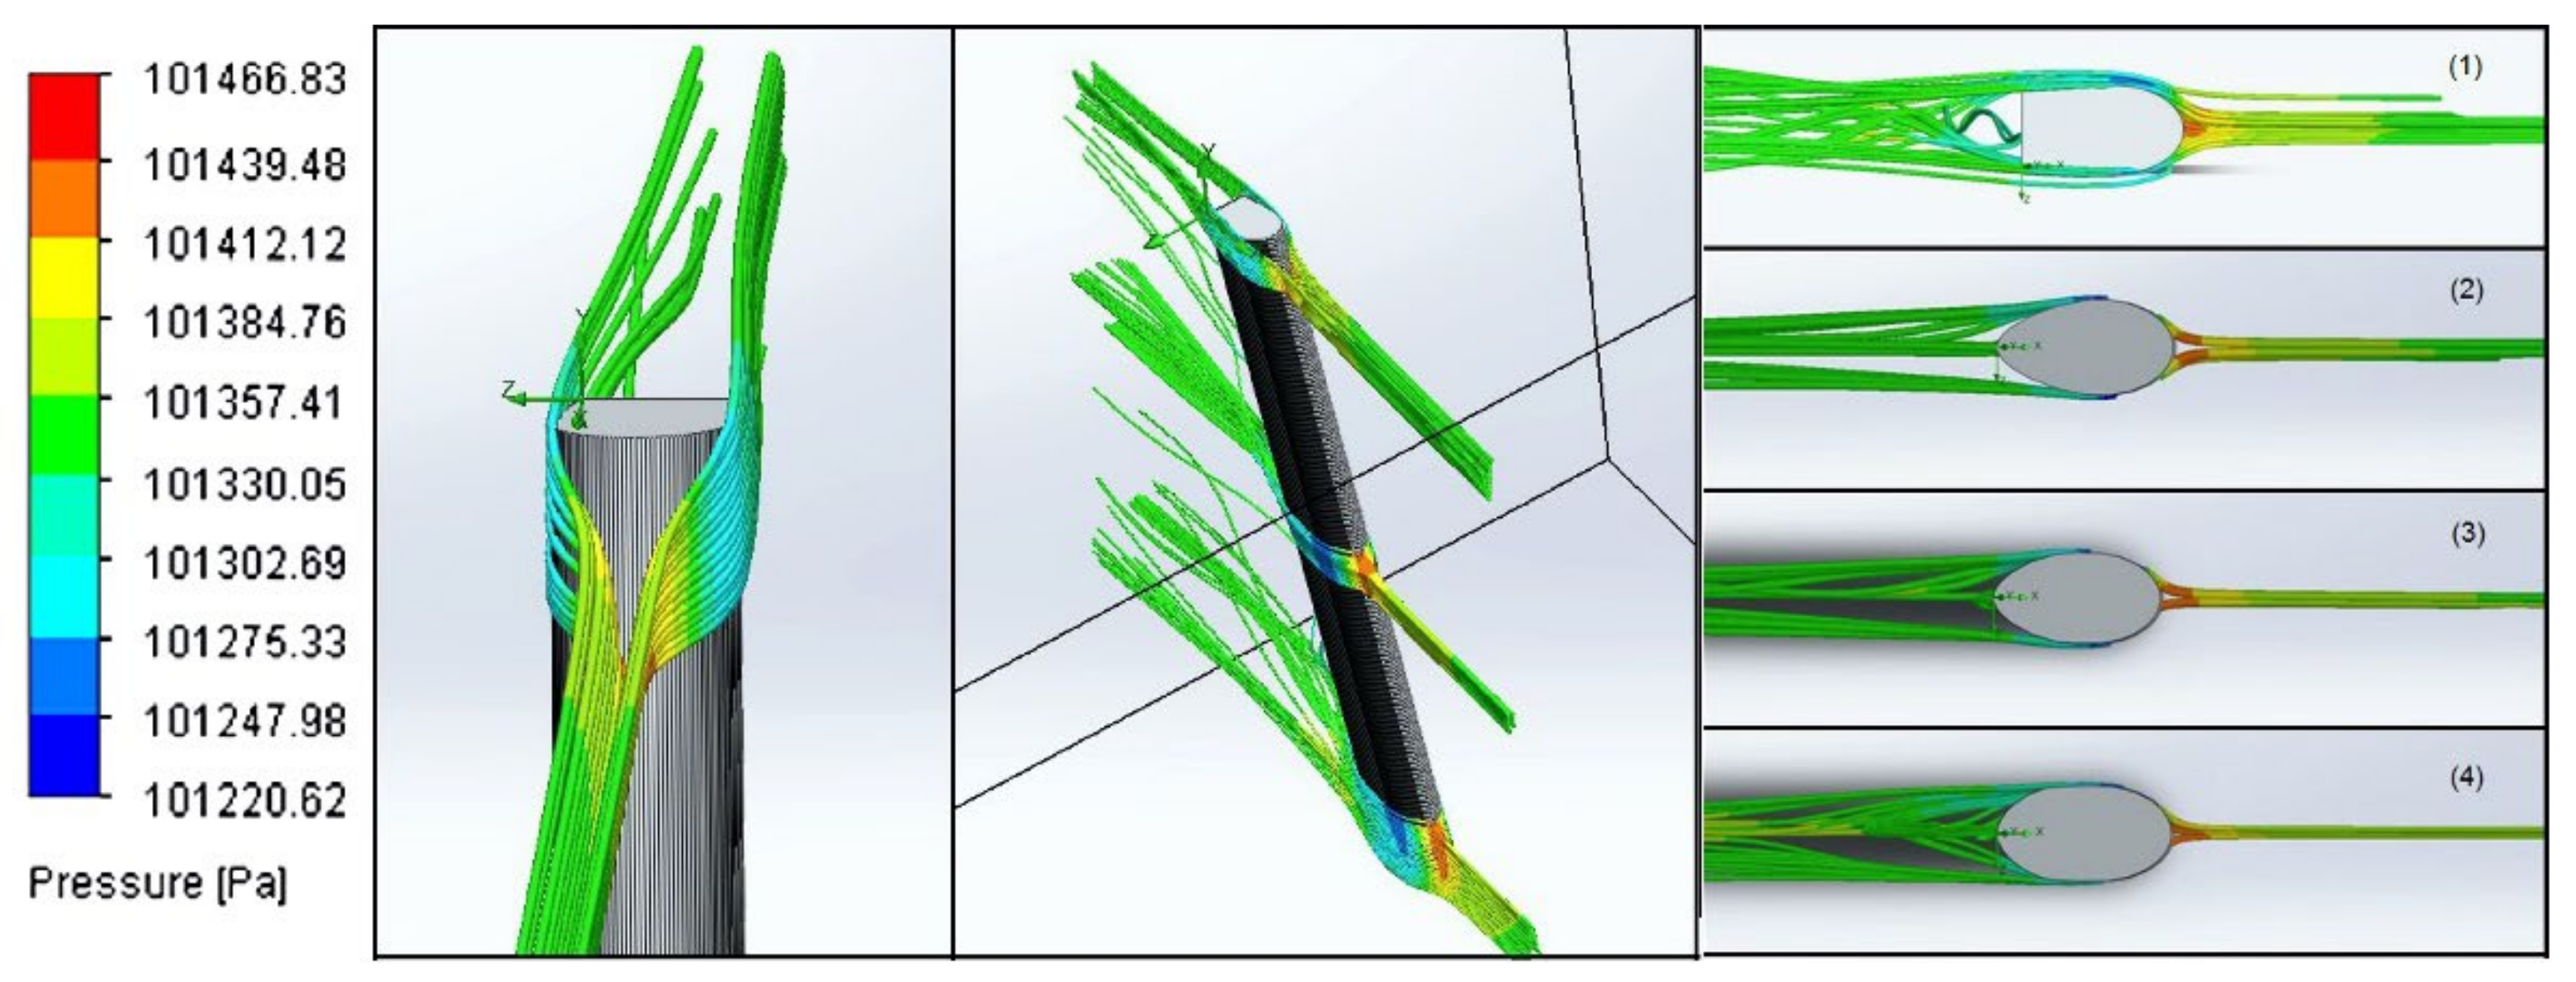
Figure 14.
Flow and pressure area lines on seat tube cross-sections in design point 1. From left to right: the two left pictures show the flow lines around the complex 1 cross-section from different views. The next three pictures show the flow lines around the complex 4, complex 3, and complex 1 cross-sections as viewed from above. The different colors represent the variation of pressure caused when the air flows around the models (red indicates high pressure, blue is low, and green is atmospheric pressure).
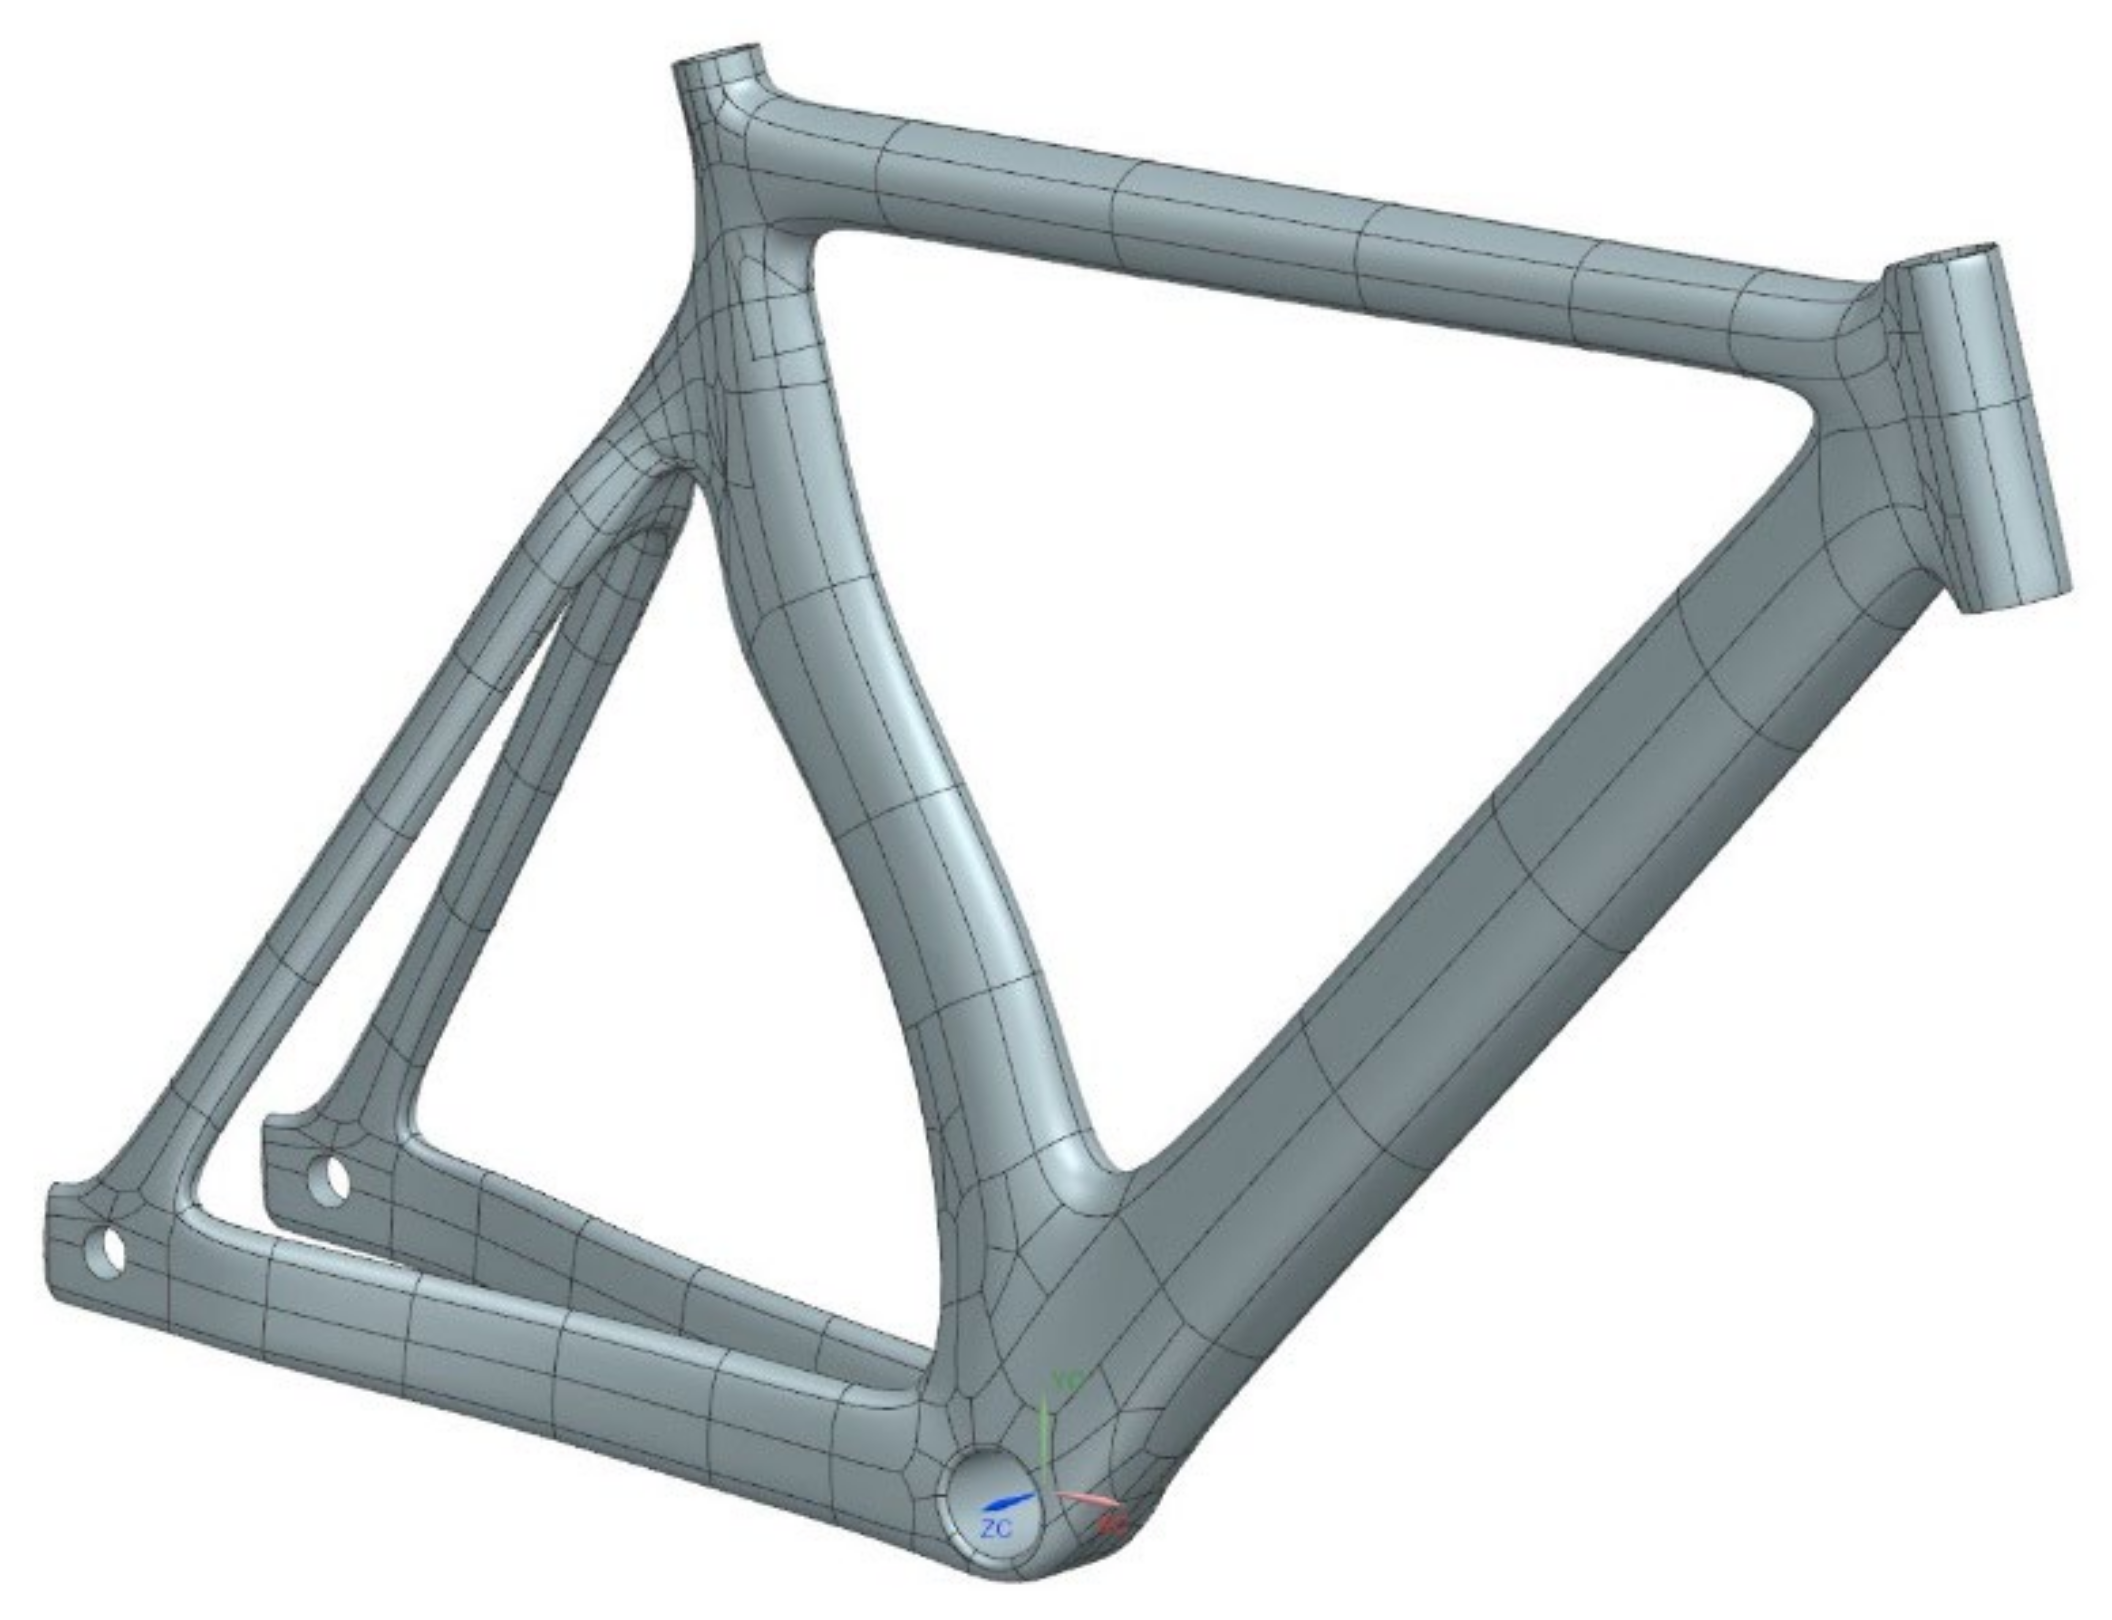
Figure 15.
Final frame model.
Figure 15.
Final frame model.
Figure 16.
(a) FE method preview of drop mass test, (b) FE test method preview of the falling frame, (c) FE test method preview of horizontal forces, (d) FE test method preview of vertical force through the seat tube, (e) FE test method preview of pedaling forces.
Figure 16.
(a) FE method preview of drop mass test, (b) FE test method preview of the falling frame, (c) FE test method preview of horizontal forces, (d) FE test method preview of vertical force through the seat tube, (e) FE test method preview of pedaling forces.
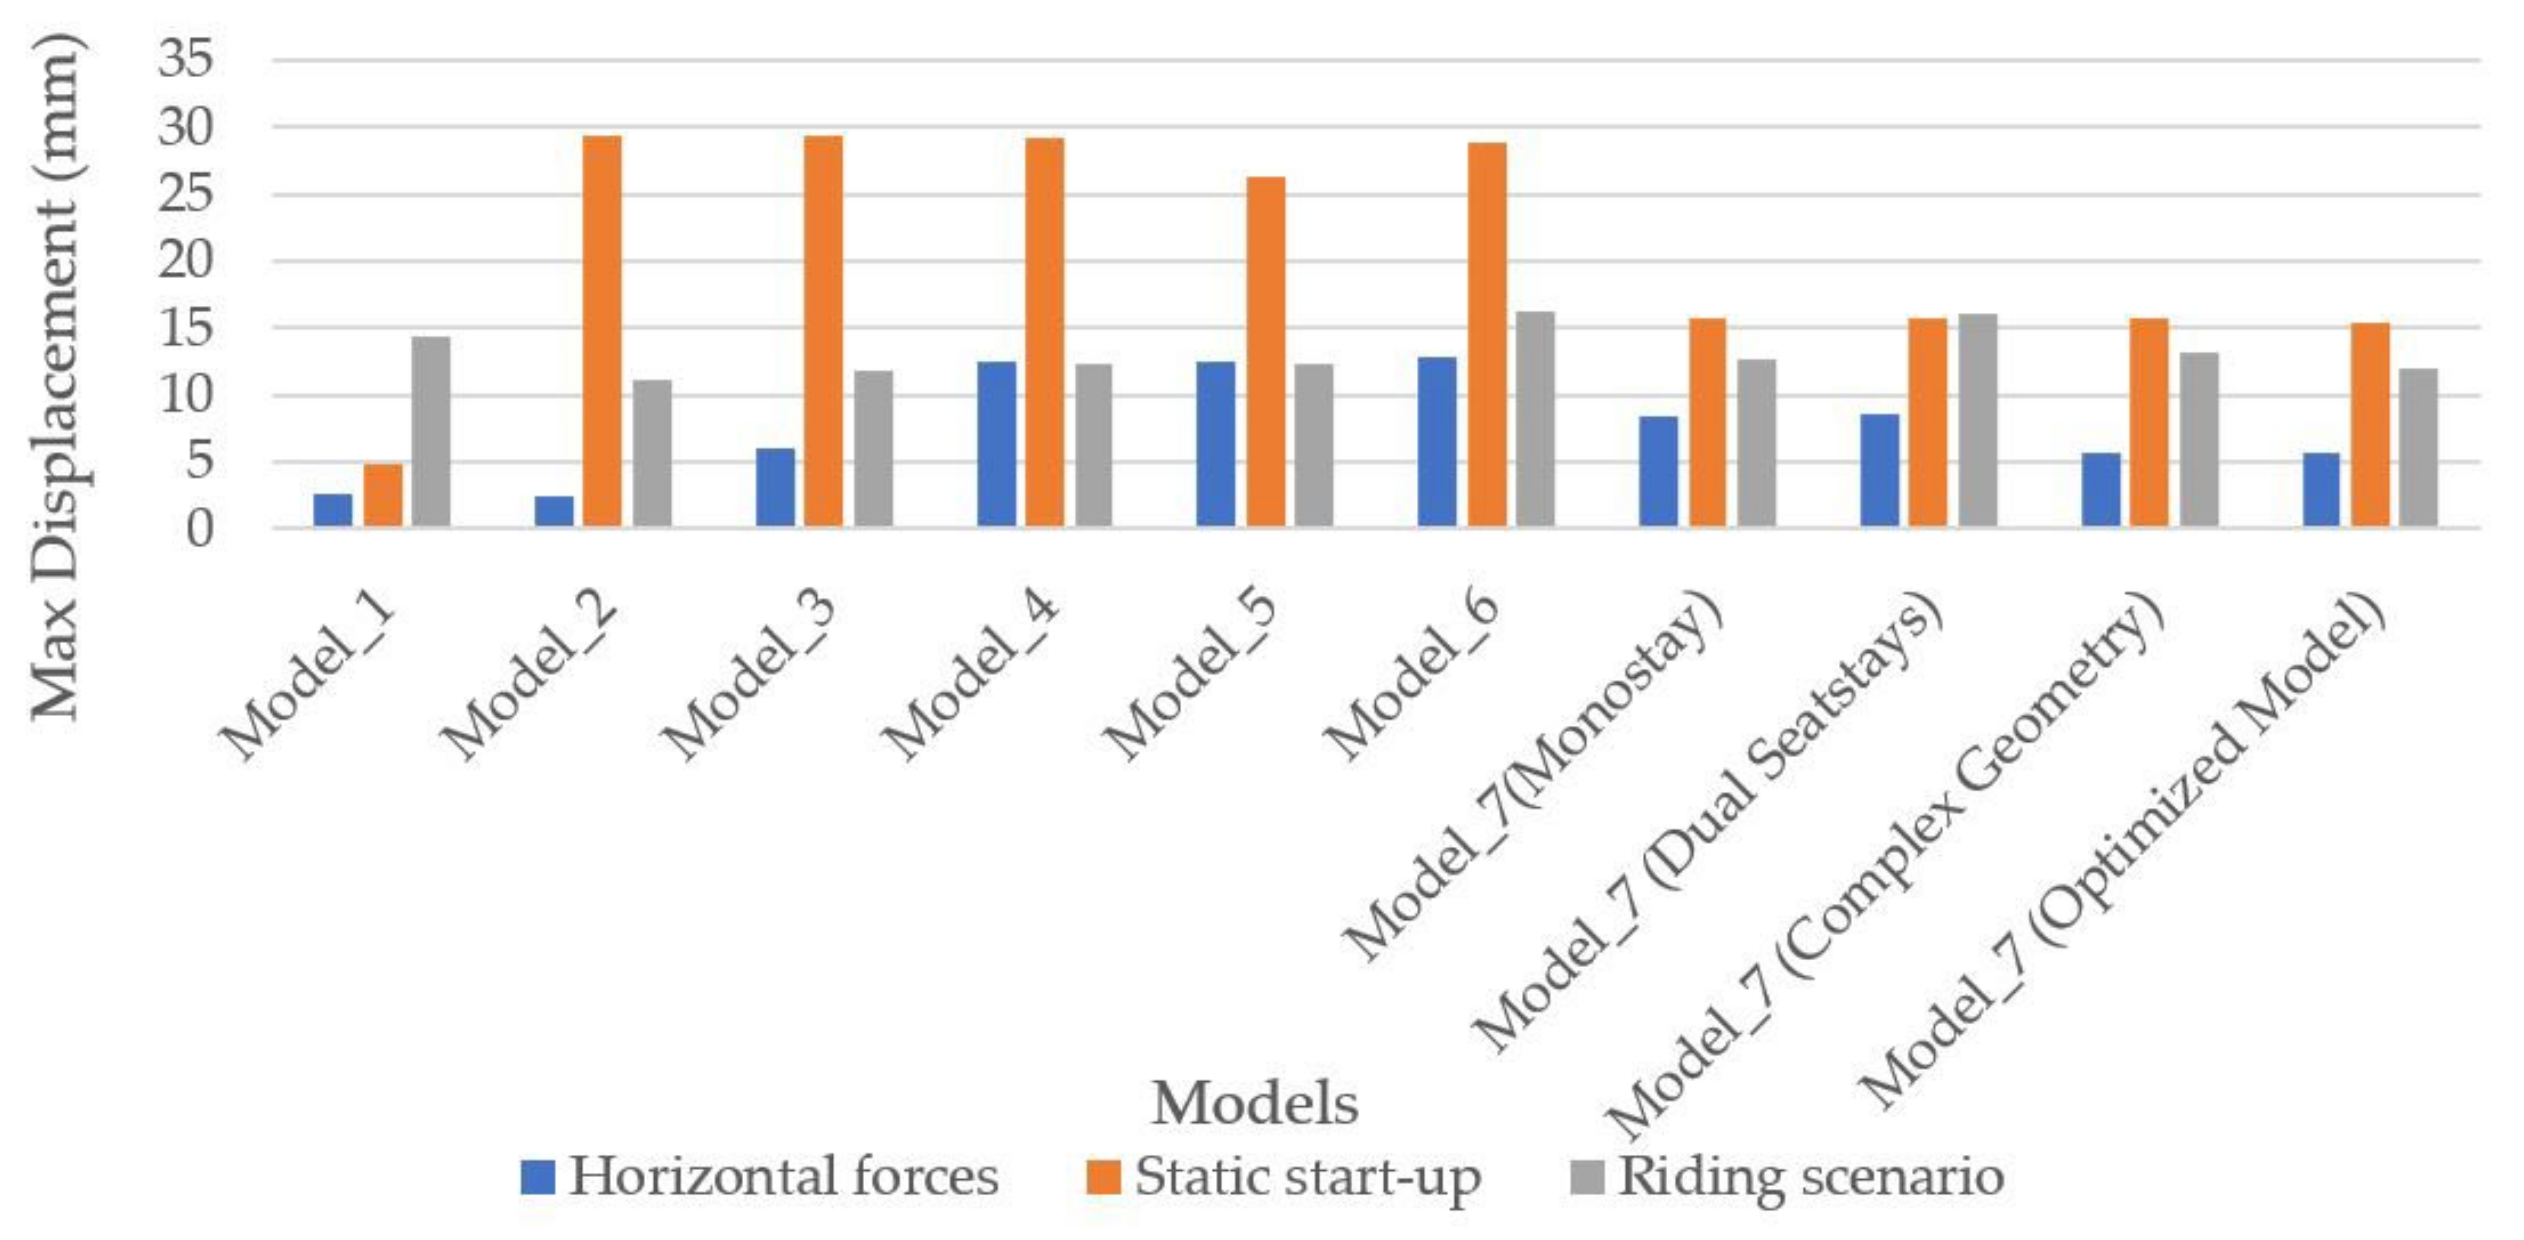
Figure 17.
Maximum displacement per model in horizontal impact, in static start-up, and in riding scenarios.
Figure 17.
Maximum displacement per model in horizontal impact, in static start-up, and in riding scenarios.
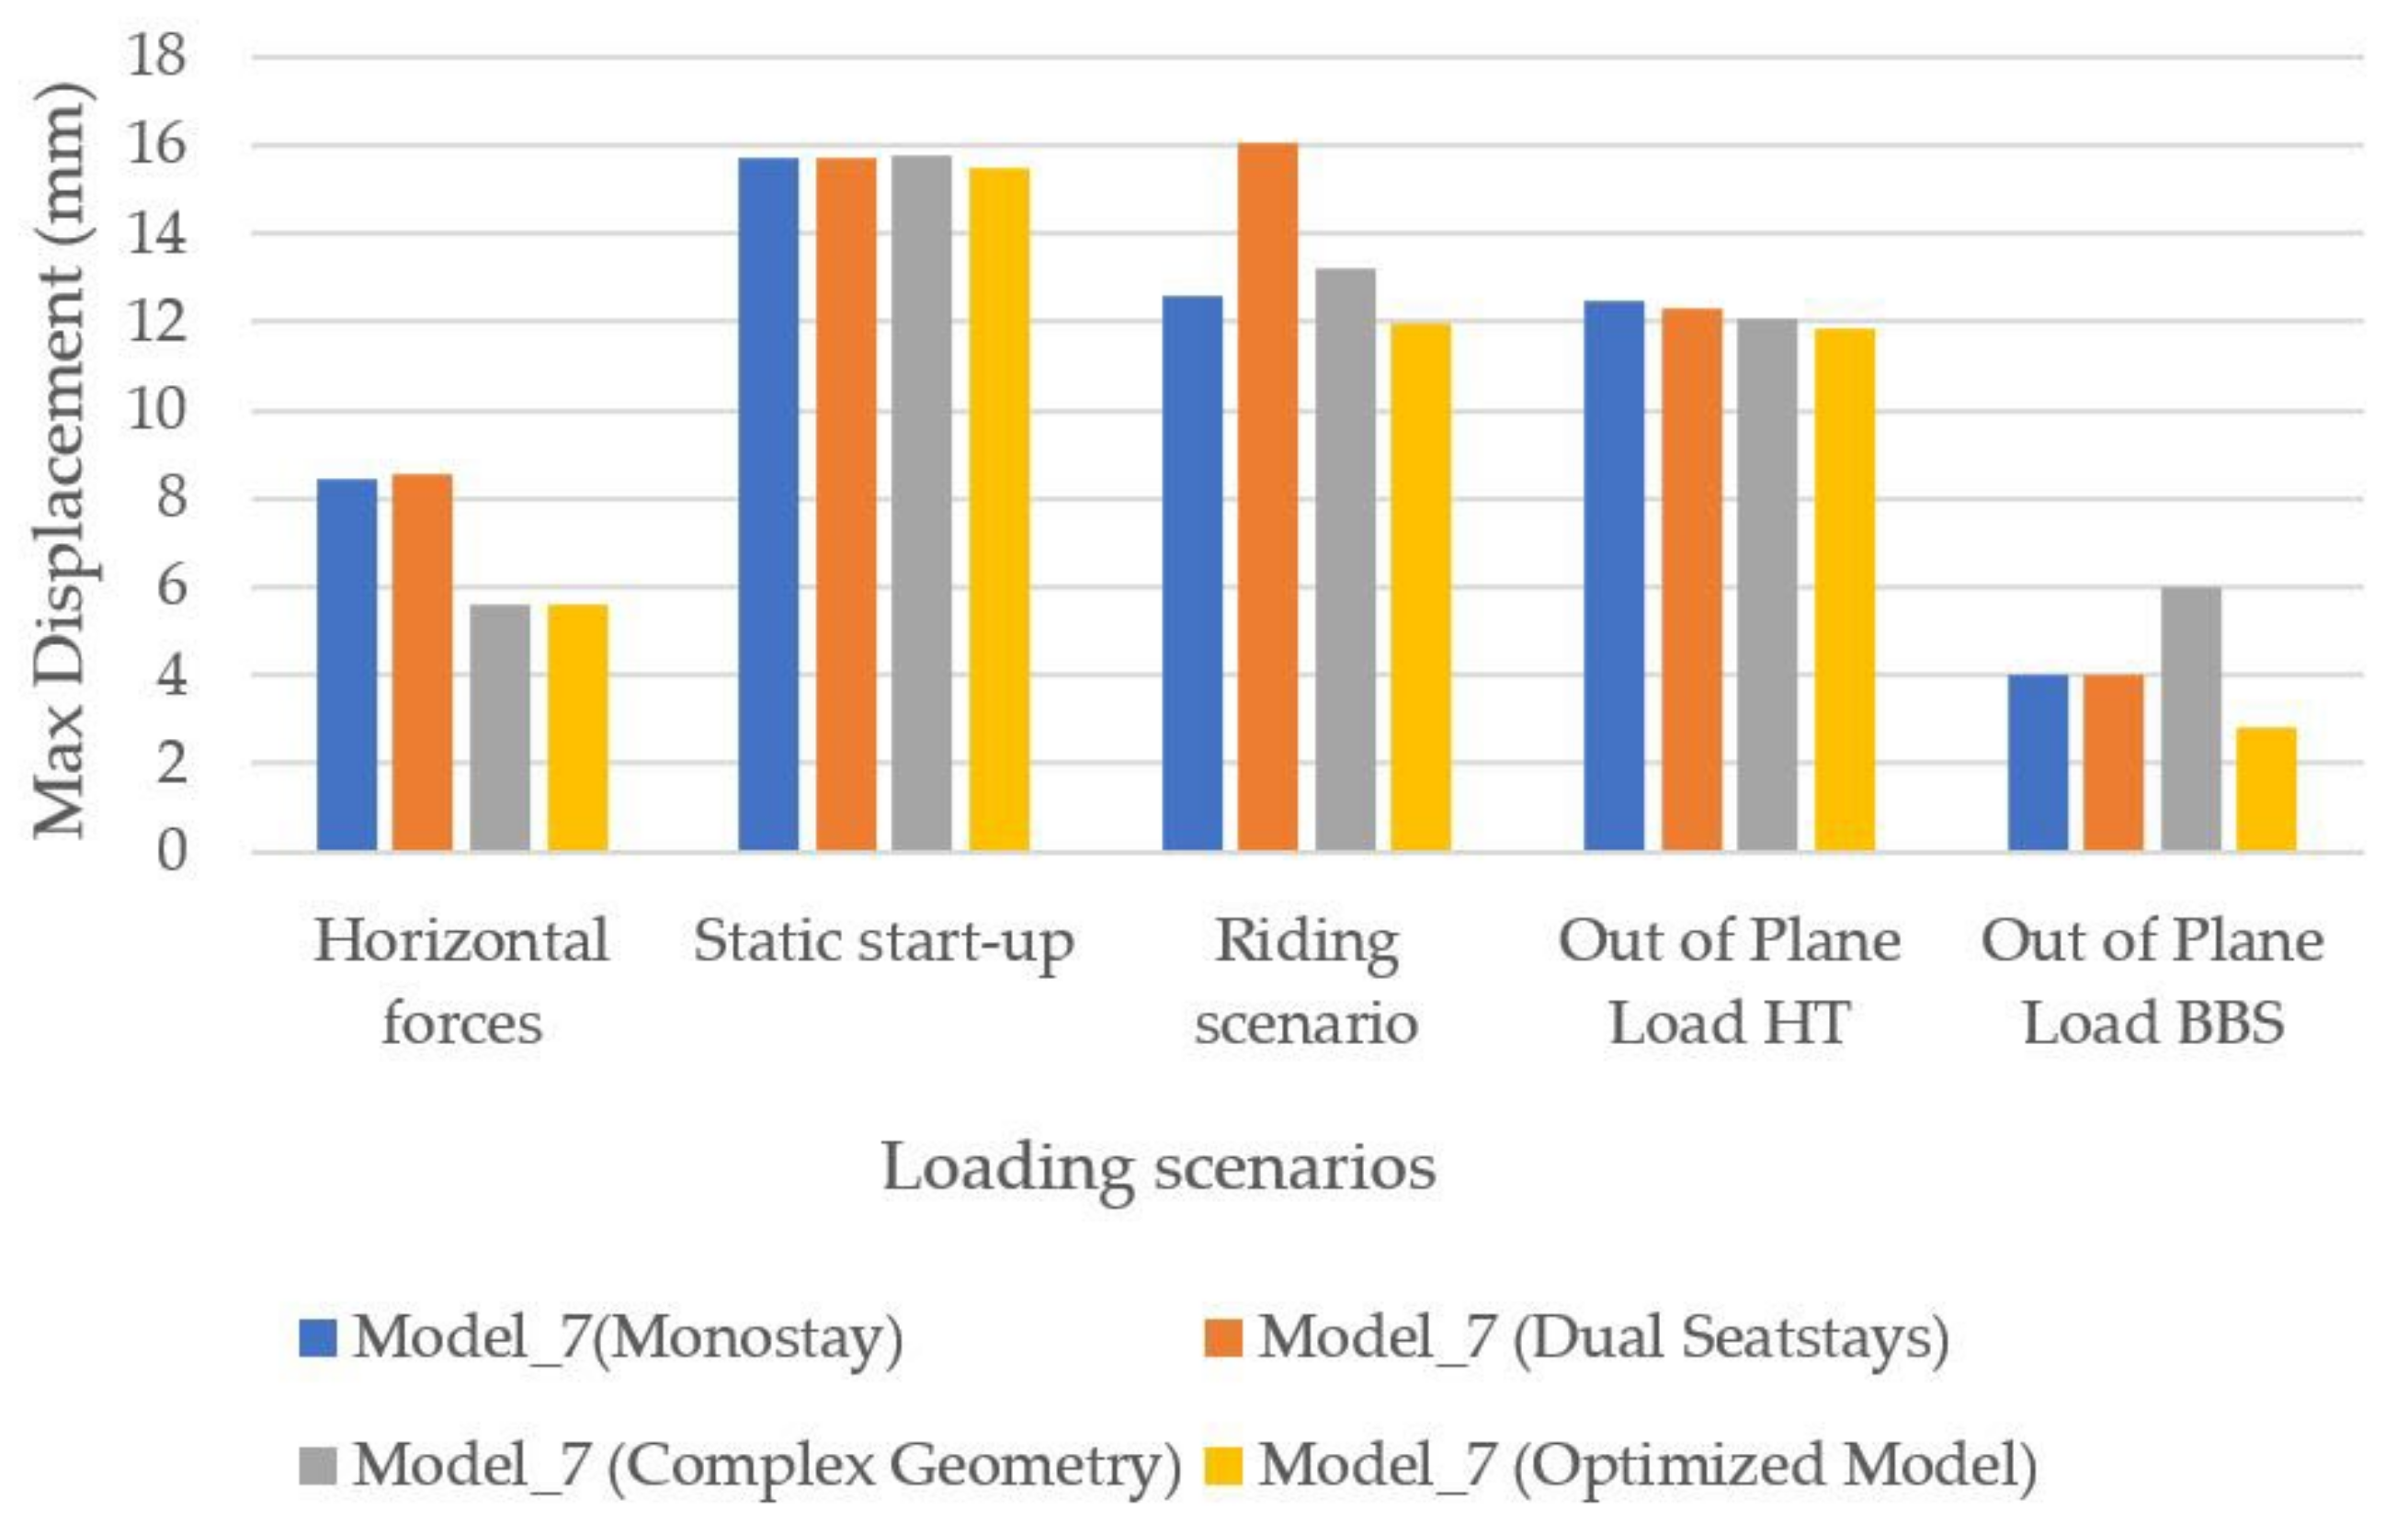
Figure 18.
Maximum displacement per model in horizontal impact, static startup, riding, out-of-plane load in the headtube, and out-of-plane load in the bottom bracket shell scenarios.
Figure 18.
Maximum displacement per model in horizontal impact, static startup, riding, out-of-plane load in the headtube, and out-of-plane load in the bottom bracket shell scenarios.
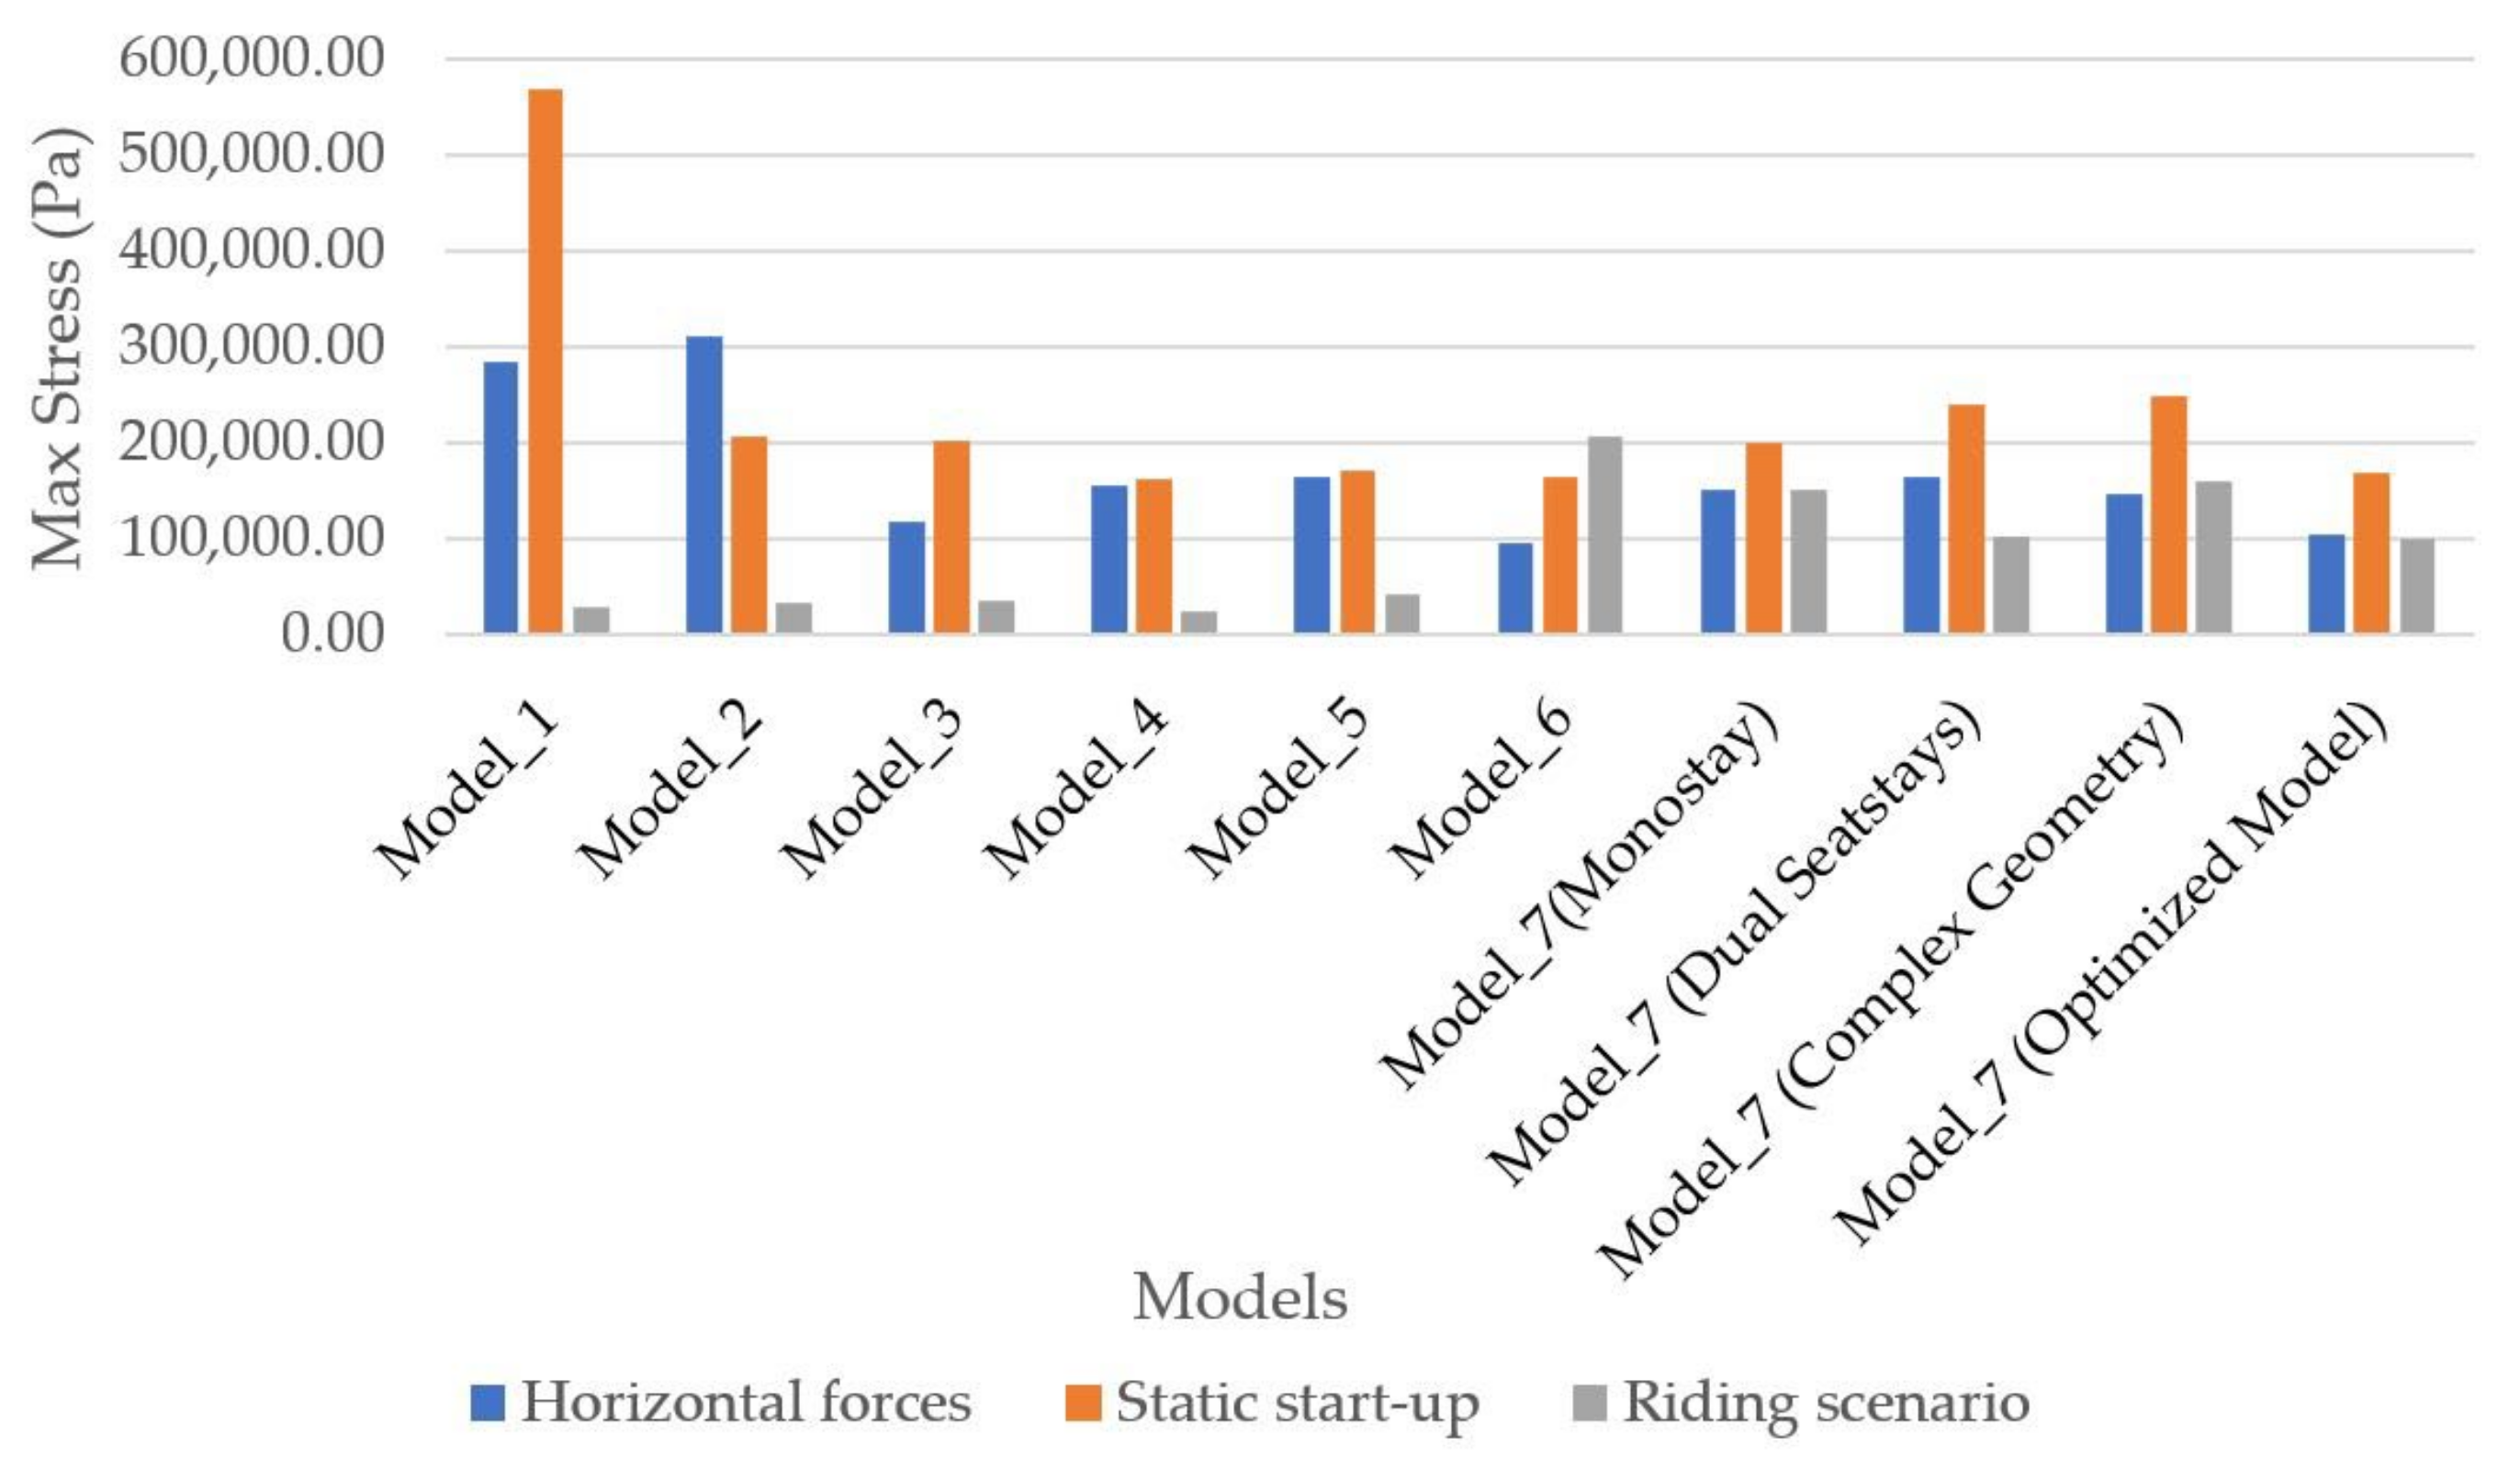
Figure 19.
Maximum stress of horizontal impact, static start-up, and riding scenarios per model.
Figure 19.
Maximum stress of horizontal impact, static start-up, and riding scenarios per model.
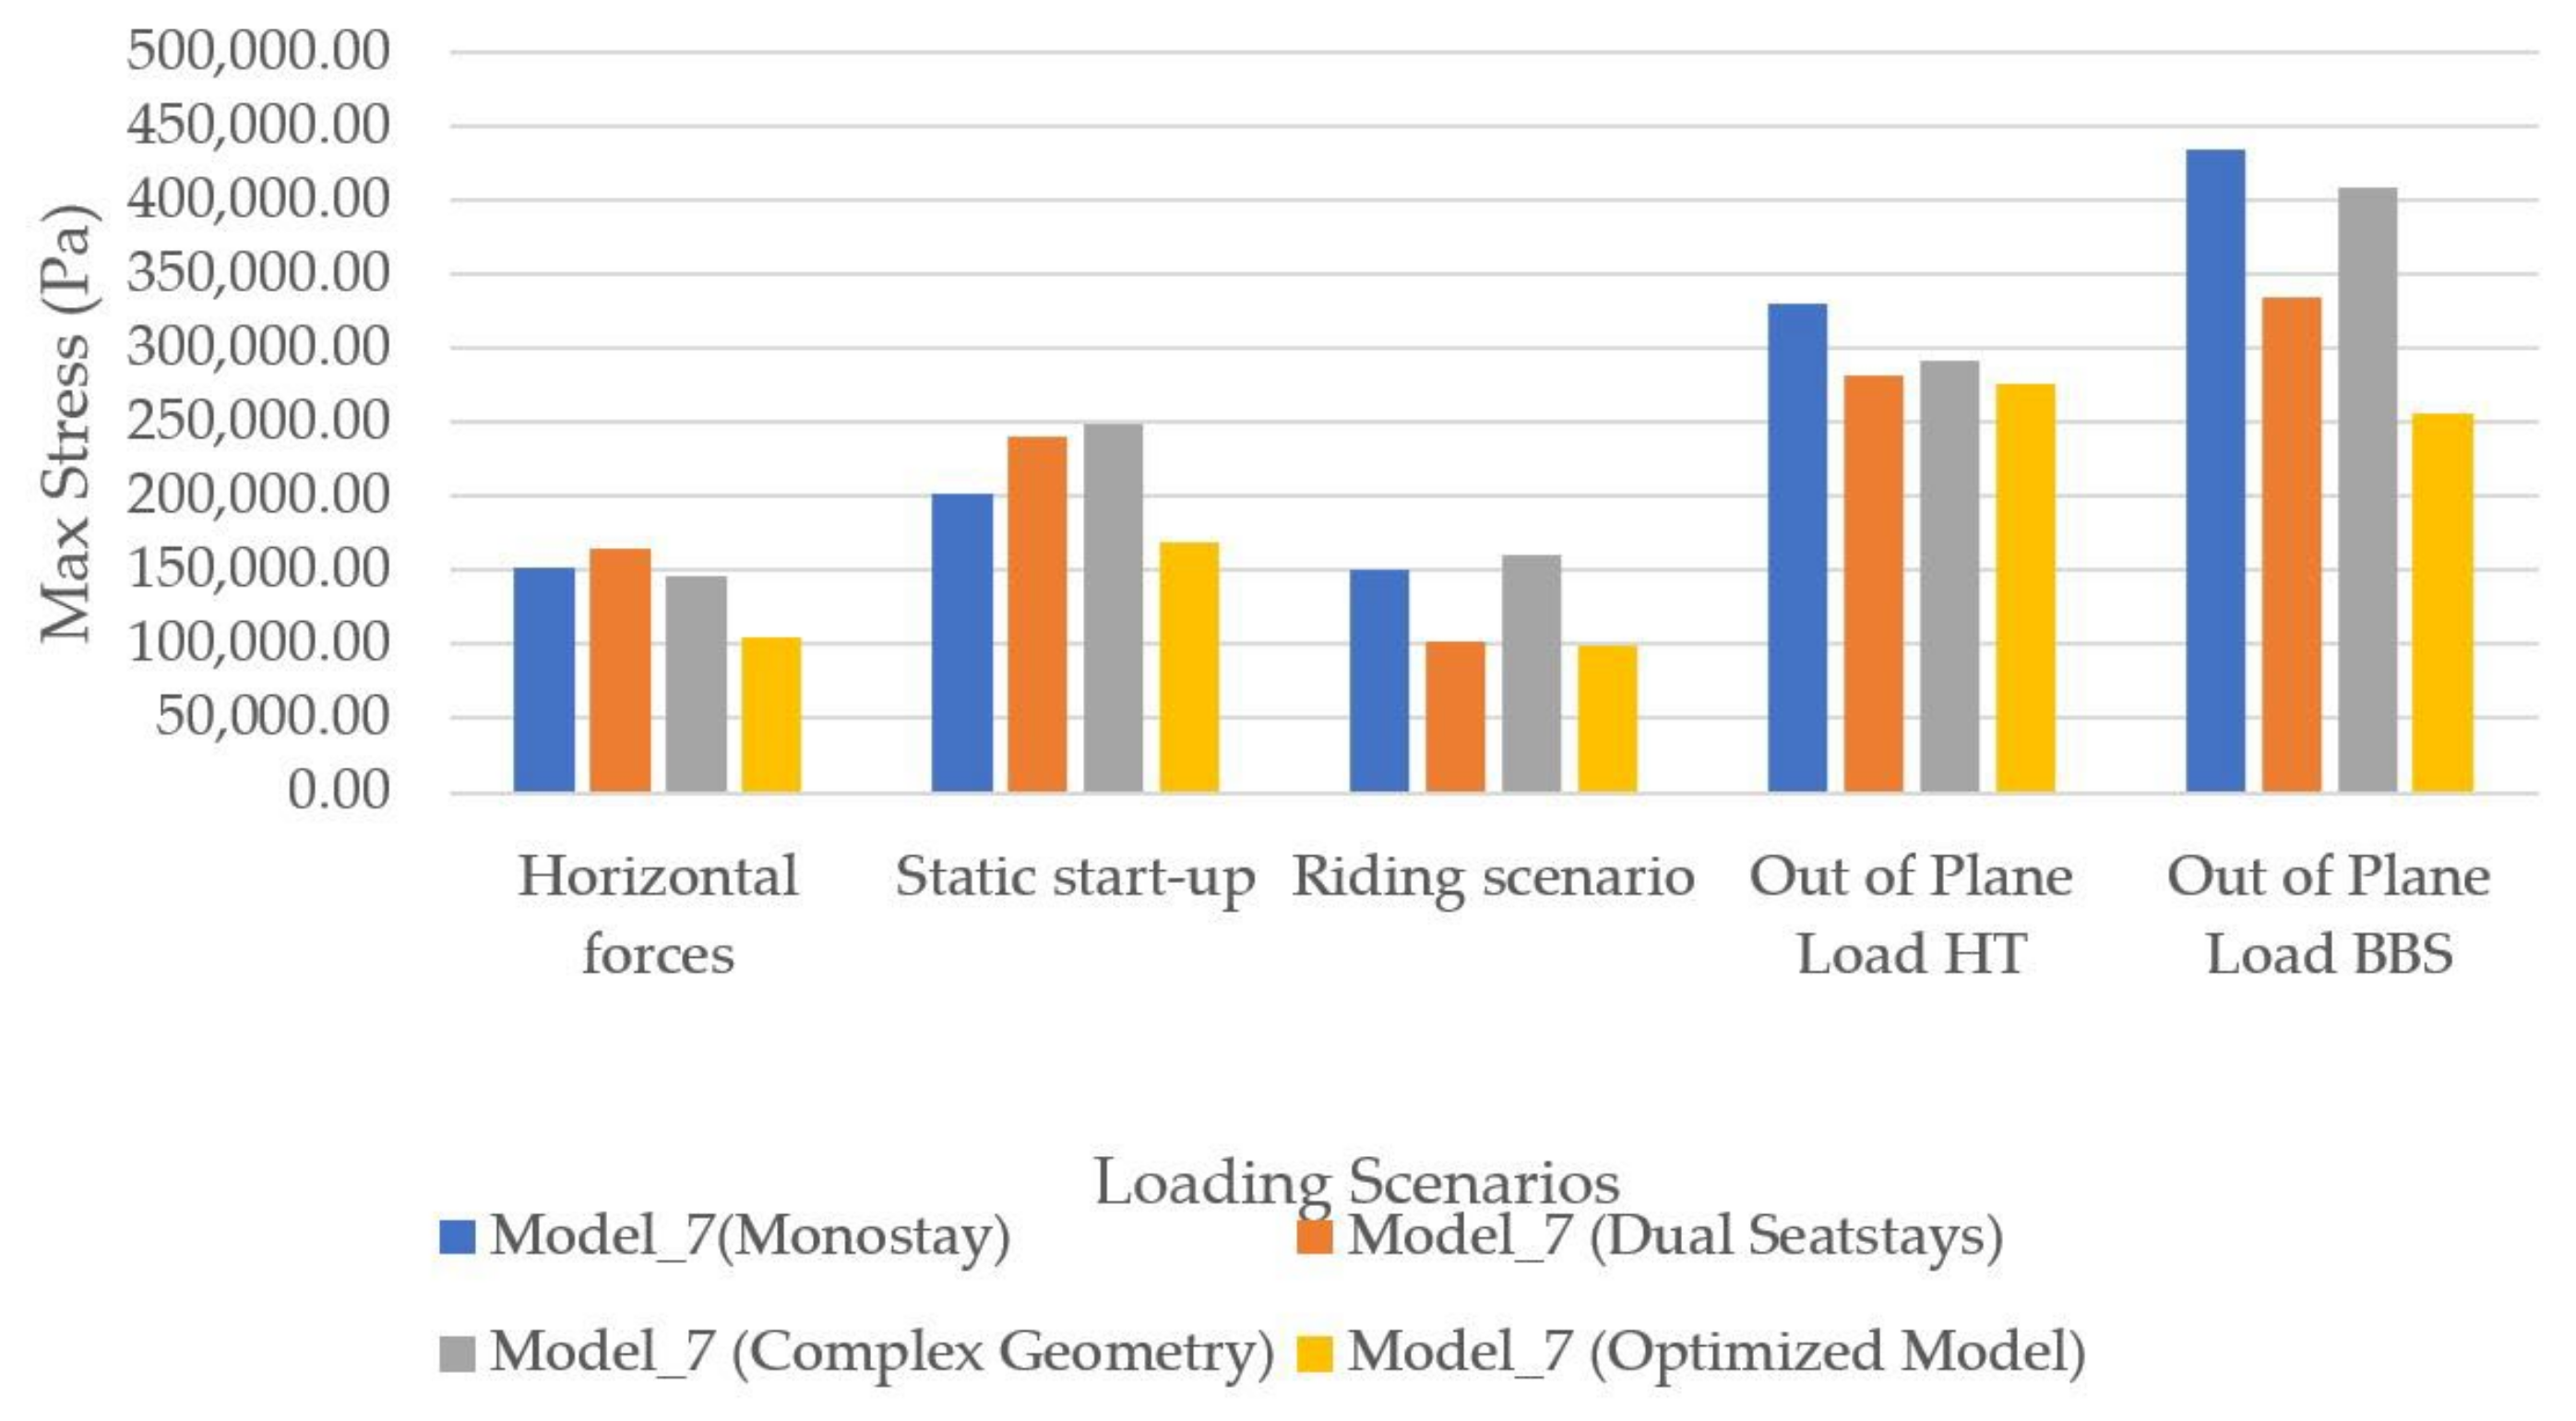
Figure 20.
Maximum stress per model in horizontal forces, static start-up, riding, out-of-plane load in the headtube, and out-of-plane load in the bottom bracket shell scenarios.
Figure 20.
Maximum stress per model in horizontal forces, static start-up, riding, out-of-plane load in the headtube, and out-of-plane load in the bottom bracket shell scenarios.
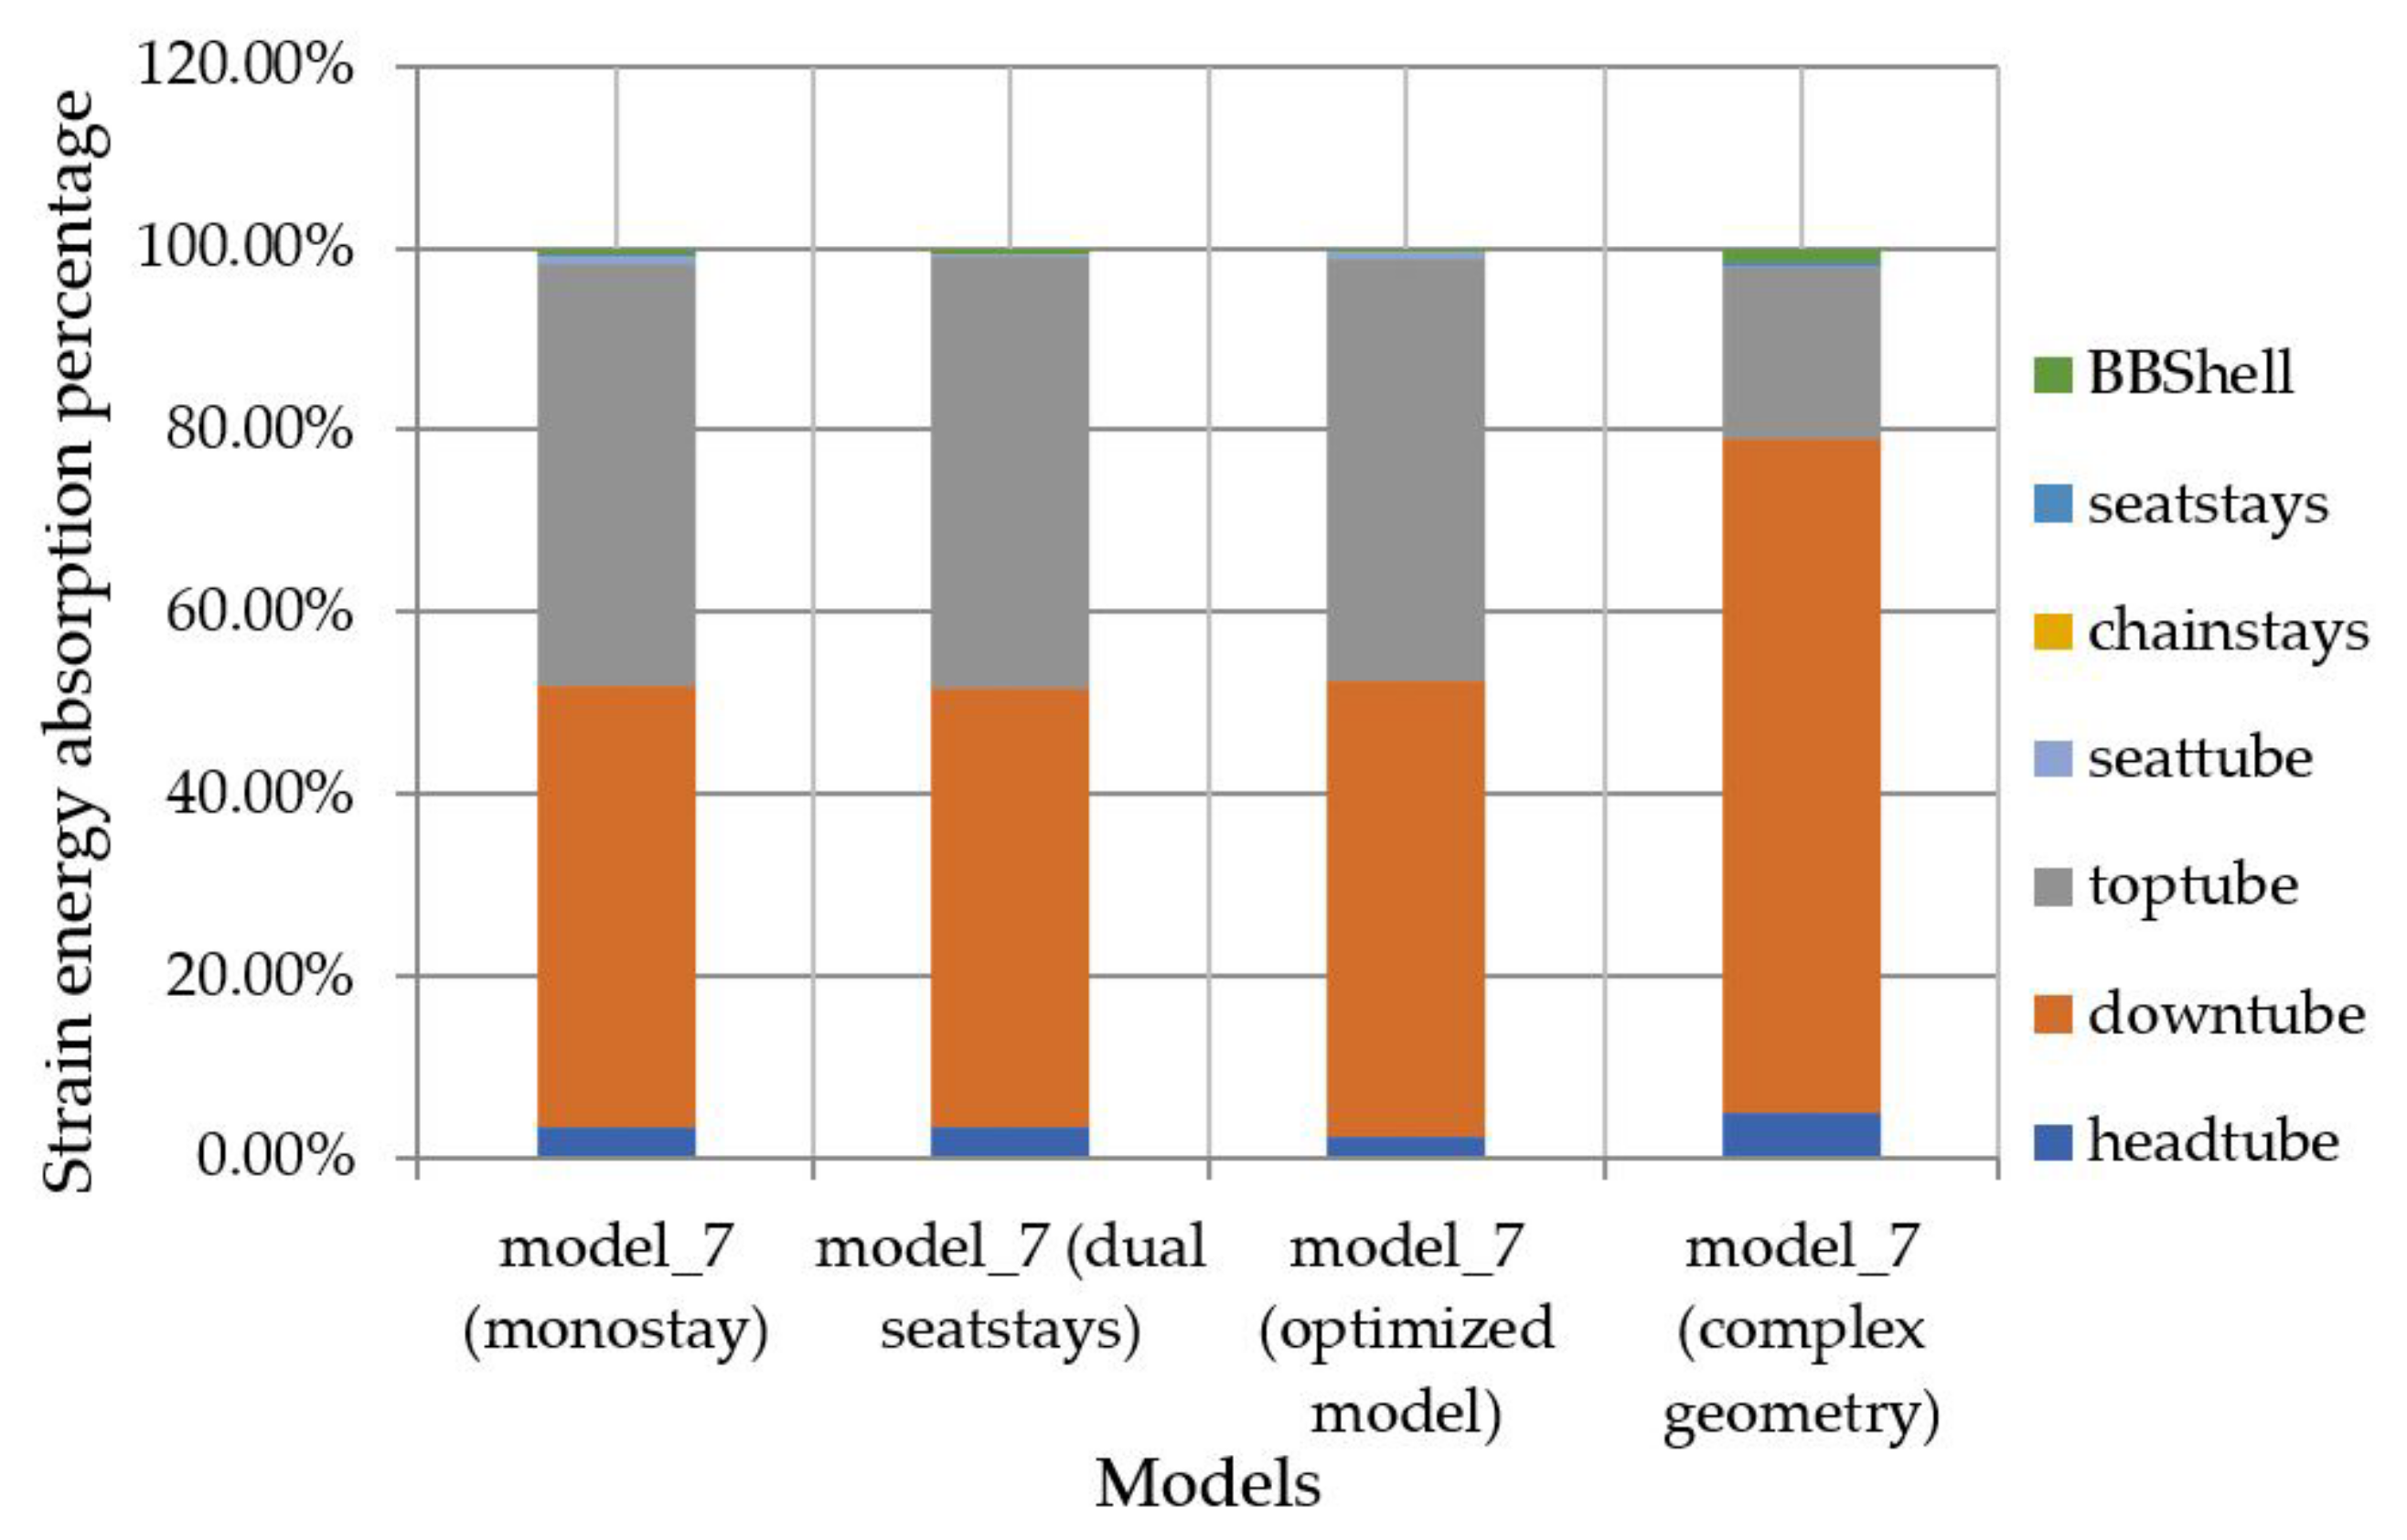
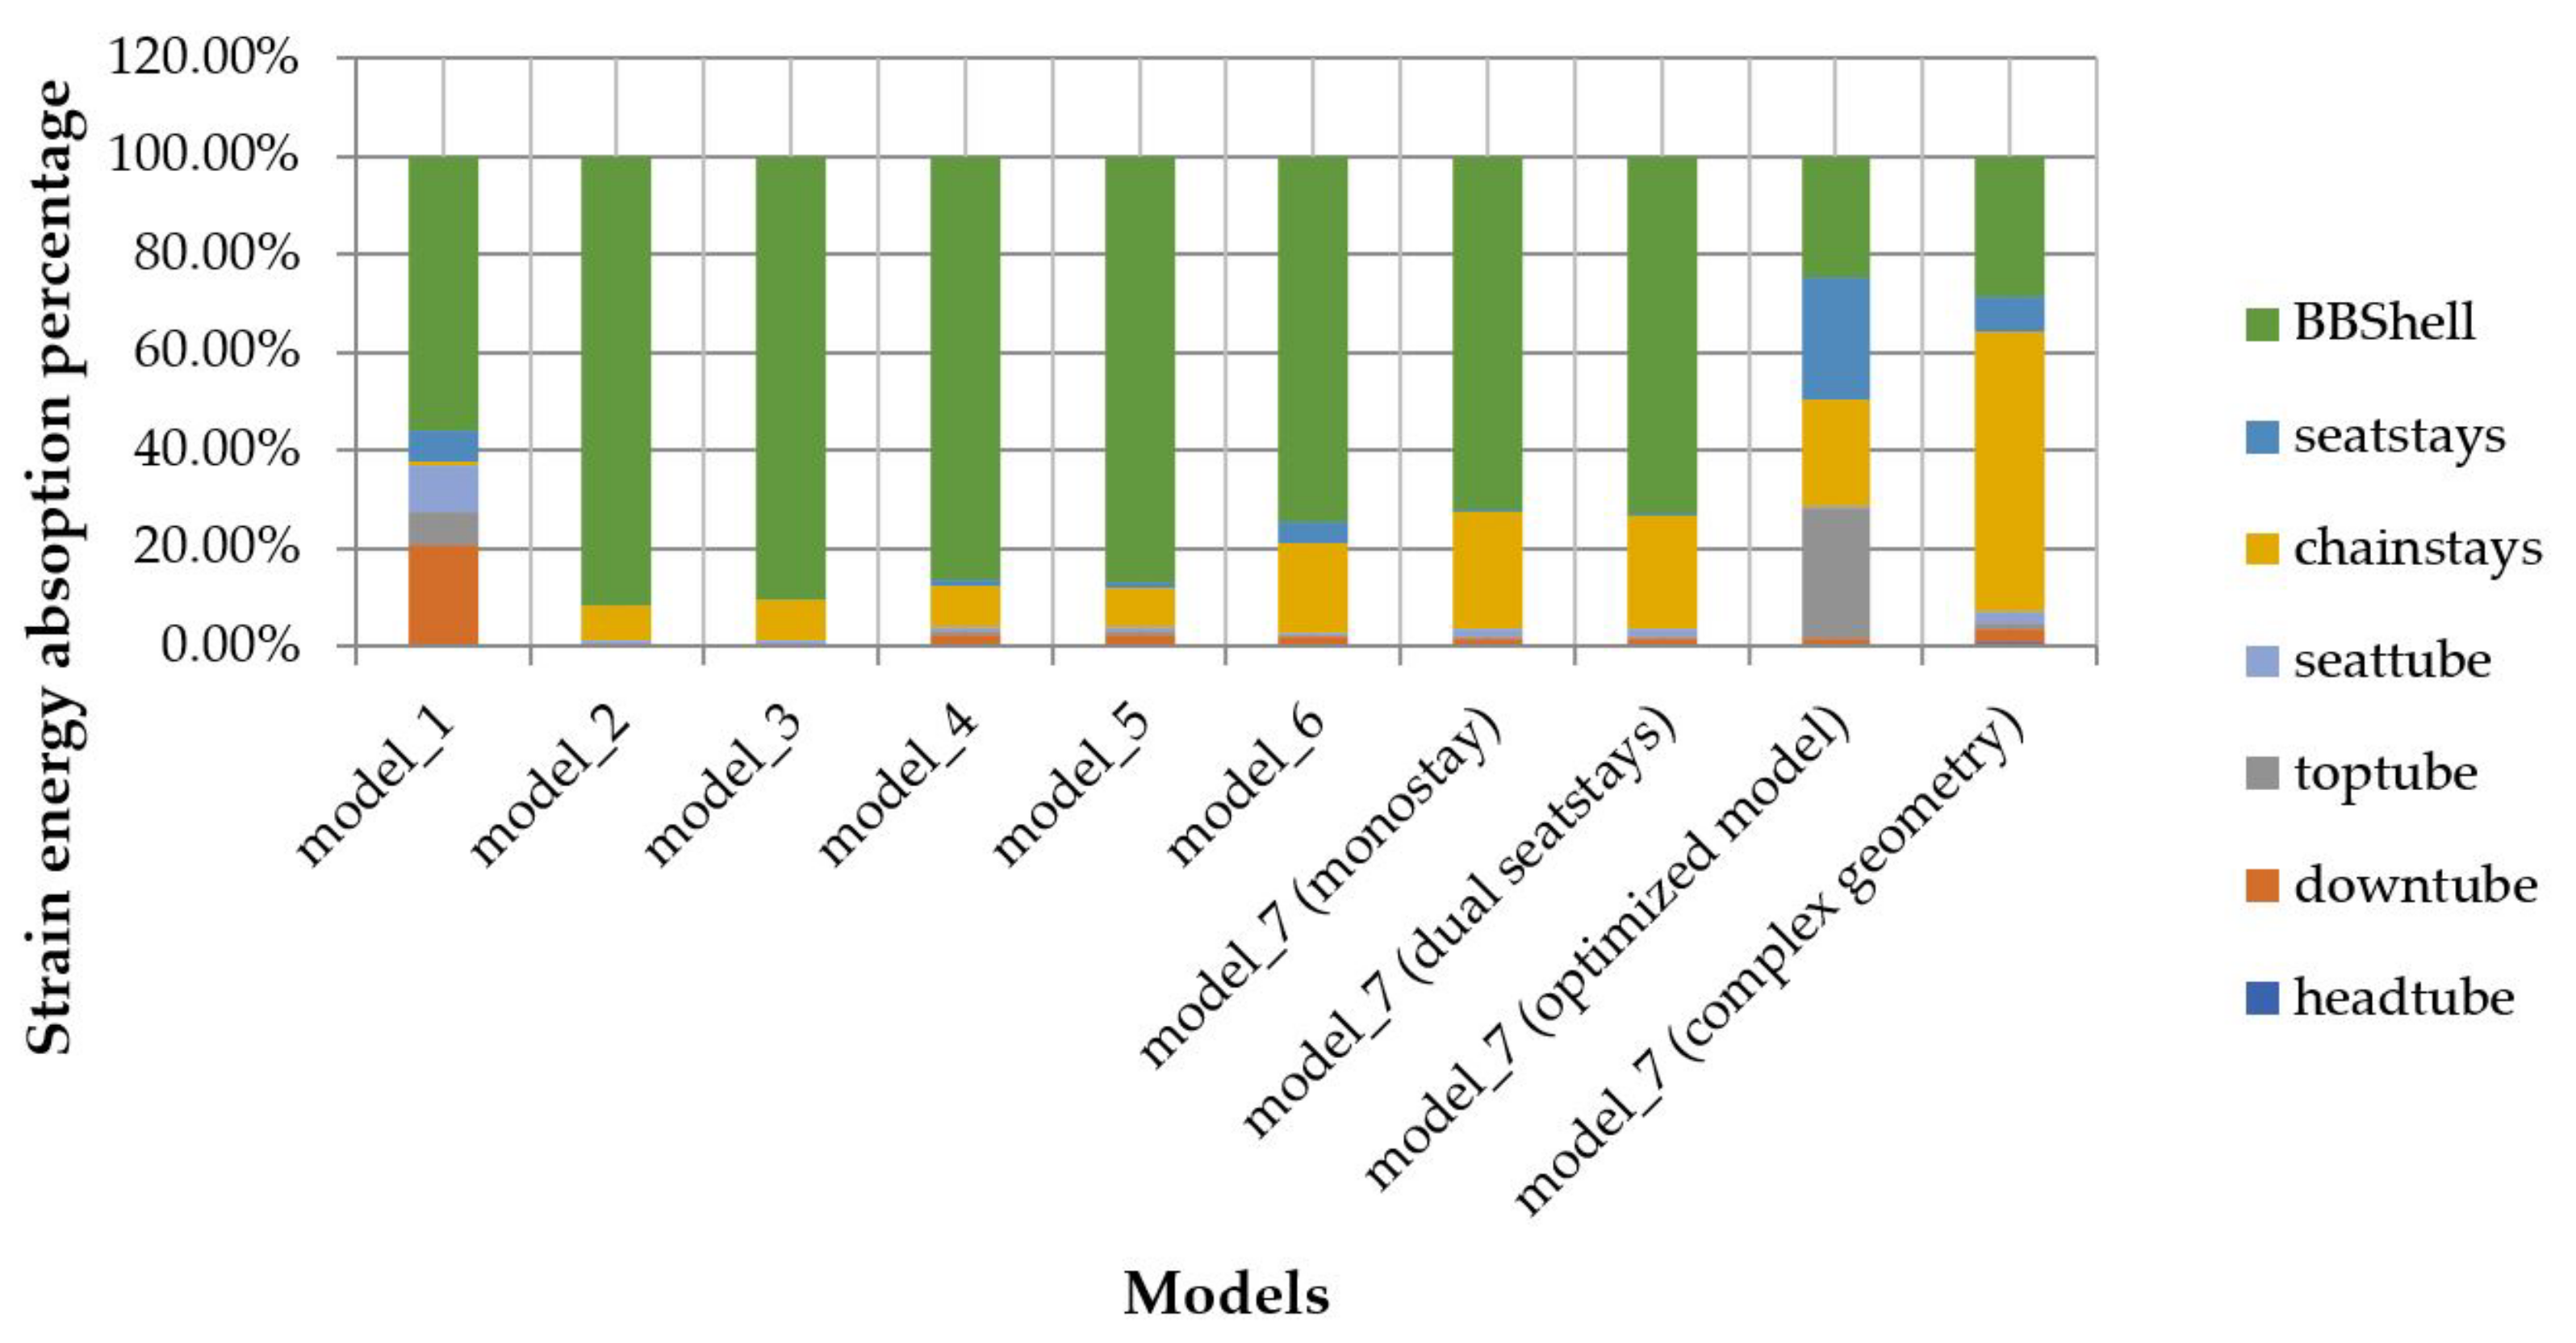
Figure 21.
Absorption of strain energy and its distribution in out-of-plane loads on head tube scenario.
Figure 21.
Absorption of strain energy and its distribution in out-of-plane loads on head tube scenario.
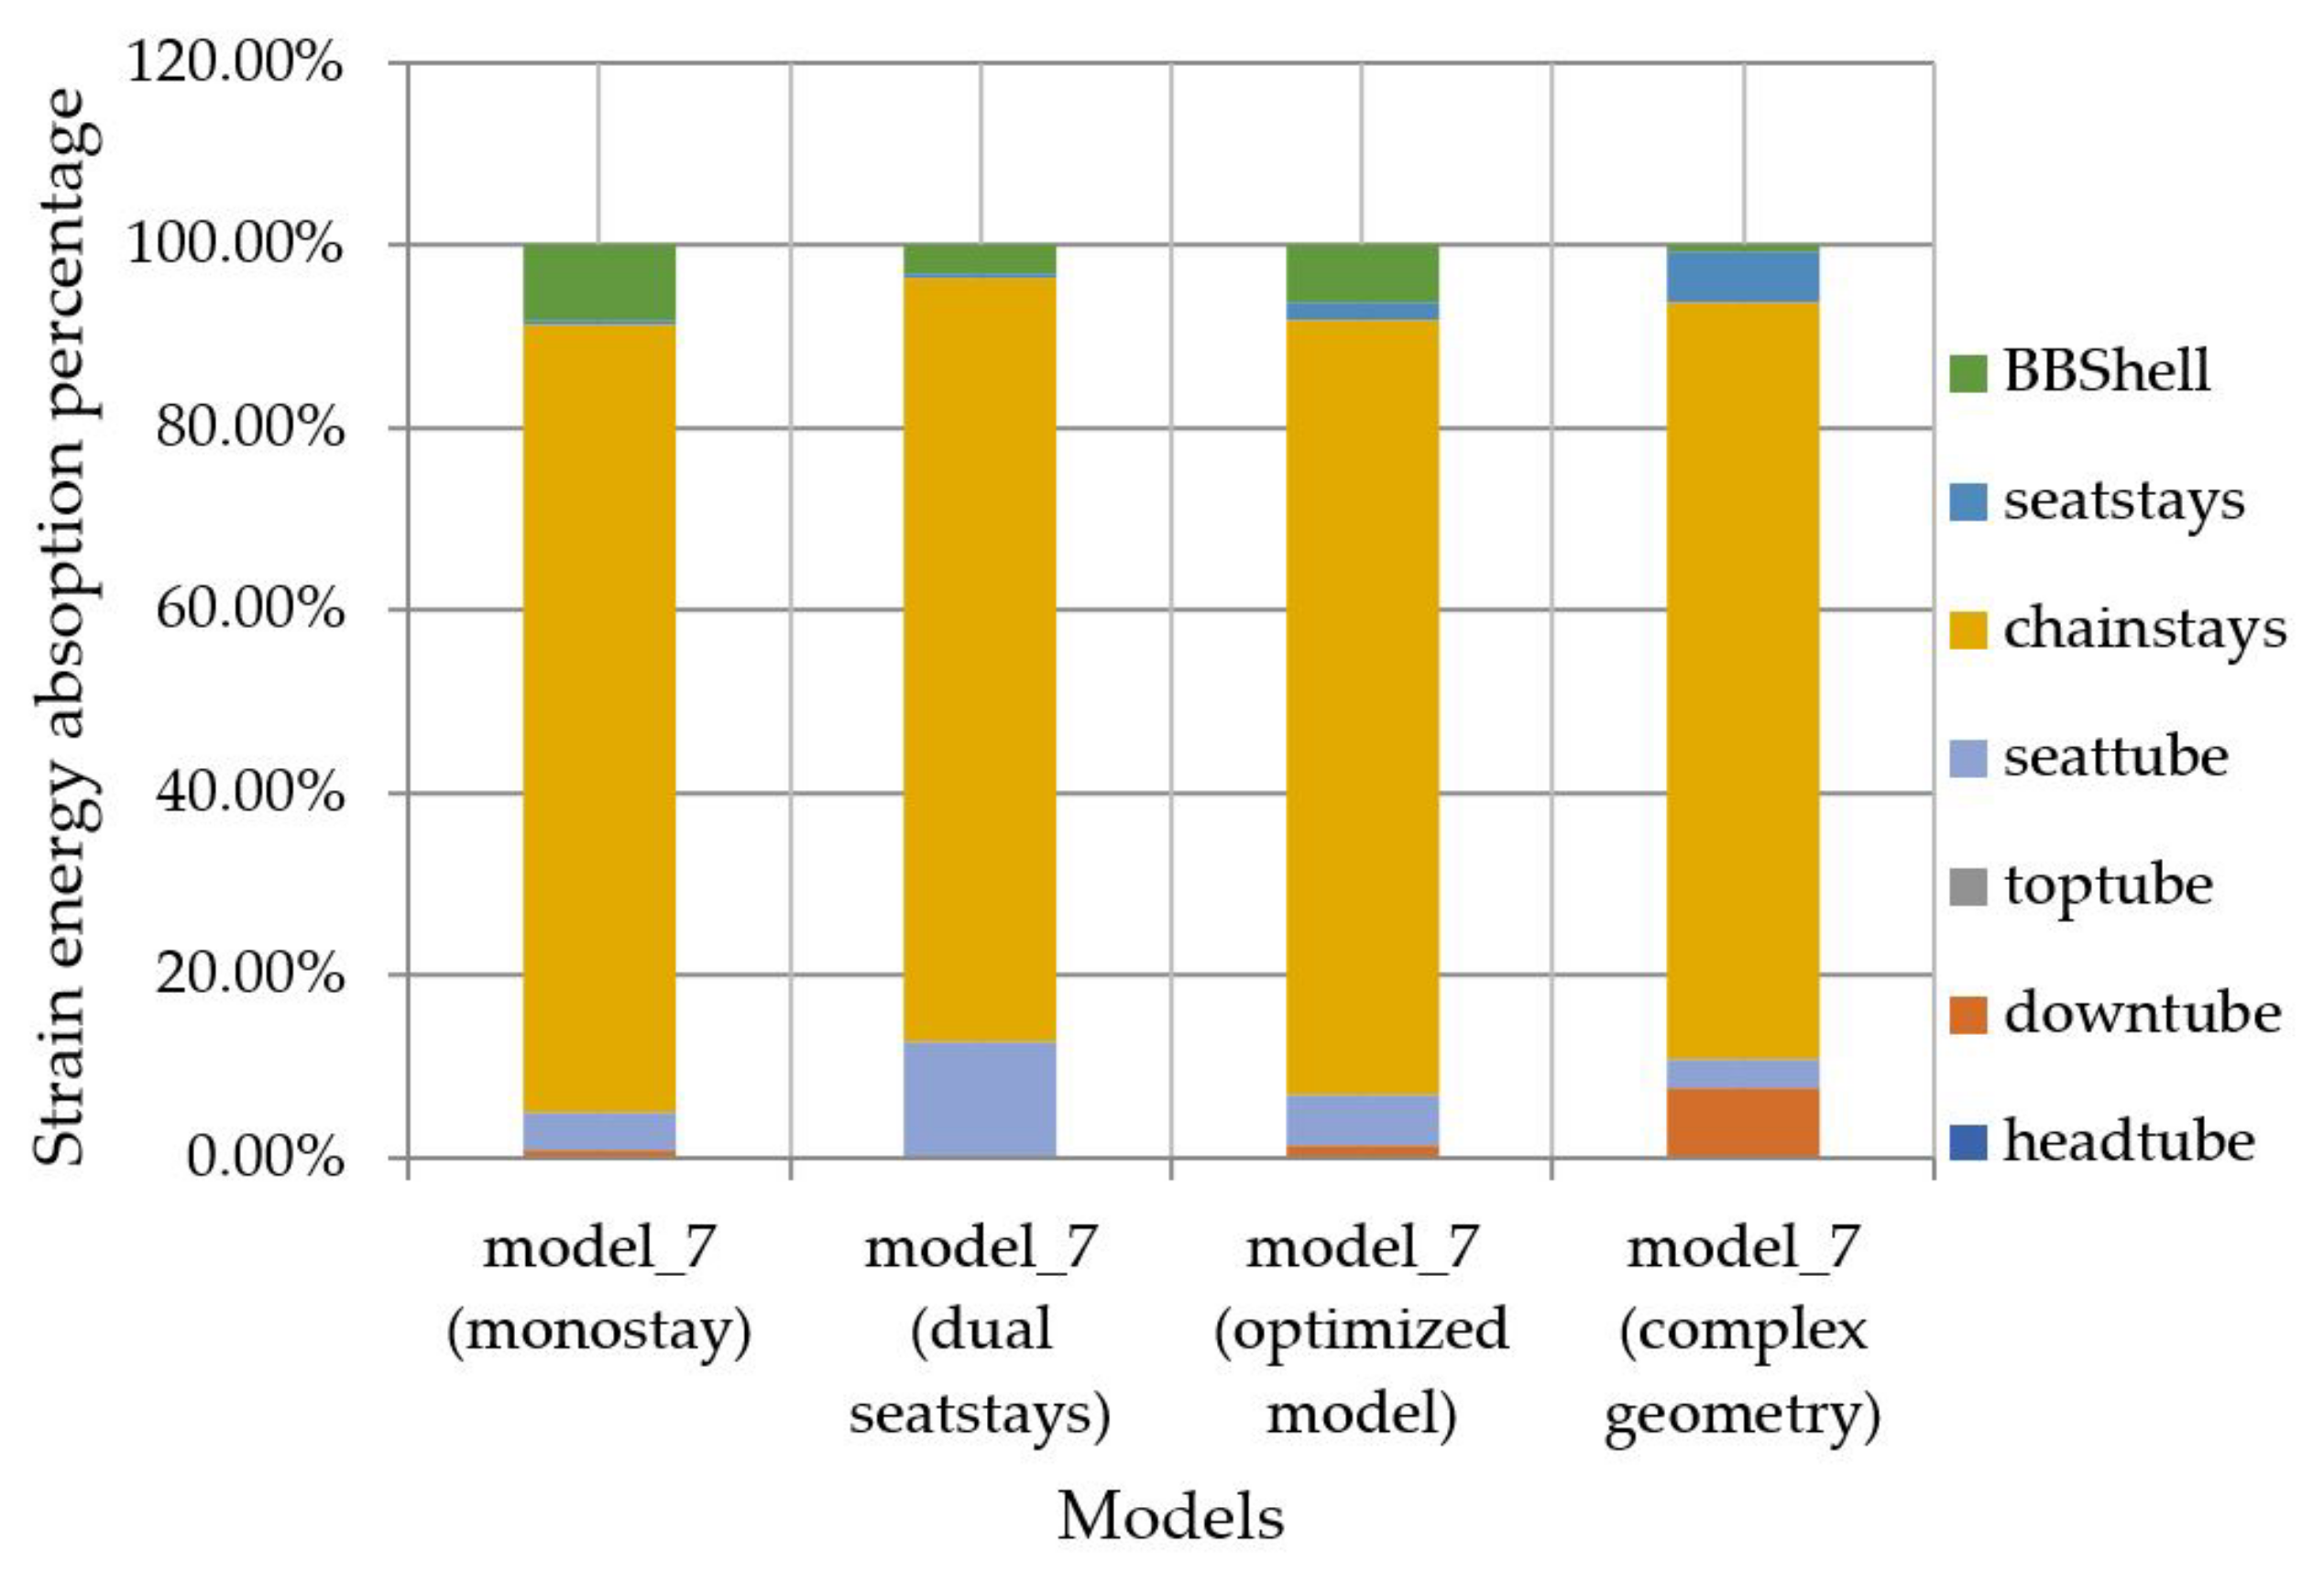
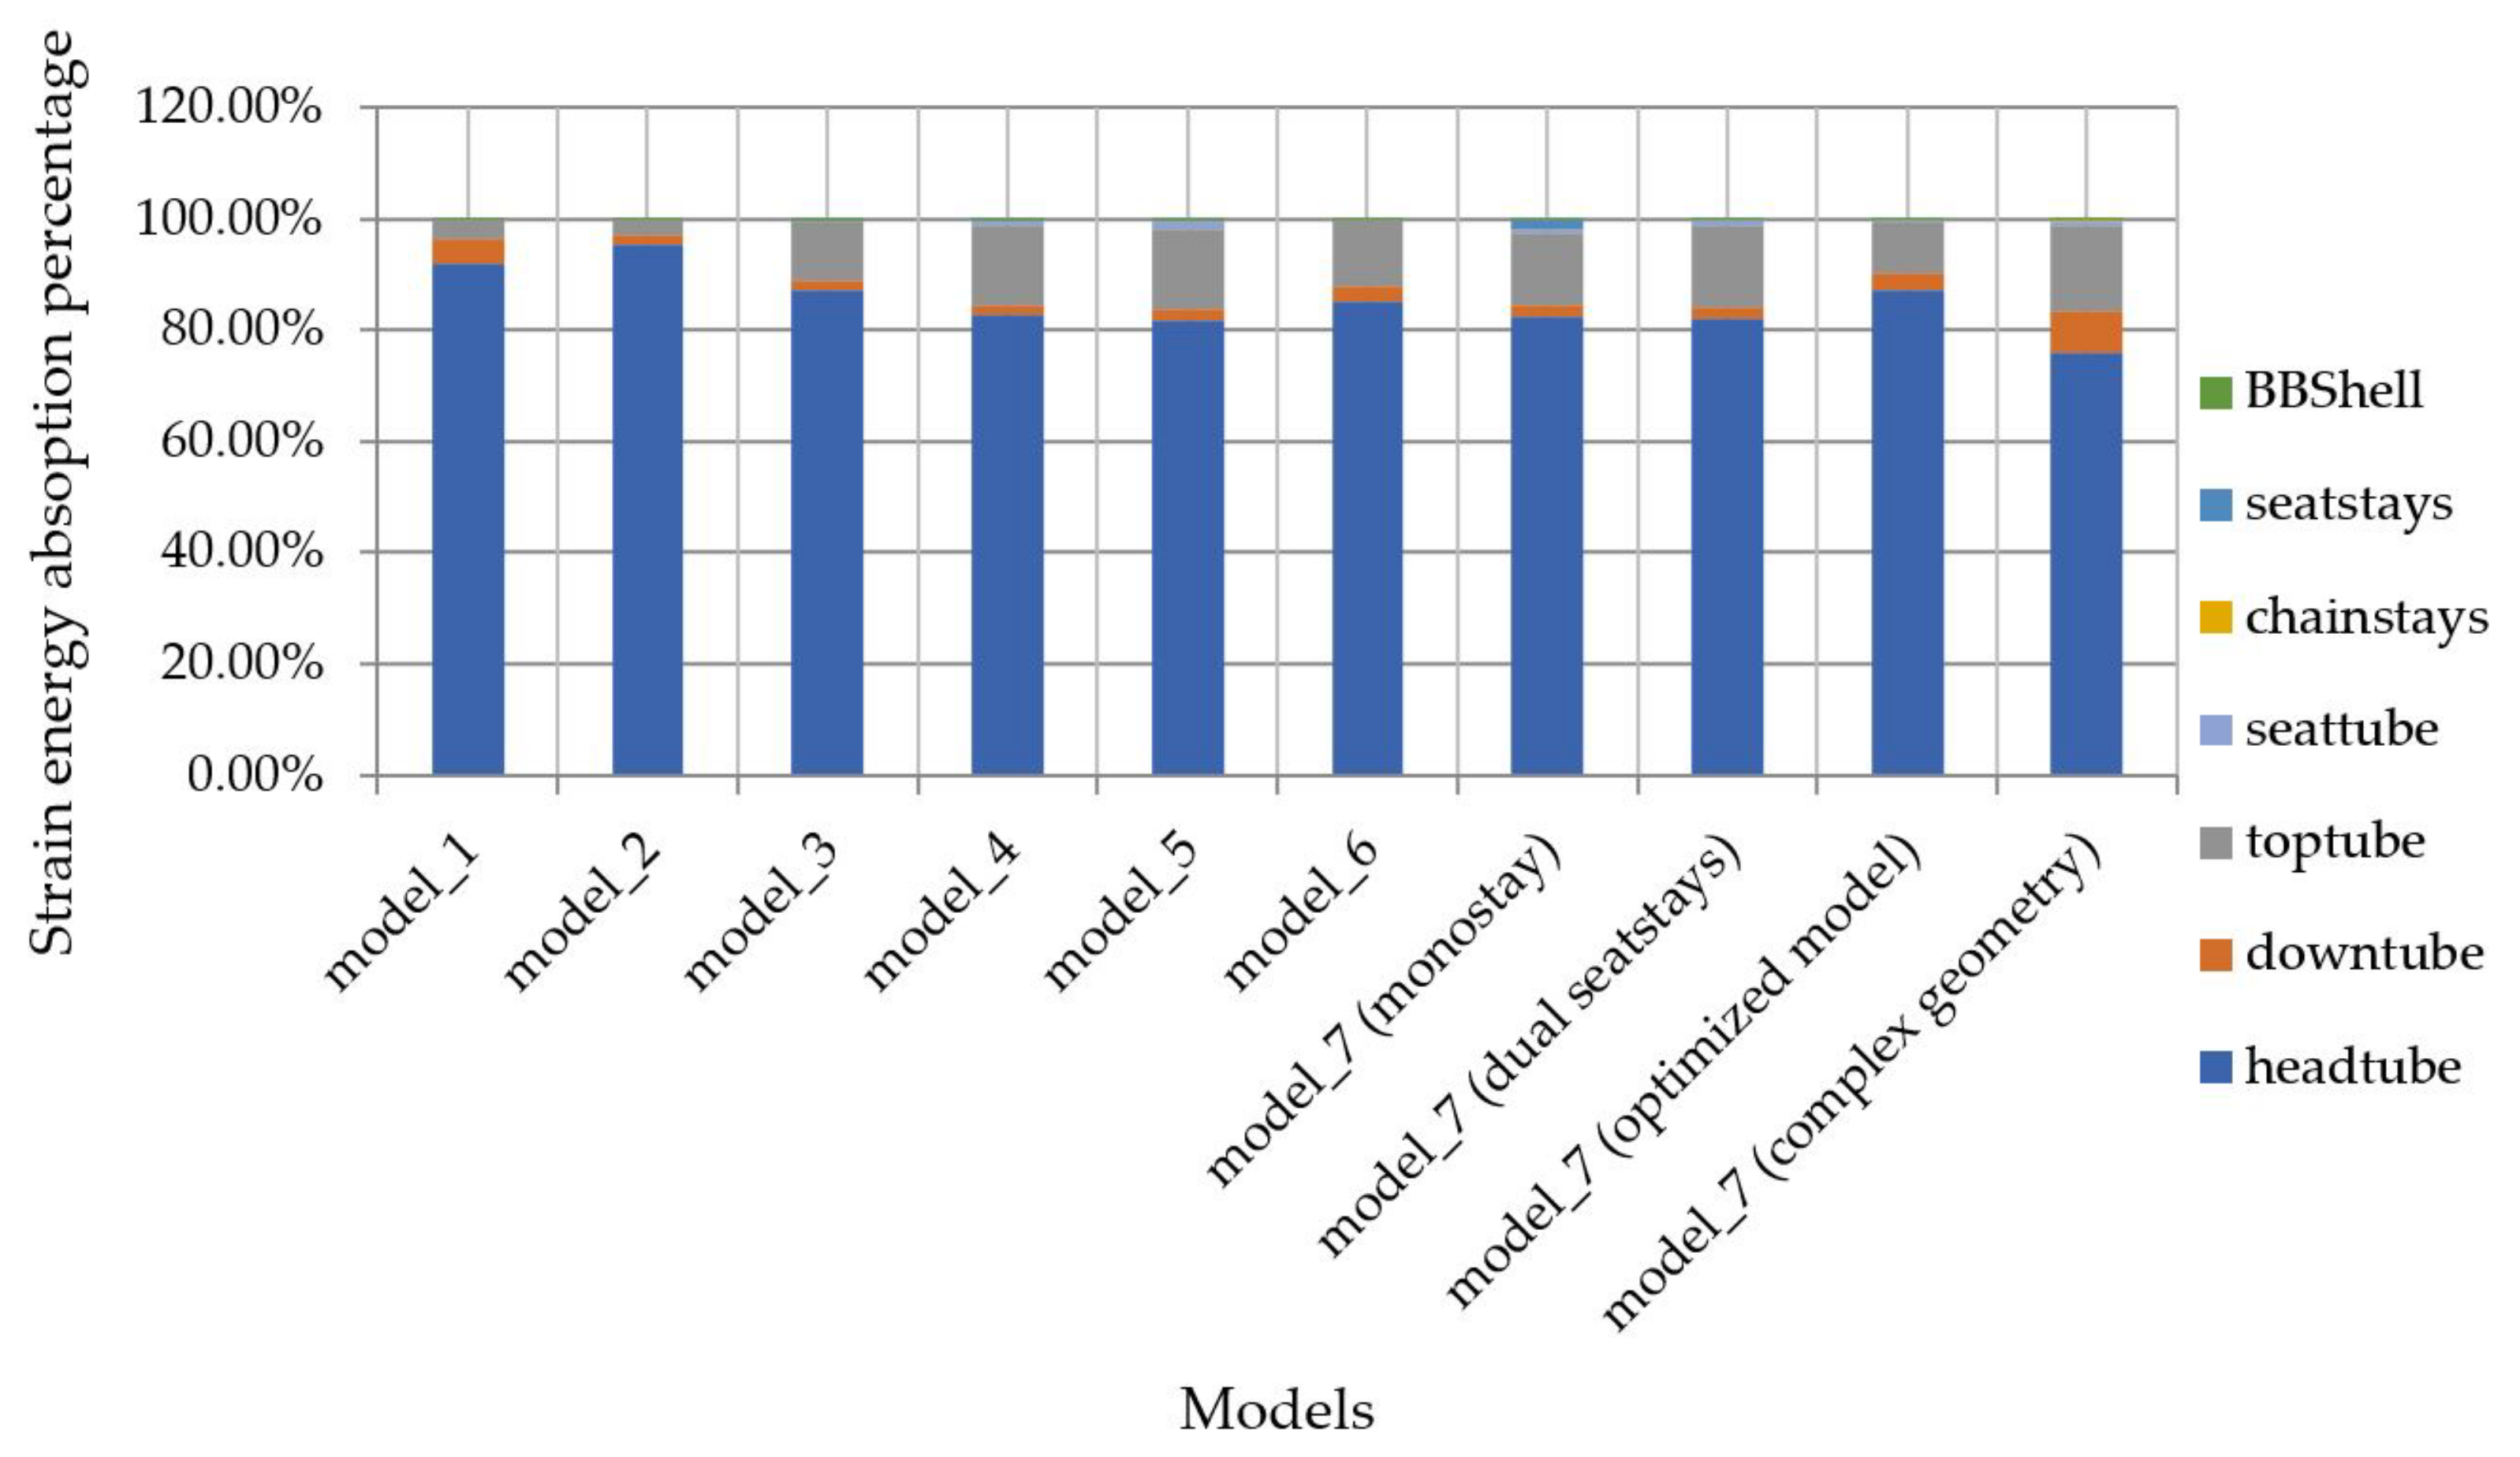
Figure 22.
Absorption of strain energy and its distribution in out-of-plane loads on bottom bracket shell scenario.
Figure 22.
Absorption of strain energy and its distribution in out-of-plane loads on bottom bracket shell scenario.
Figure 23.
Absorption of strain energy and its distribution in a static start-up scenario.
Figure 23.
Absorption of strain energy and its distribution in a static start-up scenario.
Figure 24.
Absorption of strain energy and its distribution in a horizontal forces scenario.
Figure 24.
Absorption of strain energy and its distribution in a horizontal forces scenario.
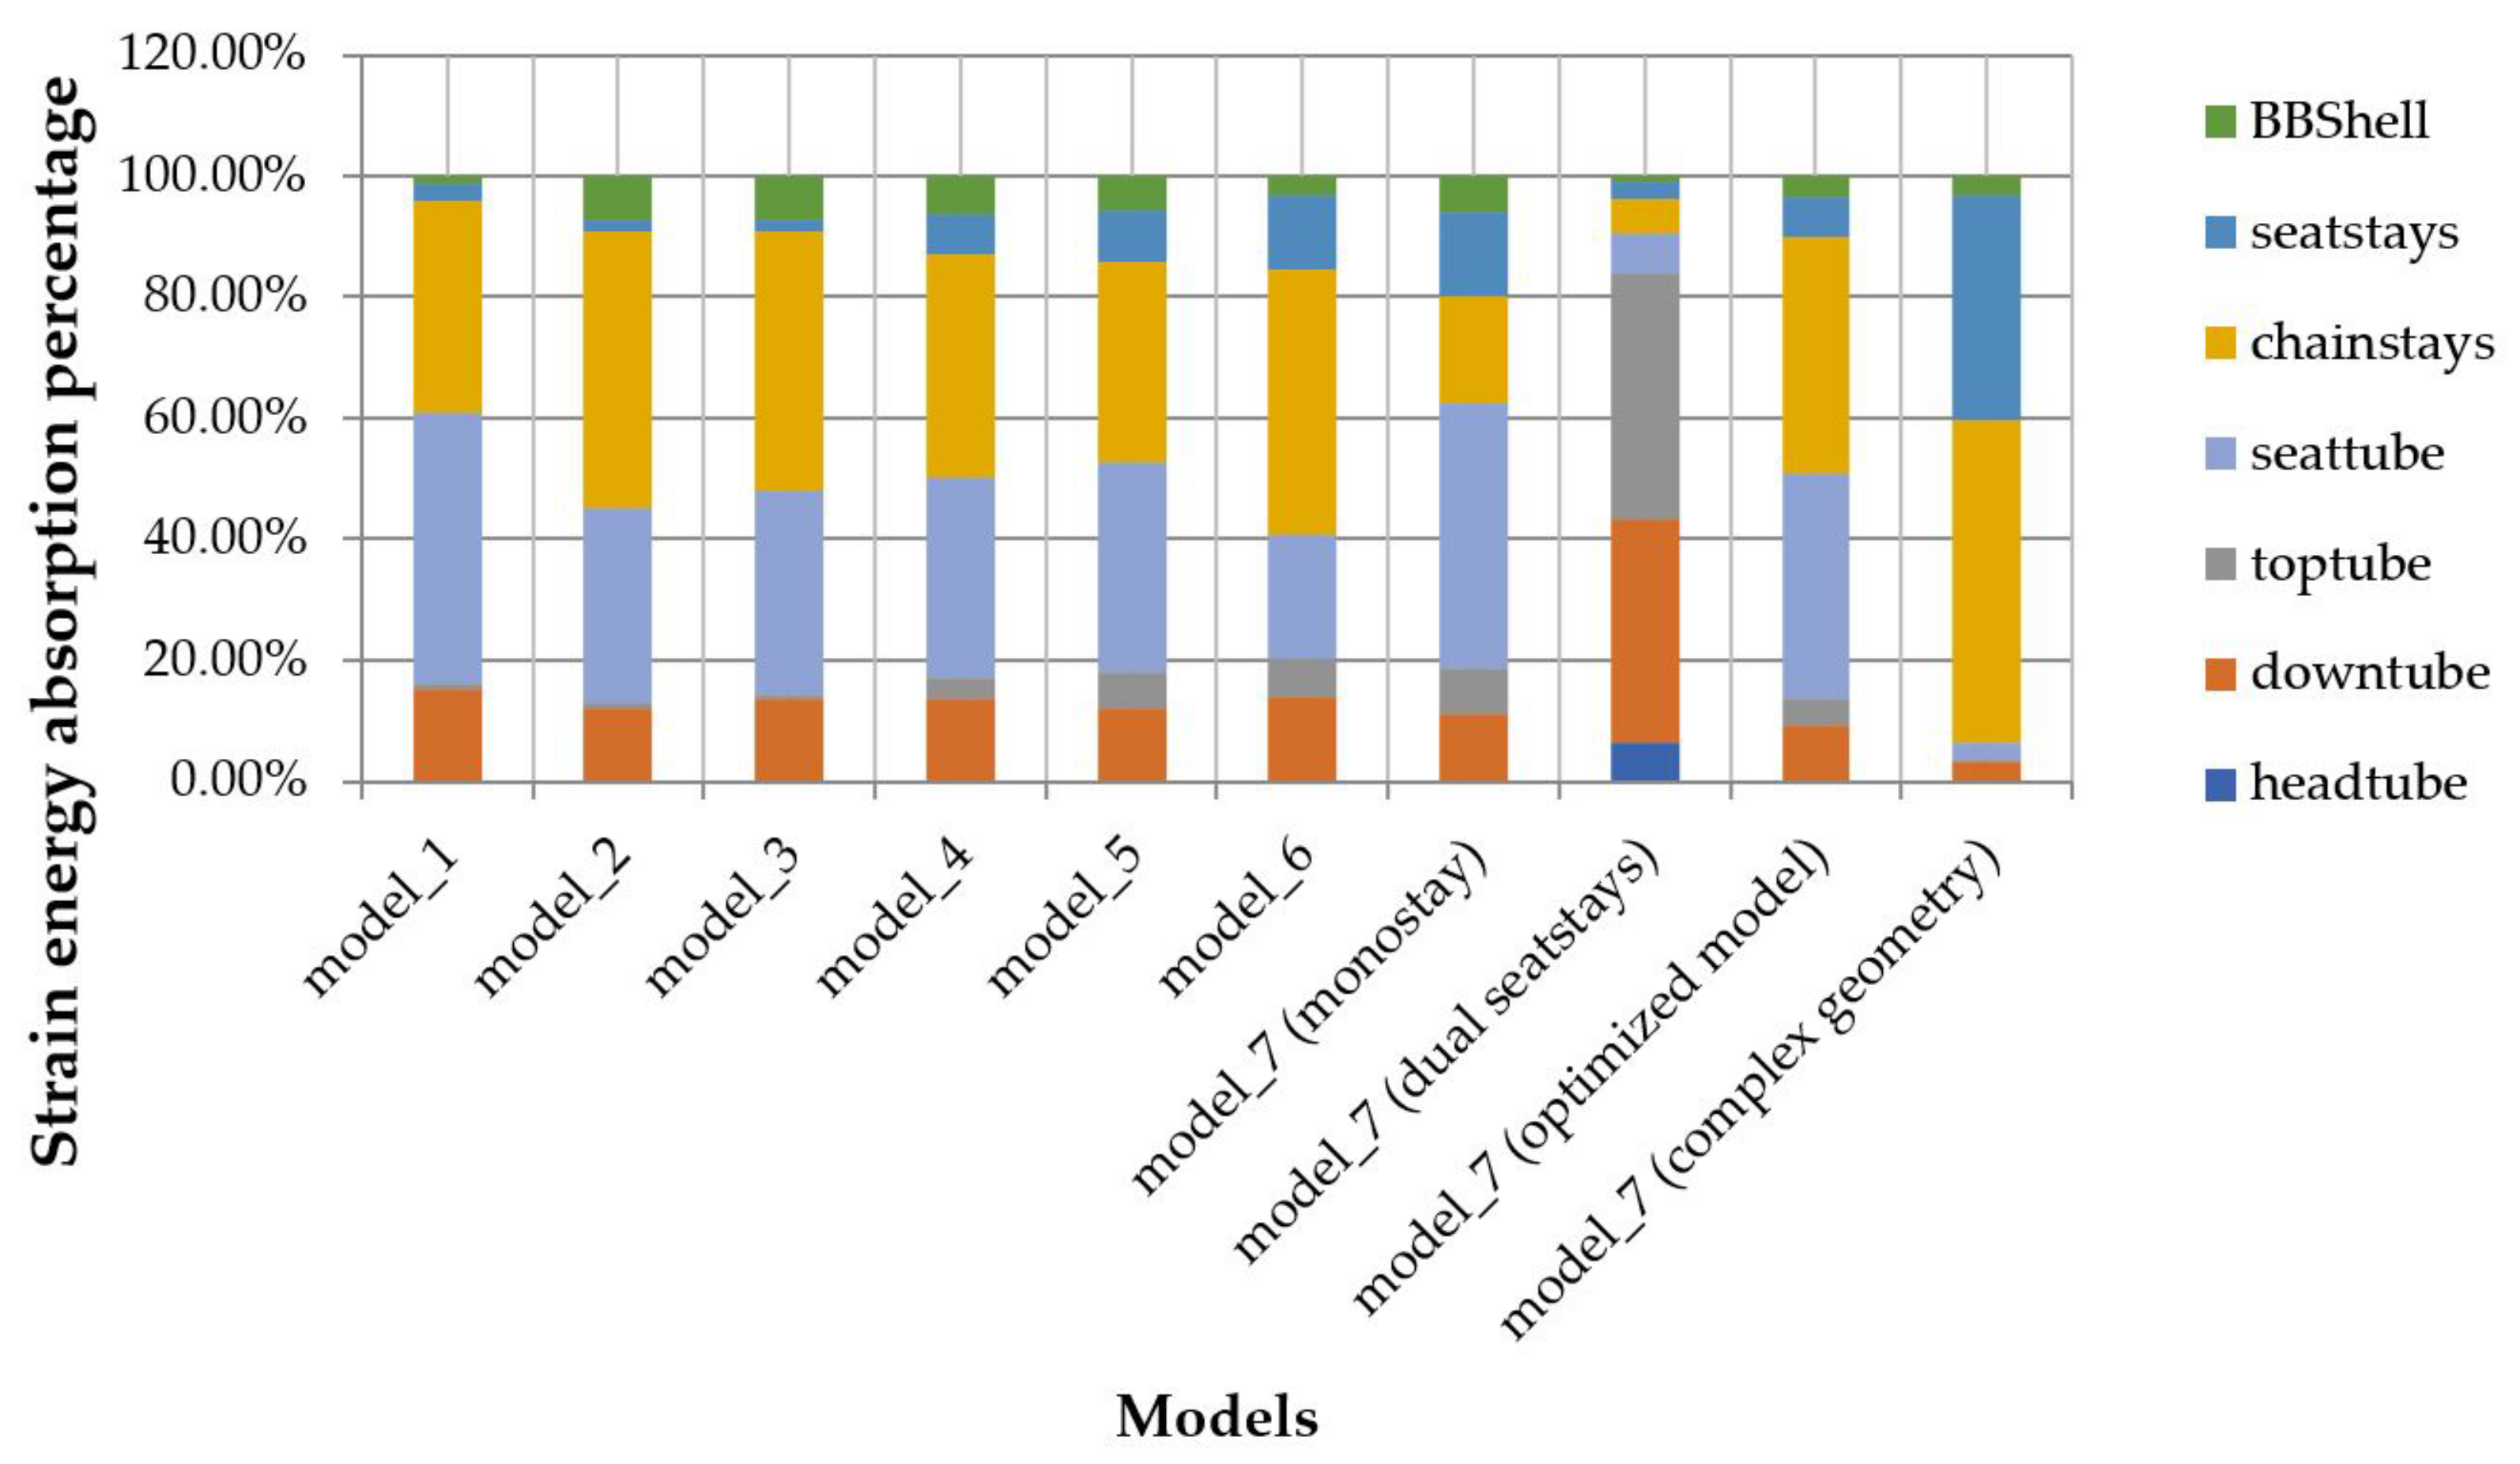
Figure 25.
Absorption of strain energy and its distribution in the riding scenario.
Figure 25.
Absorption of strain energy and its distribution in the riding scenario.
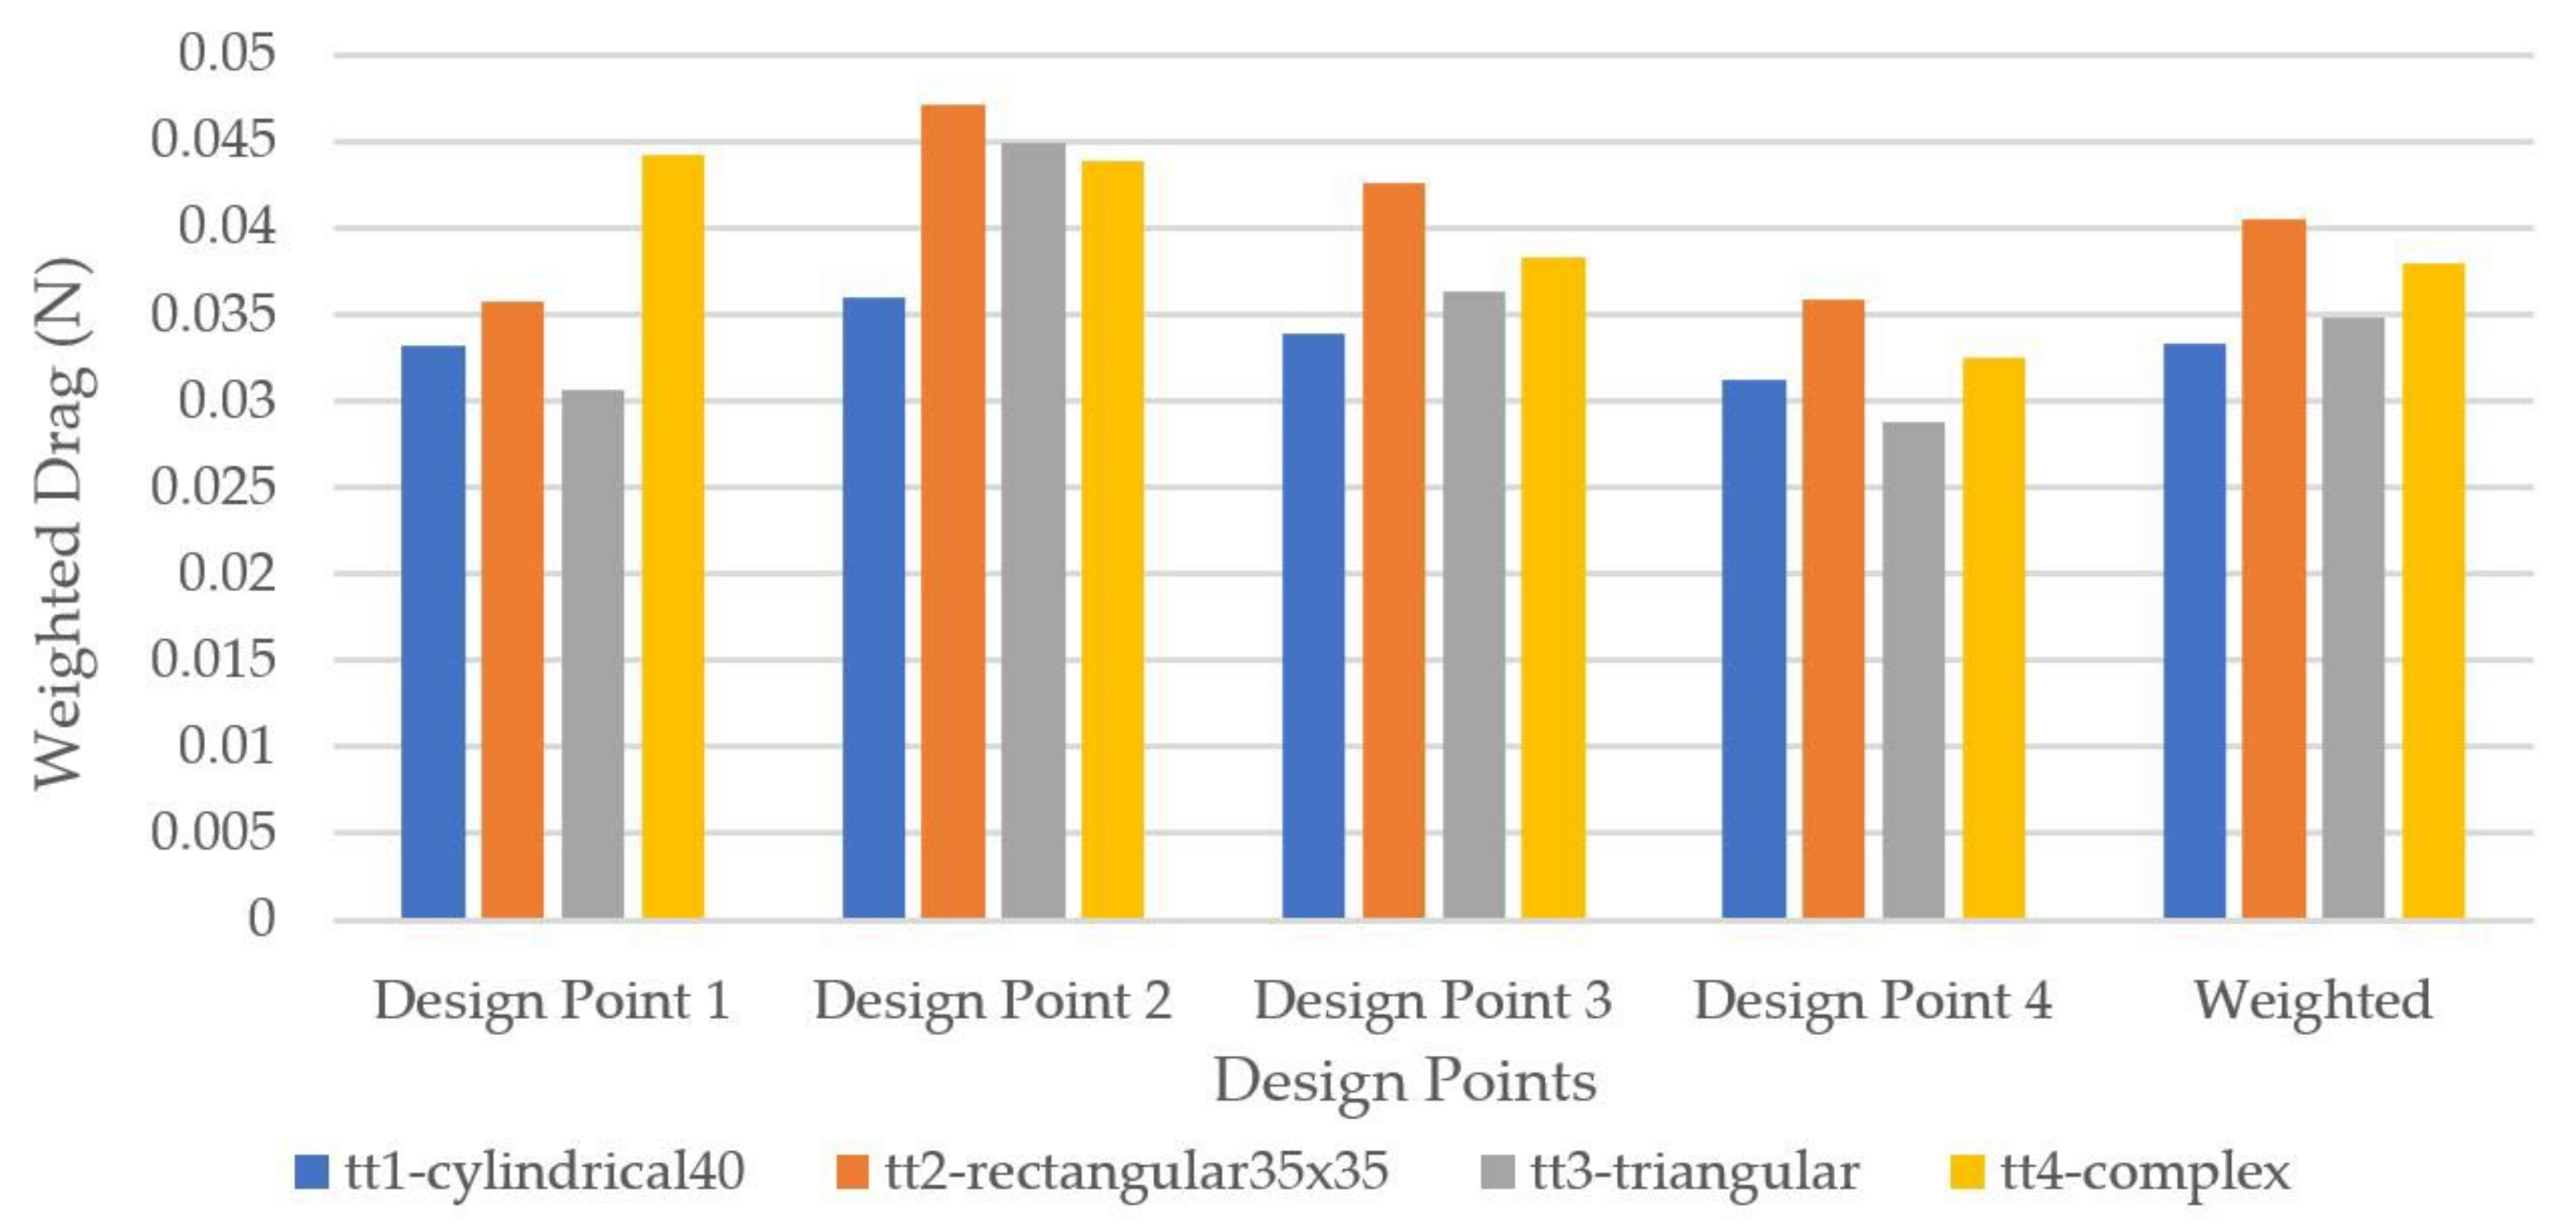
Figure 26.
Weighted drag on top tube cross-sections.
Figure 26.
Weighted drag on top tube cross-sections.
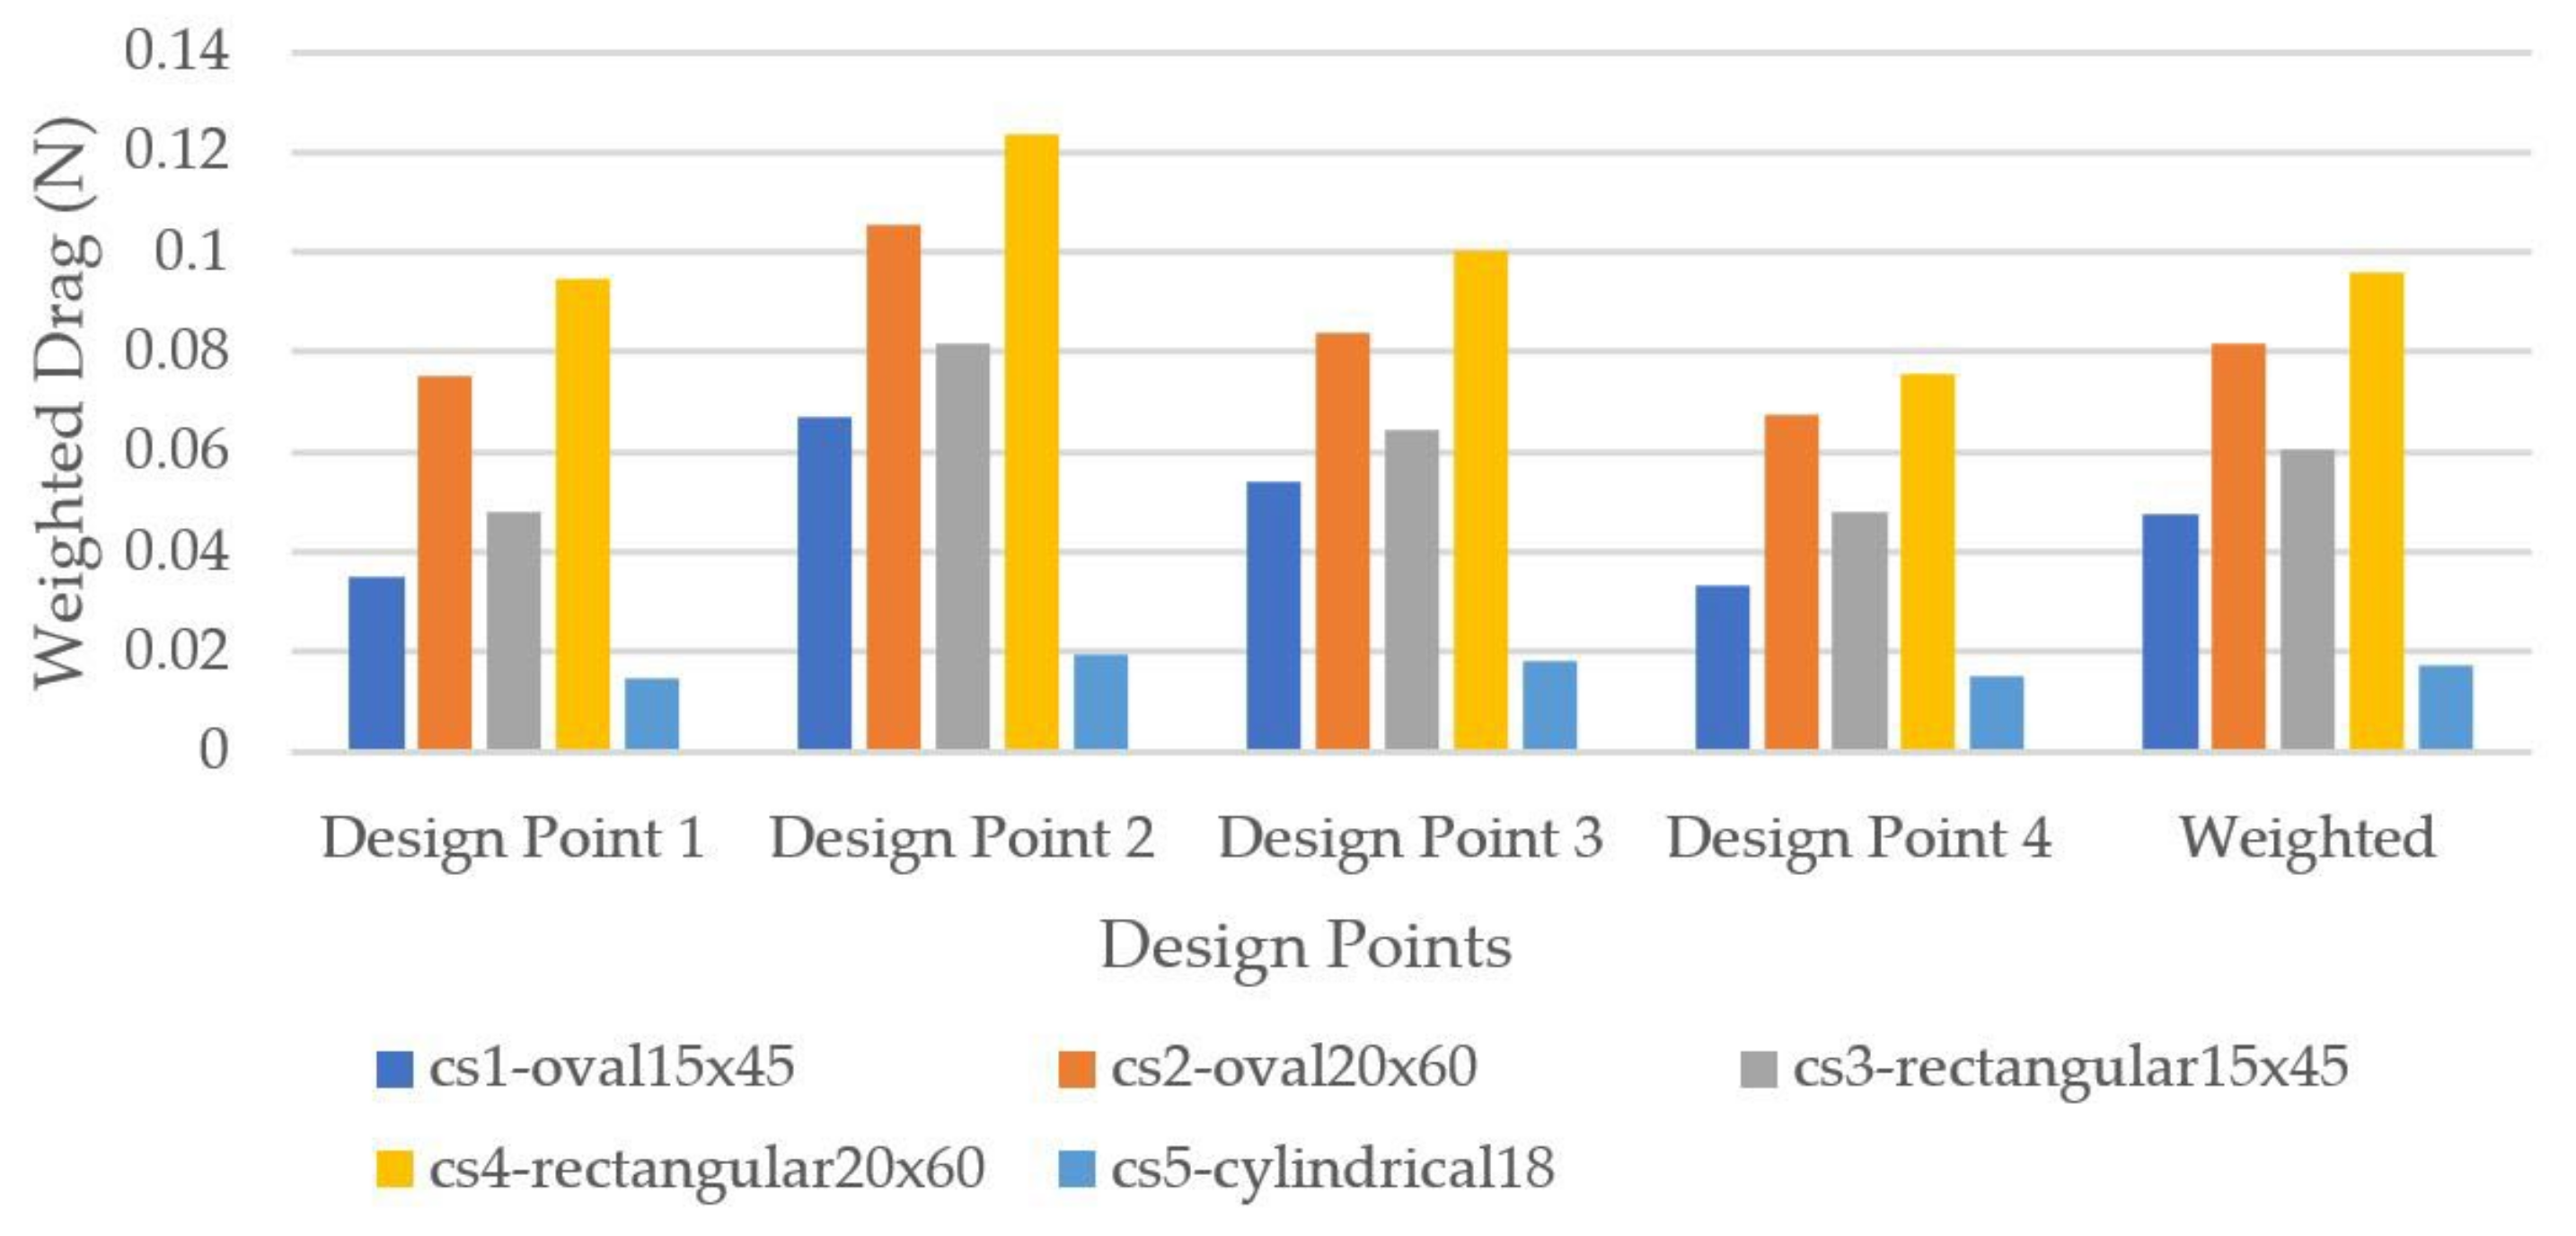
Figure 27.
Weighted drag force on down tube cross-sections.
Figure 27.
Weighted drag force on down tube cross-sections.
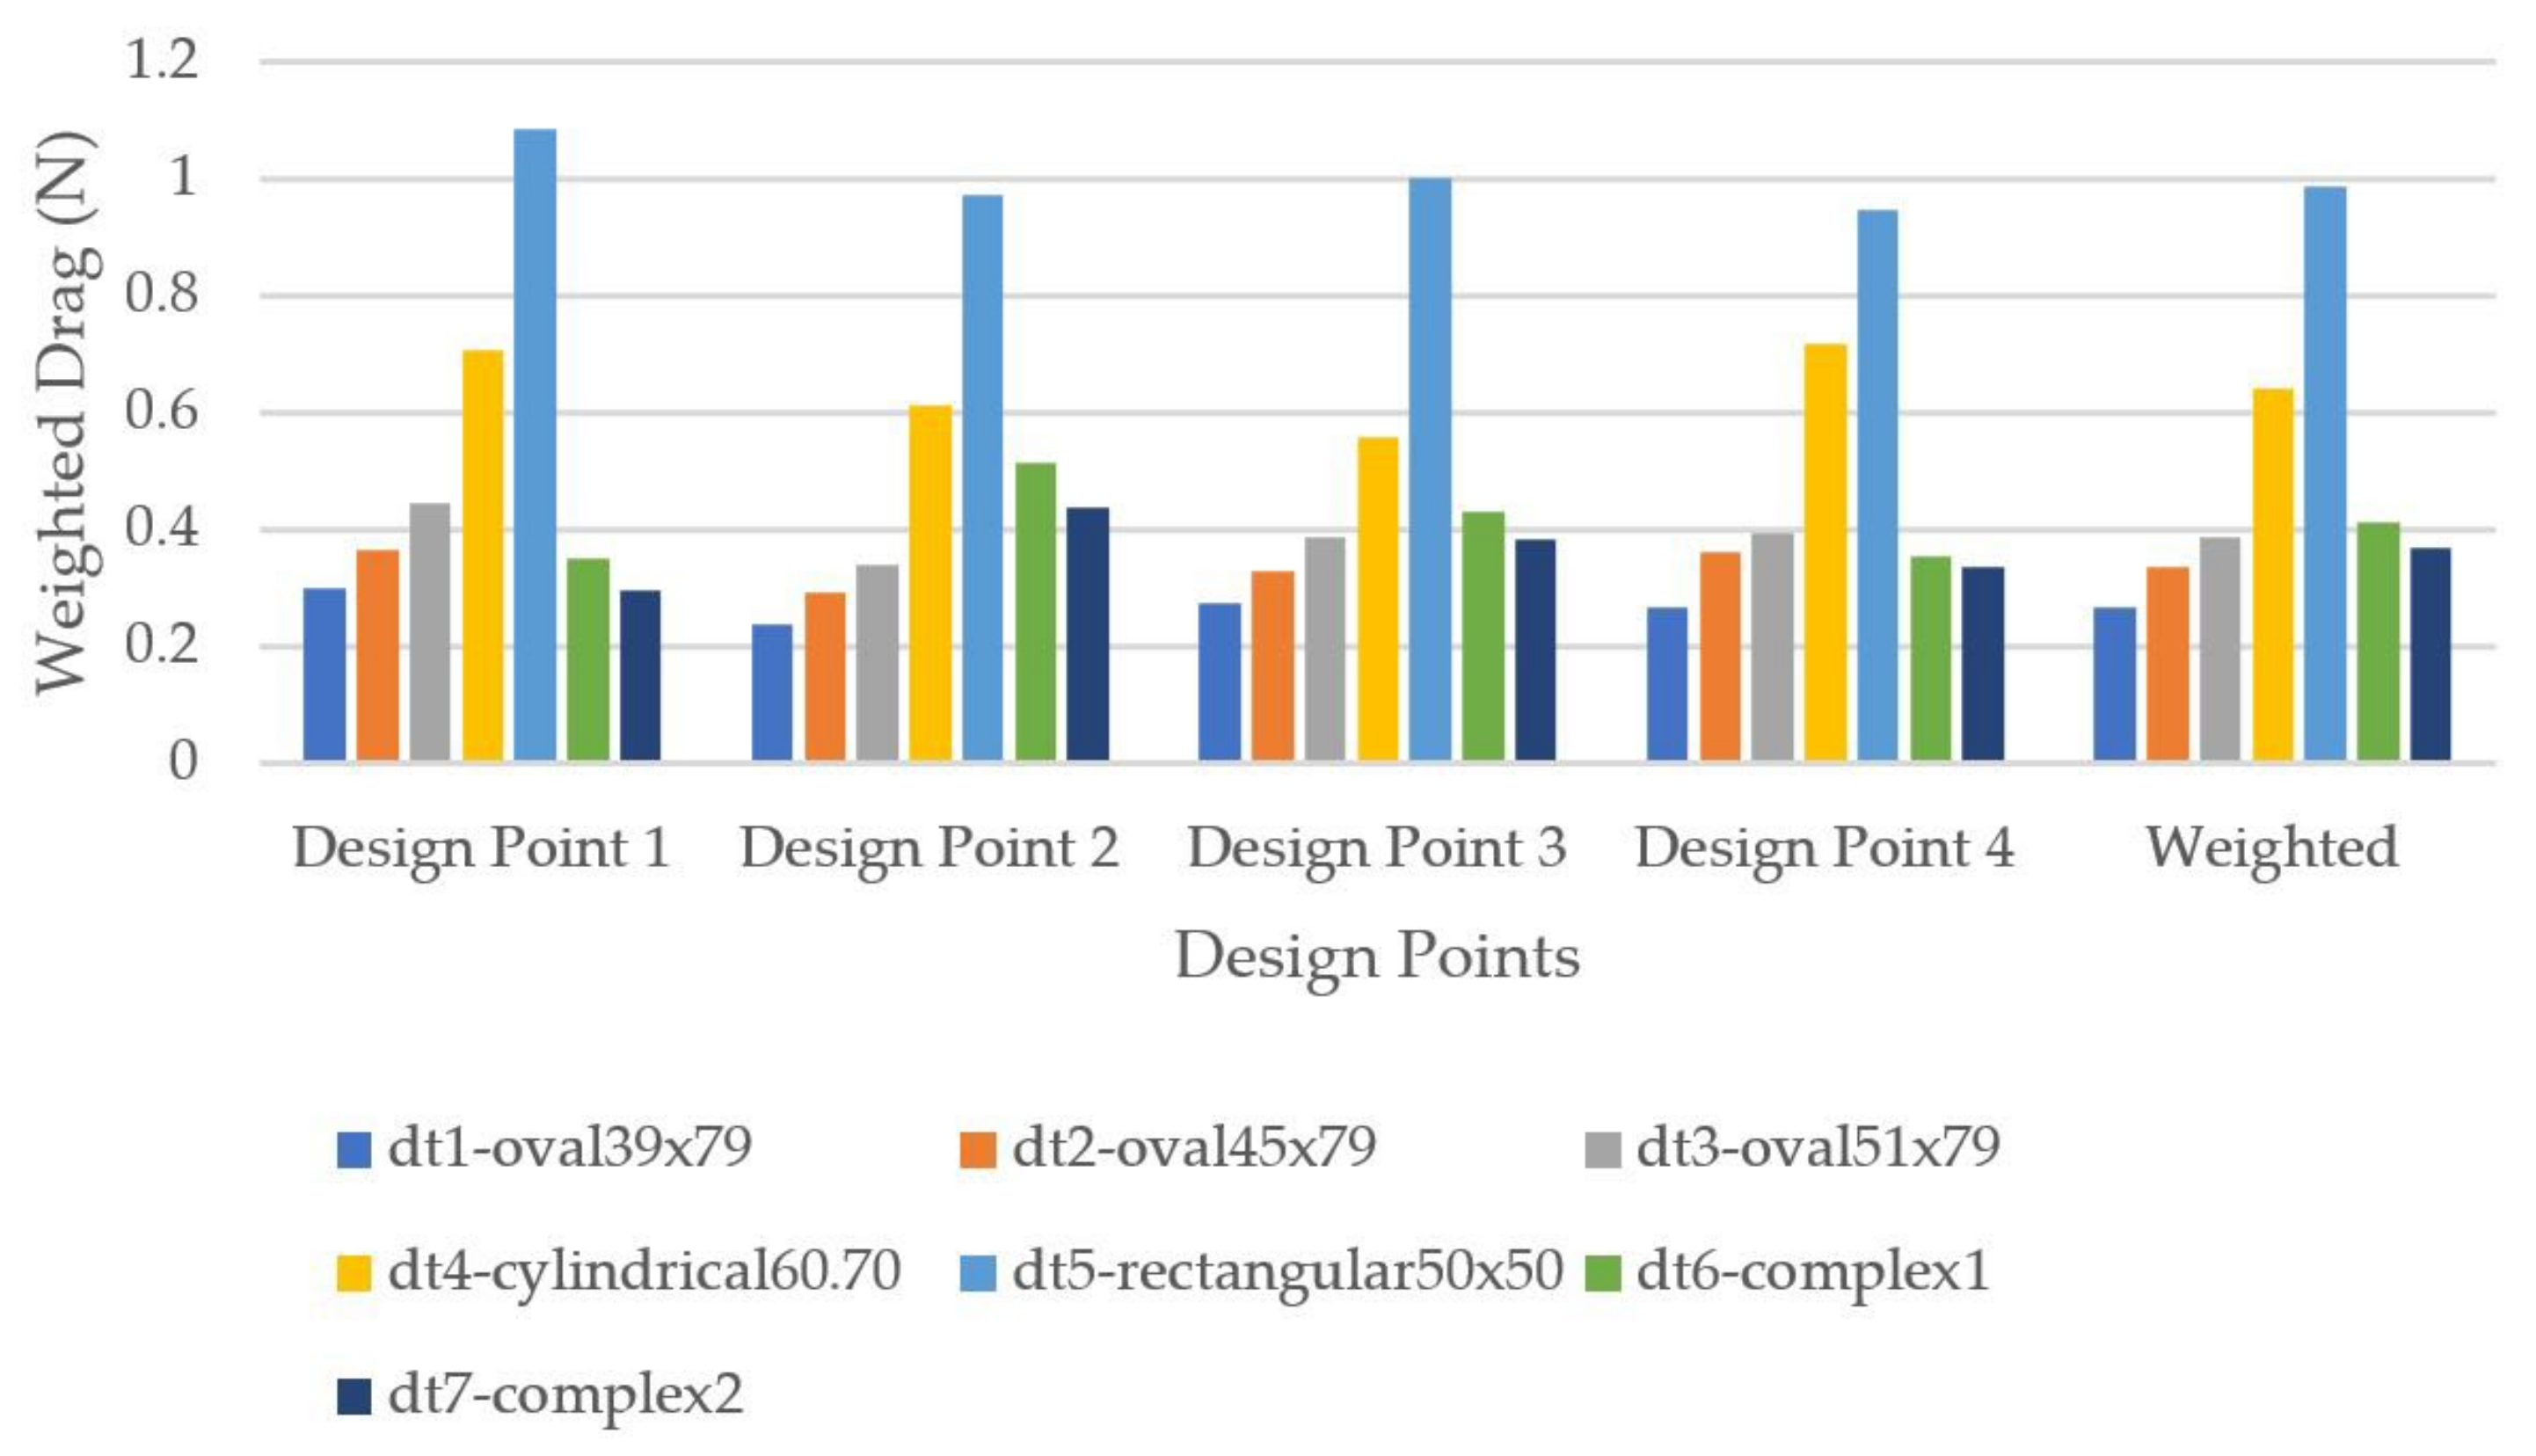
Figure 28.
Weighted drag force on seat tube cross-sections.
Figure 28.
Weighted drag force on seat tube cross-sections.
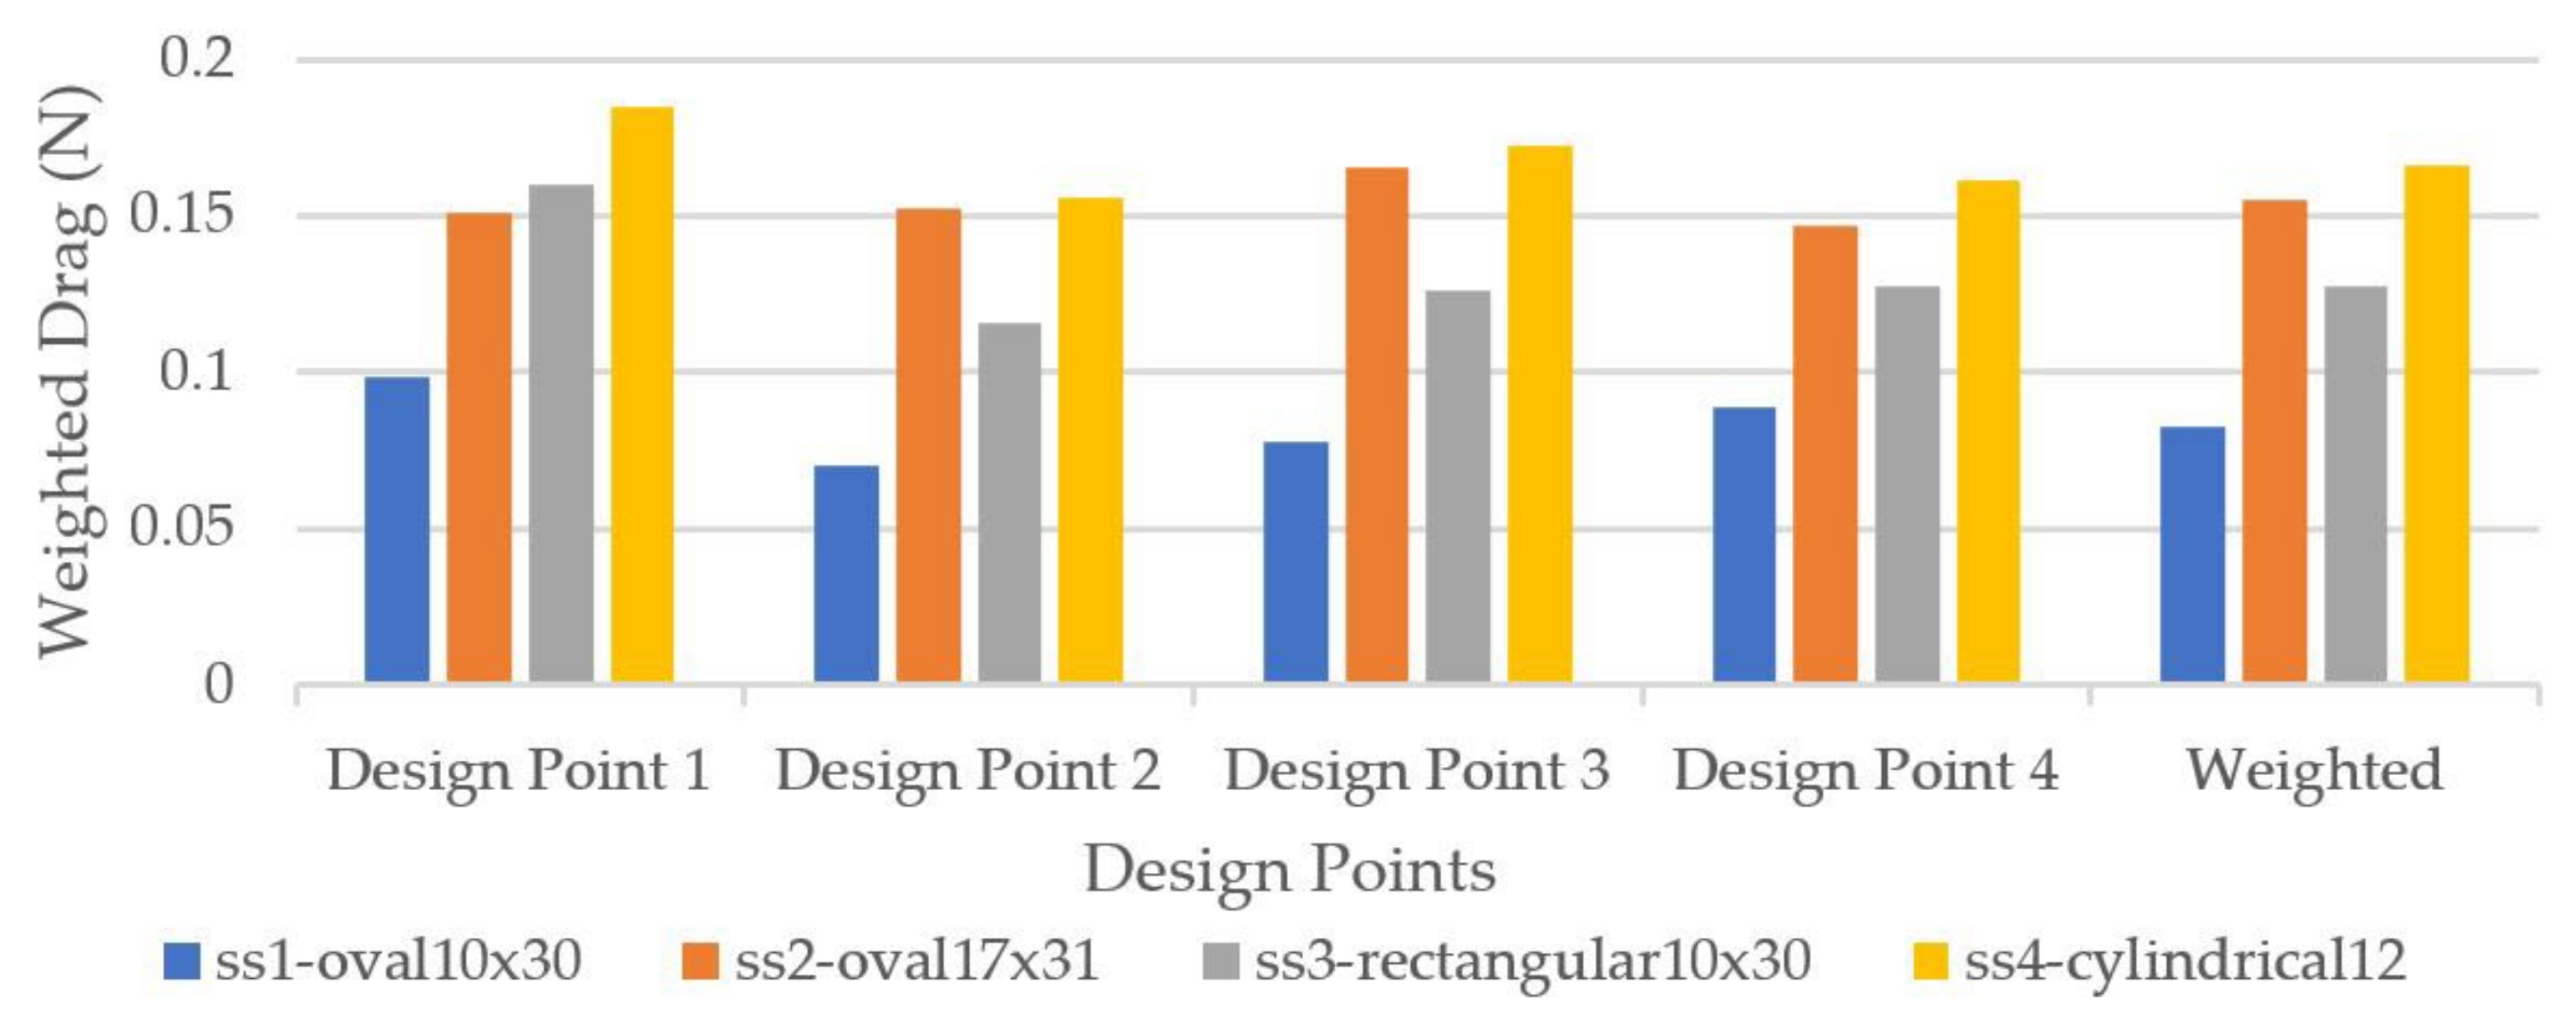
Figure 29.
Weighted drag force on seat stay cross-sections.
Figure 29.
Weighted drag force on seat stay cross-sections.
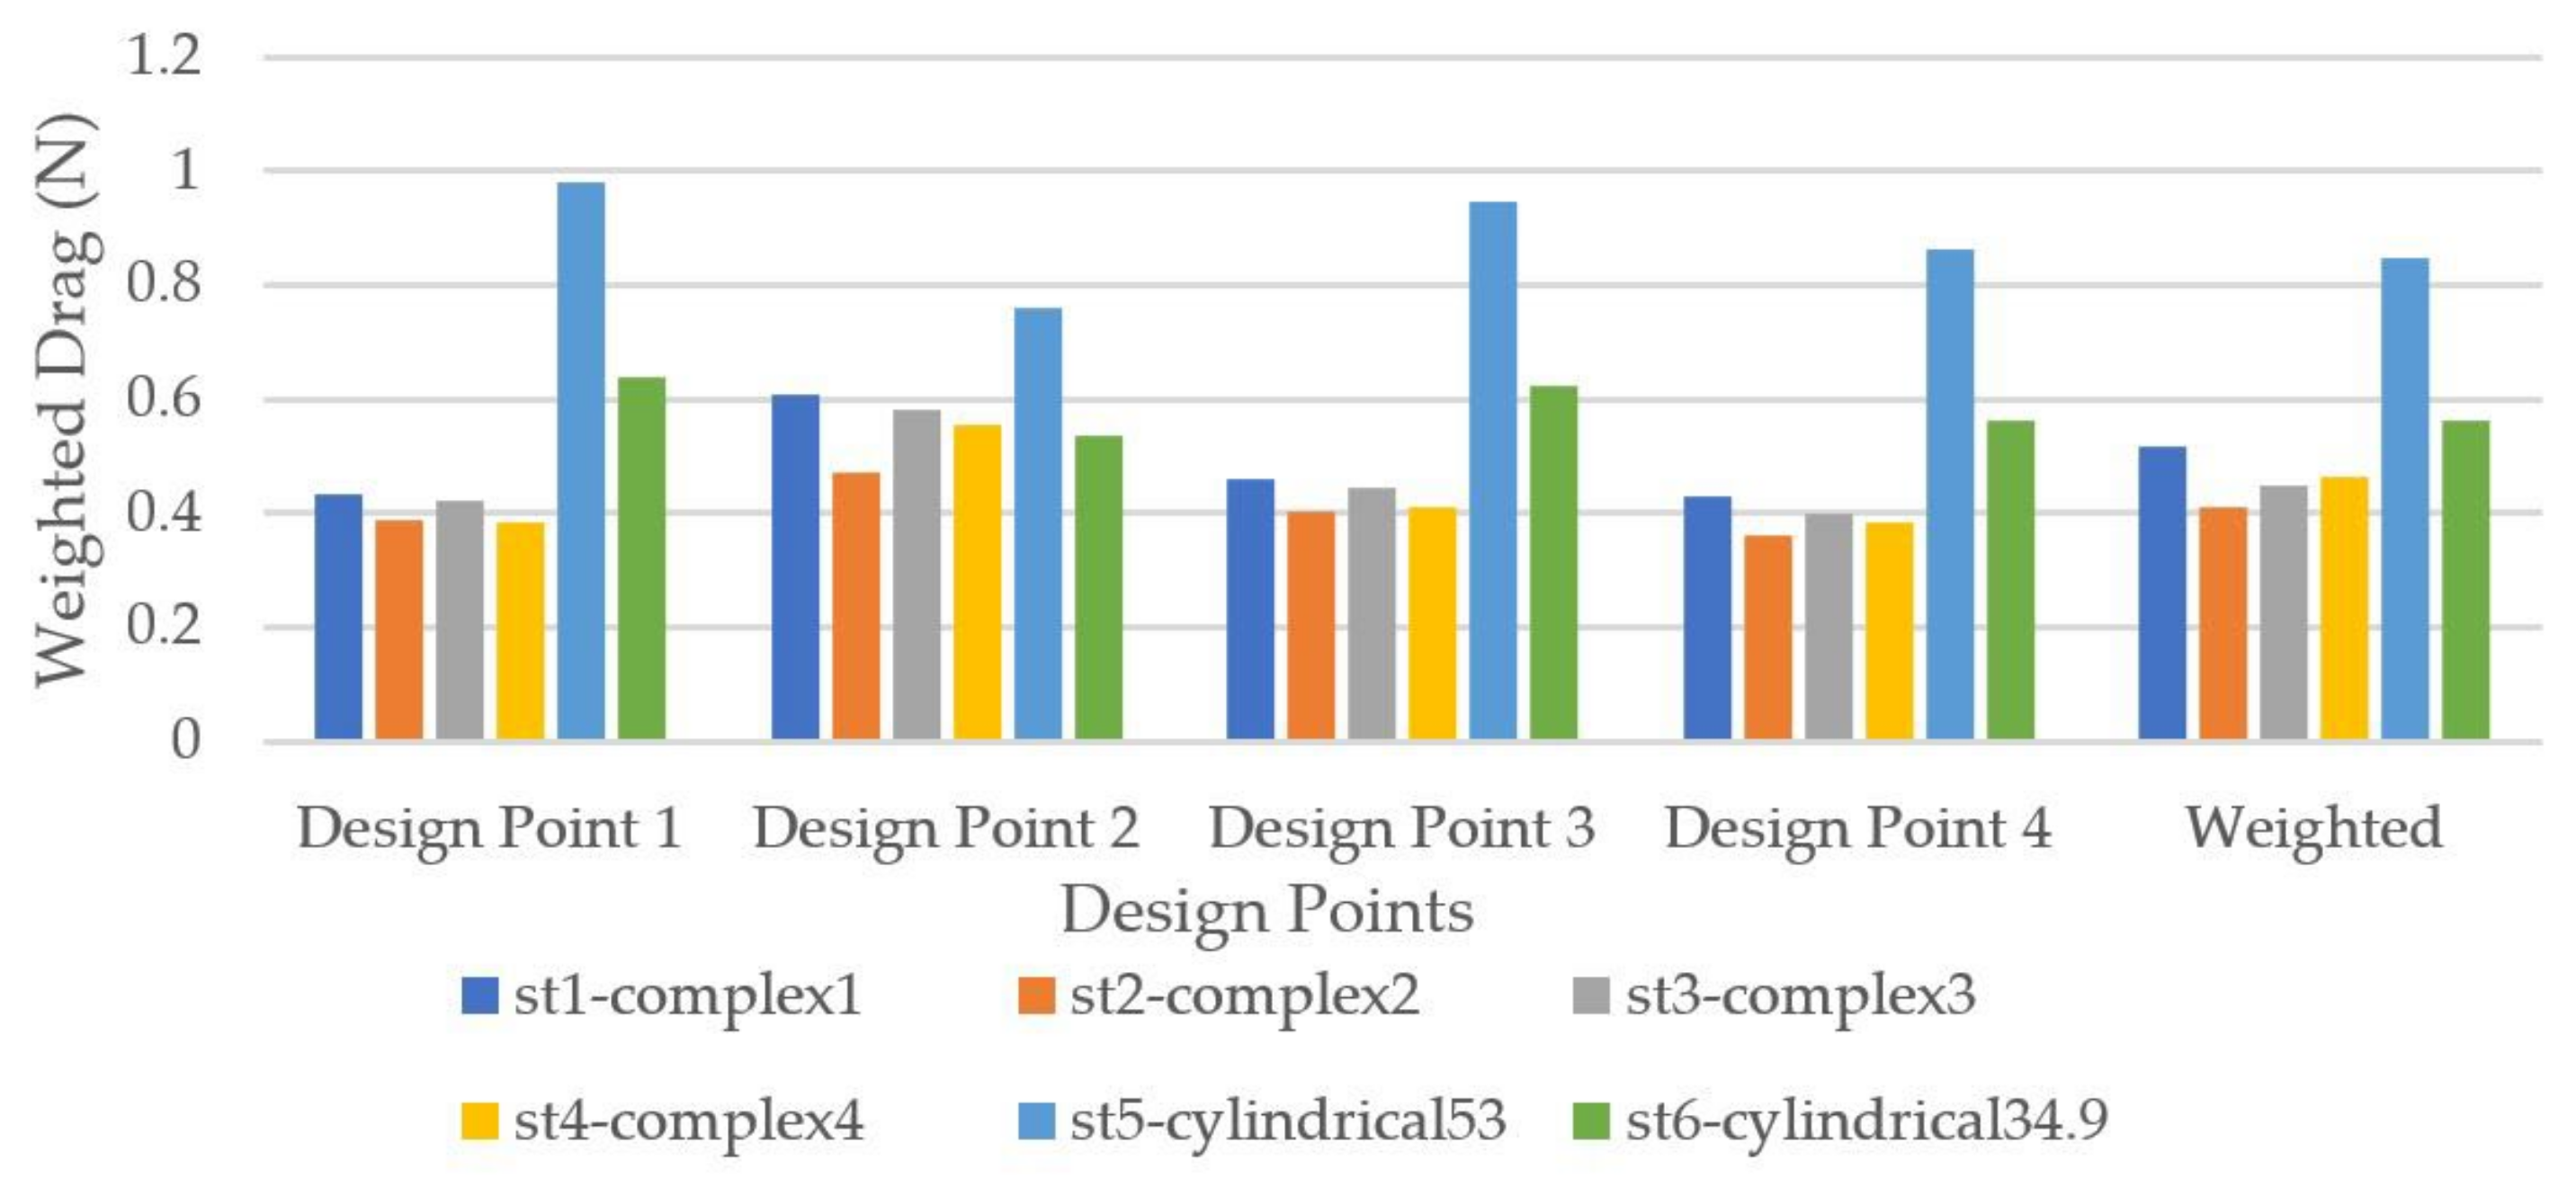
Figure 30.
Weighted drag force on chain stay cross-sections.
Figure 30.
Weighted drag force on chain stay cross-sections.
Table 1.
The four design points and their weights.
Table 1.
The four design points and their weights.
| | Vr (km/h) | Vw (km/h) | Yaw Angle (Deg) | Weight (%) | Drag (%) | Side Force (%) |
|---|
| Design point 1 | 45 | 0 | 0 | 10 | 85 | 15 |
| Design point 2 | 32 | 18 | 12 | 20 | 85 | 15 |
| Design point 3 | 32 | 18 | 7 | 35 | 85 | 15 |
| Design point 4 | 32 | 18 | 2 | 35 | 85 | 15 |
Table 2.
Quasi-isotropic layup using M46J Woven fabric.
Table 2.
Quasi-isotropic layup using M46J Woven fabric.
| Frame Tube | Stacking Recipe |
|---|
| Head tube | M46J Woven 0/90, M46J Woven ±45, M46J Woven 0/90, M46J Woven ±45 |
| Top tube | M46J Woven 0/90, M46J Woven ±45, M46J Woven 0/90, M46J Woven ±45 |
| Down tube | M46J Woven 0/90, M46J Woven ±45, M46J Woven 0/90, M46J Woven ±45 |
| Seat tube | M46J Woven 0/90, M46J Woven ±45, M46J Woven 0/90, M46J Woven ±45 |
| Seat stay (left) | M46J Woven 0/90, M46J Woven ±45, M46J Woven 0/90, M46J Woven ±45 |
| Seat stay (right) | M46J Woven 0/90, M46J Woven ±45, M46J Woven 0/90, M46J Woven ±45 |
| Chain stay (left) | M46J Woven 0/90, M46J Woven ±45, M46J Woven 0/90, M46J Woven ±45 |
| Chain stay (right) | M46J Woven 0/90, M46J Woven ±45, M46J Woven 0/90, M46J Woven ±45 |
Table 3.
Quasi-isotropic layup using T300 Woven fabric.
Table 3.
Quasi-isotropic layup using T300 Woven fabric.
| Frame Tube | Stacking Recipe |
|---|
| Head tube | T300 Woven 0/90, T300 Woven ±45, T300 Woven 0/90, T300 Woven ±45 |
| Top tube | T300 Woven 0/90, T300 Woven ±45, T300 Woven 0/90, T300 Woven ±45 |
| Down tube | T300 Woven 0/90, T300 Woven ±45, T300 Woven 0/90, T300 Woven ±45 |
| Seat tube | T300 Woven 0/90, T300 Woven ±45, T300 Woven 0/90, T300 Woven ±45 |
| Seat stay (left) | T300 Woven 0/90, T300 Woven ±45, T300 Woven 0/90, T300 Woven ±45 |
| Seat stay (right) | T300 Woven 0/90, T300 Woven ±45, T300 Woven 0/90, T300 Woven ±45 |
| Chain stay (left) | T300 Woven 0/90, T300 Woven ±45, T300 Woven 0/90, T300 Woven ±45 |
| Chain stay (right) | T300 Woven 0/90, T300 Woven ±45, T300 Woven 0/90, T300 Woven ±45 |
Table 4.
Stacking scenario 1.
Table 4.
Stacking scenario 1.
| Frame Tube | Stacking Recipe |
|---|
| Head tube | T300 Woven 0/90, T300 Woven ±45, T300 Woven 0/90, T300 Woven ±45, T300 Woven 0/90, T300 Woven ±45 |
| Top tube | T300 Woven 0/90, T300 Woven ±45, T300 Woven 0/90, T300 Woven ±45 |
| Down tube | T300 Woven 0/90, T300 Woven ±45, T300 Woven 0/90, T300 Woven ±45, T300 Woven 0/90, T300 Woven ±45 |
| Seat tube | T300 Woven 0/90, T300 Woven ±45, T300 Woven 0/90, T300 Woven ±45, T300 Woven 0/90, T300 Woven ±45 |
| Seat stay (left) | T300 Woven 0/90, T300 Woven ±45, T300 Woven 0/90, T300 Woven ±45 |
| Seat stay (right) | T300 Woven 0/90, T300 Woven ±45, T300 Woven 0/90, T300 Woven ±45 |
| Chain stay (left) | T300 Woven 0/90, T300 Woven ±45, T300 Woven 0/90, T300 Woven ±45 |
| Chain stay (right) | T300 Woven 0/90, T300 Woven ±45, T300 Woven 0/90, T300 Woven ±45, T300 Woven 0/90, T300 Woven ±45 |
Table 5.
Stacking scenario 2.
Table 5.
Stacking scenario 2.
| Frame Tube | Stacking Recipe |
|---|
| Head tube | T300 Woven ±45, T300 Woven 0/90, T300 Woven ±45, T300 Woven 0/90, T300 Woven ±45, T300 Woven 0/90, T300 Woven ±45, T300 Woven 0/90 |
| Top tube | T300 Woven ±45, T300 Woven 0/90, T300 Woven ±45, T300 Woven 0/90 |
| Down tube | T300 Woven ±45, T300 Woven 0/90, T300 Woven ±45, T300 Woven 0/90, T300 Woven ±45, T300 Woven 0/90 |
| Seat tube | T300 Woven ±45, T300 Woven 0/90, T300 Woven ±45, T300 Woven 0/90 |
| Seat stay (left) | T300 Woven ±45, T300 Woven 0/90, T300 Woven ±45, T300 Woven 0/90 |
| Seat stay (right) | T300 Woven ±45, T300 Woven 0/90, T300 Woven ±45, T300 Woven 0/90 |
| Chain stay (left) | T300 Woven ±45, T300 Woven 0/90, T300 Woven ±45, T300 Woven 0/90, T300 Woven ±45, T300 Woven 0/90 |
| Chain stay (right) | T300 Woven ±45, T300 Woven 0/90, T300 Woven ±45, T300 Woven 0/90, T300 Woven ±45, T300 Woven 0/90, T300 Woven ±45, T300 Woven 0/90 |
Table 6.
Stacking scenario 3.
Table 6.
Stacking scenario 3.
| Frame Tube | Stacking Recipe |
|---|
| Head tube | T300 Woven ±45, T300 Woven 0/90, T300 Woven ±45, T300 Woven 0/90, T300 Woven ±45, T300 Woven 0/90, T300 Woven ±45, T300 Woven 0/90 |
| Top tube | T300 Woven ±45, T700 UD 0, T300 Woven ±45, T300 Woven 0/90 |
| Down tube | T300 Woven ±45, T700 UD 0, T300 Woven ±45, T700 UD 0, T300 Woven ±45, T700 UD 0 |
| Seat tube | T300 Woven ±45, T700 UD 0, T300 Woven ±45, T700 UD 0, T700 UD 0 |
| Seat stay (left) | T300 Woven ±45, T700 UD 0, T300 Woven ±45, T300 Woven 0/90 |
| Seat stay (right) | T300 Woven ±45, T700 UD 0, T300 Woven ±45, T300 Woven 0/90 |
| Chain stay (left) | T300 Woven ±45, T700 UD 0, T300 Woven ±45, T700 UD 0, T300 Woven ±45, T300 Woven 0/90 |
| Chain stay (right) | T300 Woven ±45, T700 UD 0, T300 Woven ±45, T700 UD 0, T300 Woven ±45, T300 Woven 0/90, T300 Woven ±45, T700 UD 0 |
Table 7.
Stacking scenario 4.
Table 7.
Stacking scenario 4.
| Frame Tube | Stacking Recipe |
|---|
| Head tube | T300 Woven ±45, T300 Woven 0/90, T300 Woven ±45, T300 Woven 0/90, T300 Woven ±45, T300 Woven 0/90, T300 Woven ±45, T300 Woven 0/90 |
| Top tube | T300 Woven ±45, T700 UD 0, T300 Woven ±45 |
| Down tube | T300 Woven ±45, T700 UD 0, T300 Woven ±45, T700 UD 0, T300 Woven ±45, T700 UD 0 |
| Seat tube | T300 Woven ±45, T700 UD 0, T300 Woven 0/90, T700 UD 0, T700 UD 0 |
| Seat stay (left) | T300 Woven ±45, T700 UD 0, T300 Woven ±45 |
| Seat stay (right) | T300 Woven ±45, T700 UD 0, T300 Woven ±45 |
| Chain stay (left) | T300 Woven ±45, T700 UD 0, T300 Woven ±45, T700 UD 0, T300 Woven ±45, T700 UD 0 |
| Chain stay (right) | T300 Woven ±45, T700 UD 0, T300 Woven ±45, T700 UD 0, T300 Woven ±45, T700 UD 0, T300 Woven ±45, T700 UD 0 |
Table 8.
Stacking scenario 5.
Table 8.
Stacking scenario 5.
| Frame Tube | Stacking Recipe |
|---|
| Head tube | M46J UD 45, M46J UD -45, M46J UD 0, M46J UD 90, M46J UD 45, M46J UD -45, M46J UD 0, M46J UD 90, M46J UD 45, M46J UD −45, M46J UD 0, M46J UD 90 |
| Top tube | M46J UD 45, M46J UD −45, M46J UD 0 |
| Down tube | M46J UD 45, M46J UD −45, M46J UD 0, M46J UD 45, M46J UD −45, M46J UD 0, M46J UD 45, M46J UD −45, M46J UD 0 |
| Seat tube | M46J UD 45, M46J UD −45, M46J UD 0, M46J UD 90, M46J UD 0, M46J UD 0, M46J UD 0 |
| Seat stay (left) | M46J UD 45, M46J UD −45, M46J UD 0 |
| Seat stay (right) | M46J UD 45, M46J UD −45, M46J UD 0 |
| Chain stay (left) | M46J UD 45, M46J UD −45, M46J UD 0, M46J UD 45, M46J UD −45, M46J UD 0 |
| Chain stay (right) | M46J UD 45, M46J UD −45, M46J UD 0, M46J UD 45, M46J UD −45, M46J UD 0, M46J UD 45, M46J UD −45, M46J UD 0 |
Table 9.
Stacking scenario 6.
Table 9.
Stacking scenario 6.
| Frame Tube | Stacking Recipe |
|---|
| Head tube | M46J Woven ±45, M46J Woven 0/90, M46J Woven ±45, M46J Woven 0/90,
M46J Woven ±45, M46J Woven 0/90 |
| Top tube | T300 Woven ±45, T700 UD 0, T300 Woven ±45 |
| Down tube | M46J Woven ±45, M4J UD 0, M46J Woven ±45, M4J UD 0, M46J Woven ±45, M4J UD 0 |
| Seat tube | M46J Woven ±45, M4J UD 0, M46J Woven 0/90, M4J UD 0, M4J UD 0 |
| Seat stay (left) | T300 Woven ±45, T700 UD 0, T300 Woven ±45 |
| Seat stay (right) | T300 Woven ±45, T700 UD 0, T300 Woven ±45 |
| Chain stay (left) | M46J Woven ±45, M4J UD 0, M46J Woven ±45, M4J UD 0, M46J Woven ±45, M4J UD 0 |
| Chain stay (right) | M46J Woven ±45, M4J UD 0, M46J Woven ±45, M4J UD 0, M46J Woven ±45, M4J UD 0, M46J Woven ±45, M4J UD 0 |
Table 10.
Stacking scenario 7.
Table 10.
Stacking scenario 7.
| Frame Tube | Stacking Recipe |
|---|
| Head tube | M46J Woven ±45, M46J Woven 0/90, M46J Woven ±45, M46J Woven 0/90, M46J Woven ±45, M46J Woven 0/90, M46J Woven ±45, M46J Woven 0/90 |
| Top tube | M46J Woven ±45, M46J UD 0, M46J Woven ±45 |
| Down tube | M46J Woven ±45, M46J UD 0, M46J Woven ±45, M46J UD 0, M46J Woven ±45,
M46J UD 0 |
| Seat tube | M46J Woven ±45, M46J UD 0, M46J Woven 0/90, M46J UD 0, M46J UD 0 |
| Seat stay (left) | M46J Woven ±45, M46J UD 0, M46J Woven ±45 |
| Seat stay (right) | M46J Woven ±45, M46J UD 0, M46J Woven ±45 |
| Chain stay (left) | M46J Woven ±45, M46J UD 0, M46J Woven ±45, M46J UD 0, M46J Woven ±45, M46J UD 0 |
| Chain stay (right) | M46J Woven ±45, M46J UD 0, M46J Woven ±45, M46J UD 0, M46J Woven ±45, M46J UD 0, M46J Woven ±45, M46J UD 0 |
Table 11.
Stacking scenario 8.
Table 11.
Stacking scenario 8.
| Frame Tube | Stacking Recipe |
|---|
| Head tube | M46J Woven ±45, M46J Woven 0/90, M46J Woven ±45, M46J Woven 0/90, M46J Woven ±45, M46J Woven 0/90 |
| Top tube | M46J Woven ±45, M46J Woven 0/90 |
| Down tube | M46J Woven ±45, M46J UD 0, M46J Woven ±45, M46J UD 0, M46J Woven ±45, M46J UD 0 |
| Seat tube | M46J Woven ±45, M46J UD 0, M46J Woven 0/90, M46J UD 0, M46J UD 0 |
| Seat stay (left) | M46J Woven ±45, M46J Woven 0/90 |
| Seat stay (right) | M46J Woven ±45, M46J Woven 0/90 |
| Chain stay (left) | M46J Woven ±45, M46J UD 0, M46J Woven ±45, M46J UD 0, M46J Woven ±45, M46J UD 0 |
| Chain stay (right) | M46J Woven ±45, M46J UD 0, M46J Woven ±45, M46J UD 0, M46J Woven ±45, M46J UD 0, M46J Woven ±45, M46J UD 0 |
Table 12.
Stacking scenario 9.
Table 12.
Stacking scenario 9.
| Frame Tube | Stacking Recipe |
|---|
| Head tube | M46J Woven ±45, M46J Woven 0/90, M46J Woven ±45, M46J Woven 0/90, M46J Woven ±45, M46J Woven 0/90, M46J Woven ±45, M46J Woven 0/90, M46J Woven ±45, M46J Woven 0/90, M46J Woven ±45, M46J Woven 0/90 |
| Top tube | M46J Woven ±45, M46J UD 0, M46J Woven ±45, M46J UD 0, M46J Woven ±45, M46J UD 0 |
| Down tube | M46J Woven ±45, M46J UD 0, M46J Woven ±45, M46J UD 0, M46J Woven ±45, M46J UD 0, M46J Woven ±45, M46J UD 0 |
| Seat tube | M46J Woven ±45, M46J UD 0, M46J Woven 0/90, M46J UD 0, M46J UD 0, M46J Woven ±45, M46J UD 0, M46J Woven 0/90, M46J UD 0 |
| Seat stay (left) | M46J Woven ±45, M46J UD 0, M46J Woven ±45, M46J UD 0, M46J Woven ±45, M46J UD 0 |
| Seat stay (right) | M46J Woven ±45, M46J UD 0, M46J Woven ±45, M46J UD 0, M46J Woven ±45, M46J UD 0 |
| Chain stay (left) | M46J Woven ±45, M46J UD 0, M46J Woven ±45, M46J UD 0, M46J Woven ±45, M46J UD 0, M46J Woven ±45, M46J UD 0 |
| Chain stay (right) | M46J Woven ±45, M46J UD 0, M46J Woven ±45, M46J UD 0, M46J Woven ±45, M46J UD 0, M46J Woven ±45, M46J UD 0, M46J Woven ±45, M46J UD 0 |
Table 13.
Stacking scenario 10.
Table 13.
Stacking scenario 10.
| Frame Tube | Stacking Recipe |
|---|
| Head tube | T700 UD 45, T700 UD −45, T700 UD 0, T700 UD 90, T700 UD 45, T700 UD −45, T700 UD 0, T700 UD 90, T700 UD 45, T700 UD −45, T700 UD 0, T700 UD 90 |
| Top tube | T700 UD 45, T700 UD −45, T700 UD 0 |
| Down tube | T700 UD 45, T700 UD −45, T700 UD 0, T700 UD 45, T700 UD −45, T700 UD 0, T700 UD 45, T700 UD −45, T700 UD 0 |
| Seat tube | T700 UD 45, T700 UD −45, T700 UD 0, T700 UD 90, T700 UD 0, T700 UD 0, T700 UD 0 |
| Seat stay (left) | T700 UD 45, T700 UD −45, T700 UD 0 |
| Seat stay (right) | T700 UD 45, T700 UD −45, T700 UD 0 |
| Chain stay (left) | T700 UD 45, T700 UD −45, T700 UD 0, T700 UD 45, T700 UD −45, T700 UD 0 |
| Chain stay (right) | T700 UD 45, T700 UD −45, T700 UD 0, T700 UD 45, T700 UD −45, T700 UD 0, T700 UD 45, T700 UD −45, T700 UD 0 |
Table 14.
Static analysis of all tubes under bending and torsional loads.
Table 14.
Static analysis of all tubes under bending and torsional loads.
| Frame Parts | Cross-Section Designs | Surface Area (mm2) | Bending Load Test | Torsional Load Test |
|---|
| Max Stress (MPa) | Max Displacement (mm) | Max Stress (MPa) | Max Displacement (mm) |
|---|
| Top tube | Cylindrical 40 | 71,628.31 | 108.70 | 8.56 | 22.40 | 0.22 |
| Rectangular 35 × 35 | 73,979.39 | 91.20 | 8.68 | 11.20 | 0.11 |
| Triangular | 66,192.26 | 157.00 | 11.30 | 132.30 | 3.73 |
| Complex | 68,512.70 | 144.70 | 11.03 | 39.73 | 0.94 |
| Down tube | Oval 39 × 79 | 111,183.63 | 42.14 | 1.76 | 57.92 | 1.35 |
| Oval 45 × 79 | 115,669.59 | 39.01 | 1.64 | 42.86 | 1.02 |
| Oval 51 × 79 | 120,205.33 | 36.41 | 1.53 | 32.29 | 0.76 |
| Cylindrical 60.70 | 107,742.49 | 46.36 | 2.50 | 9.63 | 0.09 |
| Rectangular 50 × 50 | 108,150.00 | 47.84 | 3.46 | 34.77 | 0.25 |
| Complex1 | 118,822.31 | 41.20 | 1.68 | 39.15 | 0.73 |
| Complex2 | 110,288.51 | 51.54 | 2.00 | 76.30 | 1.15 |
| Seat tube | Complex1 | 82,015.47 | 65.74 | 3.51 | 71.62 | 1.10 |
| Complex2 | 69,475.08 | 85.03 | 4.66 | 101.50 | 1.25 |
| Complex3 | 70,781.40 | 80.69 | 4.44 | 79.85 | 1.30 |
| Complex4 | 73,113.23 | 147.80 | 4.04 | 63.38 | 1.83 |
| Cylindrical 53 | 83,252.21 | 61.11 | 3.72 | 12.63 | 0.19 |
| Cylindrical 34.9 | 54,820.79 | 141.10 | 12.84 | 29.12 | 0.28 |
| Seat stays | Oval 10 × 30 | 21,385.25 | 356.20 | 36.68 | 303.50 | 6.12 |
| Oval 17 × 31 | 24,644.18 | 261.80 | 26.84 | 142.90 | 1.29 |
| Rectangular 10 × 30 | 23,951.86 | 262.60 | 27.58 | 344.70 | 3.25 |
| Cylindrical 12 | 12,063.72 | 1293.00 | 31.08 | 250.60 | 2.96 |
| Chain stays | Oval 15 × 45 | 39,594.67 | 150.90 | 10.90 | 196.80 | 2.38 |
| Oval 20 × 60 | 52,588.59 | 87.81 | 4.64 | 165.20 | 2.54 |
| Rectangular 15 × 45 | 45,365.57 | 108.80 | 7.82 | 226.70 | 2.46 |
| Rectangular 20 × 60 | 60,487.43 | 61.34 | 3.37 | 177.20 | 2.61 |
| Cylindrical 18 | 22,336.72 | 540.60 | 92.79 | 109.70 | 1.11 |
Table 15.
Evaluation of each cross-section.
Table 15.
Evaluation of each cross-section.
| Frame Parts | Cross-Section Designs | Displacement | Mass | Weighted Drag | Production/Cost-Effectiveness |
|---|
| Top tube | cylindrical40 | ✓ | ✓ | ✓ | ✓ |
| rectangular35 × 35 | ✓ | ✕ | ✕ | ✓ |
| triangular | ✕ | ✓ | ✓ | ✕ |
| complex | ✕ | ✓ | ✕ | ✕ |
| Down tube | oval39 × 79 | ✓ | ✓ | ✓✓ | ✓ |
| oval45 × 79 | ✓ | ✓ | ✓ | ✓ |
| oval51 × 79 | ✓✓ | ✕ | ✓ | ✓ |
| cylindrical60.70 | ✕ | ✓ | ✕ | ✓ |
| rectangular50 × 50 | ✕ | ✓ | ✕ | ✓ |
| complex1 | ✓ | ✓ | ✓ | ✕ |
| complex2 | ✓ | ✕✕ | ✓ | ✕ |
| Seat tube | complex1 | ✓ | ✕ | ✓ | ✕ |
| complex2 | ✓ | ✓ | ✓ | ✕ |
| complex3 | ✓ | ✓ | ✓ | ✕ |
| complex4 | ✓ | ✓ | ✓ | ✕ |
| cylindrical53 | ✓ | ✕ | ✕ | ✓ |
| cylindrical34.9 | ✕✕ | ✓ | ✓ | ✓ |
| Seat stays | oval10 × 30 | ✕ | ✓ | ✓✓ | ✓ |
| oval17 × 31 | ✓ | ✕ | ✕ | ✓ |
| rectangular10 × 30 | ✓✓ | ✕ | ✓ | ✕ |
| cylindrical12 | ✕✕✕ | ✓✓ | ✕ | ✓ |
| Chain stays | oval15 × 45 | ✕ | ✓ | ✓✓ | ✓ |
| oval20 × 60 | ✓ | ✓ | ✓ | ✓ |
| rectangular15 × 45 | ✕ | ✓ | ✓ | ✓ |
| rectangular20 × 60 | ✓✓ | ✕✕ | ✕✕ | ✓ |
| cylindrical18 | ✕✕✕ | ✓✓ | ✓✓ | ✓ |
Table 16.
Allowable tensile and compressive stresses for each material.
Table 16.
Allowable tensile and compressive stresses for each material.
| Allowable Stresses | T300 Woven | T700 UD | M46J Woven | M46J UD |
|---|
| Tensile (ST1) | 573 | 1700 | 1600 | 1900 |
| Tensile (ST2) | 573 | 40 | 1600 | 40 |
| Compressive (SC1) | 631 | 1000 | 600 | 850 |
| Compressive (SC2) | 631 | 40 | 600 | 40 |
| Max Shear Stress (SS12) | 74 | 85.7 | 65 | 72 |
Table 17.
Stress and displacement results of M46J Woven quasi-isotropic scenario.
Table 17.
Stress and displacement results of M46J Woven quasi-isotropic scenario.
| Test | Layer | Tube | Stress | MPa | Displacement (mm) |
|---|
| Drop mass | 1 | head tube | Min 11 | −354 | 1.516 |
| 1 | head tube | Max 11 | 229 |
| 1 | head tube | Min 22 | −351 |
| 1 | head tube | Max 22 | 229 |
| 1 | head tube | Min 12 | −26.49 |
| 1 | down tube | Max 12 | 20.88 |
| Falling frame | 1 | head tube | Min 11 | −73 | 0.556 |
| 1 | head tube | Max 11 | 89 |
| 1 | head tube | Min 22 | −82 |
| 1 | head tube | Max 22 | 80 |
| 1 | head tube | Min 12 | −6.61 |
| 1 | head tube | Max 12 | 6.4 |
| Horizontal forces | 1 | head tube | Min 11 | −60 | 0.289 |
| 1 | head tube | Max 11 | 60 |
| 1 | head tube | Min 22 | −59 |
| 1 | head tube | Max 22 | 59 |
| 1 | head tube | Min 12 | −4.421 |
| 1 | head tube | Max 12 | 4.421 |
| Vertical forces | 4 | seat tube | Min 11 | −121 | 0.523 |
| 3 | seat tube | Max 11 | 128 |
| 1 | seat tube | Min 22 | −113 |
| 4 | seat tube | Max 22 | 199 |
| 4 | seat tube | Min 12 | −11.37 |
| 1 | seat tube | Max 12 | 12.53 |
| Pedaling forces | 1 | seat tube | Min 11 | −254 | 2.193 |
| 4 | seat tube | Max 11 | 207 |
| 1 | seat tube | Min 22 | −258 |
| 4 | seat tube | Max 22 | 205 |
| 4 | seat tube | Min 12 | −23.02 |
| 1 | seat tube | Max 12 | 16.44 |
Table 18.
Stress and displacement results of T300 Woven quasi-isotropic scenario.
Table 18.
Stress and displacement results of T300 Woven quasi-isotropic scenario.
| Test | Layer | Tube | Stress | MPa | Displacement (mm) |
|---|
| Drop mass | 1 | head tube | Min 11 | −290 | 1.485 |
| 1 | head tube | Max 11 | 171 |
| 1 | head tube | Min 22 | −276 |
| 1 | head tube | Max 22 | 170 |
| 1 | head tube | Min 12 | −26.53 |
| 1 | top tube | Max 12 | 20.57 |
| Falling frame | 1 | head tube | Min 11 | −55 | 0.545 |
| 1 | head tube | Max 11 | 72 |
| 1 | head tube | Min 22 | −61 |
| 1 | head tube | Max 22 | 63 |
| 1 | head tube | Min 12 | −5.96 |
| 1 | head tube | Max 12 | 6.57 |
| Horizontal forces | 1 | head tube | Min 11 | −49 | 0.288 |
| 1 | head tube | Max 11 | 49 |
| 1 | head tube | Min 22 | −47 |
| 1 | head tube | Max 22 | 47 |
| 1 | head tube | Min 12 | −4.484 |
| 1 | head tube | Max 12 | 4.484 |
| Vertical forces | 4 | seat tube | Min 11 | −99 | 0.498 |
| 3 | seat tube | Max 11 | 98 |
| 1 | seat tube | Min 22 | −88 |
| 4 | seat tube | Max 22 | 148 |
| 1 | seat stays | Min 12 | −11.48 |
| 1 | seat tube | Max 12 | 12.11 |
| Pedaling forces | 1 | seat tube | Min 11 | −162 | 2.149 |
| 3 | seat tube | Max 11 | 172 |
| 1 | seat tube | Min 22 | −171 |
| 3 | seat tube | Max 22 | 165 |
| 4 | seat tube | Min 12 | −26.53 |
| 4 | seat tube | Max 12 | 27.18 |
Table 19.
Stress and displacement results of stacking scenario 1.
Table 19.
Stress and displacement results of stacking scenario 1.
| Test | Layer | Tube | Stress | MPa | Displacement (mm) |
|---|
| Drop mass | 1 | head tube | Min 11 | −199 | 1.111 |
| 1 | top tube | Max 11 | 148 |
| 2 | head tube | Min 22 | −194 |
| 1 | top tube | Max 22 | 155 |
| 1 | head tube | Min 12 | −17.93 |
| 1 | top tube | Max 12 | 16.07 |
| Falling frame | 4 | top tube | Min 11 | −38 | 0.448 |
| 1 | head tube | Max 11 | 50 |
| 2 | head tube | Min 22 | −34 |
| 2 | head tube | Max 22 | 48 |
| 1 | top tube | Min 12 | −3.518 |
| 1 | head tube | Max 12 | 4.513 |
| Horizontal forces | 1 | head tube | Min 11 | −39 | 0.249 |
| 1 | head tube | Max 11 | 39 |
| 2 | head tube | Min 22 | −38 |
| 2 | head tube | Max 22 | 38 |
| 1 | head tube | Min 12 | 3.567 |
| 1 | head tube | Max 12 | 3.567 |
| Vertical forces | 4 | seat stays | Min 11 | −92 | 0.368 |
| 2 | seat tube | Max 11 | 67 |
| 5 | seat tube | Min 22 | −58 |
| 5 | seat tube | Max 22 | 69 |
| 4 | seat stays | Min 12 | −7.61 |
| 1 | seat stays | Max 12 | 8.51 |
| Pedaling forces | 2 | left chain stay | Min 11 | −116 | 1.689 |
| 5 | seat tube | Max 11 | 120 |
| 1 | seat tube | Min 22 | −113 |
| 5 | seat tube | Max 22 | 114 |
| 6 | seat tube | Min 12 | −16.85 |
| 6 | seat tube | Max 12 | 17.34 |
Table 20.
Stress and displacement results of stacking scenario 2.
Table 20.
Stress and displacement results of stacking scenario 2.
| Test | Layer | Tube | Stress | MPa | Displacement (mm) |
|---|
| Drop mass | 6 | down tube | Min 11 | −184 | 1.104 |
| 1 | top tube | Max 11 | 139 |
| 2 | head tube | Min 22 | −156 |
| 1 | top tube | Max 22 | 148 |
| 1 | down tube | Min 12 | −15.63 |
| 1 | top tube | Max 12 | 15.39 |
| Falling frame | 4 | top tube | Min 11 | −33 | 0.44 |
| 6 | down tube | Max 11 | 44 |
| 1 | top tube | Min 22 | −30 |
| 2 | head tube | Max 22 | 38 |
| 1 | top tube | Min 12 | −3.475 |
| 1 | down tube | Max 12 | 3.515 |
| Horizontal forces | 6 | down tube | Min 11 | −37 | 0.244 |
| 6 | down tube | Max 11 | 37 |
| 2 | head tube | Min 22 | −31 |
| 2 | head tube | Max 22 | 31 |
| 1 | top tube | Min 12 | −2.84 |
| 1 | top tube | Max 12 | 2.84 |
| Vertical forces | 4 | seat tube | Min 11 | −96 | 0.438 |
| 3 | seat tube | Max 11 | 96 |
| 1 | seat tube | Min 22 | −86 |
| 4 | seat tube | Max 22 | 145 |
| 1 | seat stays | Min 12 | −11 |
| 1 | seat tube | Max 12 | 11.96 |
| Pedaling forces | 1 | seat tube | Min 11 | −149 | 1.577 |
| 3 | seat tube | Max 11 | 161 |
| 1 | seat tube | Min 22 | −153 |
| 3 | seat tube | Max 22 | 155 |
| 4 | seat tube | Min 12 | −25.32 |
| 1 | seat tube | Max 12 | 23.71 |
Table 21.
Stress and displacement results of stacking scenario 3.
Table 21.
Stress and displacement results of stacking scenario 3.
| Test | Layer | Tube | Stress | MPa | Displacement (mm) |
|---|
| Drop mass | 6 | down tube | Min 11 | −287 | 1.073 |
| 2 | down tube | Max 11 | 290 |
| 1 | head tube | Min 22 | −164 |
| 1 | top tube | Max 22 | 179 |
| 1 | down tube | Min 12 | −19.48 |
| 1 | top tube | Max 12 | 16.84 |
| Falling frame | 2 | seat tube | Min 11 | −57 | 0.471 |
| 4 | down tube | Max 11 | 68 |
| 3 | seat tube | Min 22 | −37 |
| 2 | head tube | Max 22 | 37 |
| 3 | seat tube | Min 12 | −4.794 |
| 5 | seat tube | Max 12 | 6.376 |
| Horizontal forces | 6 | down tube | Min 11 | −56 | 0.251 |
| 6 | down tube | Max 11 | 56 |
| 1 | head tube | Min 22 | −33 |
| 1 | head tube | Max 22 | 33 |
| 1 | down tube | Min 12 | −3.651 |
| 1 | down tube | Max 12 | 3.651 |
| Vertical forces | 2 | seat stays | Min 11 | −154 | 0.577 |
| 5 | seat tube | Max 11 | 159 |
| 1 | seat tube | Min 22 | −96 |
| 3 | seat tube | Max 22 | 137 |
| 5 | seat tube | Min 12 | −16.94 |
| 1 | seat tube | Max 12 | 17.26 |
| Pedaling forces | 2 | seat tube | Min 11 | −250 | 1.712 |
| 2 | seat tube | Max 11 | 258 |
| 1 | seat tube | Min 22 | −199 |
| 3 | seat tube | Max 22 | 231 |
| 5 | seat tube | Min 12 | −34.78 |
| 5 | seat tube | Max 12 | 36.31 |
Table 22.
Stress and displacement results of stacking scenario 4.
Table 22.
Stress and displacement results of stacking scenario 4.
| Test | Layer | Tube | Stress | MPa | Displacement (mm) |
|---|
| Drop mass | 6 | down tube | Min 11 | −310 | 1.299 |
| 2 | down tube | Max 11 | 337 |
| 1 | head tube | Min 22 | −177 |
| 1 | top tube | Max 22 | 232 |
| 1 | down tube | Min 12 | −25.08 |
| 3 | top tube | Max 12 | 23.41 |
| Falling frame | 2 | top tube | Min 11 | −82 | 0.481 |
| 6 | down tube | Max 11 | 75 |
| 1 | top tube | Min 22 | −48 |
| 2 | head tube | Max 22 | 41 |
| 3 | seat stays | Min 12 | −5.722 |
| 5 | seat tube | Max 12 | 7.634 |
| Horizontal forces | 2 | down tube | Min 11 | −60 | 0.274 |
| 2 | down tube | Max 11 | 60 |
| 1 | top tube | Min 22 | −35 |
| 1 | top tube | Max 22 | 35 |
| 3 | top tube | Min 12 | −4.396 |
| 3 | top tube | Max 12 | 4.396 |
| Vertical forces | 2 | top tube | Min 11 | −227 | 0.686 |
| 5 | seat tube | Max 11 | 179 |
| 1 | seat tube | Min 22 | −101 |
| 3 | seat tube | Max 22 | 147 |
| 5 | seat tube | Min 12 | −18.37 |
| 1 | seat tube | Max 12 | 19.47 |
| Pedaling forces | 2 | seat tube | Min 11 | −251 | 1.75 |
| 2 | seat tube | Max 11 | 251 |
| 1 | seat tube | Min 22 | −198 |
| 3 | seat tube | Max 22 | 231 |
| 5 | seat tube | Min 12 | −34.6 |
| 5 | seat tube | Max 12 | 36.28 |
Table 23.
Stress and displacement results of stacking scenario 5.
Table 23.
Stress and displacement results of stacking scenario 5.
| Test | Layer | Tube | Stress | MPa | Displacement (mm) |
|---|
| Drop mass | 1 | head tube | Min 11 | −370 | 1.167 |
| 1 | top tube | Max 11 | 486 |
| 1 | top tube | Min 22 | −19 |
| 3 | top tube | Max 22 | 30 |
| 1 | down tube | Min 12 | −28.2 |
| 1 | top tube | Max 12 | 25.79 |
| Falling frame | 4 | seat tube | Min 11 | −125 | 0.432 |
| 1 | head tube | Max 11 | 91 |
| 7 | seat tube | Min 22 | −10 |
| 3 | top tube | Max 22 | 7 |
| 2 | seat stays | Min 12 | −6.335 |
| 1 | seat stays | Max 12 | 6.21 |
| Horizontal forces | 1 | top tube | Min 11 | −87 | 0.244 |
| 1 | top tube | Max 11 | 87 |
| 3 | top tube | Min 22 | −57 |
| 3 | top tube | Max 22 | 57 |
| 1 | top tube | Min 12 | −5.187 |
| 1 | top tube | Max 12 | 5.187 |
| Vertical forces | 3 | top tube | Min 11 | −320 | 0.545 |
| 4 | seat tube | Max 11 | 292 |
| 3 | seat stays | Min 22 | −236 |
| 7 | seat tube | Max 22 | 179 |
| 2 | seat stays | Min 12 | −14.2 |
| 3 | seat stays | Max 12 | 15.39 |
| Pedaling forces | 2 | seat tube | Min 11 | −556 | 1.652 |
| 1 | seat tube | Max 11 | 429 |
| 6 | chain stay left | Min 22 | −33 |
| 7 | seat tube | Max 22 | 43 |
| 7 | seat tube | Min 12 | −27.79 |
| 7 | seat tube | Max 12 | 29.1 |
Table 24.
Stress and displacement results of stacking scenario 6.
Table 24.
Stress and displacement results of stacking scenario 6.
| Test | Layer | Tube | Stress | MPa | Displacement (mm) |
|---|
| Drop mass | 6 | down tube | Min 11 | −383 | 1.135 |
| 2 | down tube | Max 11 | 445 |
| 1 | head tube | Min 22 | −224 |
| 1 | top tube | Max 22 | 237 |
| 1 | down tube | Min 12 | −26.35 |
| 3 | top tube | Max 12 | 20.83 |
| Falling frame | 2 | down tube | Min 11 | −99 | 0.449 |
| 6 | down tube | Max 11 | 93 |
| 1 | top tube | Min 22 | −50 |
| 1 | head tube | Max 22 | 51 |
| 3 | seat tube | Min 12 | −5.303 |
| 5 | seat tube | Max 12 | 5.882 |
| Horizontal forces | 6 | down tube | Min 11 | −75 | 0.26 |
| 6 | down tube | Max 11 | 75 |
| 1 | head tube | Min 22 | −69 |
| 1 | head tube | Max 22 | 69 |
| 1 | head tube | Min 12 | −5.909 |
| 1 | head tube | Max 12 | 5.909 |
| Vertical forces | 2 | seat stays | Min 11 | −211 | 0.429 |
| 6 | seat tube | Max 11 | 151 |
| 1 | seat tube | Min 22 | −71 |
| 5 | seat tube | Max 22 | 128 |
| 3 | seat stays | Min 12 | −11.37 |
| 1 | seat stays | Max 12 | 13.8 |
| Pedaling forces | 5 | seat tube | Min 11 | −305 | 1.539 |
| 5 | seat tube | Max 11 | 350 |
| 1 | seat tube | Min 22 | −250 |
| 3 | seat tube | Max 22 | 240 |
| 5 | seat tube | Min 12 | −26.26 |
| 5 | seat tube | Max 12 | 26.66 |
Table 25.
Stress and displacement results of stacking scenario 7.
Table 25.
Stress and displacement results of stacking scenario 7.
| Test | Layer | Tube | Stress | MPa | Displacement (mm) |
|---|
| Drop mass | 6 | down tube | Min 11 | −339 | 1.023 |
| 2 | down tube | Max 11 | 348 |
| 1 | head tube | Min 22 | −177 |
| 1 | top tube | Max 22 | 212 |
| 1 | down tube | Min 12 | −20.68 |
| 3 | top tube | Max 12 | 19.05 |
| Falling frame | 2 | top tube | Min 11 | −88 | 0.436 |
| 6 | down tube | Max 11 | 81 |
| 3 | seat tube | Min 22 | −46 |
| 1 | head tube | Max 22 | 40 |
| 3 | seat stays | Min 12 | −5.152 |
| 5 | seat tube | Max 12 | 5.798 |
| Horizontal forces | 6 | down tube | Min 11 | −70 | 0.236 |
| 6 | down tube | Max 11 | 70 |
| 1 | top tube | Min 22 | −37 |
| 1 | top tube | Max 22 | 37 |
| 3 | top tube | Min 12 | −3.812 |
| 3 | top tube | Max 12 | 3.812 |
| Vertical forces | 2 | seat stays | Min 11 | −236 | 0.587 |
| 5 | seat tube | Max 11 | 197 |
| 1 | seat tube | Min 22 | −104 |
| 3 | seat tube | Max 22 | 153 |
| 5 | seat tube | Min 12 | −13.83 |
| 1 | seat tube | Max 12 | 16.46 |
| Pedaling forces | 5 | seat tube | Min 11 | −306 | 1.537 |
| 5 | seat tube | Max 11 | 357 |
| 1 | seat tube | Min 22 | −250 |
| 3 | seat tube | Max 22 | 240 |
| 5 | seat tube | Min 12 | −26.3 |
| 5 | seat tube | Max 12 | 26.61 |
Table 26.
Stress and displacement results of stacking scenario 8.
Table 26.
Stress and displacement results of stacking scenario 8.
| Test | Layer | Tube | Stress | MPa | Displacement (mm) |
|---|
| Drop mass | 6 | down tube | Min 11 | −385 | 0.723 |
| 2 | down tube | Max 11 | 456 |
| 1 | head tube | Min 22 | −226 |
| 1 | top tube | Max 22 | 240 |
| 1 | down tube | Min 12 | −27.64 |
| 1 | top tube | Max 12 | 16.31 |
| Falling frame | 2 | down tube | Min 11 | −102 | 0.321 |
| 6 | down tube | Max 11 | 94 |
| 3 | seat tube | Min 22 | −57 |
| 1 | head tube | Max 22 | 51 |
| 3 | seat tube | Min 12 | −5.905 |
| 5 | seat tube | Max 12 | 6.312 |
| Horizontal forces | 6 | down tube | Min 11 | −77 | 0.257 |
| 6 | down tube | Max 11 | 77 |
| 1 | head tube | Min 22 | −45 |
| 1 | head tube | Max 22 | 45 |
| 1 | down tube | Min 12 | −4.613 |
| 1 | down tube | Max 12 | 4.613 |
| Vertical forces | 2 | seat tube | Min 11 | −234 | 0.748 |
| 5 | seat tube | Max 11 | 241 |
| 1 | seat tube | Min 22 | −123 |
| 3 | seat tube | Max 22 | 192 |
| 5 | seat tube | Min 12 | −17.45 |
| 1 | seat tube | Max 12 | 19.95 |
| Pedaling forces | 5 | seat tube | Min 11 | −304 | 1.536 |
| 5 | seat tube | Max 11 | 348 |
| 1 | seat tube | Min 22 | −250 |
| 3 | seat tube | Max 22 | 240 |
| 5 | seat tube | Min 12 | −26.22 |
| 5 | seat tube | Max 12 | 26.65 |
Table 27.
Stress and displacement results of stacking scenario 9.
Table 27.
Stress and displacement results of stacking scenario 9.
| Test | Layer | Tube | Stress | MPa | Displacement (mm) |
|---|
| Drop mass | 8 | down tube | Min 11 | −229 | 0.556 |
| 2 | down tube | Max 11 | 180 |
| 7 | down tube | Min 22 | −106 |
| 1 | top tube | Max 22 | 106 |
| 1 | down tube | Min 12 | −10.53 |
| 5 | top tube | Max 12 | 11.93 |
| Falling frame | 2 | down tube | Min 11 | −42 | 0.384 |
| 8 | down tube | Max 11 | 55 |
| 8 | seat tube | Min 22 | −24 |
| 7 | down tube | Max 22 | 26 |
| 5 | down tube | Min 12 | −2.634 |
| 1 | down tube | Max 12 | 2.396 |
| Horizontal forces | 8 | down tube | Min 11 | −55 | 0.176 |
| 8 | down tube | Max 11 | 55 |
| 7 | down tube | Min 22 | −26 |
| 7 | down tube | Max 22 | 26 |
| 5 | top tube | Min 12 | −2.733 |
| 5 | top tube | Max 12 | 2.733 |
| Vertical forces | 2 | seat tube | Min 11 | −234 | 0.797 |
| 5 | seat tube | Max 11 | 241 |
| 1 | seat tube | Min 22 | −123 |
| 3 | seat tube | Max 22 | 191 |
| 5 | seat tube | Min 12 | −17.42 |
| 1 | seat tube | Max 12 | 19.97 |
| Pedaling forces | 2 | seat tube | Min 11 | −212 | 1.097 |
| 9 | seat tube | Max 11 | 274 |
| 1 | seat tube | Min 22 | −174 |
| 8 | seat tube | Max 22 | 153 |
| 1 | seat tube | Min 12 | −15.02 |
| 8 | seat tube | Max 12 | 12.13 |
Table 28.
Stress and displacement results of stacking scenario 10.
Table 28.
Stress and displacement results of stacking scenario 10.
| Test | Layer | Tube | Stress | MPa | Displacement (mm) |
|---|
| Drop mass | 1 | head tube | Min 11 | −362 | 1.501 |
| 1 | top tube | Max 11 | 470 |
| 1 | head tube | Min 22 | −29 |
| 1 | top tube | Max 22 | 43 |
| 1 | down tube | Min 12 | −33.34 |
| 1 | top tube | Max 12 | 33.28 |
| Falling frame | 1 | top tube | Min 11 | −108 | 0.445 |
| 1 | head tube | Max 11 | 89 |
| 7 | seat tube | Min 22 | −15 |
| 3 | top tube | Max 22 | 9 |
| 1 | top tube | Min 12 | −3.568 |
| 3 | seat tube | Max 12 | 3.257 |
| Horizontal forces | 1 | top tube | Min 11 | −75 | 0.289 |
| 1 | top tube | Max 11 | 75 |
| 3 | top tube | Min 22 | −7 |
| 3 | top tube | Max 22 | 7 |
| 1 | top tube | Min 12 | −6.215 |
| 1 | top tube | Max 12 | 6.215 |
| Vertical forces | 3 | seat stays | Min 11 | −307 | 0.648 |
| 4 | seat tube | Max 11 | 277 |
| 3 | seat stays | Min 22 | −27 |
| 7 | seat tube | Max 22 | 39 |
| 7 | seat tube | Min 12 | −20.86 |
| 7 | seat tube | Max 12 | 19.08 |
| Pedaling forces | 2 | seat tube | Min 11 | −442 | 1.92 |
| 2 | seat tube | Max 11 | 408 |
| 6 | chain stay left | Min 22 | −46 |
| 7 | seat tube | Max 22 | 50 |
| 7 | seat tube | Min 12 | −50.4 |
| 7 | seat tube | Max 12 | 55.65 |
Table 29.
Weight of each stacking recipe.
Table 29.
Weight of each stacking recipe.
| Stacking Recipe | Weight (gr) |
|---|
| M46J Woven quasi-isotropic | 615 |
| T300 Woven quasi-isotropic | 615 |
| Stacking scenario 1 | 805 |
| Stacking scenario 2 | 910 |
| Stacking scenario 3 | 835 |
| Stacking scenario 4 | 810 |
| Stacking scenario 5 | 1145 |
| Stacking scenario 6 | 810 |
| Stacking scenario 7 | 810 |
| Stacking scenario 8 | 780 |
| Stacking scenario 9 | 1180 |
| Stacking scenario 10 | 1145 |


