Article

Correlation Stability Problem in Selecting Temperature-Sensitive Points of CNC Machine Tools

1
School of Automation, Xi’an University of Posts & Telecommunications, Chang’an West St. Chang’an District, Xi’an 710121, China
2
College of Mechanical Engineering, Chongqing University of Technology, Chongqing 400054, China
*
Author to whom correspondence should be addressed.
Machines 2022, 10(2), 132; https://doi.org/10.3390/machines10020132
Submission received: 4 January 2022 / Revised: 29 January 2022 / Accepted: 5 February 2022 / Published: 12 February 2022

Abstract

:
In the thermal-error compensation of CNC machine tools, temperature-sensitive points (TSPs) are used for predicting thermal error and need to have a high correlation with the thermal error. The stability of the correlation between TSPs and the thermal error is the key to long-term prediction accuracy. In this paper, the uncertainty-calculation method of the correlation coefficient is proposed to measure the stability of the correlation, and the reasons that affect the stability of the correlation of TSPs are analyzed. Then, the uncertainty-correlation coefficient is proposed, which can comprehensively evaluate the correlation and the stability of the correlation between TSPs and the thermal error. Through long-term experimental verifications, compared with the current TSP selection algorithm, the uncertainty-correlation coefficient can help to select a more stable TSP and improve the long-term prediction accuracy of the thermal error.

1. Introduction

During the working process of the CNC machine tool, the thermal deformation of the structure will cause the tools to move, resulting in thermal error. The influence of the thermal error on machine-tool accuracy cannot be ignored [1,2]. Thermal-error compensation is a widely used method for solving the thermal error problem. The principle is to send the thermal error into the CNC system as a feedback signal. Then the CNC system controls the tool to move the same value in the opposite direction of the thermal error to achieve compensation [3]. The origin offset function is a built-in module of the CNC system of the machine tool that can automatically complete the entire compensation process without affecting the normal processing of the machine tool [4,5]. Therefore, the focus of thermal-error compensation is how to obtain accurate thermal error values during machining. In the machining process of machine tools, it is difficult to install sensors to measure high-speed rotating tools, and it is necessary to use temperature to predict thermal error. Therefore, how to establish an accurate model between the temperature and thermal error is the key to thermal-error compensation. Typically, the model is called a thermal-error-compensation model.
The thermal error originates from the thermal deformation of the machine tool’s structure, so some studies have used FEM to simulate thermal deformation. Through FEM simulation, Ni [6] found that, if a constraint is imposed on the front end of the spindle (near the tool), and the rear end is kept free to expand, the thermal deformation can be guided to the rear end of the spindle, thereby reducing the thermal deformation at the tool position. Wang [7] analyzed the spindle deformation caused by cutting force and temperature through FEM simulation and found that thermal deformation accounts for 90%, so the thermal error is the main error source of the machine tool. Wei [8] analyzed the thermal deformation of the shaft components in the axial direction and found that the temperature points that maintain a linear relationship with the thermal error are more stable for thermal-error prediction. The generation mechanism of the thermal error can be deeply analyzed through simulation, but due to the complexity of the overall structure of the machine tool, the current research can only simulate a certain part of the machine tool, and some necessary simplifications need to be made in the simulation. The simulation of a certain part cannot reflect the influence of the assembly method on thermal deformation, and simplification may cause simulation errors. At present, the simulation can only provide qualitative conclusions and cannot quantitatively calculate the thermal error of the machine tool. Therefore, the data-driven method is often used in thermal-error-compensation modeling. This method needs to install sensors to measure the thermal error and the temperature of multiple points near the heat source of the machine tool during the idling state. Then a thermal error compensation model can be built based on the measurement data [9,10]. The thermal-error-measurement method refers to the international standard ISO230-3 [11]. It obtains the tool-position change by measuring the repeated positioning error of the machine tool after heating, that is, the thermal error. This method is well-established and commonly used in the current research [12,13,14]. Since the machine tool cannot work during thermal-error measurement, frequent measurements can lead to a significant reduction in machining efficiency. Furthermore, the accuracy of the model needs to be stable for a long time. Therefore, existing research focuses on the modeling algorithm, which needs to be selected according to the thermal-error characteristics. Usually, the relationship between the thermal error and temperature is mainly linear, so multiple linear regression is a commonly used modeling algorithm [15,16]. Neural network algorithms are often used to fit the nonlinear relationship between thermal error and temperature [17,18]. There are also studies that use the LSTM algorithm to model thermal error lags relative to temperature [19]. Although a highly nonlinear model can achieve higher fitting accuracy, it is also easier to fit the interference information of nonlinear components into the model, resulting in overfitting. Therefore, when the operating environment of the machine tool is more complex, the stability of the prediction accuracy of the linear model is better [20].
In addition to modeling algorithms, temperature is a source of information for model predictions of thermal errors. Therefore, if the temperature measurement points are not properly selected, it is impossible to provide effective temperature information for thermal-error prediction, and an effective thermal-error-compensation model cannot be established only by modeling algorithms. Therefore, it is very important to select reasonable temperature measurement points as the model input. The selected temperature points are usually called temperature-sensitive points (TSPs). Lo [21] proposed a selection strategy of correlation ranking and clustering. First, the initial temperature measurement points are grouped; then, from each group, one of the highest correlations with the thermal error is selected as the TSP. In this way, the cluster can solve the collinearity problem of TSPs and reduce the probability of overfitting of the thermal-error-compensation model [22]. Most studies have followed this strategy. Abdulshahed [23] and Miao [24] used the fuzzy clustering algorithm for grouping and used gray correlation to calculate the correlation between temperature measurement points and thermal error. Li [25], Fu [26], Zhang [27], and Yin [28] used the fuzzy clustering algorithm for grouping and used the correlation coefficient to calculate the correlation between temperature measurement points and the thermal error. The difference between the above research lies in the modeling algorithm. The most commonly used modeling algorithms are multiple regression and neural network. This study focuses on the selection of TSPs, so the modeling algorithm is not discussed in depth. Liu [20] found that the temperature measurement points that have a strong correlation with thermal errors often have high collinearity, so they will be grouped into the same group, and then the correlation between the thermal error and TSPs selected in the other groups is weak. TSPs with weak correlations will introduce a large amount of interference in the thermal error compensation model, and this will greatly reduce the long-term prediction accuracy of thermal errors. Furthermore, in Reference [20], TSPs were directly selected by correlation ranking without the clustering, and ridge regression was used to solve the collinearity problem, which greatly improved the long-term stability of the thermal-error-prediction accuracy.
In summary, the high correlation with the thermal error is the key to selecting TSPs. A premise of the existing research is that the correlation-coefficient calculation result is credible. However, is it really credible? Existing research shows that abnormal data will interfere with the calculation results of correlation coefficients. Additionally, the interference of abnormal data can be reduced by improving the calculation method of the correlation coefficient. Niven [29] proposed the LOOT correlation coefficient in which the test data are expanded into multiple segments through re-sampling, and the correlation coefficient of each segment is calculated; finally, the weighted average is calculated as the result of the correlation coefficient. The Spearman correlation coefficient [30] and Kendall correlation coefficient [31] are rank correlation coefficients, and the correlation is calculated by sorting the data. The above research can solve the calculation error of the correlation coefficient caused by the abnormal data. However, for thermal errors, the instability problem is another reason why the correlation between the thermal error and temperature measurement points is not credible. Temperature measurement points will be affected by a variety of heat sources, such as changes in ambient temperature and temperature changes caused by human activities [32]. There is no guarantee that the influence of these heat sources on the thermal error is stable, nor can it be guaranteed that the correlation calculation result of measurement data is stable [33].
Through a large number of experiments, this study found that the unstable temperature measurement points cannot maintain a long-term high correlation with thermal errors. If they are selected as TSPs, a large amount of interference information will be introduced into the thermal error compensation model, resulting in a rapid decline in the accuracy of thermal error prediction. This paper analyzes the temperature characteristics of unstable temperature measurement points and proposes the uncertainty calculation method of the correlation coefficient to measure the stability of the correlation. Then, combined with the correlation coefficient, a new correlation calculation method is proposed, which is called the uncertainty-correlation coefficient in this article. This algorithm enables a comprehensive evaluation of the correlation and the stability of the correlation. Therefore, during the selection of TSPs, unstable temperature measurement points that are temporarily correlated with thermal errors can be filtered out, so as to improve the stability of TSPs. After a large number of experimental verifications, compared with the current TSP selection method and the current correlation calculation method, the uncertainty-correlation coefficient can select better TSPs, which can improve the thermal-error-prediction accuracy and the long-term stability of the prediction accuracy.

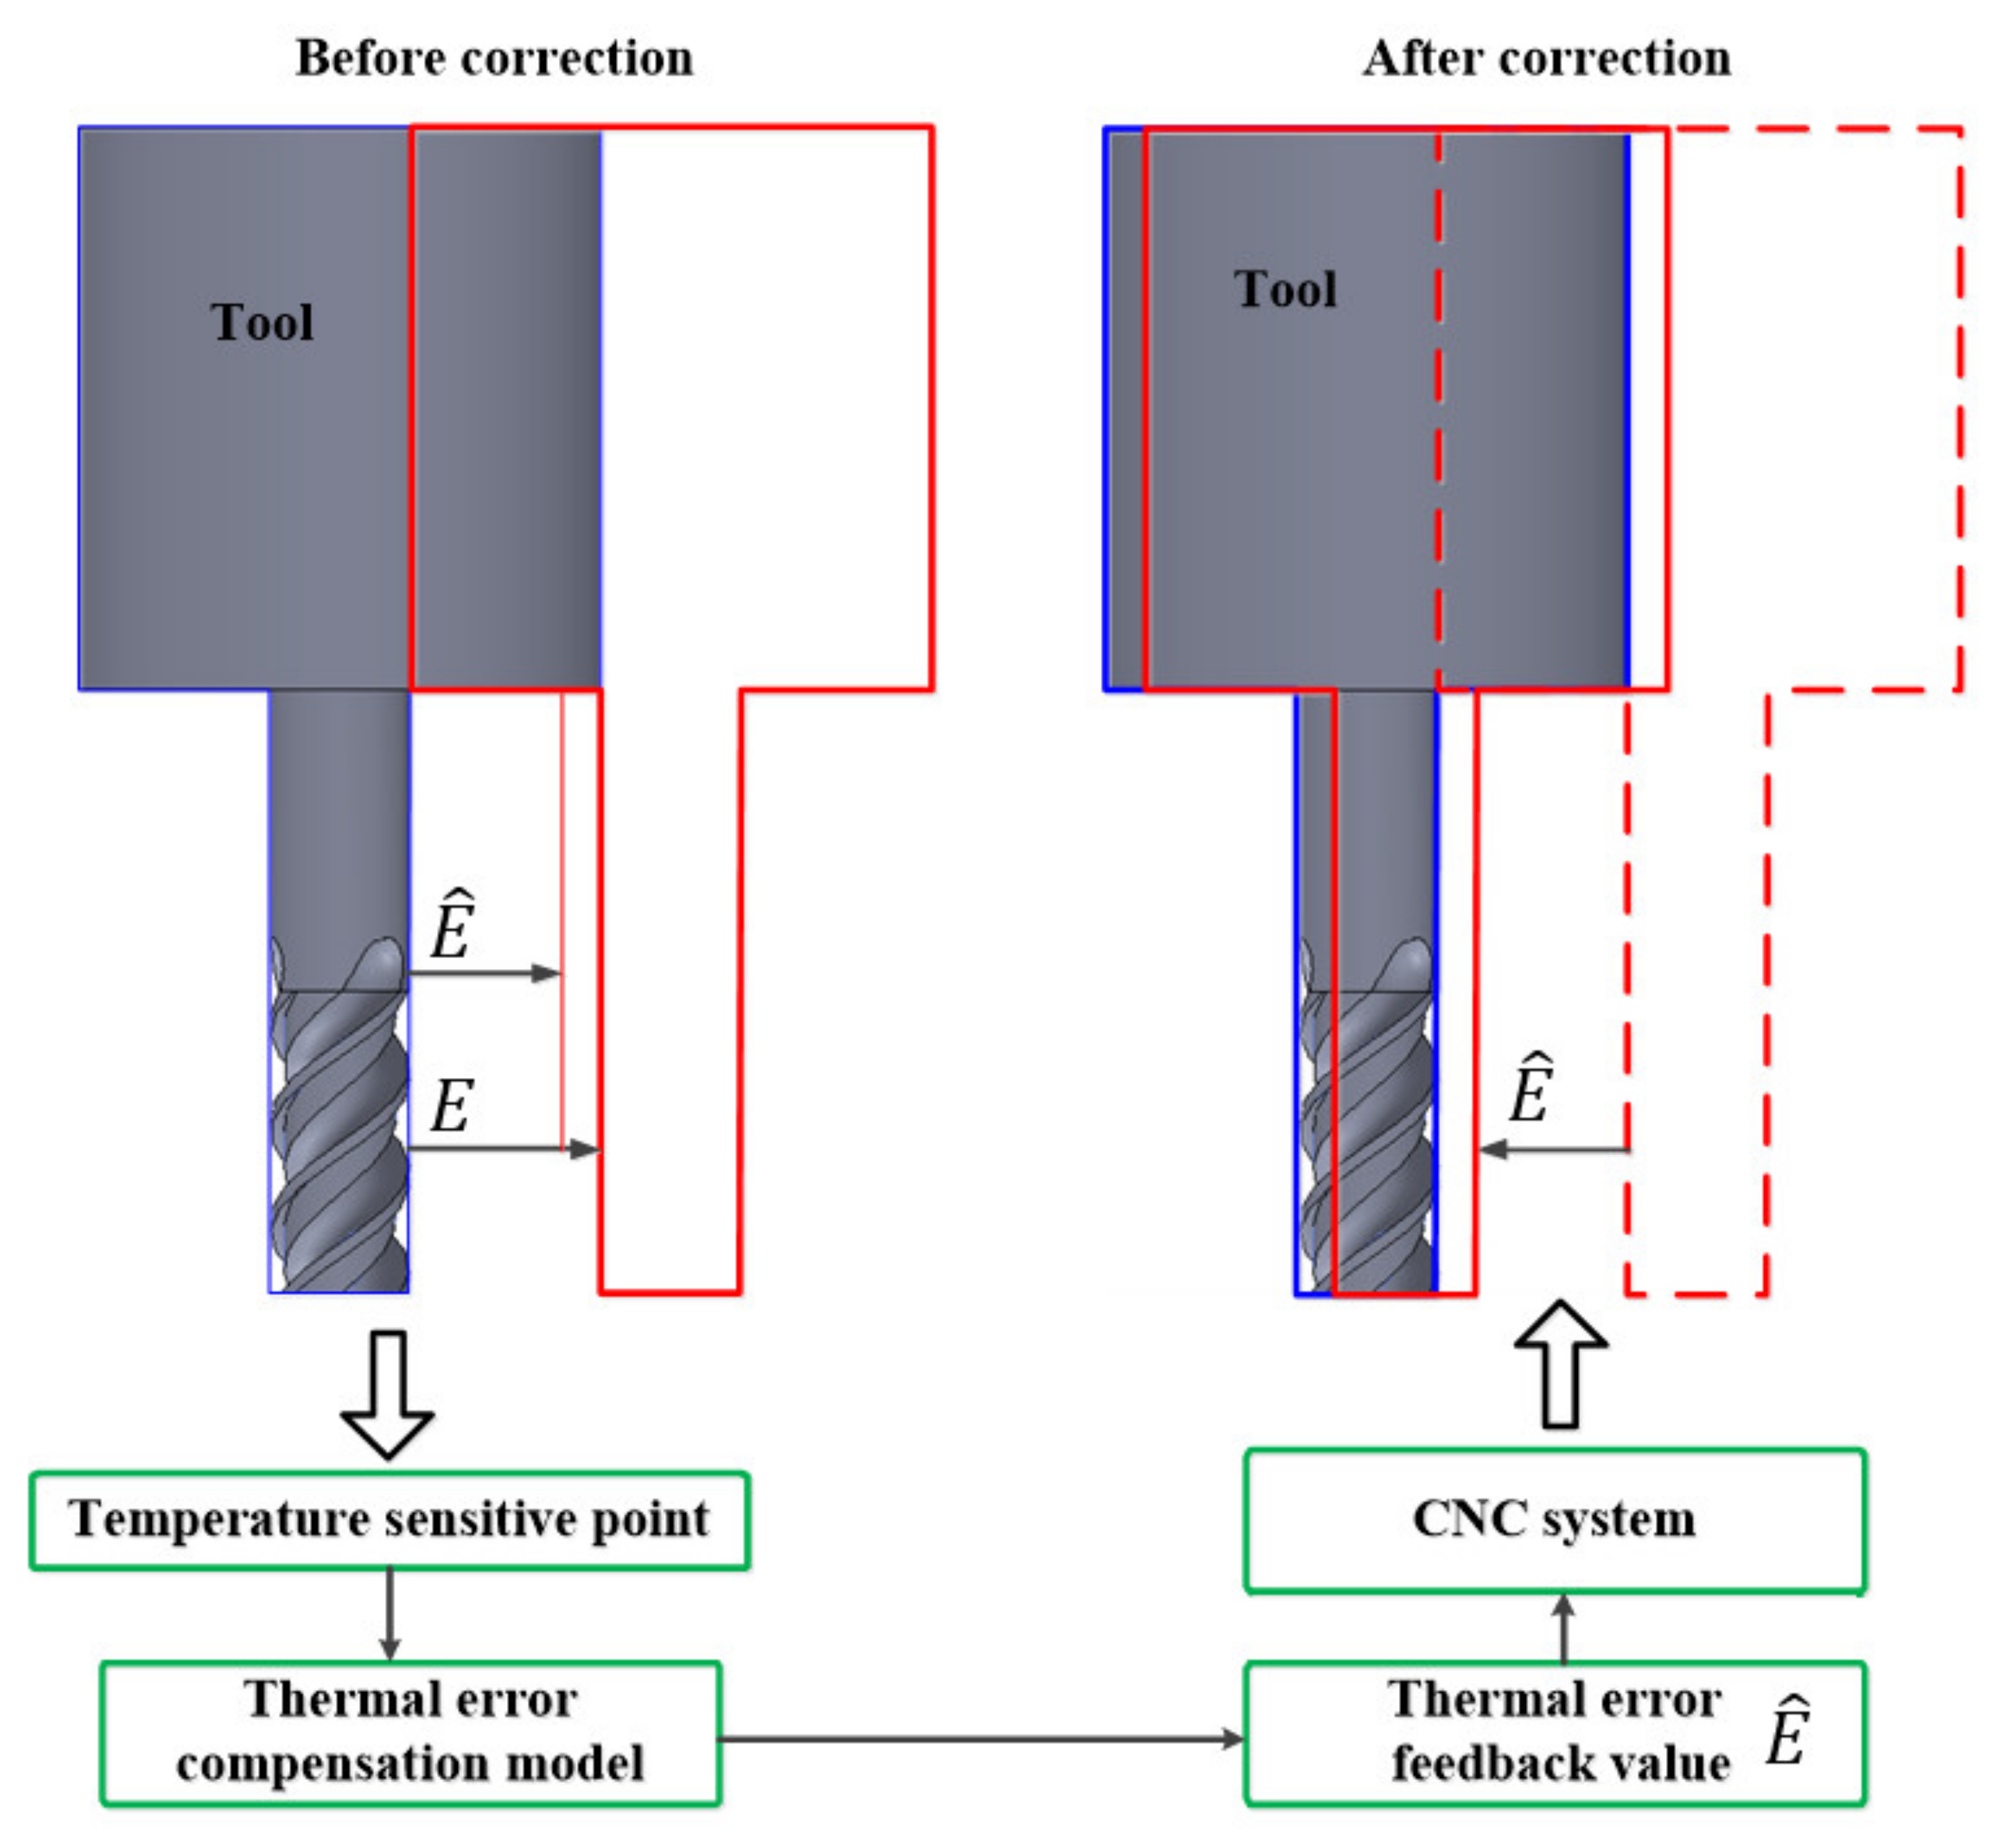
2. Principle of Thermal Error Compensation

Figure 1 shows the working principle of the thermal-error compensation. Thermal errors will cause the tool to deviate from the ideal position and cause machining errors.
After the thermal error ( E ) occurs, the thermal-error-compensation model is used to predict the thermal error based on the TSPs. Then the predicted value is used as the feedback control signal ( E ^ ) and is sent to the CNC system. Finally, the CNC system controls the tool to move the same value in the opposite direction of the thermal error, thus reducing the thermal error.
The accuracy of thermal-error compensation depends only on the prediction accuracy of the thermal-error-compensation model. Figure 2 shows the principle of the data-driven method to establish a thermal-error-compensation model.
As seen in Figure 2, first operate the machine tool to run in an idling state. Second, the thermal error and initial temperature points are simultaneously measured. Third, the TSPs are selected as model input, and the output is the thermal error. Finally, the thermal-error-compensation model is established according to the measured data. The thermal-error-measurement method refers to the international standard [11]. The principle is to measure the repeated positioning error of the machine tool after heating. First, replace the tool with a test bar and install displacement sensors around the bar. Then measure the position change in the test bar when the machine tool moves to the same coordinate after heating up. When the thermal error is not considered, the repeated positioning accuracy of machine tools is high [34], so this method can guarantee the accuracy of the thermal error measurement.

3. Correlation-Stability Problem in TSP Selection

The key step in the selection of TSPs is to calculate the correlation between the thermal error and each temperature measurement point. However, this study found that the correlation between some temperature measurement points and the thermal error is not stable, especially the measurement points with small temperature changes. This article has elaborated on the theoretical analysis of this and proposed the uncertainty calculation method of the correlation coefficient to measure the stability of the correlation. Finally, the uncertainty-correlation coefficient calculation method is proposed to select more stable TSPs.

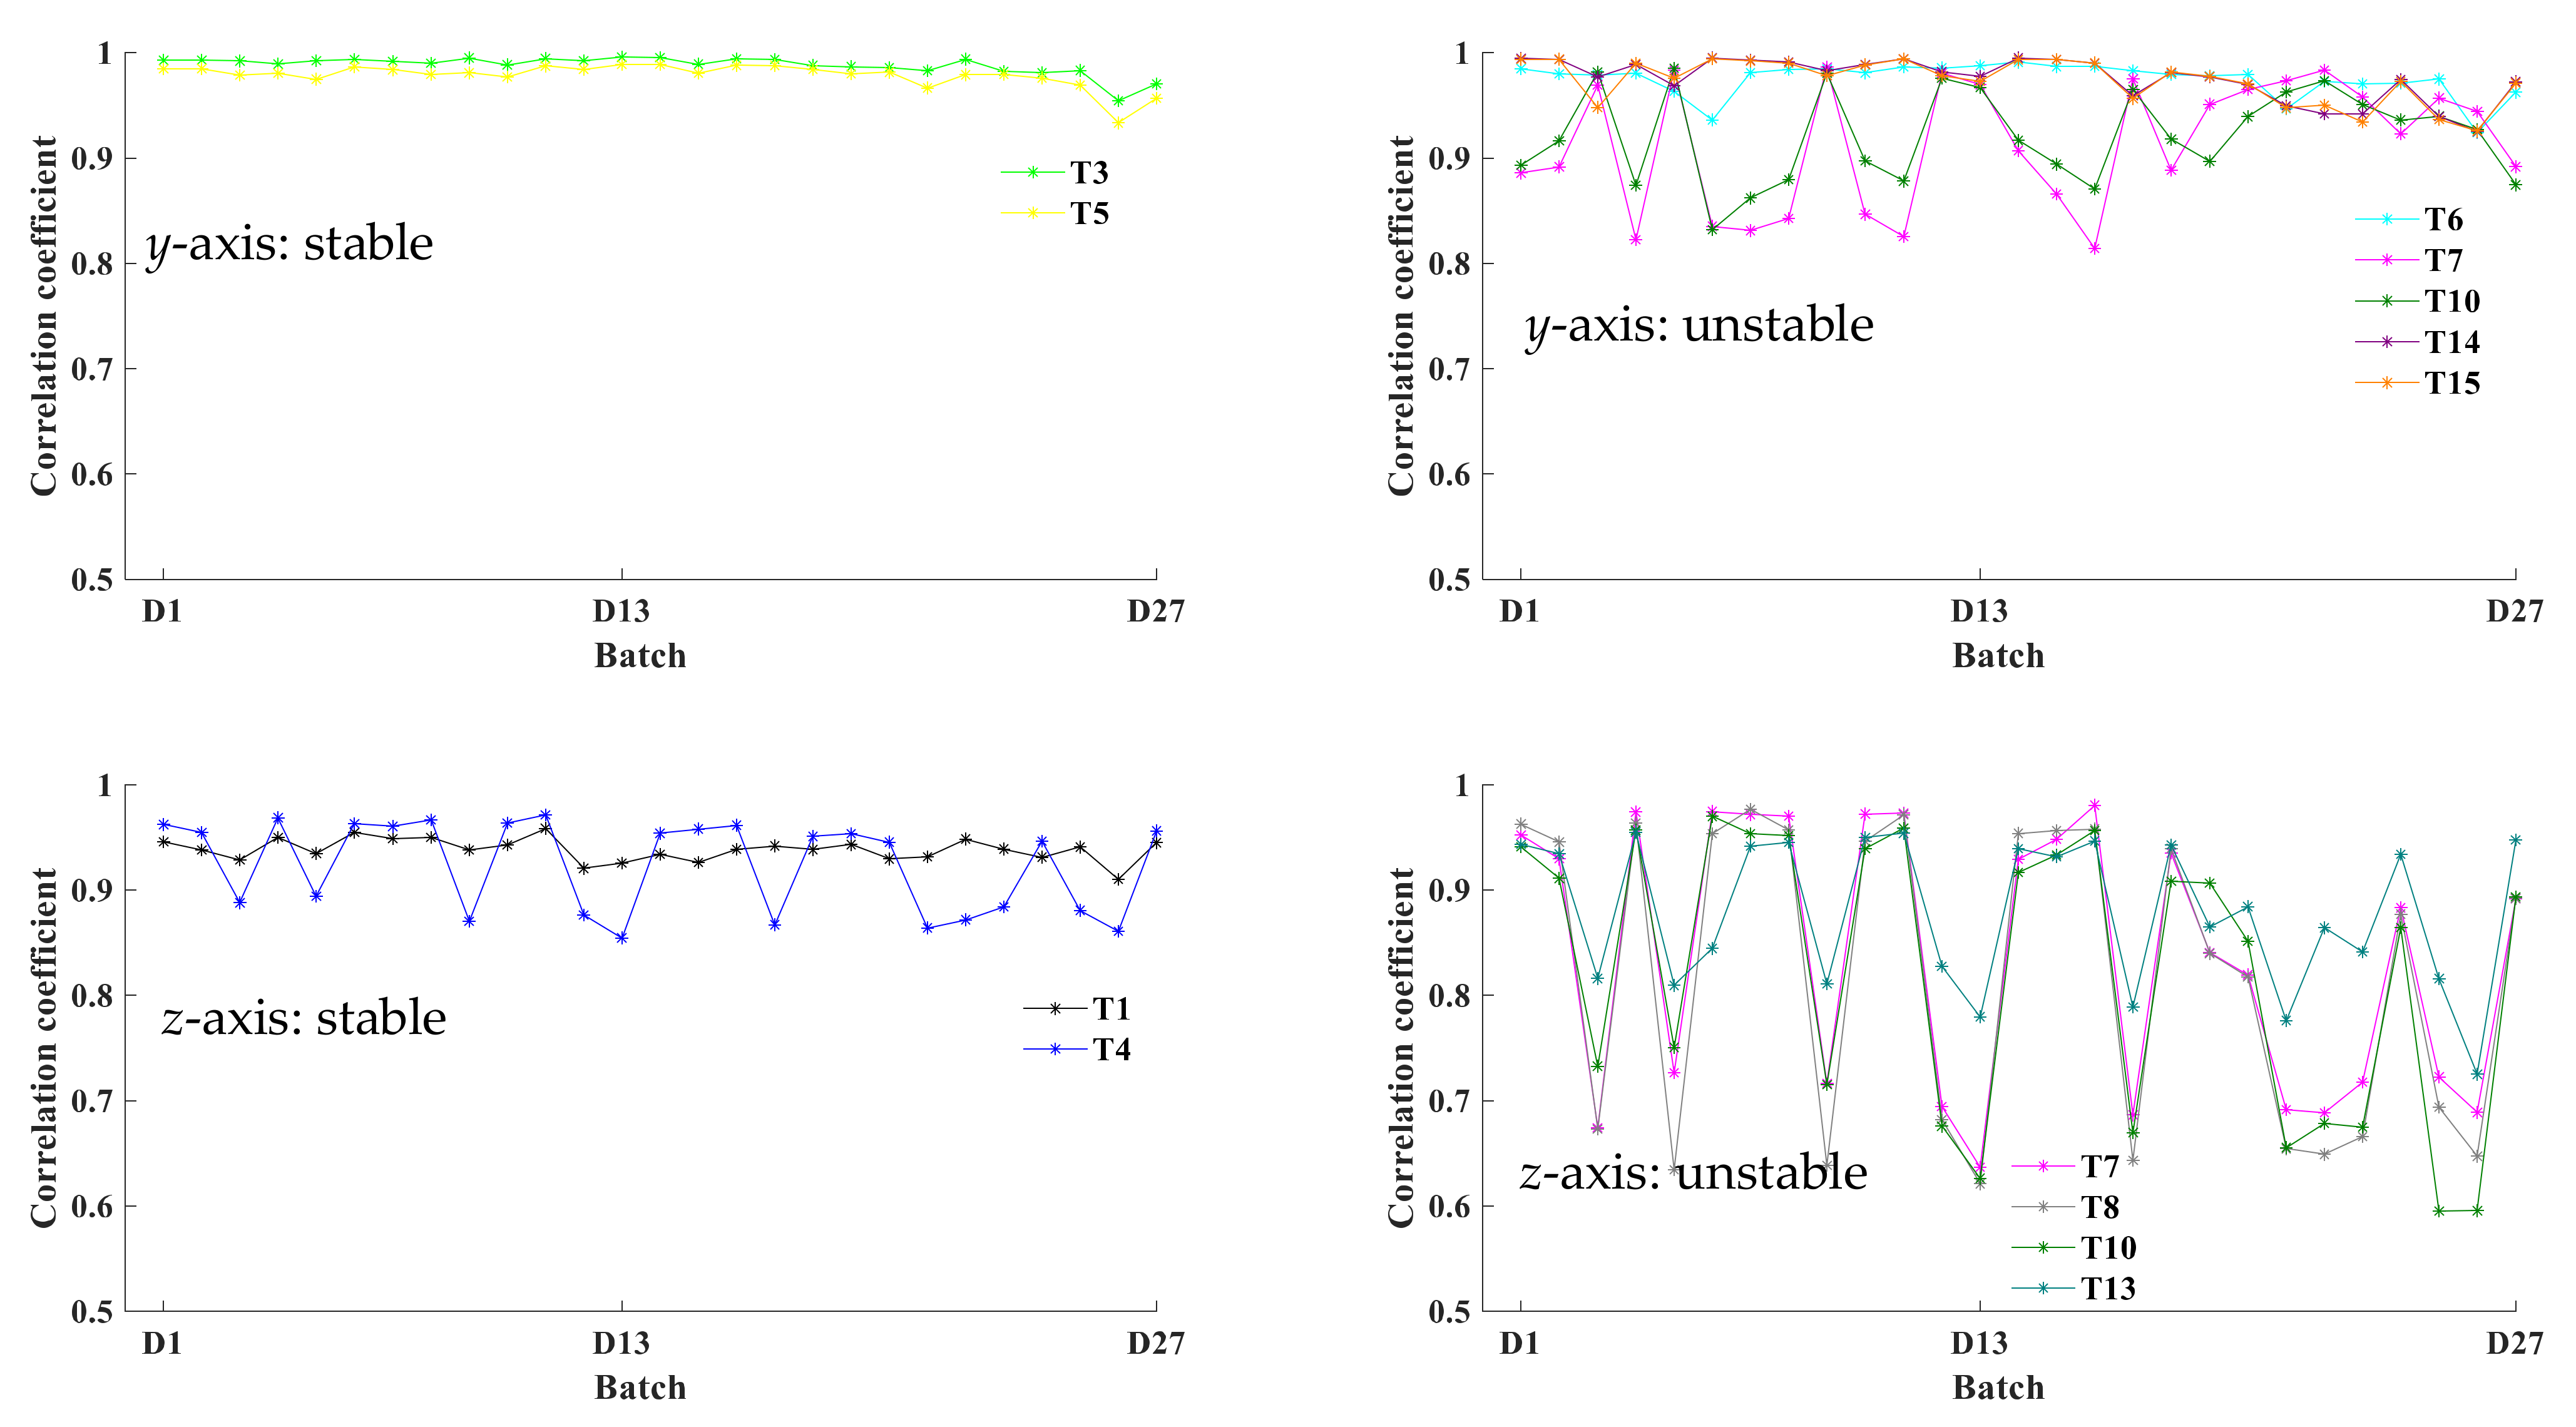
3.1. Analysis of Correlation Stability of TSPs

Theorem 1.
During the measurement period, the smaller the change in the two variables  X   a n d   Y , the more sensitive the correlation is to the change. The premise is that the data of the variable meet the condition (2).
X and Y are the measurement values of the x ,   y .
X = x 1 , x 2 , , x N Y = y 1 , y 2 , , y N
Define
X   * = x 1 * , x 2 * , , x N * = x 1 , x 2 , , x N x ¯ Y   * = y 1 * , y 2 * , , y N * = y 1 , y 2 , , y N y ¯
where x ¯ and y ¯ represent the average of the data x 1 , x 2 , , x N and y 1 , y 2 , , y N , respectively. x k *   a n d   y k * represent the change in x k *   a n d   y k * , respectively. X   * and Y   * represent the change in the spatial direction of the vectors X * and Y * due to x k * and y k * ,respectively.
L X > x k * x k * + 2 x k * 2 0 < X   * < 180 ° f o r   v a r i a b l e s   X L y > y k * y k * + 2 y k * 2 0 < Y   * < 180 ° f o r   v a r i a b l e s   Y
where
L X = k = 1 n x k * 2 ,     L y = k = 1 n y k * 2
Proof. 
The correlation coefficient ρ X Y between variables X and Y is shown in (4).
ρ X Y = k = 1 n x k x ¯ y k y ¯ k = 1 n x k x ¯ 2 k = 1 n y k y ¯ 2
The correlation coefficient represents the angle between the vectors X   * and Y   * . Therefore, evaluating the influence of interference on the angle of the vectors is equivalent to evaluating the influence on the correlation coefficient.
If the changes in data X and Y are very small during the measurement, the elements in the vectors X   * and Y   * are close to 0. Moreover, if the spatial direction of one vector changes due to interference, the angle between the two vectors will change too. Then the influence of interference on the angle between two vectors is equivalent to evaluating the influence of interference on the direction of one vector.
Take the variable X as an example. Suppose that an element in the vector X   * , such as x k * , becomes x k * + x k * under interference; then the cosine of the angle of the vector X   * changes, as in (5).
c o s X   * = L X + x k * x k * L X x k * 2 + 2 x k * x k * + L X
L X represents the modulus of the vector X   * ; the closer the element in X   * is to 0, the smaller the L X is. Find the derivative of c o s X   * with respect to L X , as in (6).
d   c o s X   * d L X = x 1 * 2 L X x k * x k * 2 x k * 2 L X 2 + L X x k * 2 + 2 L X x k * x k * 3 2
According to (6), if the conditions (2) are met, the Formula (6) is greater than 0 ( c o s X   * is proportional to L X ), and c o s X   * is inversely proportional to X   * ; it can be obtained that X   * is inversely proportional to L X .
Similarly, the proof for variable Y is the same as for X.
Therefore, if the conditions (2) are met and the changes in data X and Y are small during the measurement, the correlation coefficient is easily affected by interference. □
For thermal-error experiments in this study, the length of each measurement datum is long, meaning that it is easy to meet the conditions (2). Therefore, if the change in a temperature point during the measurement is small, the correlation between this temperature point and the thermal error will become very sensitive to the interference. For a temperature point, the interference is not only due to random errors, but also includes the influence of other heat sources. If the interference shows the same trend as the thermal error in the experimental data, it will cause the calculation result of the correlation coefficient to increase. Therefore, if a temperature point changes slightly, it not only causes the correlation coefficient to decrease, but also makes the correlation coefficient unstable.

3.2. Uncertainty-Correlation Coefficient

If the correlation coefficient is high, this might be caused by the instability of the calculation results. Therefore, this paper proposes the use of uncertainty to measure the stability of the correlation coefficient. According to the synthesis method of uncertainty [35], the calculation method is as follows (7).
U ρ X Y = U y * 2 k = 1 n ρ X Y y k * 2 + U x * 2 k = 1 n ρ X Y x k * 2
where
ρ X Y x k * = y k * j = 1 , j k n x j * 2 j = 1 n y j * 2 x k * j = 1 n x j * y j * j = 1 n y j * 2 j = 1 n x j * 2 j = 1 n x j * 2 j = 1 n y j * 2
ρ X Y y k * = x k * j = 1 , j k n y j * 2 j = 1 n x j * 2 y k * j = 1 n x j * y j * j = 1 n x j * 2 j = 1 n y j * 2 j = 1 n x j * 2 j = 1 n y j * 2
U y *   and   U x * represent the measurement uncertainty of the sensor to the variables x   and   y , respectively. For temperature sensors, the uncertainty is 1 °C. For the eddy current sensor used for thermal-error measurement, the uncertainty is 2 μm. The higher the uncertainty, the lower the stability of the calculation results.
To improve the stability of the correlation coefficient, the correlation coefficient and the uncertainty are combined, and this combination is called the uncertainty-correlation coefficient in this article.
ρ U X Y = ρ X Y 1 + η · U ρ X Y
where η 0   is the weight of the uncertainty in the calculation. For the machine-tool thermal error and temperature-measurement data, in addition to the sensor error, the random variation of some factors, such as the ambient temperature and machine-operating parameters, is also the reason for the uncertainty of the correlation coefficient. There are many factors involved in this part. The ambient temperature is related to unpredictable factors, such as climate change and human activities. The operating parameters of the machine tool can affect the heat-generation characteristics of the machine tool, thereby affecting the thermal error by changing the thermal-deformation characteristics of the structure. Research on this is very difficult. As the structure of the machine tool is too complex, the current related research only simulates part of the structure of the machine tool, and some assumptions need to be made. As a result, the research on thermal deformation can draw some qualitative conclusions, but it is difficult to apply quantitatively [6,7,8]. Therefore, the effects of random changes in factors cannot be accurately calculated. When calculating the uncertainty-correlation coefficient, this paper chooses η = 2 ; that is, the uncertainty caused by the sensor error is doubled to cover the influence of random changes in factors. Through experiments, the stable TSPs can be selected by η = 2 (see Section 5.2). The uncertainty-correlation coefficient is between [−1, 1], which is proportional to the correlation coefficient and inversely proportional to the uncertainty. If the uncertainty increases, the uncertainty-correlation coefficient will decrease. Therefore, when the uncertainty-correlation coefficient is used for the selection of TSPs, the temperature measurement points with stable correlation will be selected first.

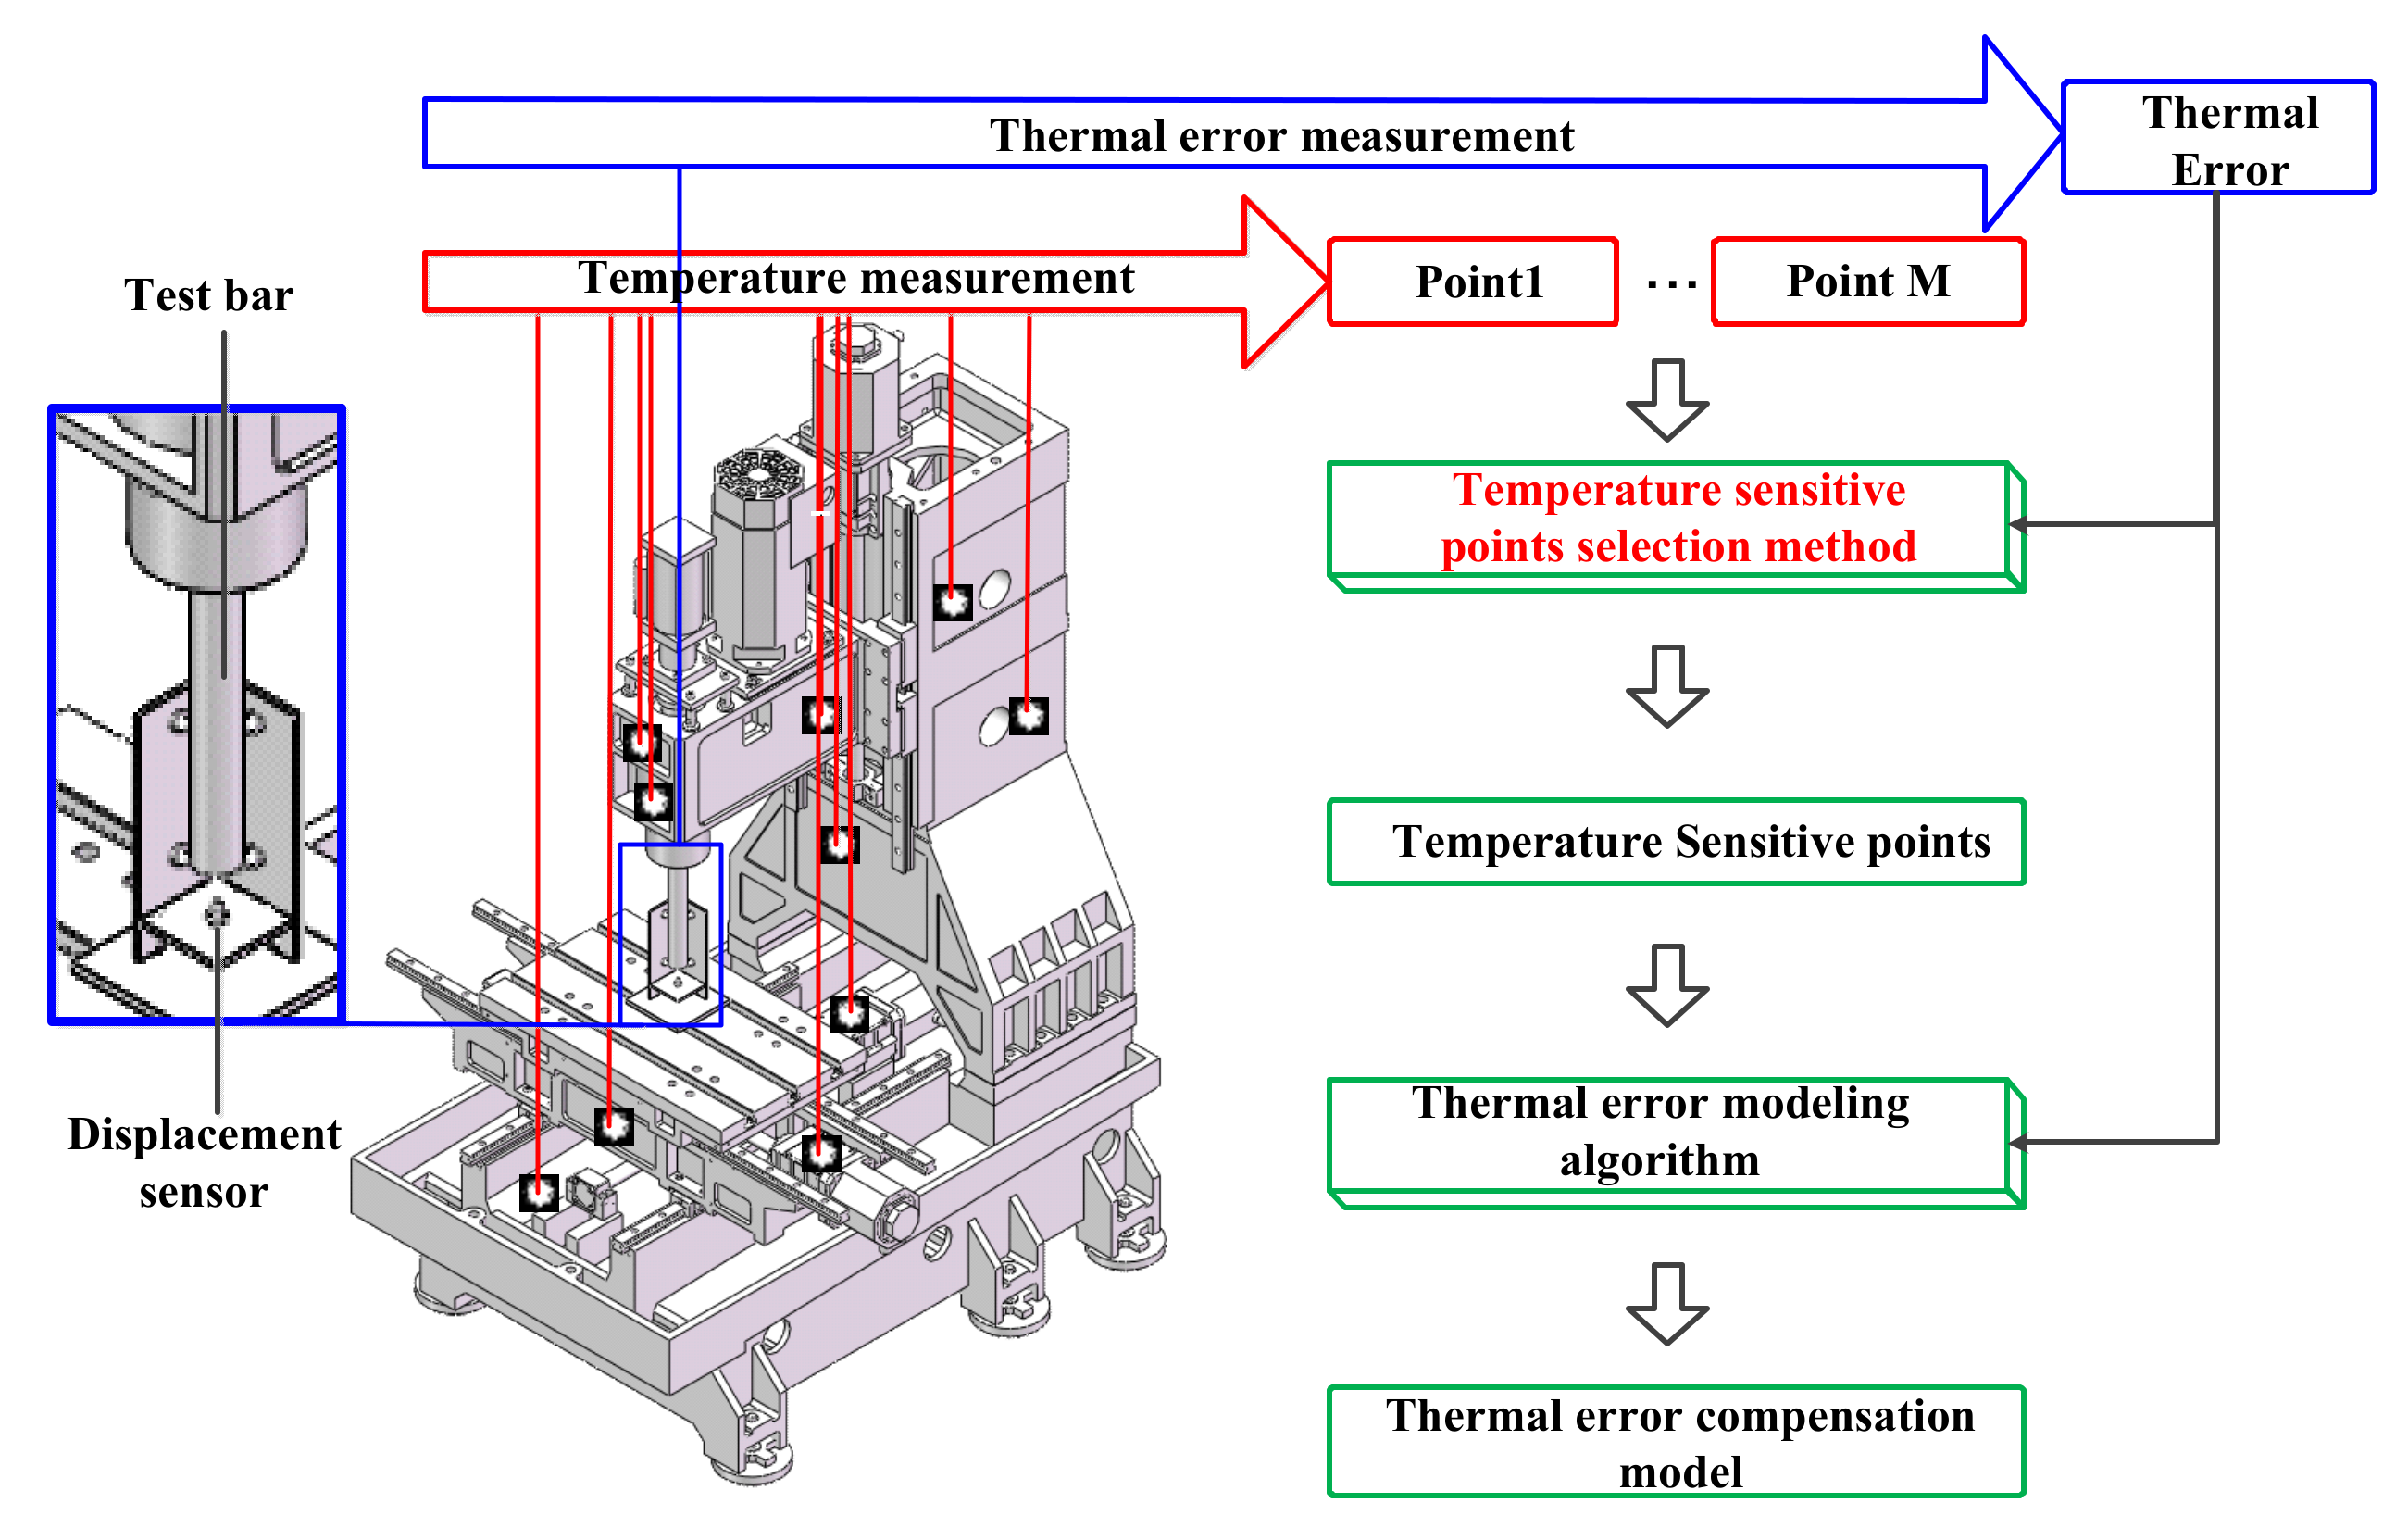
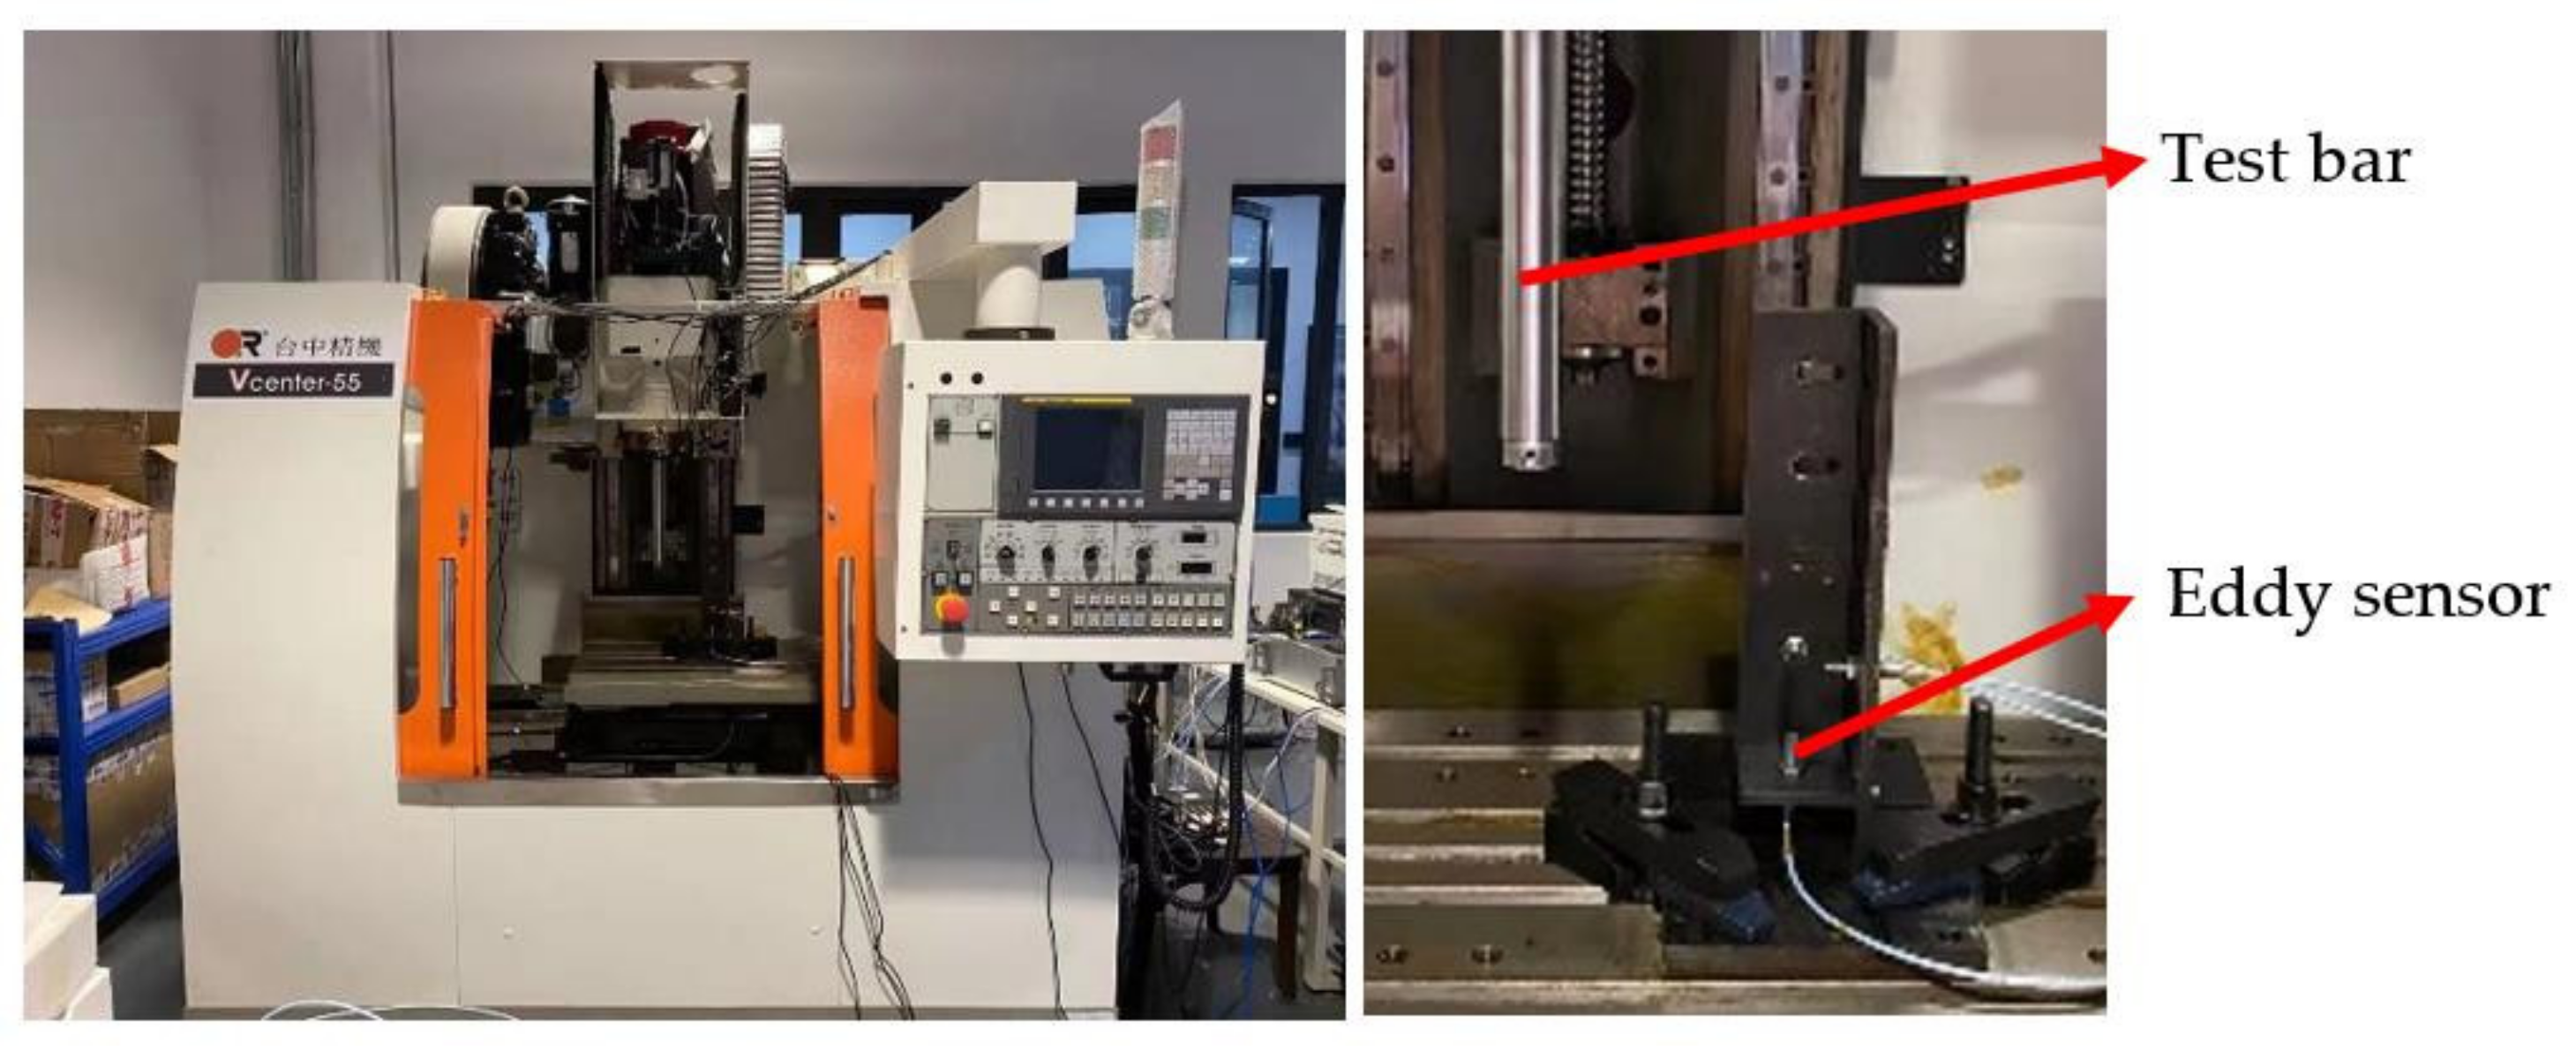
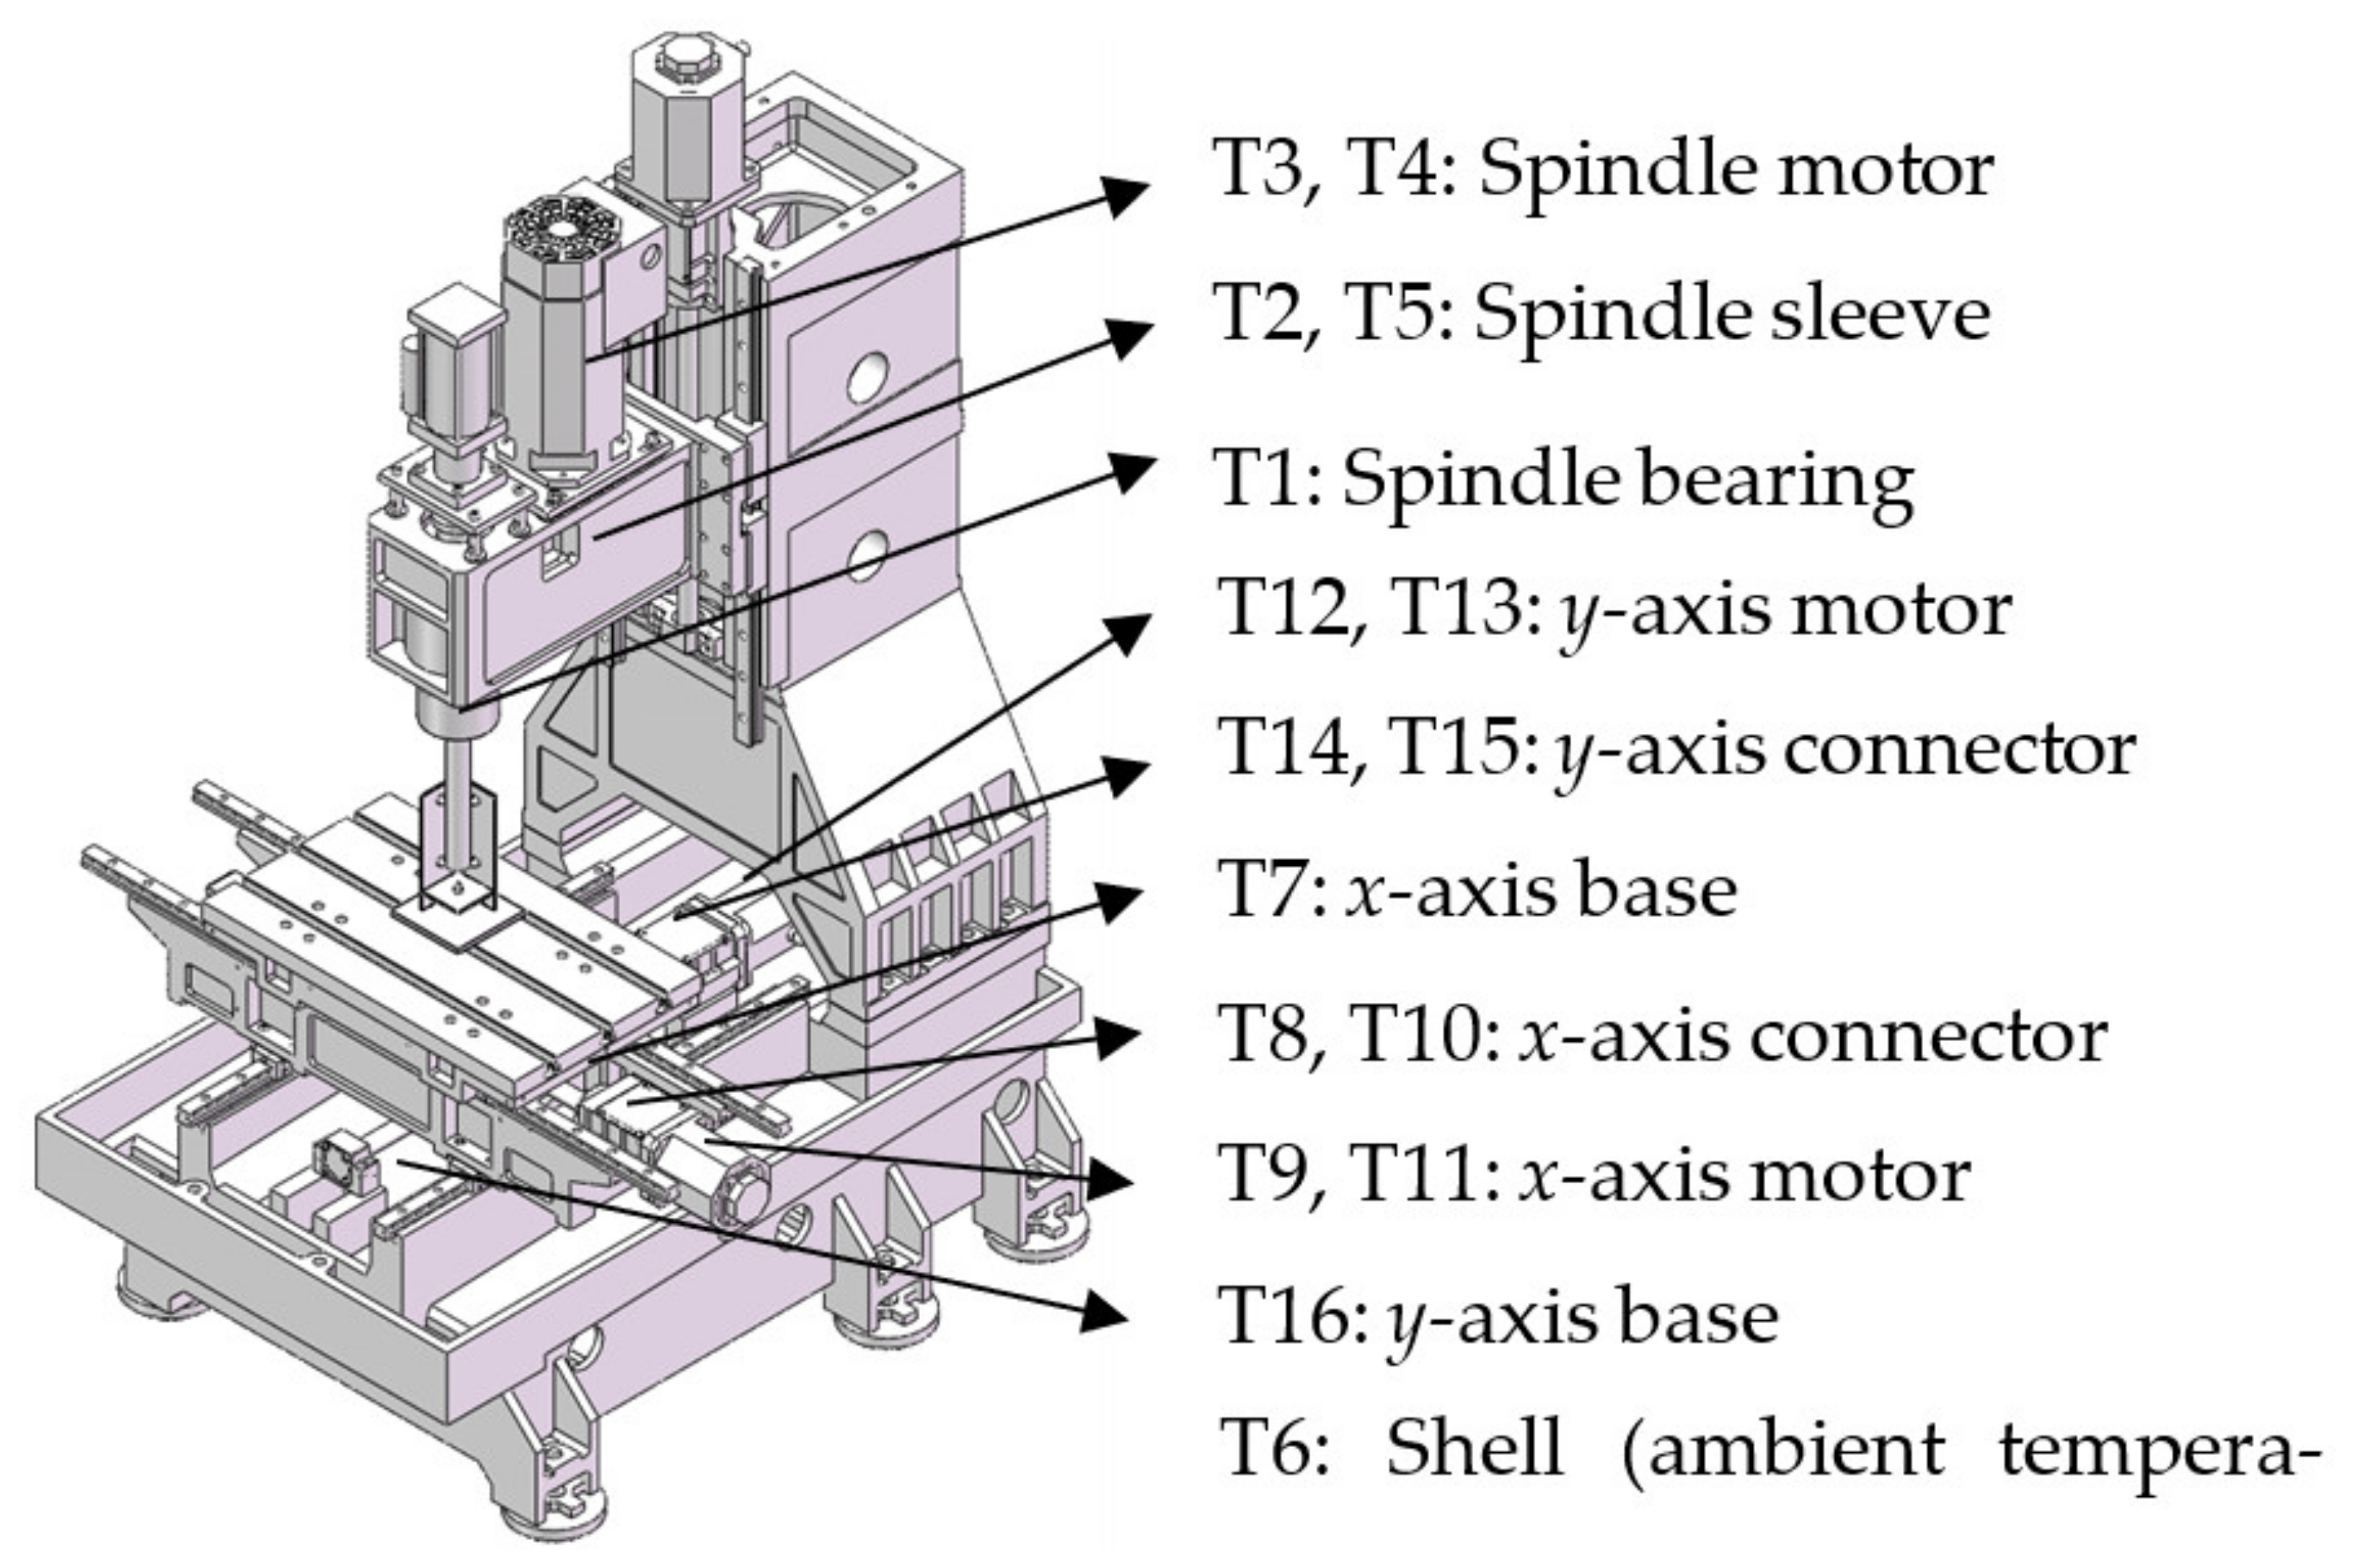
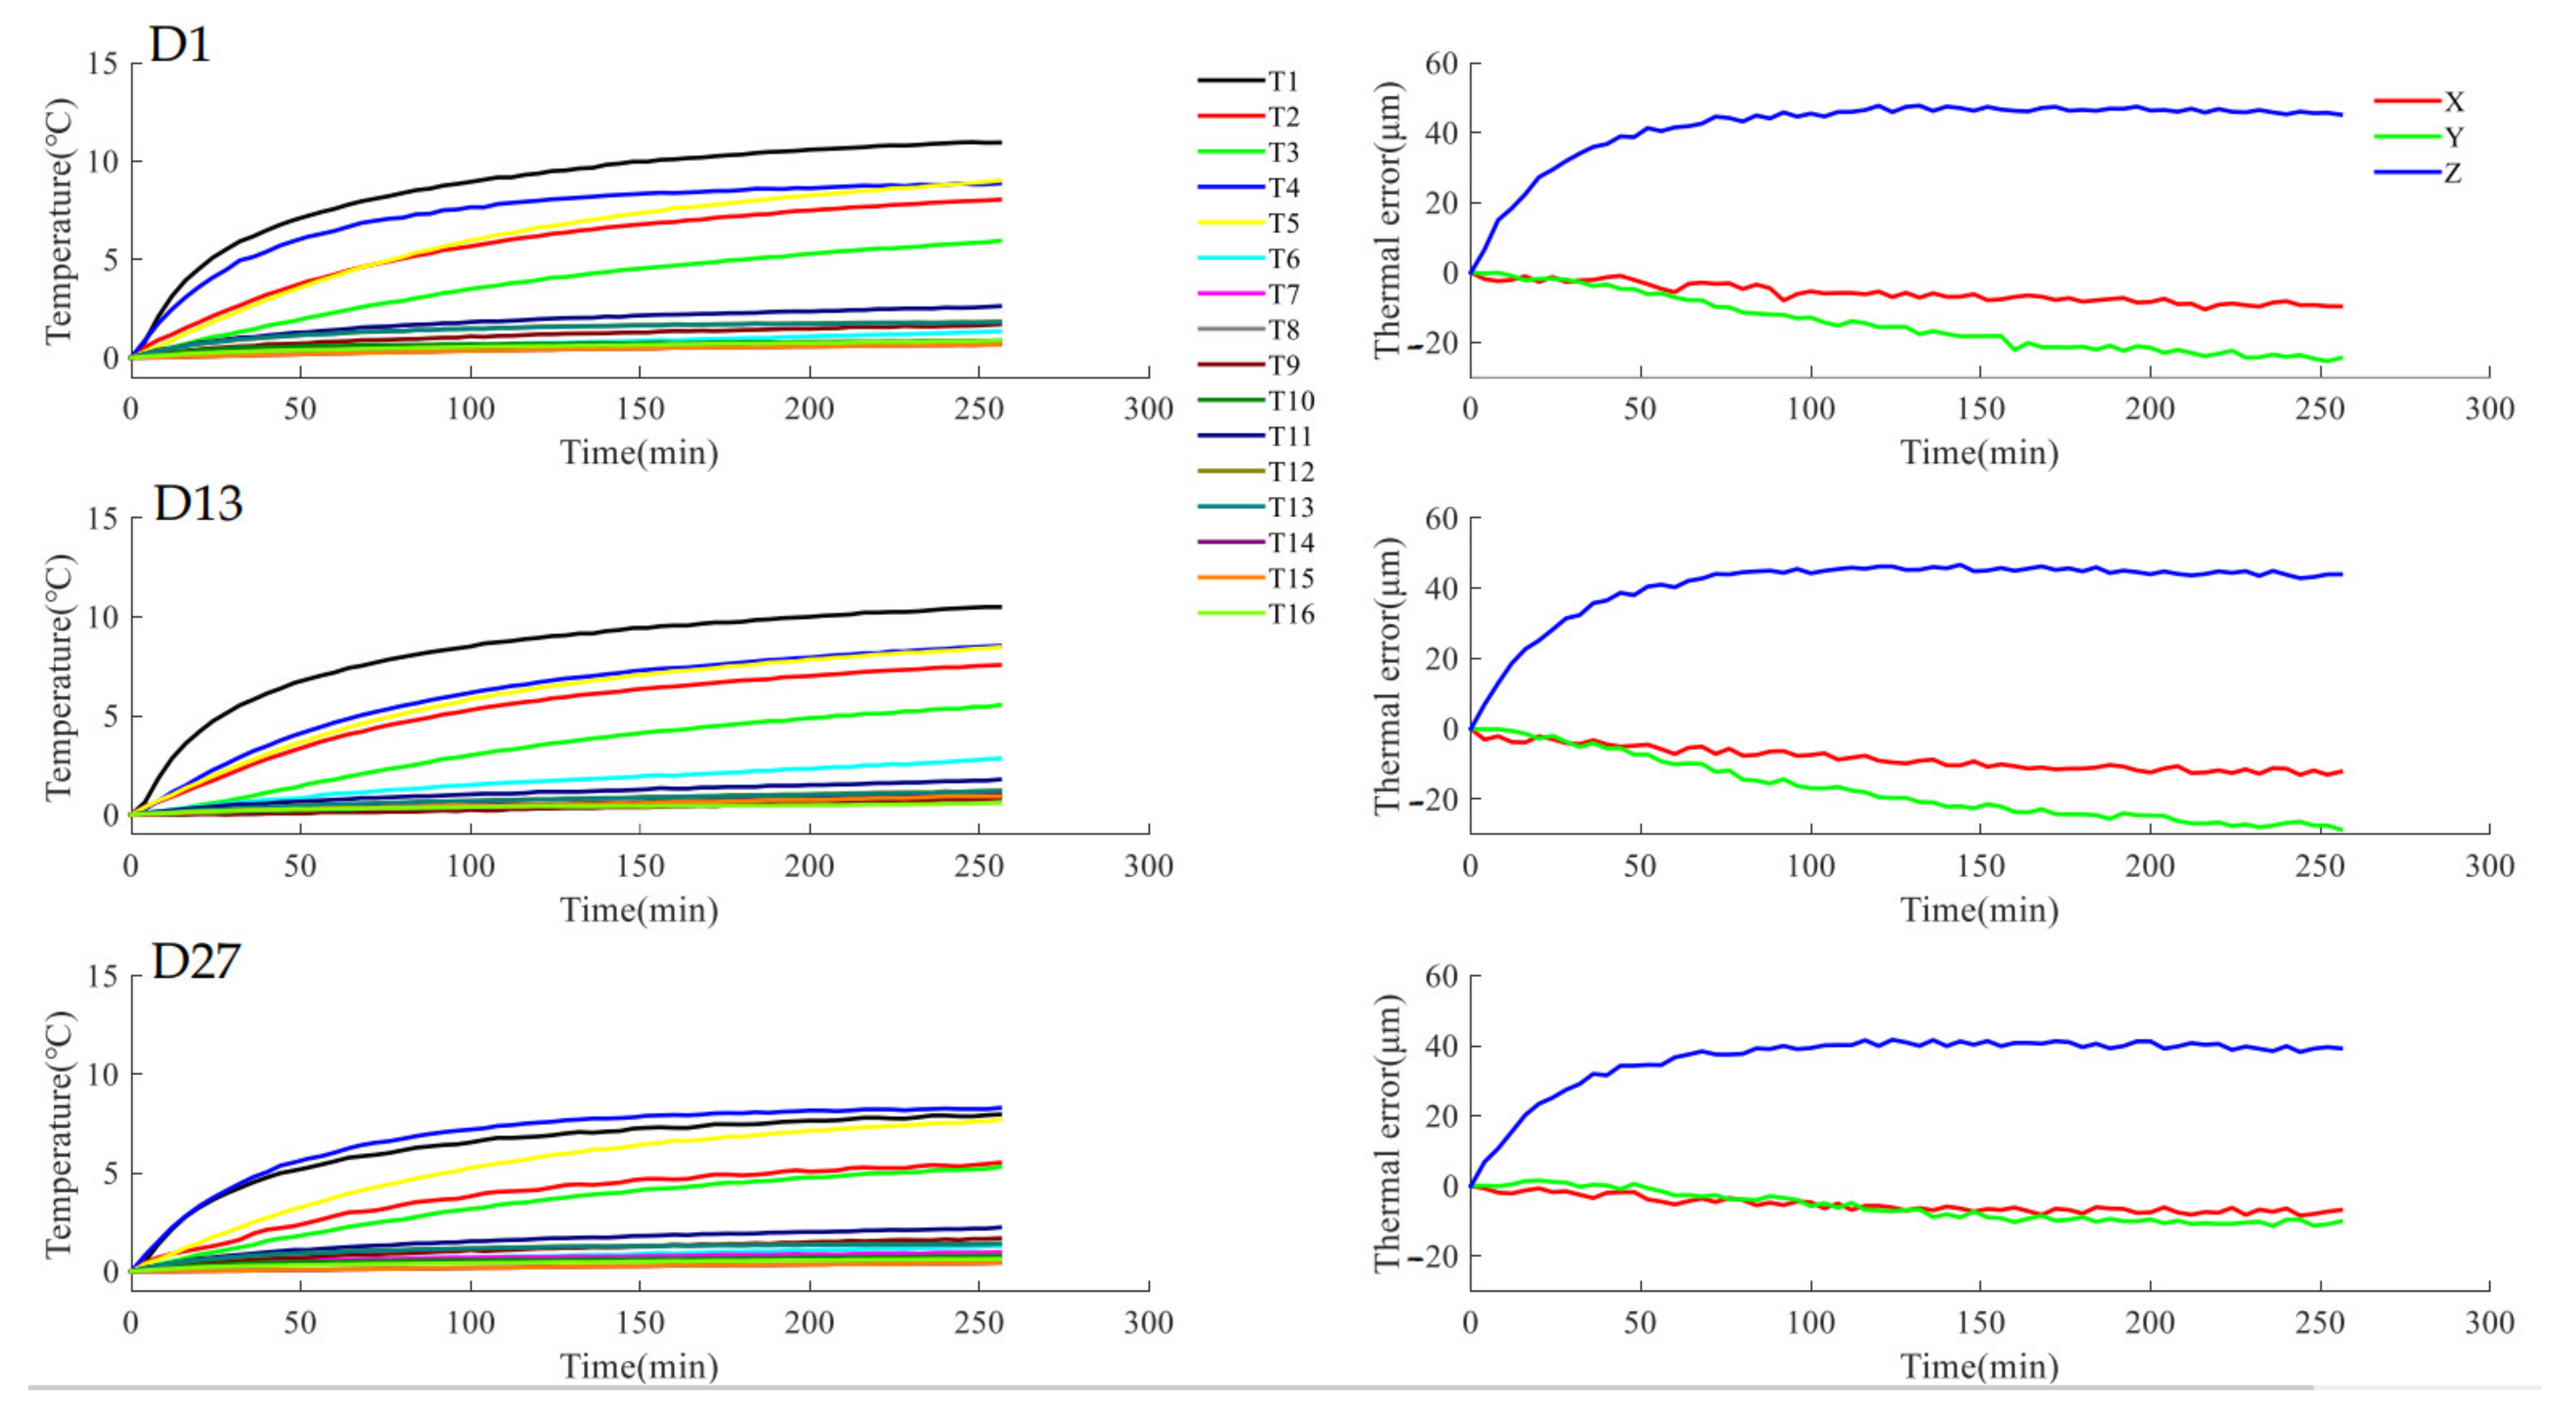
4. Thermal-Error-Measurement Experiment

The stability of the correlation between thermal error and TSPs requires long-term experimental verification. A vertical machining center was chosen for thermal-error-measurement experiments over six months. The main parameters of the machine are as follows.
Model: Vcenter-55, Victor Taichung Machinery Works Co., Ltd. Stroke: X, 550; Y, 460; Z, 460 mm. Size: 1955 × 2350 × 2500 (high) mm. Maximum spindle speed: 8000 rpm. Positioning accuracy: 5 μm.
Figure 3 showed the measurement of the thermal errors, using three eddy sensors in the x-, y-, and z-axis, respectively. A total of 16 temperature sensors were installed near the heat source of the machine tool to measure the initial temperature points (Figure 4).
The specific experiment process is as follows:
(1)
Move the test bar to a position that the displacement sensor can sense, refer to this position as the initial position, and record the values of all displacement sensors and temperature sensors. The displacement measurement values in the three axes of x, y, and z are referred to as x t 0 ,     y t 0 ,     and   z t 0 ,   r e s p e c t i v e l y . The 16 initial temperature-point-measurement values are referred to as T i t 0 , i = 1 , , 16 .
(2)
The spindle of the machine tool is controlled to idly run, and the workbench moves along the rectangular track at the same time.
(3)
Every 4 min, stop spindle rotation and control the worktable to move to the initial position, and record the values of all displacement sensors and temperature sensors. The displacement measurement values in the three axes of x, y, and z are referred to as x t k ,     y t k ,     and   z t k , respectively. The 16 initial temperature-point-measurement values are referred to as T i t k , i = 1 , , 16 . Repeat Step (3) until the end of the measurement. The k represents the number of repetitions of Step (3).
(4)
Take the change in the displacement sensor and temperature sensor as the measurement result, as shown in (11).
x t k = x t k x t 0 y t k = y t k y t 0 z t k = z t k z t 0 T i t k = T i t k T i t 0 , i = 1 , , 16
where x t k ,   y t k ,     and   z t k are the thermal errors in the x-axis, y-axis, and z-axis, respectively; and T i t k ,     i = 1 , , 16 are the changes in 16 initial temperature points. The reason for using the temperature change is that the thermal error is the position change in the tool after being heated, which is a relative error, so it is only necessary to pay attention to the temperature change after the machine tool has run.
Each experiment lasted 4 to 5 h. On different dates, a total of 27 batches of experiments were carried out, denoted as D1~D27. The ambient temperature of each experiment is shown in Table 1. The temperatures and the thermal error of experiments D1, D13, and D27 are shown in Figure 5. They represent the data at the beginning, middle, and end of the experiment, respectively. In order not to make the paper too long, other data are not shown. The x-axis thermal error change was very small, due to the symmetrical structure of the machine tools. Therefore, this article mainly focuses on the y-axis and z-axis.

5. Analysis of TSP Selection Result

5.1. Analysis of Correlation Stability of TSPs

According to the commonly used correlation coefficient, the two temperature points with the highest correlation with the thermal error were selected as the TSPs, as shown in Table 2. The number of TSPs depends on the previous engineering experience [36].
In Table 2, for the y-axis, the most frequent TSP combinations are T3 and T5. However, they are easy to change, as with T6, T7, T10, T14, and T15. For the z-axis, mainly T1 and T4, T7, T8, T10, and T13 appeared in some data. We calculated the correlation coefficient between these TSPs and thermal error in each measurement datum, and the results are shown in Figure 6.
In Figure 6, the TSPs can be divided into two categories: one is stable (the correlation remains stable in different batches of measurement data), and the other is unstable. The correlation between unstable TSPs and thermal errors can easily change and sometimes even exceeds stable TSPs. The unstable correlation means that TSPs are easily disturbed, and this will seriously damage the prediction accuracy of the thermal errors. The analysis of accuracy was as follows.
The stable TSPs and unstable TSPs were selected to establish the thermal-error-compensation model, and the thermal-error-prediction accuracy of the two temperature-sensitive points was compared. The TSPs involved in the comparison are shown in Table 3.
The accuracy comparison method is as follows.
(1)
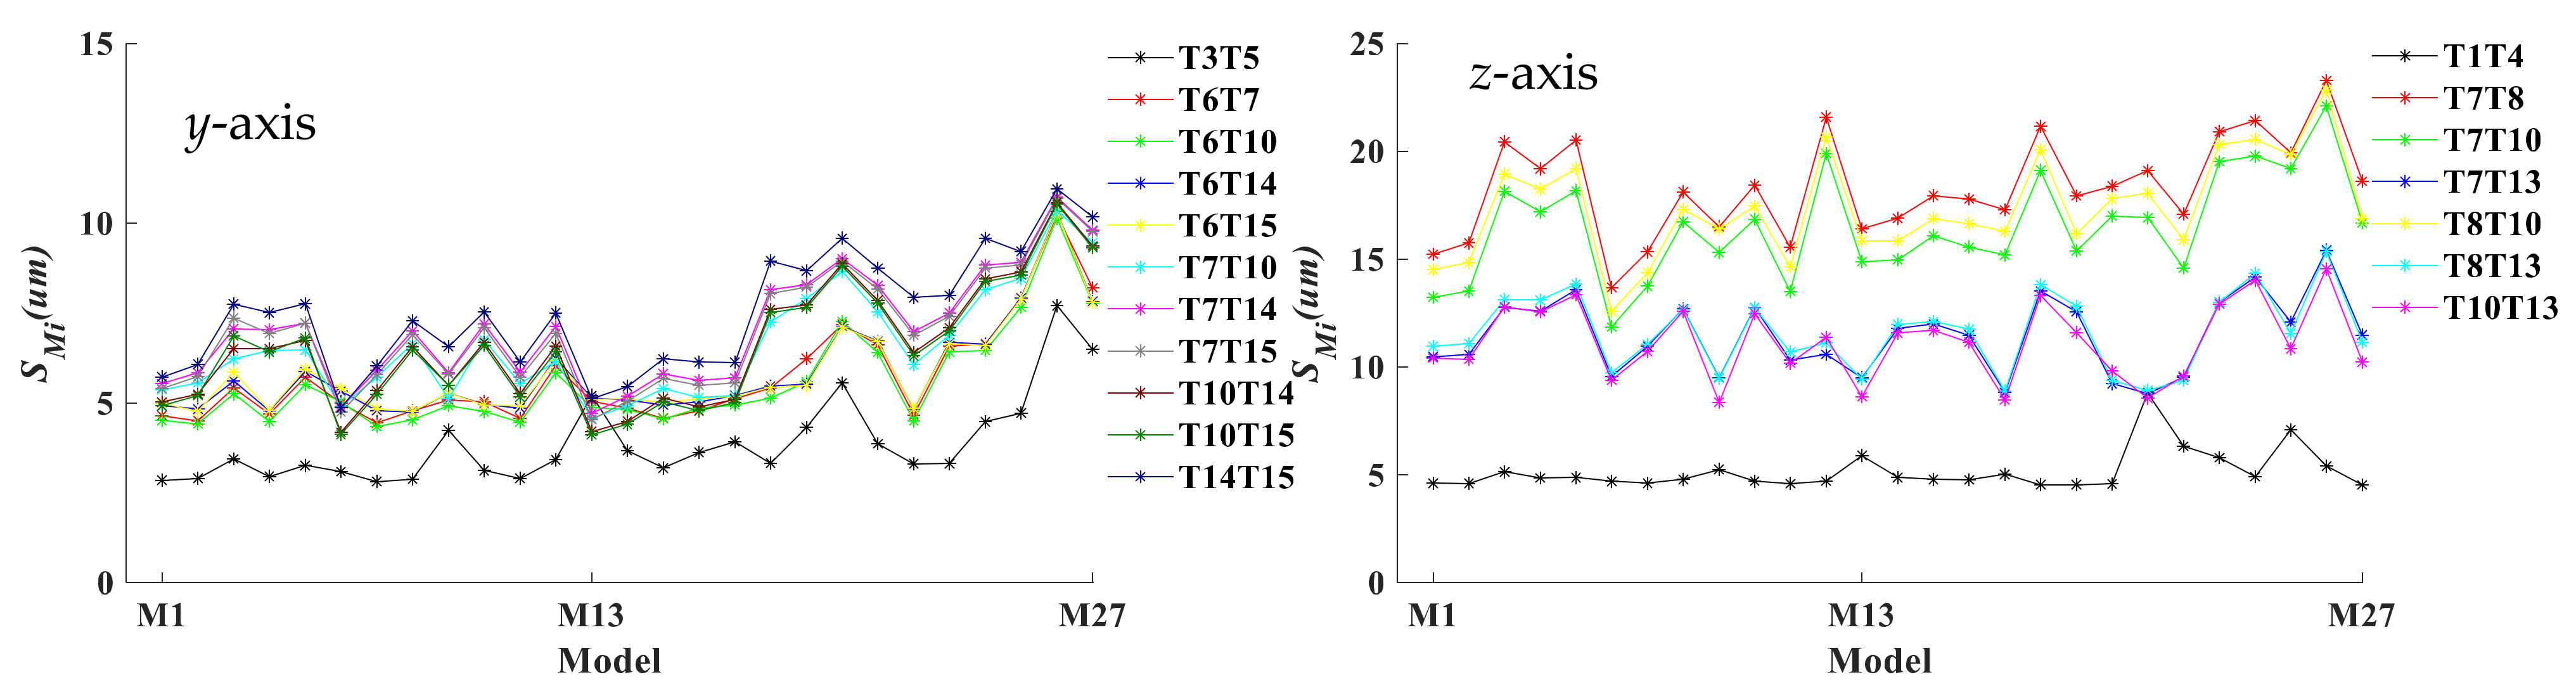
Choose a TSP combination and establish the thermal-error-compensation models in the y-axis and z-axis, respectively. The models established by experiments D1~D27 are referred to as M1~M27. The modeling algorithm is the ridge regression algorithm; the ridge parameter was obtained by the previous study [20].
(2)
Choose a model and bring the TSPs data of one experiment into the model to obtain the thermal-error-predicted value. Then calculate the root-mean-squared error (RMSE) by (12) to measure the prediction accuracy. The bigger the RMSE, the worse the prediction accuracy [37].
S M i D j = k = 1 N E k ^ E k 2 N 1
where S M i D j is the RMSE obtained by bringing the temperature data of experiment   D j into the model M i , N is the length of the measurement data of D j , E k is the k -th thermal error measurement value of D j , and E k ^ is the corresponding thermal error prediction value.
(3)
For each model, use the average RMSE of all batches of experiment data to evaluate the model accuracy. The calculation method is shown in (13).
S M i = j = 1 27 S M i D j 27
The S M i of each model is shown in Figure 7.
According to Figure 7, the prediction accuracy of the stable TSPs is significantly better than the unstable TSPs. This means that the stable TSPs are very important for thermal error prediction.

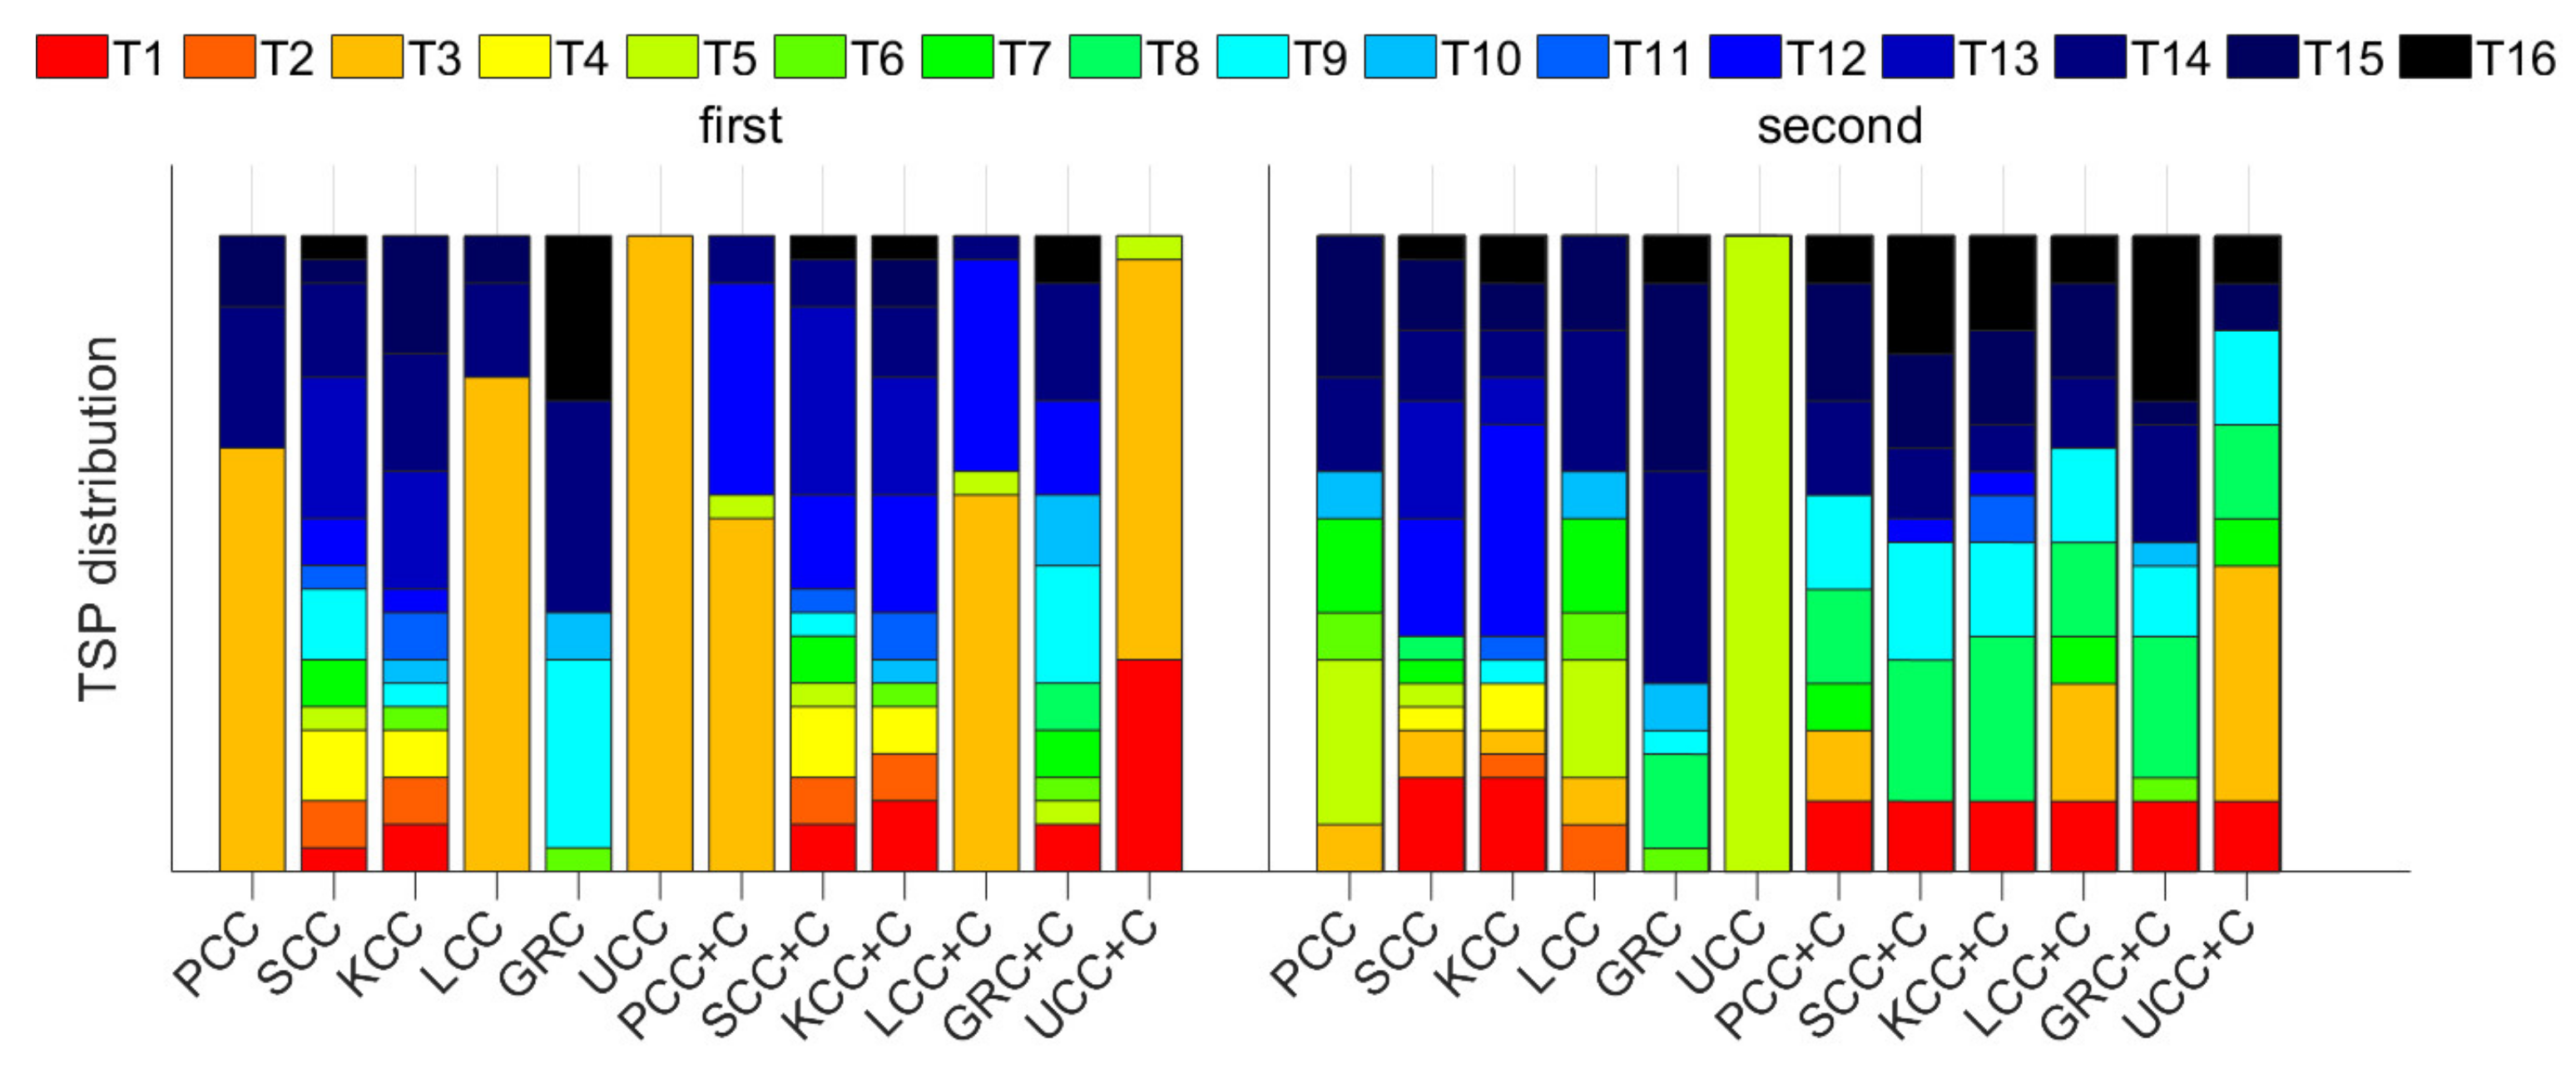
5.2. TSP Selection Result Based on Uncertainty-Correlation Coefficient

To test the effect of the uncertainty-correlation coefficient on the selection of TSPs, this study selected the commonly used TSP-selection algorithm for comparison. Meanwhile, the widely used improved correlation-coefficient calculation method was also selected for comparison. The specific selection method of TSPs involved in the comparison is shown in Table 4. The methods in Table 4 are divided into two types:
(1)
Directly select the two with the highest correlation with the thermal error as TSPs.
(2)
Based on the fuzzy clustering algorithm [8], the temperature points are divided into two groups; then, from each group, the one with the highest correlation with the thermal error is selected as the TSP.
For each method, the average S M i of all models was used for accuracy evaluation. The calculation method is as follows:
(1)
Build the thermal-error-compensation model according to the measurement data of D1~D27, referred to as M1~M27, respectively. The modeling algorithm is ridge regression.
(2)
Calculate the S M i of each model according to (12) and (13), and then calculate the average S M i of all models to measure the accuracy of the TSP selection method, as shown in (14).
S m e t h o d = i = 1 27 S M i 27
For ease of presentation, the specific TSP-selection results of each experimental datum are not provided; instead, the distribution of TSPs in the selection results of 27 batches of data is displayed. The results are shown in Figure 8 and Figure 9. The accuracy evaluations of each TSP-selection method are shown in Table 5.
According to Figure 8 and Figure 9, the TSPs selected by the UCC are concentrated in T1~T5. According to Table 5, the UCC is the best, and the UCC + C is the best among all the cluster methods.

6. Discussion

The TSPs selected by UCC were concentrated in T1~T5, indicating that only the TSPs near the spindle can have an excellent thermal error prediction effect. The reasons for this are as follows.
(1)
The spindle motor generates a large amount of heat and is close to the tool, contributing the most to the thermal error. The heat source of other temperature points is the feed motor. Compared to the spindle motor, the speed is lower, the heat generation is less, and the contribution to the thermal error is also small. If the effective information of these temperature points is less than the interference, it will cause a decrease in prediction accuracy. Therefore, abandoning these temperature points has little effect on the model, and it even helps to improve the accuracy.
(2)
The heat will be conducted in the machine-tool structure, leading to the correlation between the temperature points of different parts of the machine tool. Therefore, the temperature-measurement data of the spindle include temperature information on other heat sources.
The following are the explanations of questions that readers may have regarding the experimental results.
Q1: For the y-axis, why does the UCC-C method have only one TSP near the spindle and can achieve the same effect as UCC? There are two main reasons for this:
(1)
For the TSPs selected by the UCC-C method, the model coefficient of the temperature point near the spindle is much larger than the other one (close to 0). This means that, for the y-axis, one TSP can also provide sufficient temperature information for thermal error prediction.
(2)
Collinearity between TSPs will cause the model prediction accuracy to decrease. Collinearity refers to the correlation between TSPs. High collinearity can easily cause overfitting of the model [38] and a decrease in prediction accuracy. The purpose of ridge-regression modeling in this study was to suppress collinearity. Ridge regression relies on the ridge parameter. If the ridge parameter is too big, it will cause the model coefficient to tend to 0 and lose accuracy. If the ridge parameter is too small, collinearity cannot be suppressed. The UCC-C will cluster first, and TSPs with low collinearity are preferred. Therefore, for the modeling algorithm, the influence of collinearity is easier to suppress. Otherwise, the ridge parameter in this paper depends on a large amount of previous experimental experience [20], but this is not ideal, so it is normal that the effect of the UCC-C is better than the UCC. If the ridge parameter is optimized for these data, a model with a higher UCC than UCC-C may be found. However, the accuracy difference between the two algorithms is too small, and this optimization is unnecessary.
Q2: How is the number of TSPs determined? At present, it mainly relies on experience.
This study used previous research experience [36] and found that choosing two TSPs works well. Further research on this is needed.

7. Conclusions

(1)
This article studied the temperature-sensitive points (TSPs) selection method of the thermal-error-compensation model. The principle is to select temperature points with high correlation with the thermal error. Through long-term experiments, the correlation between some temperature measurement points and thermal error may be unstable and will change with the change in the temperature conditions of the machine tool. Therefore, widely used methods may not be able to select the TSPs that have a stable high correlation with the thermal error. Unstable TSPs will introduce a large amount of interference into the thermal-error-compensation model, thus greatly reducing the long-term prediction accuracy of thermal errors.
(2)
This article proposed the uncertainty-calculation method of the correlation coefficient to measure the stability of the correlation. Additionally, we proposed the uncertainty-correlation coefficient algorithm. This algorithm combines the correlation coefficient and its uncertainty. It is proportional to the correlation coefficient and inversely proportional to the uncertainty. Therefore, when applied to the selection of TSPs, if a temperature point shows a temporary high correlation with the thermal error, it will be eliminated due to high uncertainty. Therefore, this method will prioritize selecting TSPs that can maintain a long-term stable correlation with the thermal error. According to the long-term prediction accuracy of the thermal error, the uncertainty-correlation coefficient has obvious advantages over the existing TSP-selection methods.
(3)
The uncertainty-correlation coefficient is an improvement over the traditional correlation coefficient. The main improvement lies in the uncertainty calculation of the correlation coefficient, which can evaluate the stability of the correlation. Therefore, it can also provide some references when encountering other problems similar to the selection of TSPs of machine tools. The characteristic of the problem is to make decisions based on the correlation between multiple variables, and the stability of the correlation is an issue that cannot be ignored. For example, in medical testing, it is necessary to calculate the correlation of paired data (data measured by the same object on different instruments) for clinical diagnosis. Uncertainty can measure the impact of errors in the data and provides some auxiliary information for decision-makers [39].

Author Contributions

Conceptualization, H.L. and E.M.; methodology, H.L.; software, H.L.; validation, H.L. and L.Z.; formal analysis, D.T. and L.Z.; investigation, H.L.; resources, H.L.; data curation, H.L.; writing—original draft preparation, H.L.; writing—review and editing, E.M., D.T. and Y.H.; visualization, H.L.; supervision, H.L. and E.M.; project administration, H.L.; funding acquisition, H.L. and E.M. All authors have read and agreed to the published version of the manuscript.

Funding

This work was supported by the National Natural Science Foundation of China, grant number 52105274, and the National Key R&D Program of China, grant number 2019YFB1703700.

Institutional Review Board Statement

Not applicable.

Informed Consent Statement

Not applicable.

Data Availability Statement

Not applicable.

Conflicts of Interest

The authors declare no conflict of interest. The funders had no role in the design of the study; in the collection, analyses, or interpretation of data; in the writing of the manuscript; or in the decision to publish the results.

References

  1. Bryan, J.B. International Status of Thermal Error Research. CIRP Ann. 1990, 39, 645–656. [Google Scholar]
  2. Aronson, R.B. War against thermal expansion. Manuf. Eng. 1996, 116, 45–50. [Google Scholar]
  3. Yun, W.S.; Kim, S.K.; Cho, D.W. Thermal error analysis for a CNC lathe feed drive system. Int. J. Mach. Tools Manuf. 1999, 39, 1087–1101. [Google Scholar]
  4. Jiang, H.; Fan, K.G.; Yang, J.G. An improved method for thermally induced positioning errors measurement, modeling, and compensation. Int. J. Adv. Manuf. Technol. 2014, 75, 1279–1289. [Google Scholar]
  5. Wang, W.; Yang, J.G.; Yao, X.D.; Fan, K.G.; Li, Z.H. Synthesis Modeling and Real-time Compensation of Geometric Error and Thermal Error for CNC Machine Tools. J. Mech. Eng. 2012, 48, 165–170. [Google Scholar] [CrossRef]
  6. Nie, X.J. Spindle Thermal Analysis of CNC Milling Machine. Adv. Mater. Res. 2013, 765–767, 88–91. [Google Scholar]
  7. Wang, W.S.; Guan, P.; Yu, T.B. Thermal-Mechanical Analysis of Hybrid Spindle System Based on FEM. Adv. Mater. Res. 2012, 565, 644–649. [Google Scholar] [CrossRef]
  8. Wei, X.; Gao, F.; Li, Y.; Zhang, D.Y. Study on optimal independent variables for the thermal error compensation model of CNC machine tools. Int. J. Adv. Manuf. Technol. 2018, 98, 657–669. [Google Scholar] [CrossRef]
  9. Liu, P.; Yao, X.; Ge, G.; Du, Z.C.; Feng, X.B.; Yang, J.G. A Dynamic Linearization Modeling of Thermally Induced Error Based on Data-Driven Control for CNC Machine Tools. Int. J. Precis. Eng. Manuf. 2021, 22, 241–258. [Google Scholar]
  10. Xiang, S.; Lu, H.; Yang, J. Thermal error prediction method for spindles in machine tools based on a hybrid model. Proc. Inst. Mech. Eng. Part B J. Eng. Manuf. 2015, 229, 130–140. [Google Scholar]
  11. ISO 230-3; Test Code for Machine Tools—Part 3: Determination of Thermal Effects. ISO: Geneva, Switzerland, 2007.
  12. Reddy, T.N.; Shanmugaraj, V.; Vinod, P.; Krishna, S.G. Real-time Thermal Error Compensation Strategy for Precision Machine tools. Mater. Today Proc. 2020, 22, 2386–2396. [Google Scholar] [CrossRef]
  13. Mareš, M.; Horejš, O.; Havlík, L. Thermal error compensation of a 5-axis machine tool using indigenous temperature sensors and CNC integrated Python code validated with a machined test piece. Precis. Eng. 2020, 66, 21–30. [Google Scholar] [CrossRef]
  14. Huang, Z.; Liu, Y.C.; Du, L.; Yang, H. Thermal error analysis, modeling and compensation of five-axis machine tools. J. Mech. Sci. Technol. 2020, 34, 4295–4305. [Google Scholar] [CrossRef]
  15. Tan, B.; Mao, X.Y.; Liu, H.Q.; Li, B.; He, S.P.; Peng, F.Y.; Yin, L. A thermal error compensation model for large machine tools that considers environmental thermal hysteresis effects. Int. J. Mach. Tools Manuf. 2014, 82–83, 11–20. [Google Scholar] [CrossRef]
  16. Li, Y.; Shi, H.X.; Ji, S.J.; Liang, F.S. Thermal Positioning Error Modeling of Servo Axis Based on Empirical Modeling Method. Micromachines 2021, 12, 201. [Google Scholar] [CrossRef]
  17. Li, Y.; Zhao, J.; Ji, S.J. Thermal positioning error modeling of machine tools using a bat algorithm-based back propagation neural network. Int. J. Adv. Manuf. Technol. 2018, 97, 2575–2586. [Google Scholar] [CrossRef]
  18. Ma, C.; Zhao, L.; Mei, X.S.; Shi, H.; Yang, J. Thermal error compensation of high-speed spindle system based on a modified BP neural network. Int. J. Adv. Manuf. Technol. 2017, 89, 3071–3085. [Google Scholar] [CrossRef]
  19. Liu, Y.C.; Li, K.Y.; Tsai, Y.C. Spindle Thermal Error Prediction Based on LSTM Deep Learning for a CNC Machine Tool. Appl. Sci. 2021, 11, 5444. [Google Scholar] [CrossRef]
  20. Liu, H.; Miao, E.; Wei, X.; Zhuang, X. Robustness Modeling Method for Thermal Error of CNC Machine Tools Based on Ridge Regression Algorithm. Int. J. Mach. Tools Manuf. 2017, 113, 35–48. [Google Scholar] [CrossRef]
  21. Lo, C.H.; Yuan, J.; Ni, J. Optimal temperature variable selection by grouping approach for thermal error compensation modeling and compensation. Int. J. Mach. Tools Manuf. 1999, 39, 1383–1396. [Google Scholar] [CrossRef]
  22. Wold, S.; Ruhe, A.; Wold, H.; Dunn, W.J. The collinearity problem in linear Regression. The partial least squares (PLS) approach to generalized inverses. Siam J. Sci. Stat. Comput. 1984, 5, 735–743. [Google Scholar] [CrossRef] [Green Version]
  23. Abdulshahed, A.M.; Longstaff, A.P.; Fletcher, S. Thermal error compensation modelling of machine tools based on ANFIS with fuzzy c-means clustering using a thermal imaging camera. Appl. Math. Model. 2015, 39, 1837–1852. [Google Scholar] [CrossRef]
  24. Miao, E.M.; Gong, Y.Y.; Dang, L.C.; Miao, J.C. Temperature-sensitive point selection of thermal error compensation model of CNC machining center. Int. J. Adv. Manuf. Technol. 2014, 74, 681–691. [Google Scholar]
  25. Li, Z.Y.; Li, G.L.; Xu, K.; Tang, X.D.; Dong, X. Temperature-sensitive point selection and thermal error compensation modeling of spindle based on synthetical temperature information. Int. J. Adv. Manuf. Technol. 2021, 113, 1–15. [Google Scholar] [CrossRef]
  26. Fu, G.; Tao, C.; Xie, Y.; Lu, C.; Gao, H. Temperature-sensitive point selection for thermal error compensation modeling of machine tool spindle by considering heat source regions. Int. J. Adv. Manuf. Technol. 2021, 112, 2447–2460. [Google Scholar] [CrossRef]
  27. Zhang, T.; Ye, W.; Shan, Y. Application of sliced inverse regression with fuzzy clustering for thermal error compensation modeling of CNC machine tool. Int. J. Adv. Manuf. Technol. 2016, 85, 2761–2771. [Google Scholar] [CrossRef]
  28. Yin, Q.; Tan, F.; Chen, H.; Yin, G. Spindle thermal error compensation modeling based on selective ensemble BP neural networks. Int. J. Adv. Manuf. Technol. 2019, 101, 1699–1713. [Google Scholar] [CrossRef]
  29. Niven, E.B.; Deutsch, C.V. Calculating a robust correlation coefficient and quantifying its uncertainty. Comput. Geosci. 2012, 40, 1–9. [Google Scholar] [CrossRef]
  30. Sedgwick, P. Spearman’s rank correlation coefficient. BMJ 2014, 349, g7327. [Google Scholar] [CrossRef] [Green Version]
  31. Josífko, M. The characteristic function of the Kendall’s rank correlation coefficient. Asopis Pro. Pěstování Mat. 1958, 83, 56–59. [Google Scholar] [CrossRef]
  32. Yang, L.; Zhao, W.; Lan, S.; Ni, J.; Wu, W.; Lu, B. A review on spindle thermal error compensation in machine tools. Int. J. Mach. Tools Manuf. 2015, 95, 20–38. [Google Scholar]
  33. Hey, J.; Teo, C.S.; Tan, J.L. Sensor Selection Method to Accurately Model the Thermal Error in a Spindle Motor. IEEE Trans. Ind. Inform. 2017, 14, 2925–2931. [Google Scholar] [CrossRef]
  34. Tu, L.F.; Yi, C.Y.; Zhong, R.L.; Cao, Z.A. Testing of Positioning Accuracy and Repeated Positioning Accuracy of CNC Machine Tool Based on Grating. Mach. Electron. 2012, 4, 32–34. [Google Scholar]
  35. ISO/IEC GUIDE 98-3; Unertainty of Measurement—Part 3: Guide to the Expression of Uncertainty in Measurement. ISO: Geneva, Switzerland, 2008.
  36. Miao, E.M.; Liu, Y.; Liu, H.; Gao, Z.; Li, W. Study on the effects of changes in temperature-sensitive points on thermal error compensation model for CNC machine tool. Int. J. Mach. Tools Manuf. 2015, 97, 50–59. [Google Scholar] [CrossRef]
  37. Bonett, D.G. Robust confidence interval for a residual standard deviation. J. Appl. Stat. 2005, 32, 1089–1094. [Google Scholar] [CrossRef]
  38. Hoerl, A.E.; Kennard, R.W. Ridge regression: Biased estimation for nonorthogonal problems. Technometrics 1970, 42, 80–86. [Google Scholar] [CrossRef]
  39. Aslam, M. Clinical Laboratory Medicine Measurements Correlation Analysis under Uncertainty. Ann. Clin. Biochem. 2021, 58, 377–383. [Google Scholar] [CrossRef]
Figure 1. Principle of thermal-error compensation.
Machines 10 00132 g001
Figure 2. Thermal-error-compensation model’s building method.
Machines 10 00132 g002
Figure 3. Thermal-error-measurement experiment.
Machines 10 00132 g003
Figure 4. Locations of the initial temperature points.
Machines 10 00132 g004
Figure 5. Temperature and thermal error measurement data of experiments D1, D13 and D27.
Machines 10 00132 g005
Figure 6. Correlation coefficient of stable and unstable TSPs.
Machines 10 00132 g006
Figure 7. S M i of model with different TSPs.
Machines 10 00132 g007
Figure 8. TSP selection results of y-axis.
Machines 10 00132 g008
Figure 9. TSP selection results of z-axis.
Machines 10 00132 g009
Table 1. Ambient temperature (°C).
D1D2D3D4D5D6D7D8D9
5910996434
D10D11D12D13D14D15D16D17D18
71013151420212123
D19D20D21D22D23D24D25D26D27
282927242325273233
Table 2. TSP selection result of by correlation coefficient rank (Y/Z 1).
D1D2D3D4D5D6D7
14, 15/4, 814, 15/4, 83, 10/1, 43, 15/4, 73, 10/1, 414, 15/7, 1014, 15/7, 8
D8D9D10D11D12D13D14
14, 15/4, 73, 7/1, 43, 14/4, 73, 14/7, 83, 6/1, 43, 5/1, 43, 14/4, 8
D15D16D17D18D19D20D21
14, 15/4, 83, 14/4, 73, 5/1, 43, 5/4, 83, 5/1, 43, 5/1, 43, 7/1, 4
D22D23D24D25D26D27
3, 7/1, 43, 5/1, 43, 5/4, 133, 6/1, 43, 7/1, 414, 15/4, 13
1 For example, the corresponding result of D1 is 14, 15/4, and 8; this means that the TSP selection result is T14 and T15 in the y-axis, and T4 and T8 in the z-axis.
Table 3. TSPs for model-accuracy comparison.
Stable TSPsUnstable TSPs
y-axisT3, T5T6, T7 T6, T10 T6, T14 T6, T15 T7, T10 T7, T14
T7, T15 T10, T14 T10, T15 T14, T15
z-axisT1, T4T7, T8 T7, T10 T7, T13 T8, T10 T8, T13 T10, T13
Table 4. TSP selection method for comparison.
MethodAbbreviateMethodAbbreviate
Pearson correlation coefficientPCCPearson correlation coefficient + ClusterPCC + C
Spearman correlation coefficientSCCSpearman correlation coefficient + ClusterSCC + C
Kendall correlation coefficientKCCKendall correlation coefficient + ClusterKCC + C
Loot correlation coefficientLCCLoot correlation coefficient + ClusterLCC + C
Grey relational coefficientGRCGrey relational coefficient + ClusterGRC + C
Uncertainty correlation coefficientUCCUncertainty correlation coefficient + ClusterUCC + C
Table 5. S m e t h o d of methods in comparison.
Method S m e t h o d / μ m Method S m e t h o d / μ m
y-axisz-axisy-axisz-axis
PCC4.416.60PCC + C4.387.66
SCC5.0111.97SCC + C5.4311.99
KCC5.0411.72KCC + C5.3912.23
LCC4.006.55LCC + C4.087.77
GRC6.926.08GRC + C6.086.16
UCC3.605.19UCC + C3.585.80
Publisher’s Note: MDPI stays neutral with regard to jurisdictional claims in published maps and institutional affiliations.

