
Model-Based Field Winding Interturn Fault Detection Method for Brushless Synchronous Machines


Abstract
:1. Introduction
2. Operational Principles of the Fault Detection Method
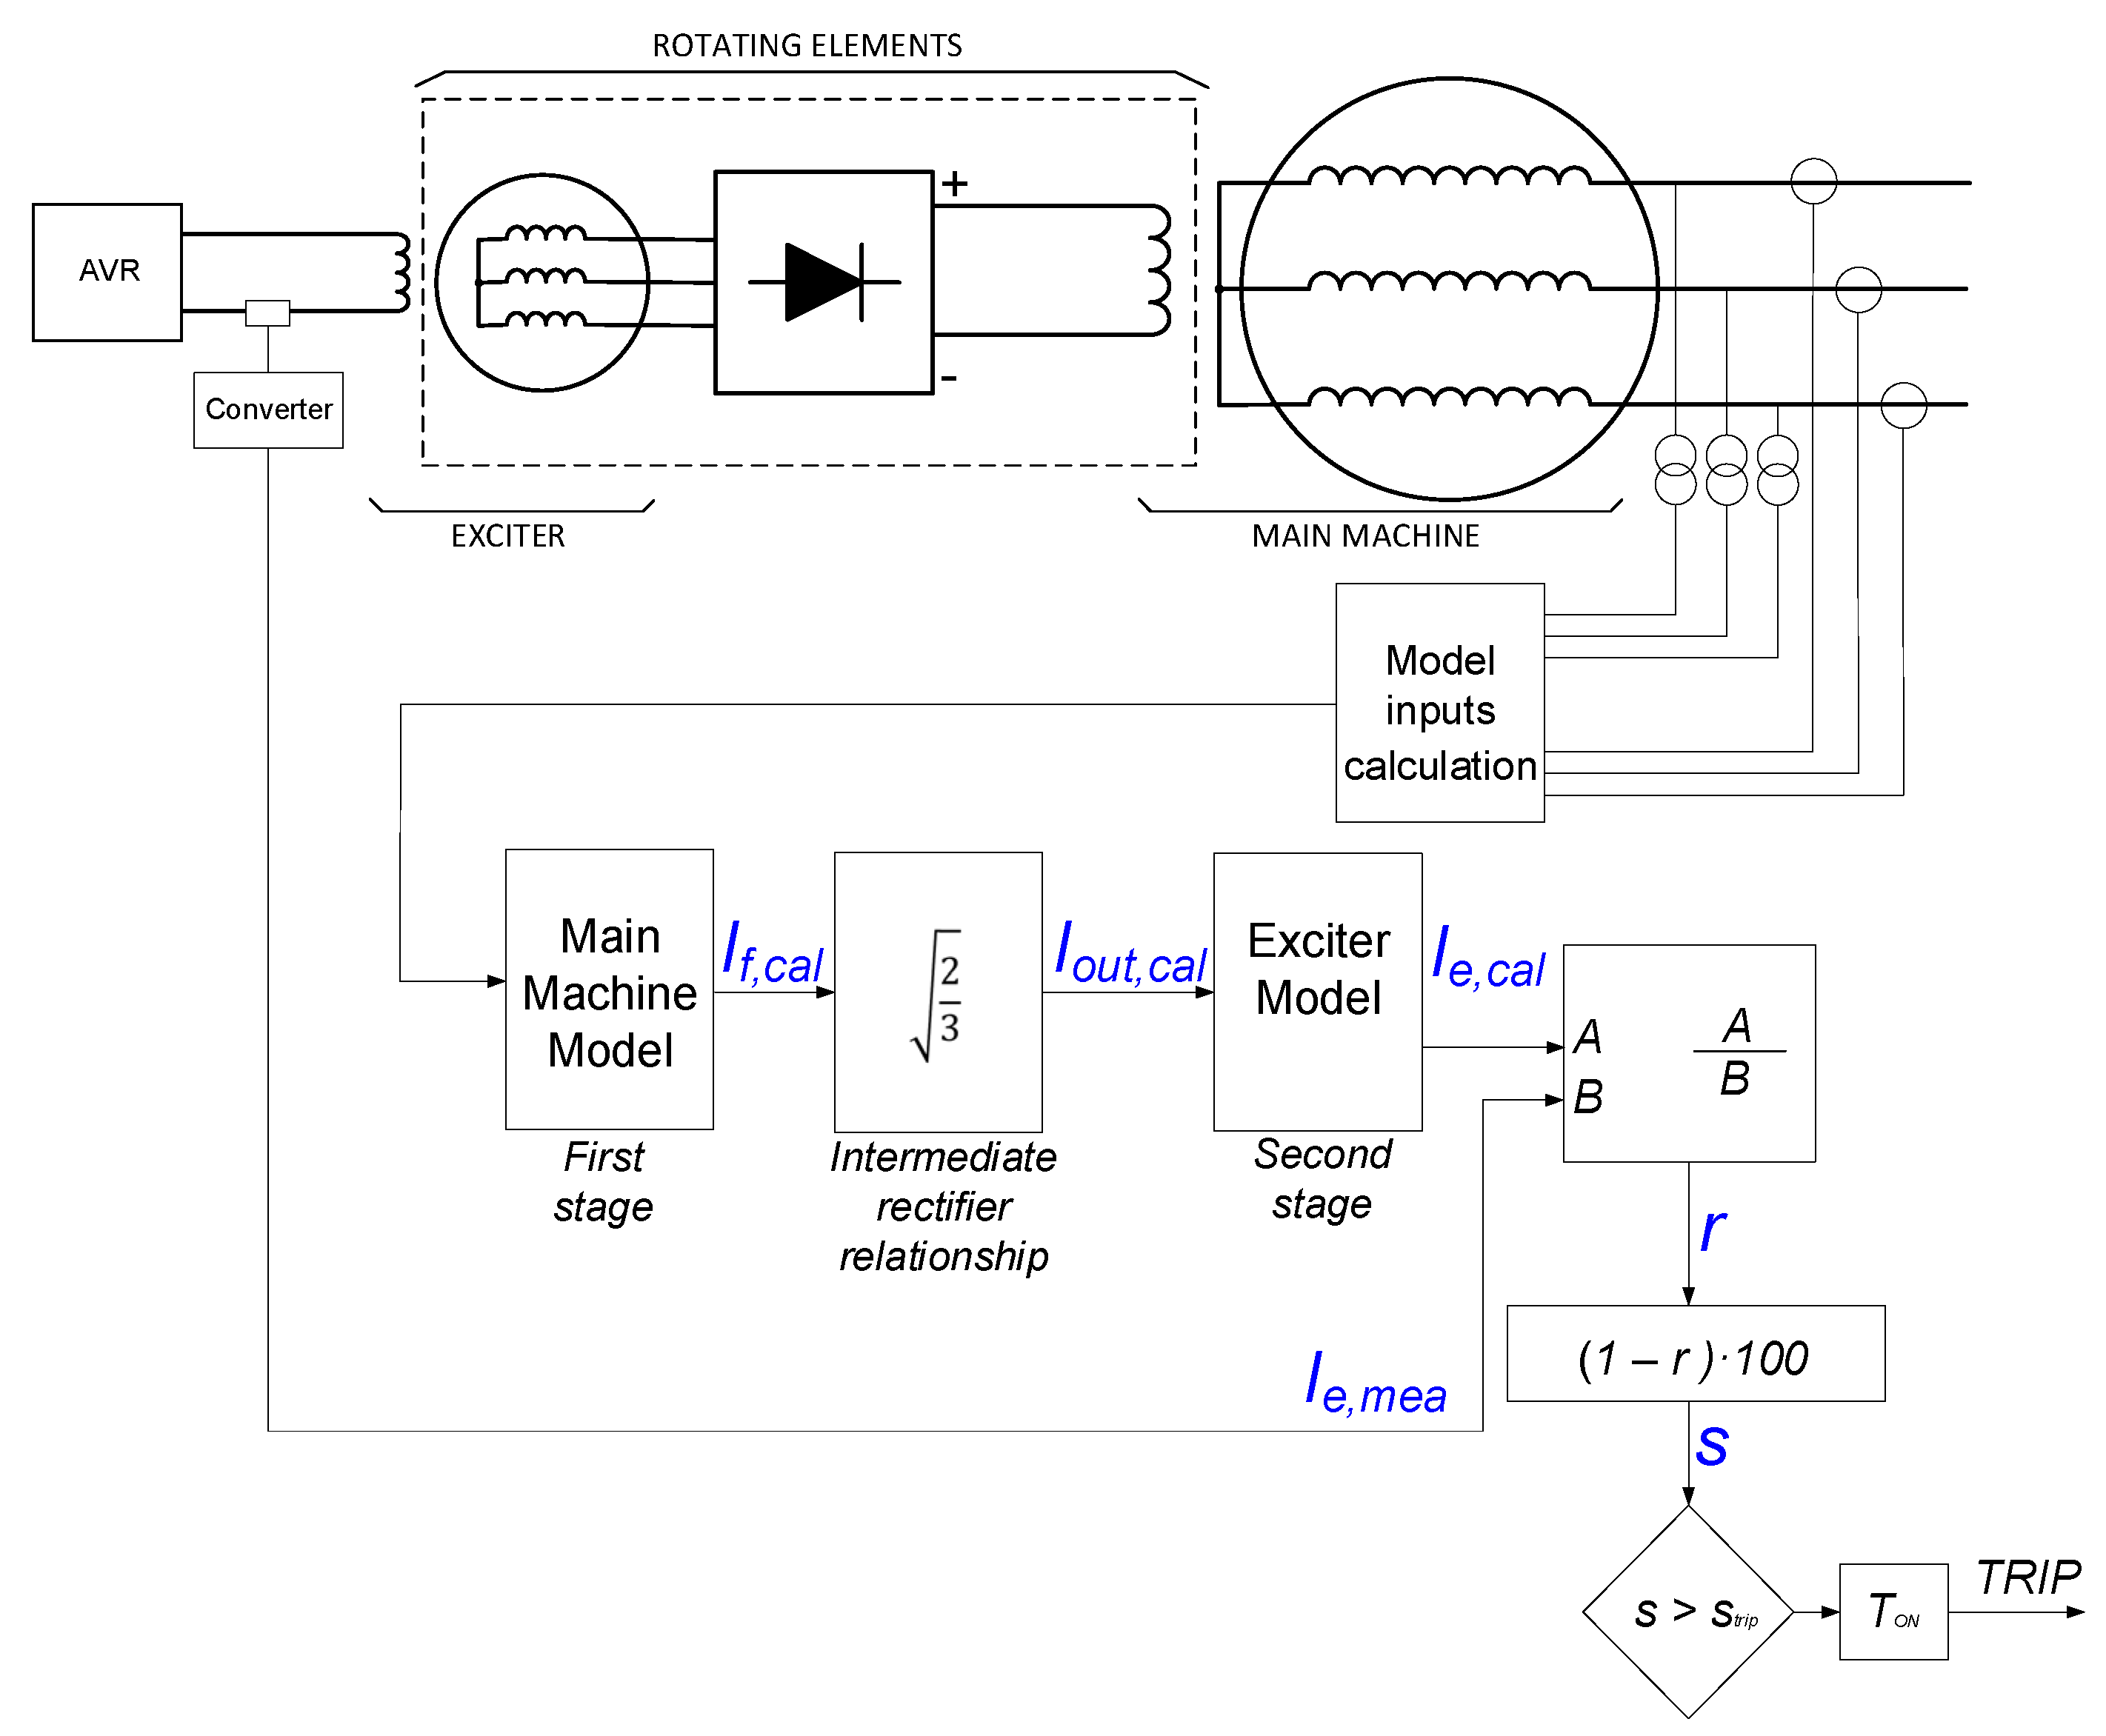
2.1. Theoretical Construction of the Healthy Model
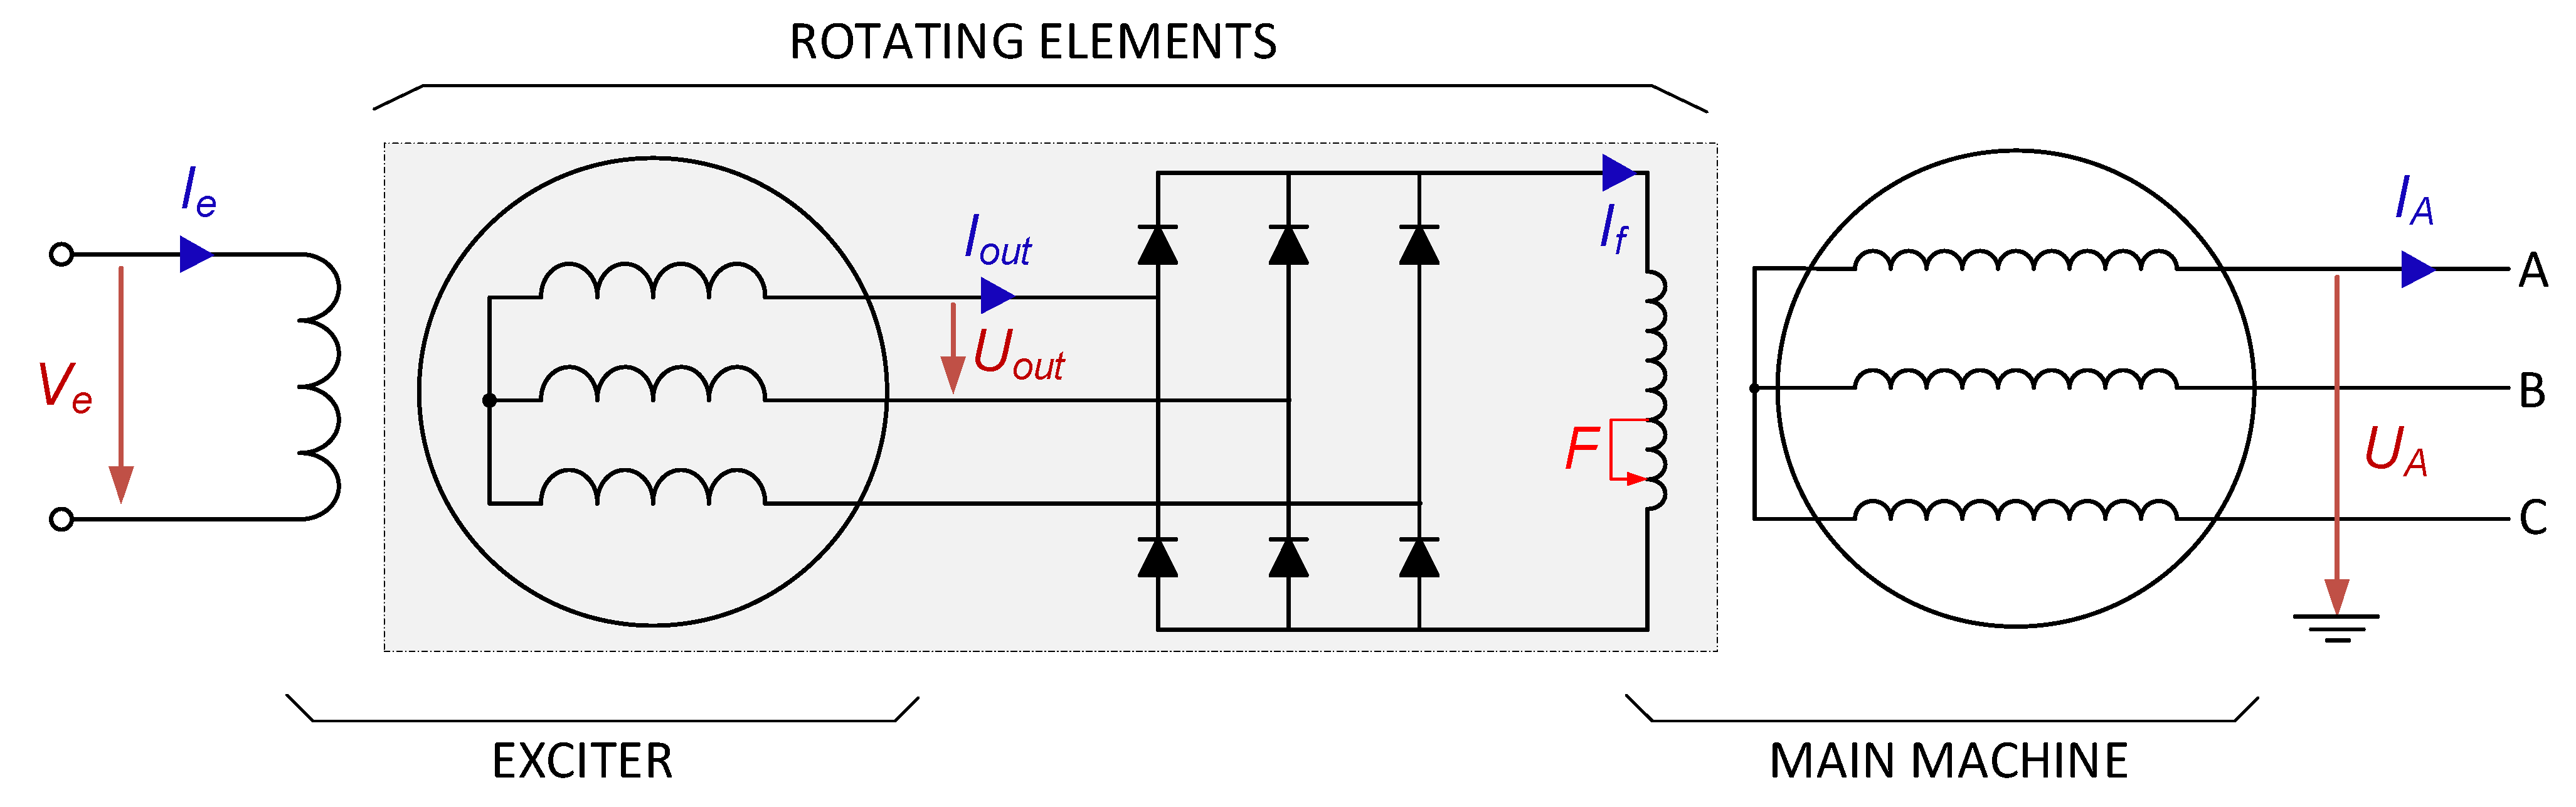
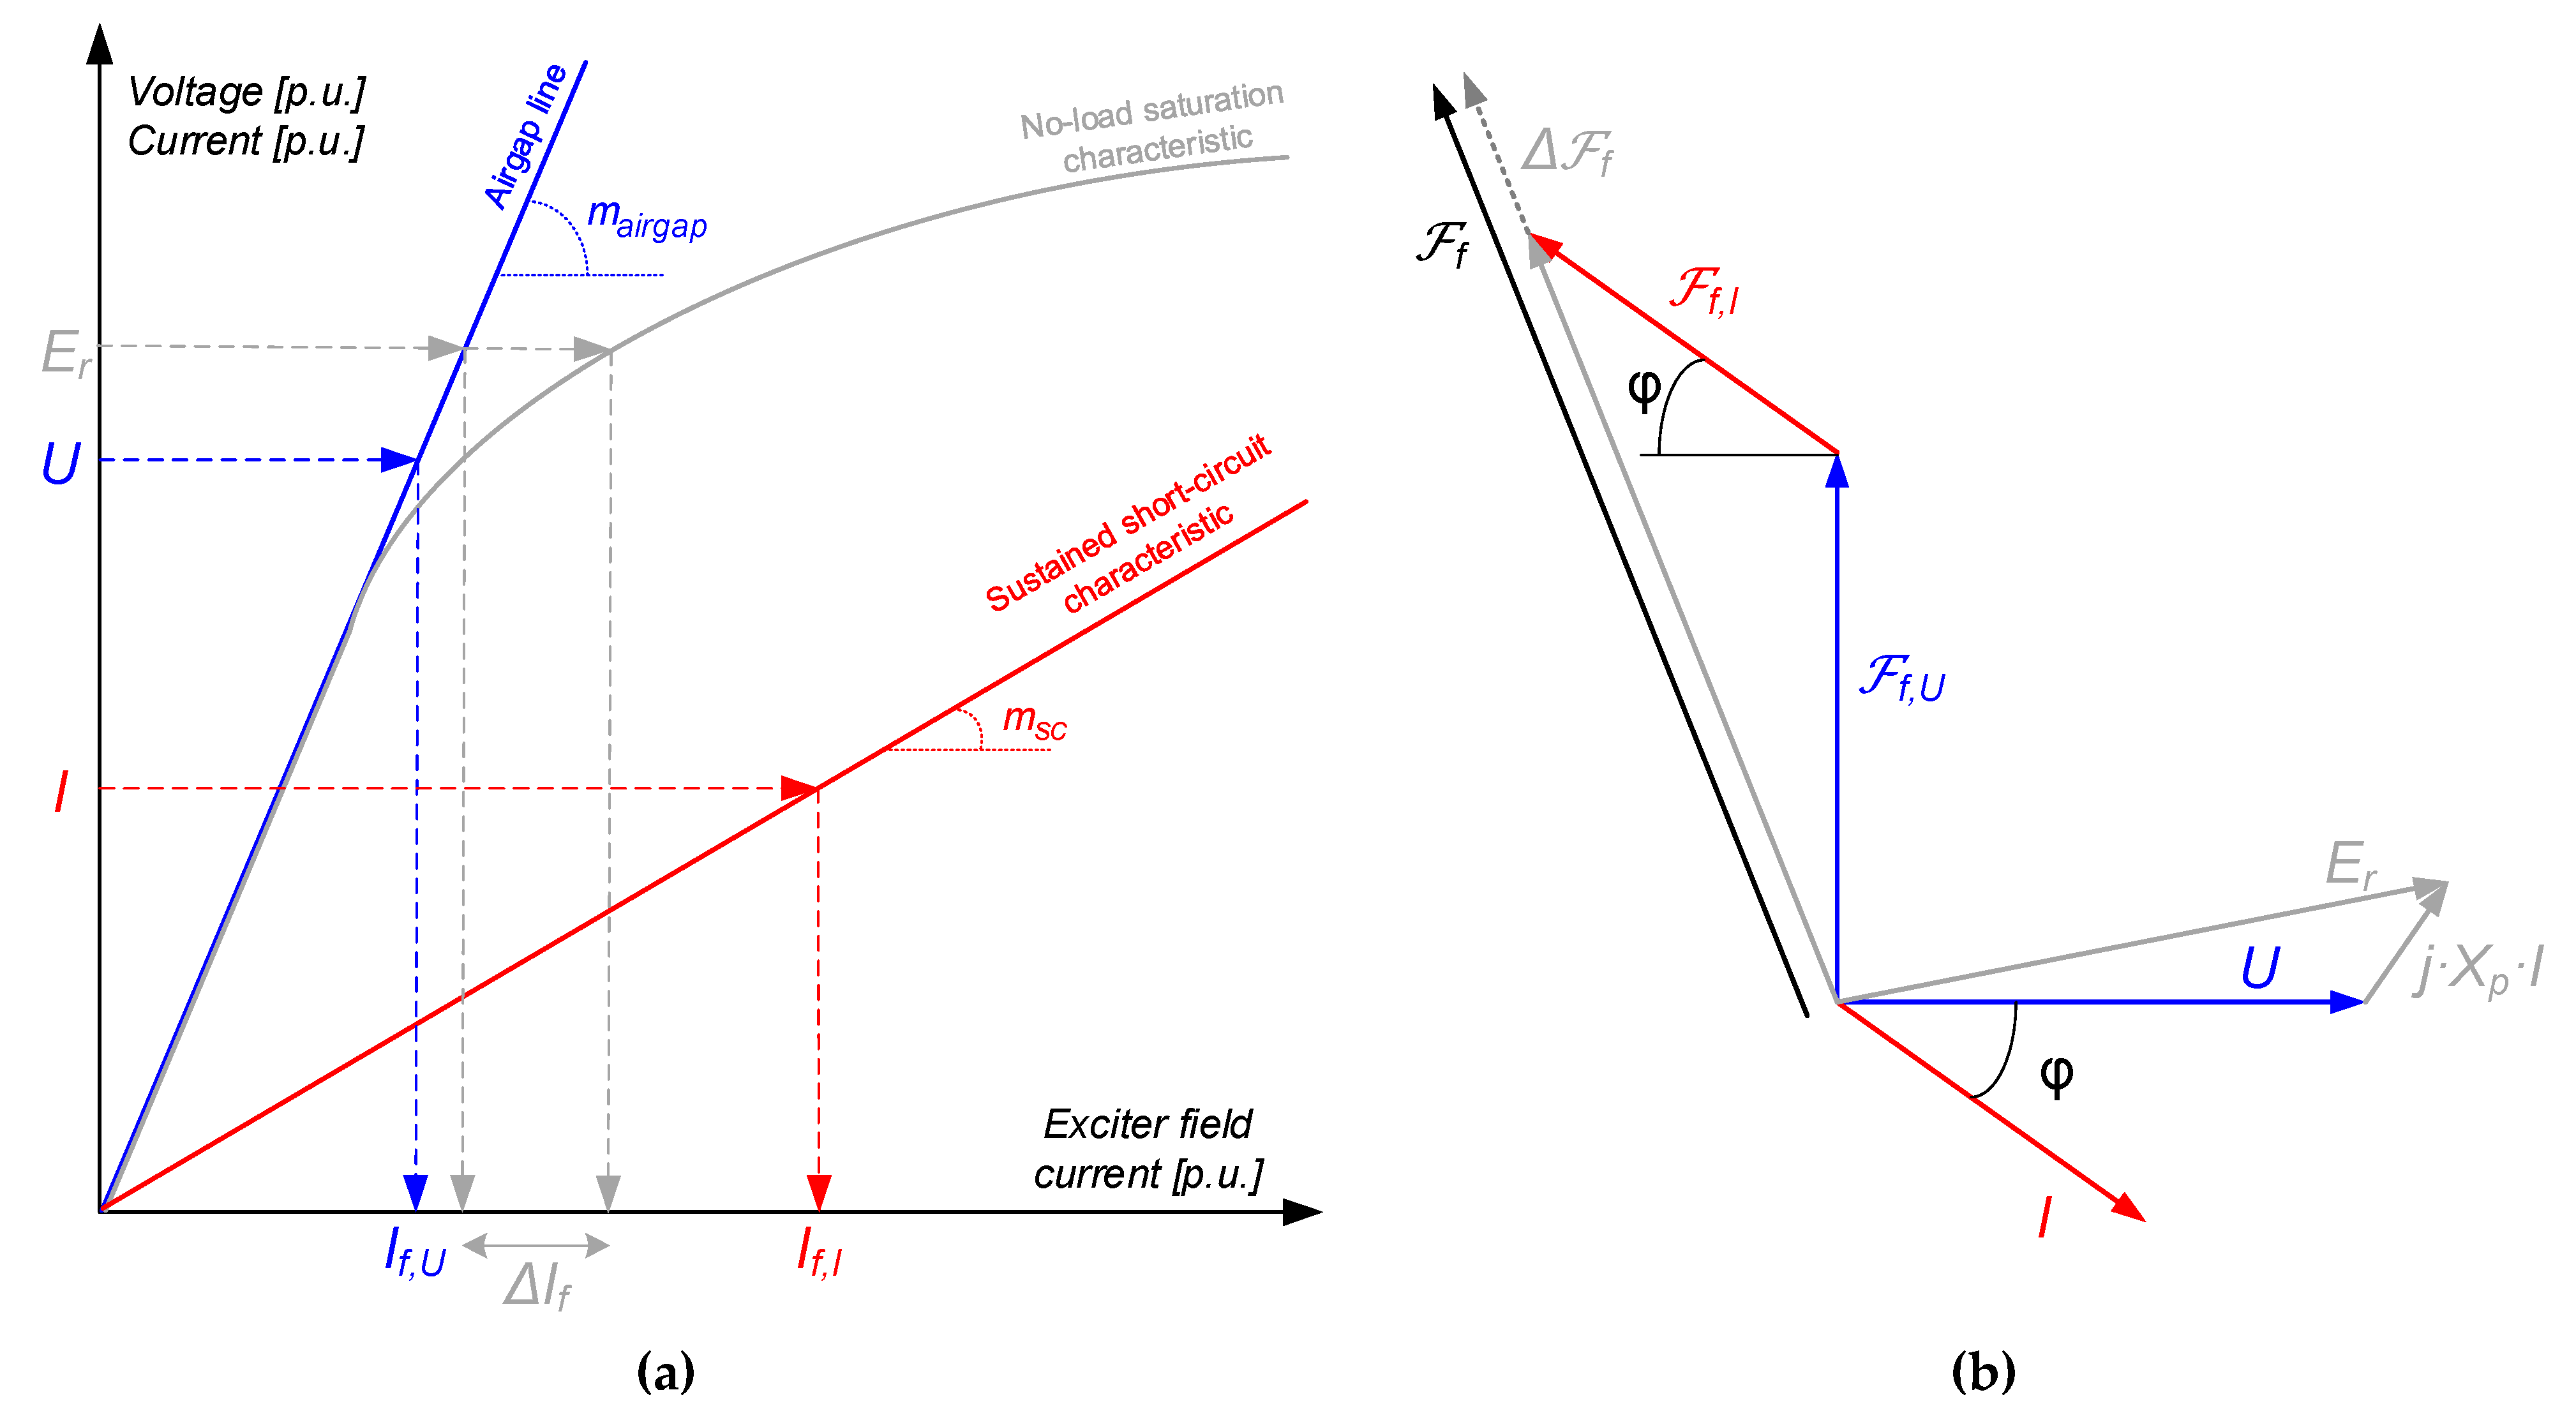
2.1.1. First Stage: Main Machine Model
- On the one hand, voltage measurements (UA and/or and/or UB and/or UC) and/or current measurements (IA and/or IB and/or IC). Eventually, line voltages (UAB and/or UAC and/or UBC) could be also used instead of phase voltages;
- On the other hand, the active power measurement (P) and/or reactive power measurement (Q). Alternatively, the apparent power measurement (S) could be used as a replacement for either P or Q.
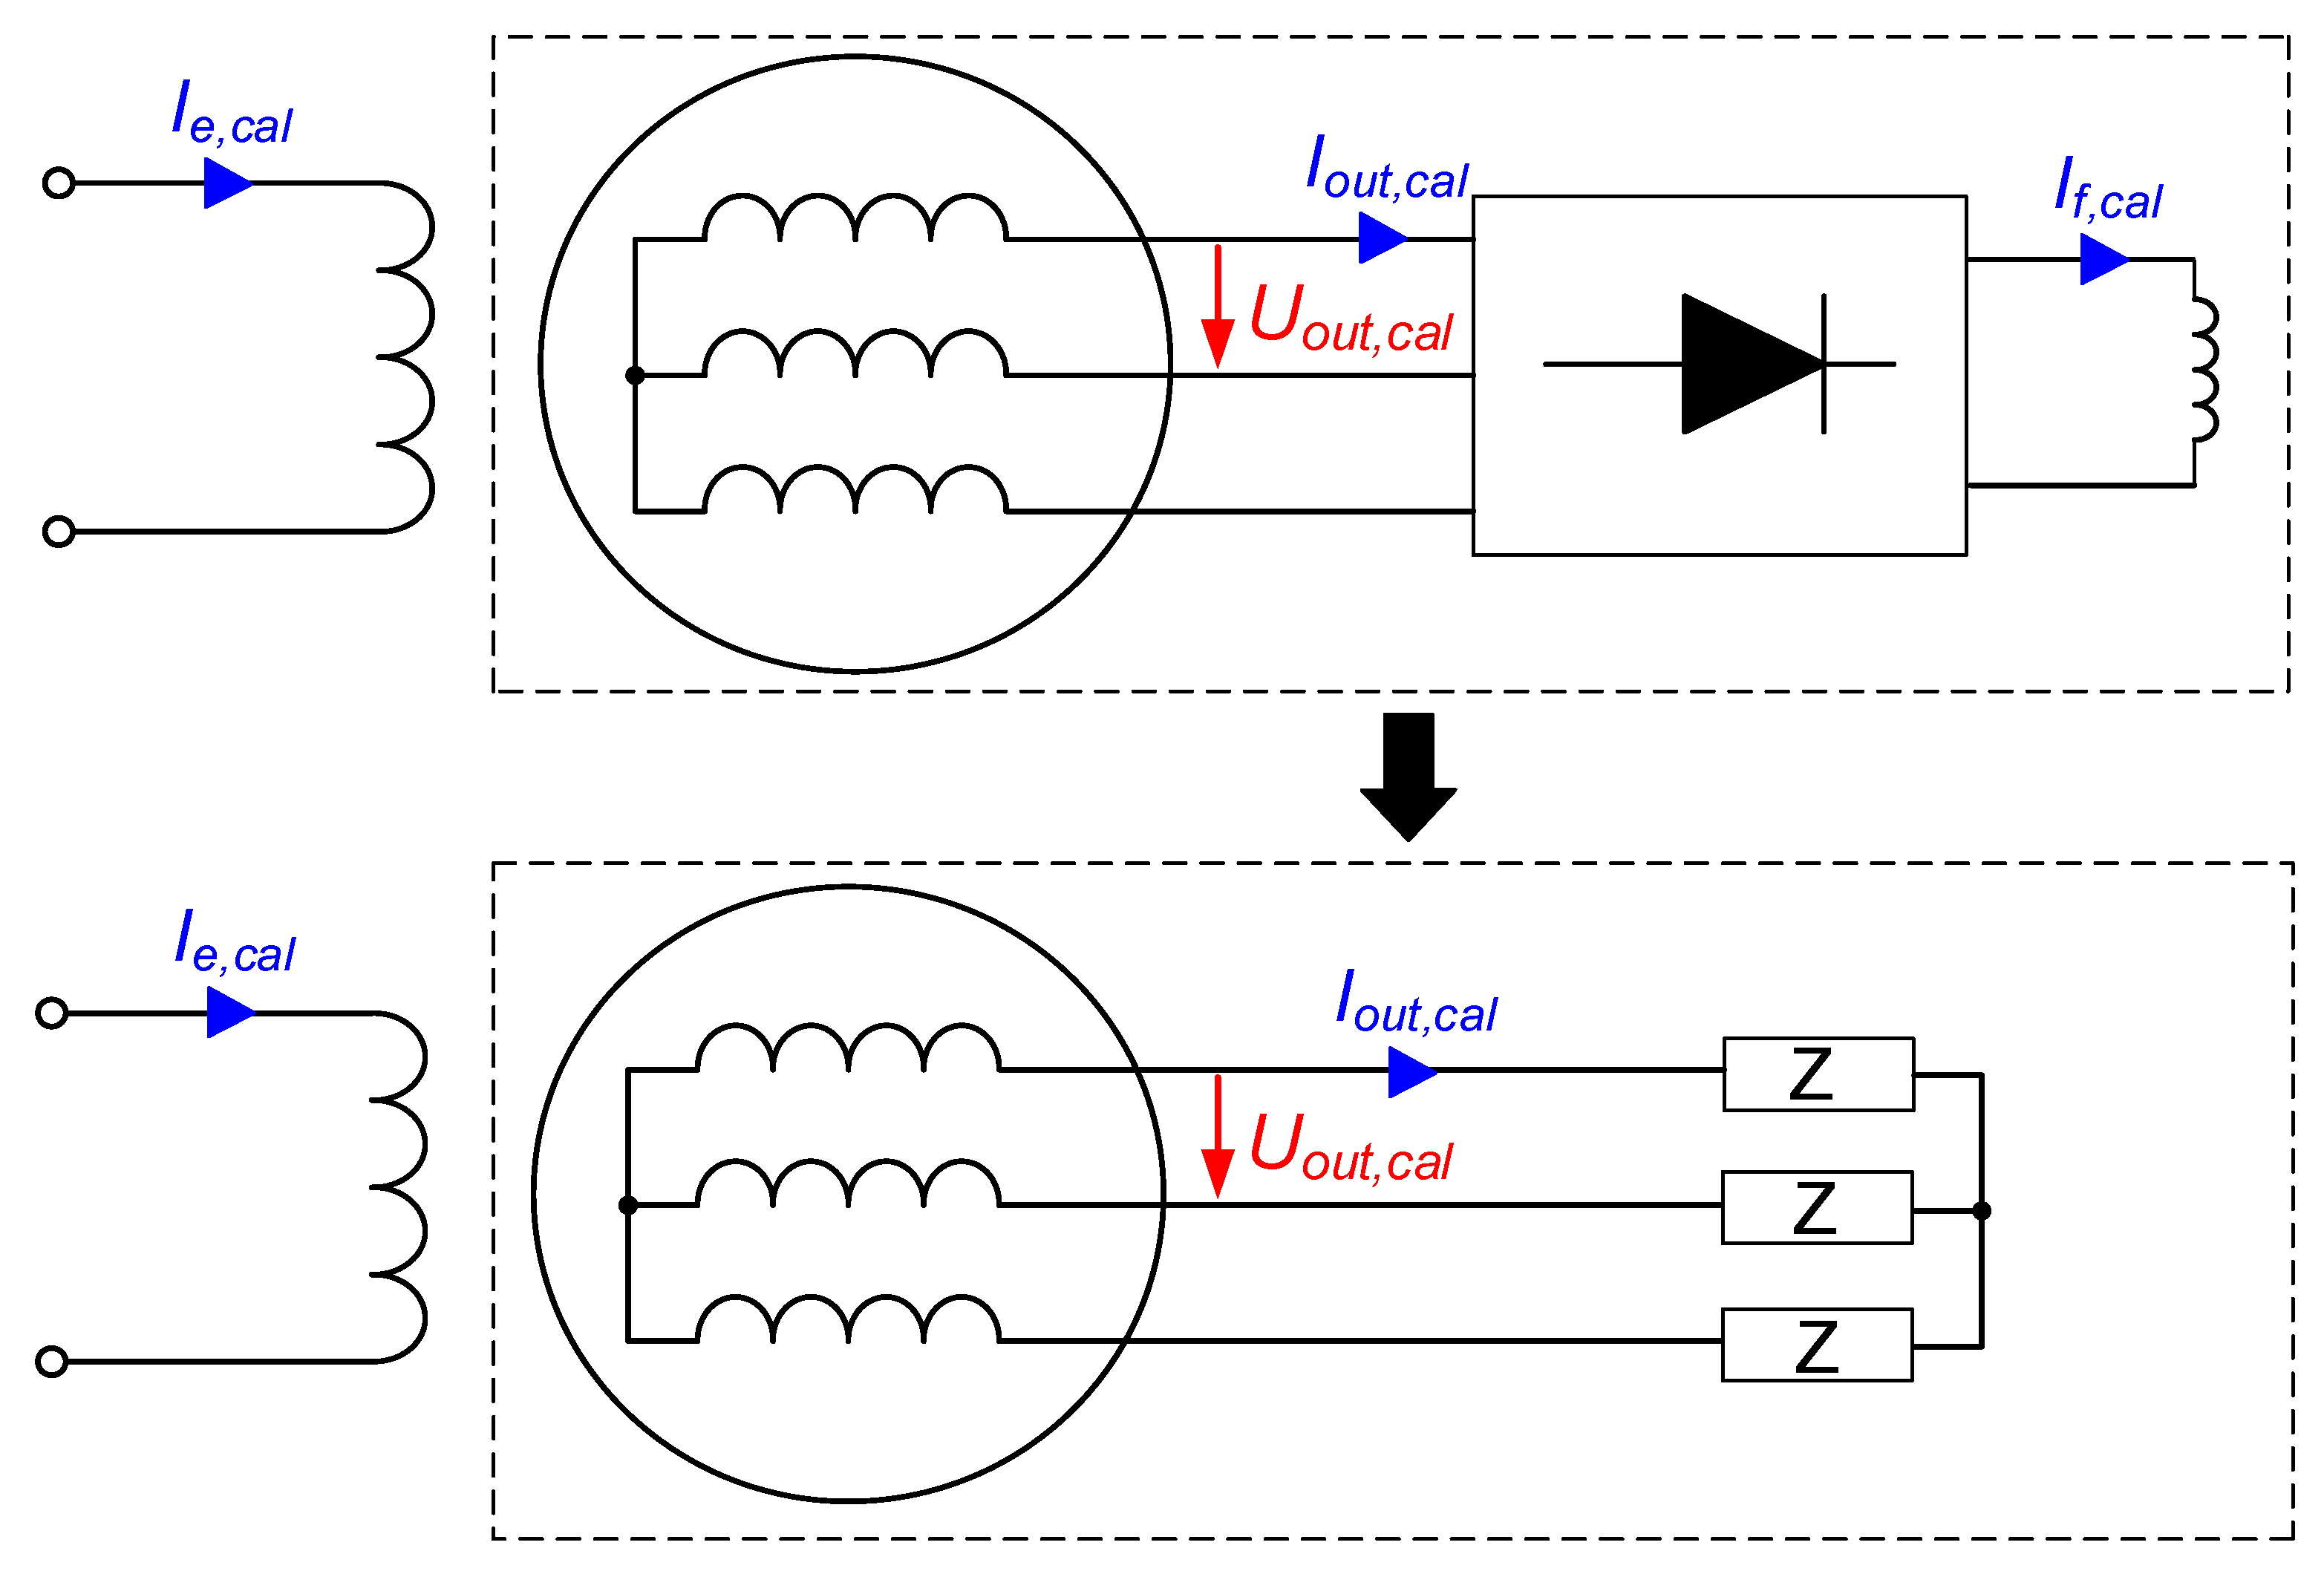
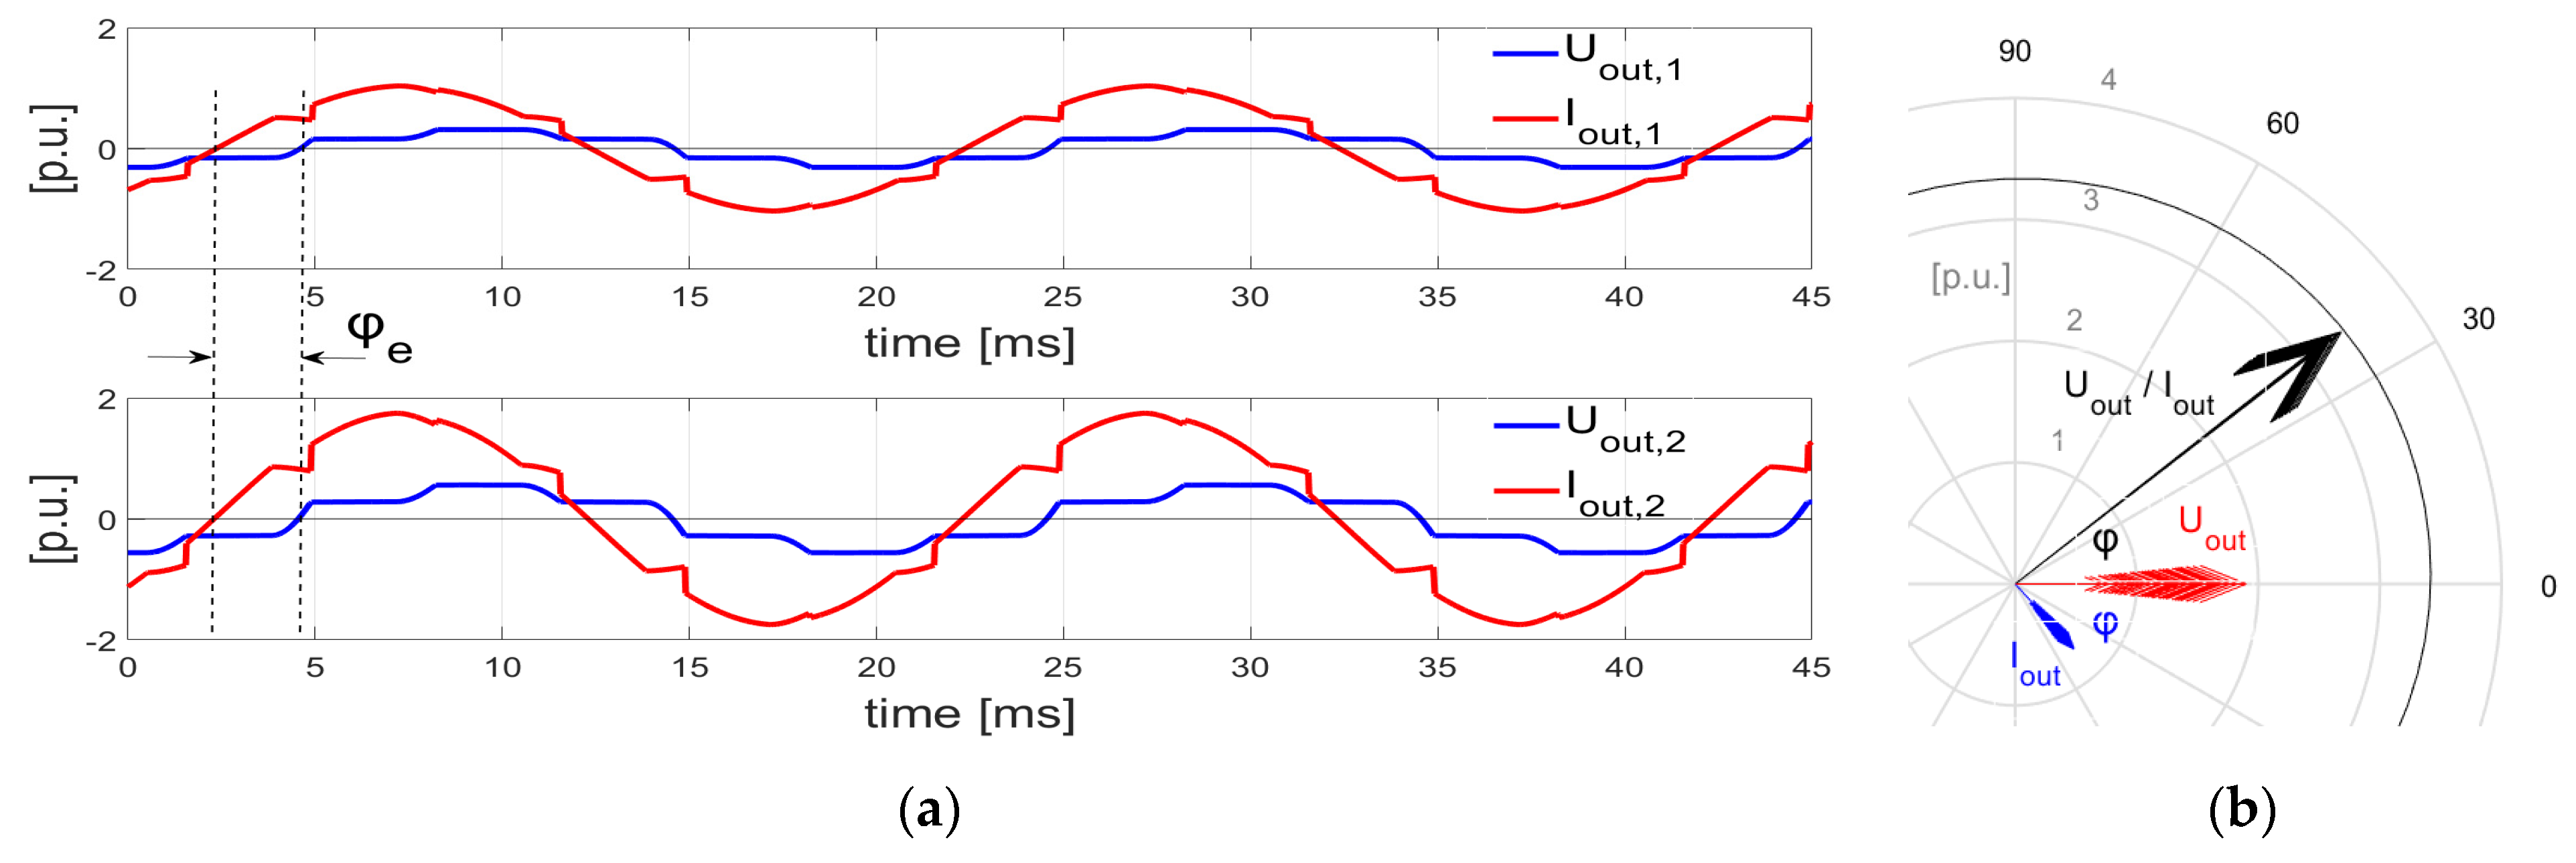
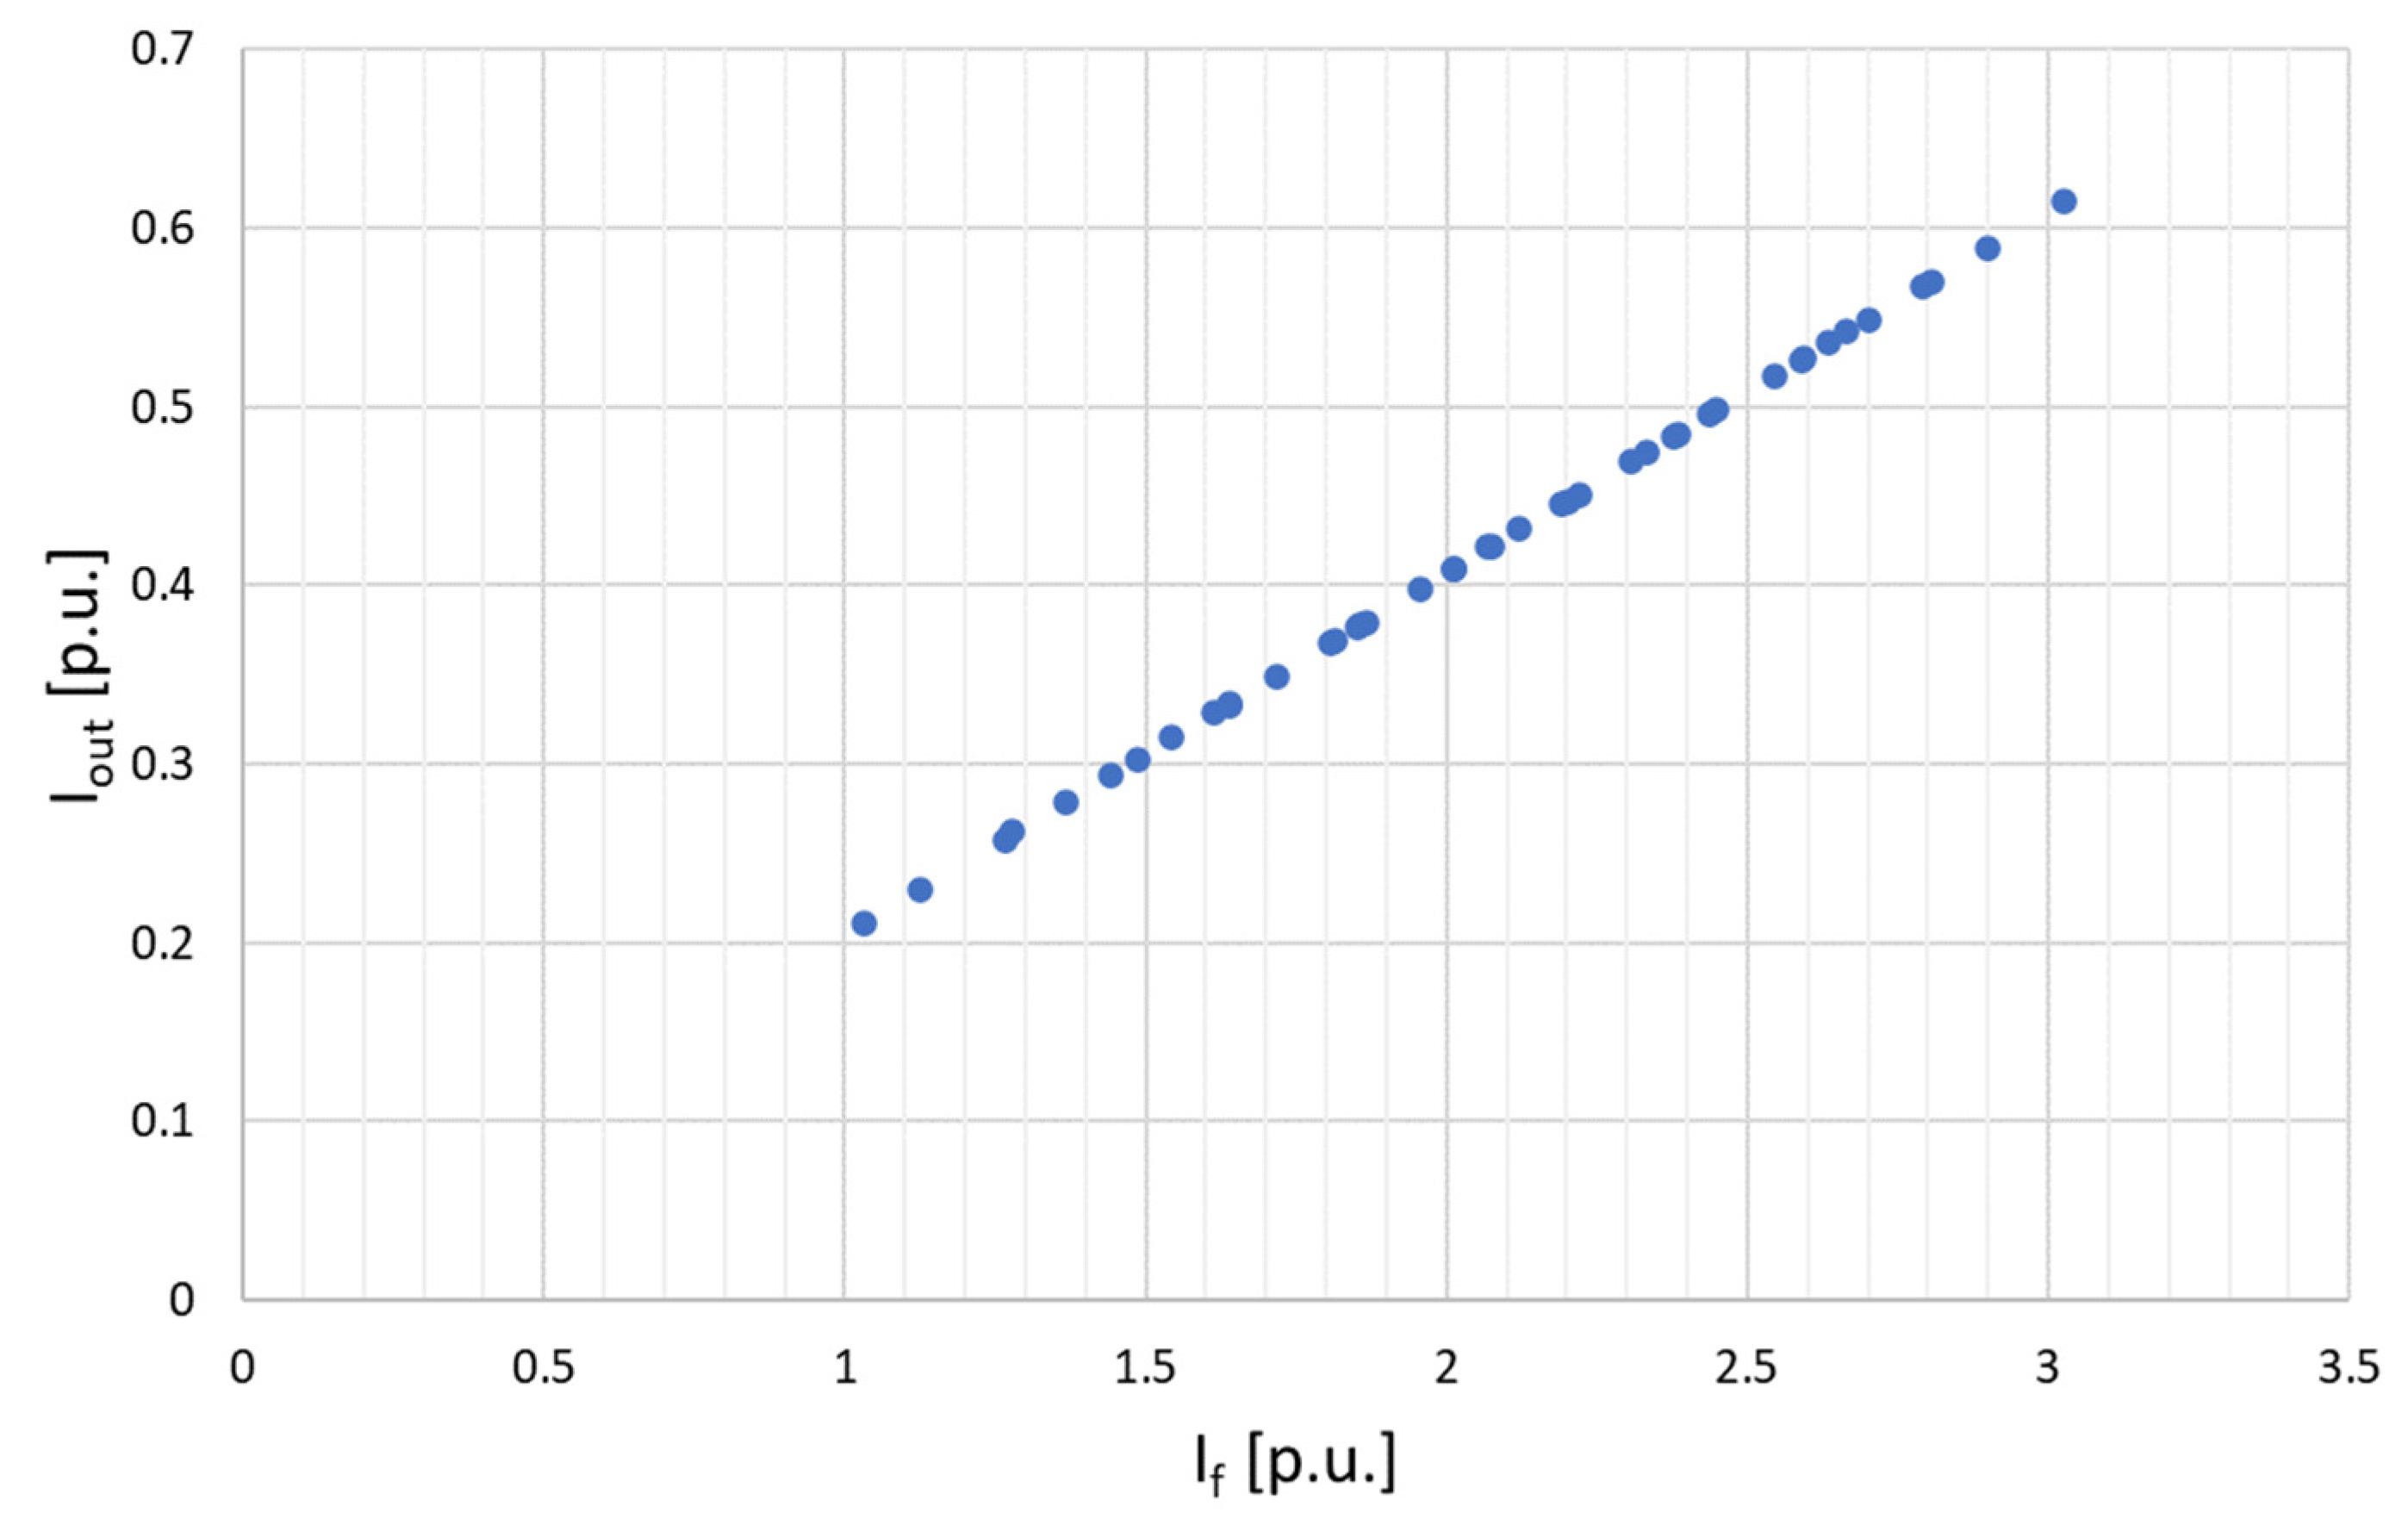
2.1.2. Intermediate Rectifier Relationship
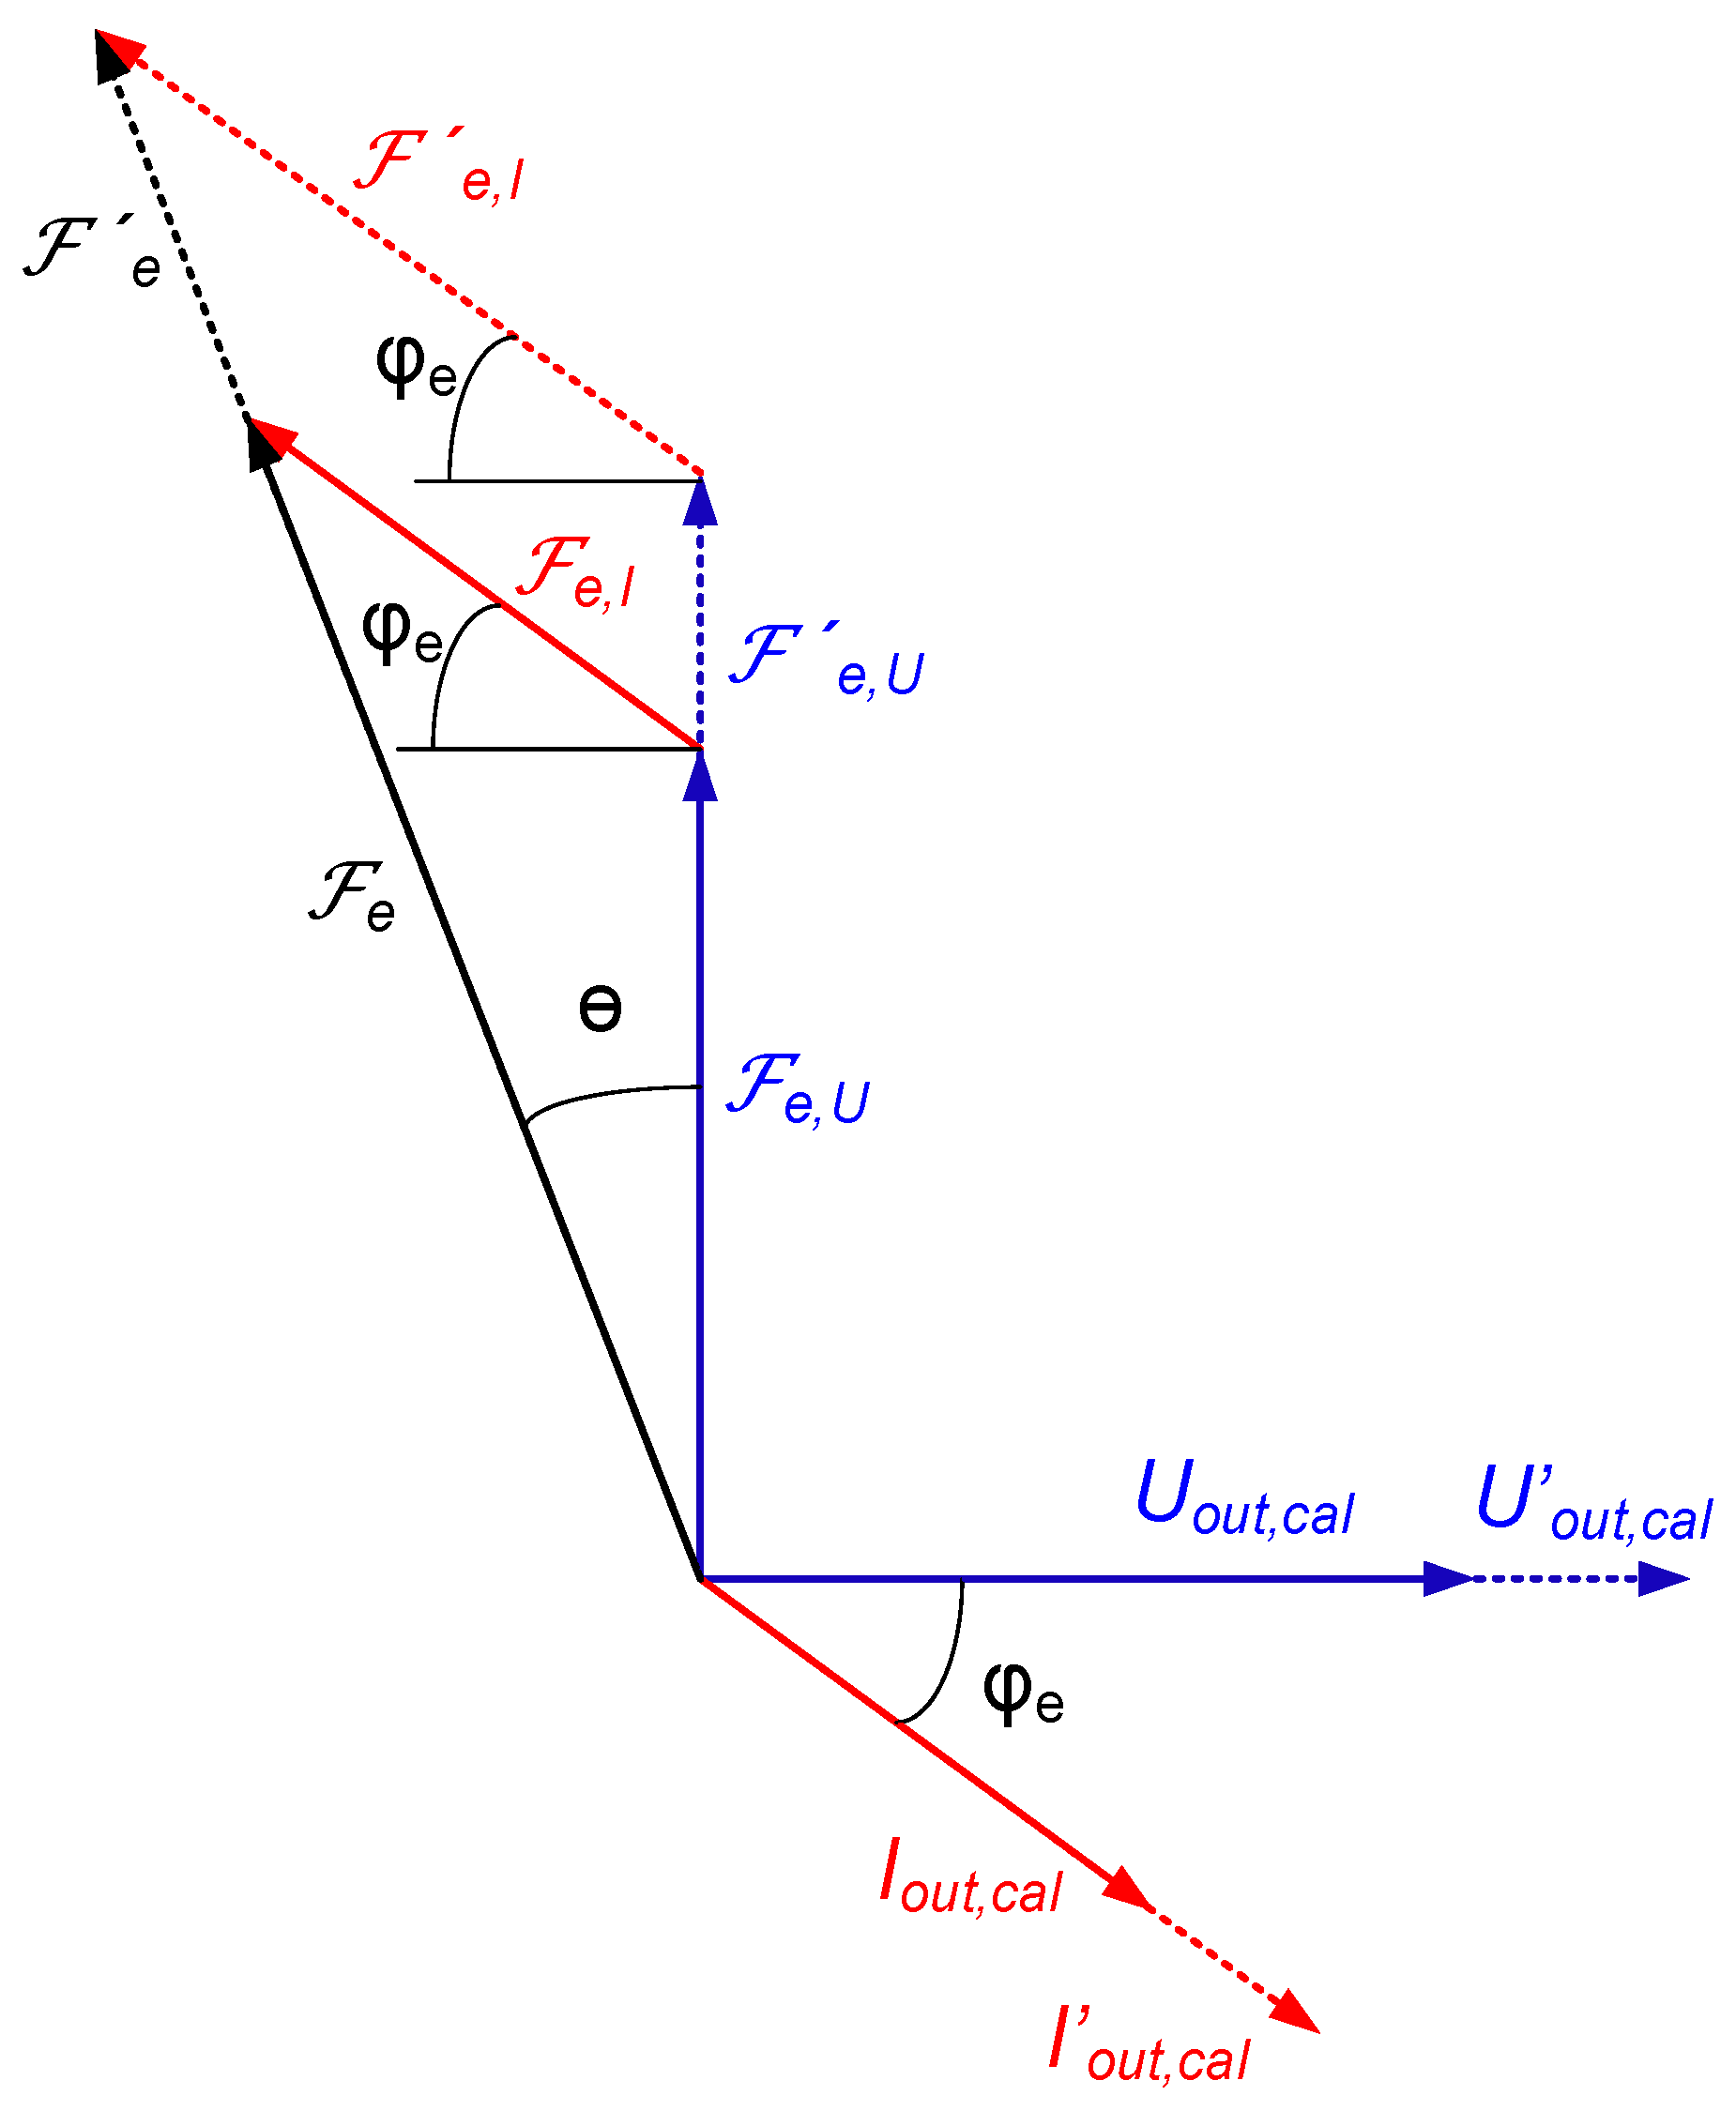
2.1.3. Second Stage: Exciter Model
2.2. Fault Detection Method
- Main machine model
- 2.
- Intermediate rectifier relationship
- 3.
- Exciter model
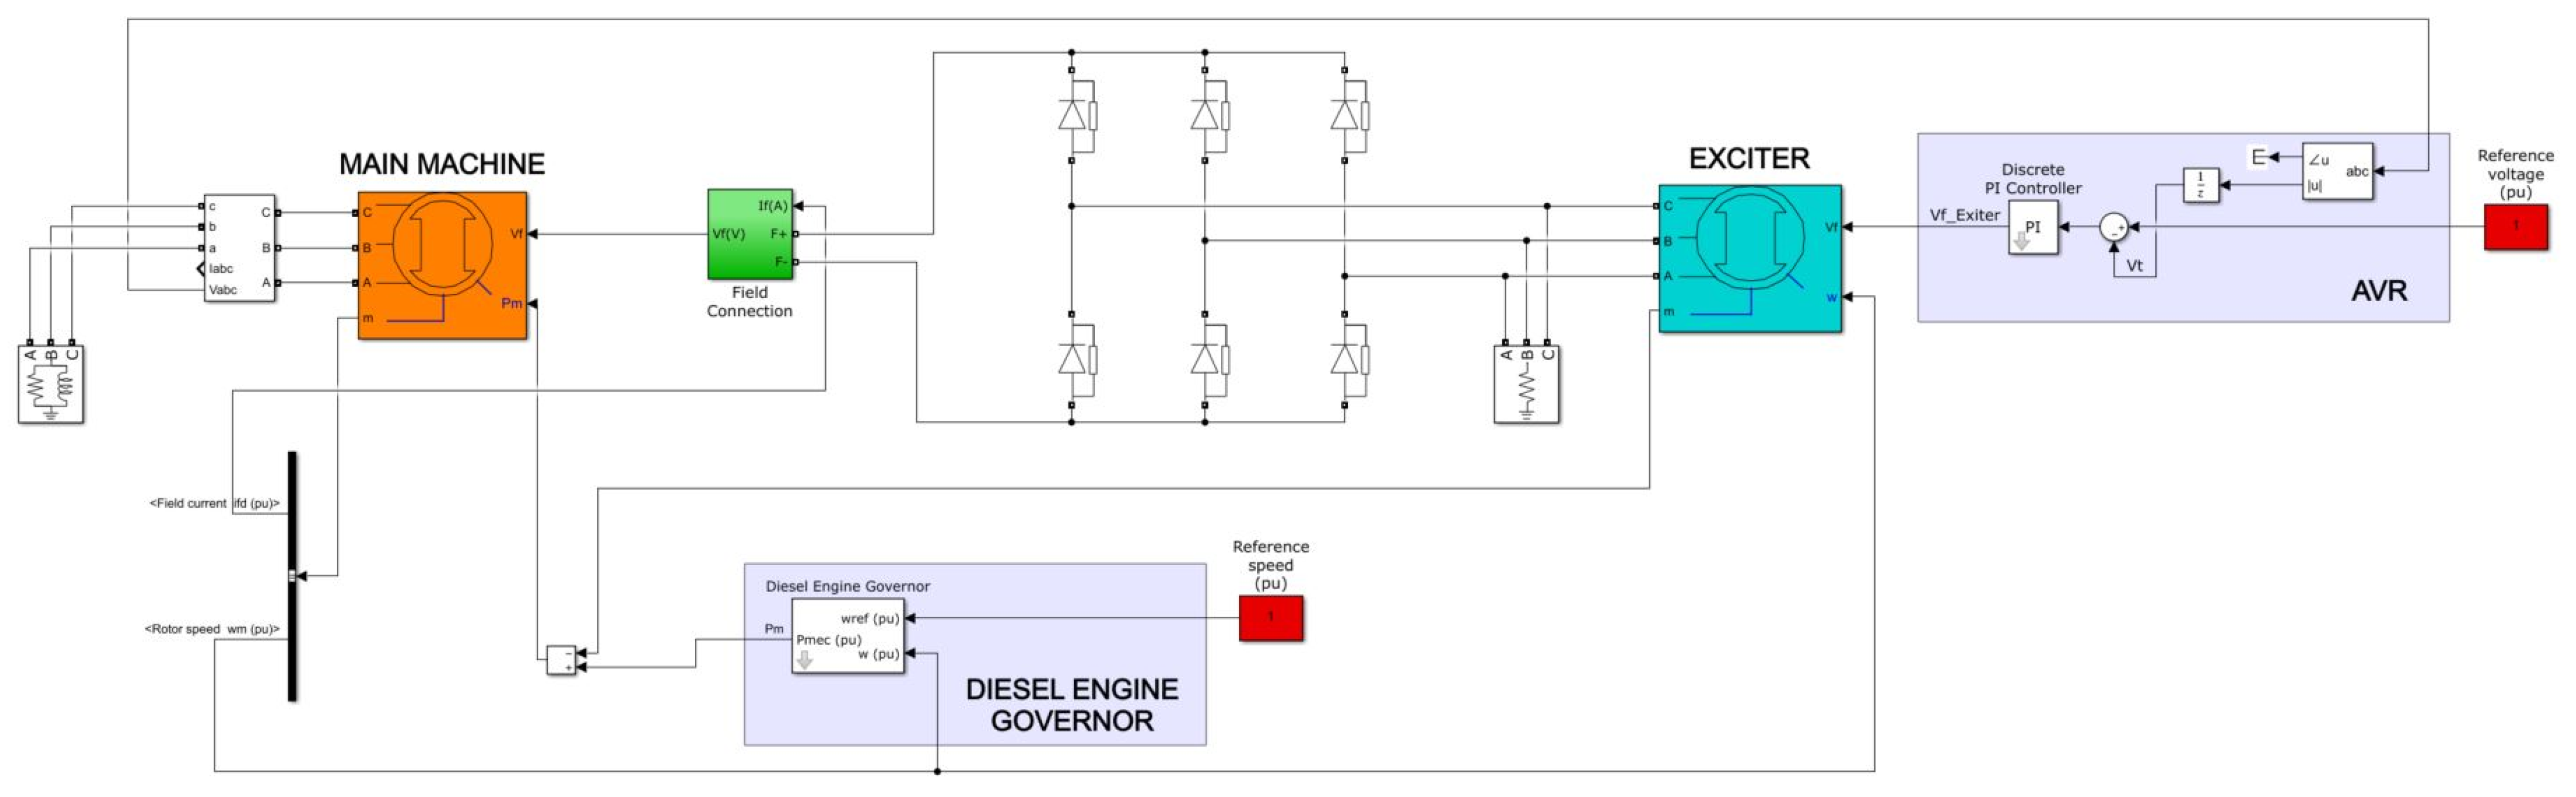
3. Computer Simulations
3.1. Computer Simulation Model
3.2. Healthy Condition Simulations
3.3. Faulty Condition Simulations
4. Experimental Tests
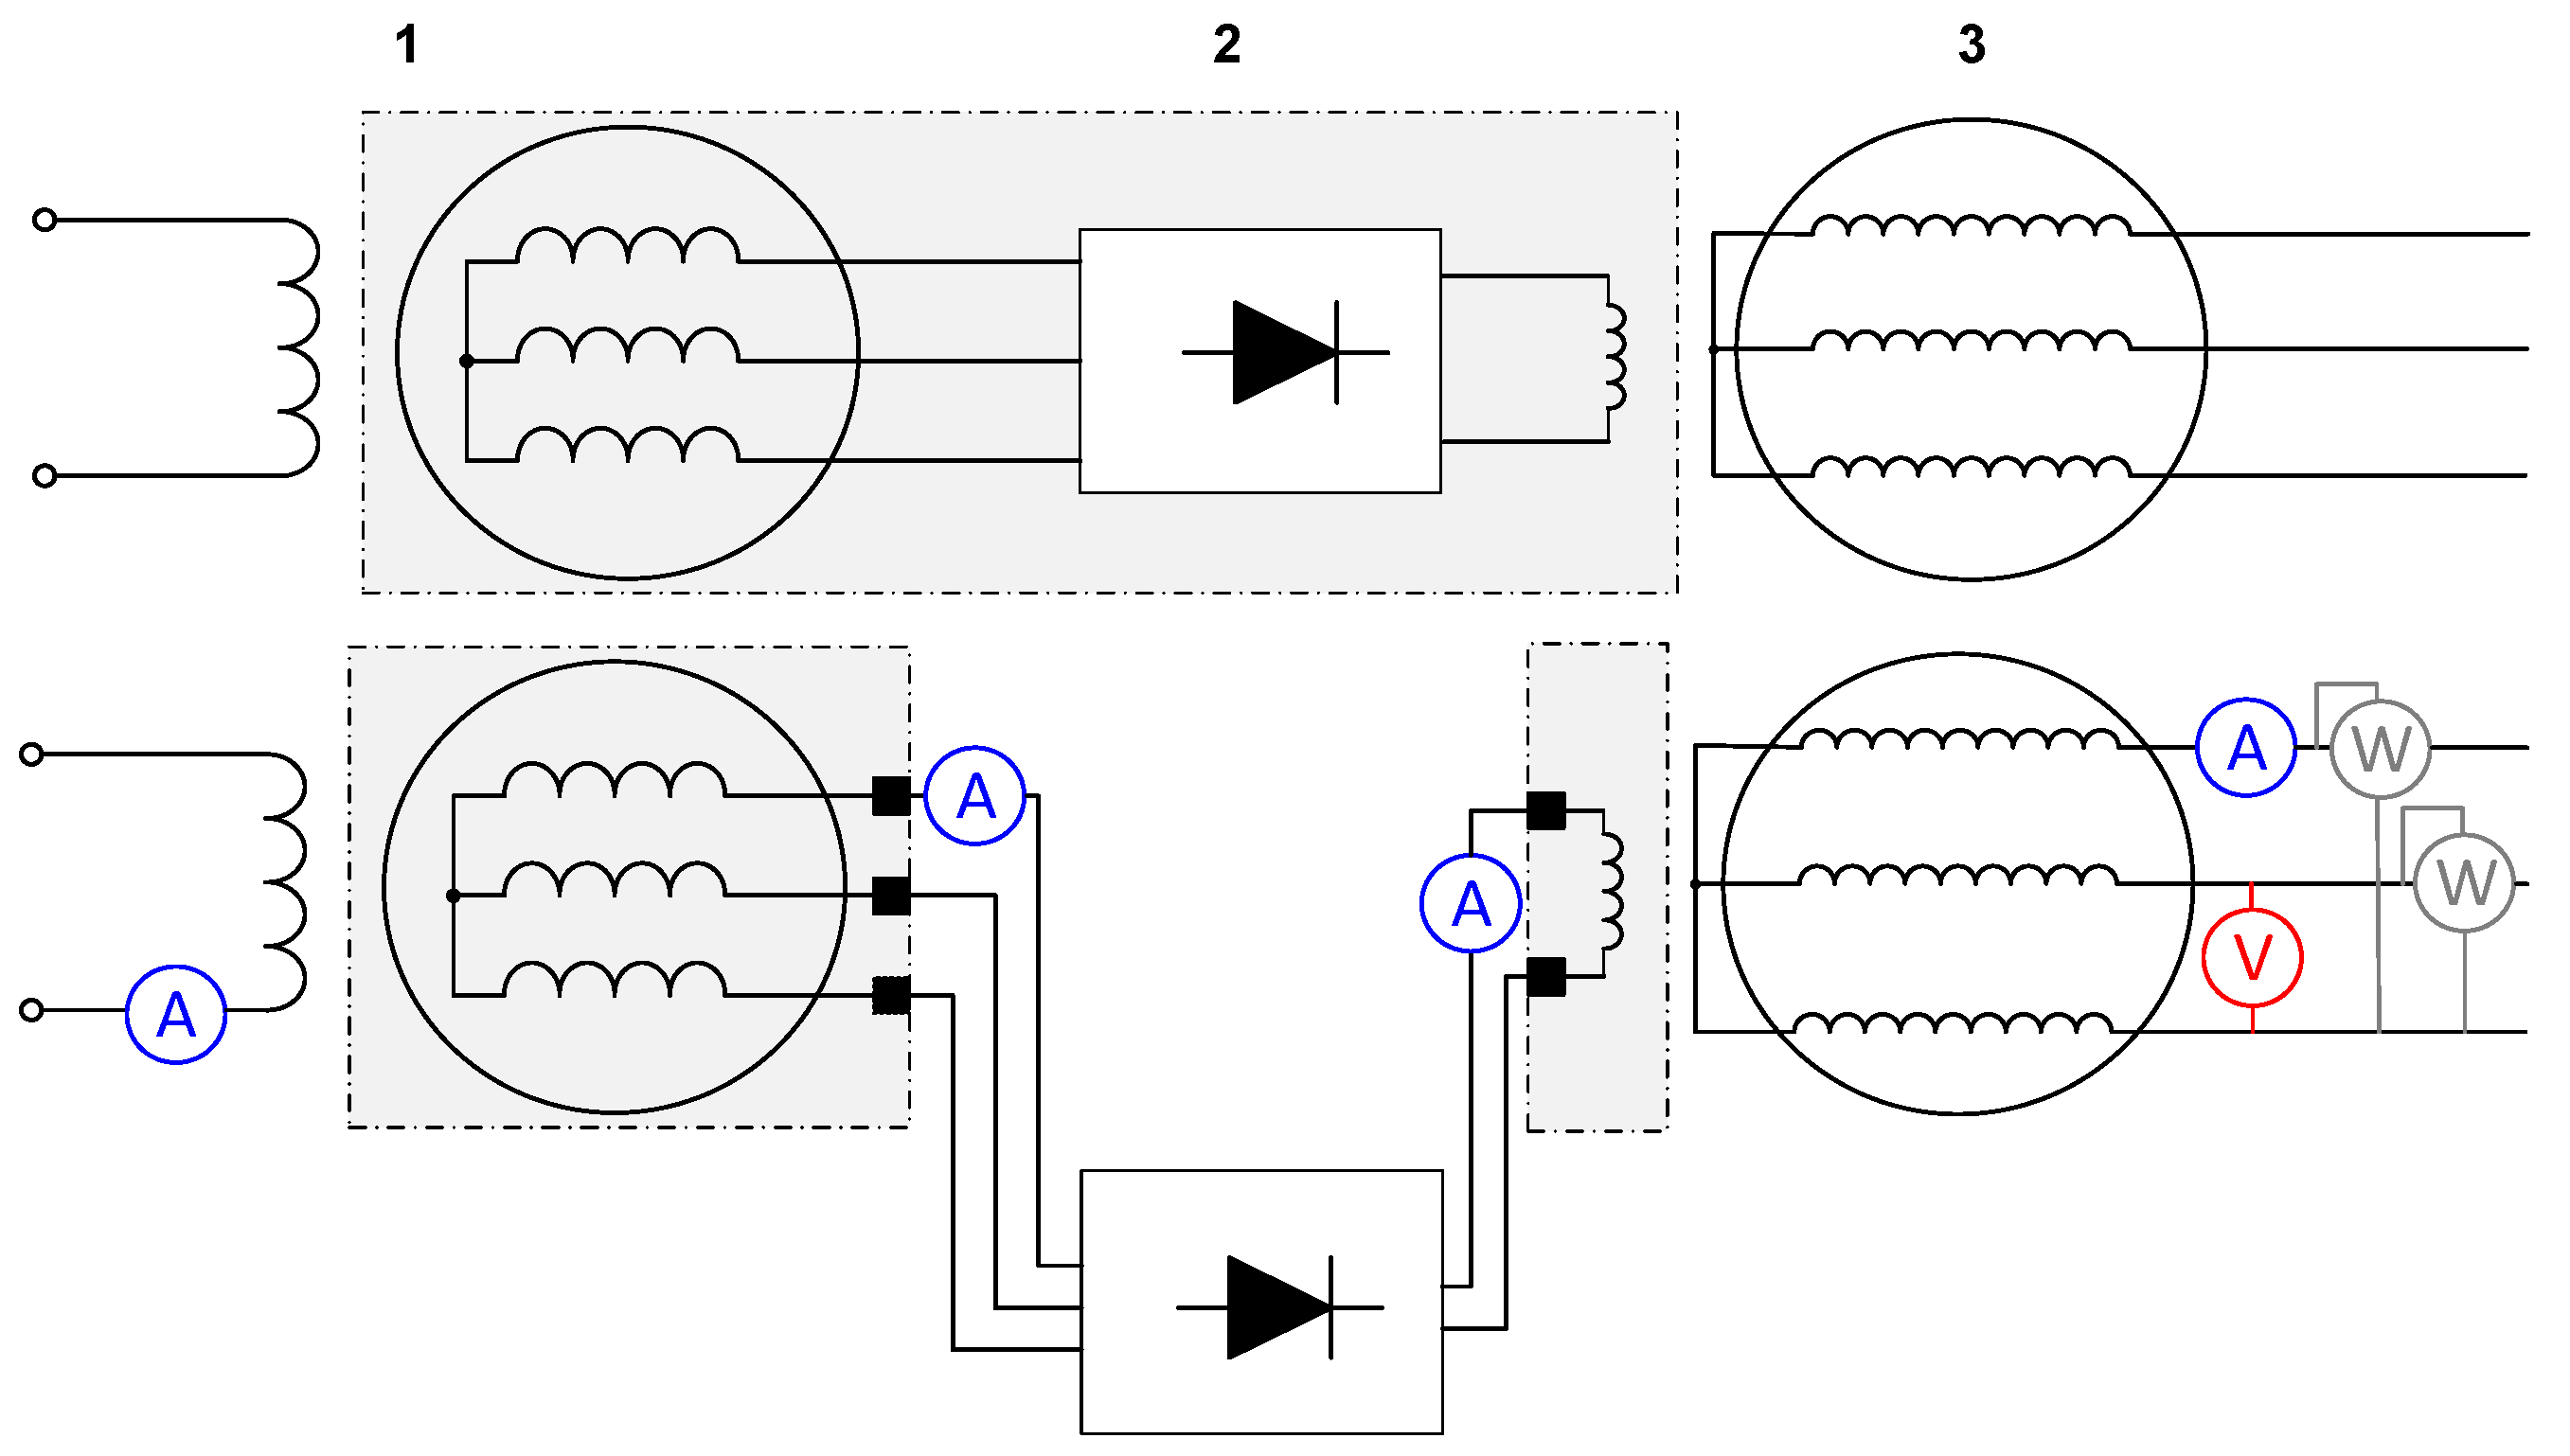
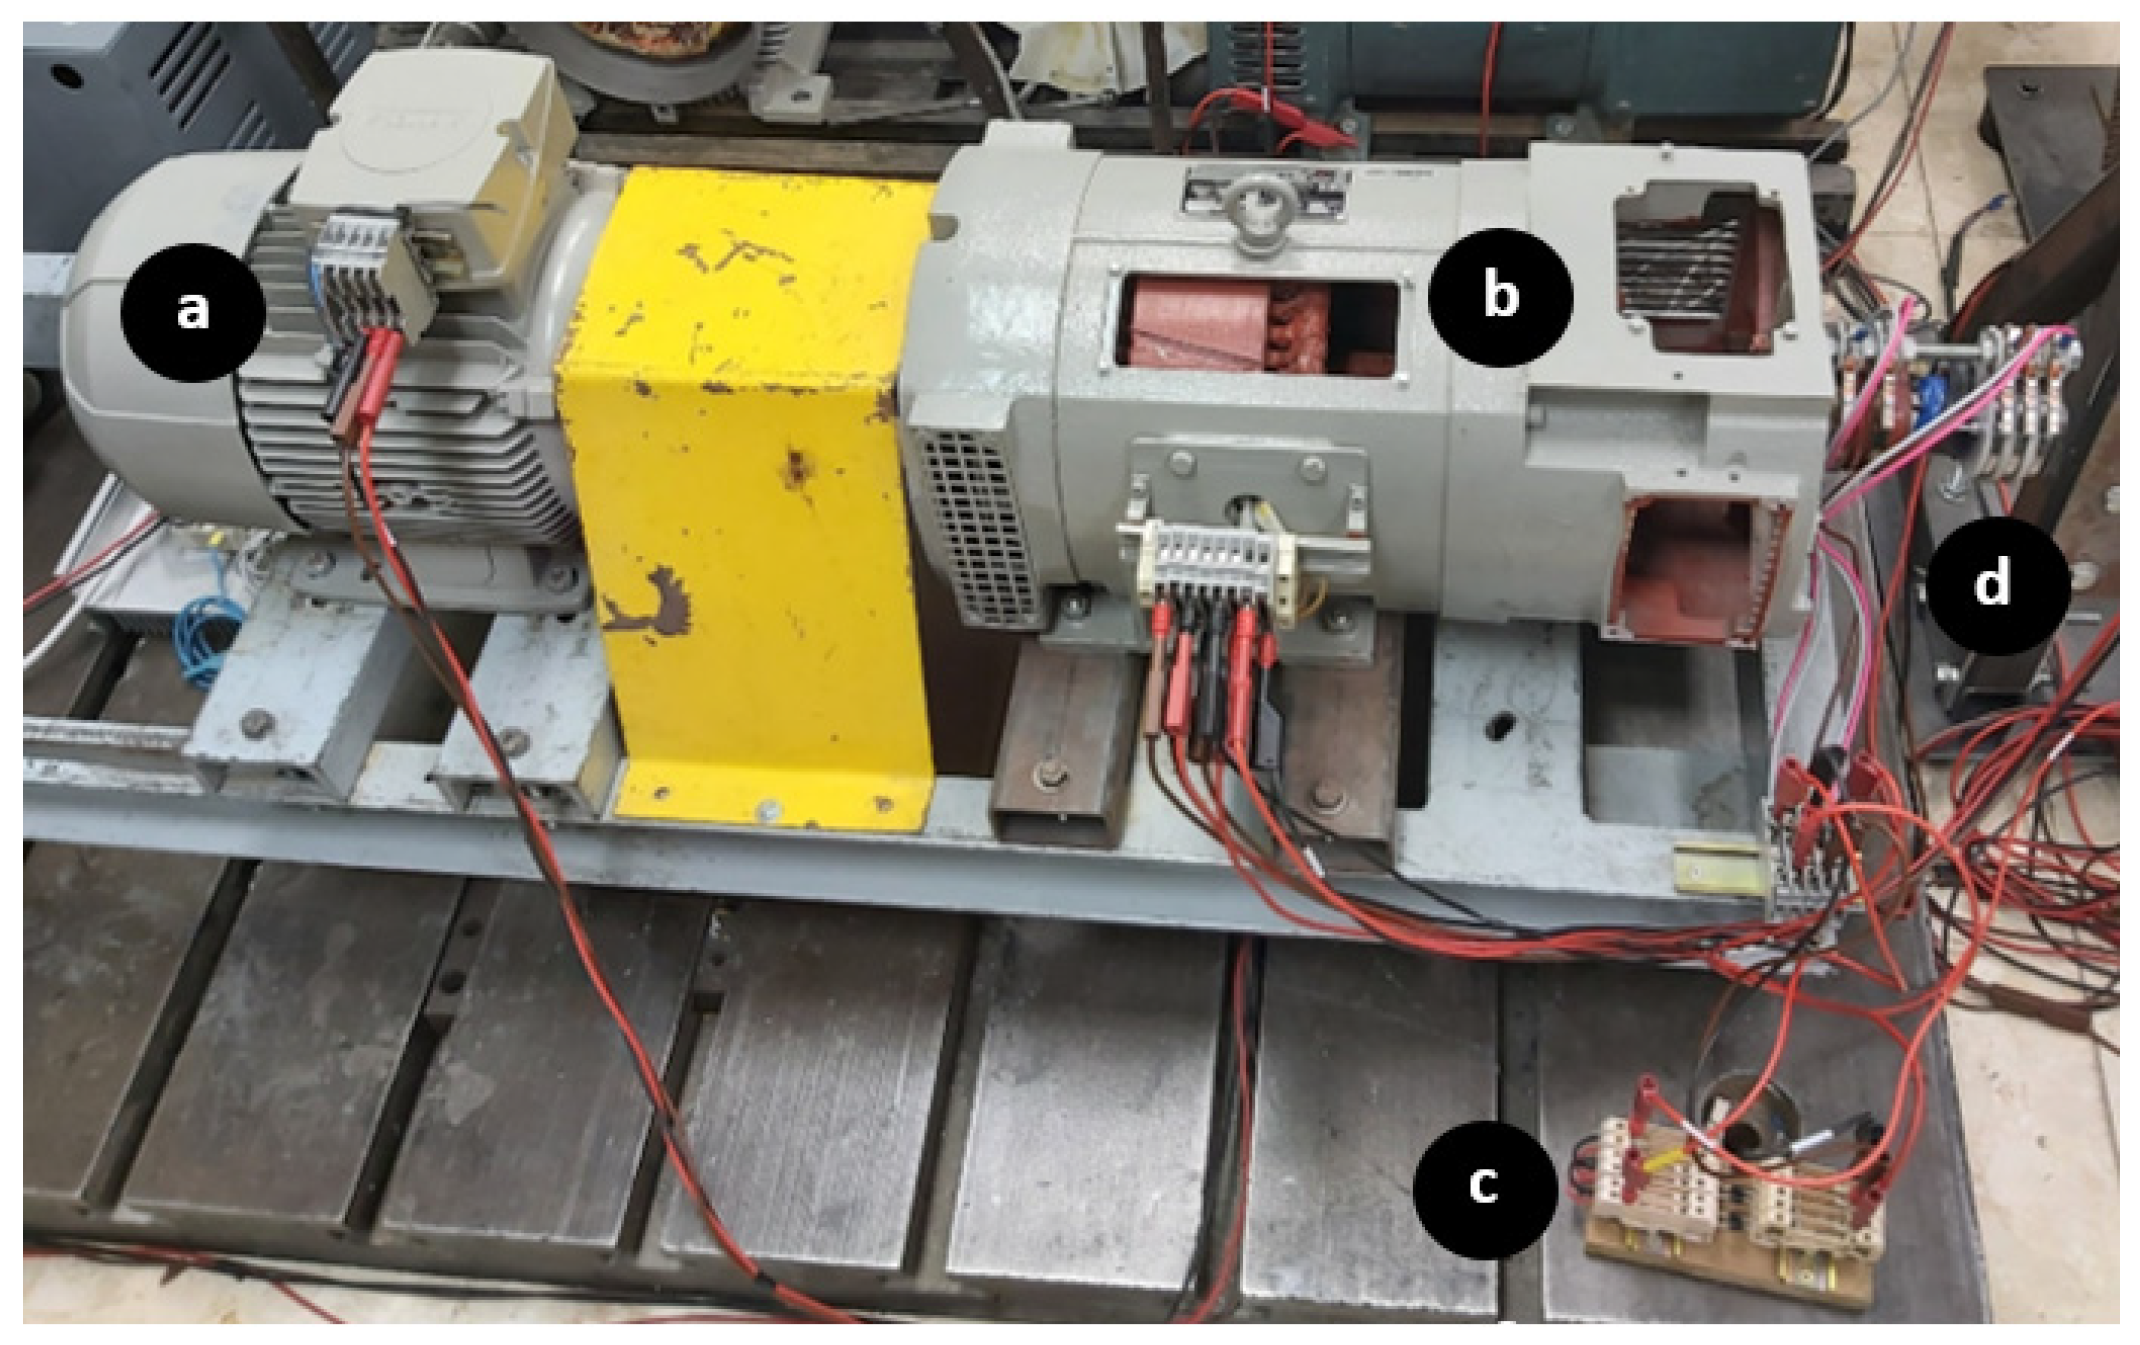
4.1. Experimental Setup
- An ammeter at the excitation DC input of the exciter;
- An ammeter at the three-phase connection between the exciter and the rectifier;
- An ammeter at the DC connection between the rectifier and the main machine field winding;
- Three-phase voltage and current sensors and a wattmeter at the output of the main machine.
4.2. Healthy Condition Tests
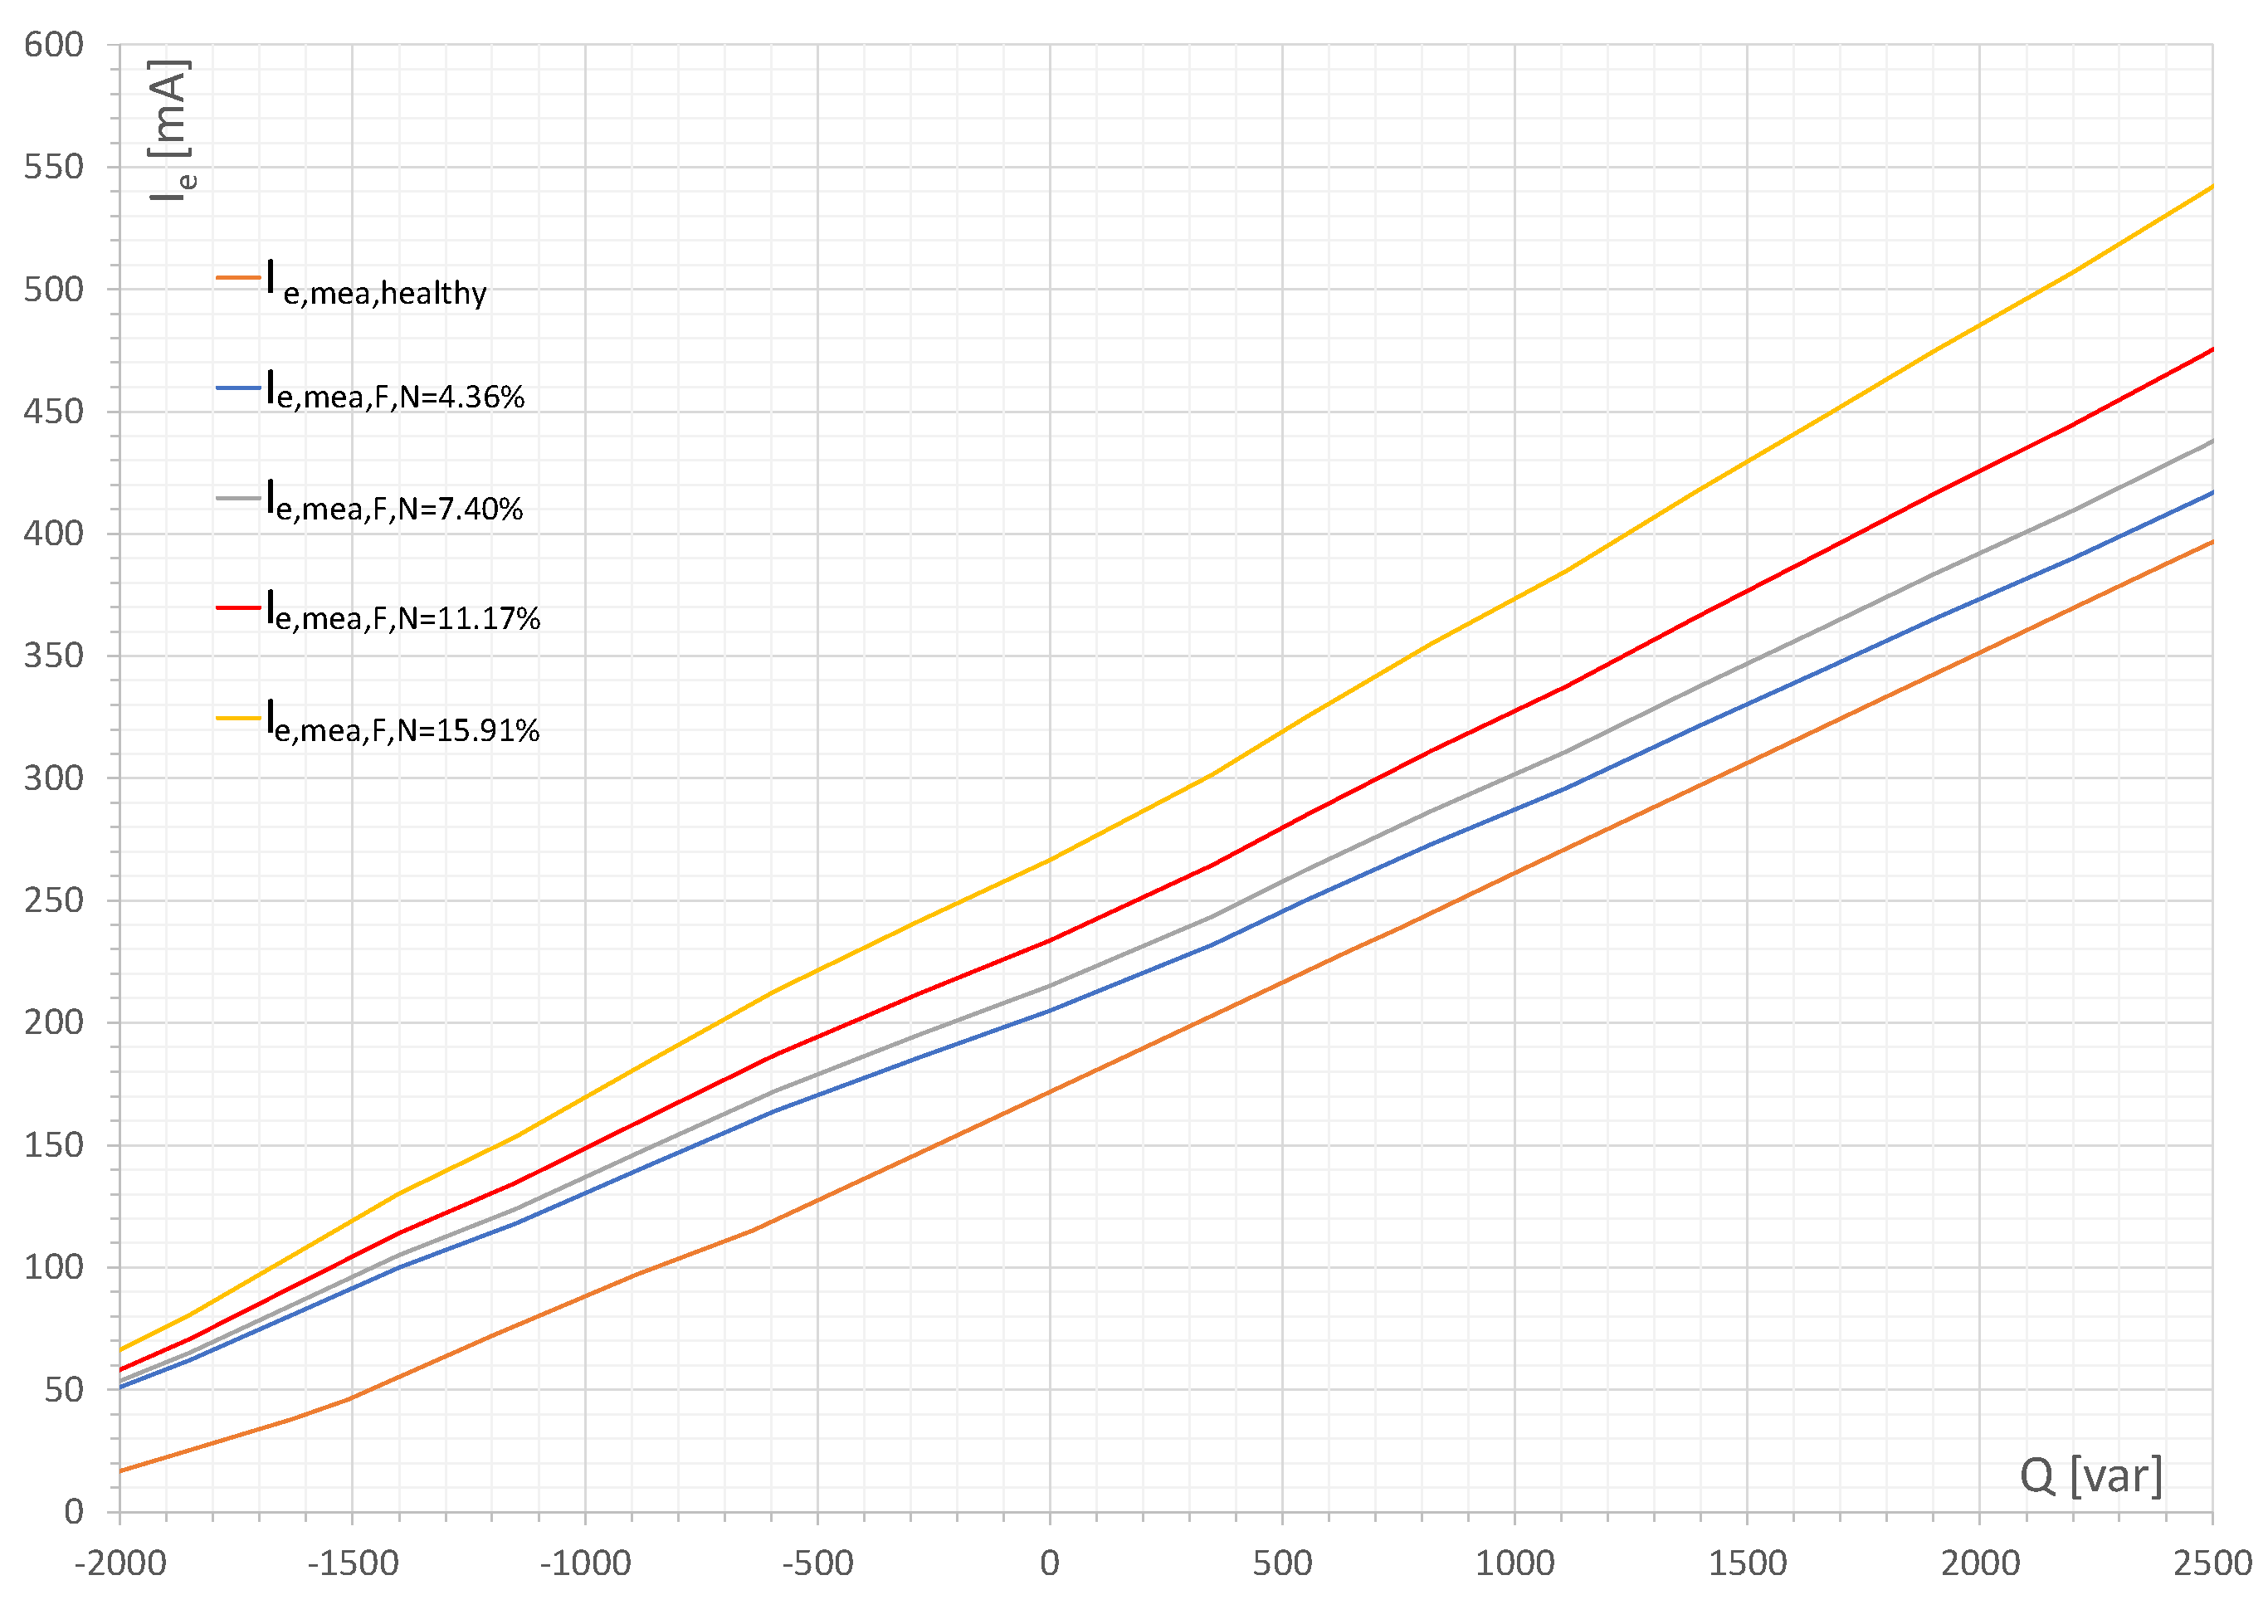
4.3. Faulty Condition Tests
5. Conclusions
Author Contributions
Funding
Data Availability Statement
Conflicts of Interest
References
- Juan, Y.; Haiyi, X.; Zhangang, Y. An Active Control Excitation Method of Three-Stage Brushless Synchronous Starter/Generator in Electric Starting Mode for MEA. IEEE Access 2021, 9, 109763–109774. [Google Scholar] [CrossRef]
- Basak, S.; Mondal, A.K.; Chakraborty, C. Performance and Analysis of a New Brushless Synchronous Generator for DC Microgrid Application. IEEE Trans. Ind. Appl. 2020, 56, 3137–3148. [Google Scholar] [CrossRef]
- Jiao, N.; Sun, C.; Zhang, X.; Duan, X.; Liu, W. Double-Side Voltage-Behind-Reactance Model of Brushless Exciter in Aircraft Wound-Rotor Synchronous Starter-Generator Considering Magnetic Saturation. IEEE Trans. Energy Convers. 2021, 36, 2358–2369. [Google Scholar] [CrossRef]
- Sikora, A.; Zielonka, A.; Woźniak, M. Minimization of Energy Losses in the BLDC Motor for Improved Control and Power Supply of the System under Static Load. Sensors 2022, 22, 1058. [Google Scholar] [CrossRef] [PubMed]
- Chapman, S.J. Electric Machinery Fundamentals, 5th ed.; McGraw-Hill: New York, NY, USA, 2012; ISBN 9780073529547. [Google Scholar]
- IEEE Std C37 102-2006 (Revision of IEEE Std C37 102-1995); IEEE Guide for AC Generator Protection. IEEE: New York, NY, USA, 2006; pp. 1–177. [CrossRef]
- Gupta, S.; Charola, P.; Patel, B. Field Experience on Effect of Power Electronic Component Failure in Excitation Circuit of a 5 MW Synchronous Motor. In Proceedings of the 2018 IEEE International Conference on Power Electronics, Drives and Energy Systems (PEDES), Chennai, India, 18–21 December 2018; pp. 1–6. [Google Scholar]
- Nøland, J.K.; Nuzzo, S.; Tessarolo, A.; Alves, E.F. Excitation System Technologies for Wound-Field Synchronous Machines: Survey of Solutions and Evolving Trends. IEEE Access 2019, 7, 109699–109718. [Google Scholar] [CrossRef]
- Pallantla, M.; Kumar, P.; Mohan, N. Comparison and Evaluation of the Different Brushless Excitation Topologies for Synchronous Machines-A Literature Survey. In Proceedings of the 2020 IEEE International Conference on Power Electronics, Smart Grid and Renewable Energy (PESGRE2020), Cochin, India, 2–4 January 2020; pp. 1–6. [Google Scholar]
- Kim, H.J.; Shaikh, M.F.; Lee, S.B.; Platero, C.A.; Kim, T. Alternative Test Methods for Monitoring the Condition of Brushless Exciters in Synchronous Machines. IEEE Trans. Energy Convers. 2022, 37, 2009–2018. [Google Scholar] [CrossRef]
- Batzel, T.D.; Swanson, D.C.; Defenbaugh, J.F. Predictive diagnostics for the main field winding and rotating rectifier assembly in the brushless synchronous generator. In Proceedings of the 4th IEEE International Symposium on Diagnostics for Electric Machines, Power Electronics and Drives (SDEMPED), Atlanta, GA, USA, 24–26 August 2003; pp. 349–354. [Google Scholar]
- Sottile, J.; Trutt, F.C.; Leedy, A.W. Condition Monitoring of Brushless Three-phase Synchronous Generators with Stator Winding or Rotor Circuit Deterioration. IEEE Trans. Ind. Appl. 2006, 42, 1209–1215. [Google Scholar] [CrossRef]
- Trutt, F.C.; Sottile, J.; Kohler, J.L. Detection of AC Machine Winding Deterioration Using Electrically Excited Vibrations. IEEE Trans. Ind. Appl. 2001, 37, 10–14. [Google Scholar] [CrossRef]
- Guillén, C.E.G.; de Porras Cosano, A.M.; Tian, P.; Diaz, J.C.; Zarzo, A.; Platero, C.A. Synchronous Machines Field Winding Turn-to-Turn Fault Severity Estimation Through Machine Learning Regression Algorithms. IEEE Trans. Energy Convers. 2022, 37, 2227–2235. [Google Scholar] [CrossRef]
- Park, Y.; Lee, S.B.; Yun, J.; Šašić, M.; Stone, G.C. Air Gap Flux-Based Detection and Classification of Damper Bar and Field Winding Faults in Salient Pole Synchronous Motors. IEEE Trans. Ind. Appl. 2020, 56, 3506–3515. [Google Scholar] [CrossRef]
- Yun, J.; Lee, S.B.; Šašić, M.; Stone, G.C. Reliable Flux-Based Detection of Field Winding Failures for Salient Pole Synchronous Generators. IEEE Trans. Energy Convers. 2019, 34, 1715–1718. [Google Scholar] [CrossRef]
- Yun, J.; Park, S.; Yang, C.; Park, Y.; Lee, S.B.; Šašić, M.; Stone, G.C. Comprehensive Monitoring of Field Winding Short Circuits for Salient Pole Synchronous Motors. IEEE Trans. Energy Convers. 2019, 34, 1686–1694. [Google Scholar] [CrossRef]
- Cuevas, M.; Romary, R.; Lecointe, J.; Morganti, F.; Jacq, T. Noninvasive Detection of Winding Short-Circuit Faults in Salient Pole Synchronous Machine with Squirrel-Cage Damper. IEEE Trans. Ind. Appl. 2018, 54, 5988–5997. [Google Scholar] [CrossRef]
- Shaikh, M.F.; Park, J.; Lee, S.B. A Non-Intrusive Leakage Flux Based Method for Detecting Rotor Faults in the Starting Transient of Salient Pole Synchronous Motors. IEEE Trans. Energy Convers. 2021, 36, 1262–1270. [Google Scholar] [CrossRef]
- Stone, G.; Boulter, E.A.; Culbert, I.; Dhirani, H. Electrical Insulation for Rotating Machines: Design, Evaluation, Aging, Testing, and Repair, 4th ed.; Wiley-IEEE Press: Piscataway, NJ, USA, 2004; pp. 1–41. ISBN 9780471445067. [Google Scholar]
- Pardo, M.A.; Mahtani, K.; Platero, C.A.; Sánchez-Fernández, J.A. New On-line Rotor Ground Fault Location Method for Brushless Synchronous Generators. In Proceedings of the IEEE 13th International Symposium on Diagnostics for Electrical Machines, Power Electronics and Drives (SDEMPED), Dallas, TX, USA, 22–25 August 2021; pp. 140–145. [Google Scholar]
- Maughan, C.V.; Reschovsky, J.M. Advances in Motor and Generator Rotor Health. In Proceedings of the IEEE International Symposium on Electrical Insulation, San Diego, CA, USA, 6–9 June 2010; pp. 1–4. [Google Scholar]
- Kumar, P.S.; Xie, L.; Thiha, K.; Soong, B.H.; Vaiyapuri, V.; Nadarajan, S. Rotor Mounted Wireless Sensors for Condition Monitoring of Brushless Synchronous Generator. In Proceedings of the 43rd Annual Conference of the IEEE Industrial Electronics Society (IECON 2017), Beijing, China, 29 October–1 November 2017; pp. 3221–3226. [Google Scholar]
- Tantawy, A.; Koutsoukos, X.; Biswas, G. Aircraft Power Generators: Hybrid Modeling and Simulation for Fault Detection. IEEE Trans. Aerosp. Electron. Syst. 2012, 48, 552–571. [Google Scholar] [CrossRef]
- Yong-Gang, L.; Ming-Han, M.; Yu-Cai, W.; Guo-Bang, B. The New Criterion of Brushless Excitation Generator Rotor Winding Inter-Turn Short Circuit Fault Diagnosis Based on Reactive Relative Deviation. In Proceedings of the 19th International Conference on Electrical Machines and Systems (ICEMS), Chiba, Japan, 13–16 November 2016; pp. 1–4. [Google Scholar]
- Mahtani, K.; Guerrero, J.M.; Beites, L.F.; Platero, C.A. Model-based On-line Protection Method for Brushless Synchronous Generators. In Proceedings of the IEEE 13th International Symposium on Diagnostics for Electrical Machines, Power Electronics and Drives (SDEMPED), Dallas, TX, USA, 22–25 August 2021; pp. 126–132. [Google Scholar]
- EN-IEC 60034-4-1: 2018; Rotating Electrical Machines—Part 4–1: Methods for Determining Electrically Excited Synchronous Machine Quantities from Tests. International Electrotechnical Commission: Geneva, Switzerland, 2018.
- Tian, P.; Platero, C.A.; Gyftakis, K.N. On-line Turn-to-Turn Protection Method of the Synchronous Machines Field Winding. In Proceedings of the IEEE 12th International Symposium on Diagnostics for Electrical Machines, Power Electronics and Drives (SDEMPED), Toulouse, France, 27–30 August 2019; pp. 69–74. [Google Scholar]


| Main Method Categories | Advantages | Disadvantages |
|---|---|---|
| Current or voltage signal analysis | Simplicity and accessibility Commonly used equipment (PT, CT) Non-invasiveness Reliability | Low accuracy Measurement errors Electrical noise Computational complexity and cost |
| Air gap flux analysis | High accuracy Reliability Range of measurements | Invasiveness Installation constraints Machine design constraints Computational complexity and cost |
| Stray flux analysis | Simplicity of installation Non-invasiveness Range of measurements | Low accuracy Computational complexity and cost |
| Alternator Type | Synchronous 3-Phase | |
|---|---|---|
| Rated power | 5 | kVA |
| Rated speed | 1500 | rpm |
| Rated voltage | 400 | V |
| Rated current | 7.2 | A |
| Pole pairs | 2 | |
| Rated frequency | 50 | Hz |
| IP | 21 | |
| Isolation class | F | |
| Rated excitation voltage | 33 | V |
| Rated excitation current | 4.10 | A |
| Alternator Type | Synchronous 3-Phase | |
|---|---|---|
| Rated power | 277 | VA |
| Rated speed | 1500 | rpm |
| Rated voltage | 40 | V |
| Rated current | 4 | A |
| Pole pairs | 4 | |
| Rated frequency | 100 | Hz |
| IP | 21 | |
| Isolation class | F | |
| Rated excitation voltage | 33 | V |
| Rated excitation current | 0.61 | A |
| P [W], Q [var] | 0 | 250 | 500 | 750 | 1000 | 1250 | 1500 |
|---|---|---|---|---|---|---|---|
| −1000 | 0.85% | −0.77% | −1.83% | −1.03% | −4.25% | −4.88% | −3.51% |
| −750 | −1.23% | −0.31% | −0.73% | −4.29% | −4.14% | −5.01% | −4.10% |
| −500 | 0.36% | 0.87% | −0.60% | −5.96% | −2.39% | −5.84% | −2.20% |
| −250 | 1.87% | −1.53% | −2.17% | −5.80% | −5.12% | −5.99% | −4.07% |
| 0 | −1.54% | −1.70% | −2.53% | −4.65% | −4.32% | −5.85% | −5.57% |
| 250 | −0.89% | −2.73% | −3.56% | −4.38% | −2.83% | −5.54% | −5.14% |
| 500 | 0.48% | −0.65% | −2.51% | −4.61% | −2.40% | −5.32% | −5.17% |
| 750 | 0.45% | −1.42% | −1.96% | −2.51% | −2.20% | −4.41% | −2.97% |
| 1000 | −0.41% | −1.63% | −1.23% | −1.62% | −2.19% | −3.81% | −2.34% |
| 1250 | −0.07% | −0.02% | −1.49% | −1.21% | −1.70% | −3.01% | −1.79% |
| 1500 | 0.17% | −0.01% | 0.04% | −0.49% | −0.94% | −2.10% | −3.46% |
| 1750 | 1.50% | 0.24% | −0.01% | −0.24% | −0.04% | −2.25% | −2.21% |
| 2000 | 2.80% | 0.56% | 0.07% | 1.09% | −0.97% | −1.11% | −2.16% |
| 2250 | 3.22% | 1.68% | 0.47% | 1.21% | −0.62% | 0.12% | −2.03% |
| 2500 | 3.88% | 3.21% | 2.49% | 5.75% | 0.95% | −0.19% | 0.01% |
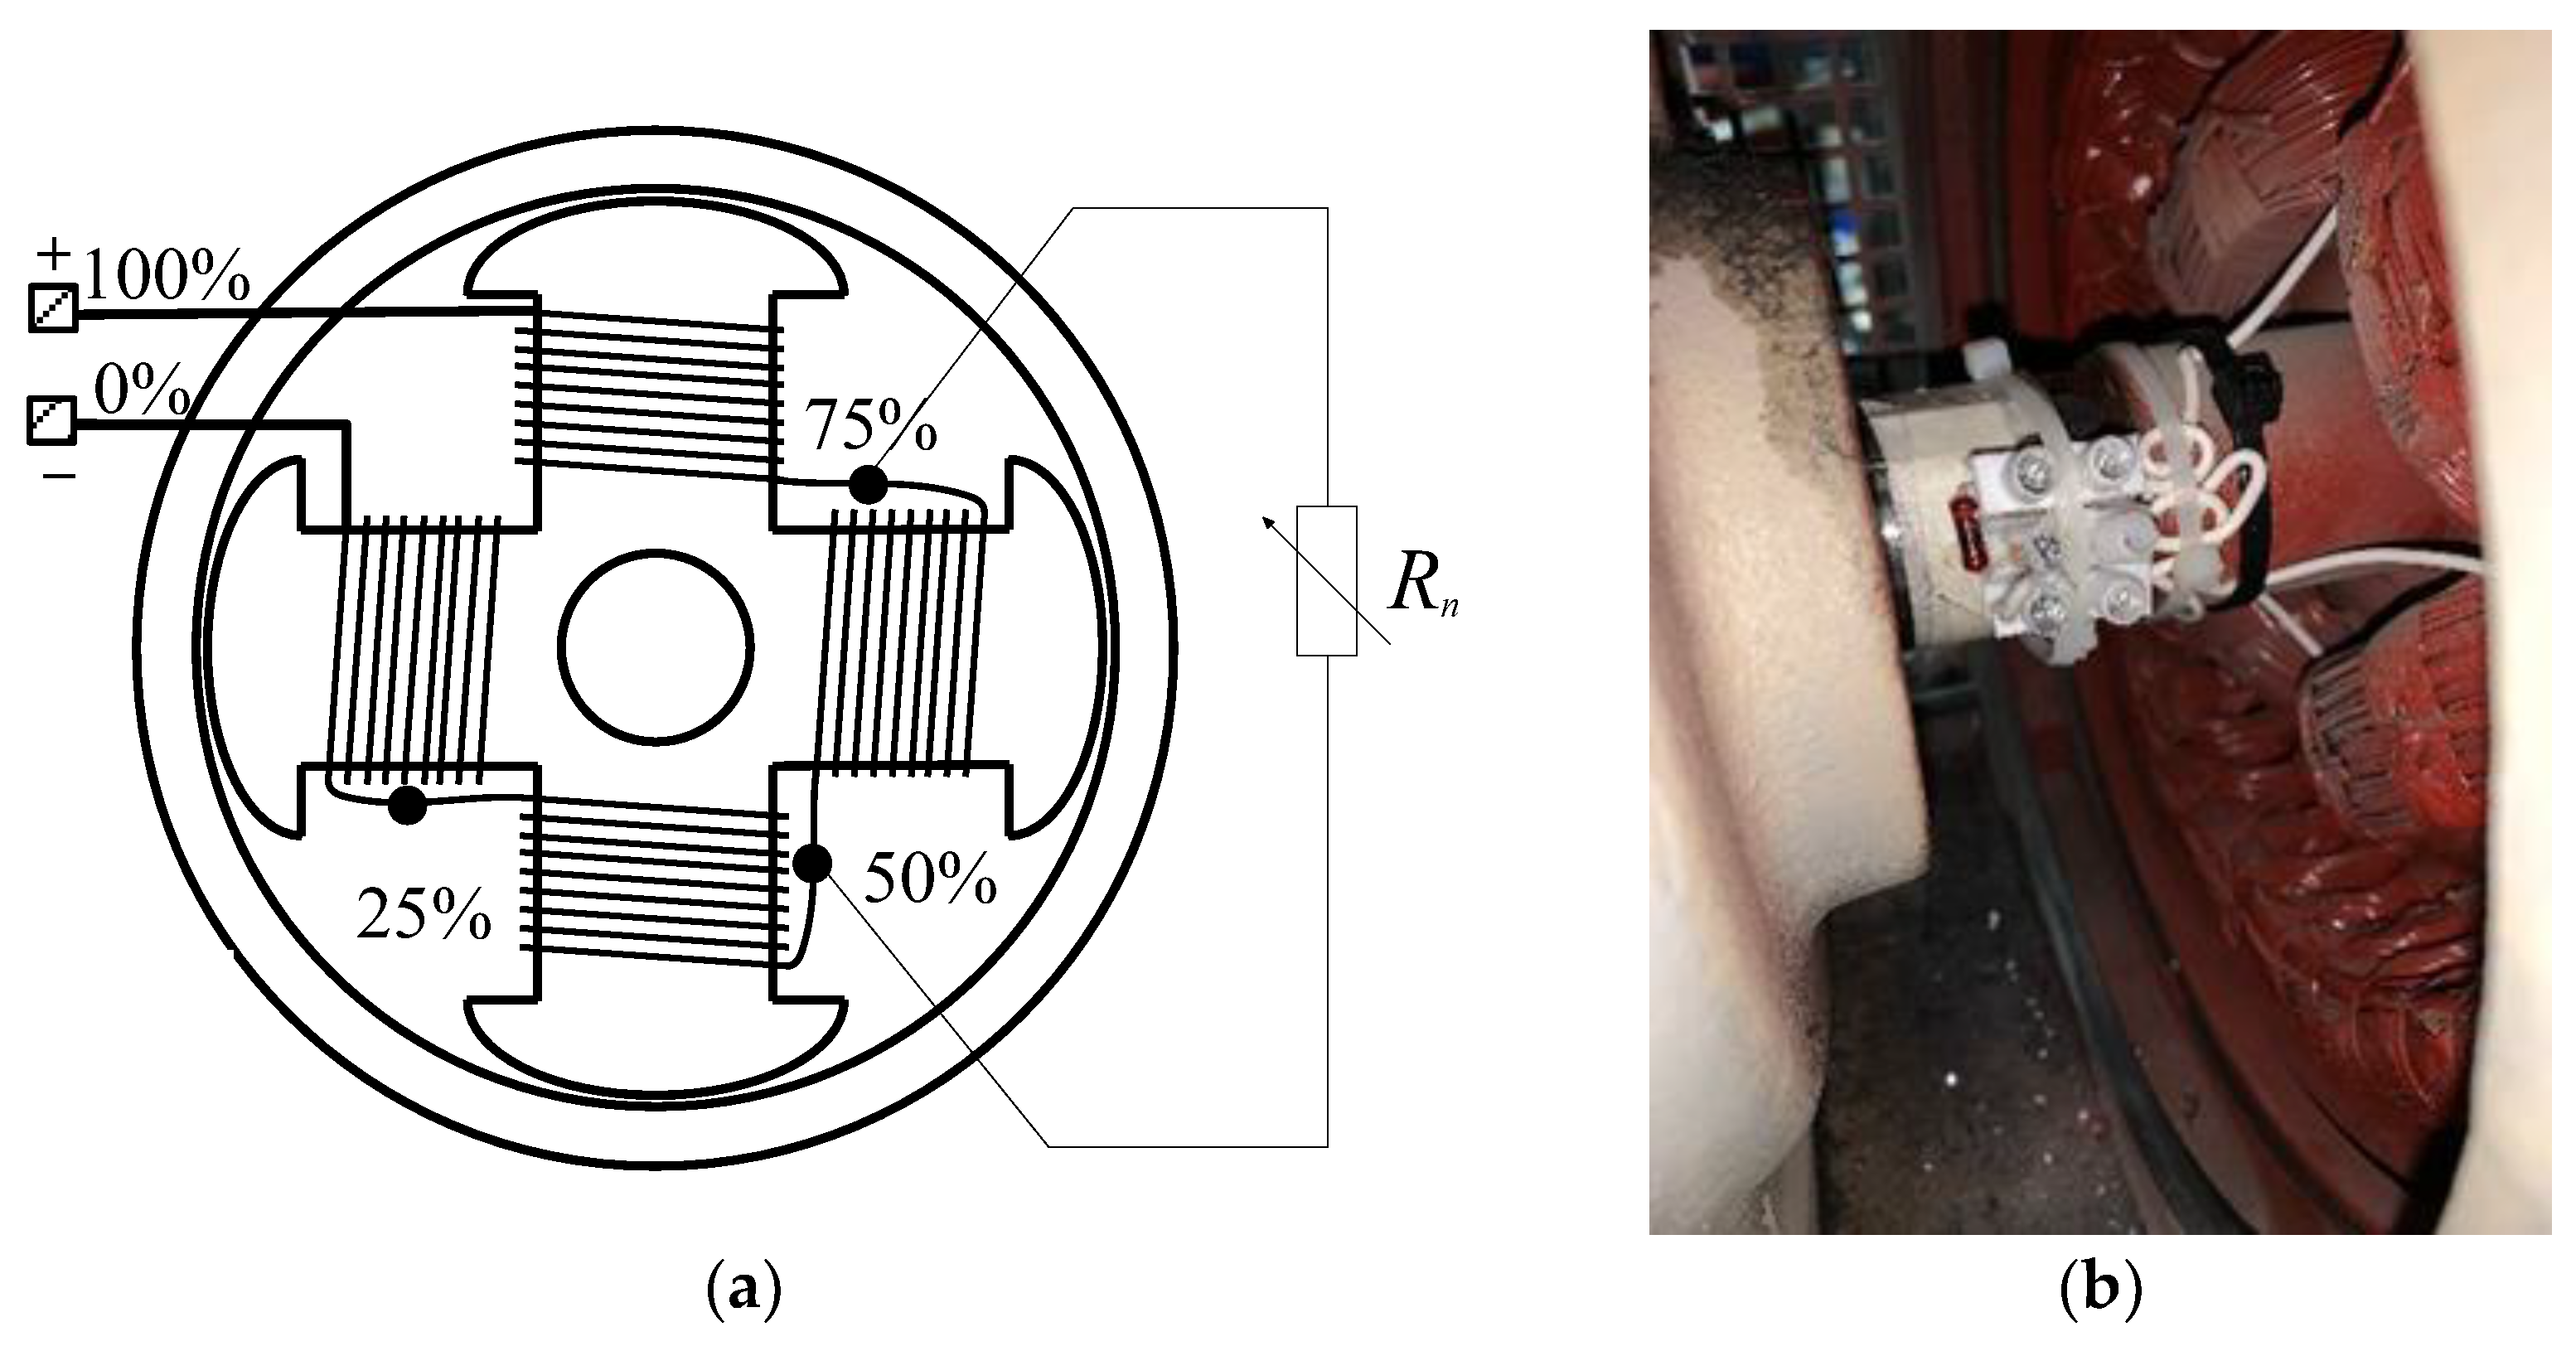
| Rn [Ω] | N/Ntotal [%] |
|---|---|
| 1.8 | 15.91 |
| 3.9 | 11.17 |
| 7.5 | 7.40 |
| 14.9 | 4.36 |
Publisher’s Note: MDPI stays neutral with regard to jurisdictional claims in published maps and institutional affiliations. |
© 2022 by the authors. Licensee MDPI, Basel, Switzerland. This article is an open access article distributed under the terms and conditions of the Creative Commons Attribution (CC BY) license (https://creativecommons.org/licenses/by/4.0/).
Share and Cite
Mahtani, K.; Guerrero, J.M.; Beites, L.F.; Platero, C.A. Model-Based Field Winding Interturn Fault Detection Method for Brushless Synchronous Machines. Machines 2022, 10, 1227. https://doi.org/10.3390/machines10121227
Mahtani K, Guerrero JM, Beites LF, Platero CA. Model-Based Field Winding Interturn Fault Detection Method for Brushless Synchronous Machines. Machines. 2022; 10(12):1227. https://doi.org/10.3390/machines10121227
Chicago/Turabian StyleMahtani, Kumar, José M. Guerrero, Luis F. Beites, and Carlos A. Platero. 2022. "Model-Based Field Winding Interturn Fault Detection Method for Brushless Synchronous Machines" Machines 10, no. 12: 1227. https://doi.org/10.3390/machines10121227