
Load Distribution and Dynamic Response in Torque Split Applications

Abstract
:1. Introduction
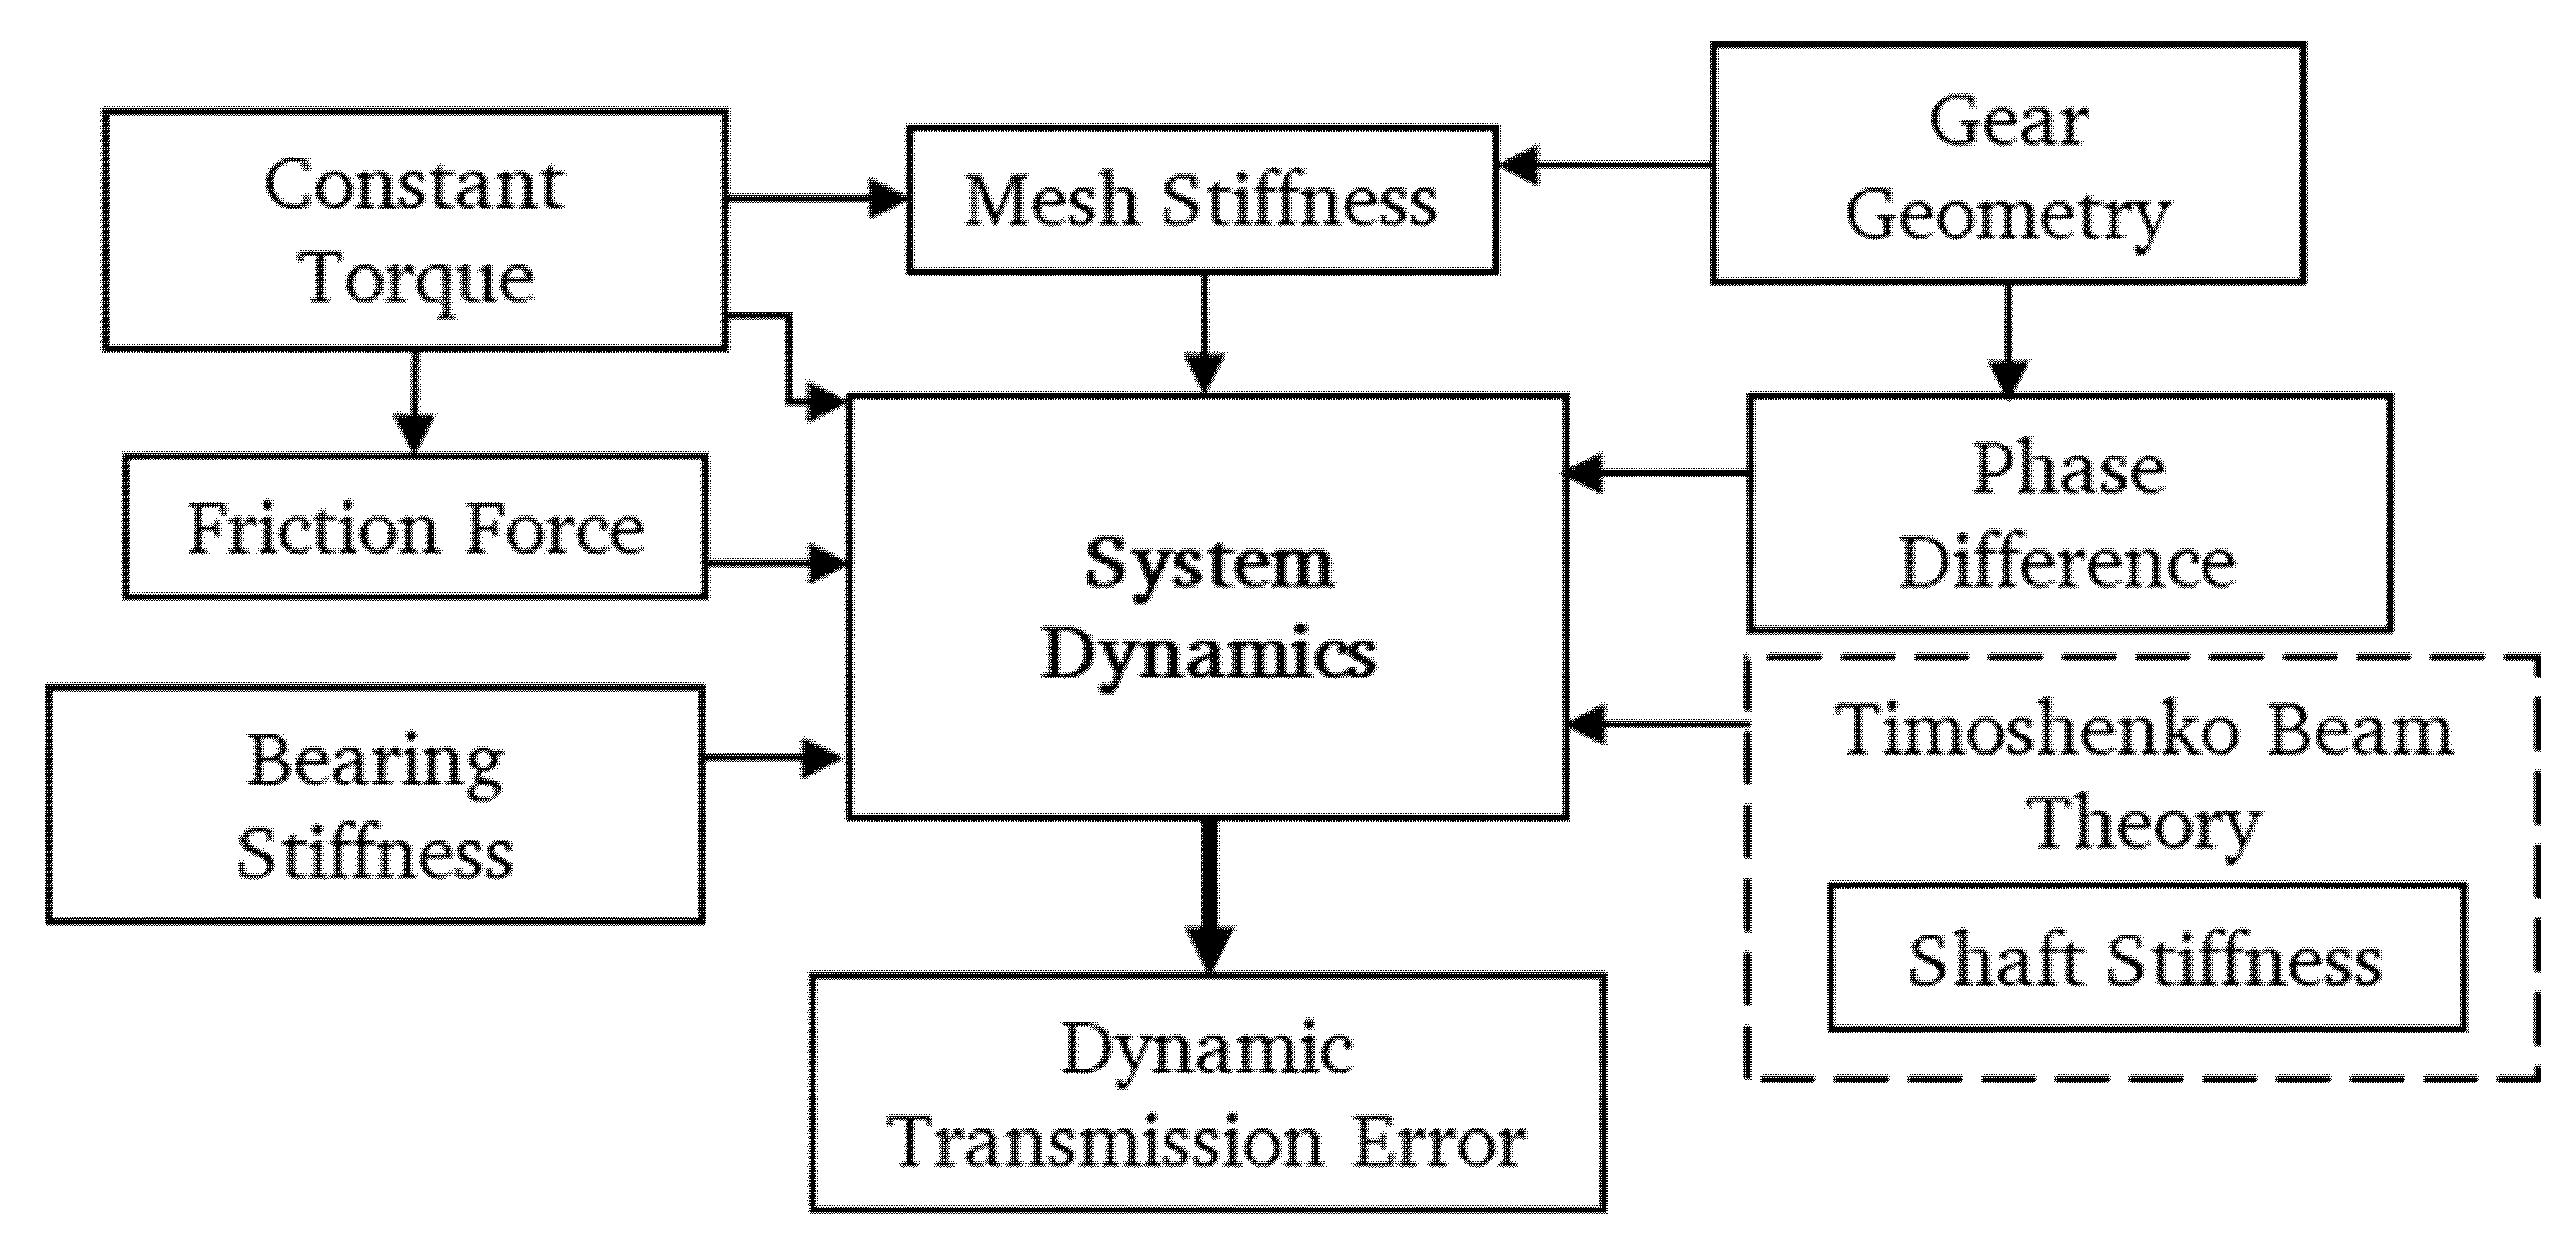
2. Modeling
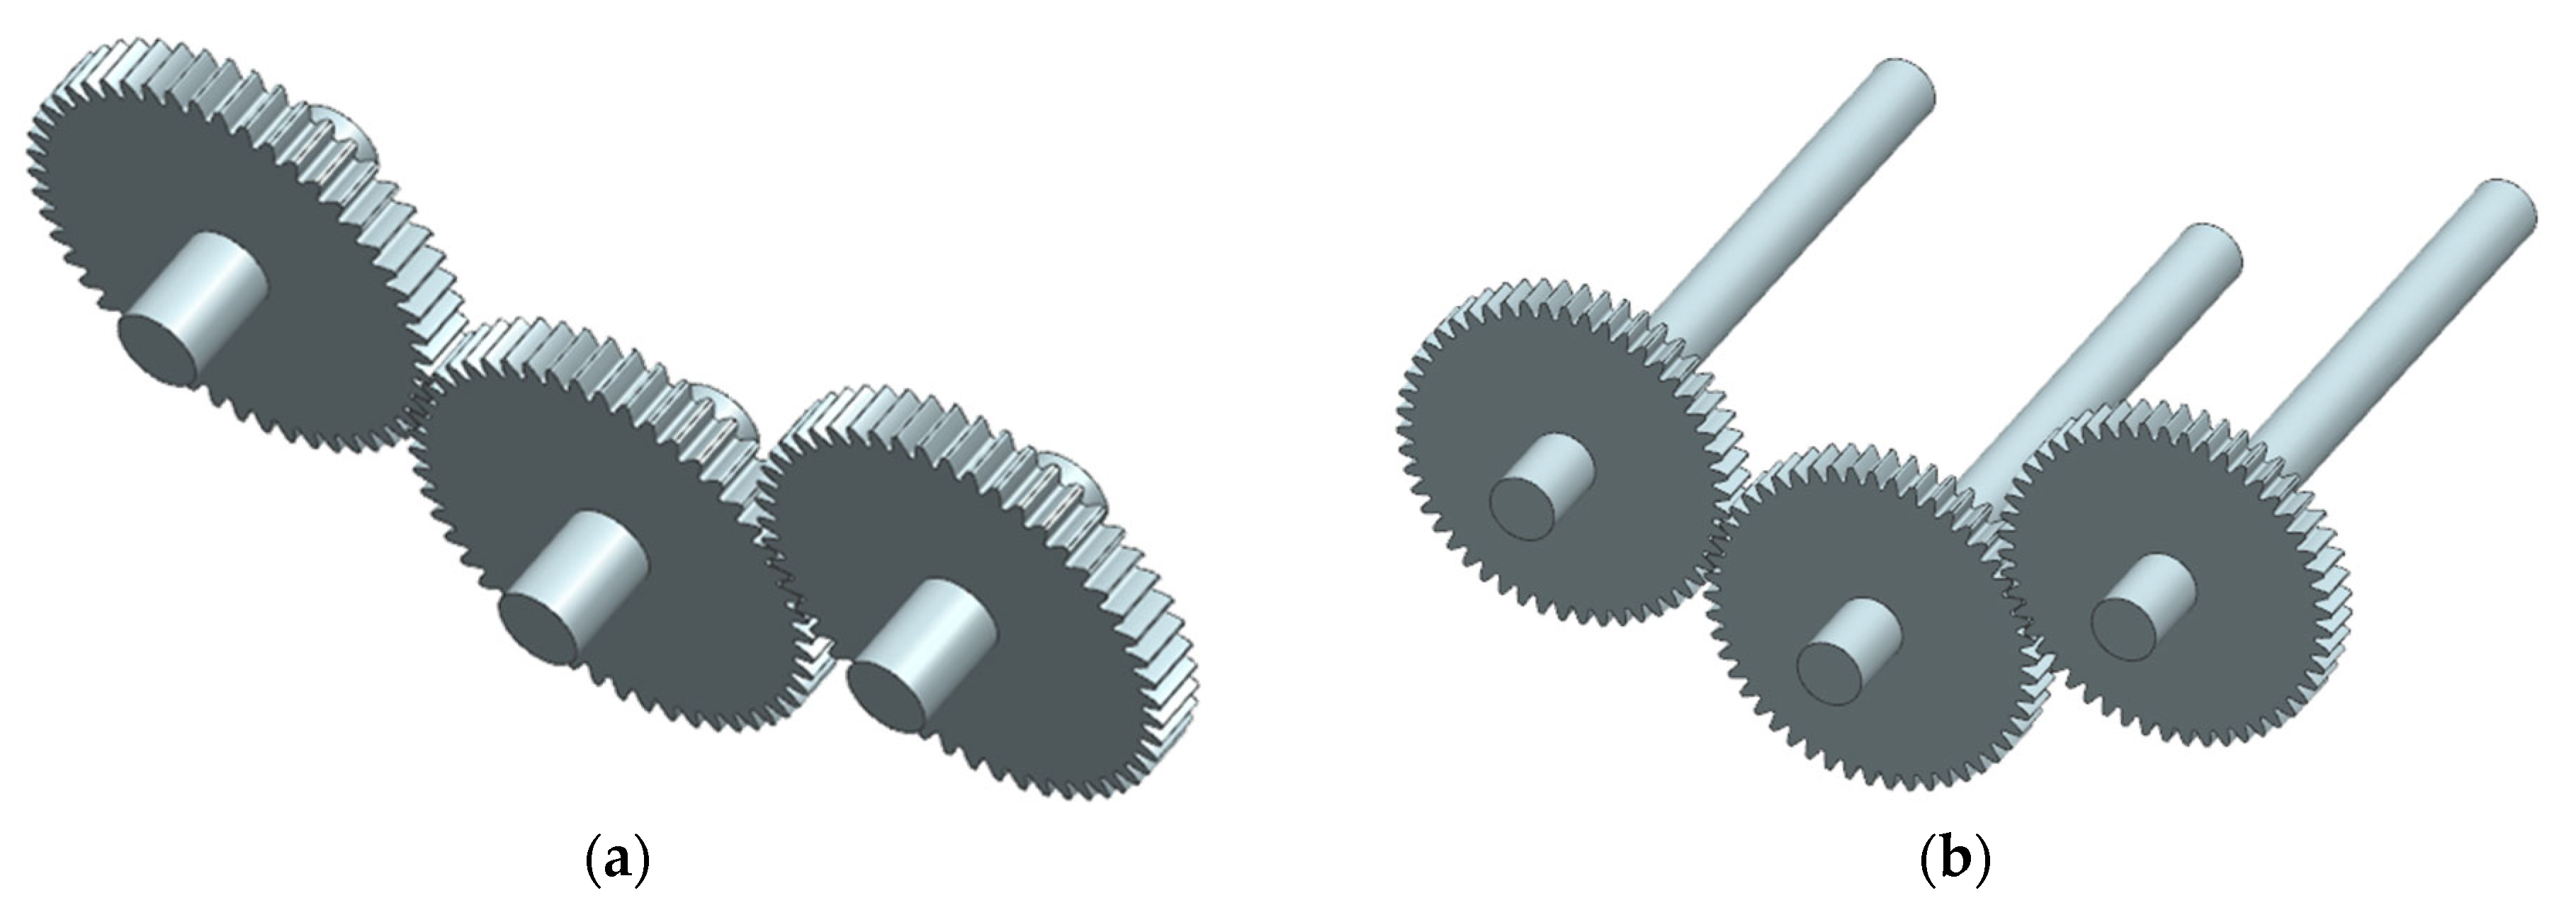
2.1. Gear Dynamics Model
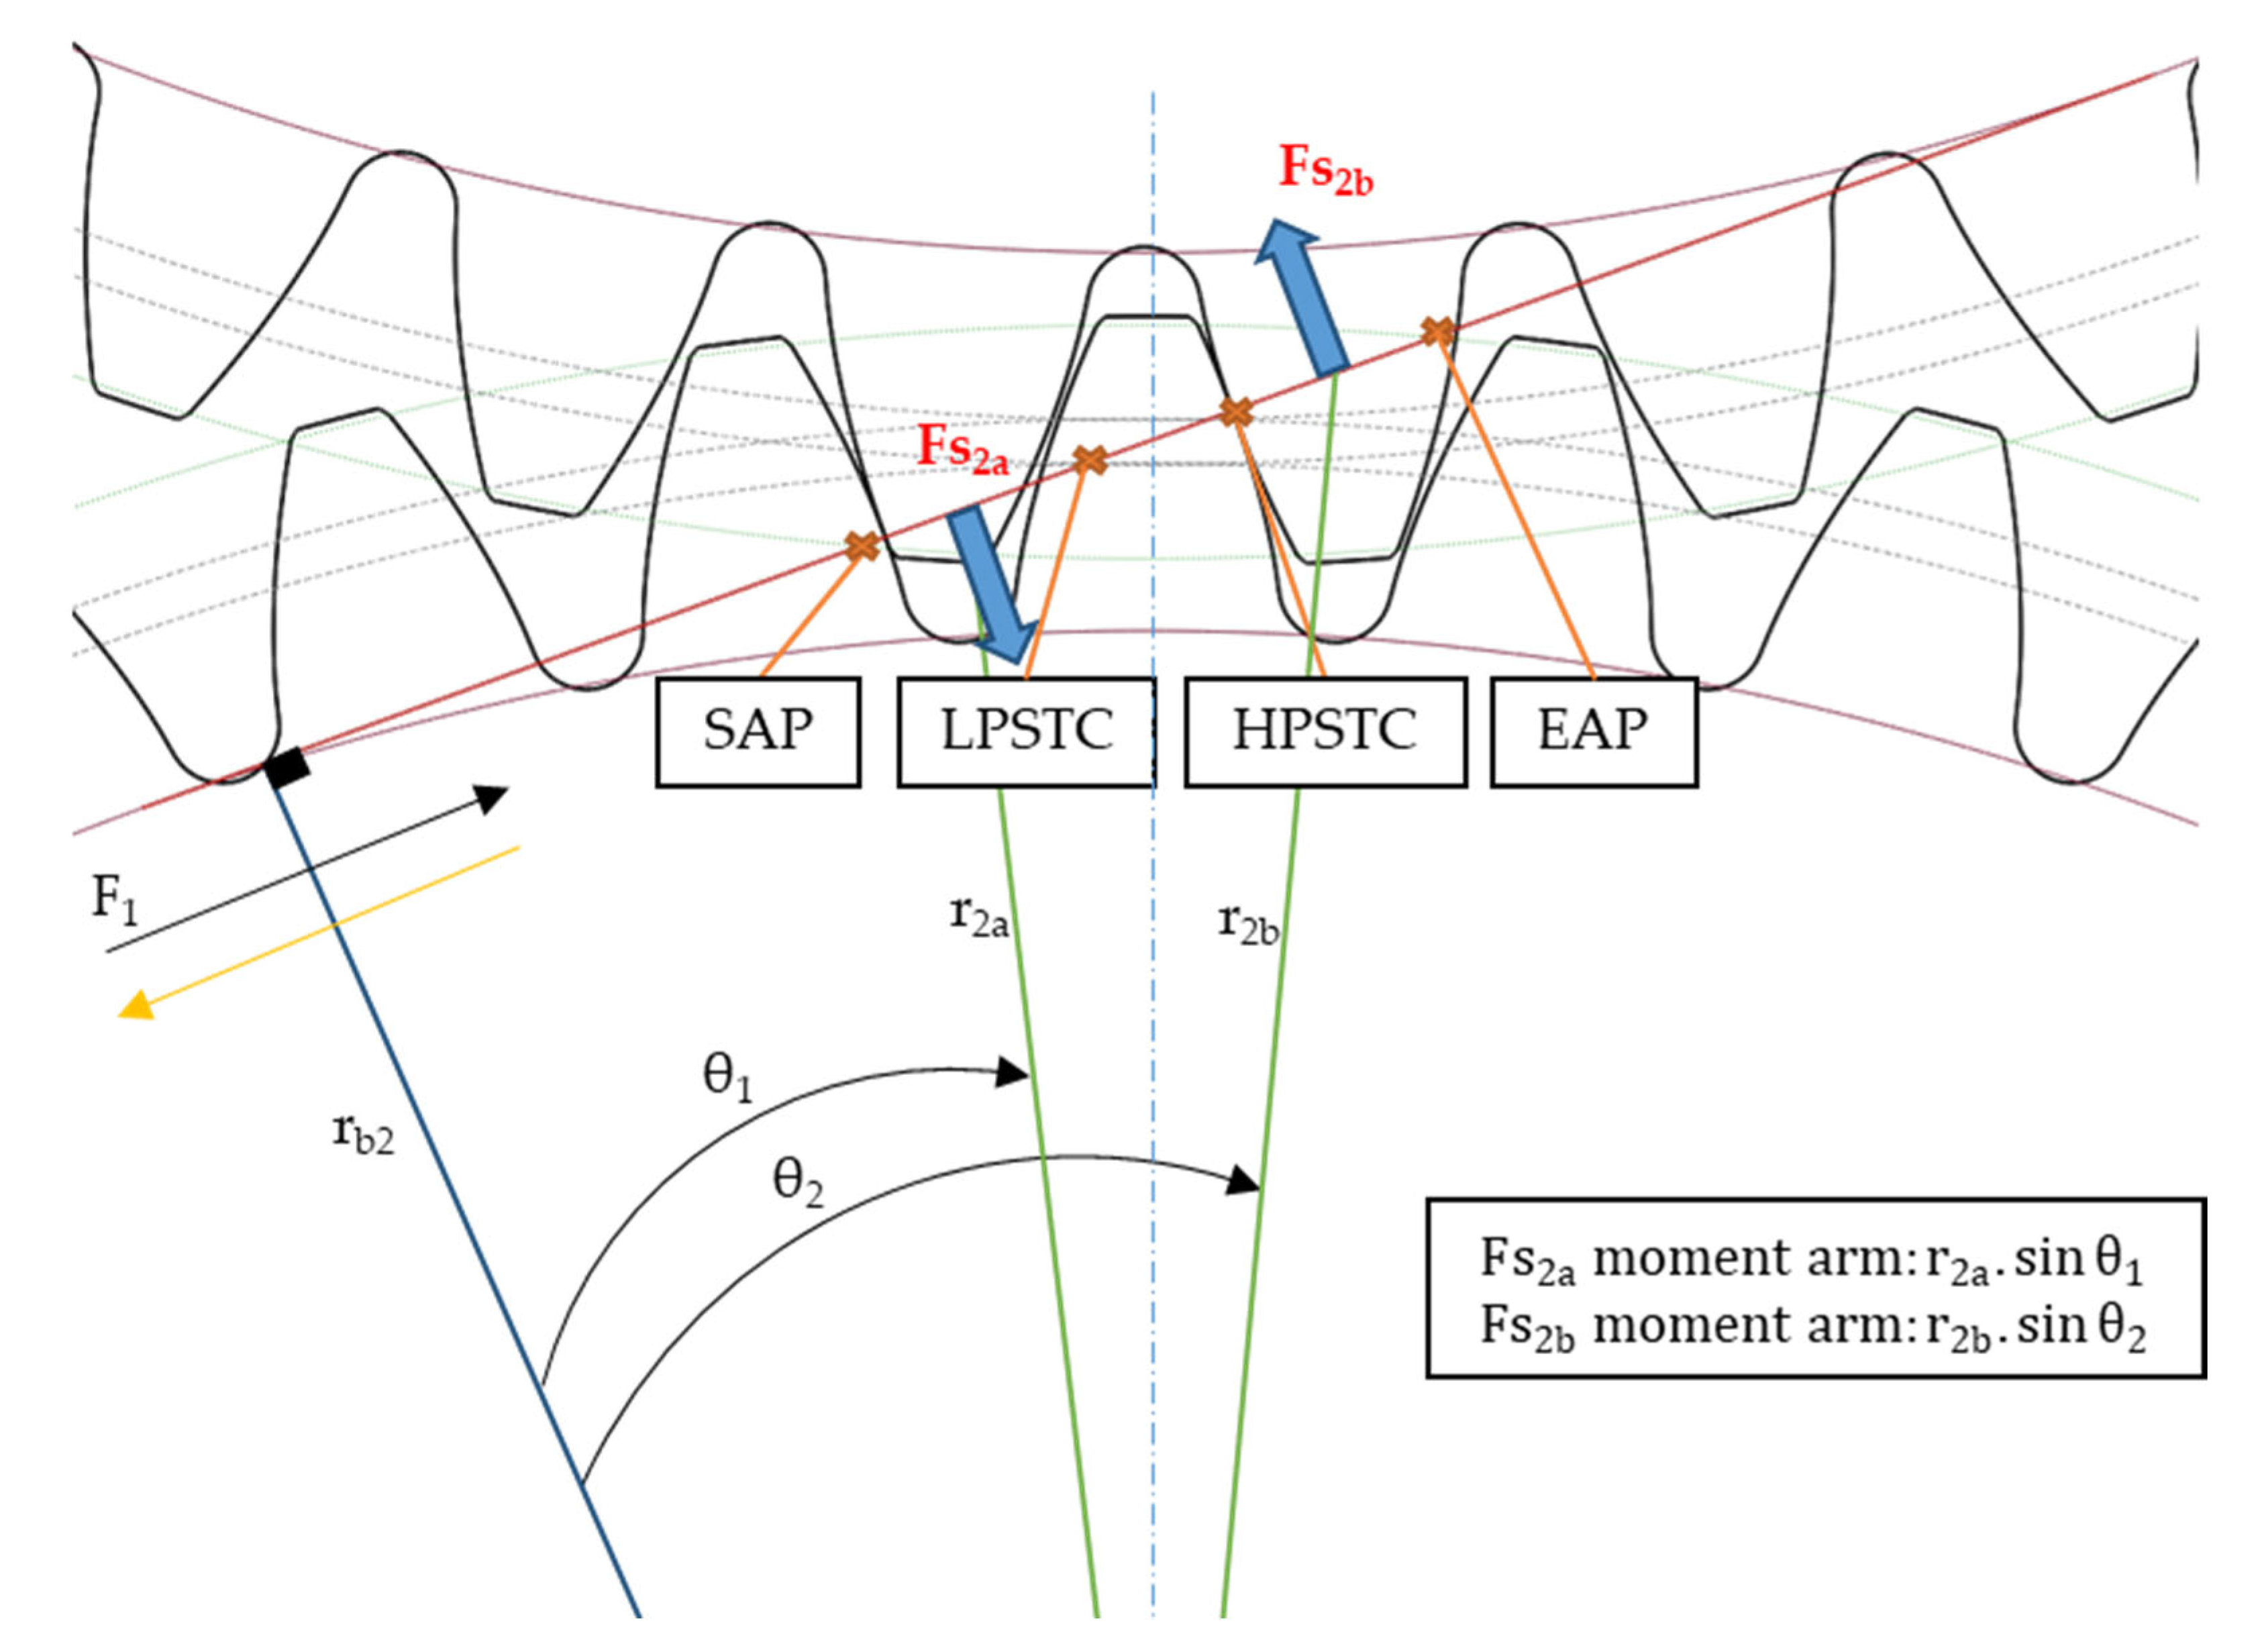
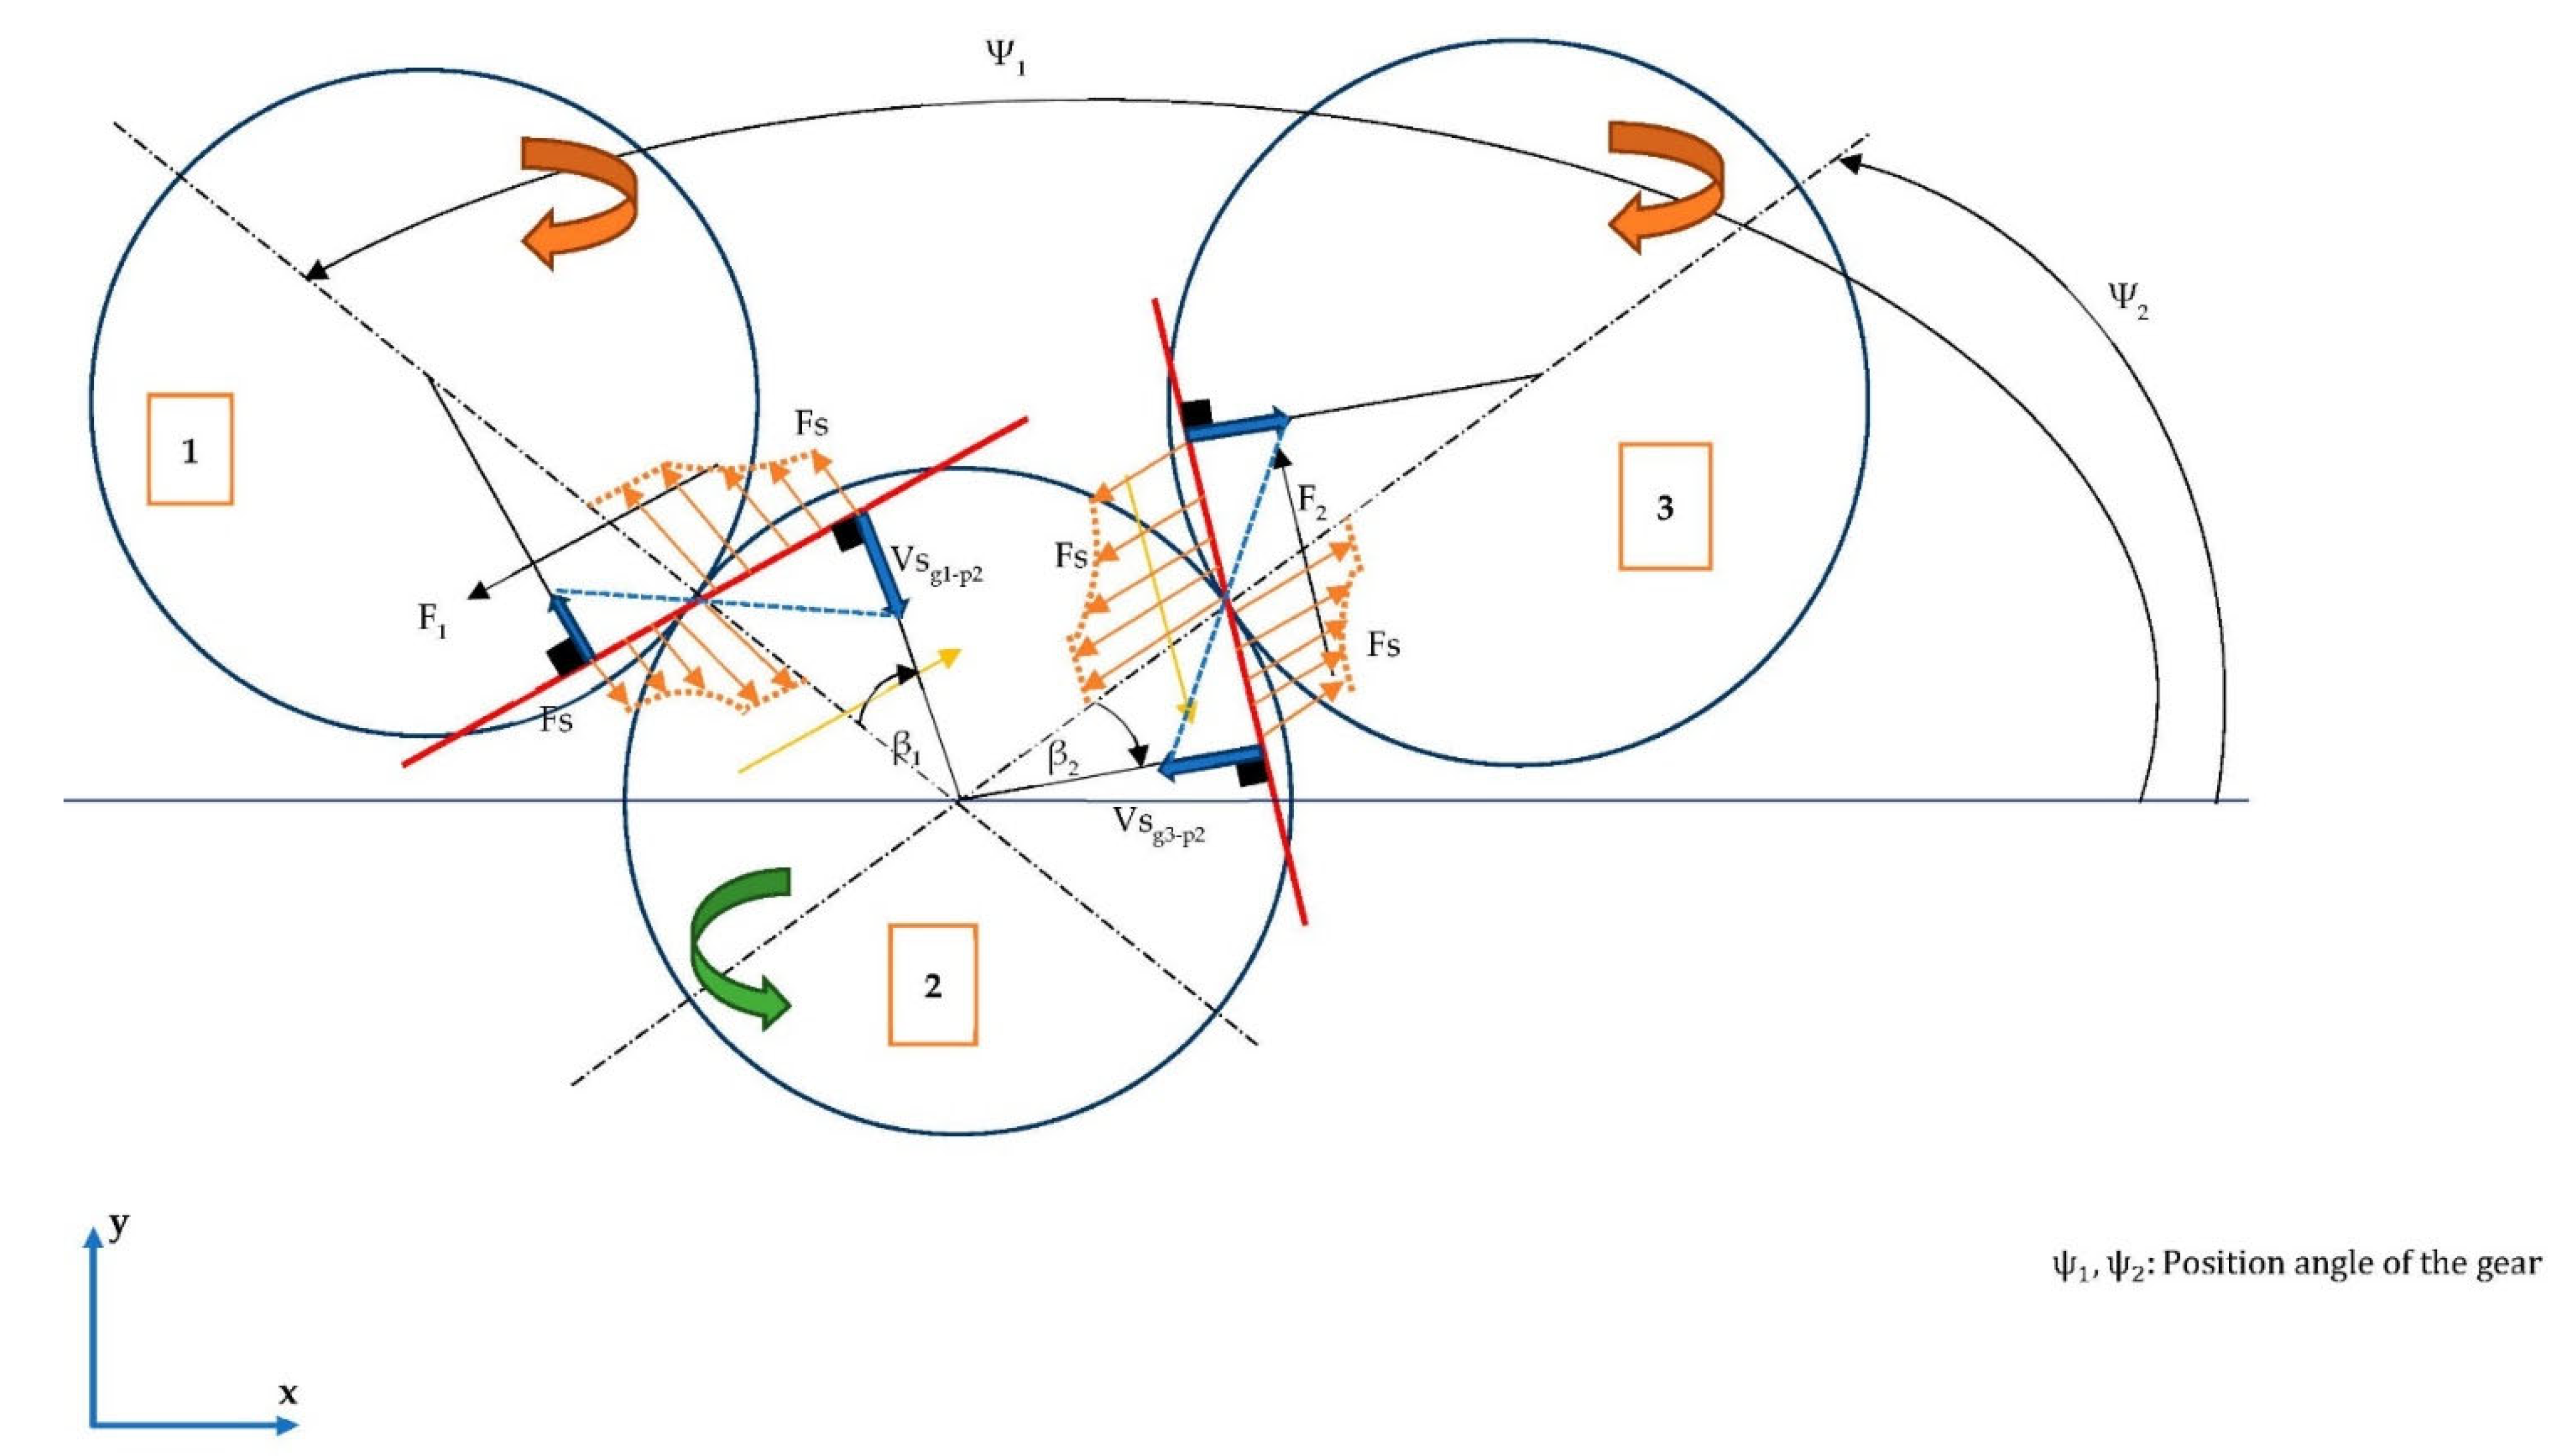
2.1.1. Calculation of Friction Force in the Gear System
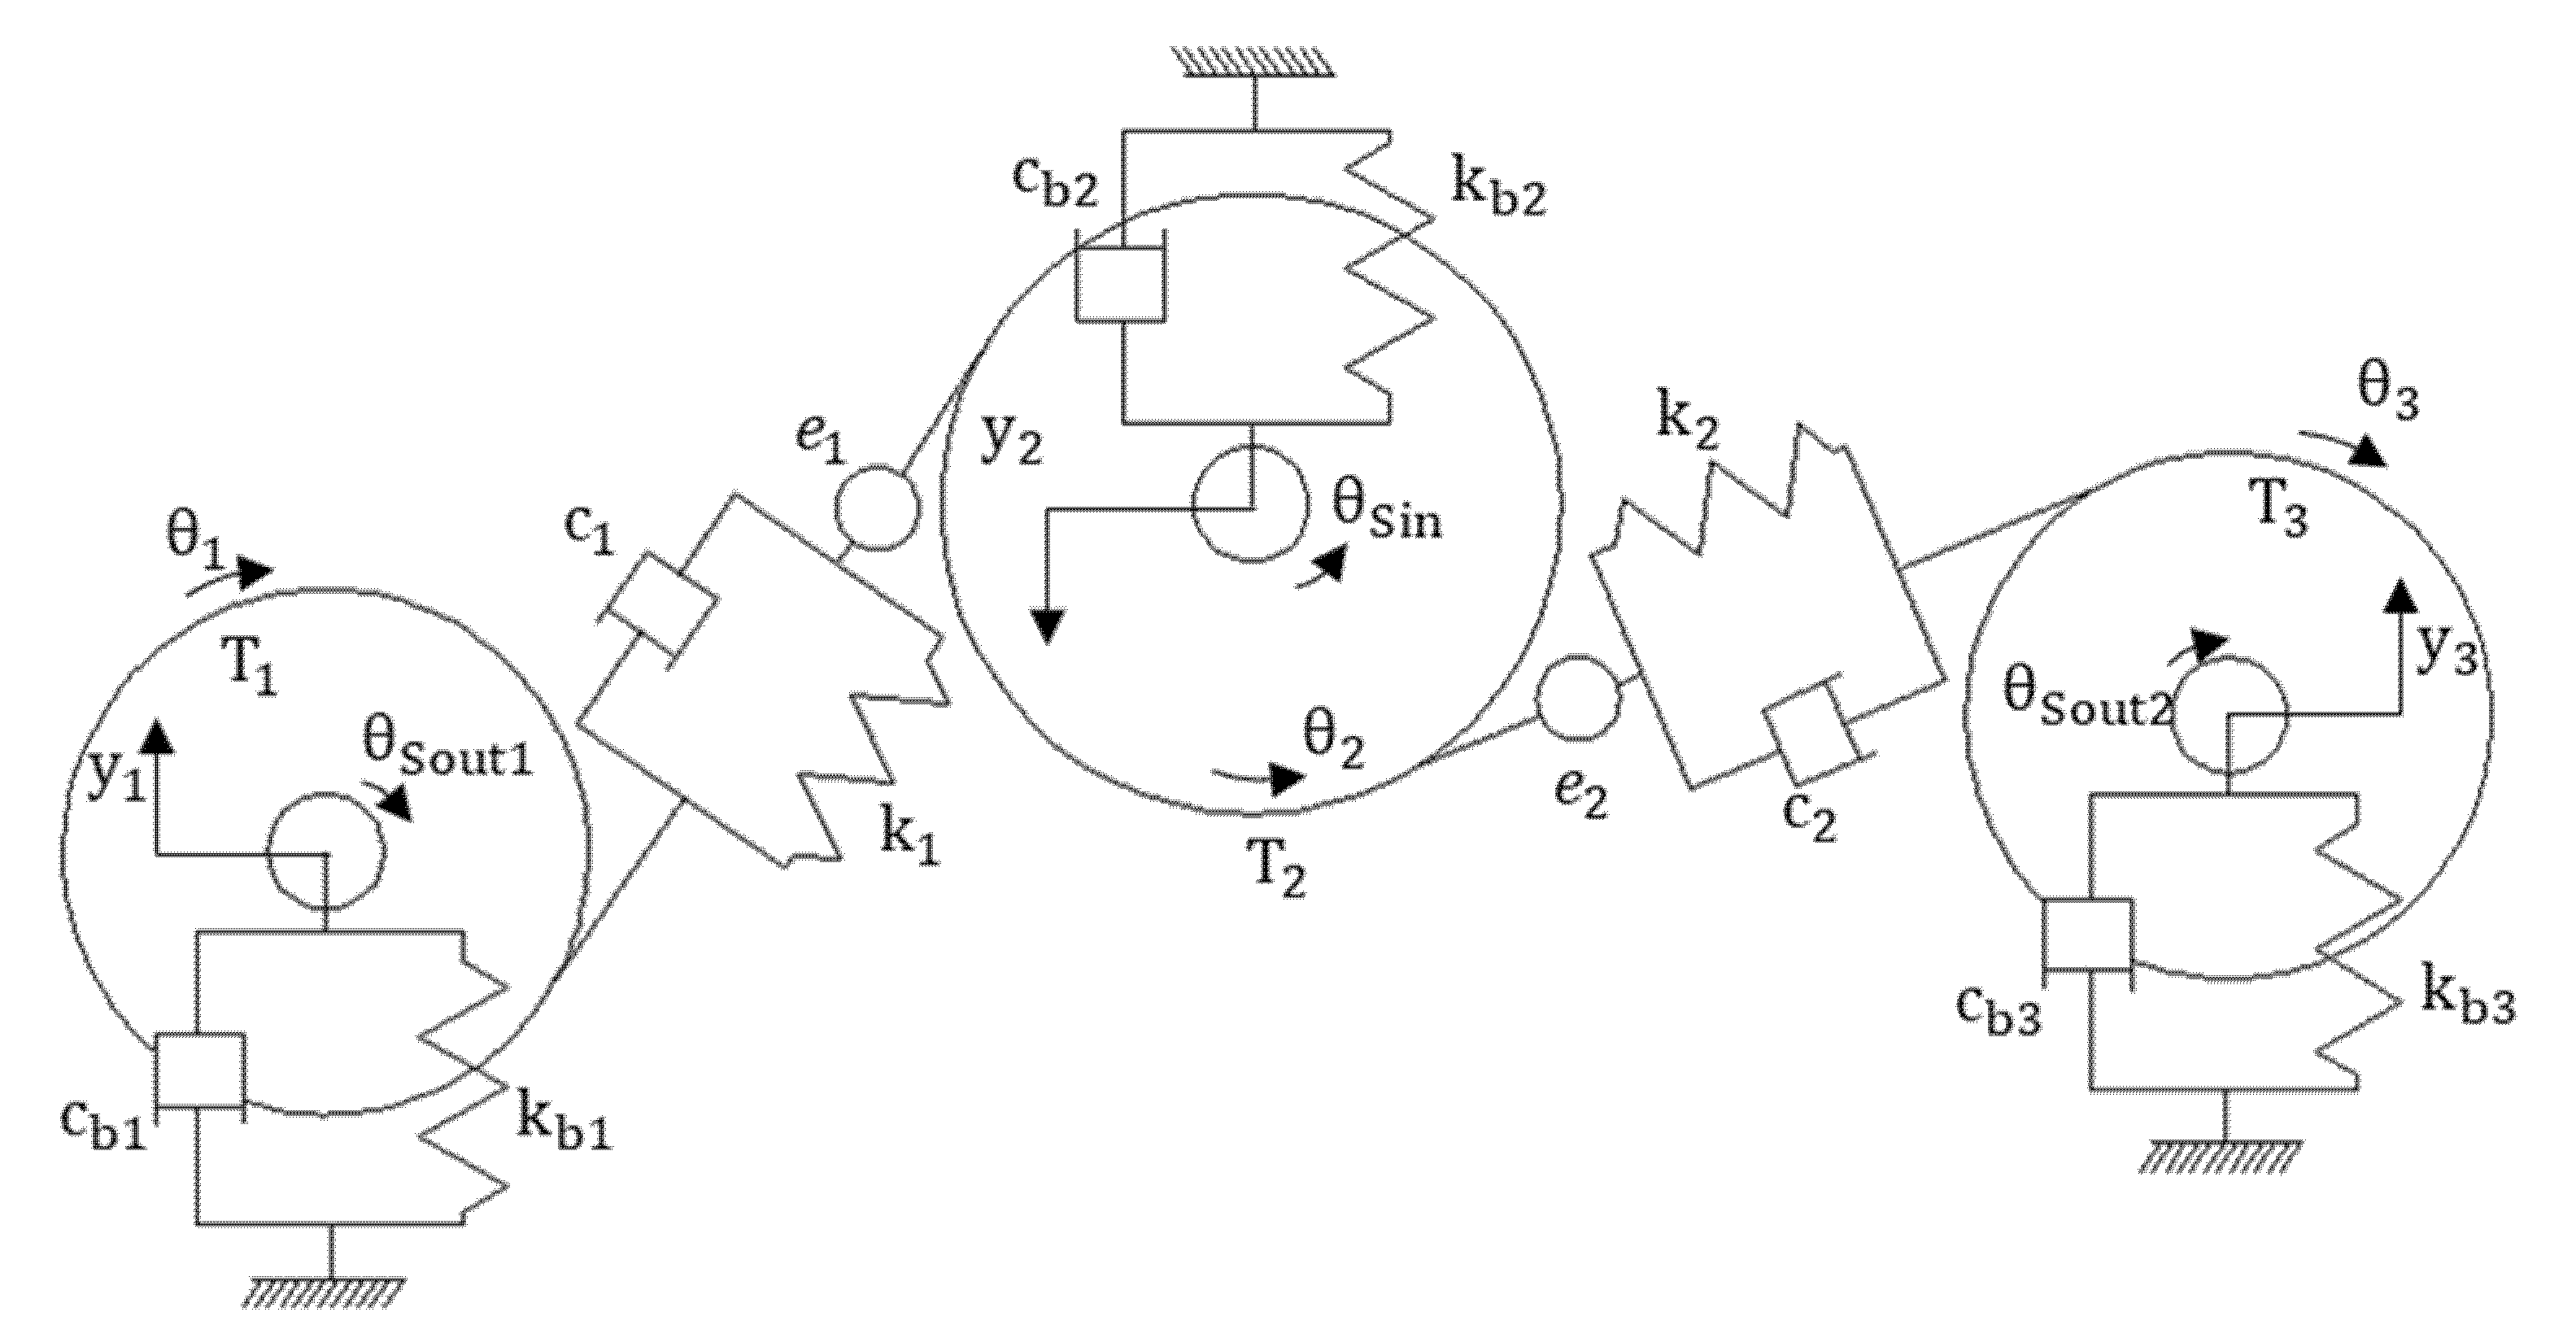
2.1.2. Equations of Motion
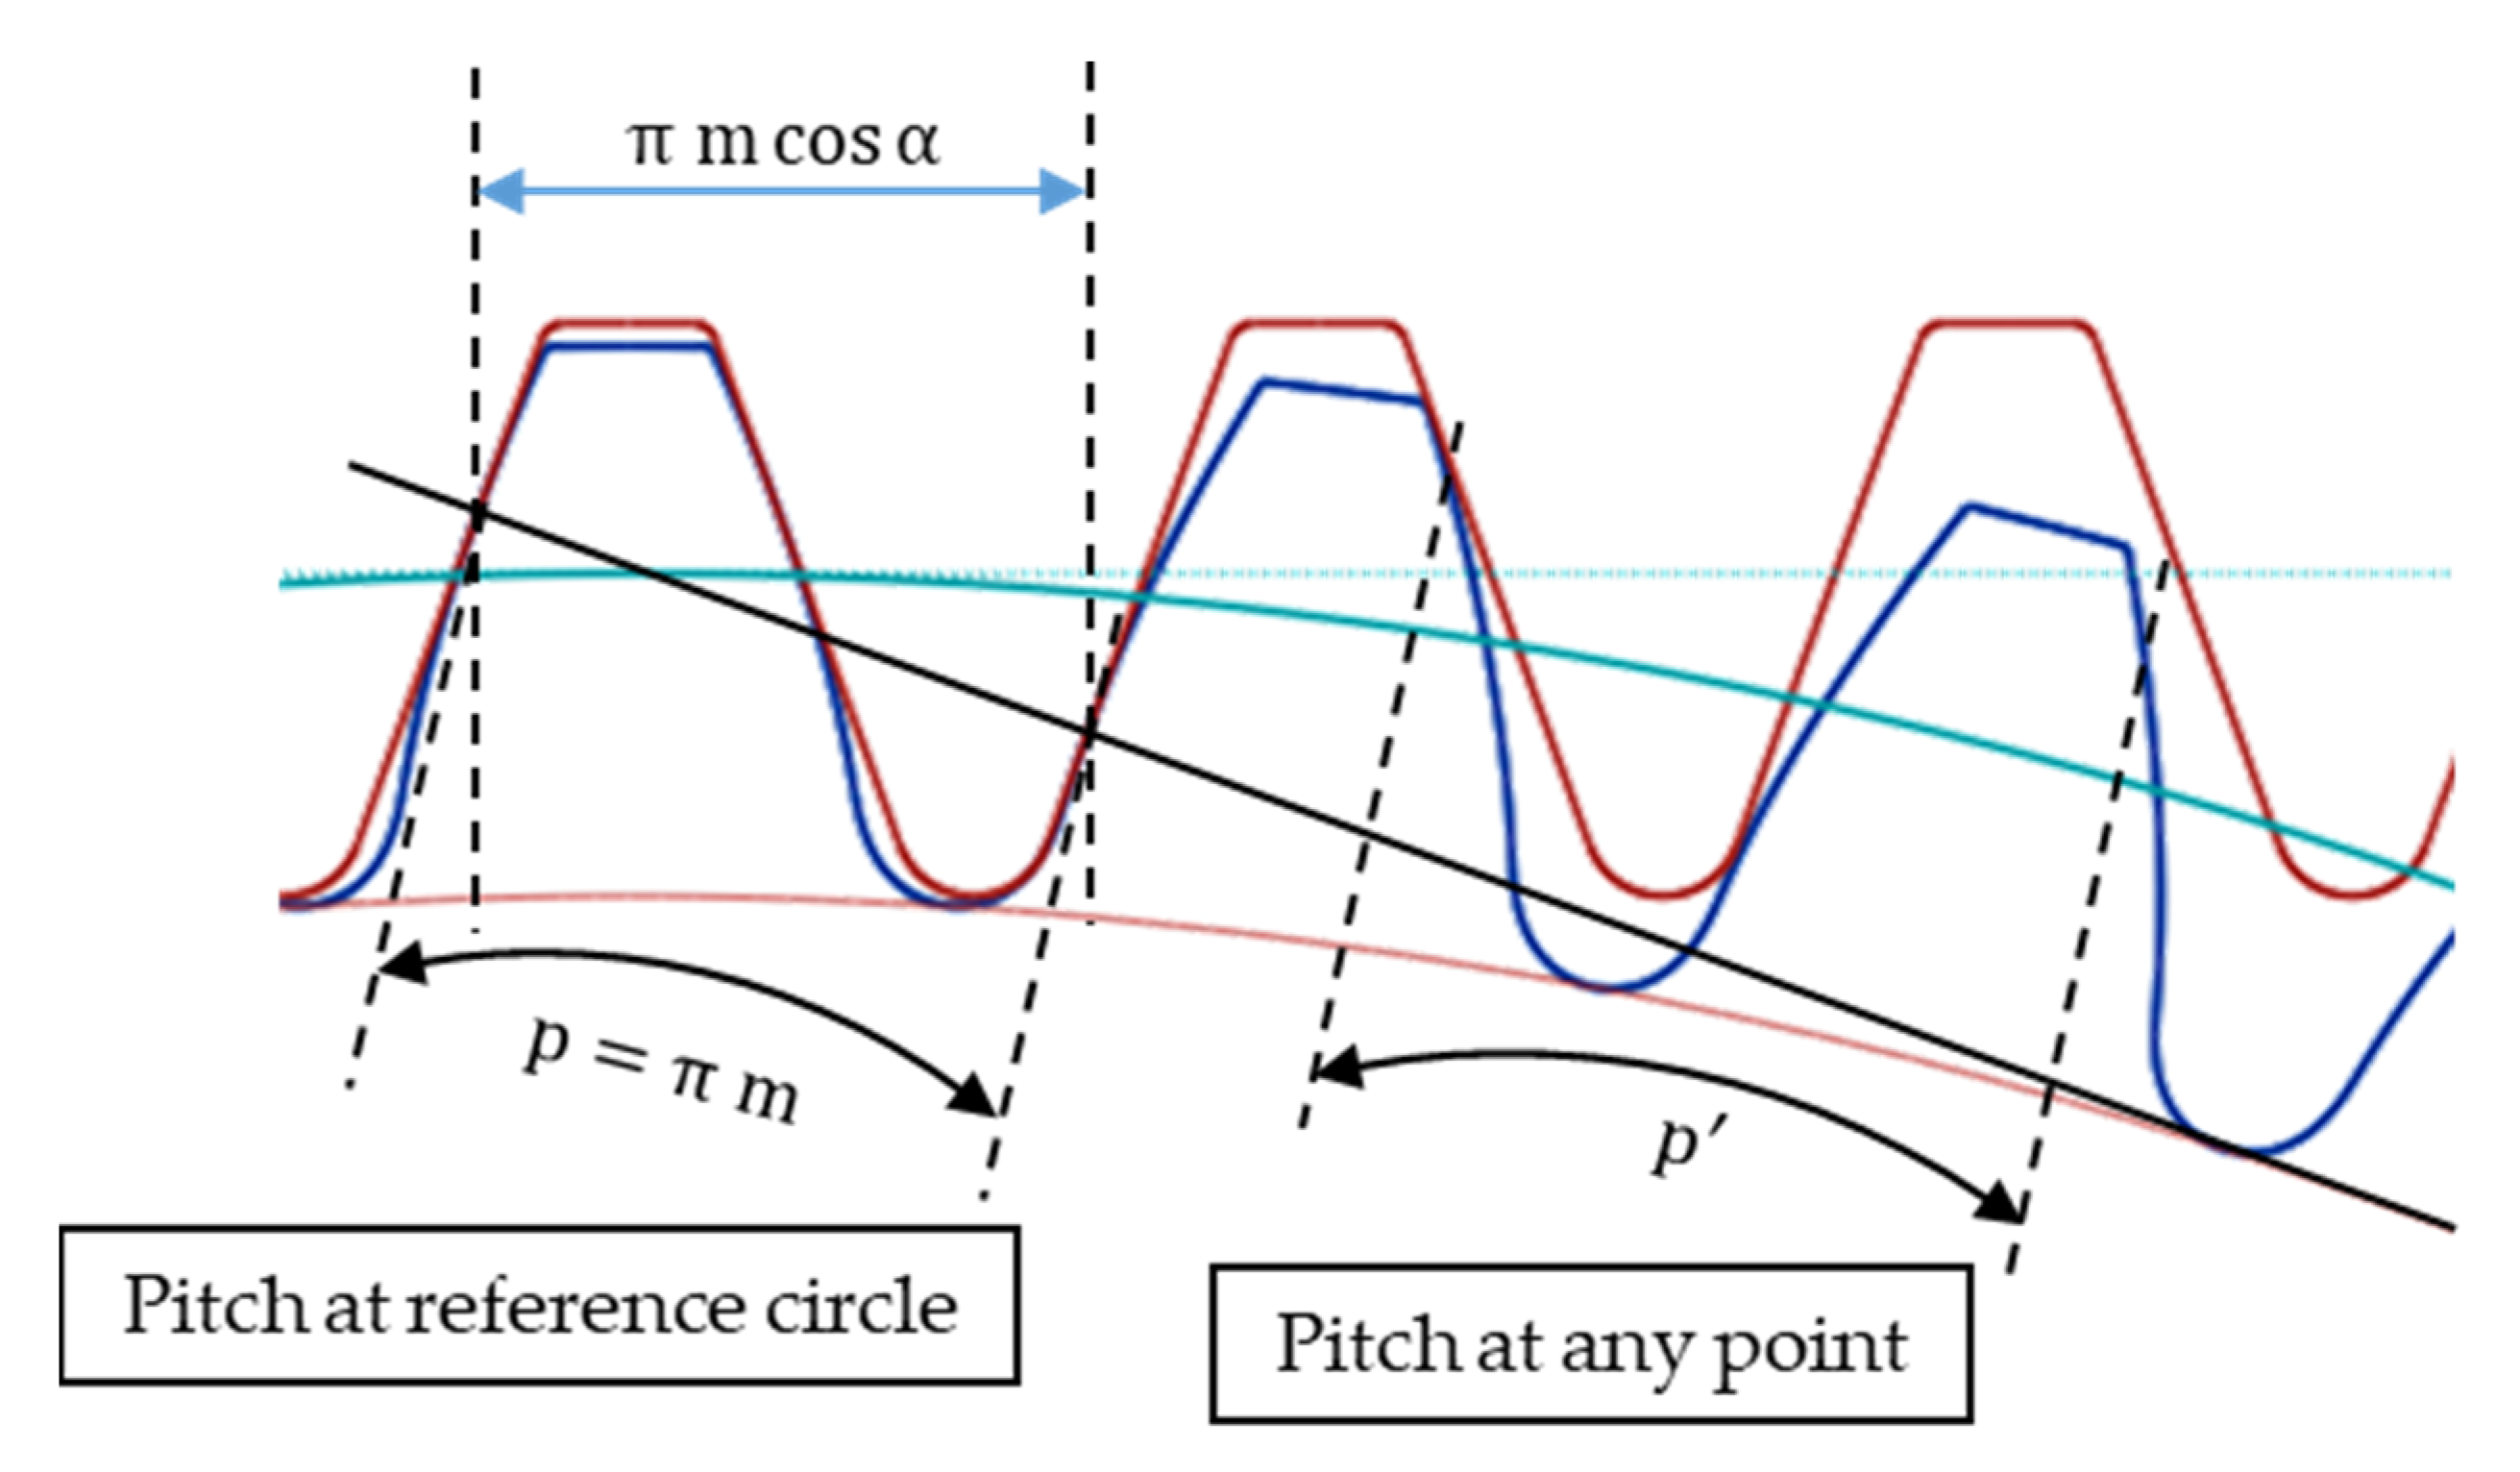
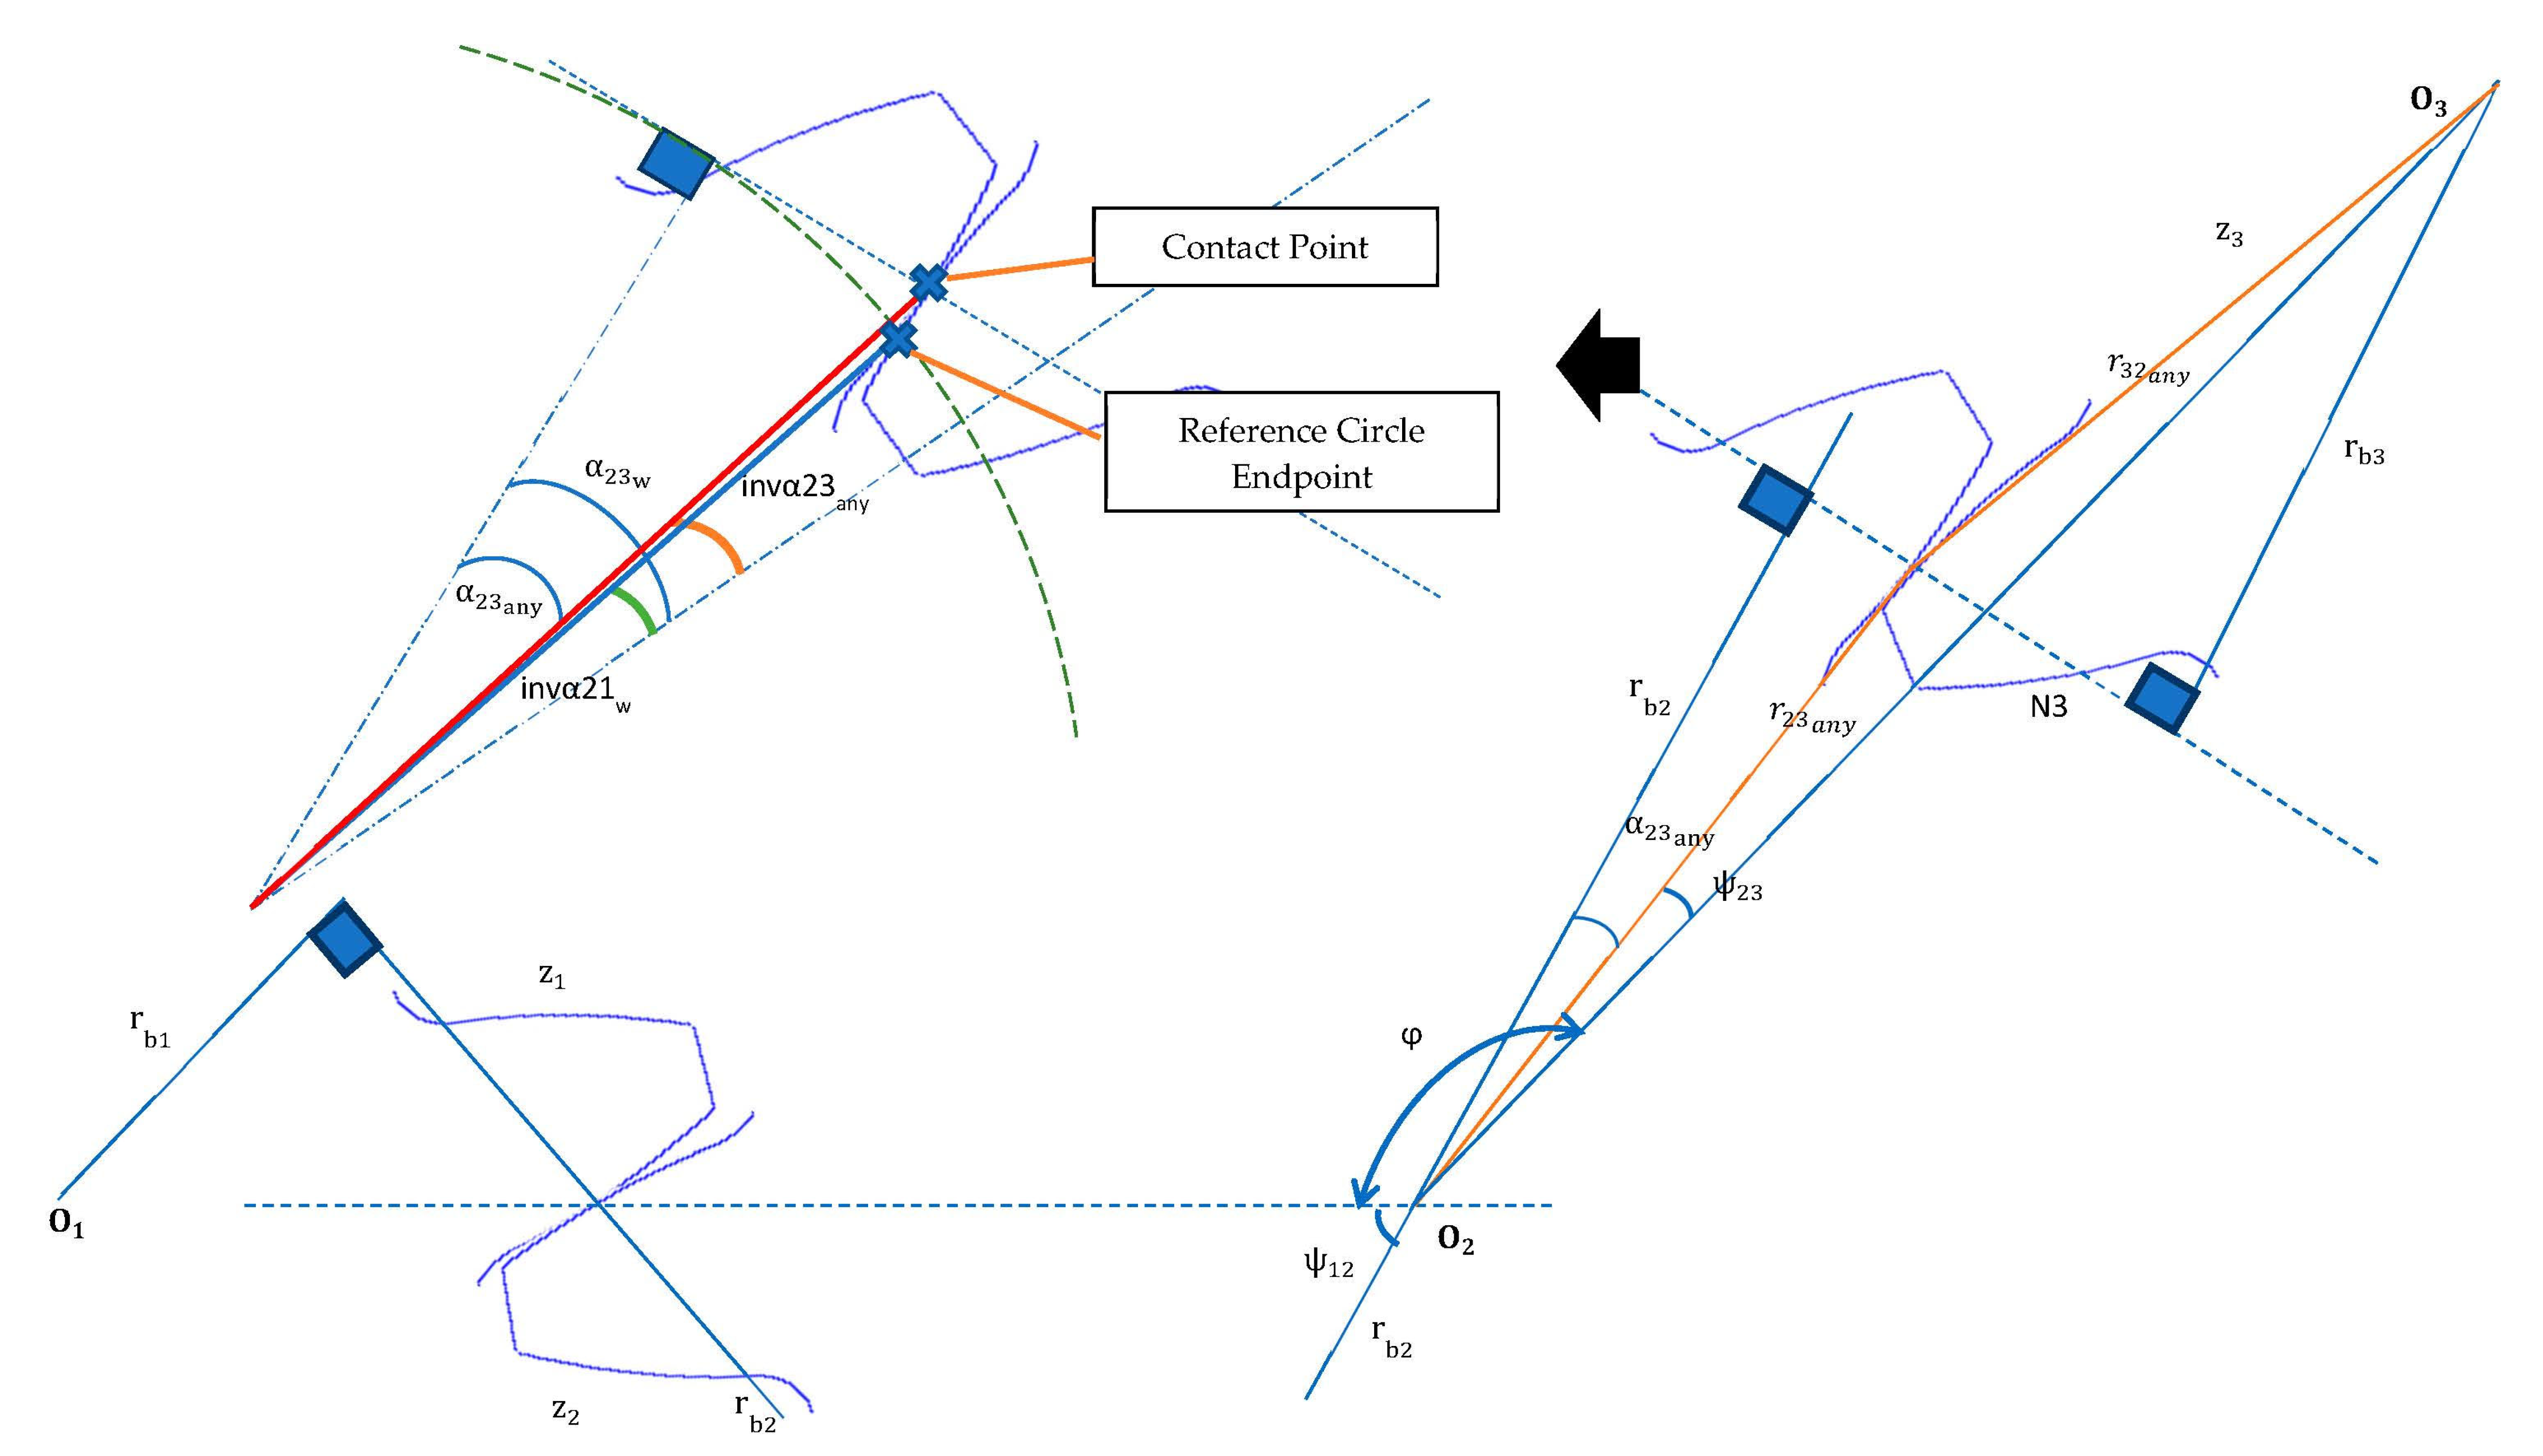
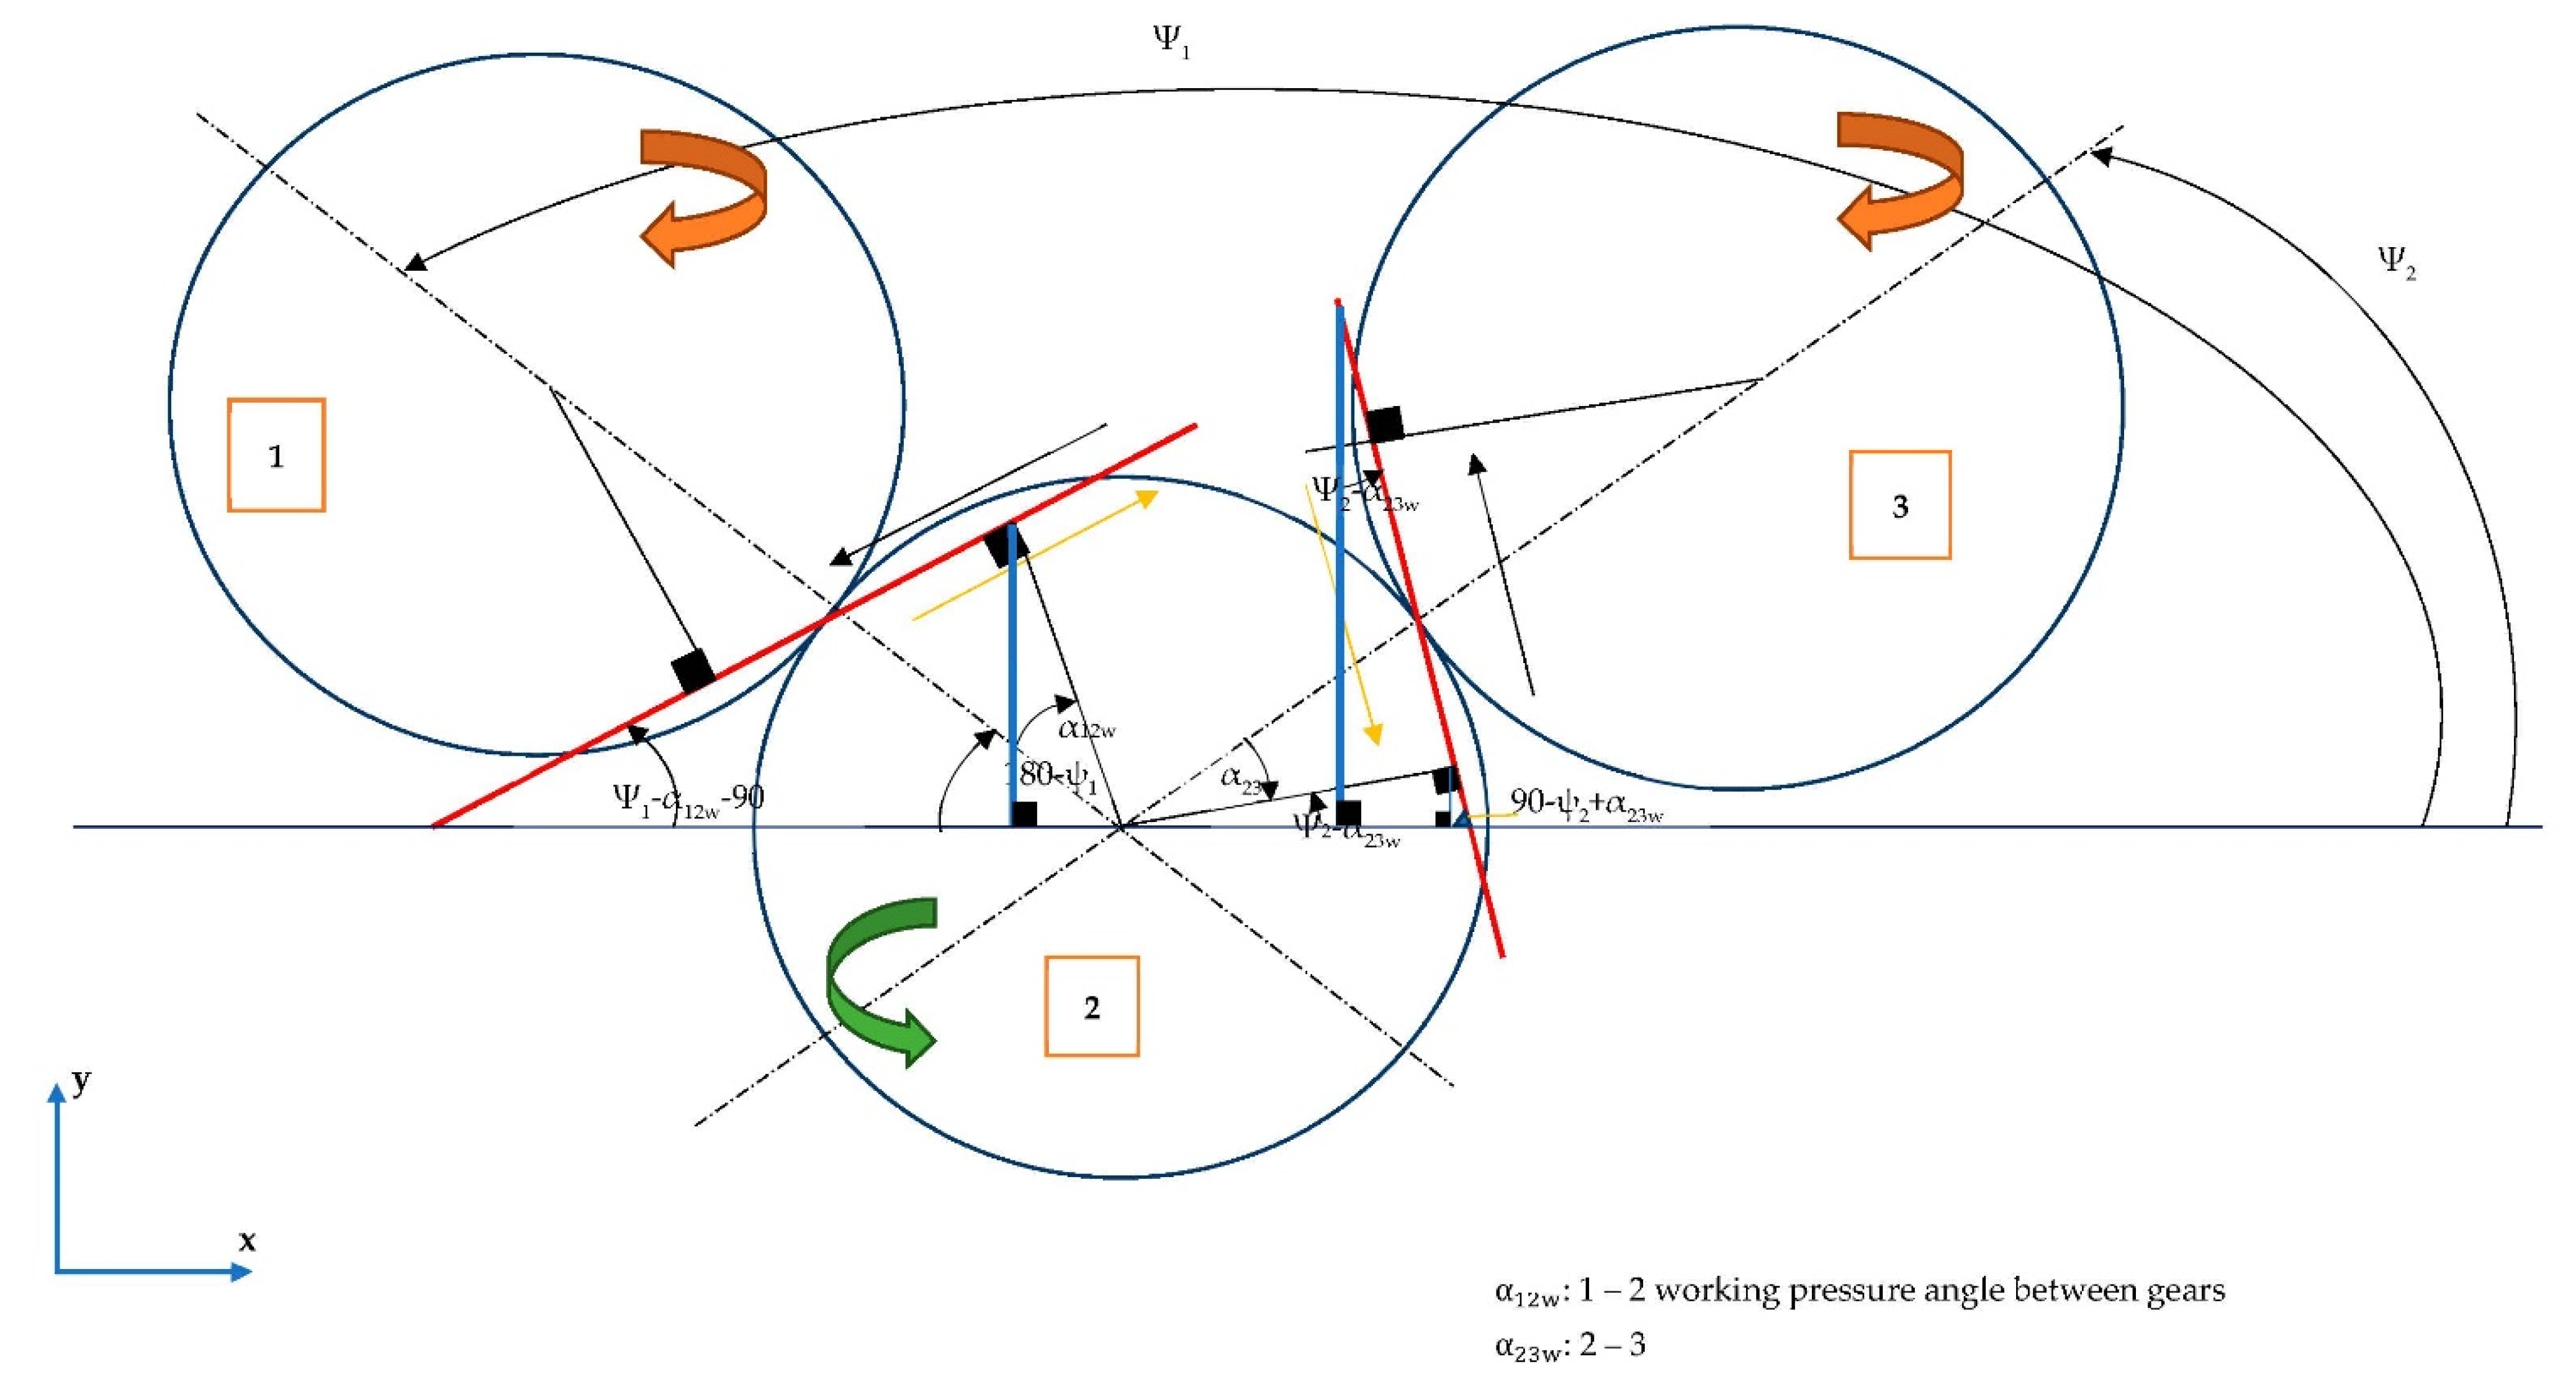
2.1.3. Phase Difference
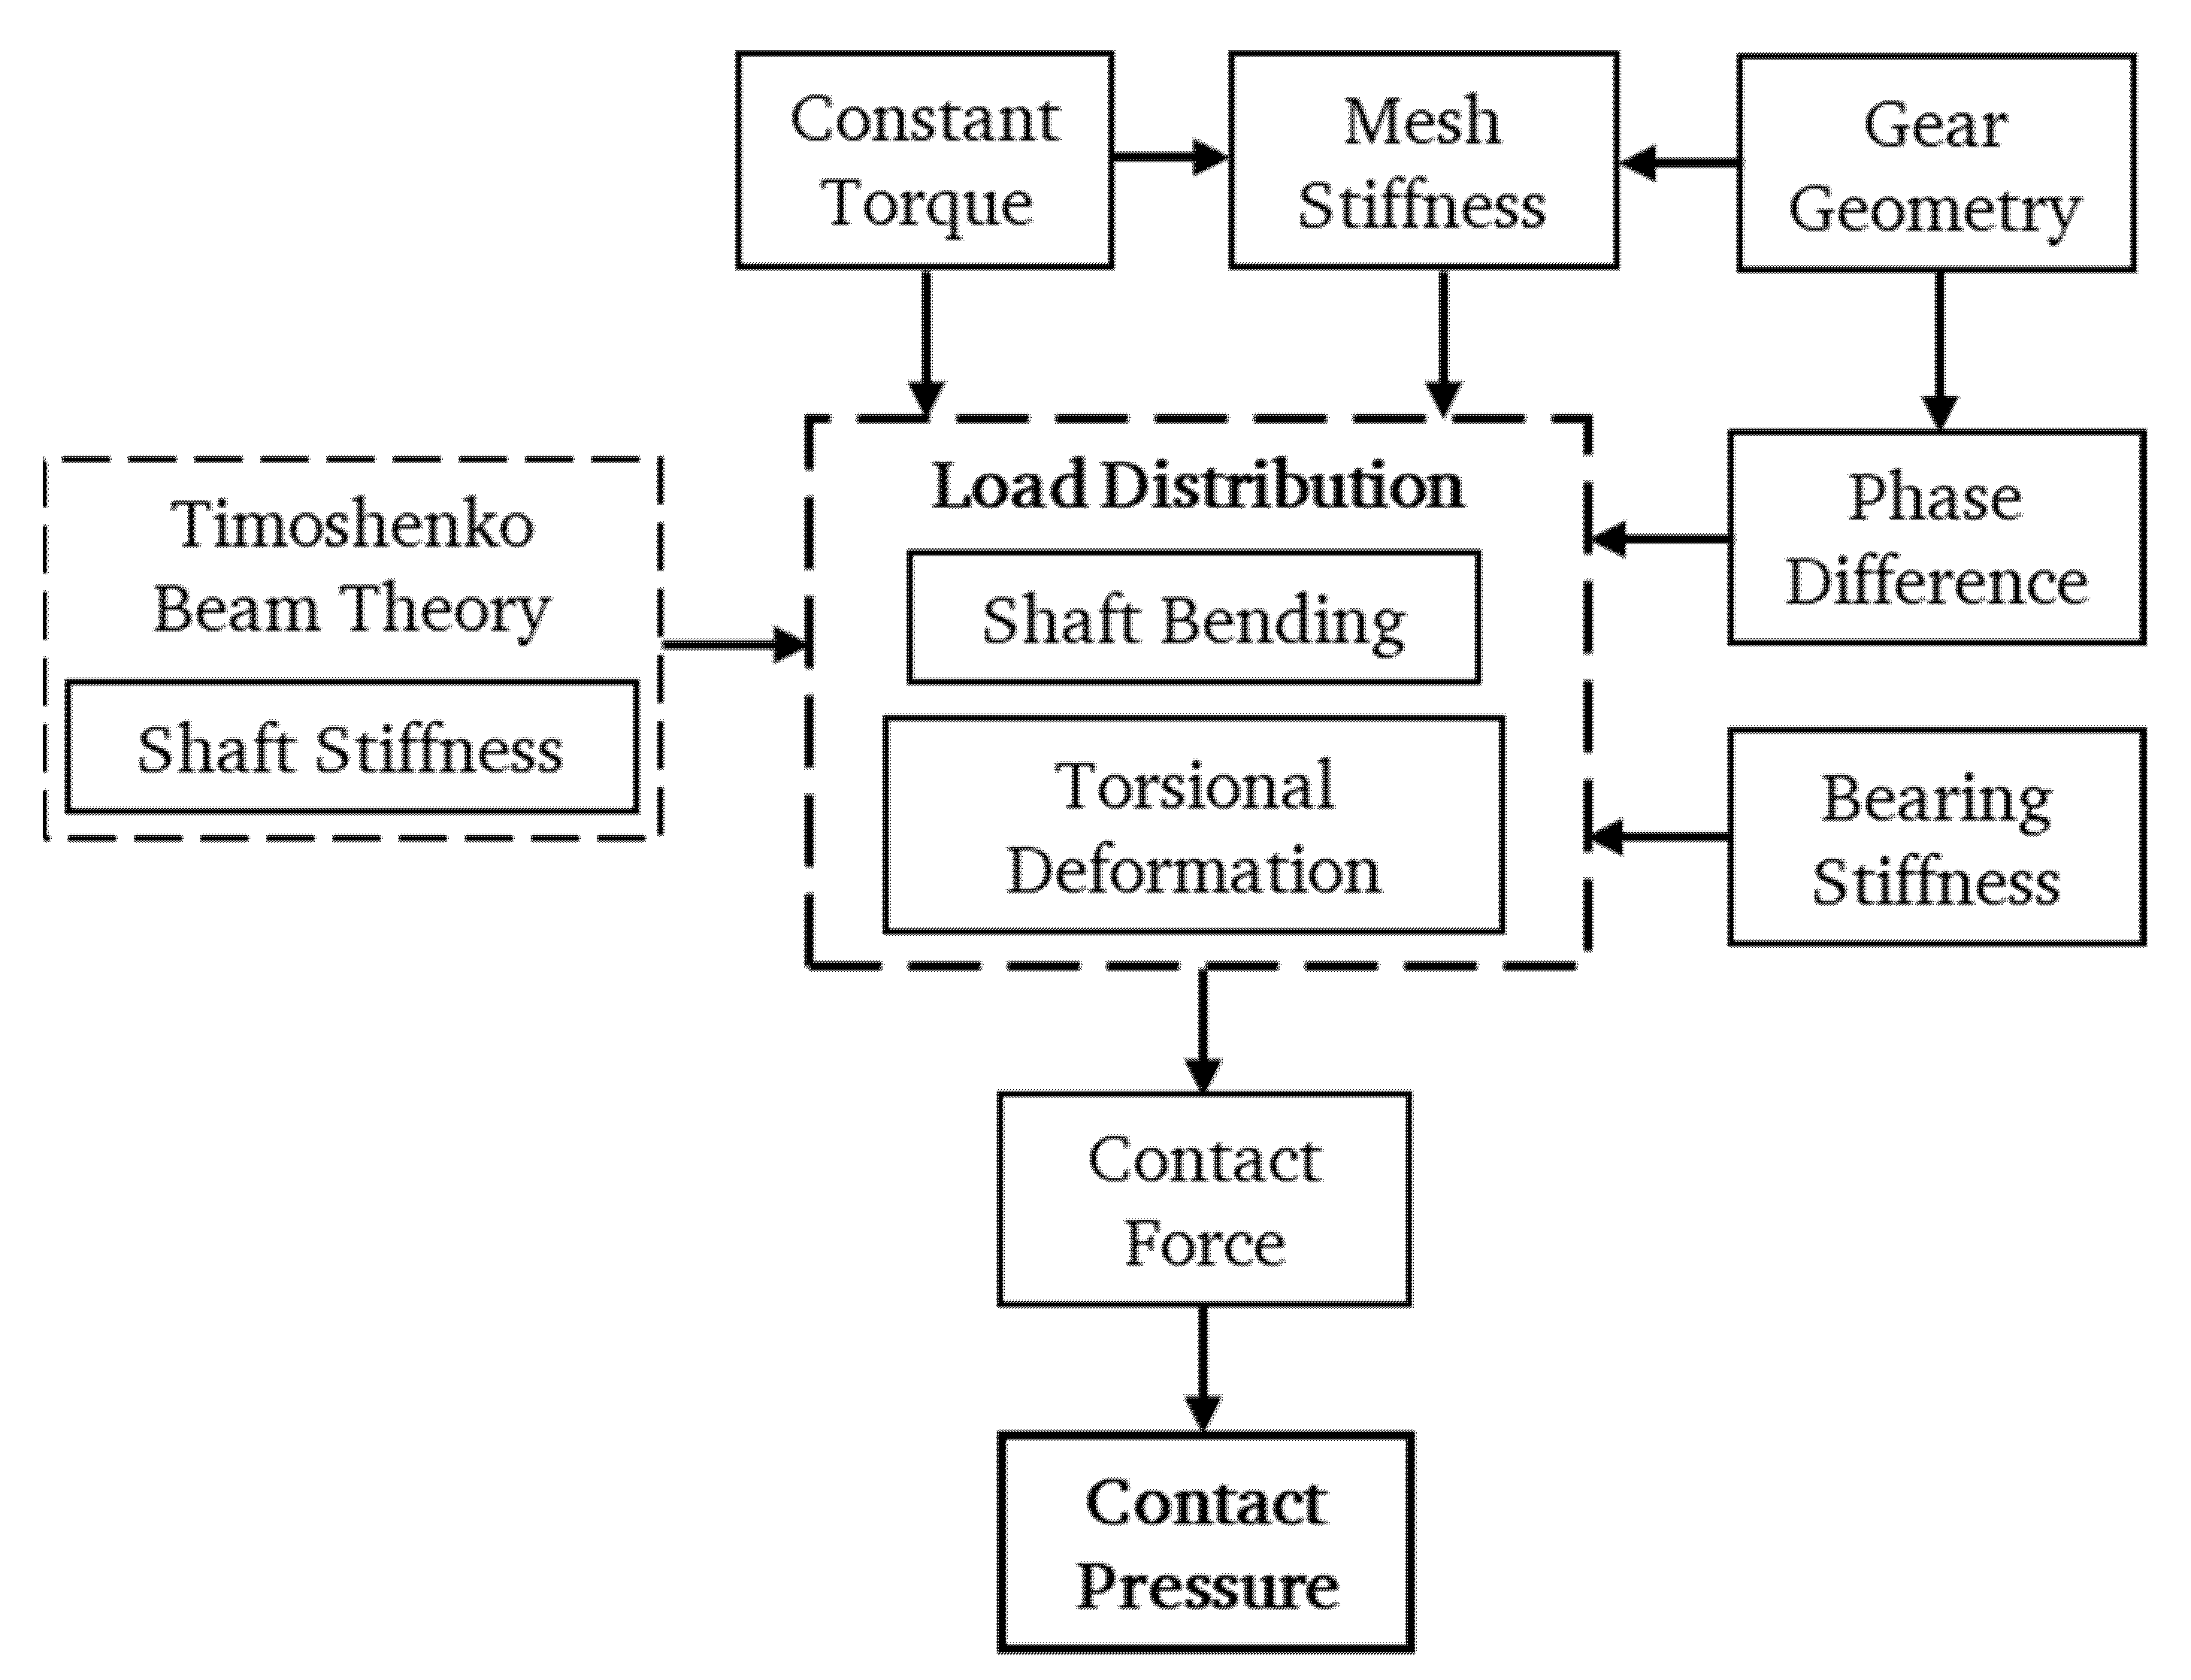
2.2. System Deformation
- The axial direction is not included in spur gears because the axial load is too small.
- The gear shaft is specified with a single stiffness matrix, assuming that it fits tightly on the shaft or is produced in one piece. The gear diameter is assumed as the increase in the diameter of the shaft with the pitch circle.
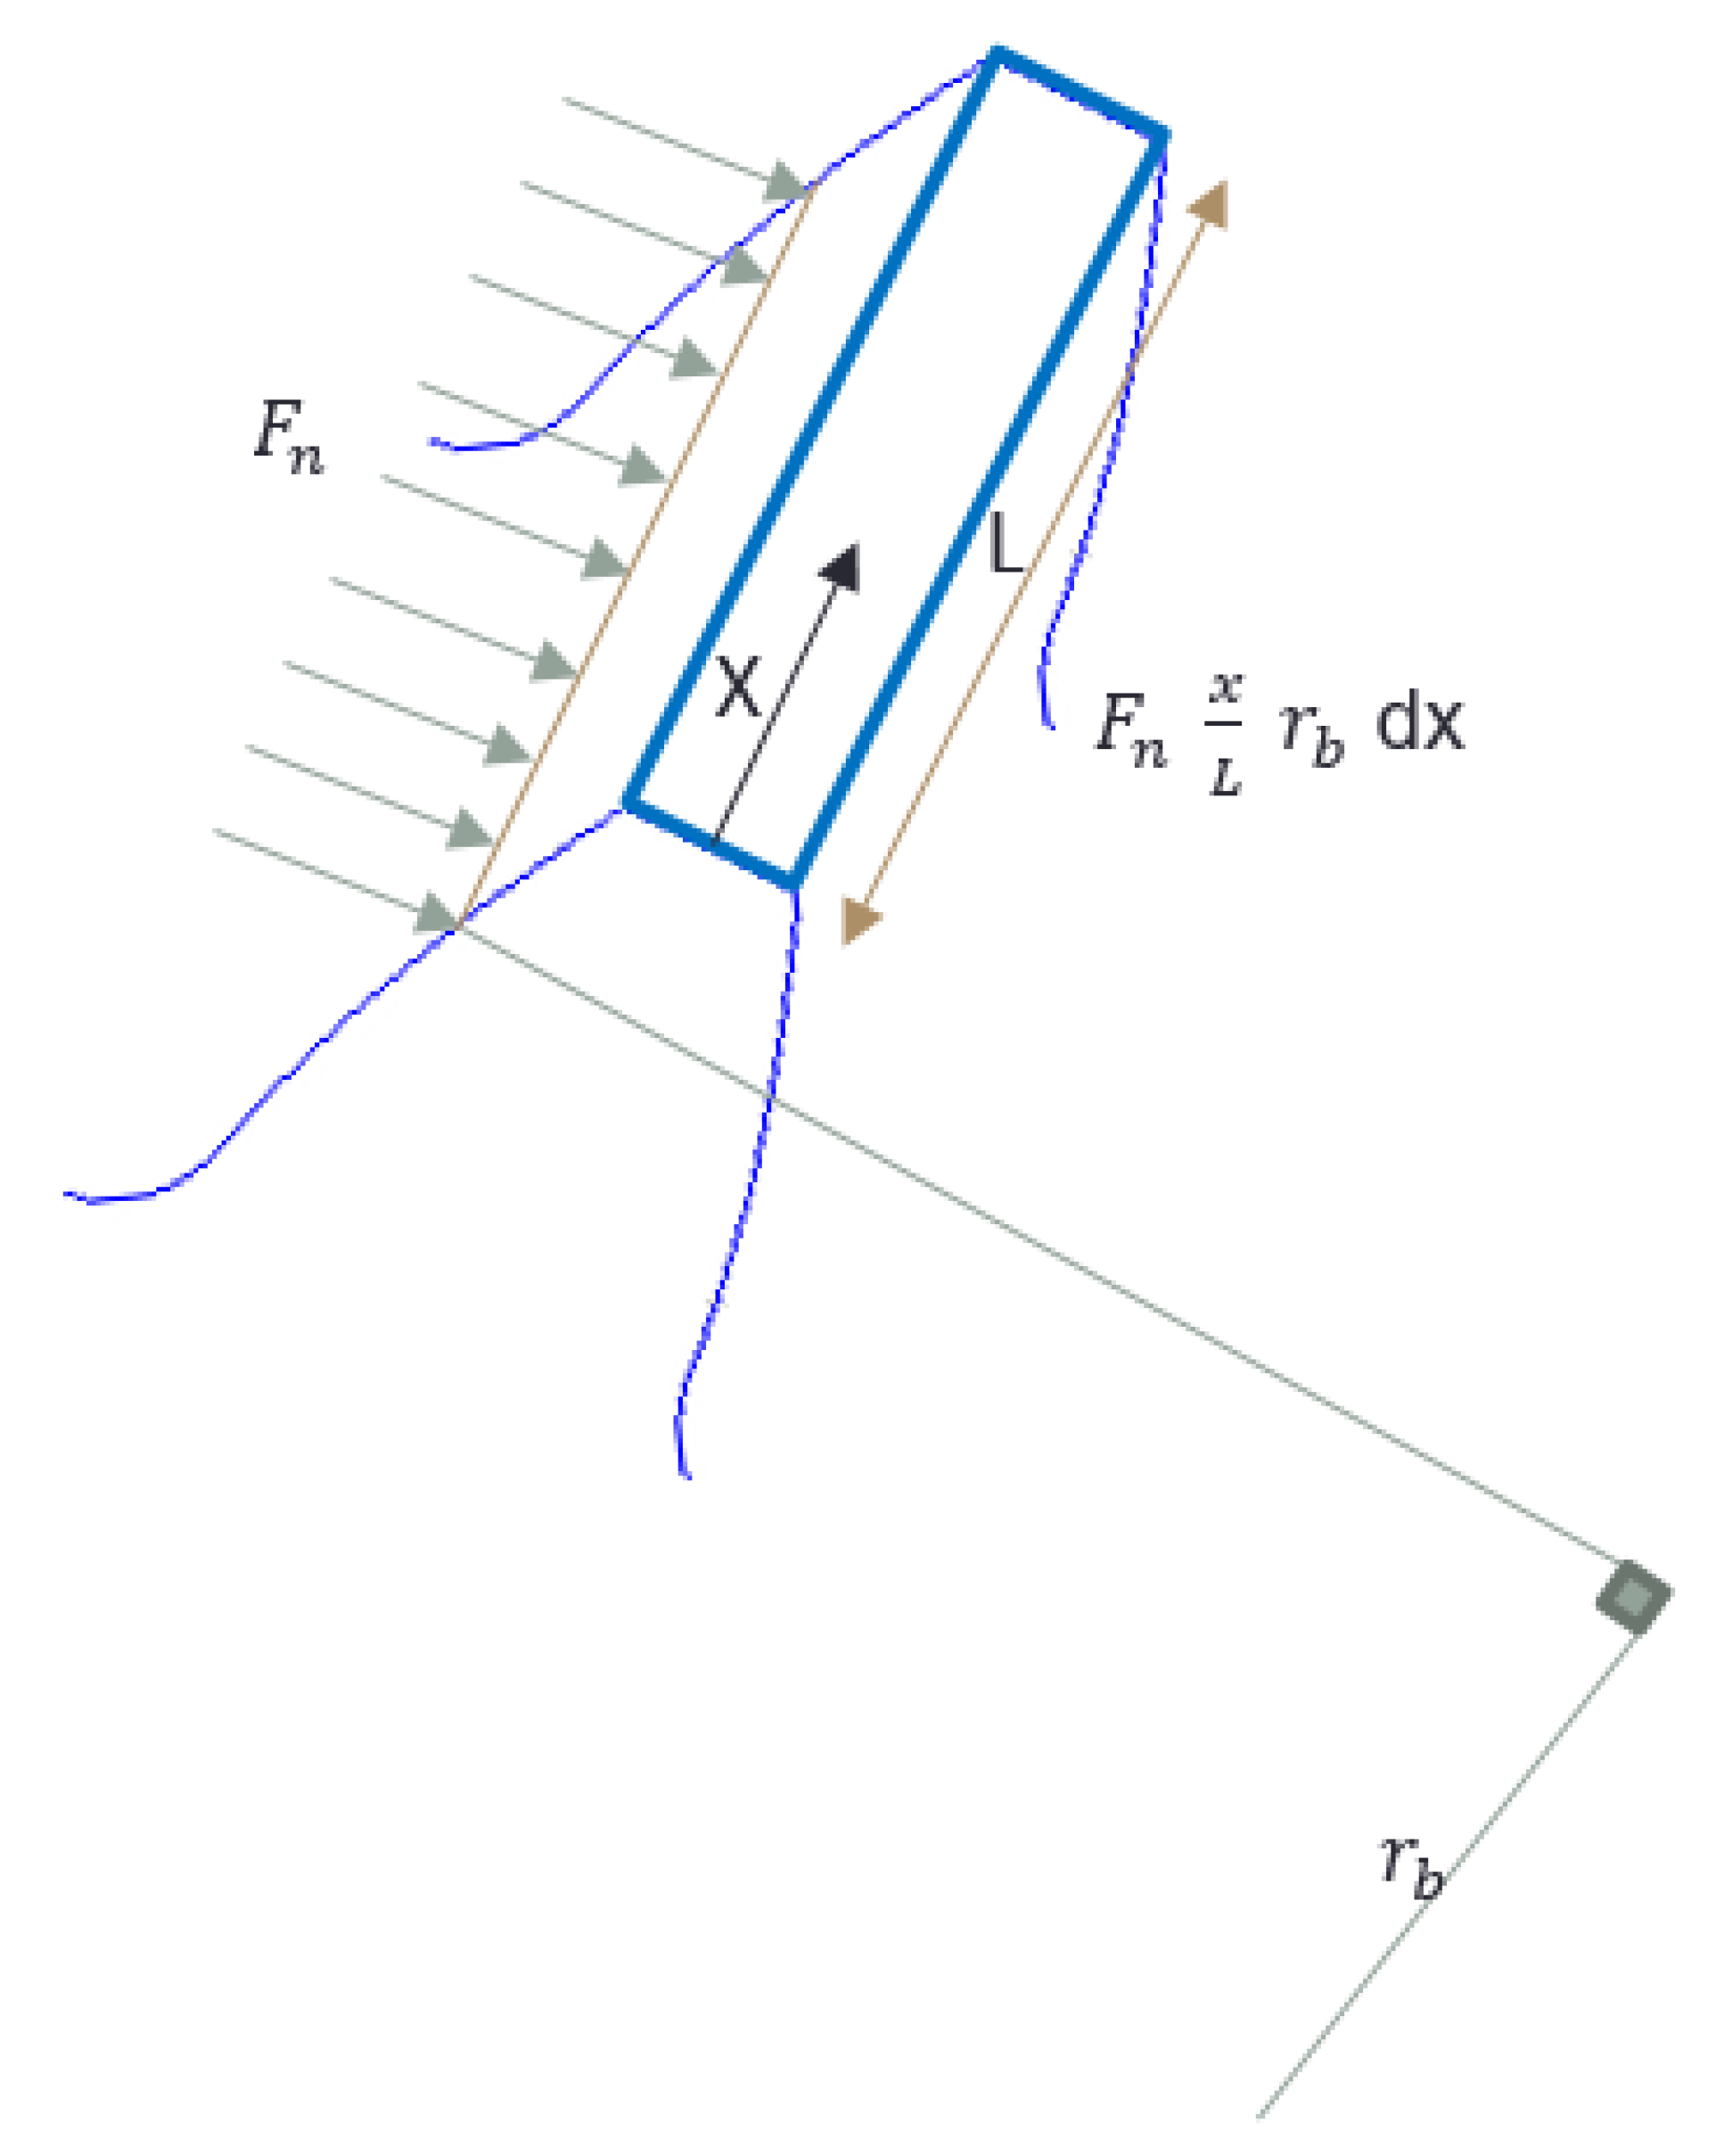
2.2.1. Torsional Deformation in the Gear Body
2.2.2. Shaft Bending
2.2.3. Tooth Contact Analysis in Torque Split Model
3. Numerical Analysis
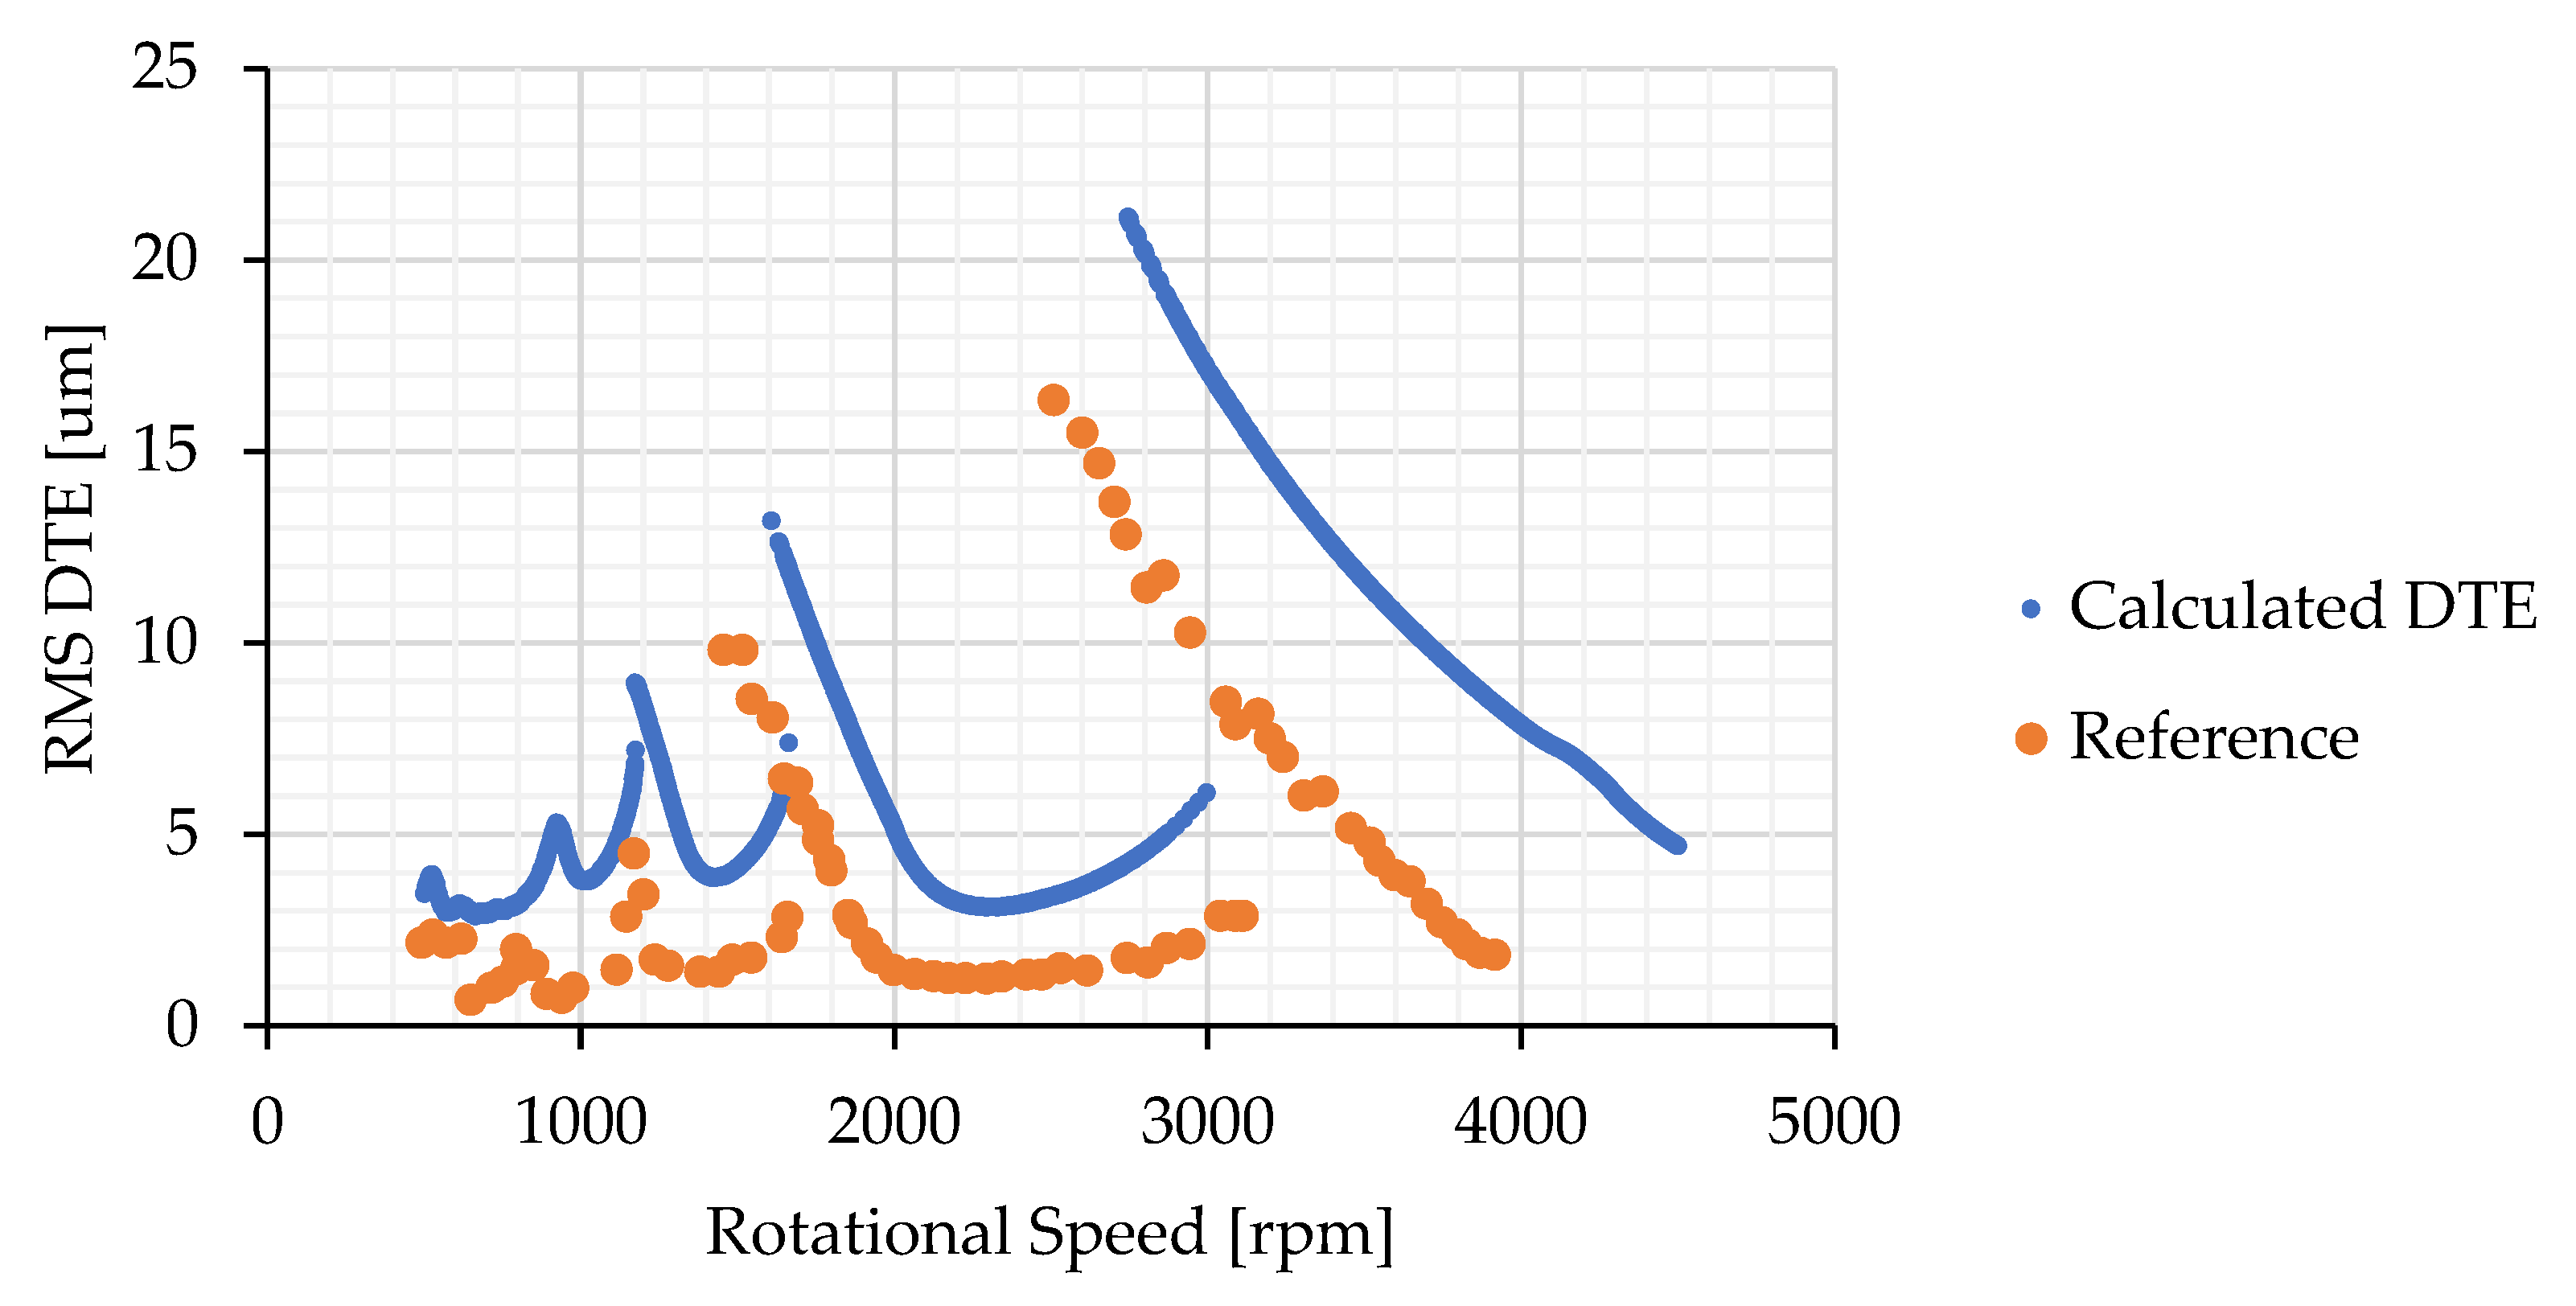
3.1. System Response in the Torque Split
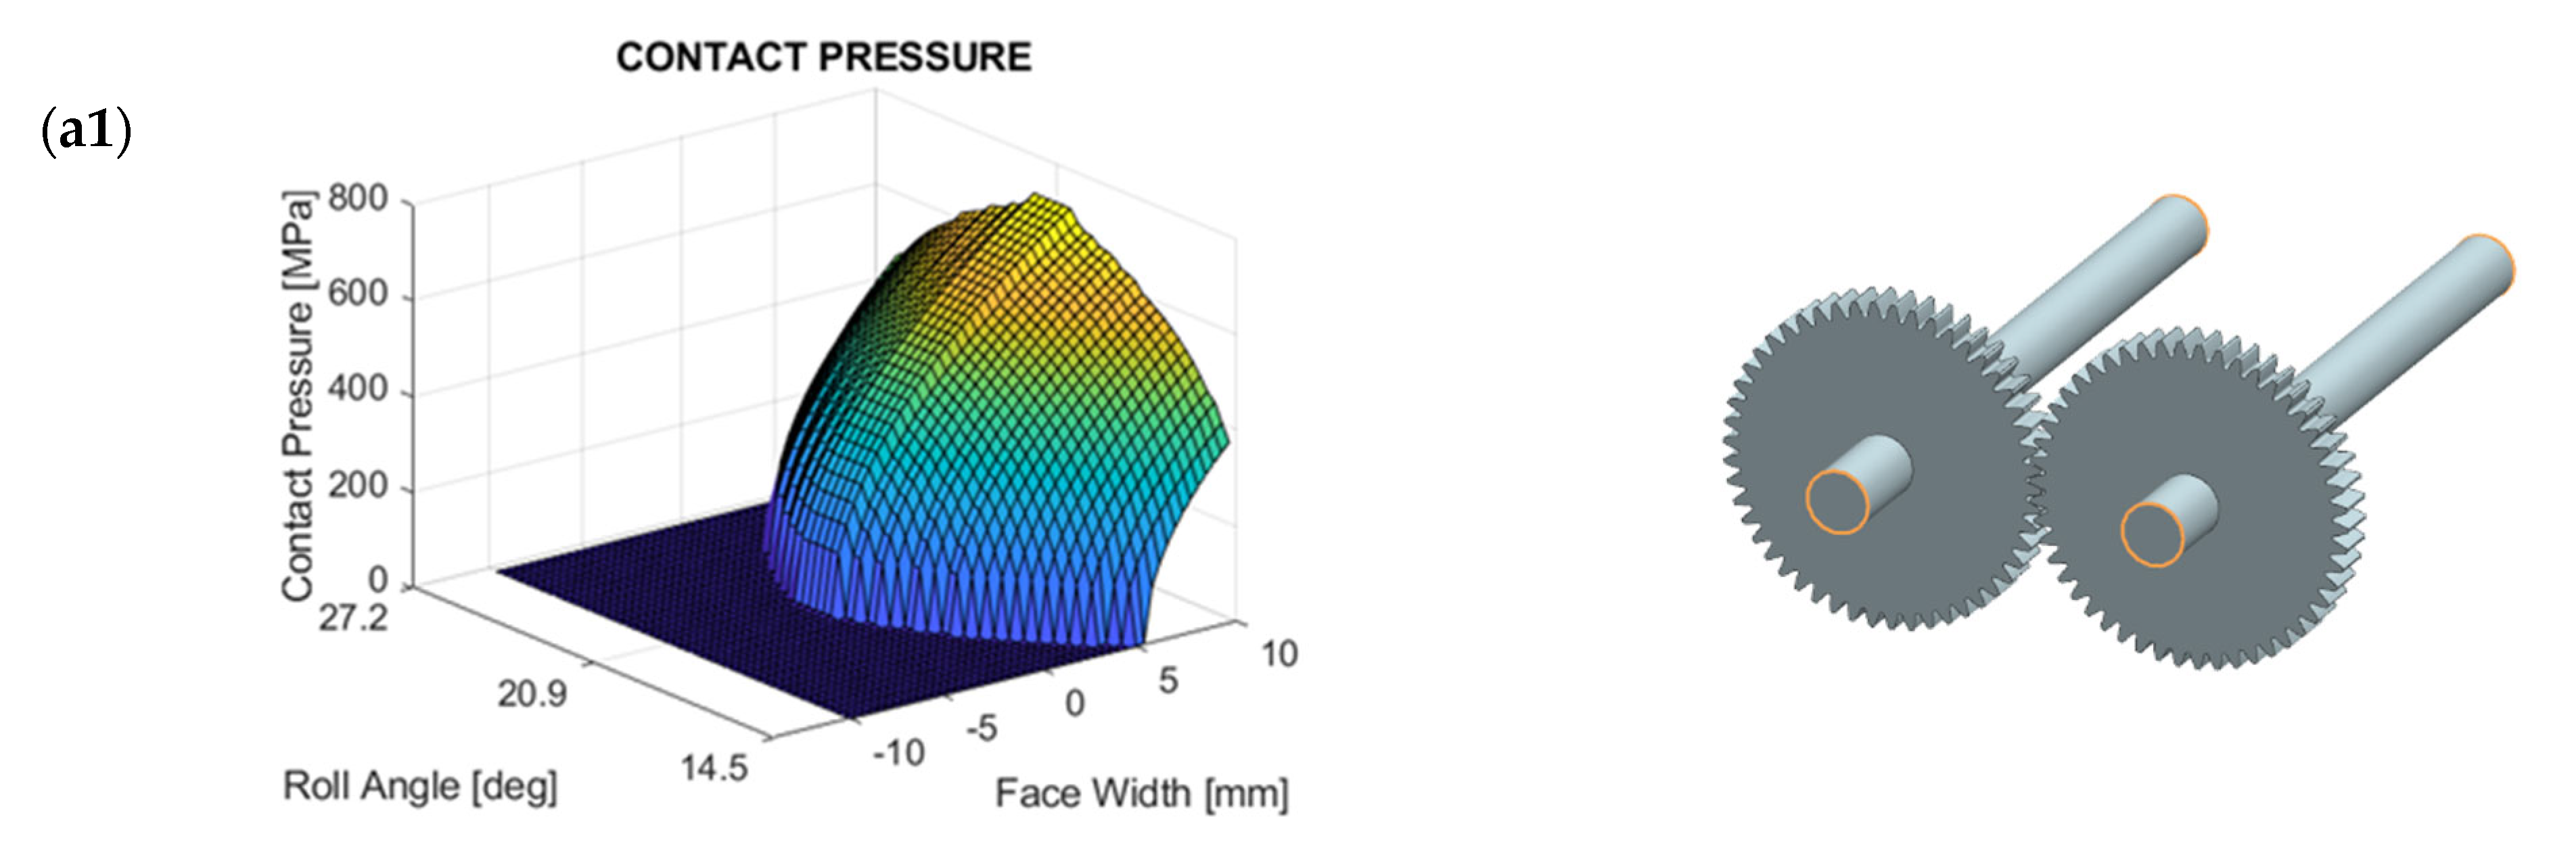
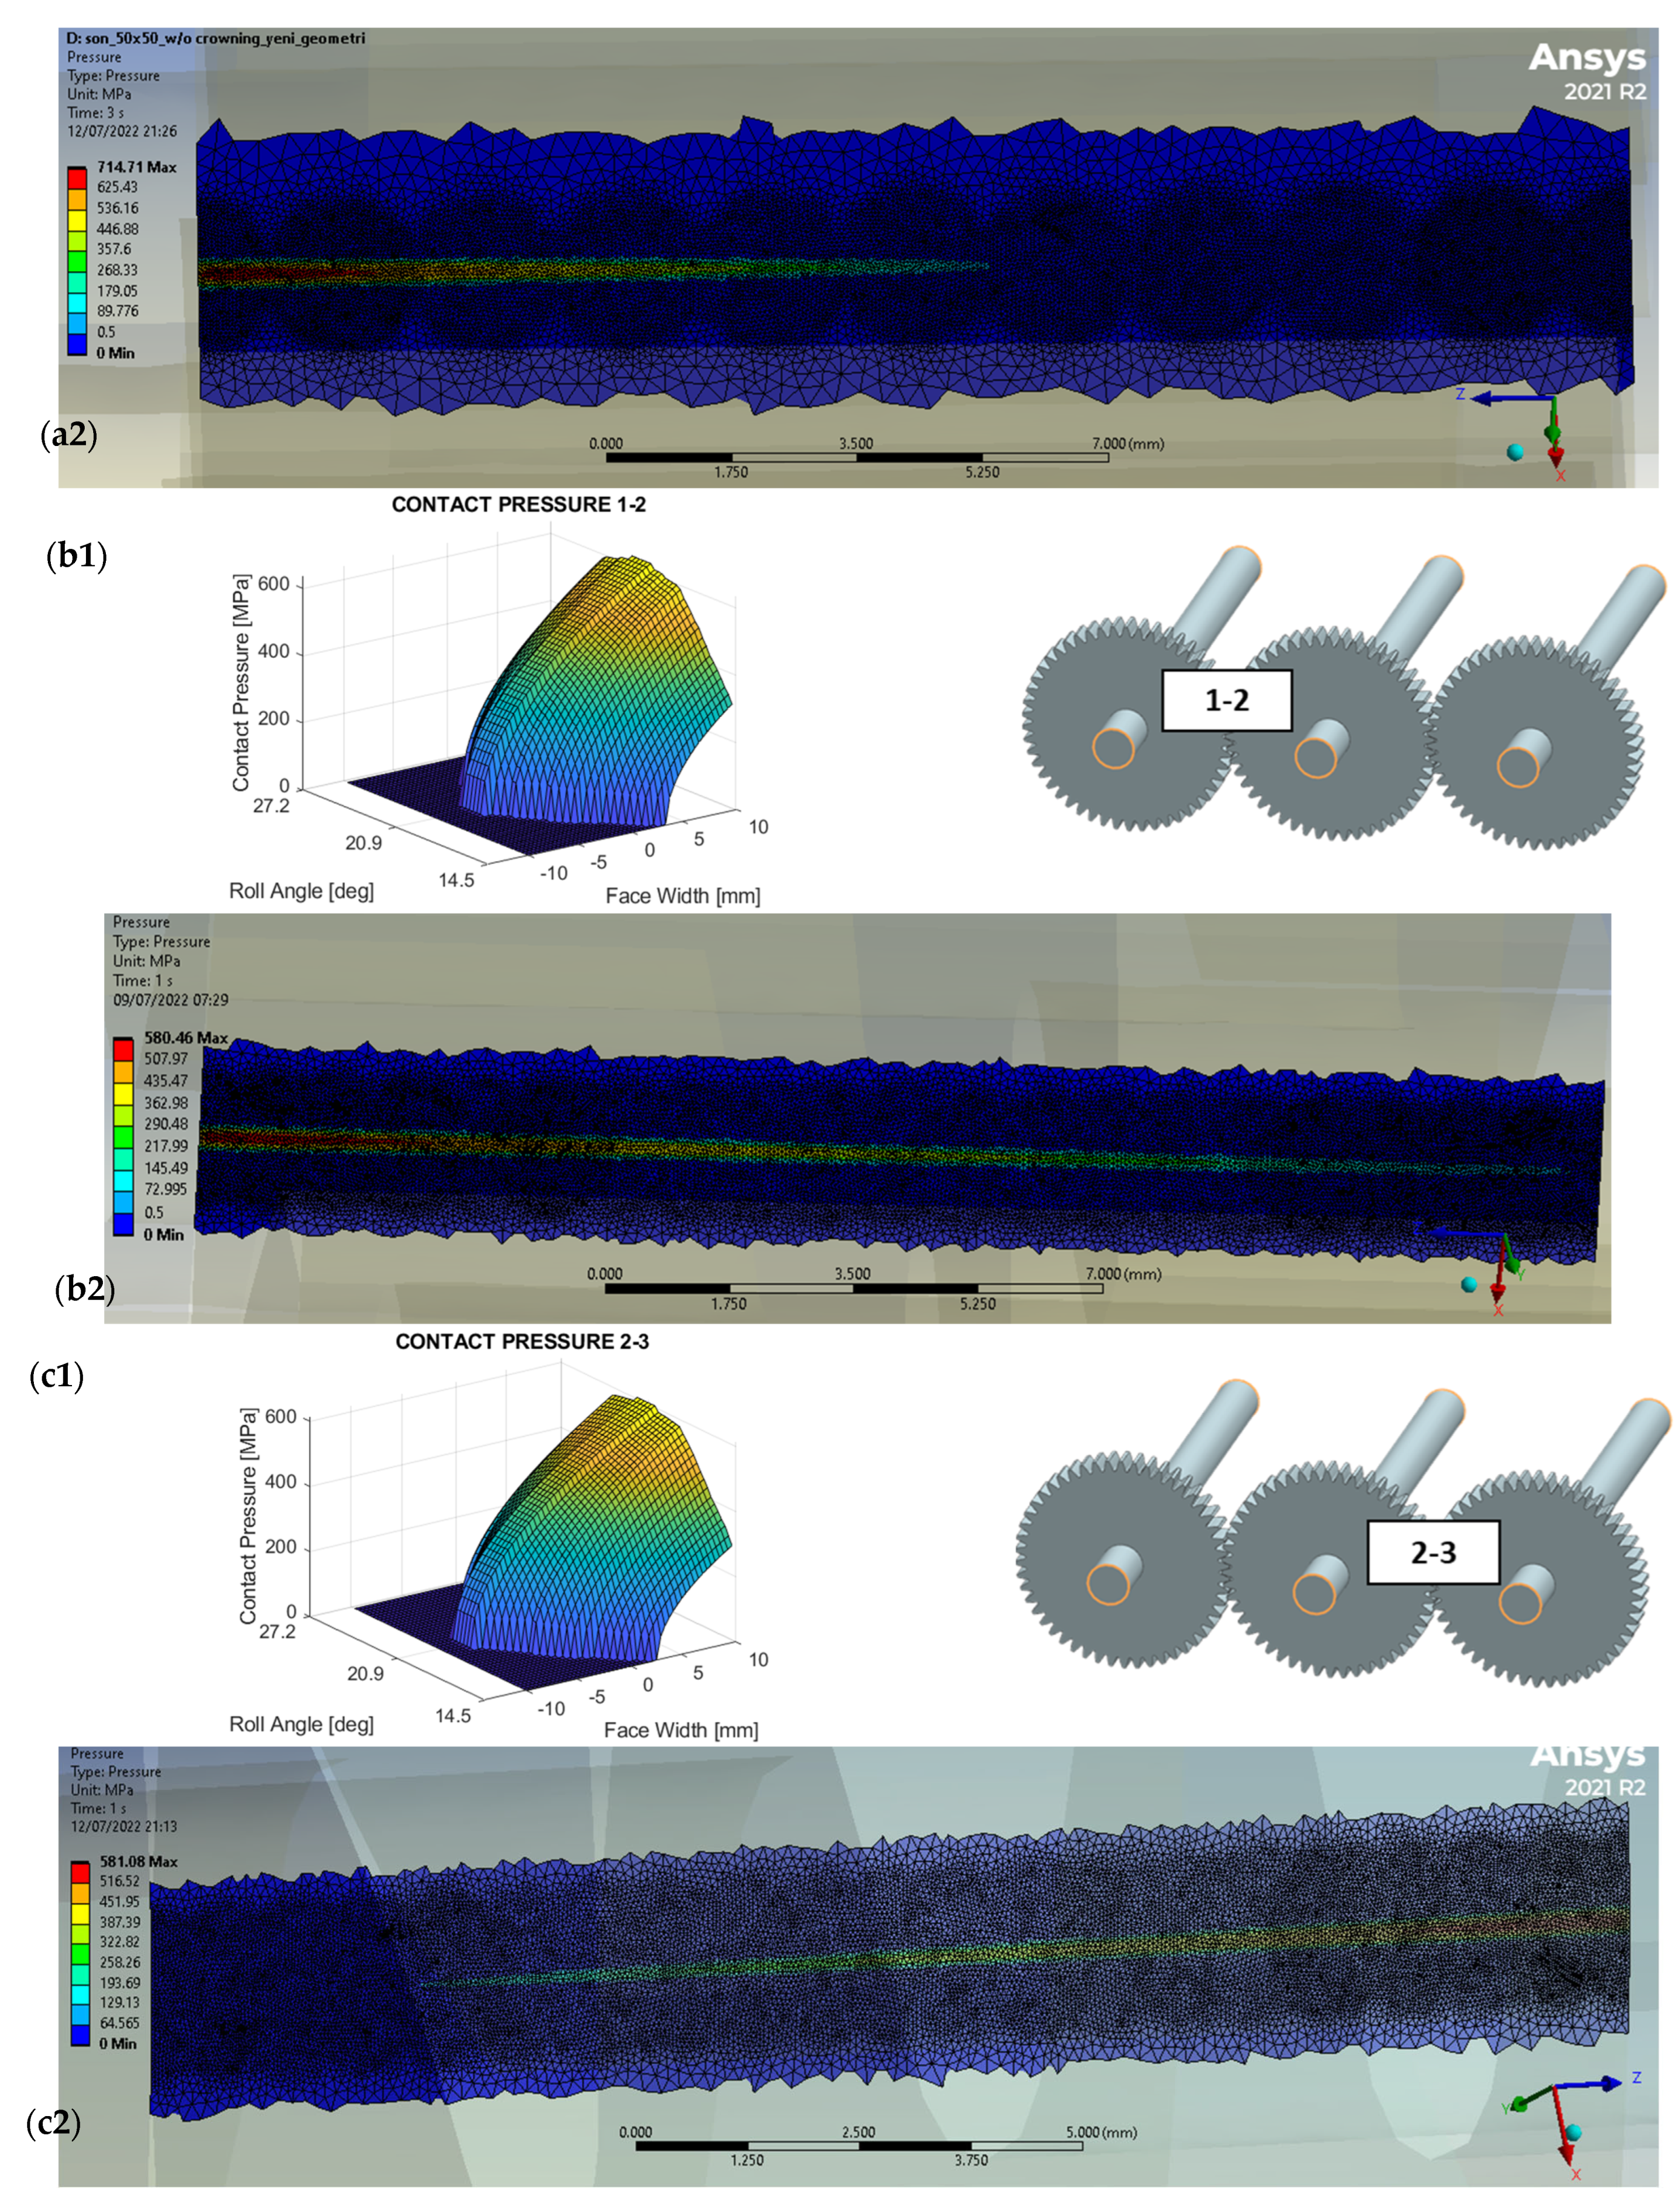
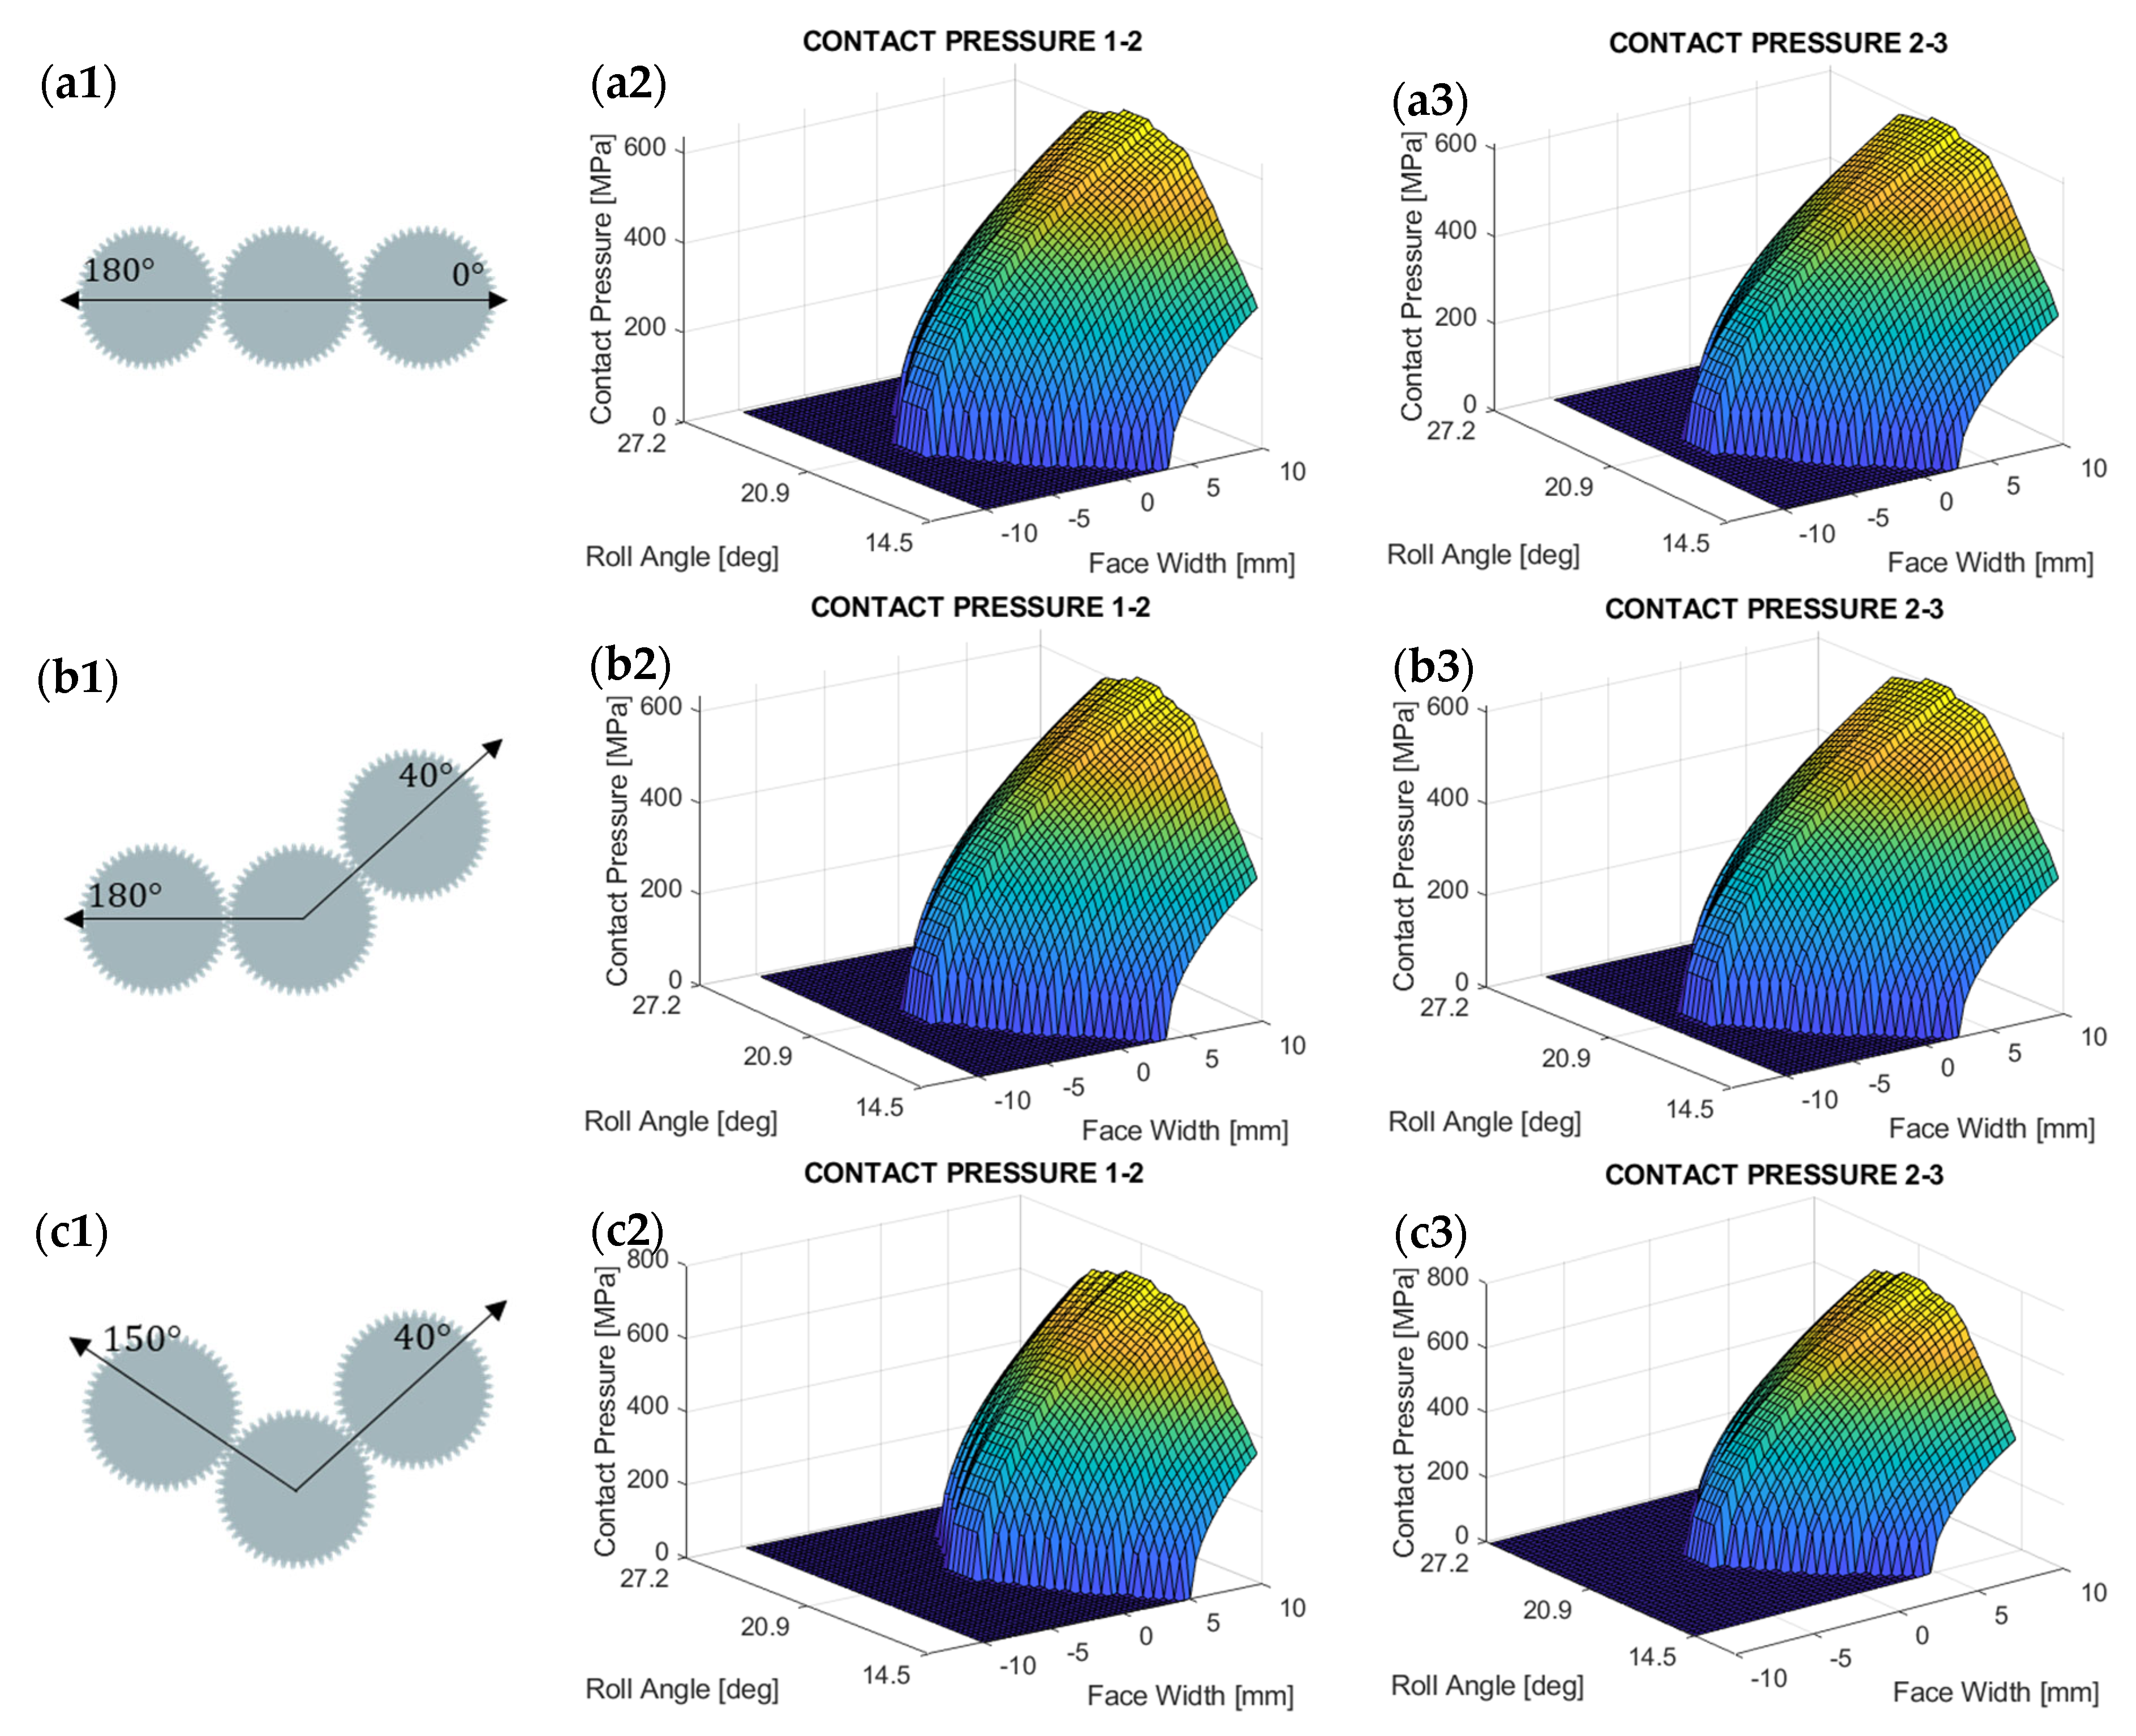
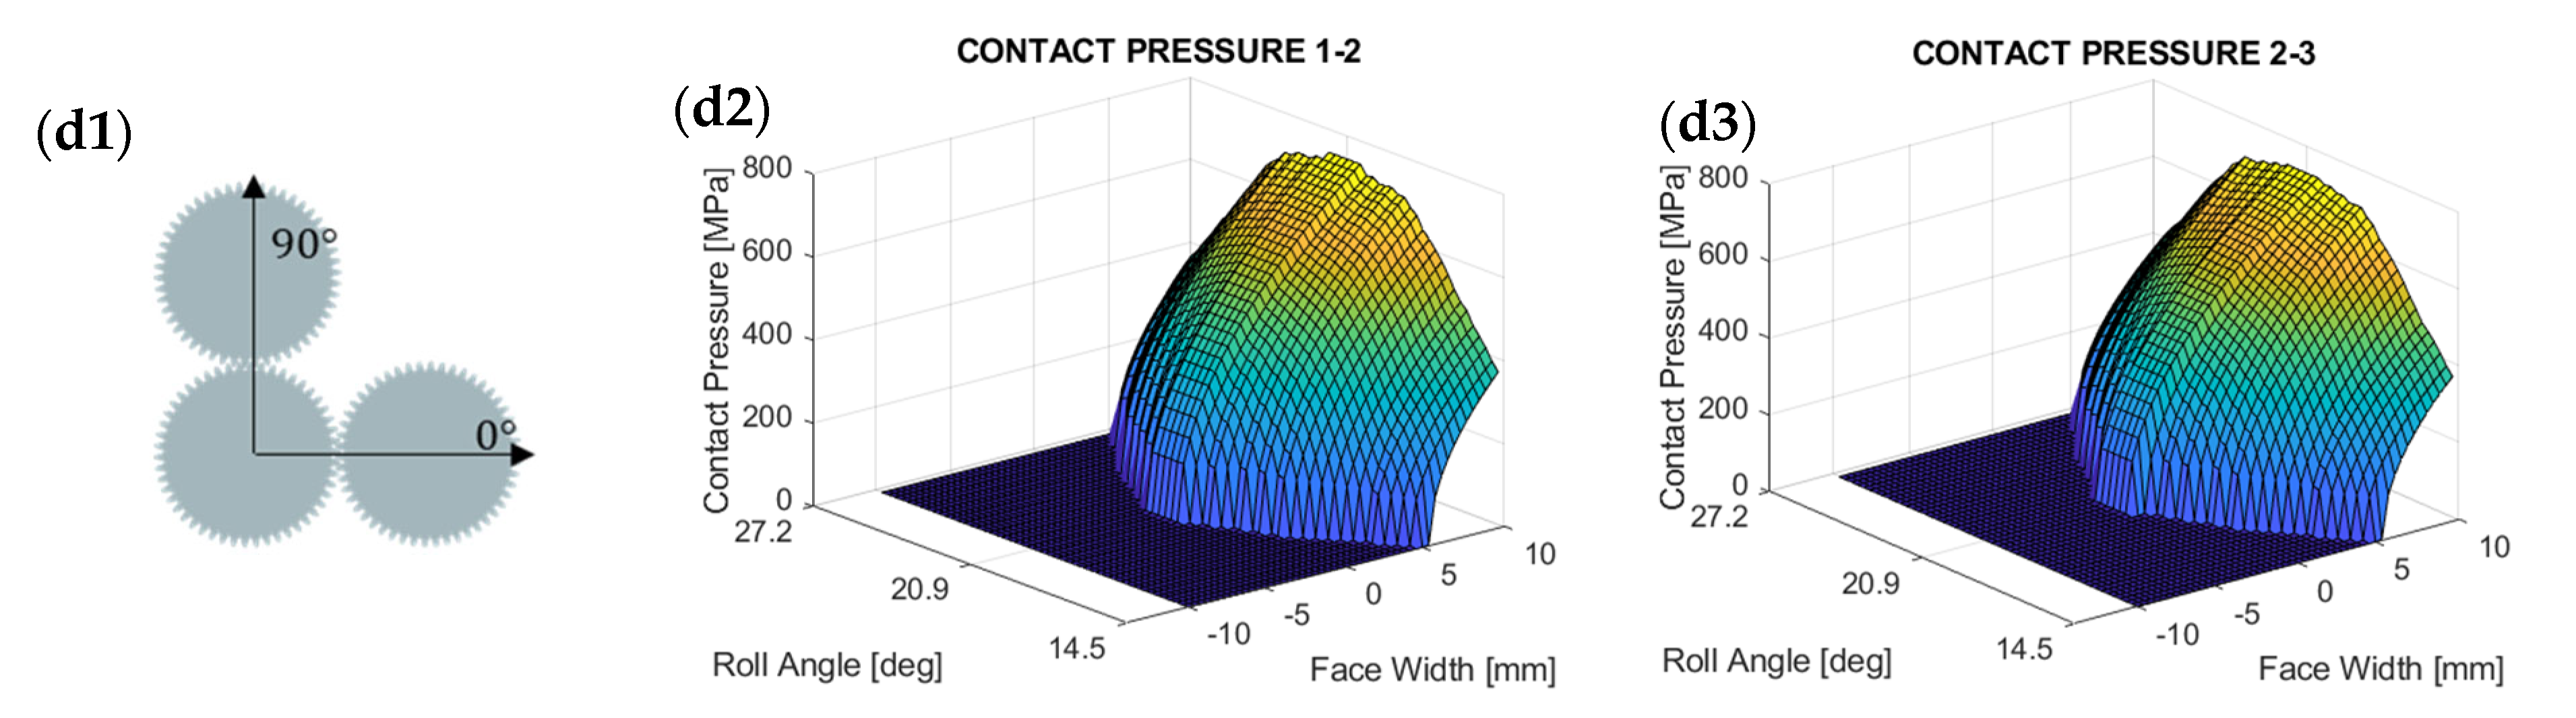
3.2. Contact Pressure Distribution in the Torque Split Model
- 1-
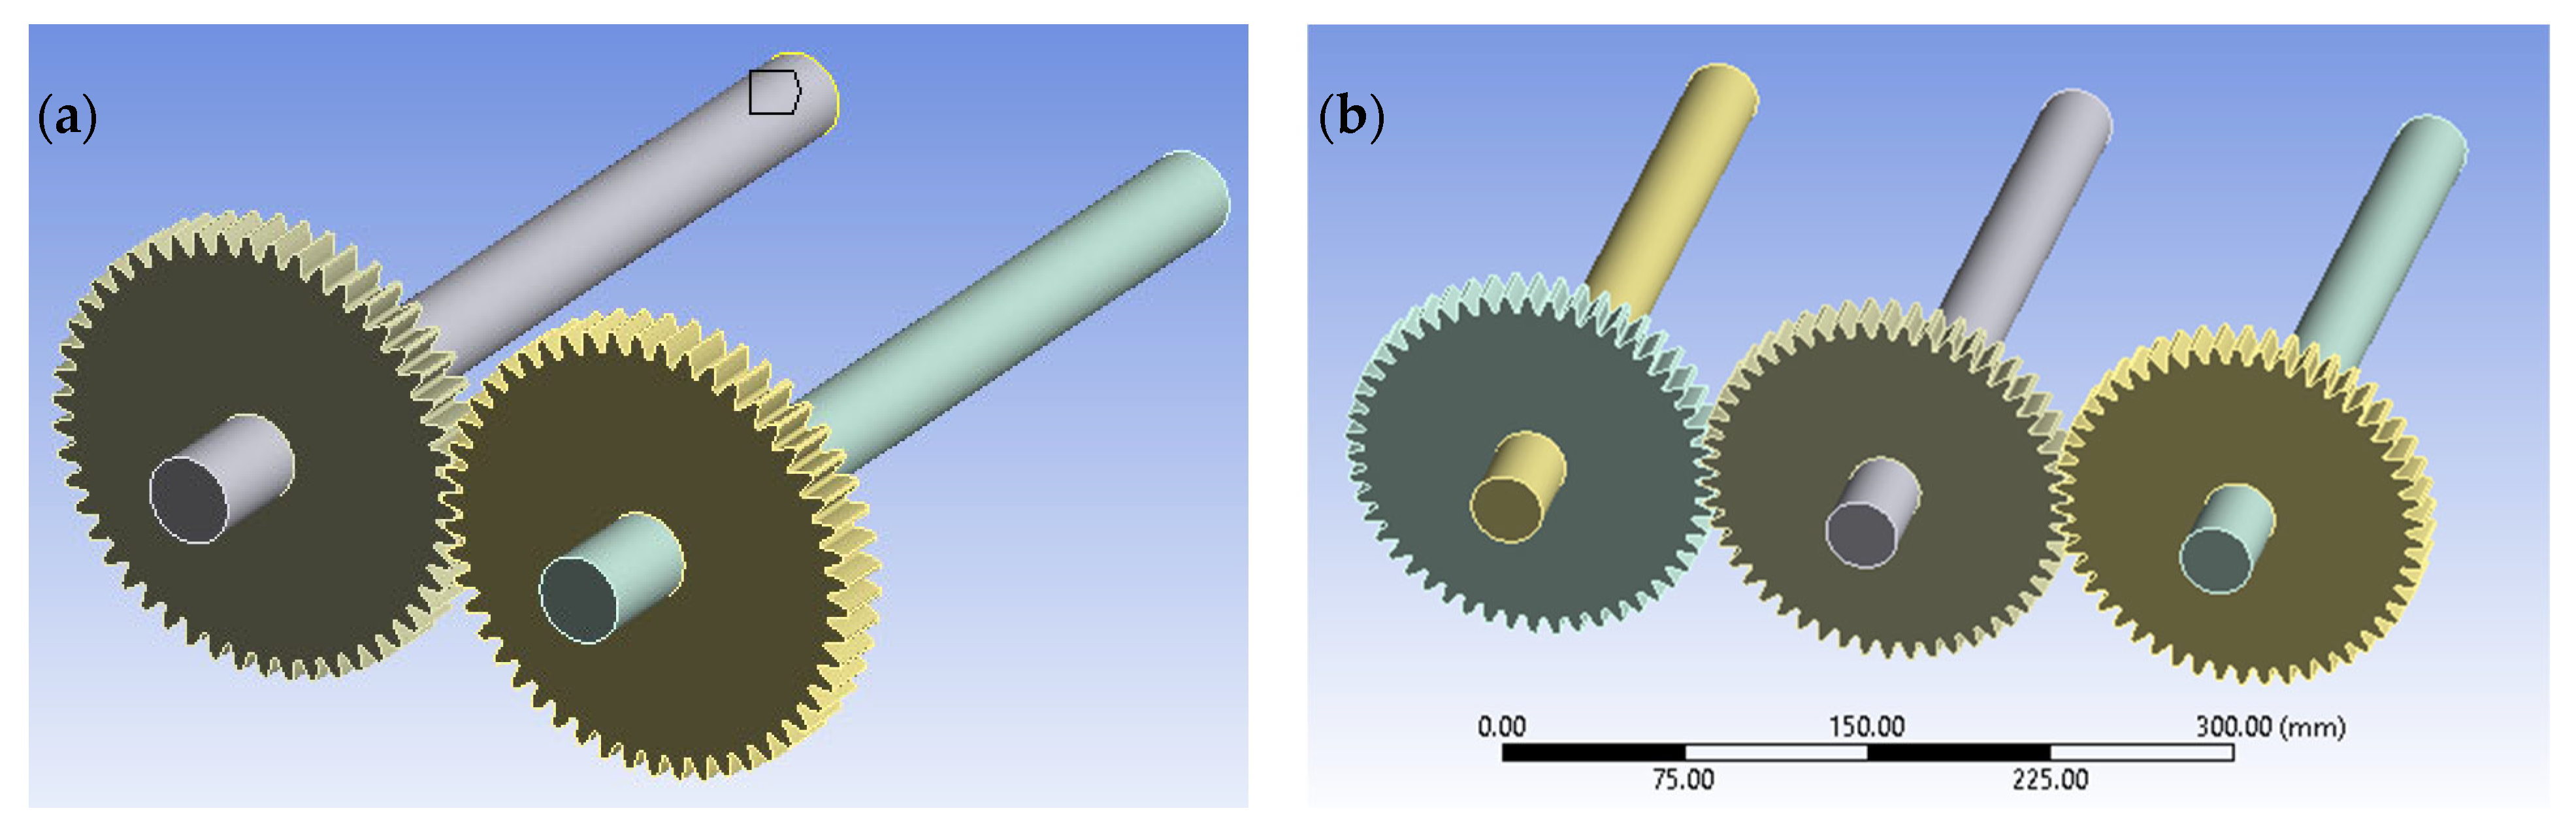
- The material assignment is performed after adding model geometry.
- 2-
- Gears are positioned in a single tooth region in Figure 11.
- 3-
- The contact areas of the pinion and the driven gear are marked.
- 4-
- The friction coefficient is defined as 0.05.
- 5-
- The ‘Augmented Lagrange’ method on contact, ‘asymmetric’ behavior, and ‘nodal-projected normal from contact’ detection method are determined.
- 6-
- Since the Hertz compliance is dependent on the force, its stiffness is updated in each iteration.
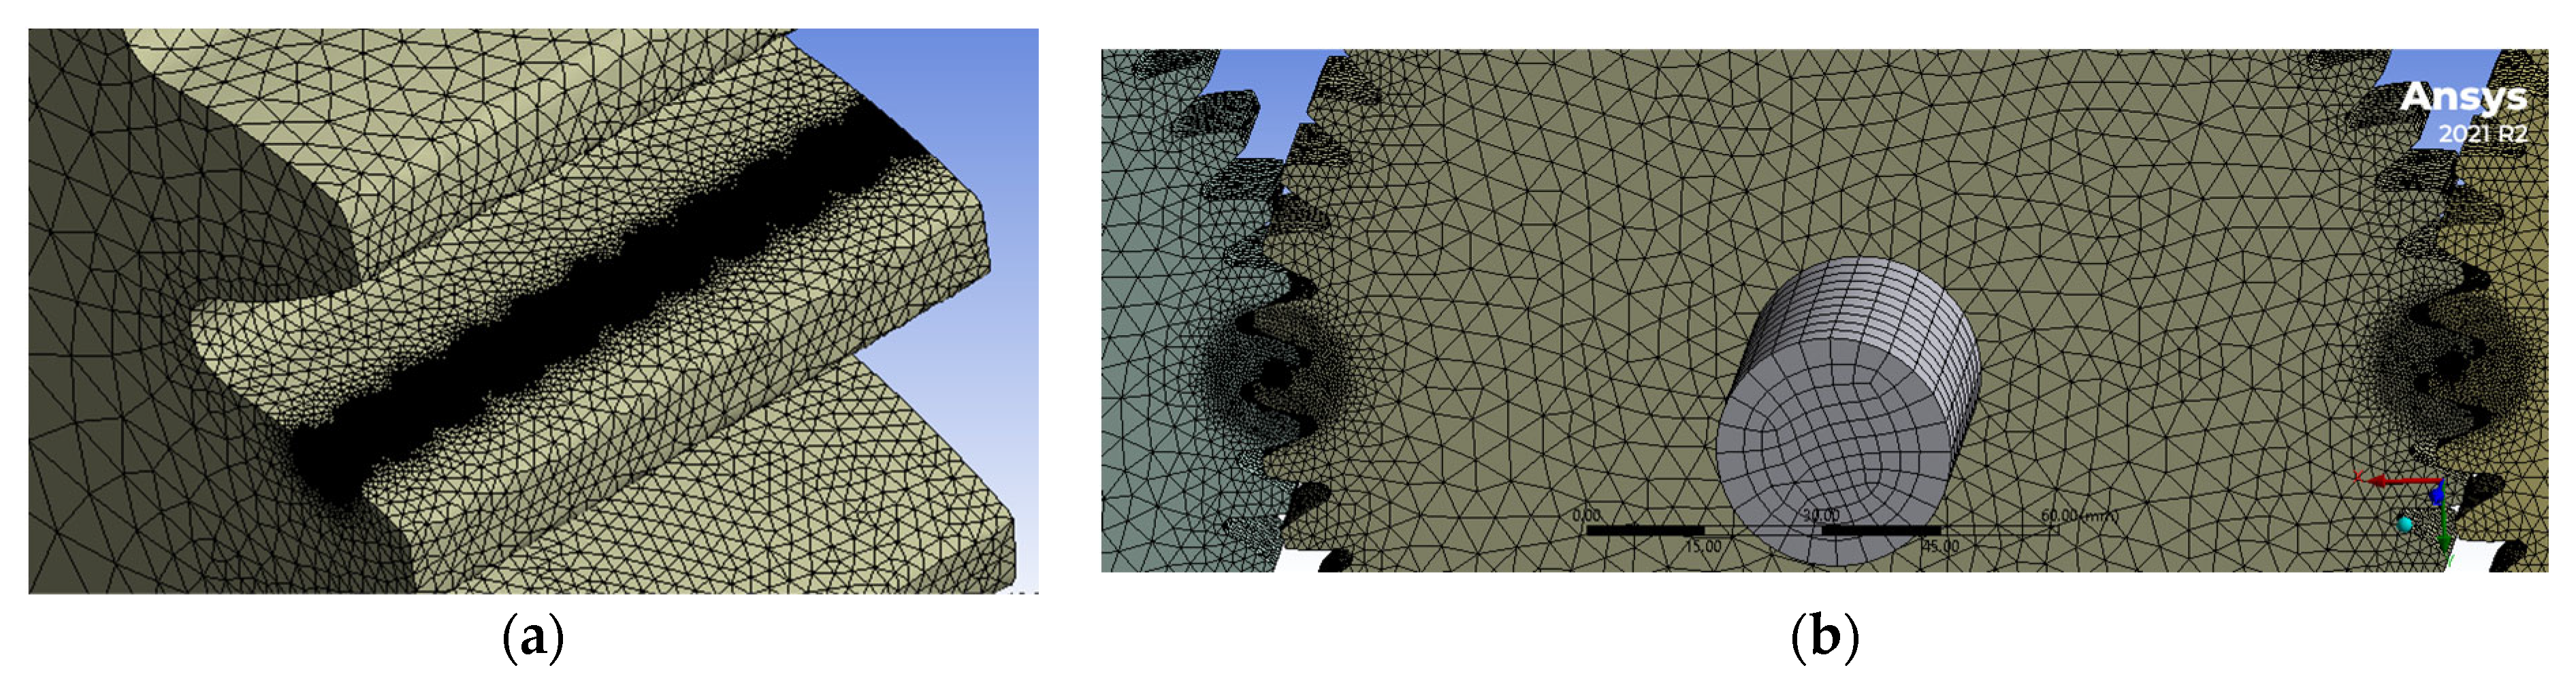
- 7-
- The mesh size of 0.06 mm in the gear contact area is used as in Figure 12. In the gear pair system, there are 4,933,469 total nodes and 3,517,393 elements. There are 10,175,252 total nodes and 7,350,662 elements in the torque split model.
- 8-
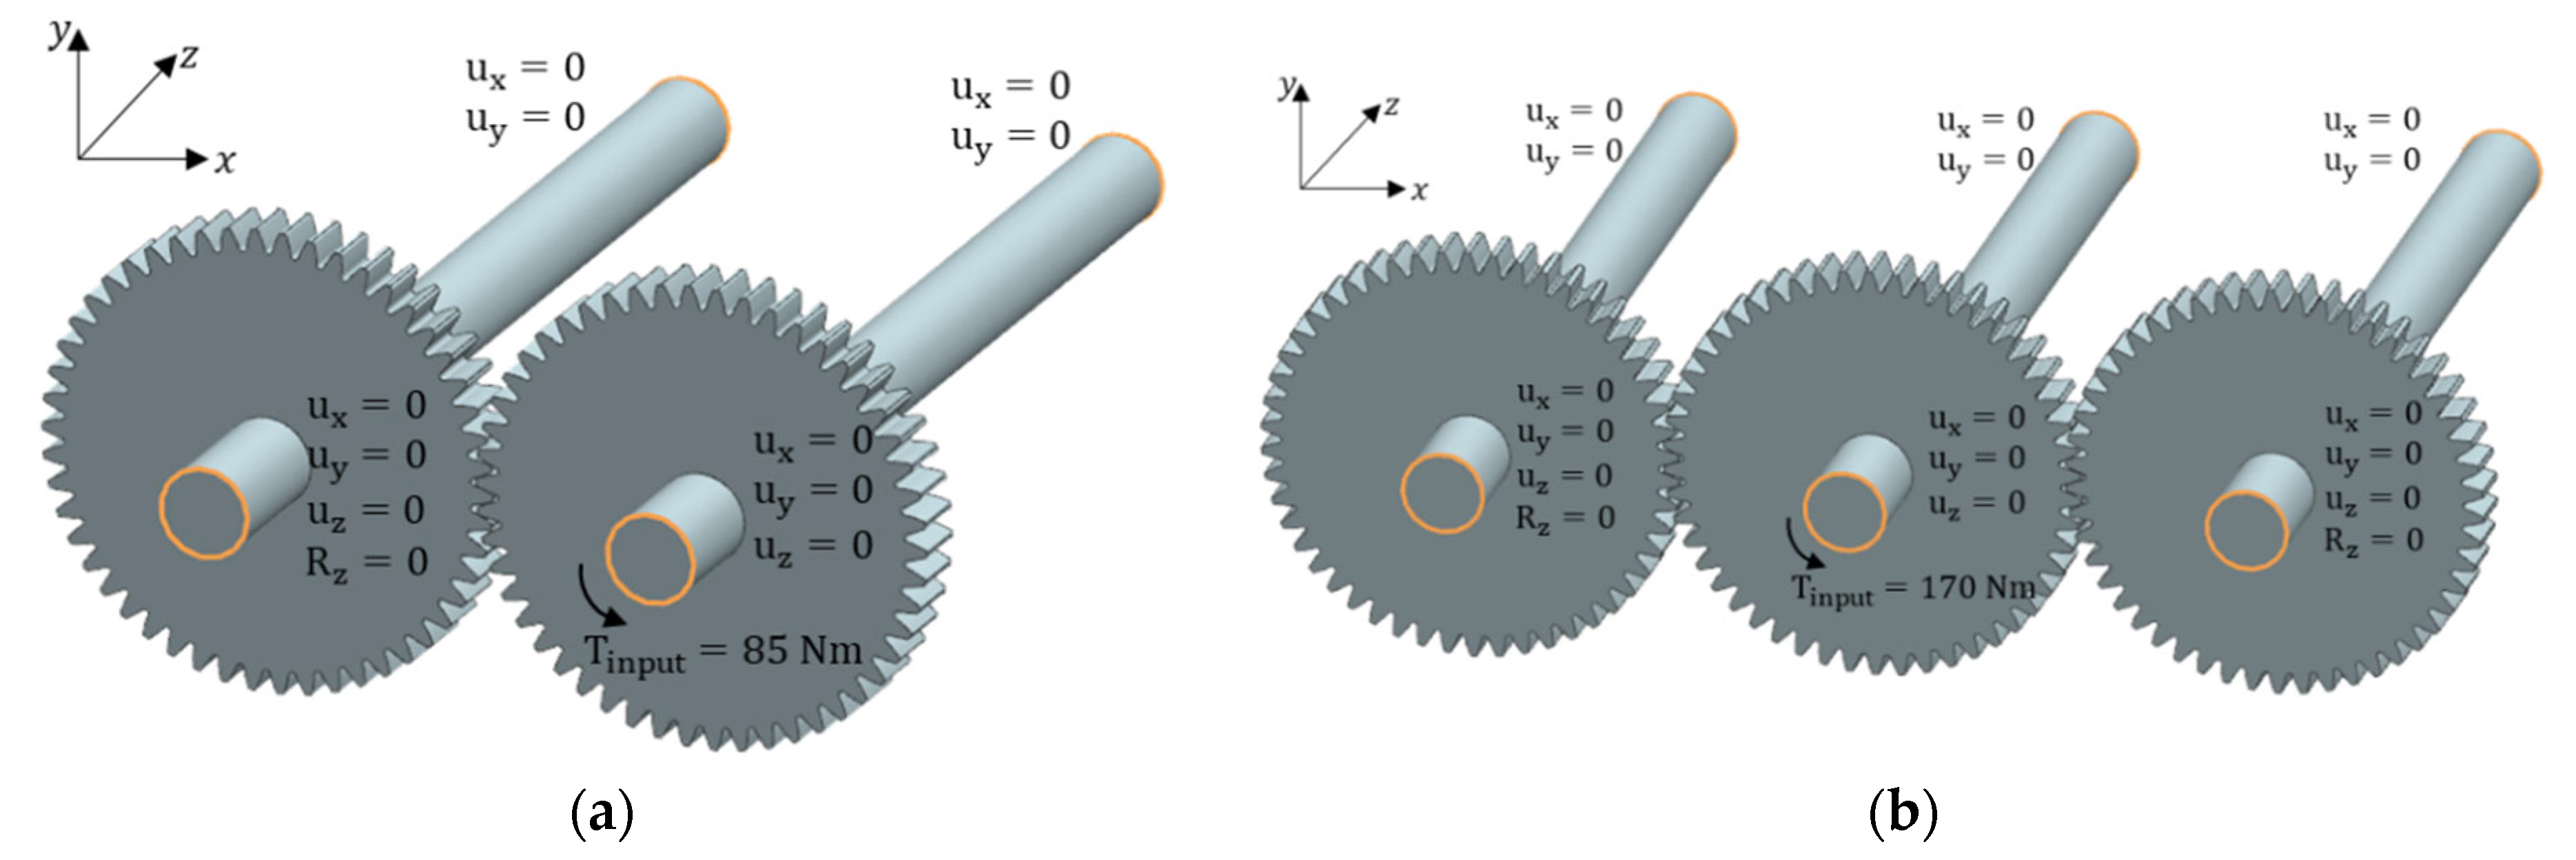
- The X and Y directions are fixed at the endpoints of the shaft to provide support on the shafts. At the end where torque is applied to the pinion, RX, RY, and RZ are released in Figure 13. One of both ends of the shaft is released in the Z direction. In the driven gears, RZ is fixed at the end in the direction of torque flow to simulate the torque of resistance. RX and RY are released. One of both ends of the shaft is released in the Z direction. X and Y coordinates represent the lateral plane and can be assumed perpendicular to the shaft axis. The shaft lays along the Z direction.
- 9-
- 85 Nm torque for the gear pair and 170 Nm for the torque split are applied to the pinion from one end in a certain period and the system is loaded.
4. Conclusions
- The direction of the shaft bending in the pinion and the load distribution algorithm are calculated for each gear pair. There is the least reaction force compared to the 0°–180° positioning in the torque split model, while as this angle decreases, the reaction force increases in the pinion, and the partial tooth contact loss increases.
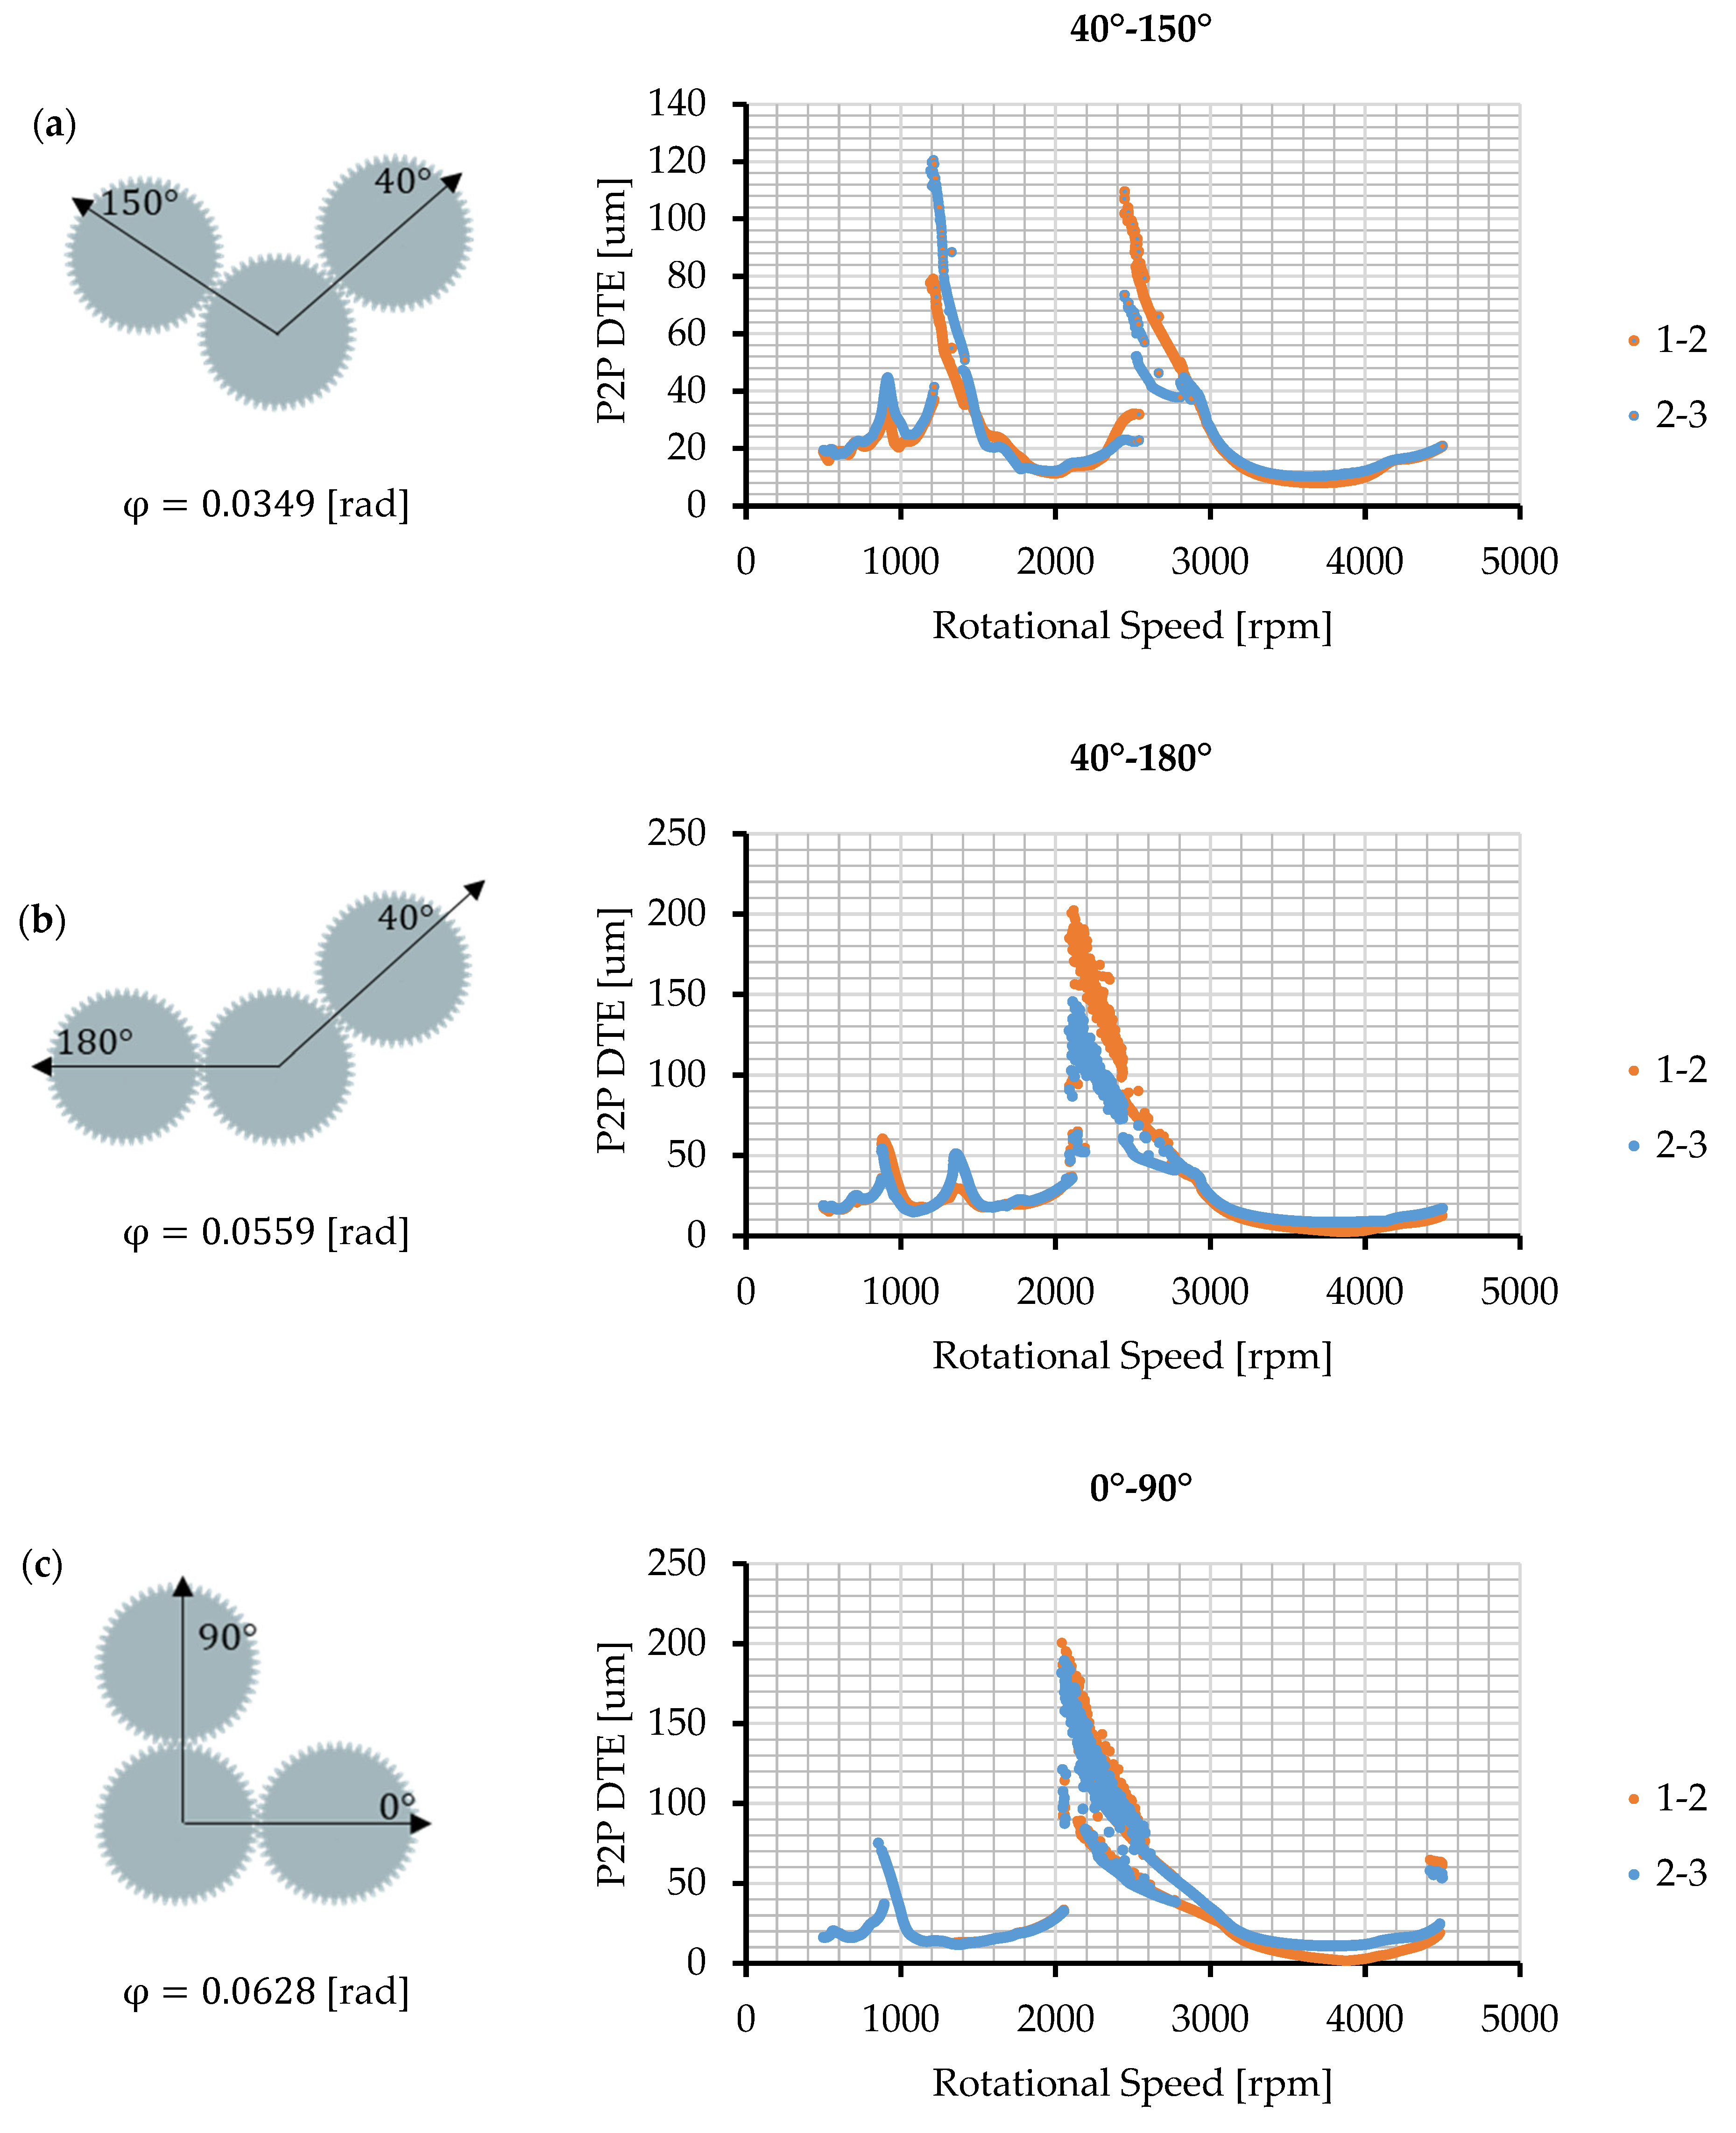
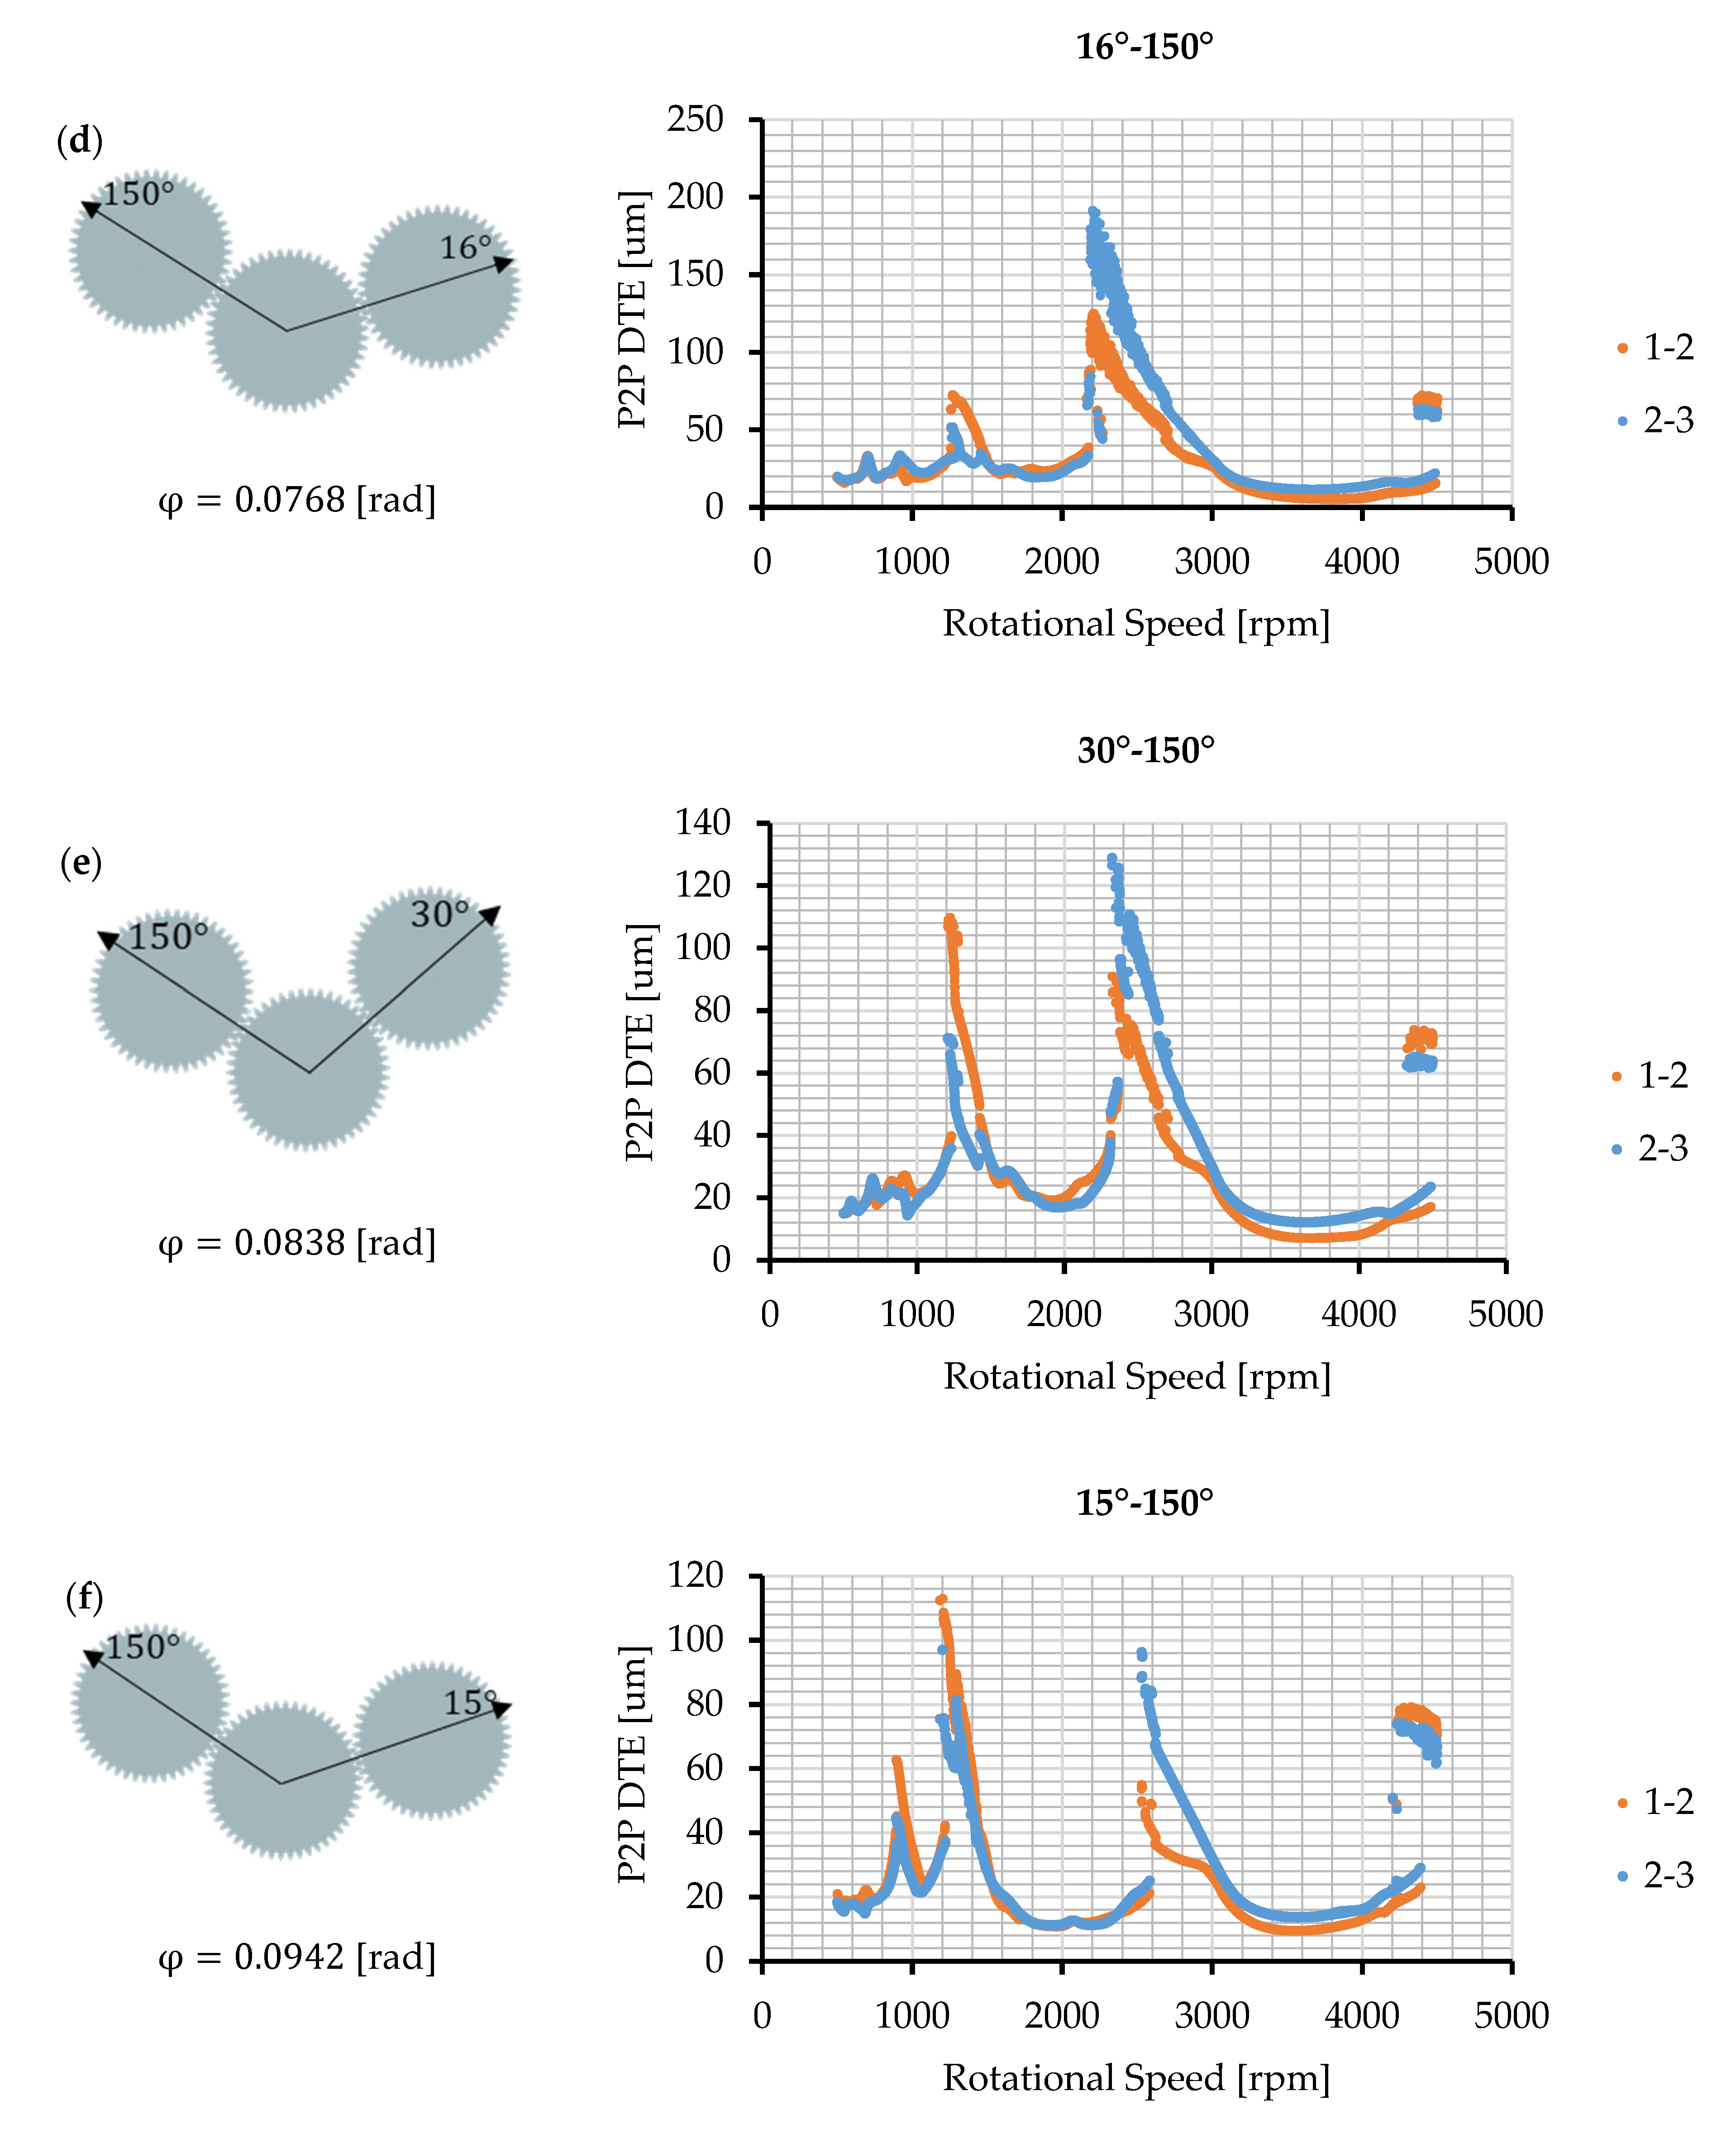
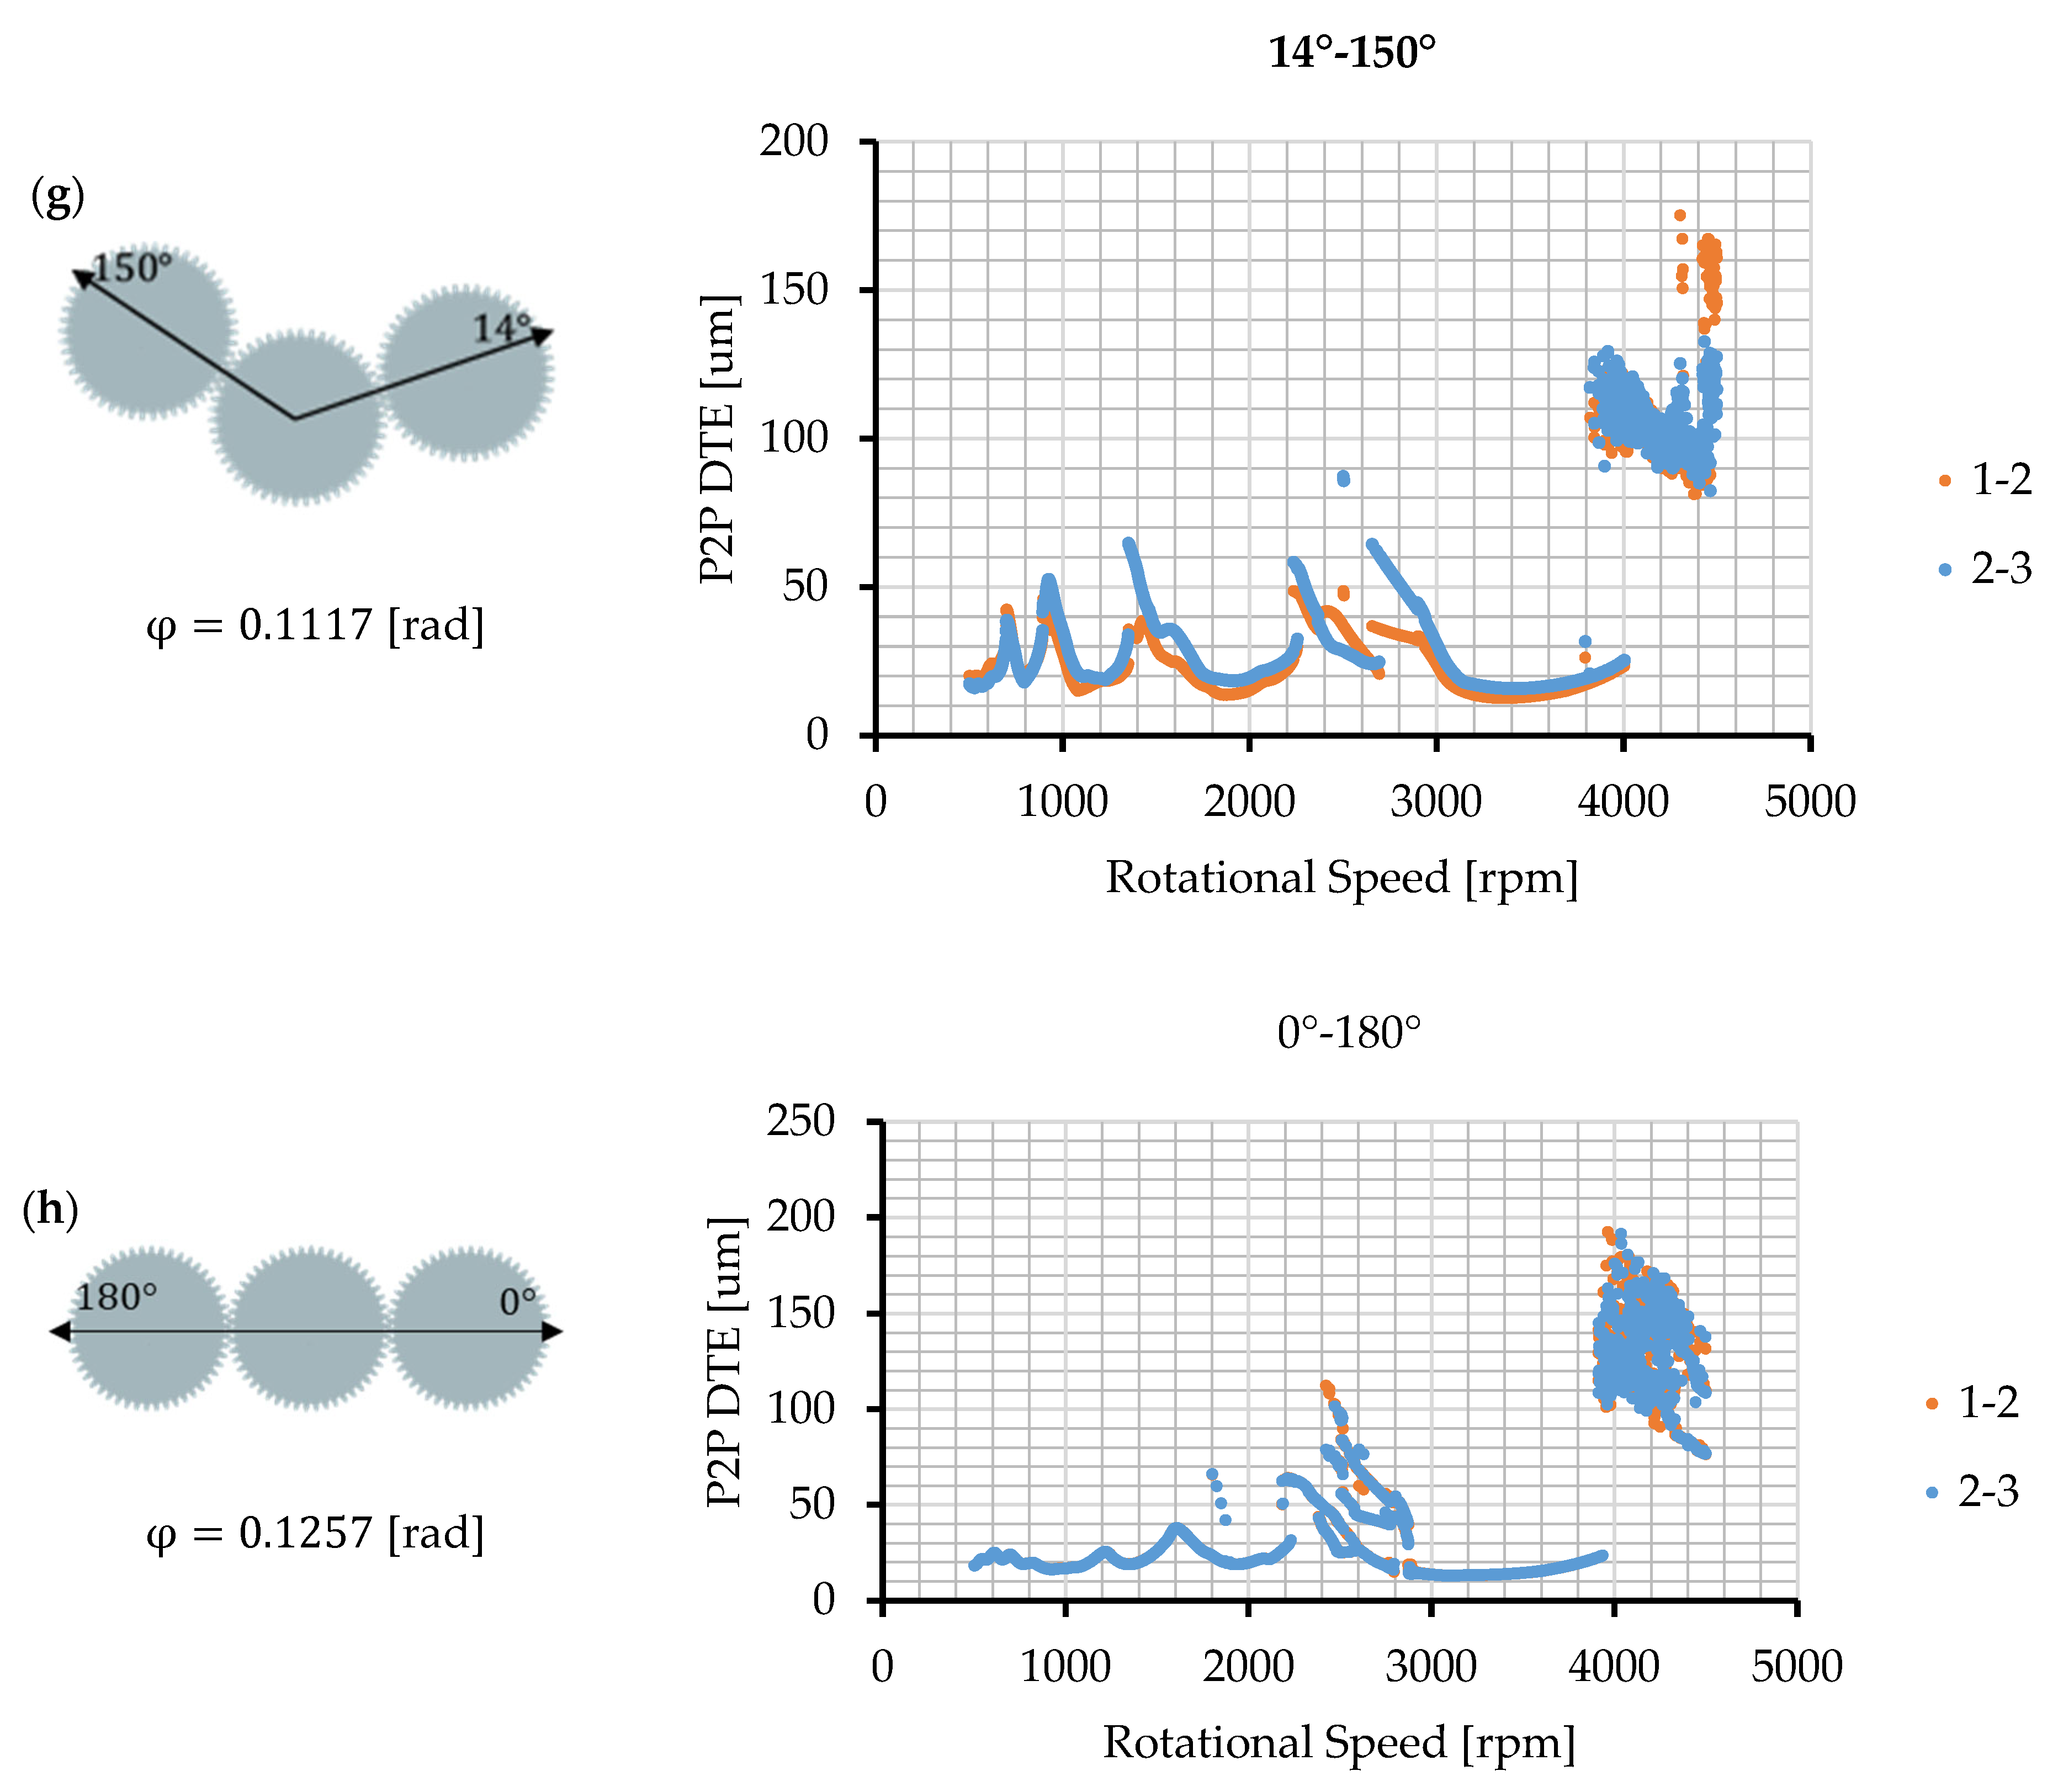
- The angle between gears directly affects the phase difference. The difference in the roll angle between gears coming into contact is reflected in the dynamic model as a phase delay. Different dynamic transmission error results occur in gear pairs even if gears with the same tooth number are used in the torque split model.
- Since the phase difference changes according to parameters such as the number of teeth and the gear position angle, the effect on the dynamic transmission error in the gears is obtained by modeling each of them. The positioning of gears can cause instability in the harmonics of the torque split model. It is possible to obtain a lower DTE amplitude depending on the location at various operating speed ranges.
Author Contributions
Funding
Institutional Review Board Statement
Informed Consent Statement
Data Availability Statement
Conflicts of Interest
Appendix A


References
- Eritenel, T.; Parker, R.G. An investigation of tooth mesh nonlinearity and partial contact loss in gear pairs using a lumped-parameter model. Mech. Mach. Theory 2012, 56, 28–51. [Google Scholar] [CrossRef]
- Yuan, B.; Chang, S.; Liu, G.; Chang, L.; Liu, L. Quasi-static analysis based on generalized loaded static transmission error and dynamic investigation of wide-faced cylindrical geared rotor systems. Mech. Mach. Theory 2019, 134, 74–94. [Google Scholar] [CrossRef]
- Yuan, B.; Chang, L.; Liu, G.; Chang, S.; Liu, L.; Shen, Y. An efficient three-dimensional dynamic contact model for cylindrical gear pairs with distributed tooth flank errors. Mech. Mach. Theory 2020, 152, 103930. [Google Scholar] [CrossRef]
- Wang, Q.; Xu, K.; Huai, T.; Ma, H.; Wang, K. A mesh stiffness method using slice coupling for spur gear pairs with misalignment and lead crown relief. Appl. Math. Model. 2021, 90, 845–861. [Google Scholar] [CrossRef]
- Kahraman, A.; Nevzatozguven, H.; Houser, D.R.; Zakrajsek, J.J. Dynamic analysis of geared rotors by finite elements. J. Mech. Des. Trans. ASME 1992, 114, 507–514. [Google Scholar] [CrossRef]
- Ma, H.; Pang, X.; Feng, R.; Wen, B. Evaluation of optimum profile modification curves of profile shifted spur gears based on vibration responses. Mech. Syst. Signal Process. 2016, 70–71, 1131–1149. [Google Scholar] [CrossRef]
- Dai, X.; Cooley, C.G.; Parker, R.G. An Efficient Hybrid Analytical-Computational Method for Nonlinear Vibration of Spur Gear Pairs. J. Vib. Acoust. Trans. ASME 2019, 141, 011006. [Google Scholar] [CrossRef]
- Han, G.; Yuan, B.; Qiao, G. Tooth Surface Modification for Helical Gear Pairs considering Mesh Misalignment Tolerance. Shock Vib. 2021, 2021, 5563648. [Google Scholar] [CrossRef]
- Xiang, L.; Gao, N. Coupled torsion–bending dynamic analysis of a gear-rotor-bearing system with eccentricity fluctuation. Appl. Math. Model. 2017, 50, 569–584. [Google Scholar] [CrossRef]
- Inalpolat, M.; Handschuh, M.; Kahraman, A. Influence of indexing errors on dynamic response of spur gear pairs. Mech. Syst. Signal Process. 2015, 60, 391–405. [Google Scholar] [CrossRef]
- Bonori, G.; Pellicano, F. Non-smooth dynamics of spur gears with manufacturing errors. J. Sound Vib. 2017, 306, 271–283. [Google Scholar] [CrossRef]
- Ghosh, S.S.; Chakraborty, G. On optimal tooth profile modification for reduction of vibration and noise in spur gear pairs. Mech. Mach. Theory 2016, 105, 145–163. [Google Scholar] [CrossRef]
- Kahraman, A. Dynamic analysis of a multi-mesh helical gear train. J. Mech. Des. Trans. ASME 1994, 116, 706–712. [Google Scholar] [CrossRef]
- Chen, Y.; Zhu, R.; Jin, G.; Xiong, Y.; Gao, J.; Liao, M. A new mathematical modeling method for four-stage helicopter main gearbox and dynamic response optimization. Complexity 2019, 2019, 5274712. [Google Scholar] [CrossRef] [Green Version]
- Sainte-marie, N. A Transmission-Error-Based Gear Dynamic Model: Applications to Single- and Multi-Mesh Transmissions–Applications to Single- and Multi-Mesh Transmissions. Ph.D. Thesis, Université de Lyon, Lyon, France, 2016. [Google Scholar]
- Brethee, K.F.; Zhen, D.; Gu, F.; Ball, A.D. Helical gear wear monitoring: Modelling and experimental validation. Mech. Mach. Theory 2017, 117, 210–229. [Google Scholar] [CrossRef]
- Al-Shyyab, A.; Kahraman, A. Non-linear dynamic analysis of a multi-mesh gear train using multi-term harmonic balance method: Sub-harmonic motions. J. Sound Vib. 2005, 279, 417–451. [Google Scholar] [CrossRef]
- Yavuz, S.D.; Saribay, Z.B.; Cigeroglu, E. Nonlinear time-varying dynamic analysis of a multi-mesh spur gear train. Conf. Proc. Soc. Exp. Mech. Ser. 2016, 4, 309–321. [Google Scholar]
- Walha, L.; Fakhfakh, T.; Haddar, M. Nonlinear dynamics of a two-stage gear system with mesh stiffness fluctuation, bearing flexibility and backlash. Mech. Mach. Theory 2019, 44, 1058–1069. [Google Scholar] [CrossRef]
- Shi, J.; Gou, X.; Zhu, L. Modeling and analysis of a spur gear pair considering multi-state mesh with time-varying parameters and backlash. Mech. Mach. Theory 2019, 134, 582–603. [Google Scholar] [CrossRef]
- Kim, W.; Yoo, H.H.; Chung, J. Dynamic analysis for a pair of spur gears with translational motion due to bearing deformation. J. Sound Vib. 2010, 329, 4409–4421. [Google Scholar] [CrossRef]
- Gonzalez-Perez, I.; Roda-Casanova, V.; Fuentes, A. Modified geometry of spur gear drive for compensation of shaft deflections. Meccanica 2015, 50, 1855–1867. [Google Scholar] [CrossRef]
- Blankenship, G.W.; Kahraman, A. Steady state forced response of a mechanical oscillator with combined parametric excitation and clearance type non-linearity. J. Sound Vib. 1995, 185, 743–765. [Google Scholar] [CrossRef] [Green Version]
- Standard AGMA 927-A01; Load Distribution Factors—Analytical Methods for Cylindrical Gears. American Gear Manufacturer Association: Alexandria, VA, USA, 2018.
- Standard AGMA 908-B89; Geometry Factors for Determining the Pitting Resistance and Bending Strength of Spur, Helical and Herringbone Gear Teeth. American Gear Manufacturers Association: Alexandria, VA, USA, 2020.
- Kang, M.R.; Kahraman, A. Measurement of vibratory motions of gears supported by compliant shafts. Mech. Syst. Signal Process. 1999, 29, 391–403. [Google Scholar] [CrossRef]
- Tatar, A. Effect of Planetary Gearboxes on the Dynamics of Rotating Systems. Ph.D. Thesis, Imperial College, London, UK, 2019. [Google Scholar]
- Hua, X.; Lim, T.; Peng, T.; Wali, W. Dynamic analysis of spiral bevel geared rotor systems applying finite elements and enhanced lumped parameters. Int. J. Automot. Technol. 2012, 13, 97–107. [Google Scholar] [CrossRef]


| Pinion/Gear | |
|---|---|
| Number of teeth | 50 |
| Module | 3 |
| Pressure angle [°] | 20 |
| Base circle [mm] | 140.95 |
| Tip diameter [mm] | 156 |
| Root diameter [mm] | 140.68 |
| Gear width [mm] | 20 |
| Young’s modulus [MPa] | 206,000 |
| Poisson coefficient | 0.3 |
| Center distance [mm] | 150 |
| Backlash at the line of action [mm] | 0.136 |
| Contact ratio | 1.75 |
Publisher’s Note: MDPI stays neutral with regard to jurisdictional claims in published maps and institutional affiliations. |
© 2022 by the authors. Licensee MDPI, Basel, Switzerland. This article is an open access article distributed under the terms and conditions of the Creative Commons Attribution (CC BY) license (https://creativecommons.org/licenses/by/4.0/).
Share and Cite
Civan, S.E.; Demir, C. Load Distribution and Dynamic Response in Torque Split Applications. Machines 2022, 10, 1218. https://doi.org/10.3390/machines10121218
Civan SE, Demir C. Load Distribution and Dynamic Response in Torque Split Applications. Machines. 2022; 10(12):1218. https://doi.org/10.3390/machines10121218
Chicago/Turabian StyleCivan, Süleyman Emre, and Cihan Demir. 2022. "Load Distribution and Dynamic Response in Torque Split Applications" Machines 10, no. 12: 1218. https://doi.org/10.3390/machines10121218