Article

Digital Twin-Based Analysis and Optimization for Design and Planning of Production Lines

1
Department of Industrial Engineering, Sungkyunkwan University, Suwon-si 16419, Republic of Korea
2
Global Technology Research, Samsung Electronics, Suwon-si 16677, Republic of Korea
*
Author to whom correspondence should be addressed.
Machines 2022, 10(12), 1147; https://doi.org/10.3390/machines10121147
Submission received: 25 October 2022 / Revised: 21 November 2022 / Accepted: 28 November 2022 / Published: 1 December 2022
(This article belongs to the Special Issue Digital Twin Applications in Smart Manufacturing)

Abstract

:
With the increasing dynamic nature of customer demand, production, product, and manufacturing design changes have become more frequent. Moreover, inadequate validation during the manufacturing design phase may result in additional issues, such as process redesign and layout reallocation, during the operation phase. Therefore, systems that can pre-validate and allow accurate and reliable analysis in the manufacturing design phase, as well as apply and optimize variations in production lines in real time, are required. Previously, digital twin (DT) has been studied a lot in product design and facility prognostics and management fields. Research on the system framework leading to DT utilization and optimization and analysis through DT in complex manufacturing systems with continuous processes such as production lines is insufficient. In this study, a system based on a DT and simulation results is developed; this system can reflect, analyze, and optimize dynamic changes in the design of processes and production lines in real time. First, the framework and application of the proposed system are designed. Subsequently, optimization methodologies based on heuristics and reinforcement learning (RL) are developed. Finally, the effectiveness and applicability of the proposed system are verified by implementing an actual DT application at a real manufacturing site.

1. Introduction

The most used keywords in the approaching “Industry 4.0” and the upcoming manufacturing paradigm are “real time” and “variability” [1,2,3,4]. The manufacturing industry is now facing dynamic market changes, including unpredictable product demands, shorter product lifecycles, and increased demands for customized products, and is committed to the introduction of smart manufacturing systems and factories to respond flexibly and intelligently [5,6,7]. As a smart factory is defined as “a fully integrated, collaborative manufacturing system that can respond in real time to satisfy the dynamic needs and conditions of factories, supply chains, and customers,” significant effort is being dedicated to planning and research and development for advanced manufacturing operations and service improvements [8,9,10].
In previous studies, manufacturing simulations have been used as tools to analyze and monitor complex processes and product life cycles in manufacturing systems [11,12,13]. These simulations focus on representing the configuration of a manufacturing system, various manufacturing activities, processes, and logistics as models in a virtual environment that can be used to allocate manufacturing resources, evaluate scheduling alternatives, predict performance, and benchmark from the shop floor level to the supply chain level [14,15]. For complex manufacturing systems, simulation models, including models that consider details down to the component level, can be integrated with various engineering fields to analyze, optimize, and verify manufacturing systems [13]. However, smart manufacturing systems and factories developed to respond flexibly to customer needs and market fluctuations can be difficult to analyze and monitor based on simple simulations. With the rapid development in technology and variation in customer needs, products have become diversified, and product and design changes have become frequent; owing to this, the frequency of production line relocation and reconfiguration has increased [16,17]. In order to analyze those fluctuating manufacturing systems accurately and reliably, simulation models need to be modified according to changes in manufacturing system design and production lines. However, after configuring the simulation model, it is difficult to change and reconstruct the model. Data obtained at a manufacturing site is often lost in the process of being refined and transferred, and it is difficult to immediately reflect and express the data in a virtual environment for a simulation model [11], so it is difficult to solve the problem by reflecting various abnormal situations or changes at a manufacturing site in real time.
Notably, digital twins (DT) are attracting considerable attention for addressing these problems in simulations. A DT can completely utilize the data collected from manufacturing sites through communication networks, such as the industrial Internet of Things (IIoT) and various sensors, and synchronize the data in real time [5,18]. This can minimize the bullwhip effect caused by changes in plans or in the design of production lines [19]. Thus, the need to introduce the DT technology is increasing [19,20,21,22]; this technology can anticipate problems in advance by reflecting the design changes in manufacturing systems and configuration changes in production lines in real time, thereby solving problems occurring during operation, reviewing and verifying the designs and plans, and monitoring and analyzing operating situations [5,11,17,18]. In addition, optimization systems that can analyze and evaluate the design of a manufacturing system more quantitatively and realistically based on various simulation results through a DT, rather than through the existing theory and engineer experience-based design, are also of particular interest [21,22]. Although many studies about DT have been conducted on a single object, such as product design and facility management, studies on the application or utilization of DT at a more complex system level such as production lines and manufacturing systems are insufficient [5,11,13,17,20]. Moreover, there is a lack of research on the system framework that expands to optimization and analysis systems of production lines through such DT [18,20].
In this study, a DT-based analysis system that enabled the evaluation of the design, variation, and planning of processes and work configurations in real time are suggested. A system framework for the DT-based analysis and optimization system are developed. In addition, optimization methodologies that derived the optimal production line design and layout composition through heuristics or reinforcement learning (RL) algorithms were combined with the proposed DT system. The operational procedures and logic for operating the DT-based system combined with those optimization methodologies are described in detail, and finally, a DT application that can be applied to manufacturing sites is developed and verified.

2. Literature Review of Digital Twin

A DT is a virtual object or system created in a virtual environment, and it imitates and demonstrates the same technological and functional properties as its actual twin. A DT can also be defined as an advanced virtual model that represents and reflects the heterogeneous elements, functional units, and information objects of a physical asset [23,24,25,26]. In the manufacturing field, a DT can be defined as an advanced virtual factory that represents the heterogeneous configuration and functional units of a physical manufacturing asset and synchronizes the information object [8].
The concept of a DT was first mentioned by Michael Grieves in 2003 and was first proposed in 2011 in his book Virtually Perfect: Driving Innovative and Lean Products through Product Lifecycle Management [23,27]. According to Grieves, a DT allows the creation of digital replicas that can imitate physical assets, processes, and systems to monitor or predict the entire lifecycle of an actual object [27,28]. A DT enables interactions by continuously updating the status, performance, and maintenance of a physical system throughout its life cycle through connections with dynamic real-world environments [29]. Moreover, deriving new analysis results based on these interactions and accumulating historical and real-time data are also possible. Thus, a DT plays an important role in “Industry 4.0” because it enables the combination of information technology and operation technology to create new value by linking the preparatory production stage with the actual production [24].
A simulation, or the simulation technology, is the most fundamental and important DT technology that allows virtual objects to interact bidirectionally with physical objects in real time [30,31]. Unlike conventional simulations, DT simulations enable rapid decision making and interoperation by utilizing data collected and recorded from physical objects through IoT sensors and communication networks in real time [31,32]; moreover, such simulations demonstrate the following characteristics [11,19,33,34,35,36,37]:
  • Automatic model creation with predefined configurational and functional units.
  • Reflection of production site information on the model via convergence with the information and communication technologies (ICT) and information synchronization.
  • Advanced processing using an optimization algorithm or plan generation based on horizontal coordination with engineering applications.
  • Repeated derivation of indicators for dynamic prediction and diagnosis, reflecting various situations.
In the manufacturing field, for manufacturing system design, simulation technology is restricted to a standard tool for supporting designers to solve specific engineering problems [20]. Although simulation models are useful for supporting the designing manufacturing system, building a unified model that can respond in real time to immediate changes in manufacturing systems is challenging. DT is highlighted as a practical enabling technology in the manufacturing system design and control, and DT can be modified and validated in a timely manner to avoid abnormal situations that happen in the manufacturing system operating and development processes [20,21]. While traditional simulations focus on identifying and verifying requirements and eliminating problems, simulations with DTs can further identify and eliminate unforeseen events [38]. DT makes synchronization between physical objects and virtual objects and promotes faster action and response to reduced lead time [39]. With the dynamic and comprehensive data synchronization, DT significantly improves the accuracy of a forecast and can be utilized for monitoring, production planning, and process control [40].

Technological Evolution Level of A Digital Twin

Traditionally, a DT has been defined as having the following three functions [24,41,42]: (1) developing a simulation model and visualizing virtual objects based on predefined data collected from physical objects; (2) monitoring a system in real time by synchronizing, collecting, and processing data; and (3) analyzing, predicting, and optimizing in real time based on the collected data and simulation results. However, this traditional DT definition cannot provide an overall optimal solution because it focuses only on a single system, whereas every system in the real world is organic and complex [41,42]. The Institute for Information and Communication Technology Planning and Evaluation in Korea focuses on multiple systems and their interactions, which cannot be considered in the traditional DT definition, and defines its level of technological evolution according to five stages. Here, each level of the DT is defined and has characteristics as described in Table 1 [42].
In the first three levels, for instance, a single physical system is imitated, configured as a virtual system, synchronized, and optimized based on the simulation results. However, at the fourth level, that is, the federation level, each single DT interconnects and interworks with other DTs such that more complex decision making can be performed, and more precise results can be derived. A DT at the autonomous level can autonomously configure, analyze, make decisions, and exercise control up to level 4.

3. Digital Twin-Based Analysis and Optimization System for Design and Planning

The DT-based analysis and optimization system proposed in this paper aims to support decision making when designing manufacturing systems or production lines or when improving existing ones. In the manufacturing operation phase, problems such as layout changes and process reallocations occur frequently when the preliminary verification of production lines in the manufacturing design phase is inadequate. In addition, the distribution of resources, such as facility availability, worker placement, and logistics capacity, required to prepare for abnormal situations that may occur during operations is often decided arbitrarily based on non-quantitative factors such as the designer’s personal judgment and propensity. Therefore, a methodology using the proposed DT-based analysis and optimization system that can reflect the dynamic changes in the design of processes and lines in real time and is more realistic, predictable, and quantitative rather than being theoretical or experimental is needed. Furthermore, this system may derive optimal alternatives, allowing engineers to design or select optimal line constructions through comparative analysis from various perspectives.

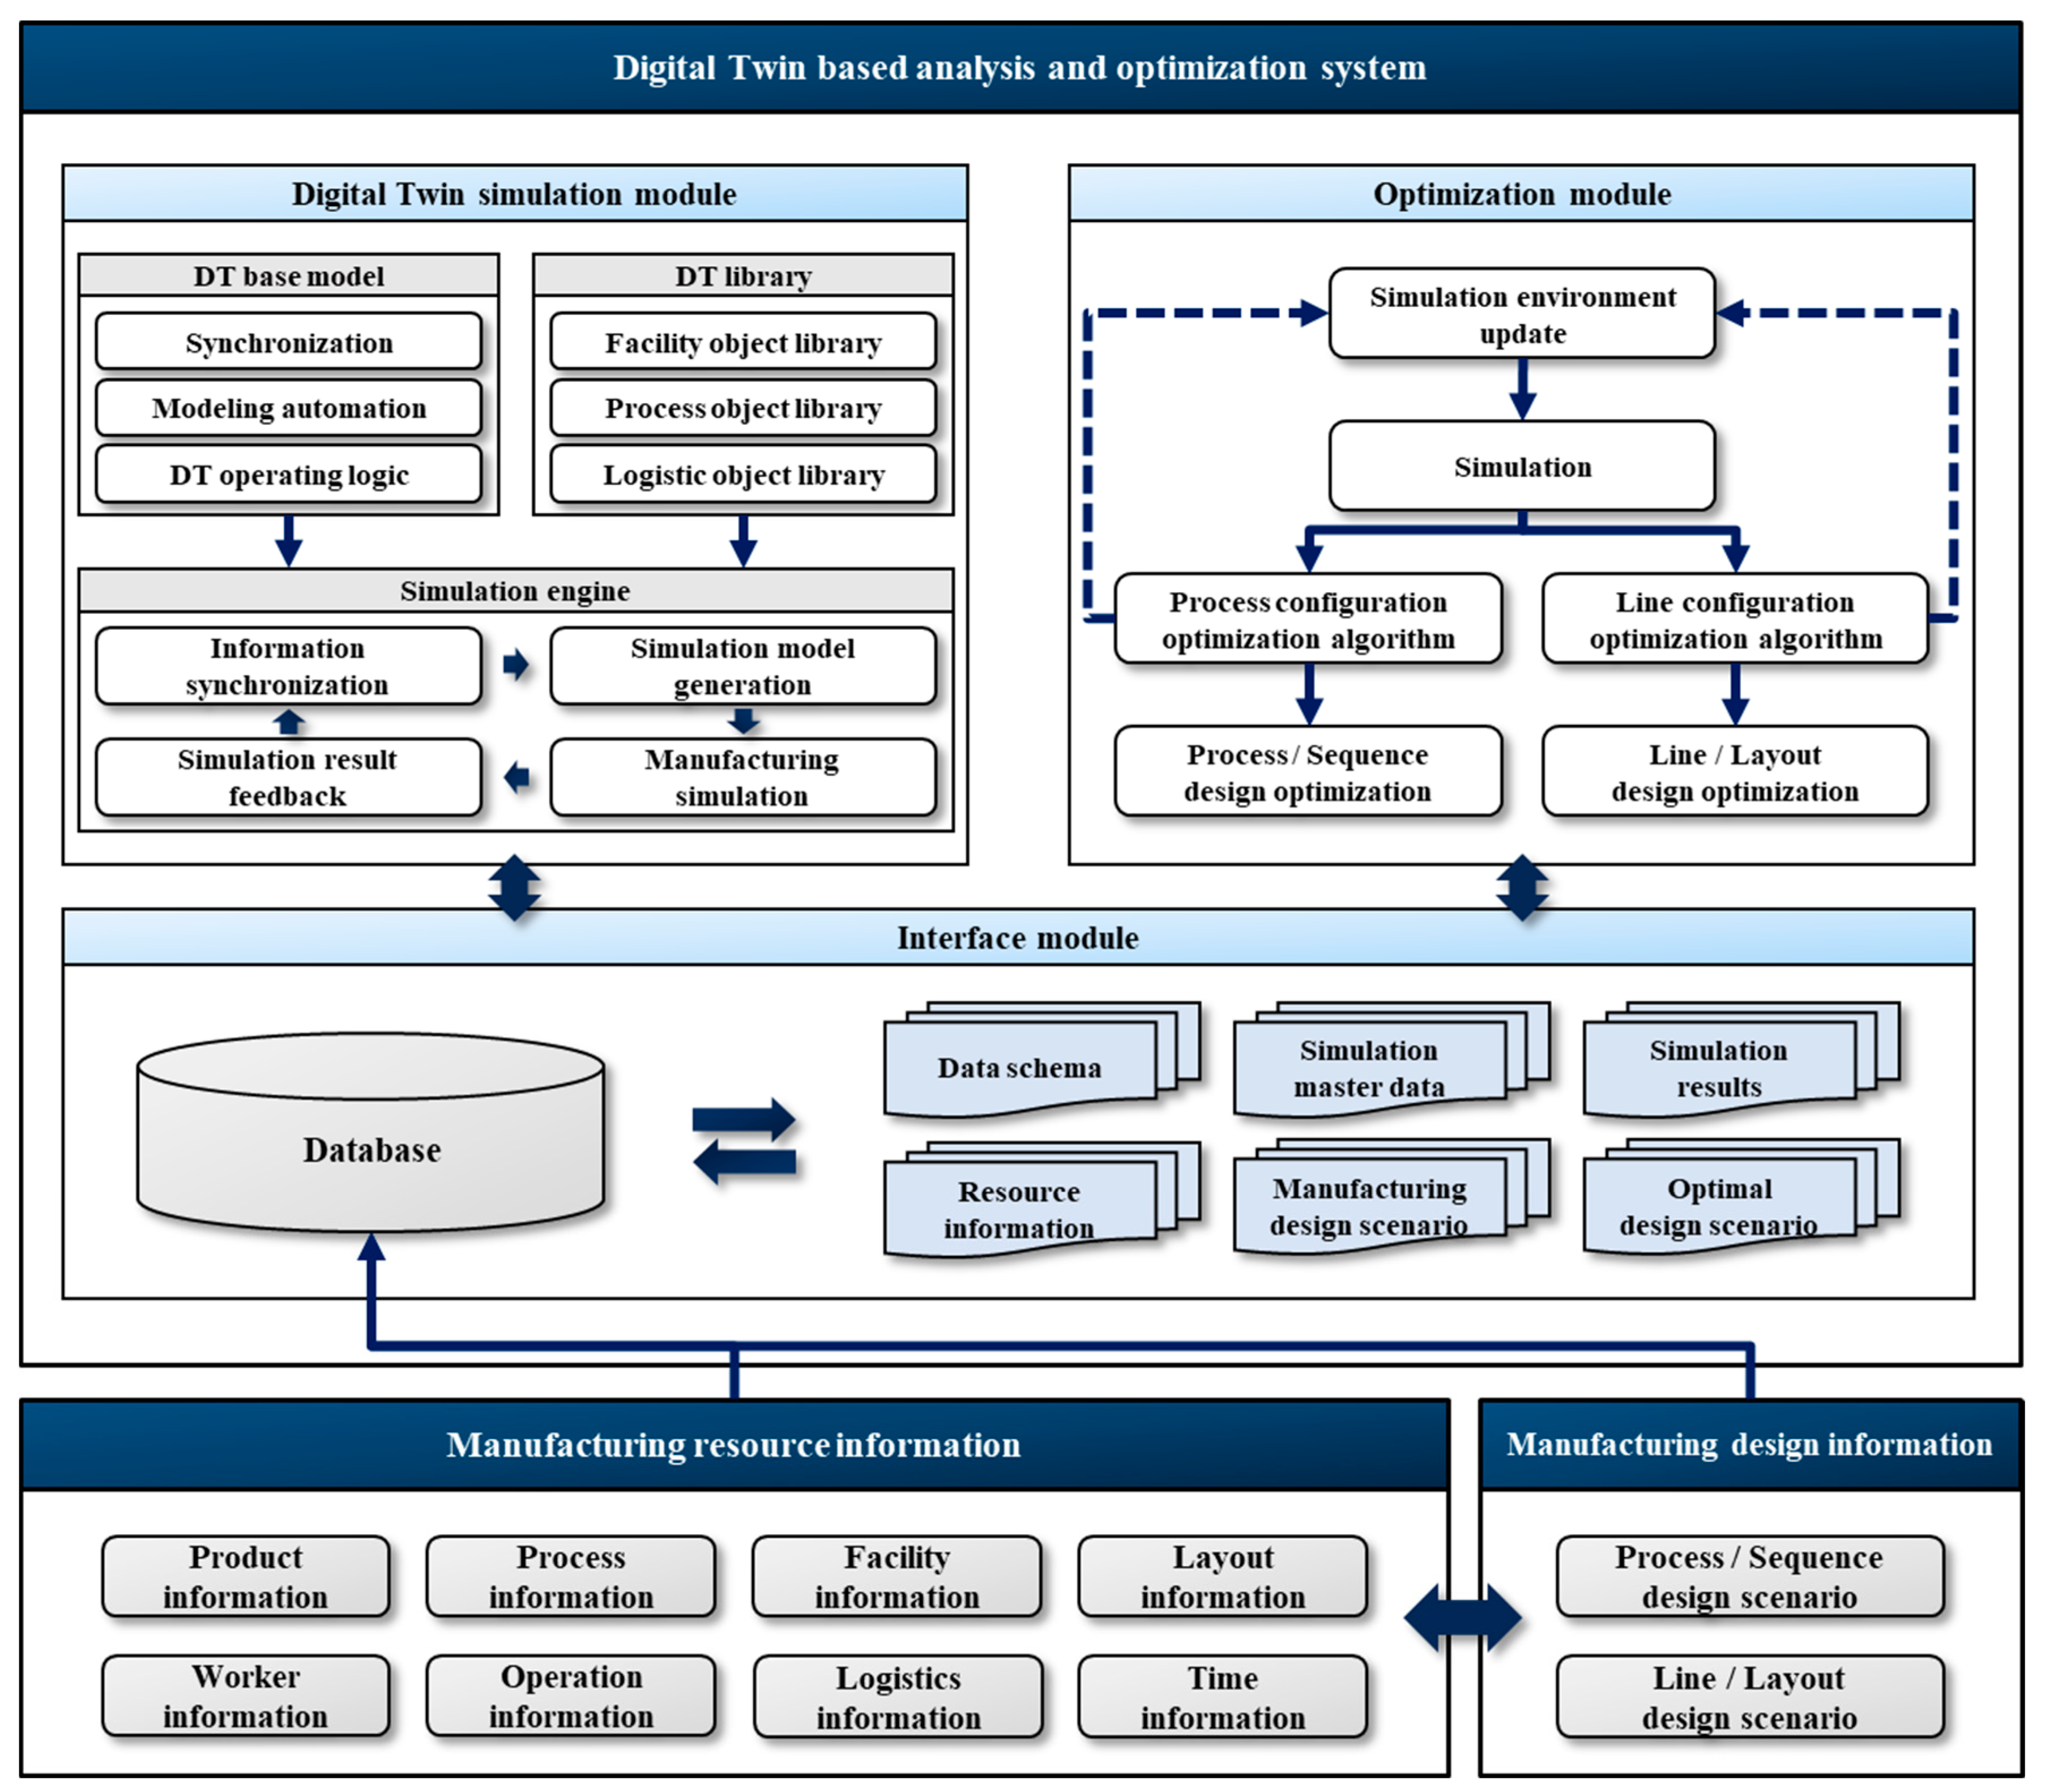
3.1. Framework of the Digital Twin-Based Analysis and Optimization System

Figure 1 presents the framework of the proposed DT-based analysis and optimization system. The framework consists of (1) an information layer and (2) a DT application layer. The information layer is located at the bottom of the framework and holds manufacturing design and resource information. Notably, manufacturing design information is stored in legacy systems such as manufacturing execution systems (MES) or enterprise resource planning (ERP), which contain design scenarios of the production process configuration and its sequence, such as manufacturing bill-of-material (M-BOM), and production line configuration and layout composition scenarios, such as computer-aided design images. Manufacturing resource information is a database of information on manufacturing resources acquired by the legacy system, and it contains information on objects, such as products, facilities, logistics, work, and time, that compose processes and line designs. The DT application layer is located at the top of the framework and includes functional modules for the analysis and optimization of the design and planning of production lines. The description of each component is as follows:
  • Interface module: This module contains a database that stores the design scenario and manufacturing resource information transmitted from the information layer. The data are transmitted to the DT simulation and optimization modules, simulation result data are stored and operated, and design optimization result data are stored.
  • DT simulation module: This module forms the core component of the proposed DT-based system and includes (1) a DT library that generates simulation models by objectifying facilities, processes, and operational logic and (2) a DT base model that automatically creates, synchronizes, and utilizes DT models. The simulation engine enables the visualization of DT simulations generated by the DT library and DT base model and utilizes the results from the simulation. The designed processes and lines can be analyzed, verified, and further utilized for optimization.
  • Optimization module: This module includes two types of algorithms: (1) one for optimizing the process, work configuration, and sequence, and (2) another for optimizing the line configuration and layout design. The simulation results obtained by the DT simulation module are inputted into the optimization module to execute the algorithms and derive optimal results.

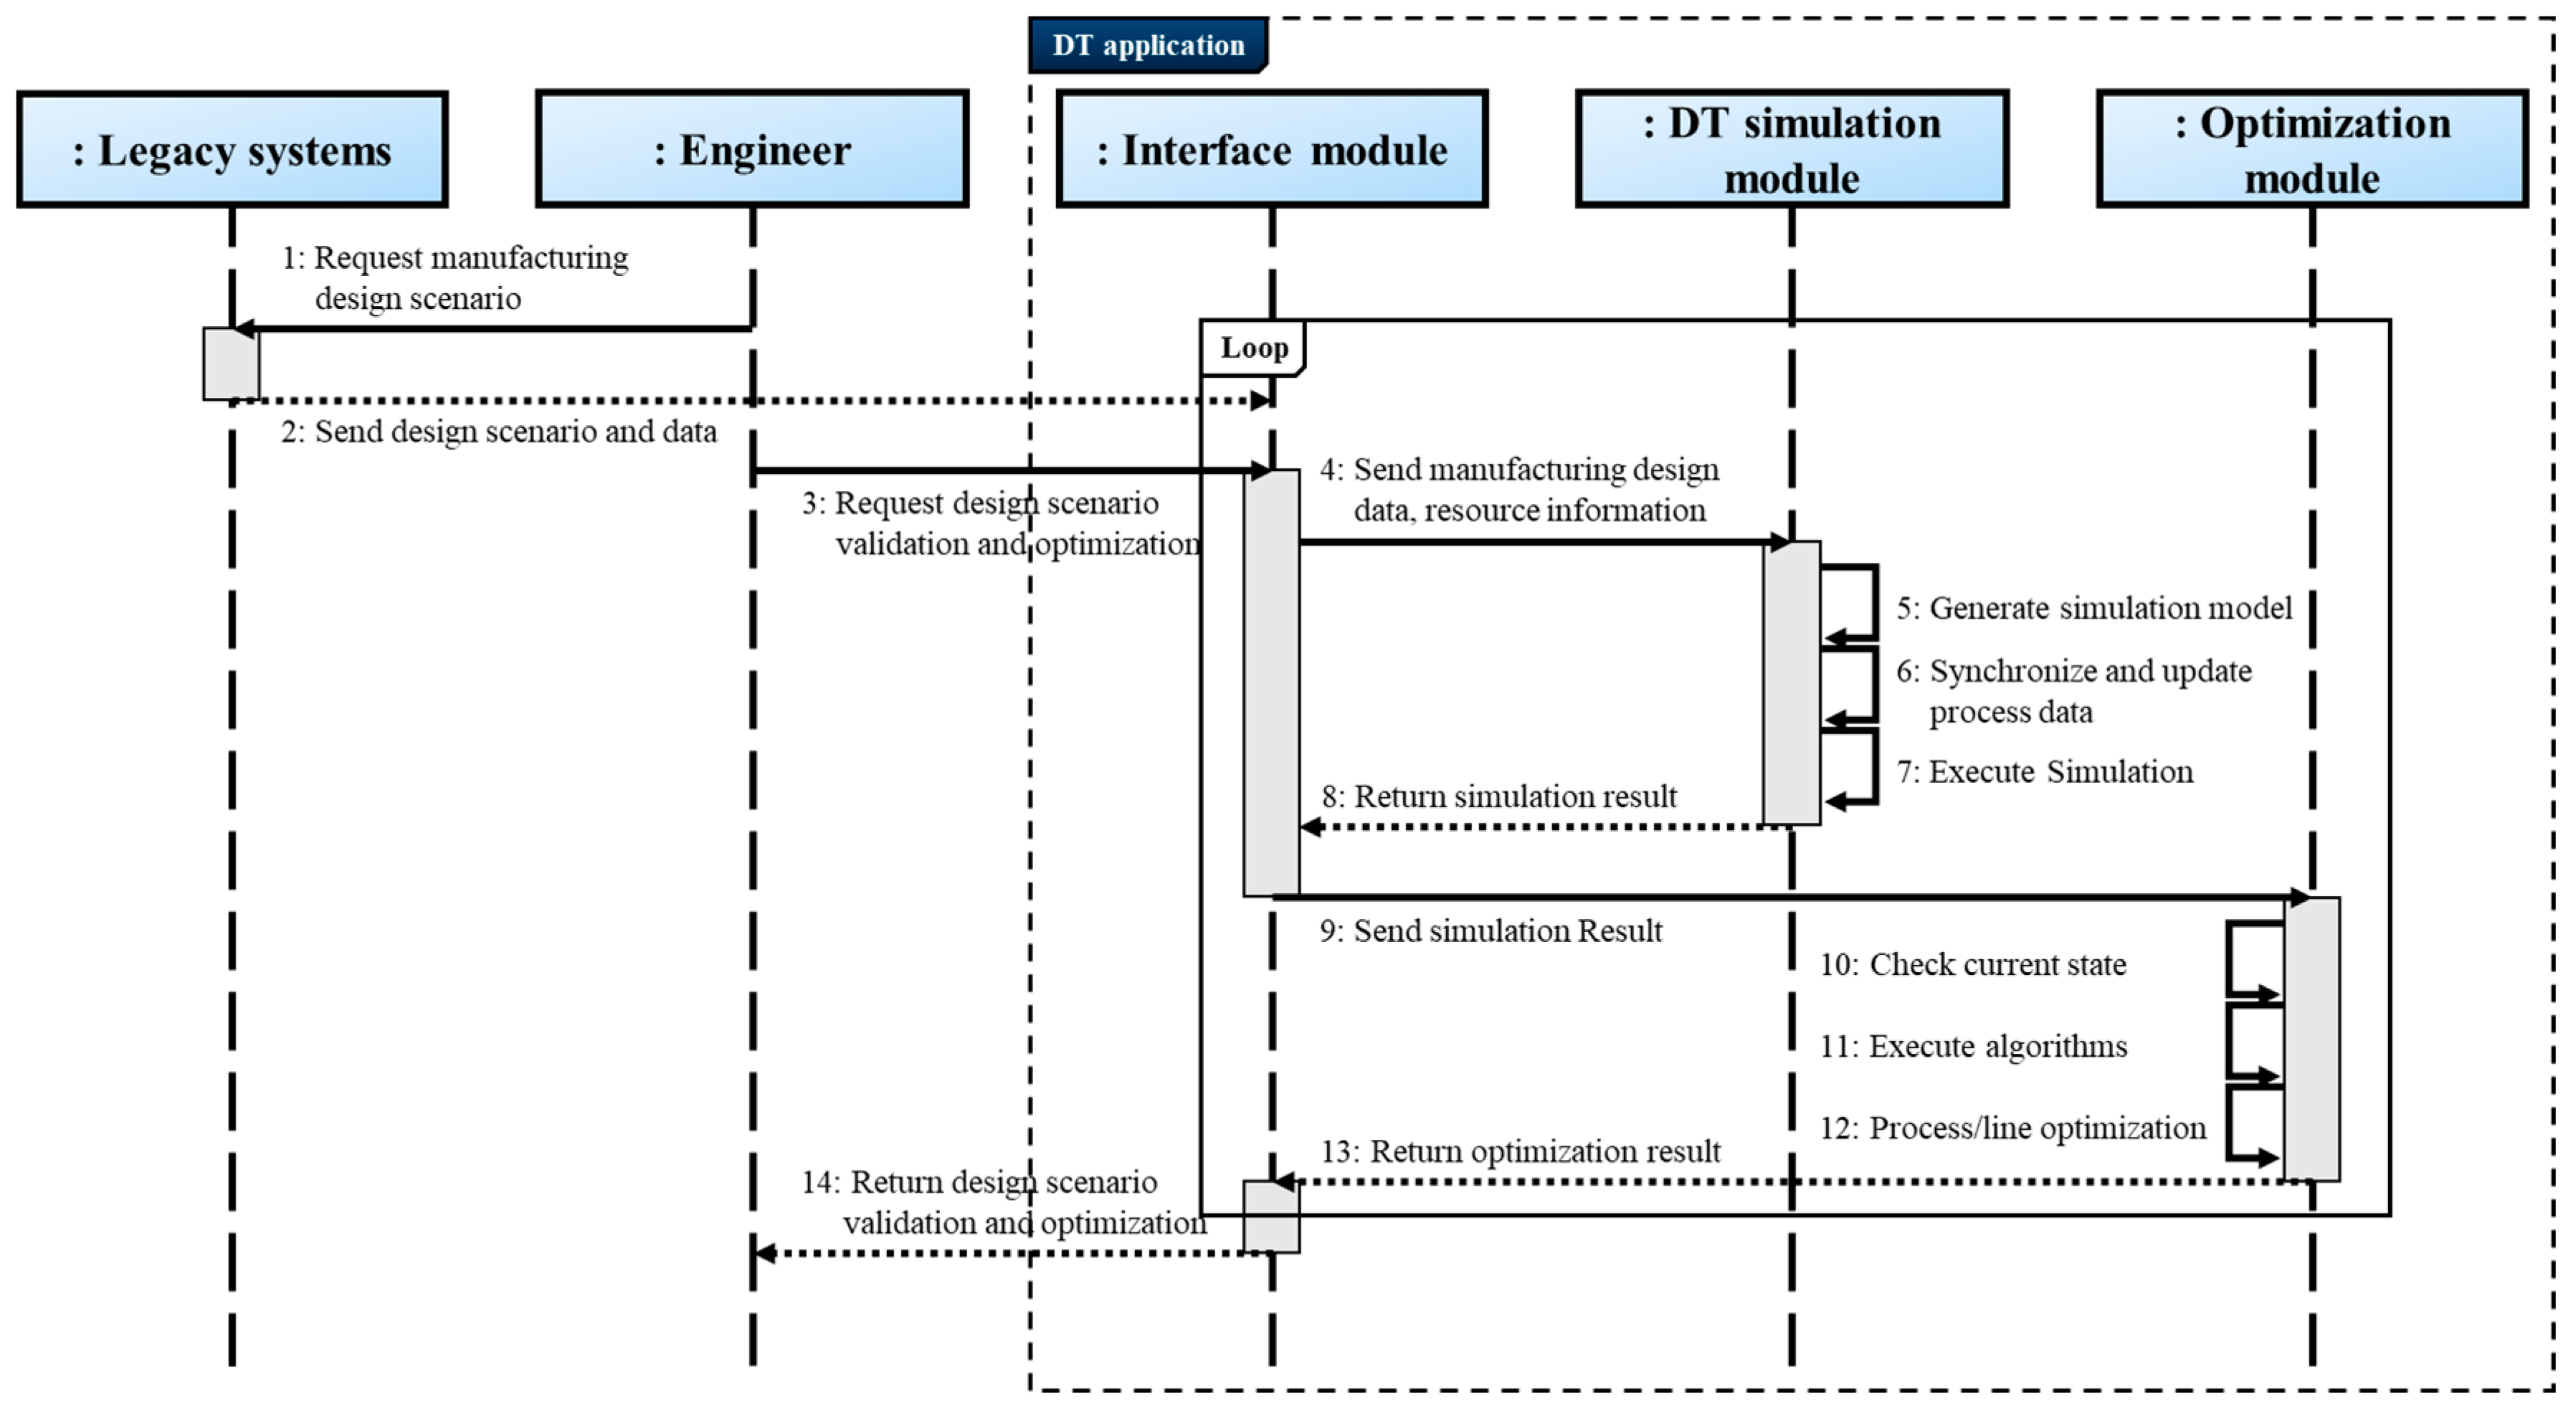
3.2. Digital Twin Application

Figure 2 presents a sequence diagram of the operational procedure of the proposed application. In practical scenarios, an engineer can request scenario data from legacy systems to validate or optimize existing manufacturing design scenarios or new scenarios. Legacy systems such as the MES or ERP then send the requested design scenario and its resource information to the database of the interface module. Following this, the interface module sends the manufacturing design scenario and resource information to the DT simulation module, which initiates the validation and optimization procedures as requested by the engineer. At this point, the engineer can set appropriate values for various key performance indicators (KPIs) and their weights. Thereafter, a simulation model is automatically generated through the DT base model and DT library by synchronizing the received data. A manufacturing simulation is executed, and the simulation results are derived and transferred to the interface module. The optimization procedure is initiated from the optimization module using the simulation results of the original design scenario. The optimization module tests the initial or current state, which is represented and determined using the simulation of every scenario. The optimization algorithms for the process or production line create a new manufacturing design scenario and return to the interface module. This validation and optimization procedure is executed until the best design scenario is derived. The engineer can then quickly and quantitatively make decisions through comparative analysis from various perspectives.

3.3. Digital Twin-Based Optimization

So far, several studies have been conducted to optimize various types of production systems using optimization methodologies, such as heuristic or metaheuristic algorithms. However, several limitations or difficulties may be encountered in the operation of optimization methodologies when expressing the dynamic characteristics of complex production systems because production procedures are expressed in the form of mathematical models. To address these problems, reinforcement learning (RL), which can solve complex problems with short calculation times, is effectively applied. RL is a machine learning approach intended to determine a policy defined as a series of actions, wherein one or multiple agents explore an environment, recognize the current state, and maximize the accumulation of rewards. The application of RL also requires a learning environment, which has previously been represented as a mathematical model. Such mathematical models, however, present limitations when representing manufacturing systems with changing line configurations in real time, thereby increasing the complexity [43]. Expressing the learning environment with a simulation model for line composition and variation enables detailed expression of complex manufacturing systems. However, the existing simulation modeling method also has limitations in modifying the model in real time and reflecting it as a learning environment in a situation where the line configuration changes in real time. Proposed DT-based simulations synchronize information in real time based on the DT base model and automatically generate simulation models so that can representing line configurations and fluctuations in real time may improve the learning performance quickly and accurately.

3.3.1. Heuristic-Based Optimization Algorithms for the Process and Sequence

A heuristic methodology, multi-objective genetic algorithm (GA), was applied for the optimization of the process and sequence. The purpose of this optimization was to solve the combination and sequencing problem, wherein n tasks were allocated to m workstations. In particular, a GA, a heuristic methodology, is a population-based search methodology. A GA simulates biological processes that allow consecutive generations in a population to adapt to their environment. The adaptation process is primarily implemented through genetic inheritance from parents to children and through the survival of the fittest [44]. The algorithm proposed in this paper optimizes processes by grouping and allocating them to each workstation. The input data for this algorithm comprise a set of work numbers and work times, and the output data comprise the objective function values (V). Note that the objective function determines V, which represents the overall assessment index considering the following KPIs: tact time (TT), line of balance (LOB), working rate (RWo), waiting rate (RWa), and blocking rate (RB). The scenario with the highest V value is selected as the optimal scenario. The user can adjust the weights of each KPI to determine the basis on which optimization is to be conducted, such that the user can compare and choose optimization results from various perspectives. The equation for the objective function is as follows, where λ represents the weights of KPIs:
V = λ T T T T + λ L O B L O B + λ R W o R W o + λ R W a R W a + λ R B R B ,   ( λ T T + λ L O B + λ R W o + λ R W a + λ R B = 1 ,   0 λ 1 )
Algorithm 1 presents the pseudocode of the DT-based multi-objective GA used for process configuration and sequence design. First, the user sets parameters such as the initial population (ninit), child population (nchild), number of termination iterations (it), constraints (Con), maximum cycle time (CTmax), and mutation rate (Rm). In this algorithm, the population refers to the process design scenario that can be created. In the first iteration, the initial populations are denoted as a set ninit and are simulated using the DT simulation model. Here, the DT simulation quantitatively computes the KPIs and determines the objective function value (V) for each scenario using the calculated KPIs and set weights. From the second iteration until termination, child populations are created by selecting and crossing over the parents from the initial population. The generated child populations are also simulated, and the objective function value (V) is derived. As generations evolve, the optimal scenario is derived by selecting parents with higher objective function values (V) and by generating child populations.
Algorithm 1: Heuristic-based optimization algorithm DT-based multi-objective genetic algorithm
Input: work number, work time
Output: objective function value (V)
Initialization: set {parameters} {number of initial populations (ninit), number of child populations (nchild), number of termination iteration (it), constraints (Con), max cycle time (CTmax), mutation rate (Rm)}
Body:
loop until i < it
  if i = 1 then
   for n = 1 to ninit do
    generate population P(n) by considering Con and CTmax
    execute the DT simulation and derive V of P(n)
   end for
   i = i + 1
   goto loop
  else if i = 2 then
   for n = 1 to nchild do
    select parents  P
    generate child C(n) form the selected parents with crossover and Rm
    execute the DT simulation and derive V of C(n)
   end for
   i = i + 1
   goto loop
  else
   for n = 1 to nchild do
    P = PC
    implement fast non-dominated sorting crowding distance method on P
    select parents P
    generate child C(n) form the selected parents with crossover and Rm
    execute the DT simulation and derive V of C(n)
   end for
   i = i + 1
   goto loop
  end if
end loop

3.3.2. Reinforcement Learning-Based Optimization Algorithm for the Line and Layout

Furthermore, the Q-learning algorithm was used to optimize the line configuration and layout design. Note that the assignment state of the workstations is defined as a state (S) of the algorithm. Action (A) can be selected considering the current state: (1) adding a new workstation in parallel, (2) adding a new workstation in series, and (3) moving the workstation to another space. The objective function value considering the KPIs, similar to that in the heuristic-based algorithm, is defined as a reward (R). The reward for each state is calculated through a DT simulation. The equation for the objective function is as follows, where λ represents the weights of KPIs:
R = λ T T T T + λ L O B L O B + λ R W o R W o + λ R W a R W a + λ R B R B + λ U S U S ,   ( λ T T + λ L O B + λ R W o + λ R W a + λ R B + λ U S = 1 ,   0 λ 1 )
The Q-function is presented in Equation (3); this parameterized Q-function is widely used in Q-learning. α denotes the learning rate that determines the learning speed, and γ represents a discount factor that manages the trade-off between the importance of immediate and future rewards [45,46].
Q ( S t ,   A t ) Q ( S t ,   A t ) + α ( R t + 1 + γ m a x A t + 1 Q ( S t + 1 ,   A t + 1 ) Q ( S t ,   A t ) )
Algorithm 2 presents the pseudocode of the DT-based Q-learning algorithm for line configuration and layout design. First, by examining the current state (St), a possible action list is derived. Next, DT simulation models (St and At) are generated. After the simulation, the next state (St+1) and next action (At+1) can be observed, and the next reward (Rt+1) can be obtained. From these repeated simulations and observations, the Q-value can be calculated and updated, and the transition can be stored in the Q-table. In this case, learning is repeated until a termination condition is obtained.
Algorithm 2: RL-based optimization algorithm DT-based Q-learning algorithm
Input: workstation assignment state (S), policy, action (A)
Output: Q-value (Q), objective function value (R)
Initialization: set {parameters} {number of episode (EP), index of ending rule (E), learning rate ( α ), discount factor ( γ )} and initialize Q-table
Body:
EP = 1
loop until EP < E
  for t = 1 to T do
   check St
   generate list of At using policy
   for i = 1 to I do
    execute the DT simulation and derive R of (St, Ai)
    generate list of (St+1, Ai+1) using policy
    for j = 1 to J do
     execute the DT simulation and derive R of (St+1, Aj)
    end for
   end for
   calculate and update Q
     Q ( S t , A t ) Q ( S t , A t ) + α ( R t + 1 + γ m a x A t + 1 Q ( S t + 1 , A t + 1 ) Q ( S t , A t ) )
   store transition (St, At, Rt, St+1) in Q-table
   if Q(St, At) = Q(St−1, At−1) then
    exit for
   else
    t = t + 1
   end if
  end for
  EP = EP + 1
end loop

4. Industrial Case Study

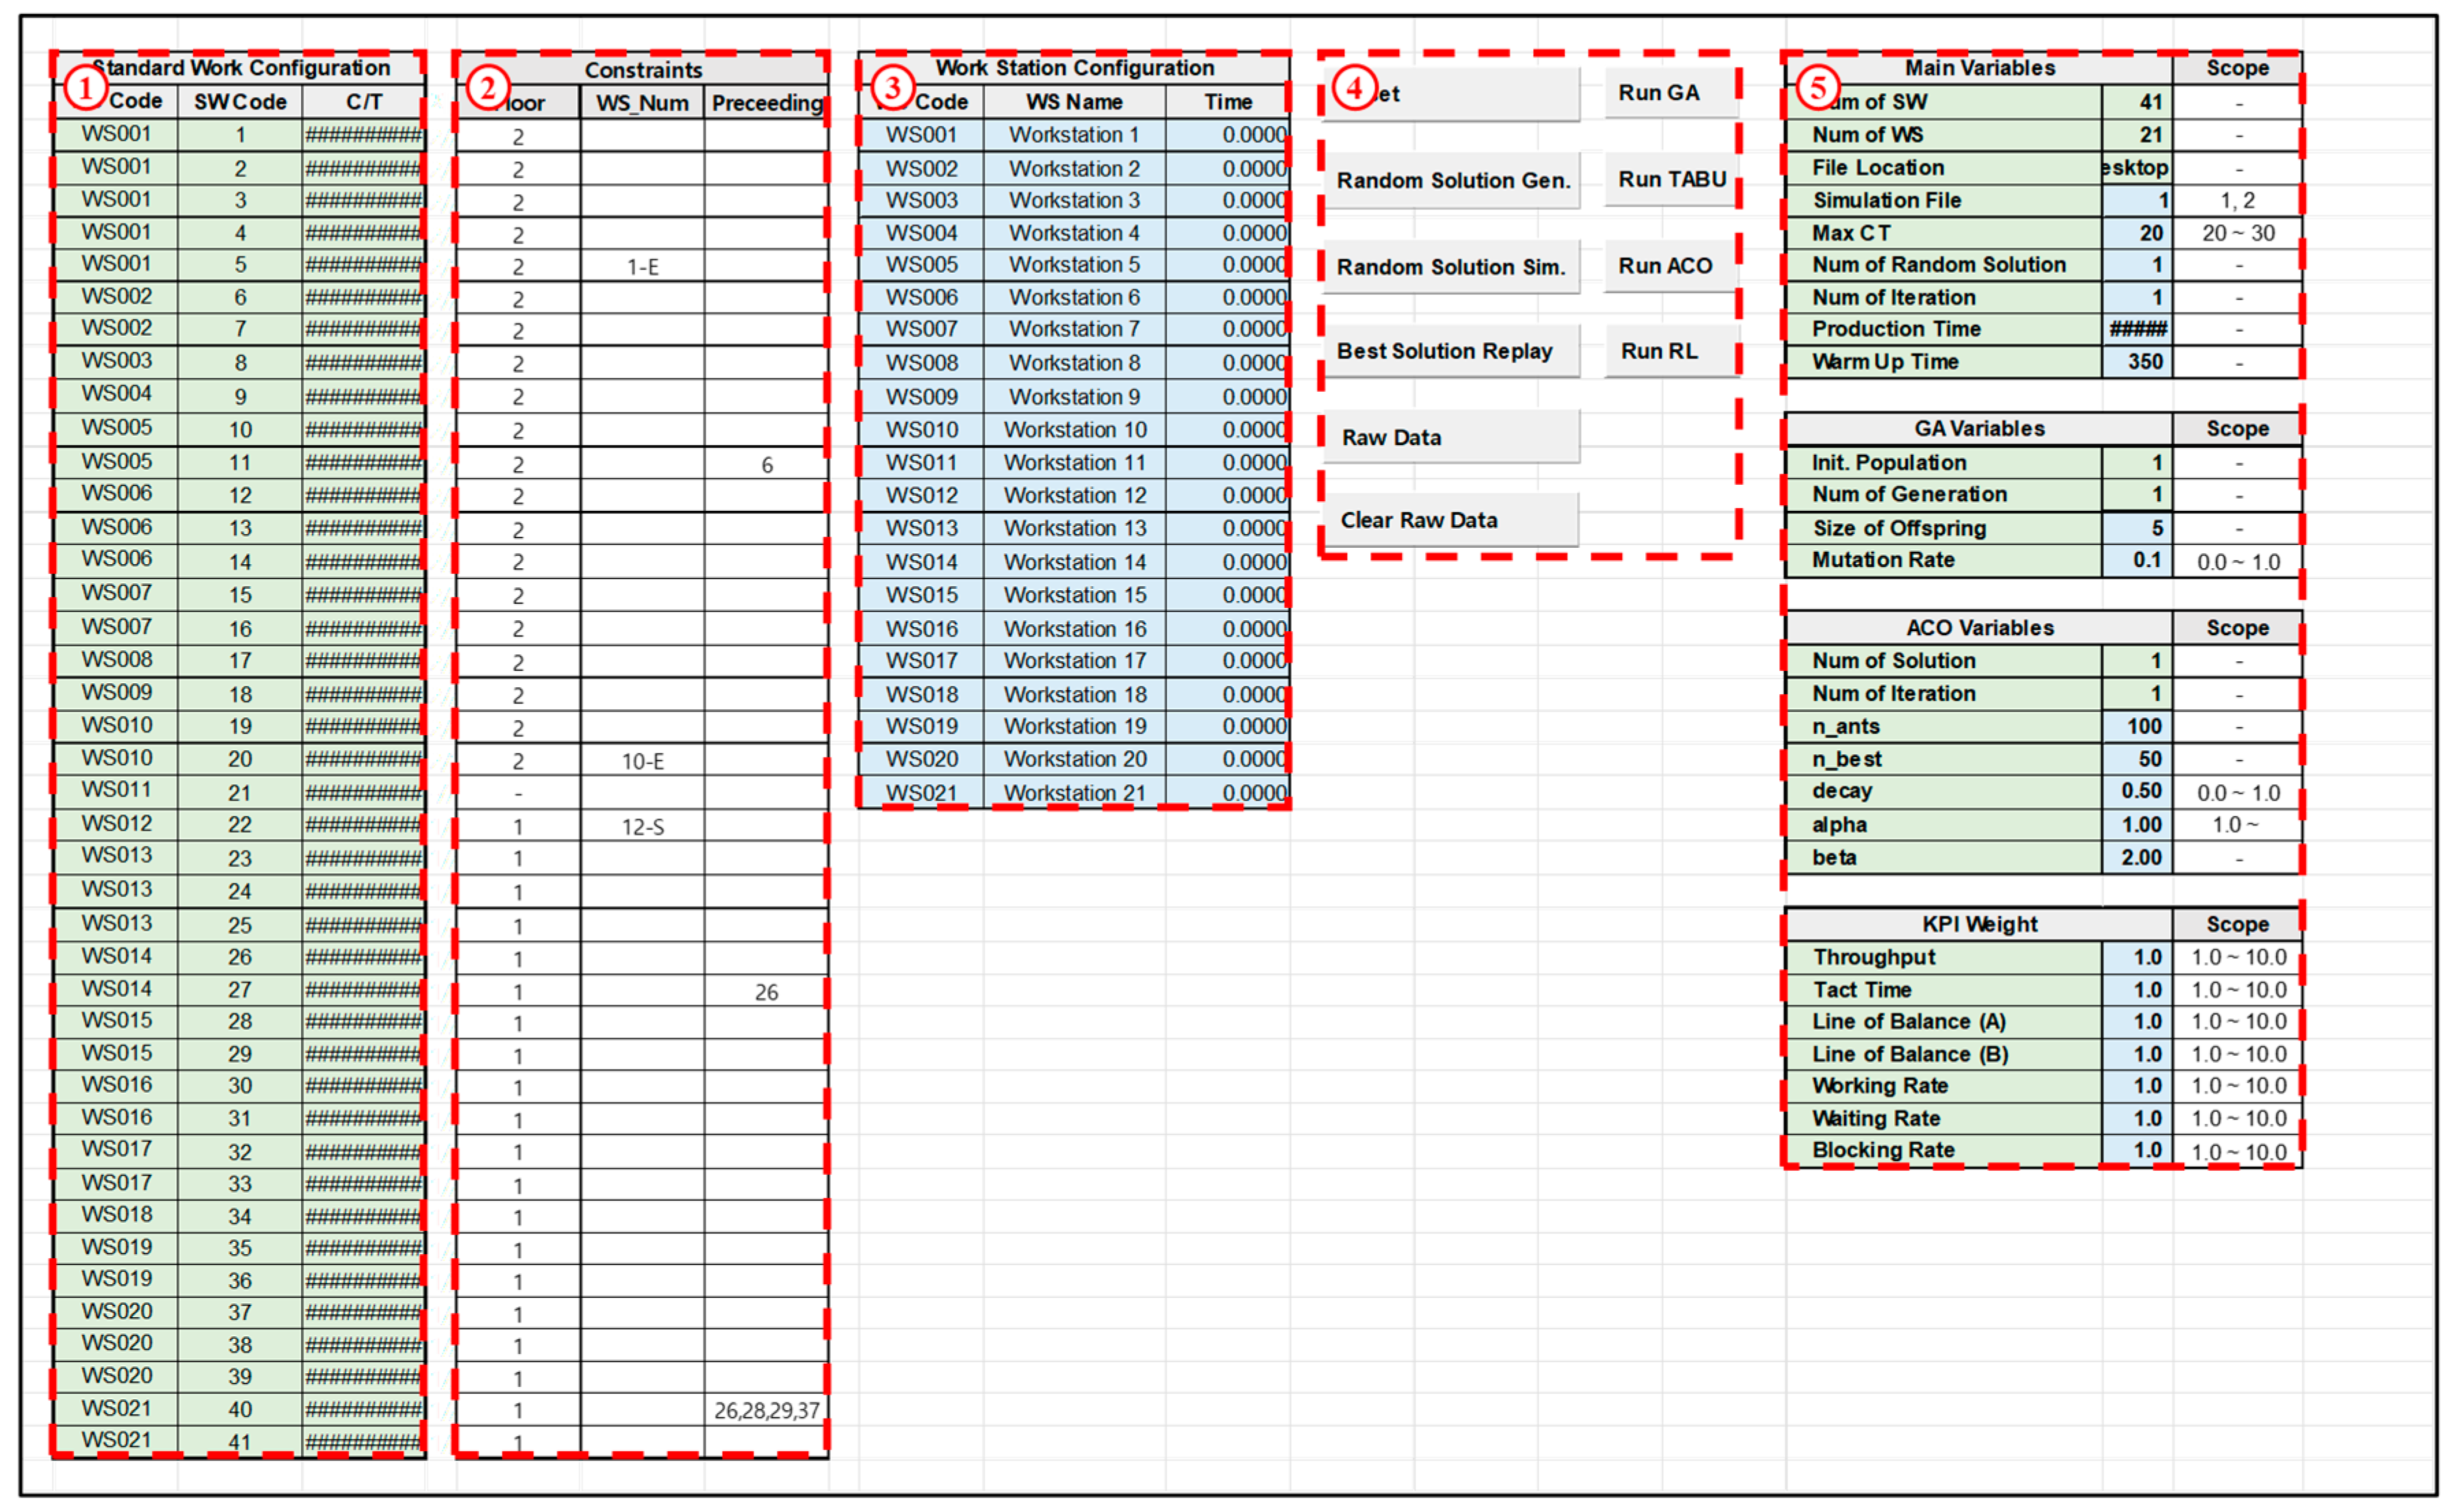
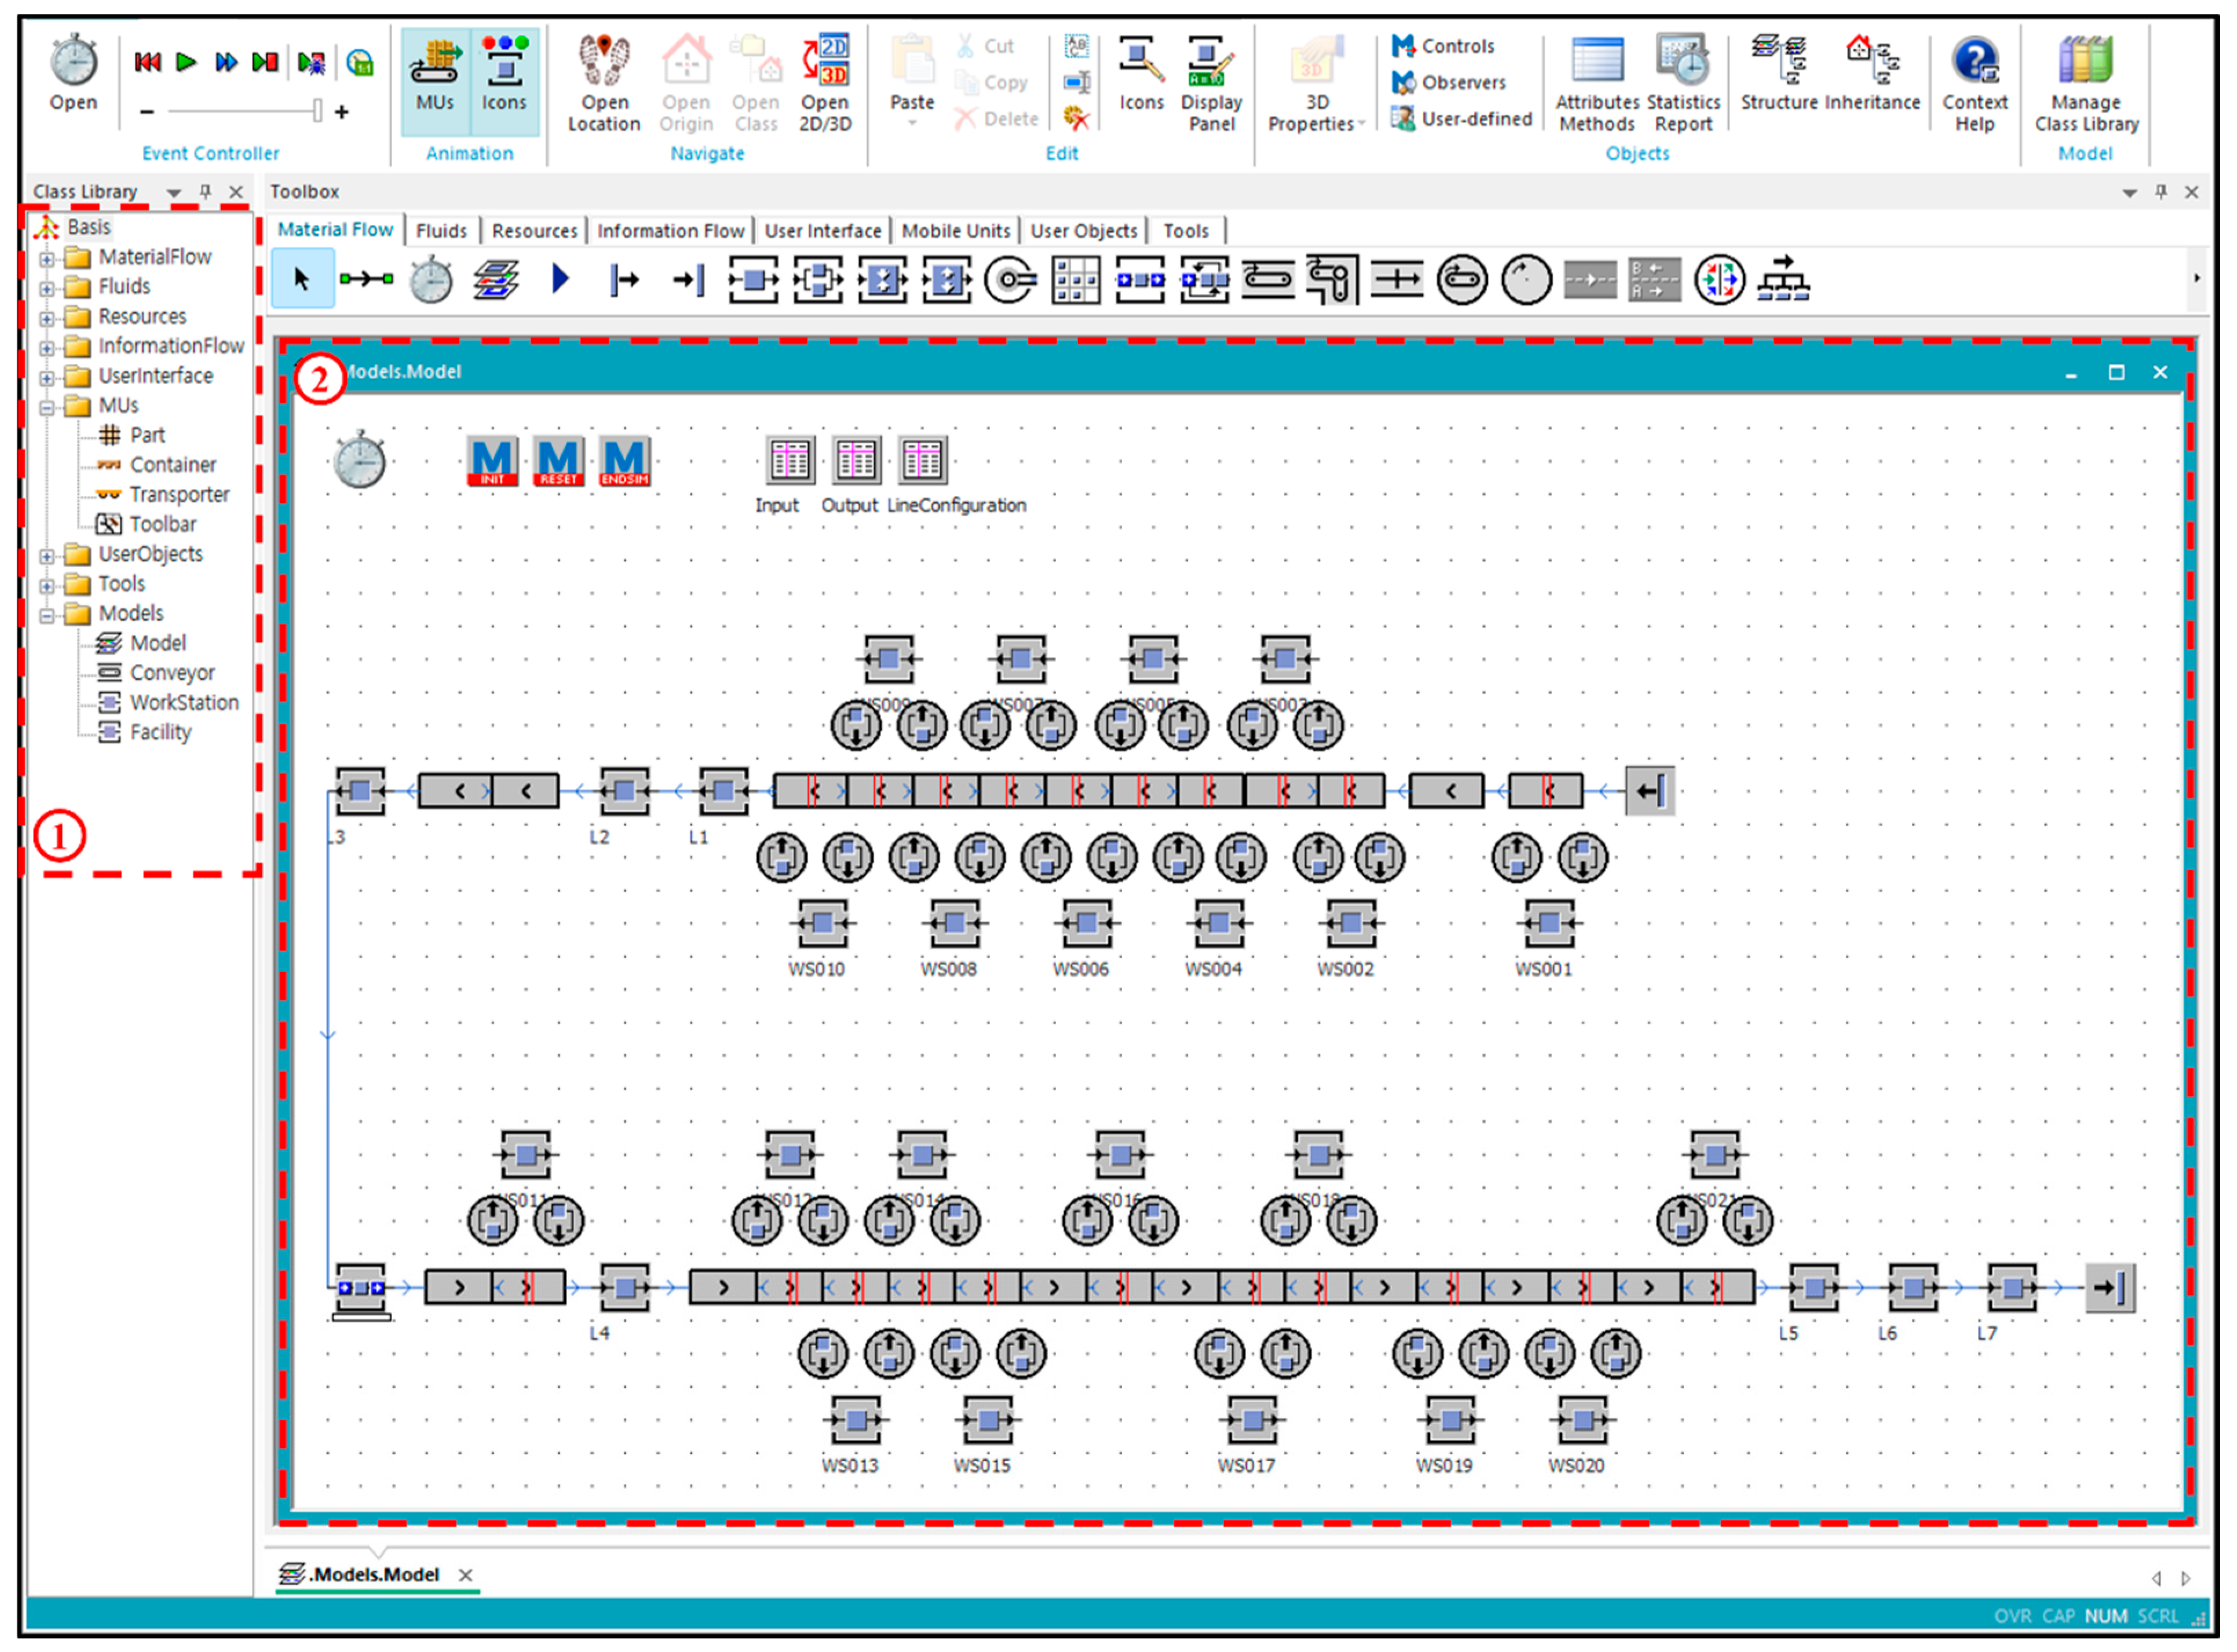
4.1. Digital Twin Application Development Environment

The DT application was implemented as depicted in Figure 3, and the development environment information for each component is summarized in Table 2. The interface module was mounted in an application based on Microsoft Office Excel, and it was interfaced with the DT simulation module and optimization module within the application through the Excel data format. Figure 3① presents resource and work information for a production line configuration. Figure 3② presents the constraint information required when configuring production lines, and Figure 3③ depicts the production line configuration scenario. Figure 3④ illustrates a menu that can control and operate this application. Finally, Figure 3⑤ depicts a user interface, wherein the user of the application can input variables or weights of the optimization algorithms. Figure 4 presents the DT simulation module and created simulation model. Note that the DT simulation module uses Siemens Plant Simulation as the simulation engine. Figure 4① presents the objectified DT library used for generating simulation models that contains facilities, processes, and operational logic; the generated simulation models are represented and visualized on the screen, as presented in Figure 4②. In our analysis, the optimization algorithms for the optimization module were programmed in Python.

4.2. Implementation of the Digital Twin-Based Analysis and Optimization System

Note that the target production line in the implementation is a worker-centered assembly line that produces the bodies of refrigerators. The line is divided into two layers: production is first performed on the second floor and then moved to the first floor. Ten workstations and two facilities are located on the second floor, and eleven workstations and four facilities are located on the first floor; the layout is shown in Figure 5. Each workstation has one worker and several tasks, and the distribution of tasks differs from one workstation to another. Information pertaining to the tasks and the task distribution for each workstation are summarized in Table 3. Using the two algorithms outlined in Section 3.3, two experimental implementations were performed: (1) a heuristic-based optimization of the process and sequence design and (2) an RL-based optimization of the line and layout design.

4.2.1. Experiment 1: Process Configuration and Sequence Optimization

In Experiment 1, the process configuration and sequence were optimized using the heuristic-based algorithm explained in Section 3.3.1. Table 4 presents the optimization results for various KPIs, and Table 5 presents a comparison of the as-is and best scenarios. As shown in Table 4, the optimization results for different KPIs can be compared. The optimization result based on TT was selected as the best scenario. In this case, the performance improved by 8.01%, 7.37%, 17.37%, 7.09%, and 10.83% in terms of the throughput, TT, LOB, working rate, and waiting rate, respectively; however, the blocking rate decreased by 3.74%. In addition, as presented in Table 5, three workstations were not assigned tasks, but the overall cycle time was evenly distributed, indicating that the LOB had improved. Thus, optimization reduces the resources required to plan the process by evenly distributing the workload, consequently improving the overall performance.

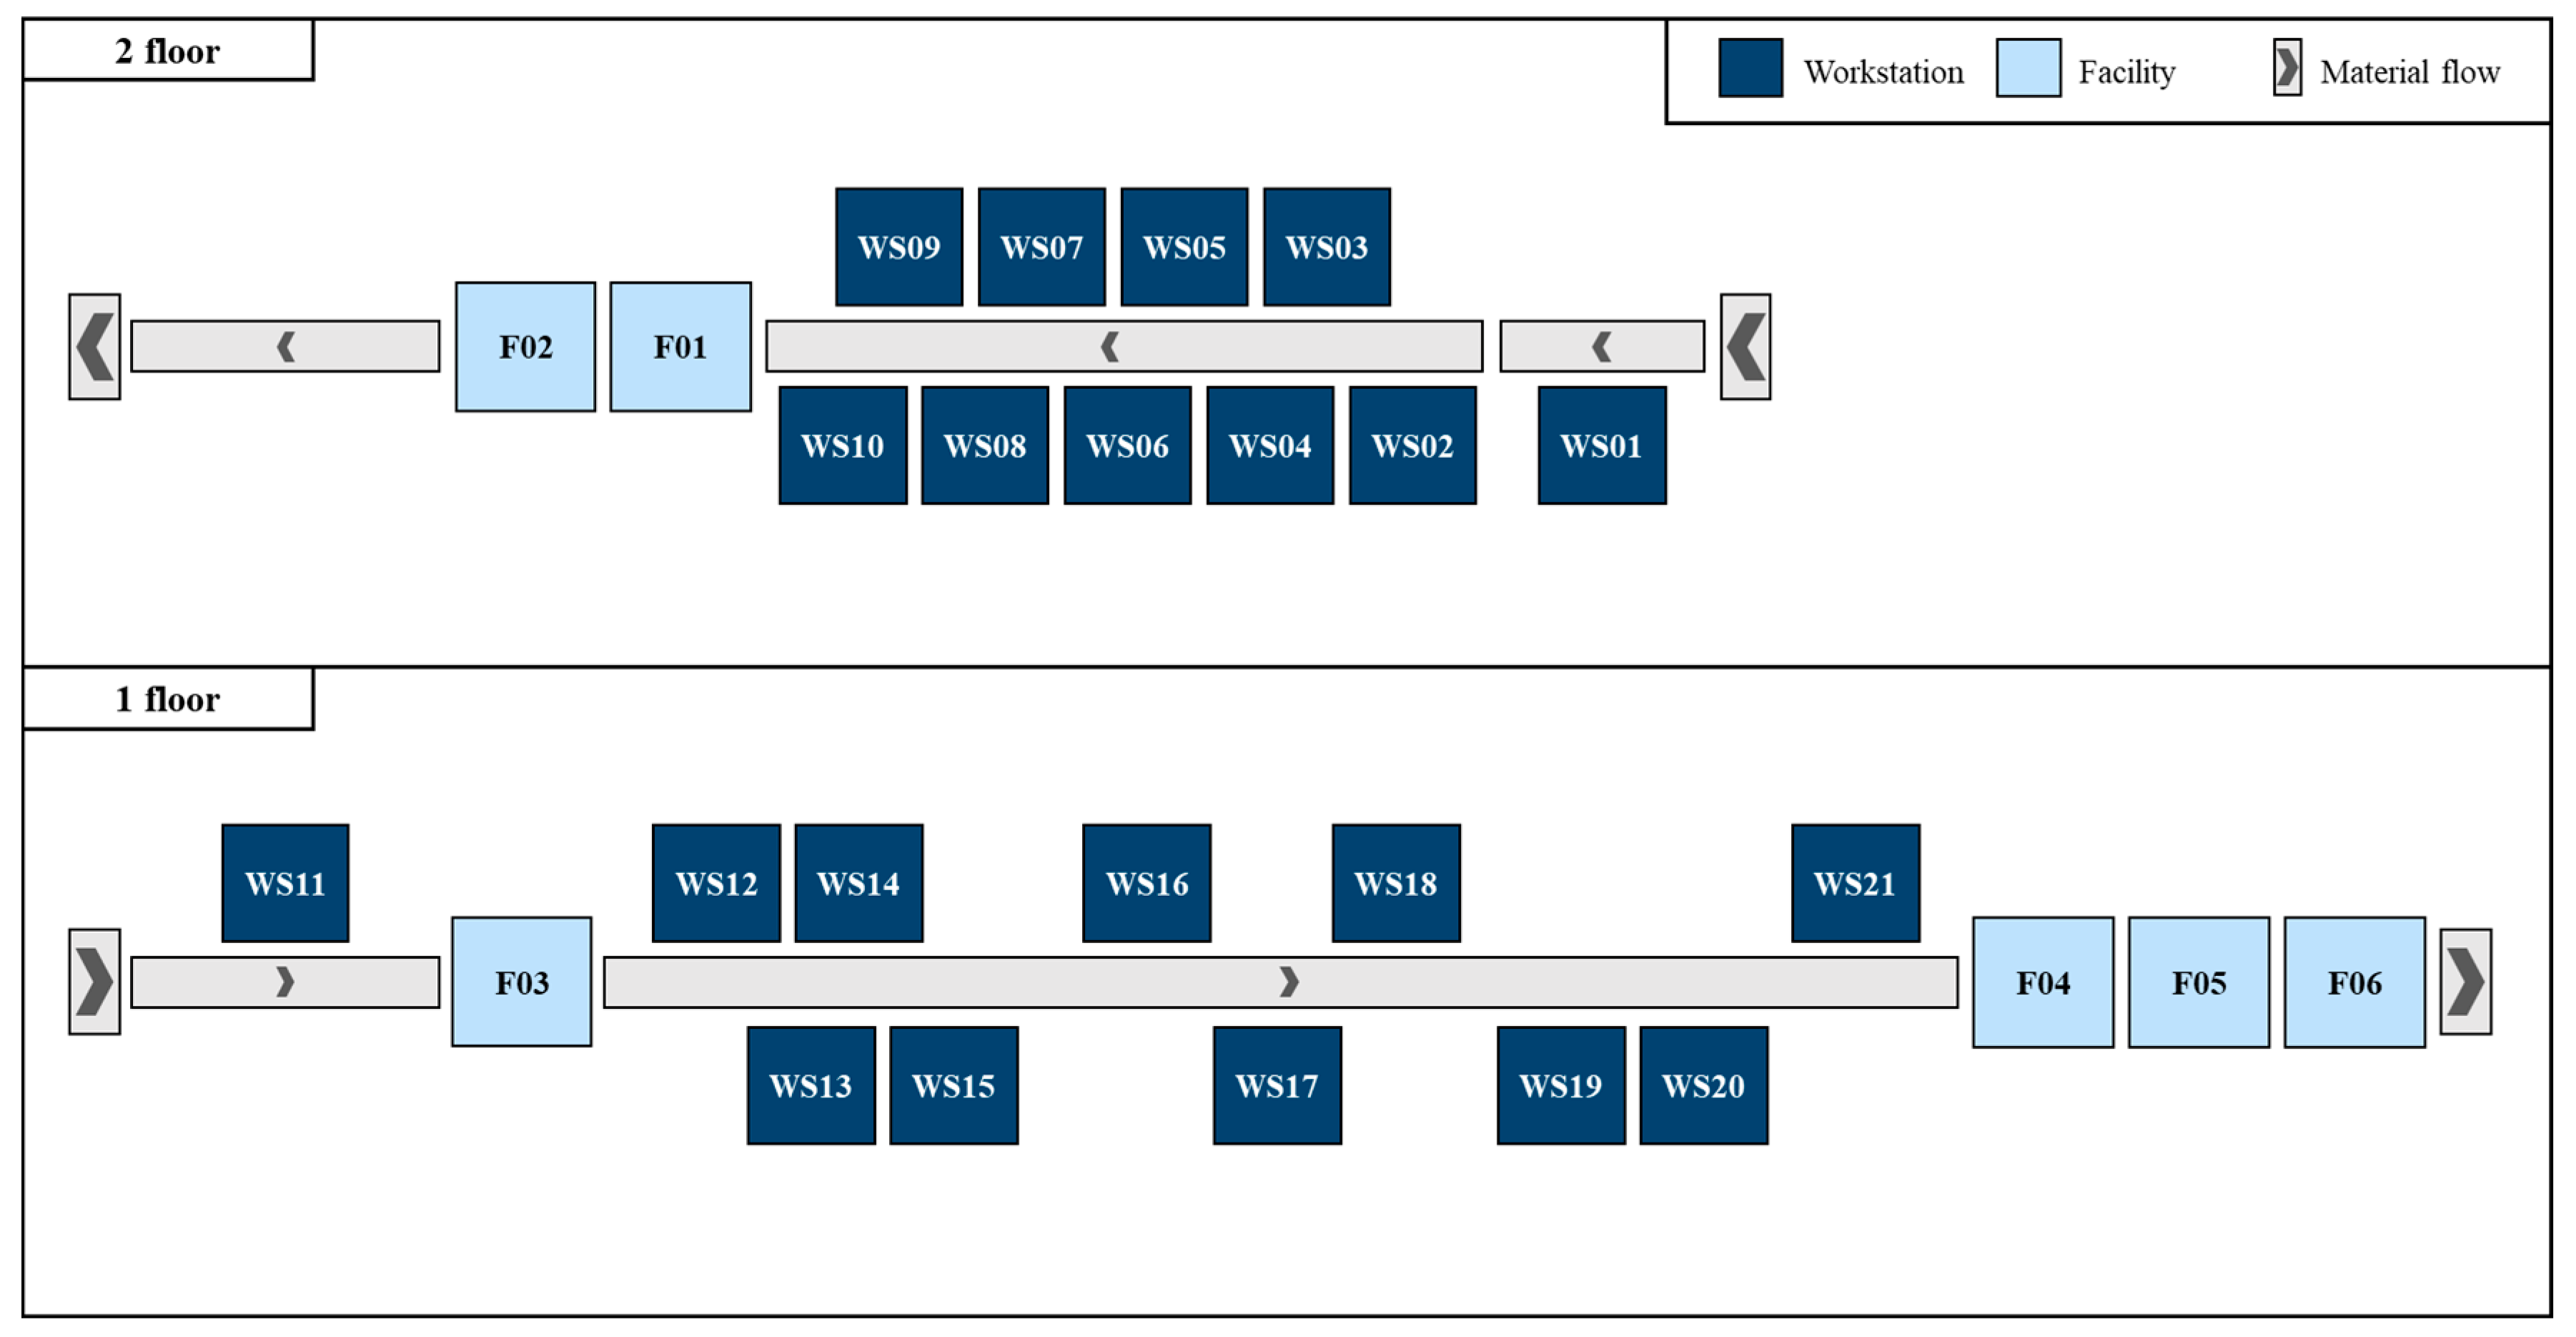
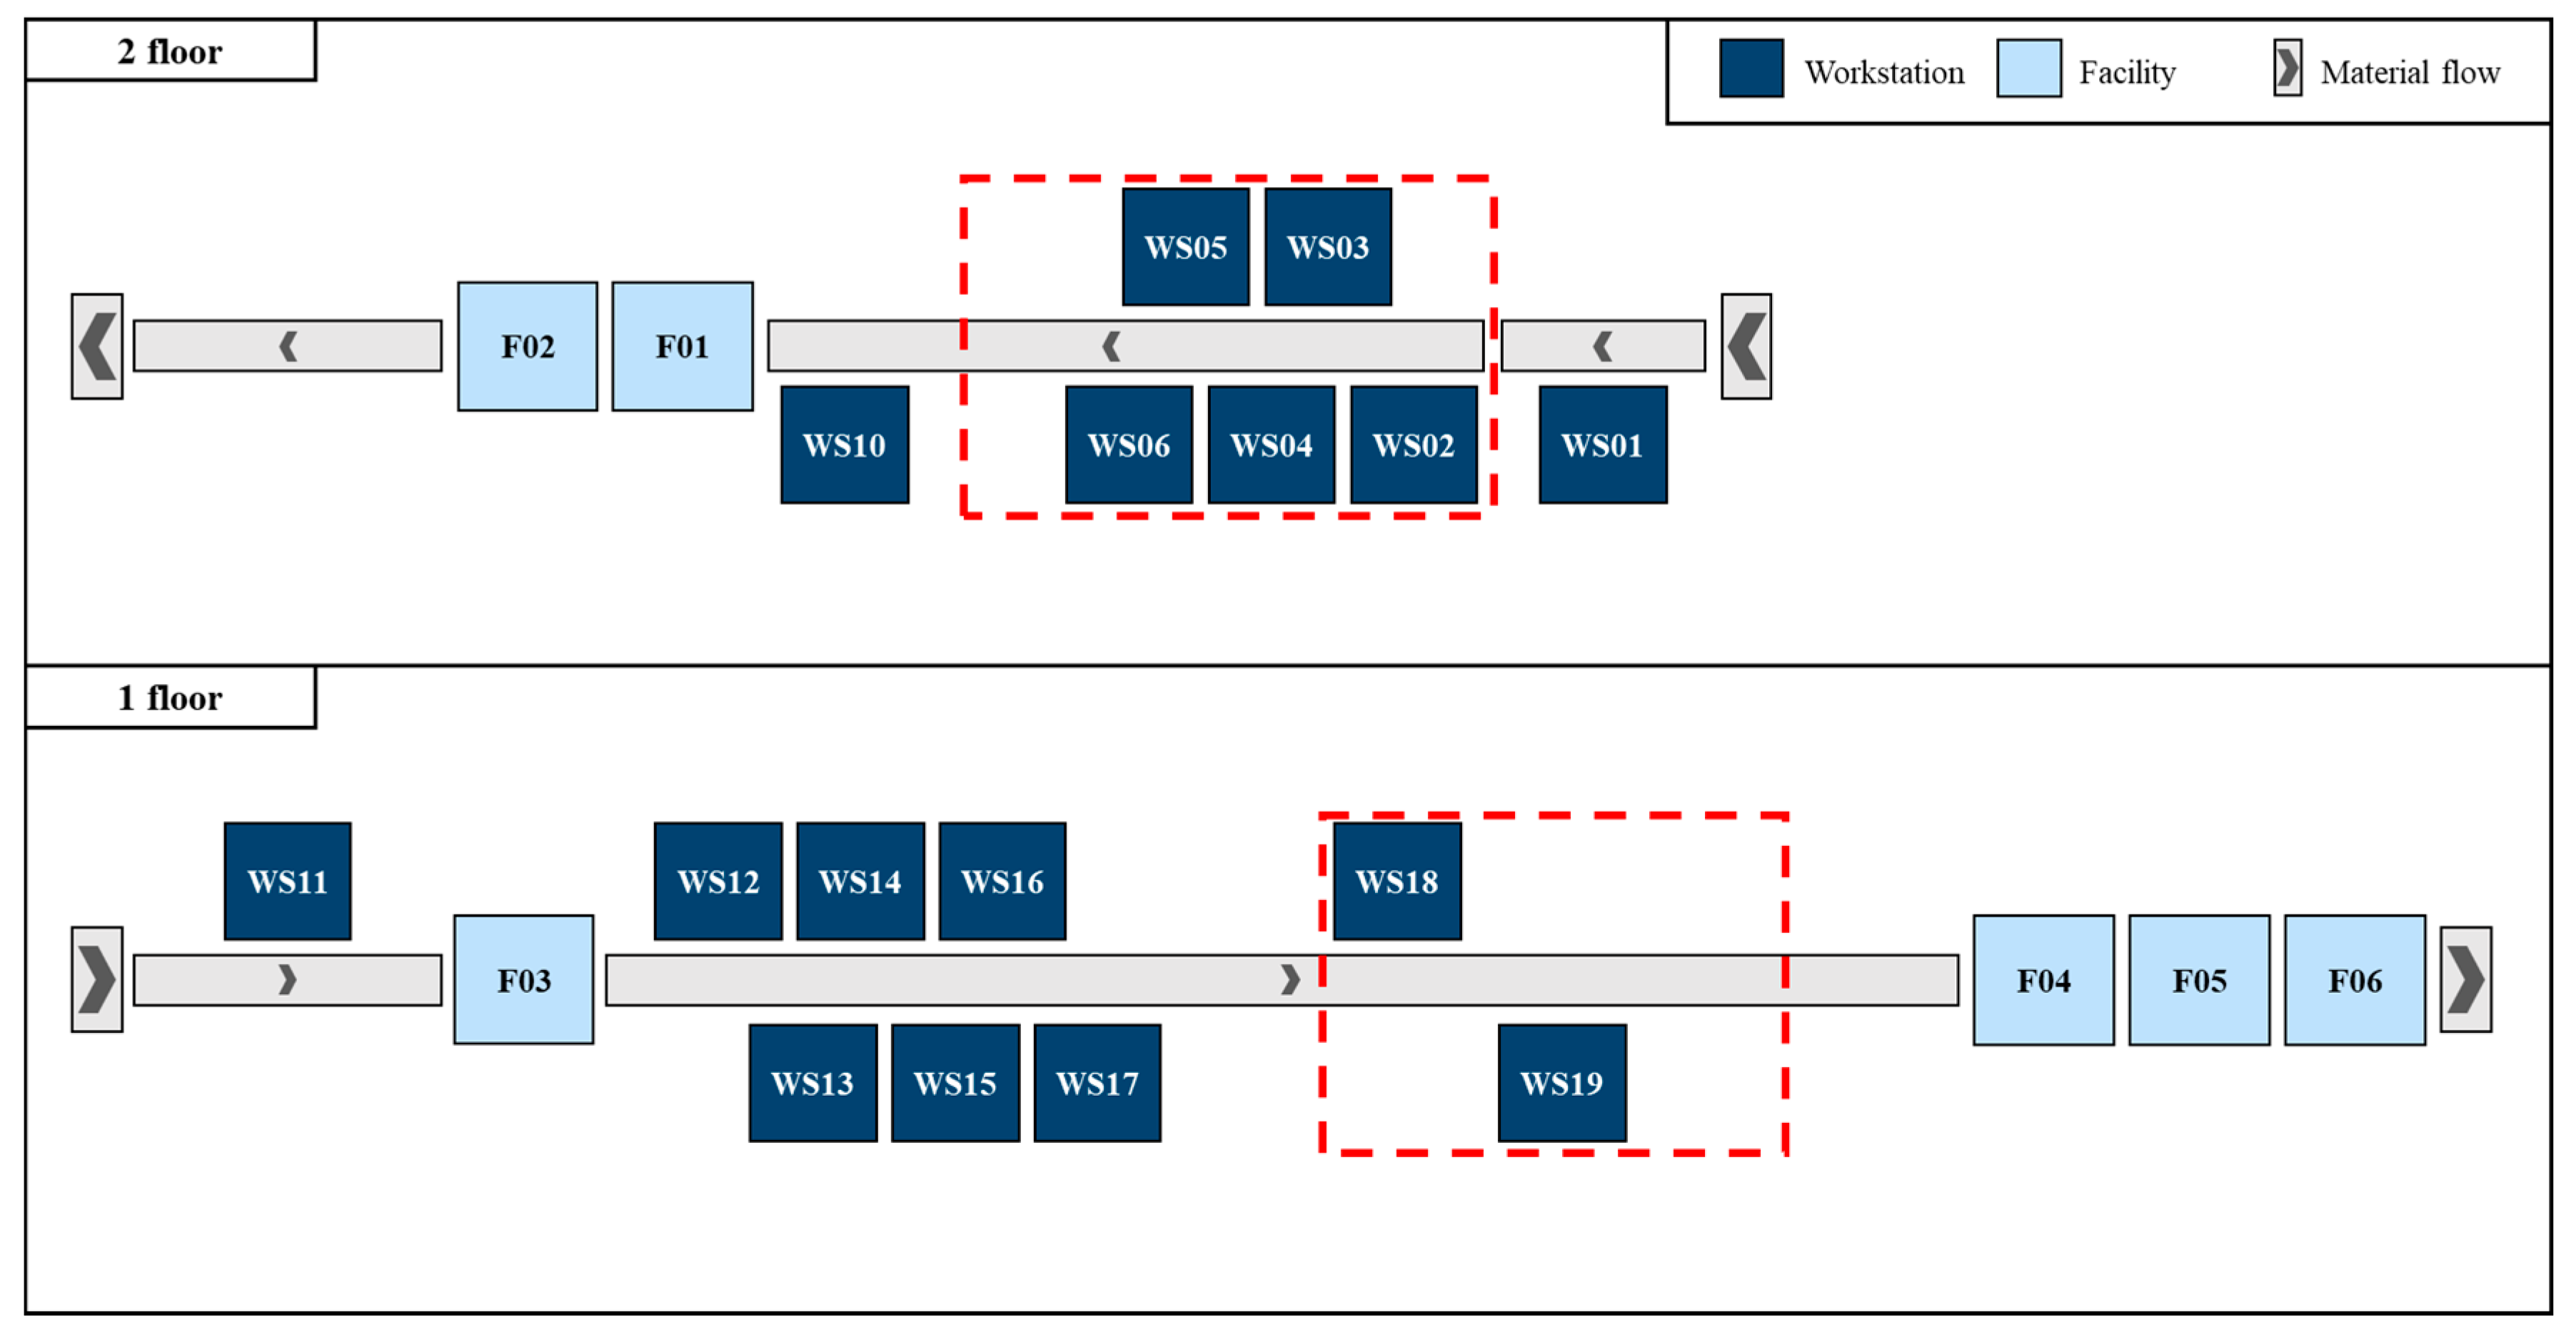
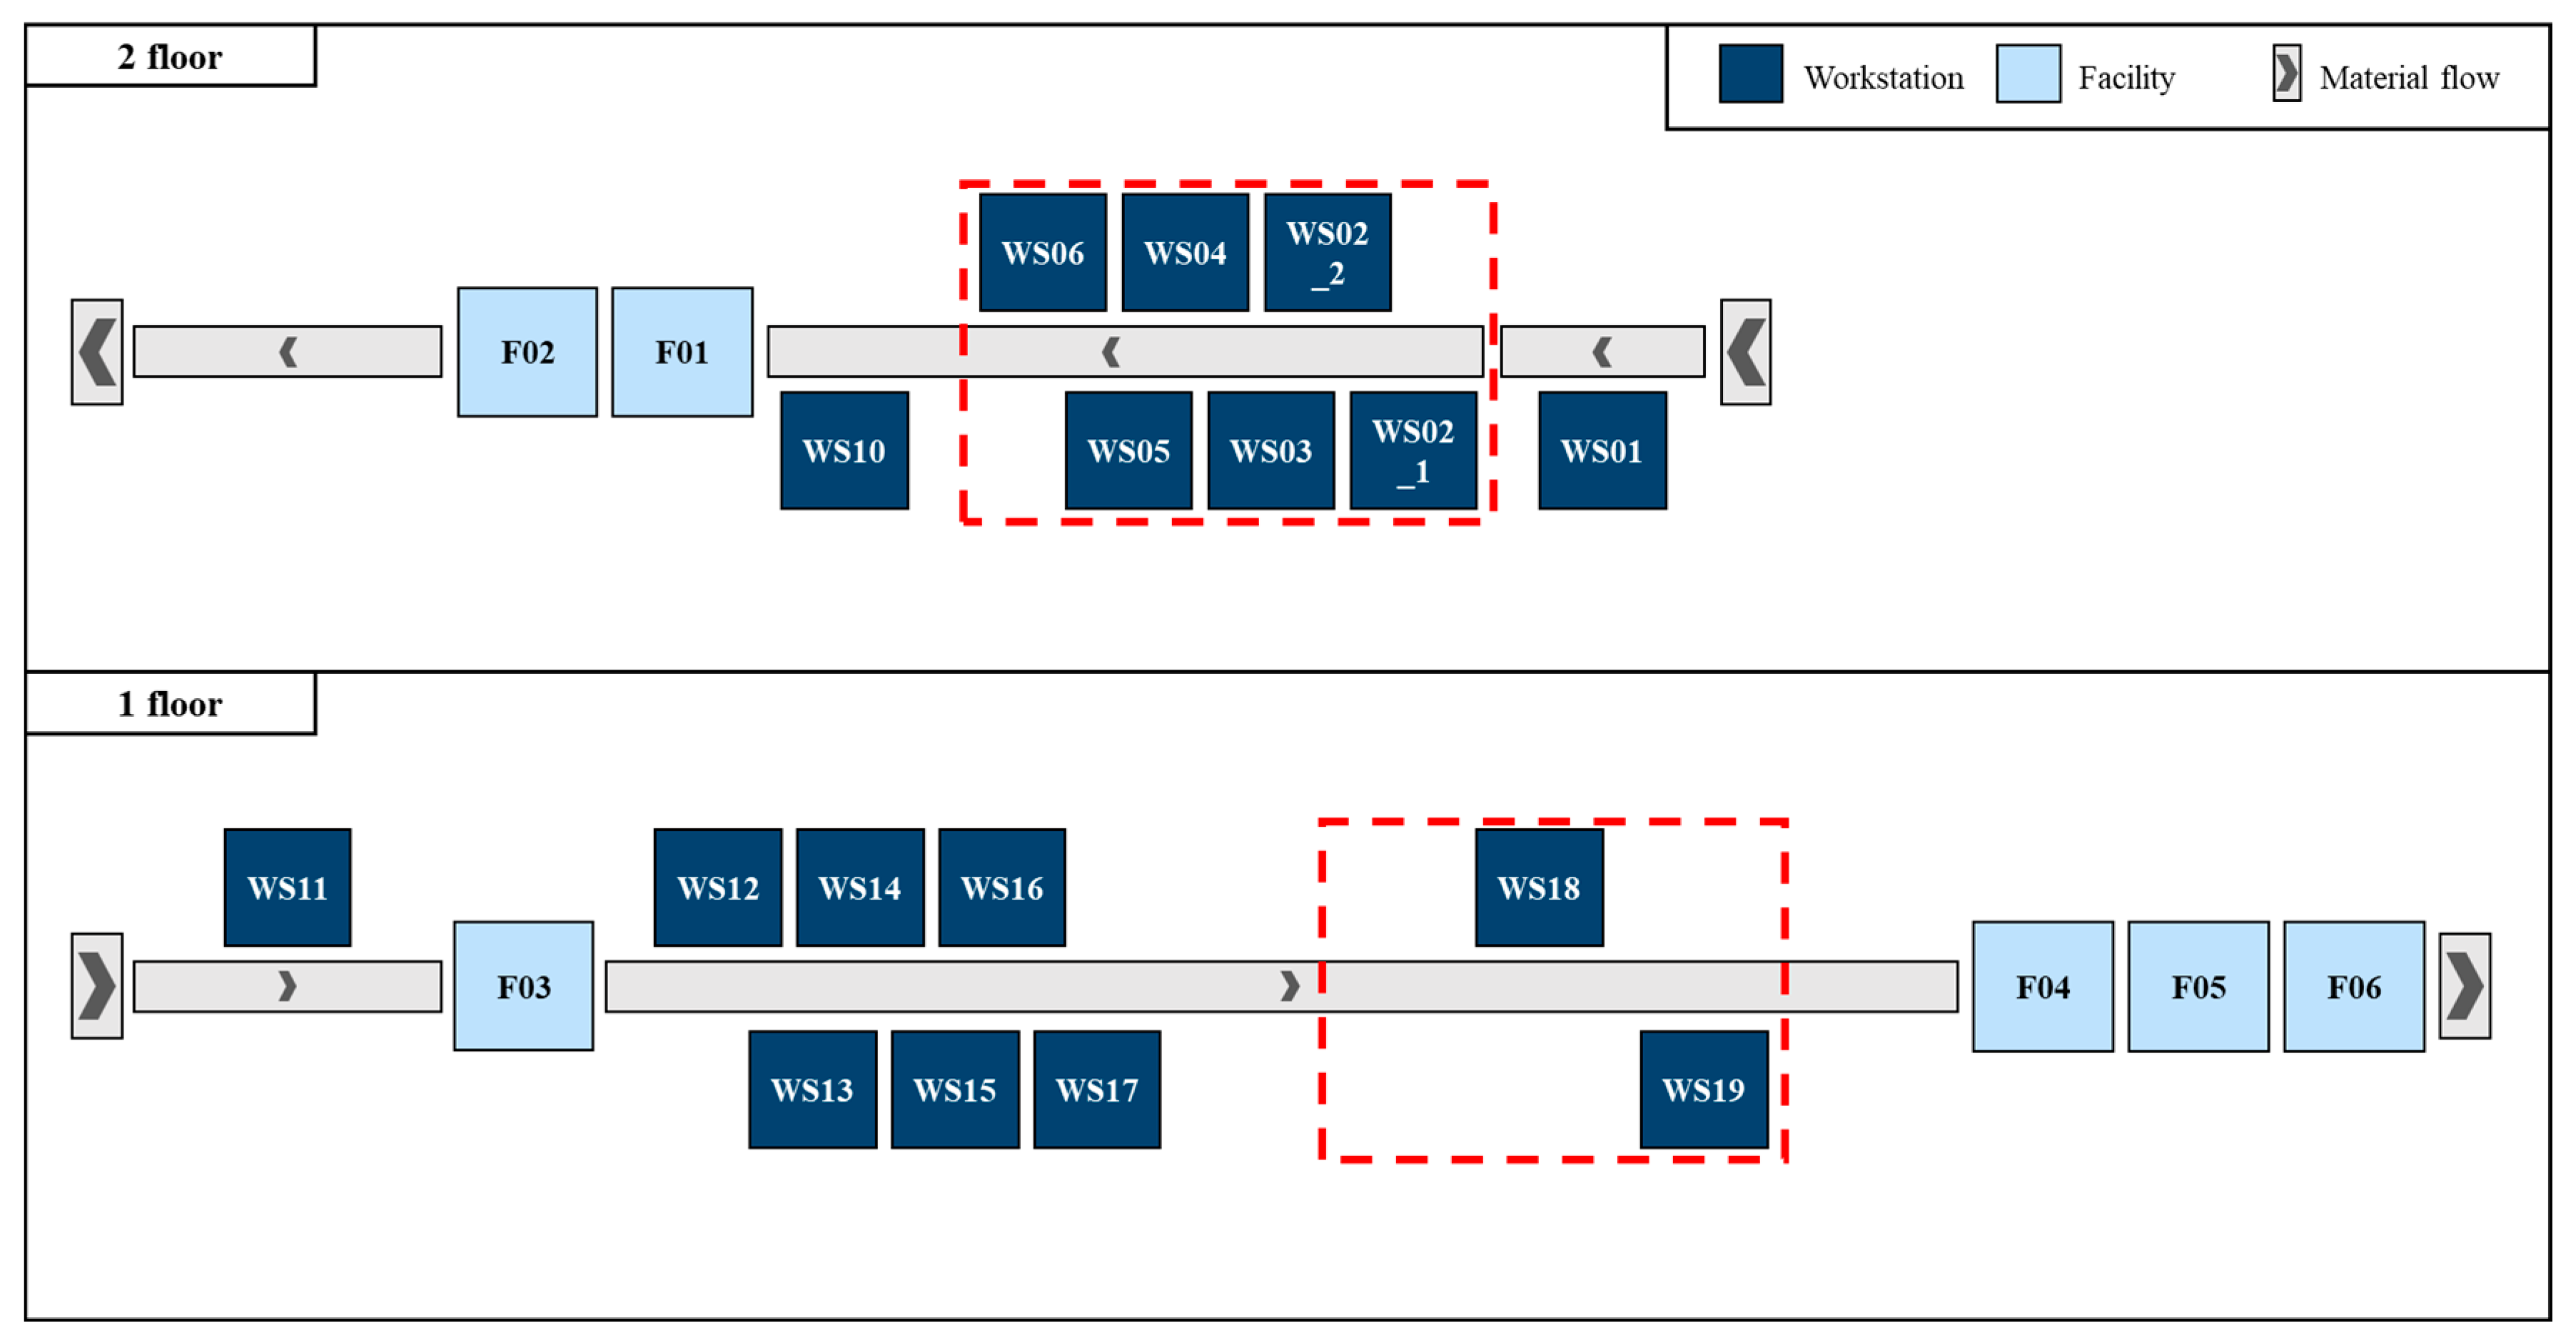
4.2.2. Experiment 2: Line Configuration and Layout Optimization

In Experiment 2, the line configuration and layout were optimized using the RL-based algorithm explained in Section 3.3.2. After the process and sequence optimization, as in Experiment 1, the manufacturing resources were compressed, and the number of workstations was decreased, which resulted in the availability of the space originally occupied by the workstations. This space could be used to add another workstation or to add the same workstations in series or parallel to improve the total performance of the line. Figure 6 and Figure 7 present the layout images before and after optimization, respectively, and Table 6 compares these two scenarios. In the scenario before optimization, WS07, WS08, WS09, WS20, and WS21 were not occupied, but in the optimized scenario, WS02 was added in parallel, and WS19 and WS20 were moved to have more logistic times. The detailed results are presented in Table 7. In both scenarios, the throughput and TT were slightly reduced compared to the as-is scenario; however, the LOB, working rate, and waiting rate demonstrated performance improvements of more than 10%. When comparing the process-optimized and layout-optimized scenarios, although the performance appeared almost similar in terms of the throughput and TT, the LOB, working rate, and waiting rate were 1.08%, 1.59%, and 0.14% higher, respectively.

5. Conclusions

In recent years, several manufacturing companies have made significant efforts to produce customized products. Specifically, as customer demand becomes more dynamic, production and products become more diverse, and product changes and manufacturing design changes also become more frequent. In such cases, insufficient verification in the manufacturing design phase leads to problems such as process redesign and layout changes, which lead to reduced production efficiencies. Therefore, systems that can pre-validate and allow accurate and reliable analysis in the manufacturing design phase are needed; these systems must also be capable of optimizing the variations in production lines in real time. Thus, DT technology has been attracting attention as a qualified system. However, DT has been studied a lot in product design and facility prognostics and management fields. Research on the system framework for utilizing DT and optimizing and analyzing through DT in complex manufacturing systems with continuous processes such as production lines is insufficient.
In this paper, we proposed a DT-based analysis and optimization system that supports the real-time analysis of manufacturing designs and variations in processes and work configurations. The proposed system also supports the optimization of manufacturing scenarios and derives optimal alternatives that allow engineers to make decisions more quickly and quantitatively. The framework and operational procedures for this system are outlined, and algorithms for optimization and actual DT applications are designed and implemented. Finally, by applying the DT application to a manufacturing company, as an industrial case study, the usability and effectiveness of the system are verified through simulation, analysis, evaluation, and optimization of the designed production line. This study suggests an approach to objectively optimize and analyze based on the data and model, in contrast to existing manufacturing design methodologies that rely on the engineer’s knowledge and experience, and reflects and corrects abnormalities during operation. This study also suggests a DT-combined methodology for modeling a learning environment for RL that enable faster and more accurate improvements in the performance of RL.
For the future work of this study, extending proposed framework and system to an advanced DT, integrated with manufacturing operational data, will create diagnostic, analytical, predictive, and optimization systems and will reflect various situations occurring in the manufacturing field in real time.

Author Contributions

Conceptualization, D.L., J.Y. and S.-D.N.; methodology, D.L., J.Y., K.-Y.C. and J.C.; software, D.L., J.Y., K.-Y.C. and J.C.; validation, D.L.; formal analysis, D.L.; writing—original draft preparation, D.L. and J.Y.; resources, C.-K.K. and S.N.; writing—review and editing, D.L. and S.-D.N.; visualization, D.L.; supervision, S.-D.N.; project administration, S.-D.N.; All authors have read and agreed to the published version of the manuscript.

Funding

This study was supported by the Institute of Information and Communications Technology Planning and Evaluation (IITP) grant funded by the Korean government (MSIT) (No. 2022-0-00866, Development of cyber-physical manufacturing base technology that supports high-fidelity and distributed simulations for large-scalability) and by the Smart Manufacturing Innovation R and D project funded by the Korea Ministry of SMEs and Startups in 2022 (Project No. RS-2022-00140261).

Data Availability Statement

Not applicable.

Conflicts of Interest

The authors declare that they have no conflict of interest.

References

  1. Ling, S.; Guo, D.; Rong, Y.; Huang, G.Q. Real-time data-driven synchronous reconfiguration of human-centric smart assembly cell line under graduation intelligent manufacturing system. J. Manuf. Syst. 2022, 65, 378–390. [Google Scholar] [CrossRef]
  2. Georgiadis, P.; Michaloudis, C. Real-time production planning and control system for job-shop manufacturing: A system dynamics analysis. Eur. J. Oper. Res. 2012, 216, 94–104. [Google Scholar] [CrossRef]
  3. Davis, J.; Edgar, T.; Porter, J.; Bernaden, J.; Sarli, M. Smart manufacturing, manufacturing intelligence and demand-dynamic performance. Comput. Chem. Eng. 2012, 47, 145–156. [Google Scholar] [CrossRef]
  4. Dequeant, K.; Vialletelle, P.; Lemaire, P.; Espinouse, M.L. A literature review on variability in semiconductor manufacturing: The next forward leap to Industry 4.0. In Proceedings of the 2016 Winter Simulation Conference (WSC), Washington, DC, USA, 11–14 December 2016; pp. 2598–2609. [Google Scholar]
  5. Mourtzis, D.; Doukas, M. Decentralized manufacturing systems review: Challenges and outlook. In Robust Manufacturing Control; Springer: Berlin/Heidelberg, Germany, 2013; pp. 355–369. [Google Scholar]
  6. Koren, Y.; Gu, X.; Guo, W. Reconfigurable manufacturing systems: Principles, design, and future trends. Front. Mech. Eng. 2018, 13, 121–136. [Google Scholar] [CrossRef] [Green Version]
  7. Hasan, F.; Jain, P.K.; Kumar, D. Service level as performance index for reconfigurable manufacturing system involving multiple part families. Procedia Eng. 2014, 69, 814–821. [Google Scholar] [CrossRef] [Green Version]
  8. Park, K.T.; Yang, J.; Noh, S.D. VREDI: Virtual representation for a digital twin application in a work-center-level asset administration shell. J. Intell. Manuf. 2021, 32, 501–544. [Google Scholar] [CrossRef]
  9. Wiktorsson, M.; Do Noh, S.; Bellgran, M.; Hanson, L. Smart Factories: South Korean and Swedish examples on manufacturing settings. Procedia Manuf. 2018, 25, 471–478. [Google Scholar] [CrossRef]
  10. Hankel, M.; Rexroth, B. The reference architectural model industrie 4.0 (rami 4.0). ZVEI 2015, 2, 4–9. [Google Scholar]
  11. Tao, F.; Cheng, J.; Qi, Q.; Zhang, M.; Zhang, H.; Sui, F. Digital twin-driven product design, manufacturing and service with big data. Int. J. Adv. Manuf. Technol. 2018, 94, 3563–3576. [Google Scholar] [CrossRef]
  12. Liu, Q.; Zhang, H.; Leng, J.; Chen, X. Digital twin-driven rapid individualised designing of automated flow-shop manufacturing system. Int. J. Prod. Res. 2019, 57, 3903–3919. [Google Scholar] [CrossRef]
  13. Schluse, M.; Priggemeyer, M.; Atorf, L.; Rossmann, J. Experimentable digital twins-Streamlining simulation-based systems engineering for industry 4.0. IEEE Trans. Ind. Inform. 2018, 14, 1722–1731. [Google Scholar] [CrossRef]
  14. McLean, C.; Leong, S. The expanding role of simulation in future manufacturing. In Proceedings of the 2001 Winter Simulation Conference (Cat. No. 01CH37304), Arlington, VA, USA, 9–12 December 2001; Volume 2, pp. 1478–1486. [Google Scholar]
  15. Monostori, L.; Kádár, B.; Bauernhansl, T.; Kondoh, S.; Kumara, S.; Reinhart, G.; Ueda, K. Cyber-physical systems in manufacturing. Cirp Ann. 2016, 65, 621–641. [Google Scholar] [CrossRef]
  16. Lee, S.; Park, S.; Yang, J.; Son, Y.H.; Ko, M.J.; Lim, J.W.; Jeon, Y. Modeling & Simulation-Based Assessments of Reconfigurability and Productivity for Automotive Module Assembly Lines. J. Comput. Des. Eng 2019, 24, 233–247. [Google Scholar]
  17. Kang, H.S.; Lee, J.Y.; Choi, S.; Kim, H.; Park, J.H.; Son, J.Y.; Noh, S.D. Smart manufacturing: Past research, present findings, and future directions. Int. J. Precis. Eng. Manuf. -Green Technol. 2016, 3, 111–128. [Google Scholar] [CrossRef]
  18. Son, Y.H.; Kim, G.Y.; Kim, H.C.; Jun, C.; Noh, S.D. Past, present, and future research of digital twin for smart manufacturing. J. Comput. Des. Eng. 2022, 9, 1–23. [Google Scholar] [CrossRef]
  19. Park, K.T.; Jeon, S.W.; Noh, S.D. Digital twin application with horizontal coordination for reinforcement-learning-based production control in a re-entrant job shop. Int. J. Prod. Res. 2022, 60, 2151–2167. [Google Scholar] [CrossRef]
  20. Li, S.; Wang, J.; Rong, J.; Wei, W. A digital twin framework for product to-be-designed analysis based on operation data. Procedia CIRP 2022, 109, 179–184. [Google Scholar] [CrossRef]
  21. Leng, J.; Chen, Z.; Sha, W.; Lin, Z.; Lin, J.; Liu, Q. Digital twins-based flexible operating of open architecture production line for individualized manufacturing. Adv. Eng. Inform. 2022, 53, 101676. [Google Scholar] [CrossRef]
  22. Leng, J.; Wang, D.; Shen, W.; Li, X.; Liu, Q.; Chen, X. Digital twins-based smart manufacturing system design in Industry 4.0: A review. J. Manuf. Syst. 2021, 60, 119–137. [Google Scholar] [CrossRef]
  23. Cheng, Y.; Zhang, Y.; Ji, P.; Xu, W.; Zhou, Z.; Tao, F. Cyber-physical integration for moving digital factories forward towards smart manufacturing: A survey. Int. J. Adv. Manuf. Technol. 2018, 97, 1209–1221. [Google Scholar] [CrossRef]
  24. Grieves, M. Digital twin: Manufacturing excellence through virtual factory replication. White Pap. 2014, 1, 1–7. [Google Scholar]
  25. Tao, F.; Cheng, J.; Qi, Q. IIHub: An industrial Internet-of-Things hub toward smart manufacturing based on cyber-physical system. IEEE Trans. Ind. Inform. 2017, 14, 2271–2280. [Google Scholar] [CrossRef]
  26. Liao, Y.; Loures, E.D.F.R.; Deschamps, F. Industrial Internet of Things: A systematic literature review and insights. IEEE Internet Things J. 2018, 5, 4515–4525. [Google Scholar] [CrossRef]
  27. Grieves, M.W. Product lifecycle management: The new paradigm for enterprises. Int. J. Prod. Dev. 2005, 2, 71–84. [Google Scholar] [CrossRef]
  28. Liu, J.; Zhou, H.; Liu, X.; Tian, G.; Wu, M.; Cao, L.; Wang, W. Dynamic evaluation method of machining process planning based on digital twin. IEEE Access 2019, 7, 19312–19323. [Google Scholar] [CrossRef]
  29. Yang, W.; Tan, Y.; Yoshida, K.; Takakuwa, S. Digital twin-driven simulation for a cyber-physical system in Industry 4.0. In DAAAM International Scientific Book; DAAAM International: Vienna, Austria, 2017; pp. 227–234. [Google Scholar]
  30. Son, Y.H.; Park, K.T.; Lee, D.; Jeon, S.W.; Do Noh, S. Digital twin–based cyber-physical system for automotive body production lines. Int. J. Adv. Manuf. Technol. 2021, 115, 291–310. [Google Scholar] [CrossRef]
  31. Park, K.T.; Lee, D.; Noh, S.D. Operation procedures of a work-center-level digital twin for sustainable and smart manufacturing. Int. J. Precis. Eng. Manuf. -Green Technol. 2020, 7, 791–814. [Google Scholar] [CrossRef]
  32. Grieves, M.; Vickers, J. Digital twin: Mitigating unpredictable, undesirable emergent behavior in complex systems. In Transdisciplinary Perspectives on Complex Systems; Springer: Berlin/Heidelberg, Germany, 2017; pp. 85–113. [Google Scholar]
  33. Alam, K.M.; El Saddik, A. C2PS: A digital twin architecture reference model for the cloud-based cyber-physical systems. IEEE Access 2017, 5, 2050–2062. [Google Scholar] [CrossRef]
  34. Uhlemann TH, J.; Schock, C.; Lehmann, C.; Freiberger, S.; Steinhilper, R. The digital twin: Demonstrating the potential of real time data acquisition in production systems. Procedia Manuf. 2017, 9, 113–120. [Google Scholar] [CrossRef]
  35. Park, K.T.; Im, S.J.; Kang, Y.S.; Noh, S.D.; Kang, Y.T.; Yang, S.G. Service-oriented platform for smart operation of dyeing and finishing industry. Int. J. Comput. Integr. Manuf. 2019, 32, 307–326. [Google Scholar] [CrossRef]
  36. Park, K.T.; Nam, Y.W.; Lee, H.S.; Im, S.J.; Noh, S.D.; Son, J.Y.; Kim, H. Design and implementation of a digital twin application for a connected micro smart factory. Int. J. Comput. Integr. Manuf. 2019, 32, 596–614. [Google Scholar] [CrossRef]
  37. Gabor, T.; Belzner, L.; Kiermeier, M.; Beck, M.T.; Neitz, A. A simulation-based architecture for smart cyber-physical systems. In Proceedings of the 2016 IEEE International Conference on Autonomic Computing (ICAC), Wuerzburg, Germany, 17–22 July 2016; pp. 374–379. [Google Scholar]
  38. Park, K.T.; Son, Y.H.; Ko, S.W.; Noh, S.D. Digital twin and reinforcement learning-based resilient production control for micro smart factory. Appl. Sci. 2021, 11, 2977. [Google Scholar] [CrossRef]
  39. Wang, Y.; Wang, X.; Liu, A. Digital twin-driven supply chain planning. Procedia CIRP 2020, 93, 198–203. [Google Scholar] [CrossRef]
  40. Park, K.T.; Lee, J.; Kim, H.J.; Noh, S.D. Digital twin-based cyber physical production system architectural framework for personalized production. Int. J. Adv. Manuf. Technol. 2020, 106, 1787–1810. [Google Scholar] [CrossRef]
  41. Velosa, A.; Natis, Y.; Lheureux, B. Use the IoT Platform Reference Model to Plan Your IoT Business Solutions; Gartner Research: Stamford, CT, USA, 2016. [Google Scholar]
  42. Jeong, D.Y.; Baek, M.S.; Lim, T.B.; Kim, Y.W.; Kim, S.H.; Lee, Y.T.; Lee, I.B. Digital Twin: Technology Evolution Stages and Implementation Layers with Technology Elements. IEEE Access 2022, 10, 52609–52620. [Google Scholar] [CrossRef]
  43. Wang, Q.; Chatwin, C.R. Key issues and developments in modelling and simulation-based methodologies for manufacturing systems analysis, design and performance evaluation. Int. J. Adv. Manuf. Technol. 2005, 25, 1254–1265. [Google Scholar] [CrossRef]
  44. D’addona, D.M.; Teti, R. Genetic algorithm-based optimization of cutting parameters in turning processes. Procedia Cirp 2013, 7, 323–328. [Google Scholar] [CrossRef] [Green Version]
  45. Watkins, C.J.; Dayan, P. Q-learning. Mach. Learn. 1992, 8, 279–292. [Google Scholar] [CrossRef]
  46. Wang, Z.; Schaul, T.; Hessel, M.; Hasselt, H.; Lanctot, M.; Freitas, N. Dueling network architectures for deep reinforcement learning. In Proceedings of the 33rd International Conference on International Conference on Machine Learning, New York, NY, USA, 19–24 June 2016; pp. 1995–2003. [Google Scholar]
Figure 1. Framework for the DT-based analysis and optimization system.
Machines 10 01147 g001
Figure 2. Operation procedure of DT application.
Machines 10 01147 g002
Figure 3. DT application implementation with the interface module.
Machines 10 01147 g003
Figure 4. Example of the implemented DT simulation module and simulation model.
Machines 10 01147 g004
Figure 5. Layout image of the as-is scenario.
Machines 10 01147 g005
Figure 6. Layout image before optimization.
Machines 10 01147 g006
Figure 7. Layout image after optimization.
Machines 10 01147 g007
Table 1. Characteristics of a five level DT.
Level of DTDescription
Level 1Mirroring: duplicating a physical object into a DT
Level 2Monitoring: monitoring and controlling the physical object based on the analysis of the DT
Level 3Modeling and Simulation: optimizing the physical object based on the simulation results of the DT
Level 4Federation: configuring federated DTs, optimizing complex physical objects, and interoperating federated DTs and complex objects
Level 5Autonomous: autonomously recognizing and solving problems in federated DTs and optimizing physical objects based on federated DT solutions
Table 2. Information on the development environment for DT application.
ComponentItemContents
Interface moduleDevelopment environment
Programming language
Microsoft Office Excel
Visual Basic for Applications
DT simulation moduleDevelopment environment
Programming language
Siemens Plant Simulation 16.1
SimTalk 2.0
Optimization moduleDevelopment environment
Programming language
PyCharm 2022.1.2
Python 3.10.7
Table 3. Process and sequence information of the as-is scenario.
First FloorSecond Floor
WS 1
Code
Work
Number
Work
Time (s)
Cycle
Time (s)
WS 1
Code
Work
Number
Work
Time (s)
Cycle
Time (s)
WS0116.00019.774WS11218.0008.000
23.500 WS122217.67617.676
33.500 WS13233.00011.773
42.000 242.000
54.774 256.773
WS0269.00011.000WS142611.00020.546
72.000 279.546
WS0387.0007.000WS15281.00015.773
WS0498.9998.999 2914.773
WS05104.0009.225WS16306.00014.870
115.225 318.870
WS06121.0009.500WS173210.00020.773
132.500 3310.773
146.000 WS18345.0005.000
WS07157.00010.000WS19353.0006.000
163.000 363.000
WS081710.00010.000WS20373.00012.000
WS091814.00014.000 386.000
WS10197.00016.451 393.000
209.451 WS21405.41918.257
4112.838
1 Workstation.
Table 4. Results of Experiment 1.
KPIAs-Is
scenario
Tact Time
Optimal
Scenario
LOB 1
Optimal
Scenario
Working Rate
Optimal
Scenario
Best
Scenario
(Improvement)
Throughput (ea)10981186113211201186
(+8.01%)
Tact time (s)25.7723.8725.0025.2723.87
(+7.37%)
Line of balance (%)61.1278.4983.3226.3778.49
(+17.37%)
Working rate (%)36.1843.2754.8682.2143.27
(+7.09%)
Waiting rate (%)37.3826.5528.0755.6826.55
(+10.83%)
Blocking rate (%)26.4430.1817.0614.9330.18
(−3.74%)
1 Line of balance.
Table 5. Comparison of the as-is scenario and best scenario.
As-Is ScenarioBest Scenario
WS 1 CodeWork NumberCycle Time (s)WS 1 CodeWork NumberCycle Time (s)
WS011, 2, 3, 4, 519.774WS015, 1714.774
WS026, 711.000WS024, 6, 1518.000
WS0387.000WS033, 9, 1117.724
WS0498.999WS042, 7, 8, 12, 1616.500
WS0510, 119.225WS0514, 1913.000
WS0612, 13, 149.500WS0610, 1818.000
WS0715, 1610.000WS071, 138.500
WS081710.000WS08--
WS091814.000WS09--
WS1019, 2016.451WS10209.451
WS11218.000WS11218.000
WS122217.676WS122217.676
WS1323, 24, 2511.773WS1324, 33, 3818.773
WS1426, 2720.546WS1423, 28, 36, 3910.000
WS1528, 2915.773WS152914.773
WS1630, 3114.870WS1626, 35, 3717.000
WS1732, 3320.773WS1725, 2716.319
WS18345.000WS1830, 4118.838
WS1935, 366.000WS1931, 3218.870
WS2037, 38, 3912.000WS2034, 4010.419
WS2140, 4118.257WS21--
1 Workstation.
Table 6. Comparison of the layouts before and after optimization.
Before OptimizationAfter Optimization
WS 1 CodeWork NumberCycle Time (s)WS 1 CodeWork NumberCycle Time (s)
WS013, 4, 5, 12, 1518.274WS013, 4, 5, 12, 1518.274
WS027, 9, 10, 13, 1620.499WS02_17, 9, 10, 13, 1620.499
WS0317, 1917.000WS02_27, 9, 10, 13, 1620.499
WS042, 6, 1418.500WS0317, 1917.000
WS051, 1820.000WS042, 6, 1418.500
WS068, 1112.225WS051, 1820.000
WS07--WS068, 1112.225
WS08-----
WS09-----
WS10209.451WS10209.451
WS11218.000WS11218.000
WS122217.676WS122217.676
WS1323, 28, 31, 34, 3520.870WS1323, 28, 31, 34, 3520.870
WS1429, 36, 3720.773WS1429, 36, 3720.773
WS1525, 2617.773WS1525, 2617.773
WS1624, 30, 39, 4016.419WS1624, 30, 39, 4016.419
WS1732, 3816.000WS1732, 3816.000
WS184112.838---
WS1927, 3320.319---
WS20--WS184112.838
WS21--WS1927, 3320.319
1 Workstation.
Table 7. Results of Experiment 2.
KPIAs-Is
Scenario
Before Optimization
(Improvement)
After Optimization
(Improvement)
Throughput (ea)10981094
(−0.36%)
1093
(−0.46%)
Tact time (s)25.7726.30
(−2.06%)
26.33
(−2.17%)
Line of balance (%)61.1279.84
(+18.72%)
80.92
(+19.80%)
Working rate (%)36.1847.45
(+11.27%)
49.04
(+12.86%)
Waiting rate (%)37.3826.33
(+11.05%)
26.19
(+11.19%)
Blocking rate (%)26.4426.21
(+0.23%)
24.77
(+1.67%)
Space utilization (%)100.0076.19
(+23.81%)
80.95
(+19.05%)
Publisher’s Note: MDPI stays neutral with regard to jurisdictional claims in published maps and institutional affiliations.

