Article

Fertilization Control System Research in Orchard Based on the PSO-BP-PID Control Algorithm

1
College of Engineering, China Agricultural University, Beijing 100107, China
2
Key Laboratory of Modern Agricultural Engineering, Xinjiang Uygur Autonomous Region, Alar 843300, China
3
College of Mechanical and Electrical Engineering, Tarim University, Alar 843300, China
4
College of Agriculture, Tarim University, Alar 843300, China
*
Author to whom correspondence should be addressed.
These authors contributed equally to this work.
Machines 2022, 10(11), 982; https://doi.org/10.3390/machines10110982
Submission received: 7 October 2022 / Revised: 24 October 2022 / Accepted: 25 October 2022 / Published: 27 October 2022
(This article belongs to the Topic Designs and Drive Control of Electromechanical Machines)

Abstract

:
In order to improve the precision of the variable-rate fertilization system in orchards, this paper conducted a simulation by MATLAB and experimental research based on a variable-rate fertilization experiment platform. The variable-rate fertilization experimental platform was mainly composed of a power supply, DC motors, a PPC-15A1 on-board computer that contains a PCI8932 PC-DAQ, speed sensors, fertilizer dischargers, and a NAV60 module that can receive Beidou Navigation Satellite System positioning data. According to the fertilizer application mechanism of an external grooved wheel fertilizer applicator, the control system model of the variable-rate fertilization driven by the DC motor for orchards was established. A BP neural network adaptive PID controller based on particle swarm optimization (PSO) was proposed to improve the control precision of the system. The step response simulation results by MATLAB show that the overshoot of the BP-PID controller optimized by the PSO algorithm (PSO-BP-PID) is 12.7%, and the adjustment time is 0.557 s. The variable-rate fertilization experiments were conducted, in which the control system was tested by using the PSO-BP-PID controller. The variable fertilizer seeder control system of the Chinese national standard was adopted to evaluate the performance indexes of the system, such as the range of fertilizer amount adjustment, the response time of fertilizer amount adjustment, and the control precision of fertilizer amount. In the variable rate fertilization experiments, the average fertilization errors, respectively, are 1.16% and 1.07%, under the conditions of changing the target fertilization amount and the vehicle speed. The test results are consistent with the simulation results, and the variable-rate fertilization performance parameters are improved.

1. Introduction

Variable-rate fertilization can reduce the harm caused by excessive chemical fertilization and fertilization cost. With the development of precision agriculture, variable-rate fertilization technology has achieved a series of achievements. The key technology for map-based variable-rate application of fertilizer lies in fertilizer should be applied precisely at each location within the field according to a prescription map. Meng, Z.J. et al. proposed a kind of algorithm for a real-time application map identifier relying on machine location [1]. In order to solve the problems of low precision of variable-rate fertilization and uneven fertilization flow of field liquid fertilizer applicator, Bai, J.B. et al. designed a control system of variable-rate fertilization of liquid fertilizer based on beetle antennae, and a search algorithm was proposed [2]. Nitrogen (N) plays a key role in the optimization between corn grain yield and its economic return. Martins, R.N. et al. aimed to evaluate the technical feasibility of a portable chlorophyll meter for recommending an economic dose of N under variable-rate using different threshold values of the nitrogen sufficiency index (NSI) [3]. Variable-rate application (VRA) of agricultural inputs is essential for optimum crop yield. Alameen, A.A. et al. developed a control system for variable-rate application (VRA) of granular fertilizers and evaluated its performance [4]. In order to solve the fertilizer layered problem caused by the different densities of mixed pellet fertilizer, An, X.F. et al. developed a four-element variable-rate fertilization control system [5].
According to the calculation method of fertilization amount, variable-rate fertilization can be divided into the following two types. The first calculates the fertilizer amount according to the variable-rate fertilization chart. Meng, Z.J. et al. developed a variable-rate fertilization operation system based on the prescription chart. The system realized closed-loop control of the hydraulic motor by receiving the fertilization amount control signal from the airborne control terminal in real-time, combining with the current operating speed and width to achieve the purpose of variable-rate fertilization [6]. The second calculates the fertilization amount based on the information on soil nutrients or crops obtained by real-time sensors. Yang, S. et al. proposed the target fertilization method for the Lycium barbarum orchard in China based on the infrared photoelectric sensors and realized the target fertilization [7].
The smaller the discharge error of variable-rate fertilization is, the closer the fertilization amount is to the fertilizer prescription-based soil nutrient distribution. Focusing on the control precision of fertilization amount and response time of fertilization amount adjustment, scholars have carried out control strategy research to improve the system performance. Huai, B.F. et al. used a PID controller based on a BP neural network in variable-rate fertilization systems, and the error of fertilization in the field experiment was 2.52% [8]. Wang, X.C et al. designed a variable topdressing control system for winter wheat based on the fuzzy PID, and the error of fertilizer amount in the field experiment was 9.07% [9]. A solid fertilizer application control system based on incremental PID was designed by Zhang, J.C., and the error of fertilizer amount in the field experiment was 2.84% [10]. Yuan, Q.C. et al. used a PID algorithm to design a hierarchical variable fertilizer control system for orchards, and the error of fertilizer amount in the field experiment was 6.20% [11]. Sun, Y.J. et al. realized variable-rate fertilization by using the discrete incremental PID control algorithm, and the error of fertilizer amount in the field experiment was 3.41% [12].
Precision fertilization can increase yield and quality in an orchard. Precision fertilization can reduce environmental pollution such as soil hardening and provide green pollution-free fruit. In this paper, a control system of variable-rate fertilization in orchards was designed. The positioning information was obtained through the Beidou satellite navigation and positioning system (BDS), and the adaptive PID control strategy of backpropagation (BP) neural network optimized by particle swarm optimization (PSO) was put forward according to the prescription map. The simulation and experimental results show that the control strategy improves the fertilization accuracy of the variable-rate fertilization system. The PSO-BP-PID algorithm in this paper provides a feasible control algorithm for the orchard variable-rate fertilization system according to the needs of chemical fertilizer.

2. Materials and Methods

2.1. Materials

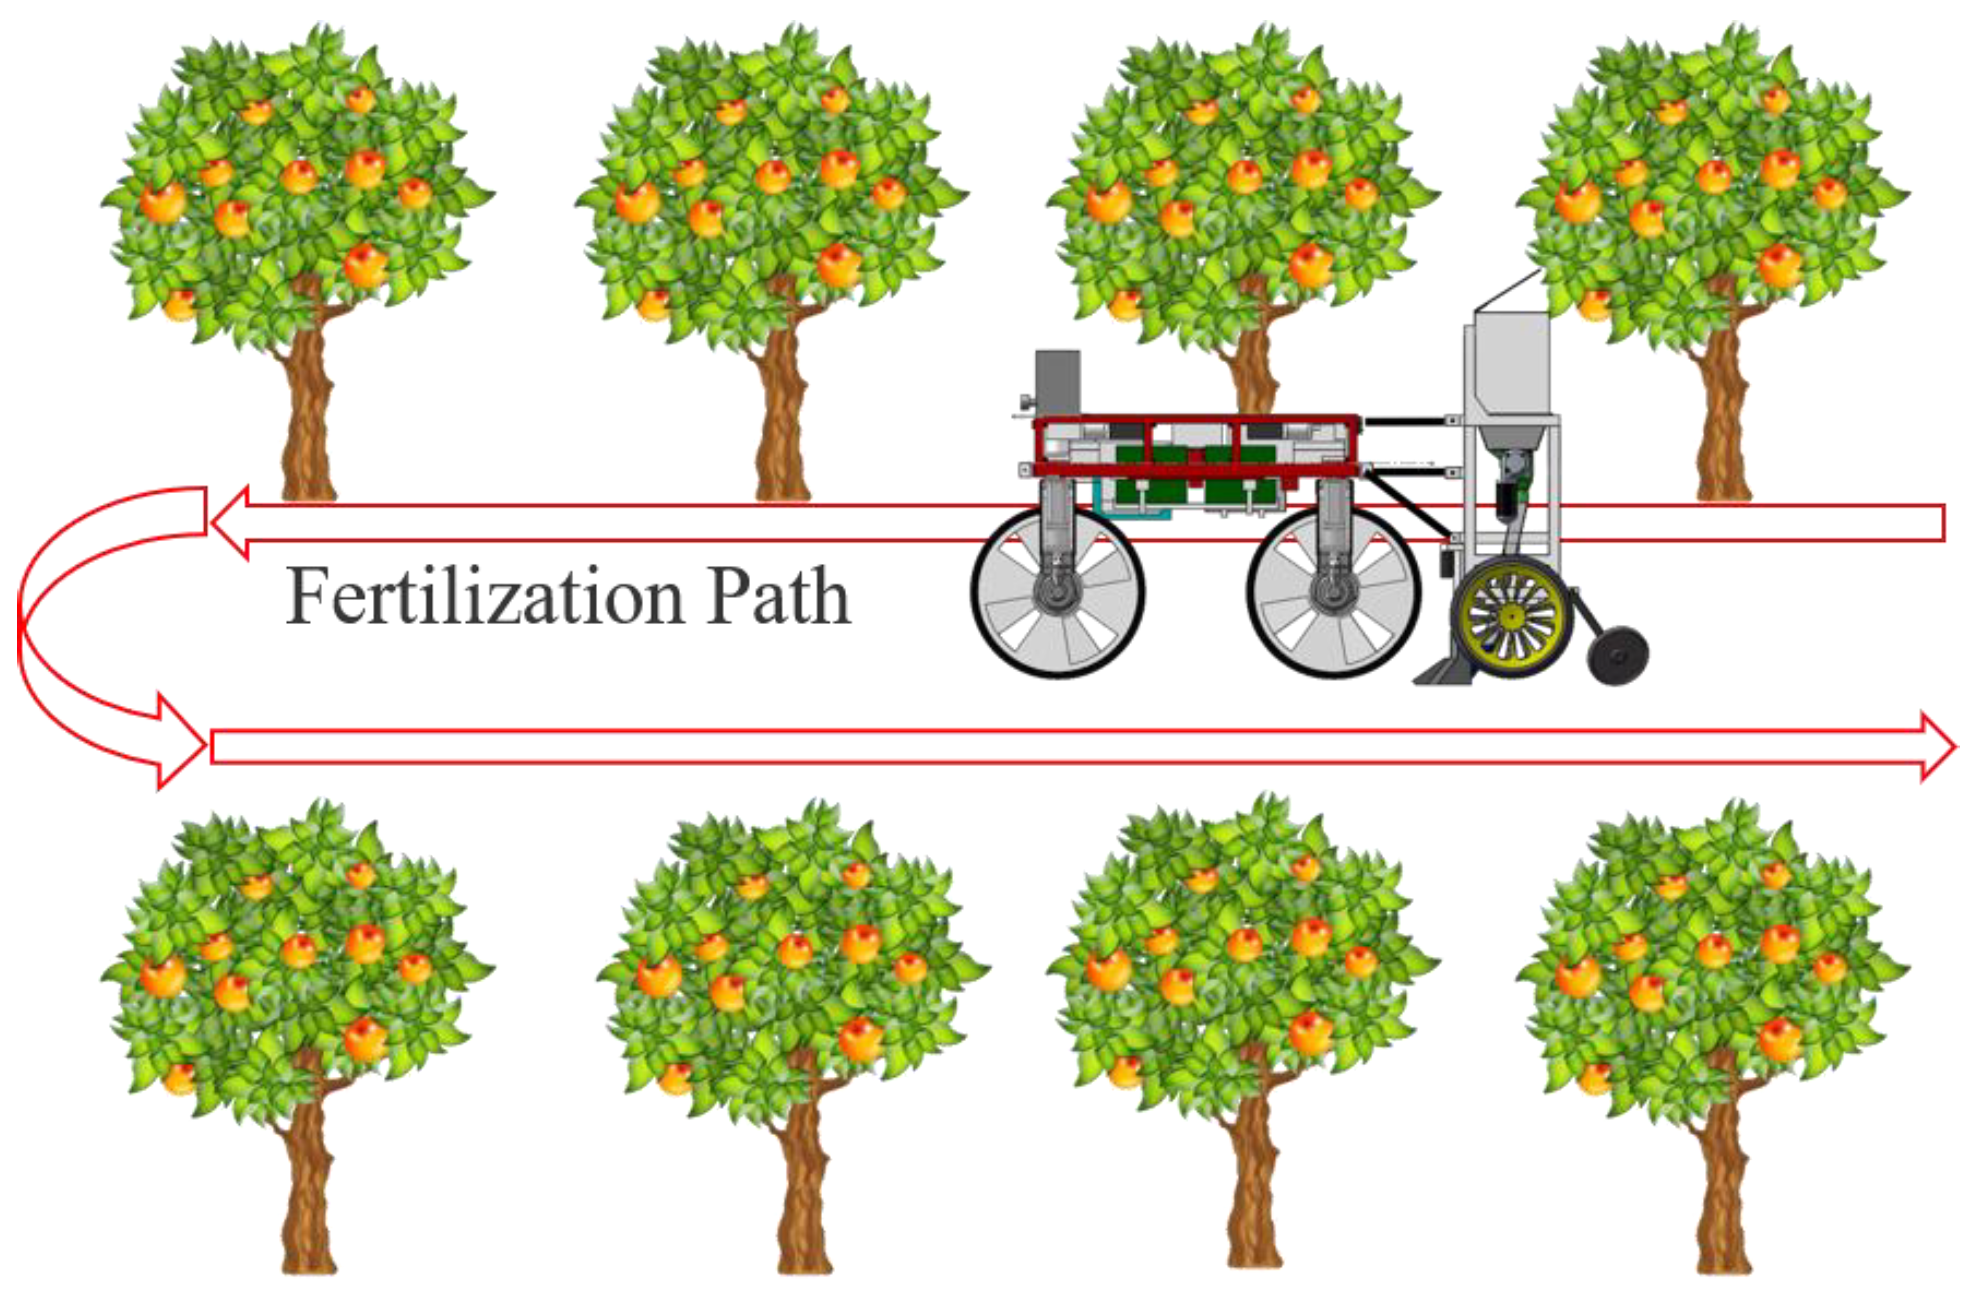
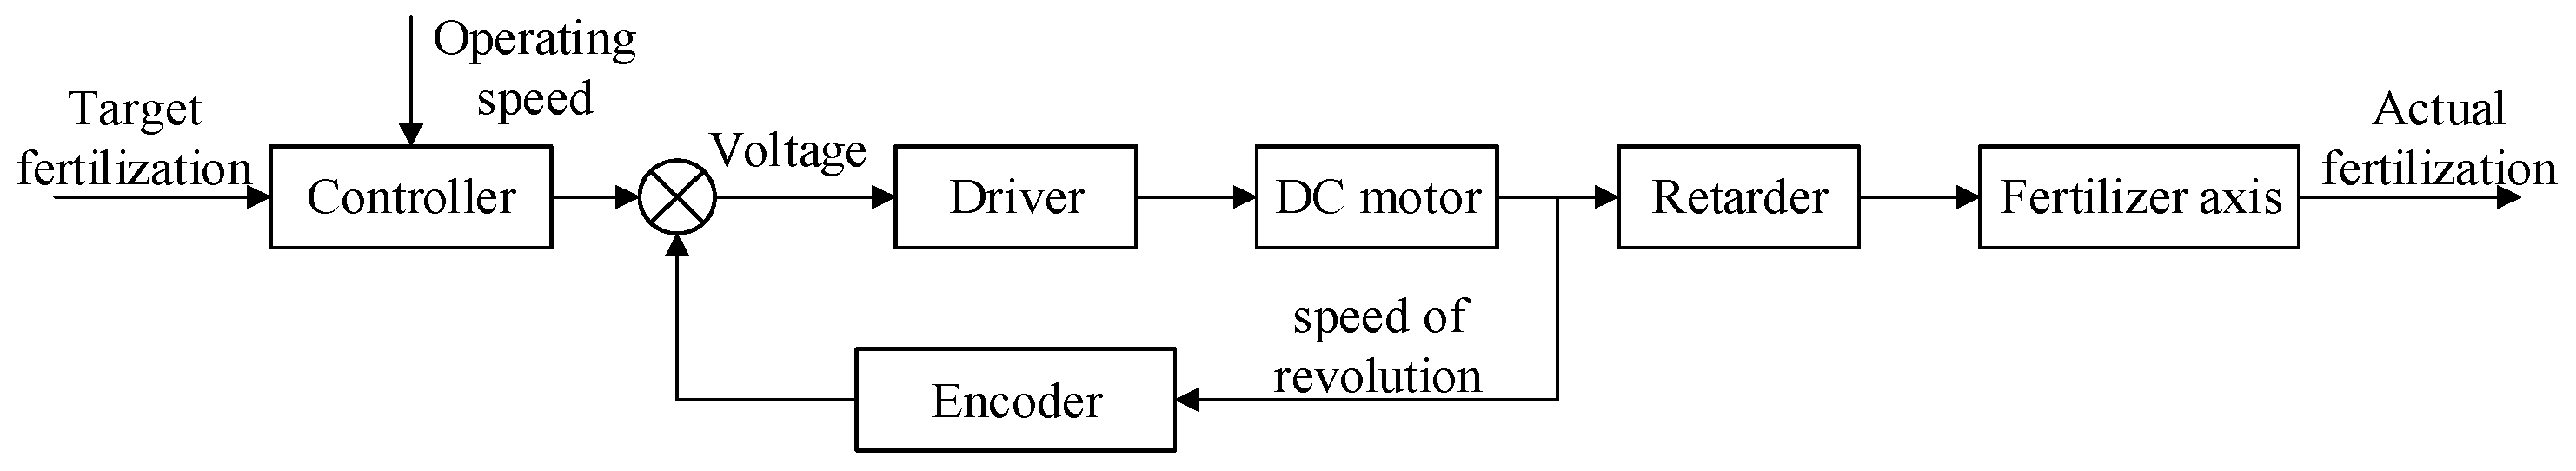
2.1.1. Orchard Fertilization Process

Figure 1 is the schematic diagram of the orchard trenching and fertilization operation. According to the prescription chart, the DC motor is used as the driving element of fertilization, and the control process of variable-rate fertilization is as follows. The longitude and latitude information are collected by GNSS, the target fertilization amount is obtained according to the prescription chart, the current vehicle speed is obtained by the speed sensor, the control system automatically calculates the theoretical speed of the fertilizer discharging motor, and changes the speed of the DC motor, thus changing the fertilizer discharge amount, and realizing variable-rate fertilization control. When fertilizing, the furrow opener ditches near the root of the fruit tree, and the controller controls the fertilizer distributor to discharge fertilizer according to the requirement of the prescription chart. The fertilizer falls into the gully through the fertilizer guide pipe, and then the soil mulcher covers the soil to complete the variable-rate fertilization operation.

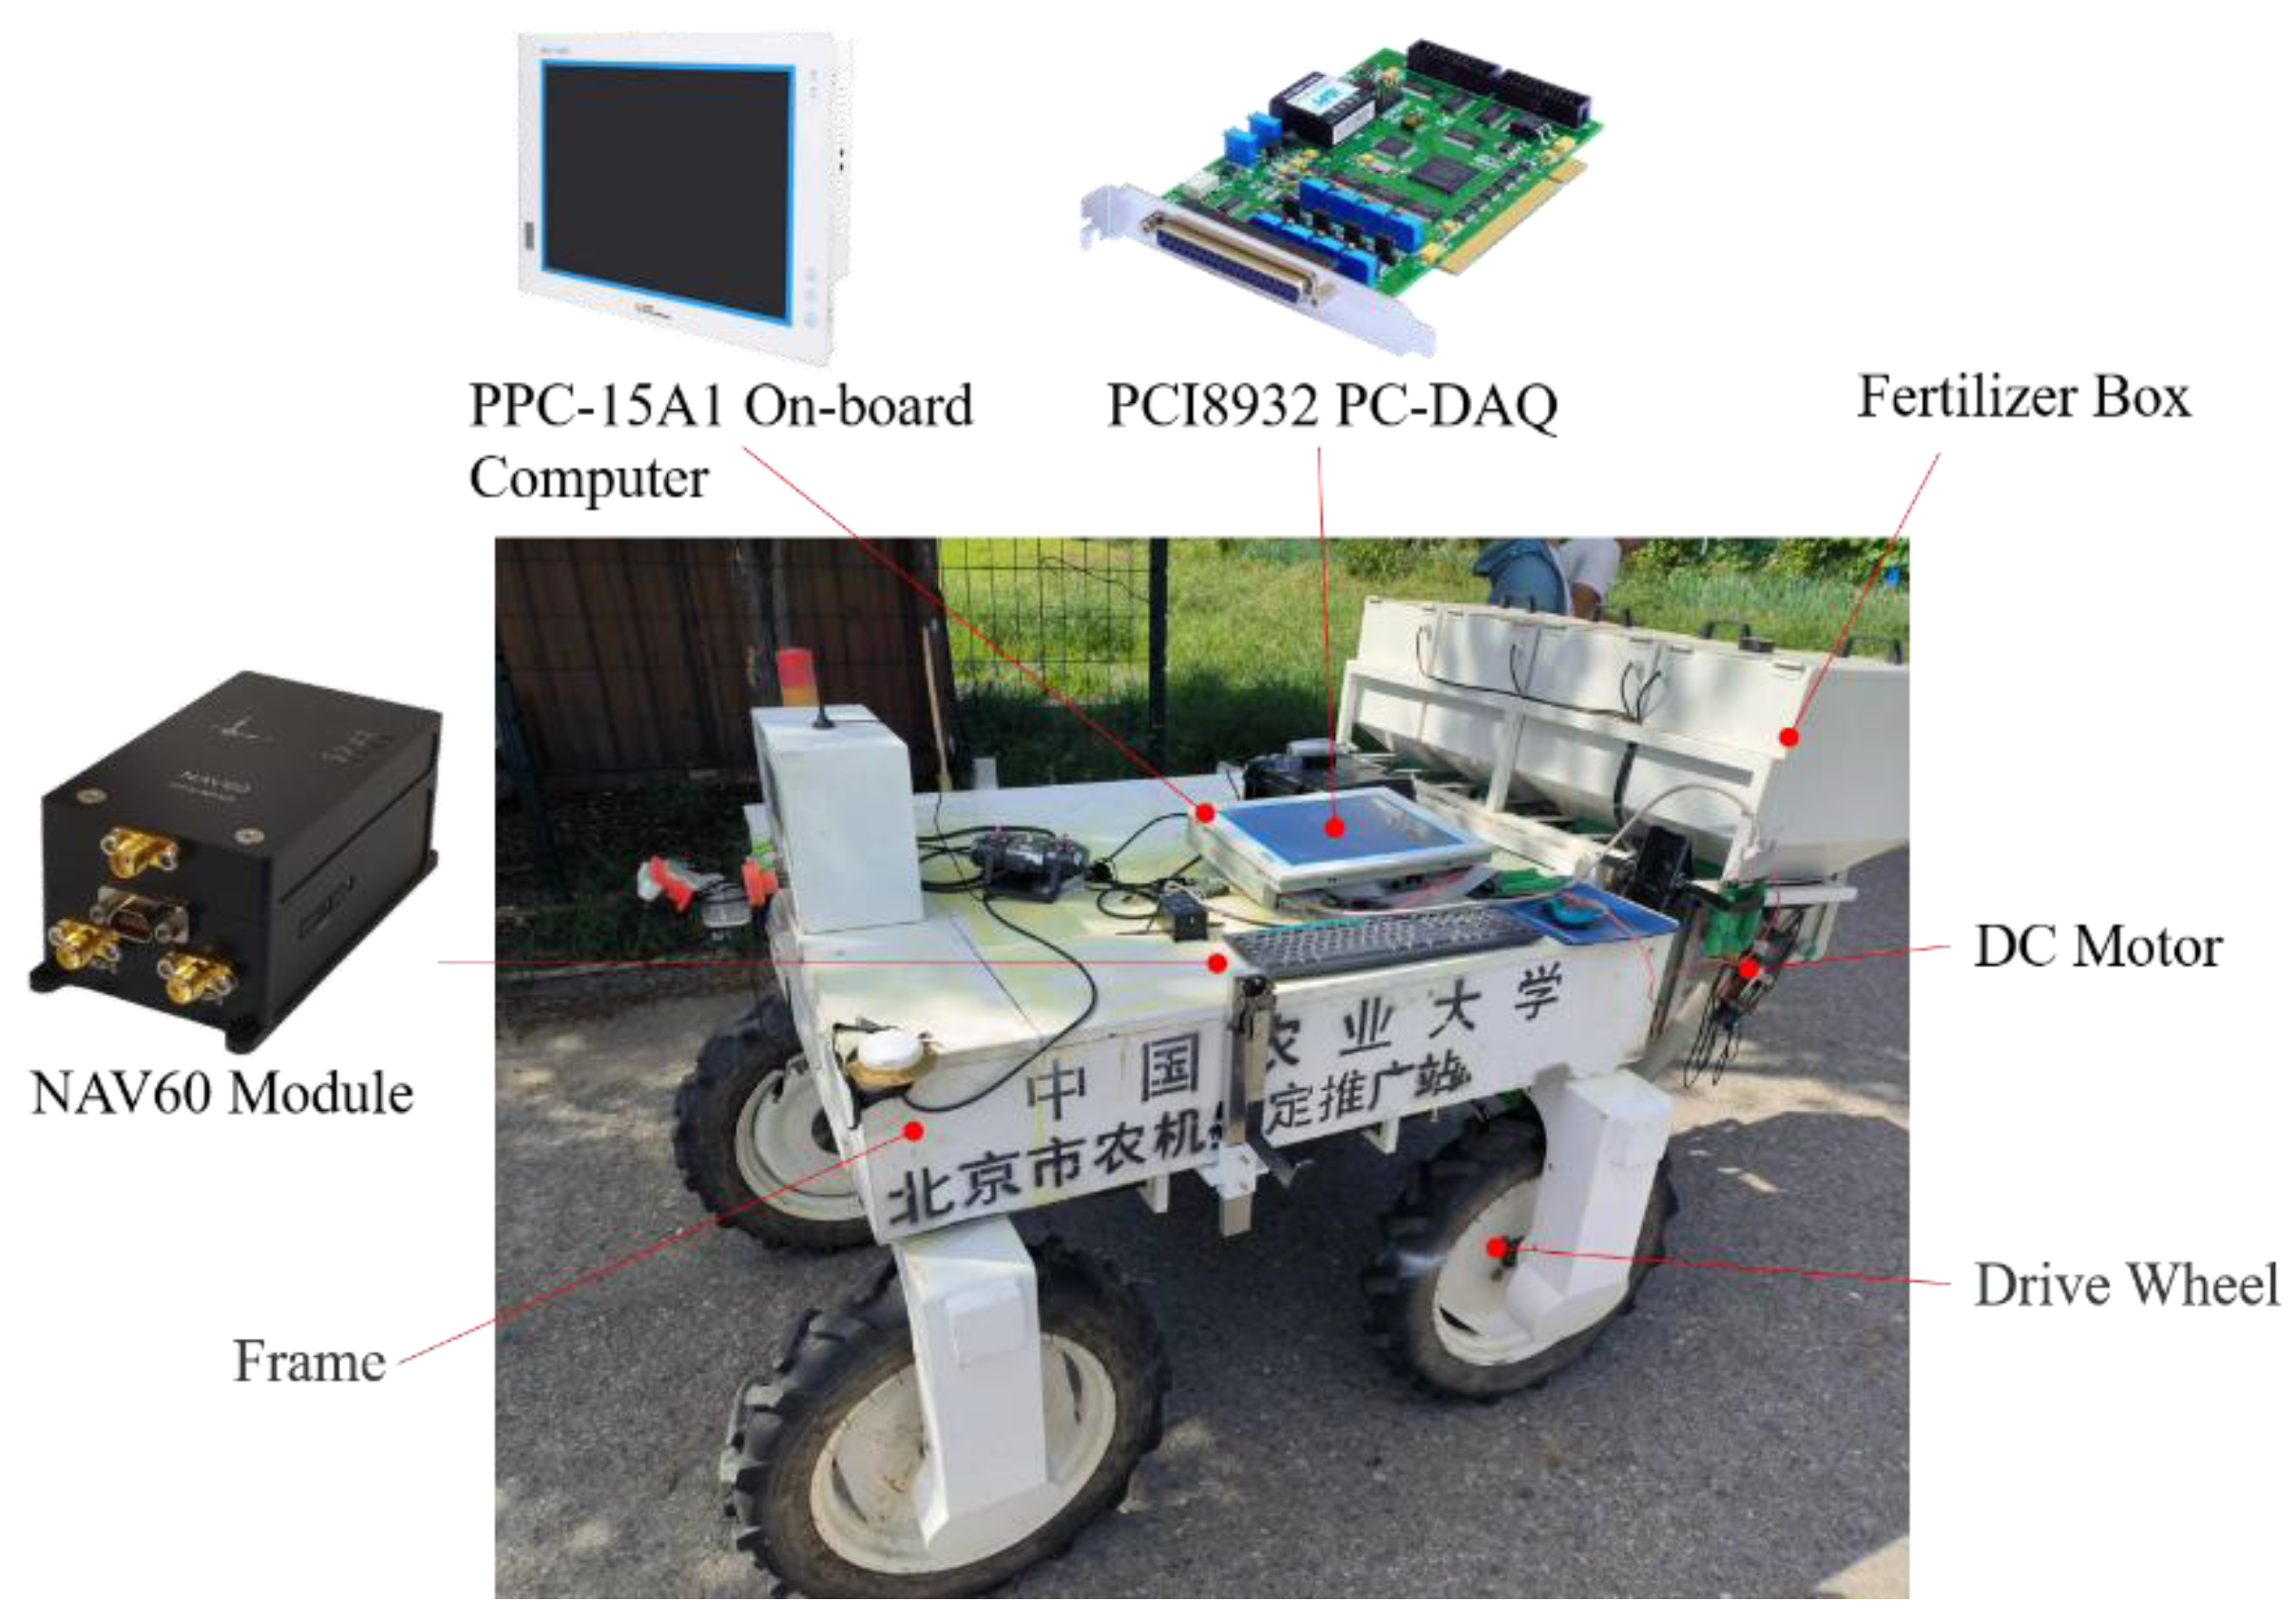
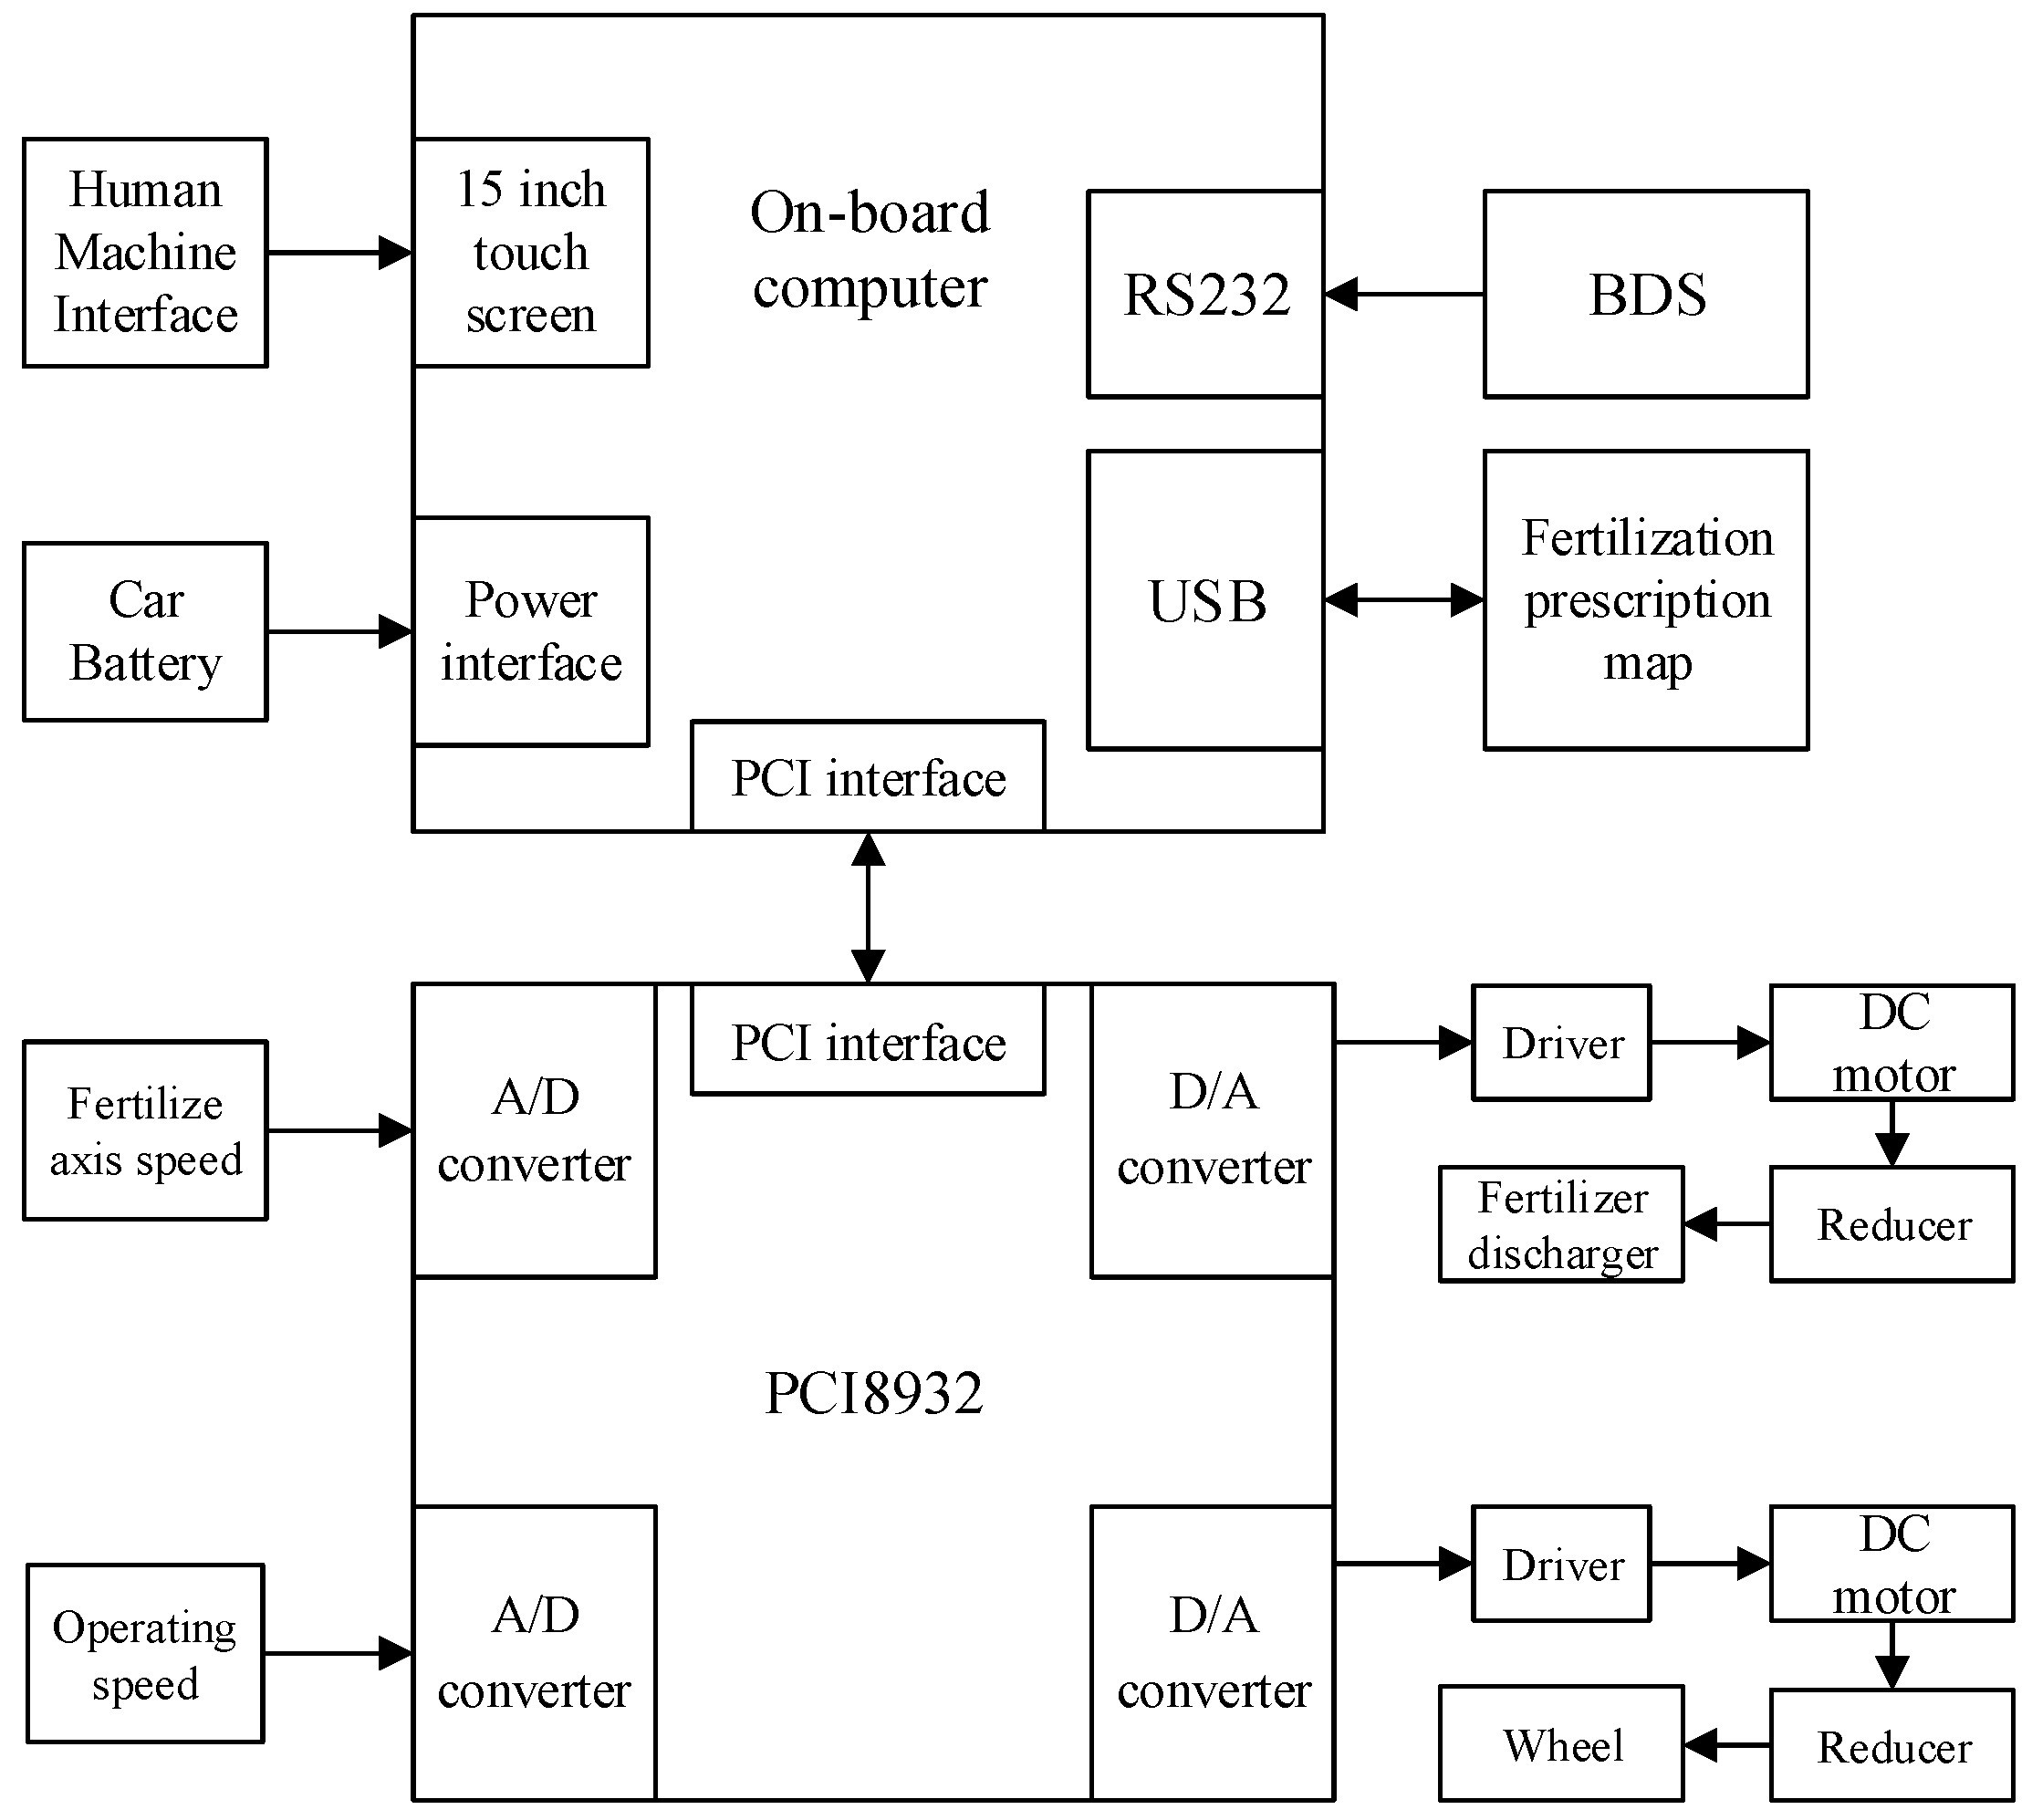
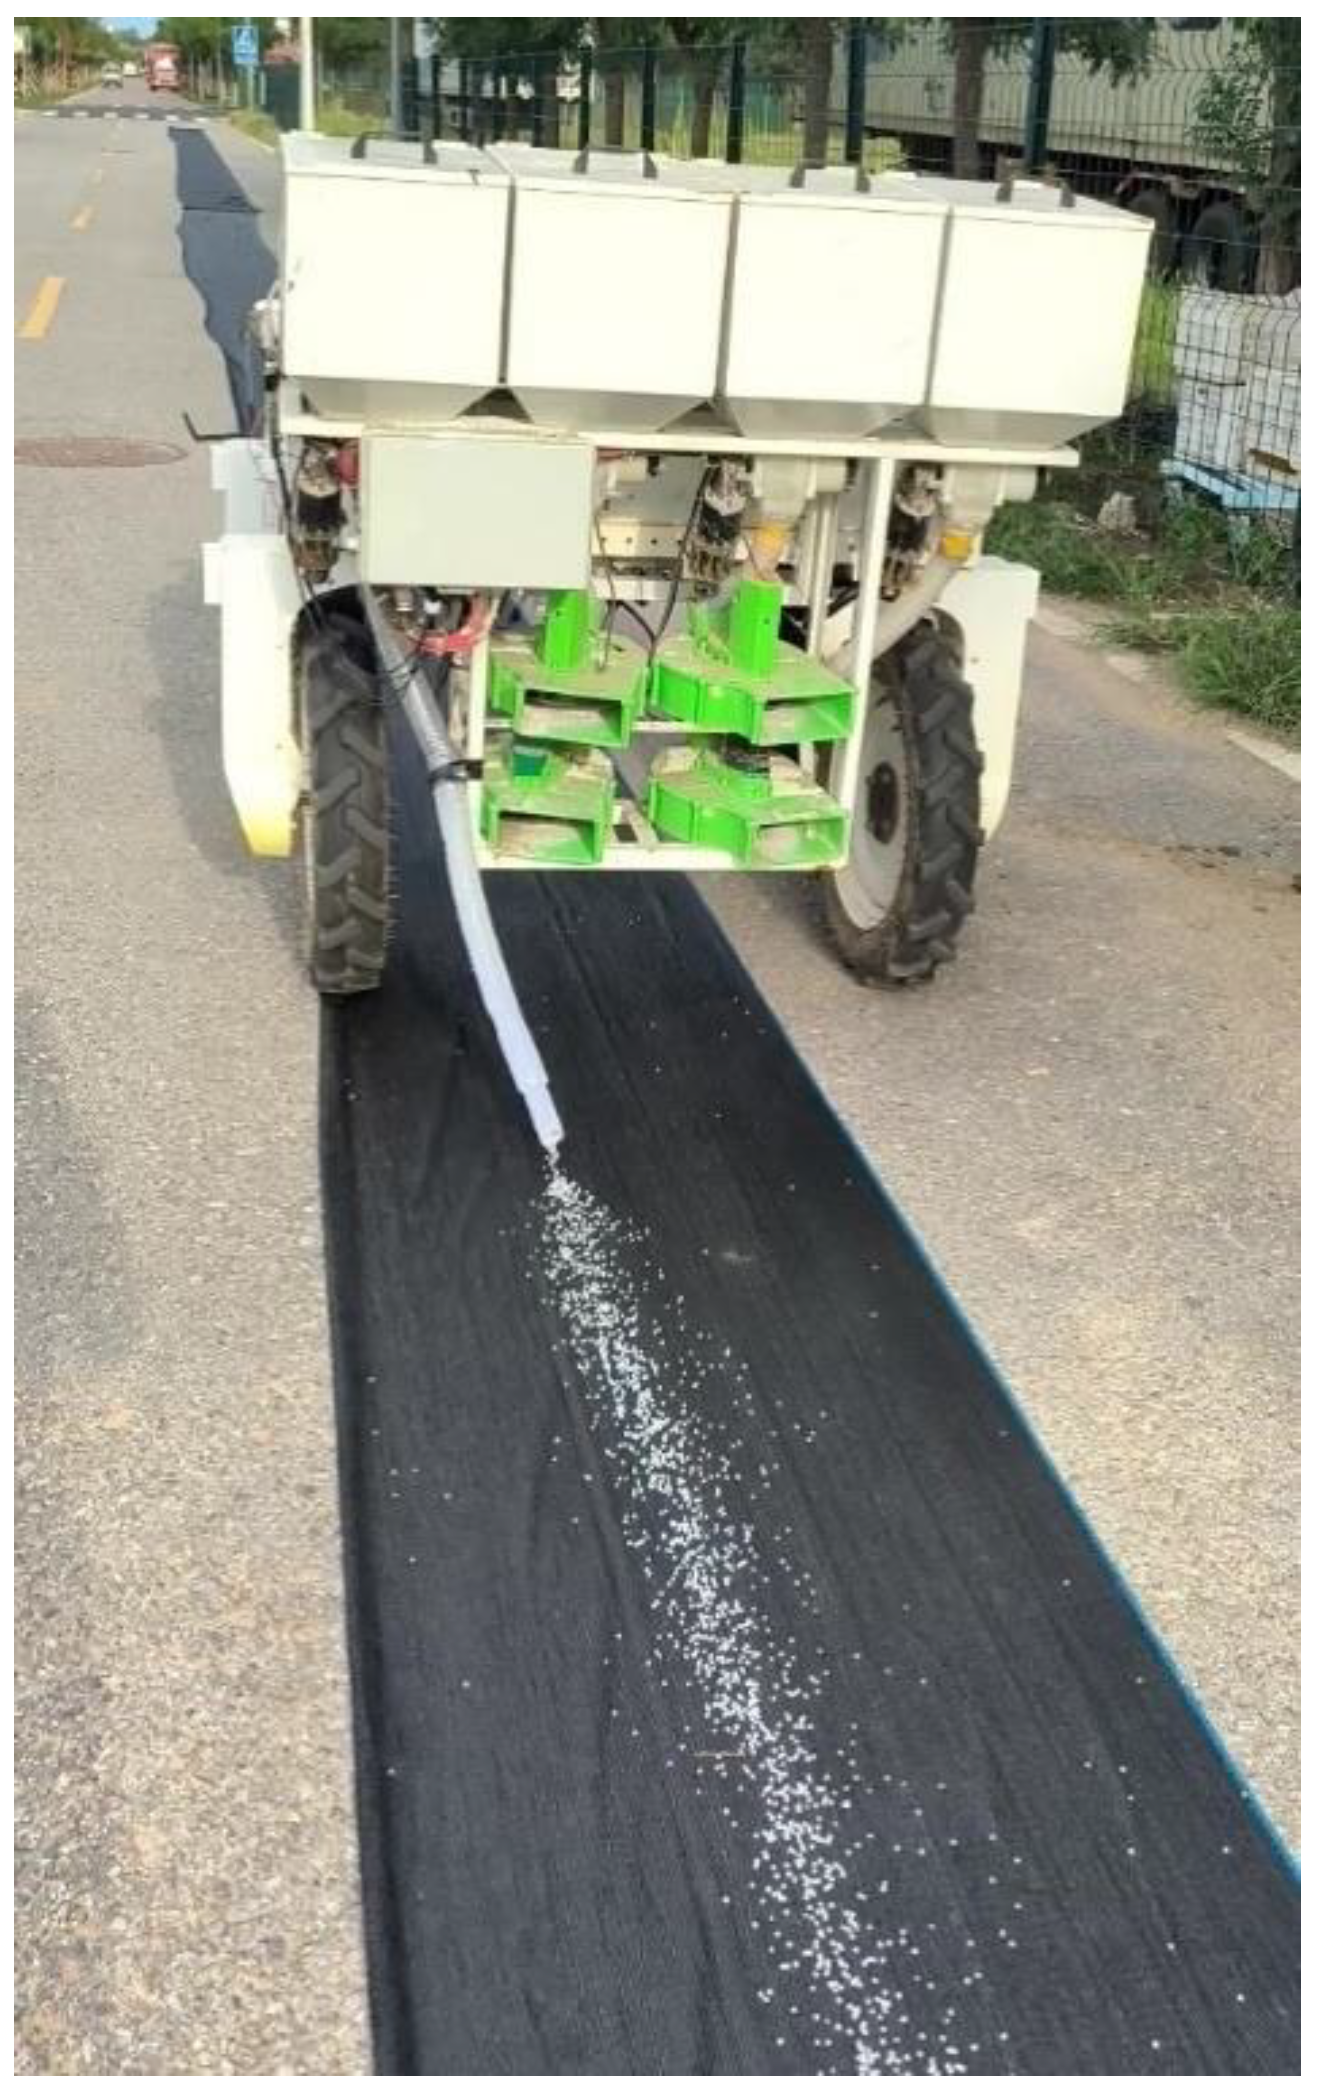
2.1.2. Variable-Rate Fertilization Experiment Platform

As shown in Figure 2, in order to verify the variable-rate fertilization control algorithm, a variable-rate fertilization experimental platform is set up in this paper, which is mainly composed of a power supply, DC motors, a PPC-15A1 on-board computer that contains a PCI8932 PC-DAQ, speed sensors, fertilizer dischargers, and a NAV60 module which can receive BDS (Beidou Navigation Satellite System) positioning data.
As shown in Figure 3, the on-board computer is equipped with a 15-inch human-computer interactive touch screen, which receives BDS positioning data through the RS232 serial port, collects speed sensor data through the PCI data acquisition card, drives the DC motor, increases the torque through the reducer to drive fertilizer discharge, and configures fertilizer application operating parameters through the on-board computer.
The on-board computer software for the variable-rate fertilization (VRF) system of the orchard is developed by LabVIEW programming, which has a man-machine interface and has the functions of importing fertilization prescription maps, displaying positioning information, displaying fertilization prescription maps in real-time, moving track, and real-time information of the fertilization amount, etc. (Figure 4). Labview realizes the PID algorithm of the BP neural network based on PSO optimization by calling the external DLL link library.

2.2. Methods of Model Construction and Calibration Test

2.2.1. Mathematical Model of Rotating Speed and Fertilizer Discharge

According to the principle of the fertilizer application mechanism of the external grooved wheel fertilizer applicator, under the condition of a certain opening, the amount of fertilizer discharged is determined by the rotation speed of the fertilizer application shaft [13]. The formula for calculating the rotating speed of the fertilizer discharge mechanism is shown in Equation (1).
n = 125 Q v 27 q N
where Q is the target fertilization amount, g/m; n is the target speed of the motor, r/min; v is the operating speed, m/s; q is the amount of fertilizer discharged by the fertilizer discharger per turn, and g/r; N is the number of fertilizer dischargers.
According to the operating mechanism in this paper and the actual situation of the experiment, a fertilizer discharger is used in the experiment; that is, N is 1; Simplify Equation (1), and the simplified result is shown in Equation (2).
n = 125 Q v 27 q  
It can be known from Equation (2) that the factors that affect the rotation speed of the fertilizer discharging motor include the target fertilizer amount Q, the operation speed v, and the fertilizer discharging amount q per revolution. The target fertilization is obtained according to the prescription chart; the operating speed is obtained by the encoder at the wheel. To realize the precise control of fertilizer application, the key lies in the calibration of fertilizer application q per turn [14].

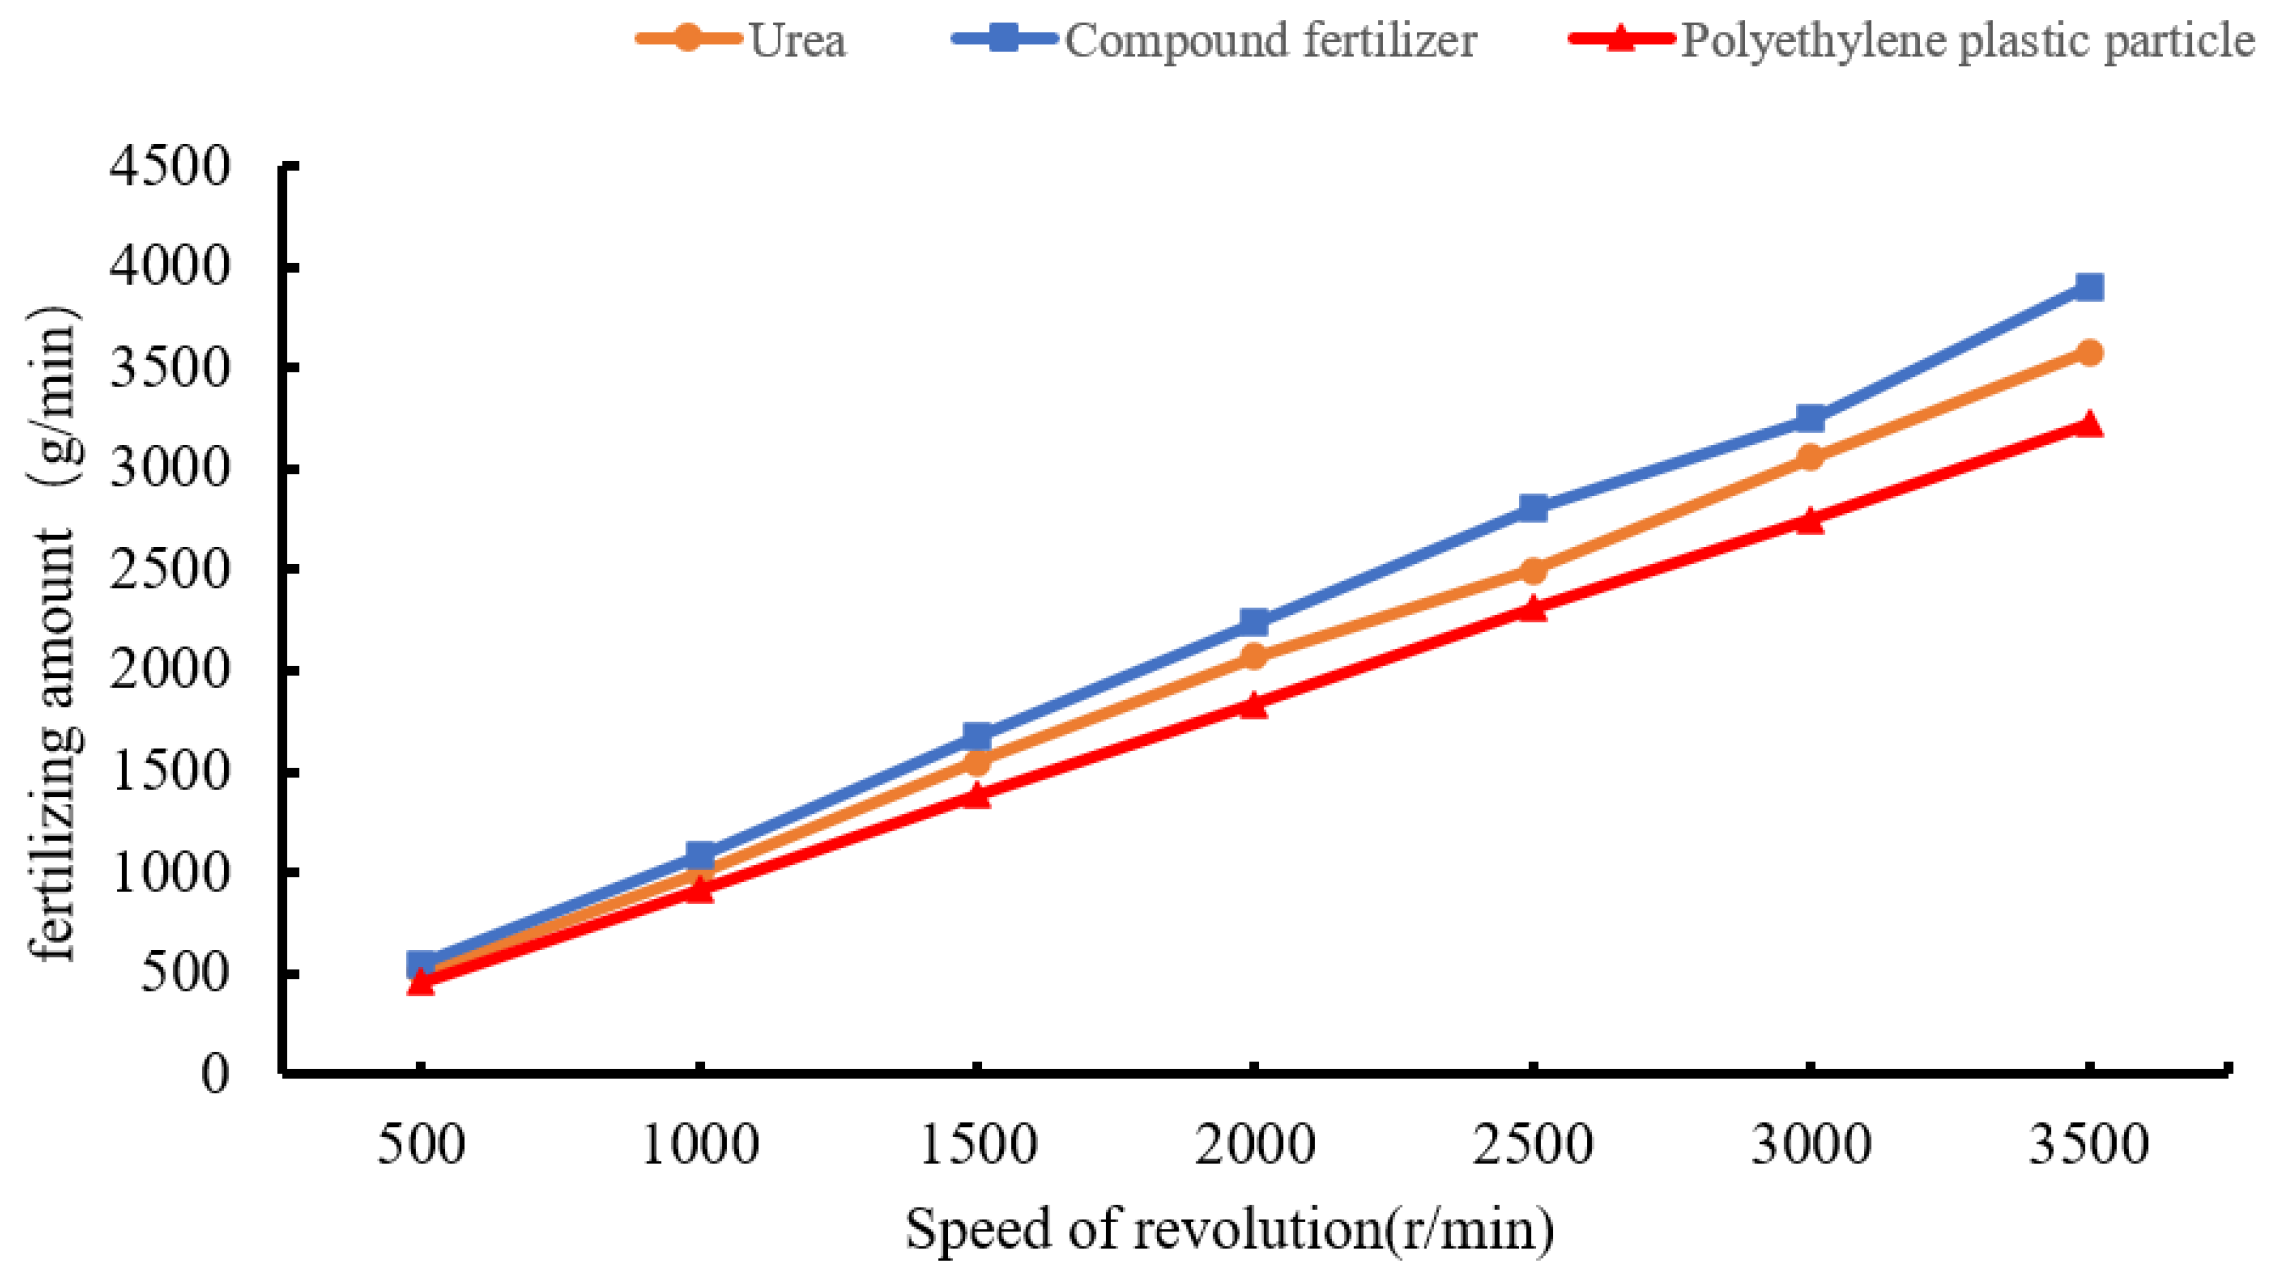
2.2.2. Calibration Method of Fertilization at Different Speeds

In the experiment, urea, compound fertilizer, and polyethylene plastic particles (simulated fertilizer) were calibrated at different rotating speeds, and the amount of fertilizer discharged per revolution was obtained under different rotational speeds. The rotating speed was increased by 500 r/min from 0 to 3500 r/min, and the rotating speed was kept for one minute. The weight of fertilizer discharged was measured to obtain the actual amount of fertilizer discharged. During the experiment, the fertilizer is easy to melt after being exposed to the air, which affects the weighing after the experiment. Except for the calibration test, polyethylene plastic particles are used to replace the fertilizer in the subsequent tests. SPSS software was used to analyze the bivariate correlation between the rotation speed of different fertilizers and the actual fertilizer discharged, and the p-value and R-value were obtained, with the p-value representing the significant coefficient and the R-value representing the Pearson coefficient. We then performed a linear fit and the fitting coefficient q is obtained from Equation (3).
M = q n
M is the actual amount of fertilizer discharged, g/min; q is the amount of fertilizer discharged per rotation, g/r; n is the speed, r/min.

2.2.3. Rotating Speed Model of Fertilizer Discharging Motor

In order to facilitate the simulation experiment, the transfer function of the speed control of the fertilizer discharging motor in the variable-rate fertilization system is constructed. In this paper, the control model of medium-precision variable-rate fertilization takes the theoretical fertilization amount as the input of the controller, and the controller sends the electric signal to the DC motor drive module after calculation. The DC motor controls the rotation speed of the fertilizer discharging shaft, and the output is the rotation speed of the motor. The motor rotation speed is fed back to the controller through the encoder, and the controller realizes closed-loop control. The block diagram of the variable-rate fertilization control system is shown in Figure 5.
The fertilizer discharging motor is a DC brushless motor of Beijing Times Chaoqun Company, and the transfer function of the fertilizer discharging motor is established according to Figure 5. In a DC motor, the control signal is the voltage input and the output is the motor shaft speed. The signal control circuit of a DC motor includes armature circuit balance, electromagnetic induction of the motor rotor, and torque balance of the motor shaft. See Equation (4) for the balance equation
{ u a ( t ) E = R a · ( i ( t ) + T e d i ( t ) d t ) E = k e · n i ( t ) i l ( t ) = T m R a · d E d t
where t is time, s; u a ( t ) is the voltage of the input DC motor, V; E is the electromotive force of the motor, V; i ( t ) is armature current, A; T e is the electromagnetic time constant; R a is armature resistance, Ω; k e is the back EMF coefficient; n is the motor speed, rad/s; i l ( t ) is the load current, and A; T m is the electromechanical time constant.
Laplace transform is performed in Equation (4), and the open-loop transfer function of a DC motor is obtained under no-load conditions, as shown in Equation (5).
G k ( s ) = N ( s ) U a ( s ) = k e T m T e s 2 + T m s + 1
According to the control model and each link function, the closed-loop unit negative feedback control transfer function of the variable-rate fertilization control system in this paper is expressed as follows.
G b ( s ) = G ( s ) 1 + G ( s ) = 1.823 × 10 5 s 2 + 32.33 s + 237.3  
where G b ( s ) is the closed-loop transfer function of fertilizer discharging motor speed.
According to Equation (6), the characteristic equation is as shown in Equation (7).
D ( s ) = s 2 + 32.33 s + 237.3 = 0  
According to the Routh–Hurwitz stability criterion, if the coefficients of the characteristic equation of the second-order system are positive, the system is stable.
During the simulation, the transfer function of the rotation speed of the fertilizer discharging motor is used to build the fertilizer discharging system model in Simulink. The PID controller, fuzzy PID controller, and improved BP neural network adaptive PID controller are, respectively, used to control the model.

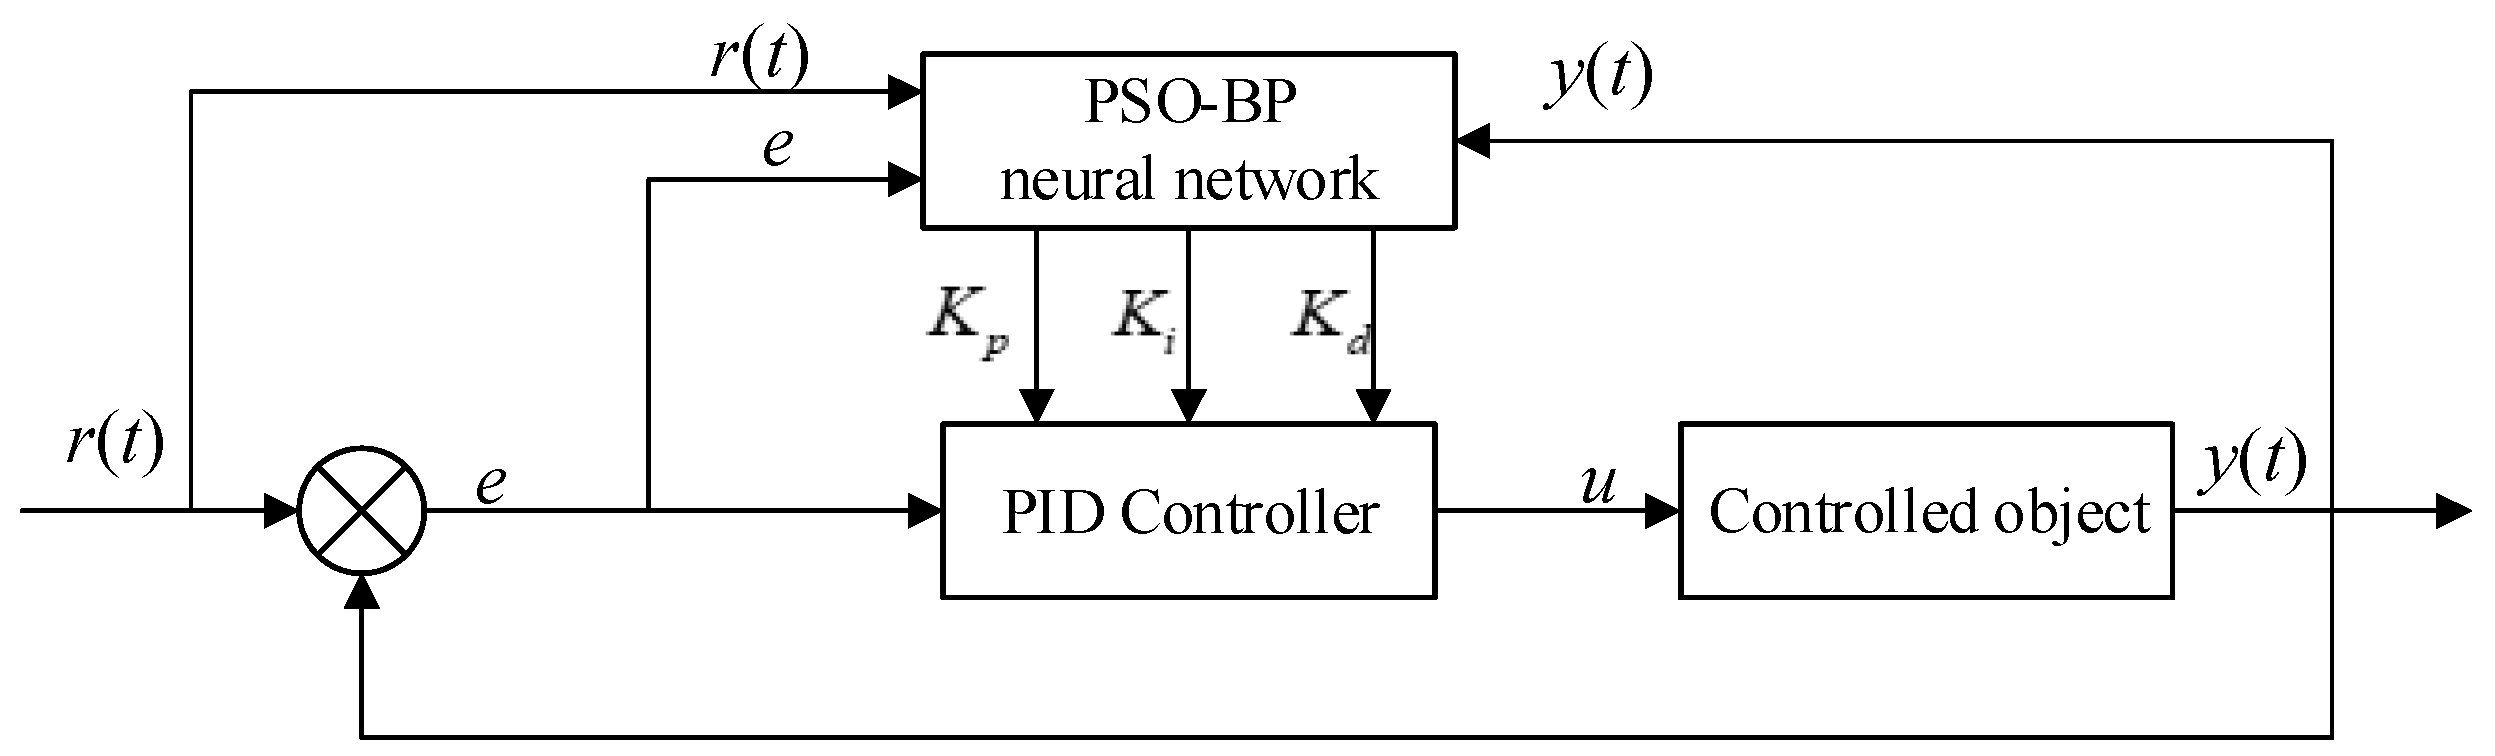
2.3. BP Neural Network PID Controller Design Based on Particle Swarm Optimization

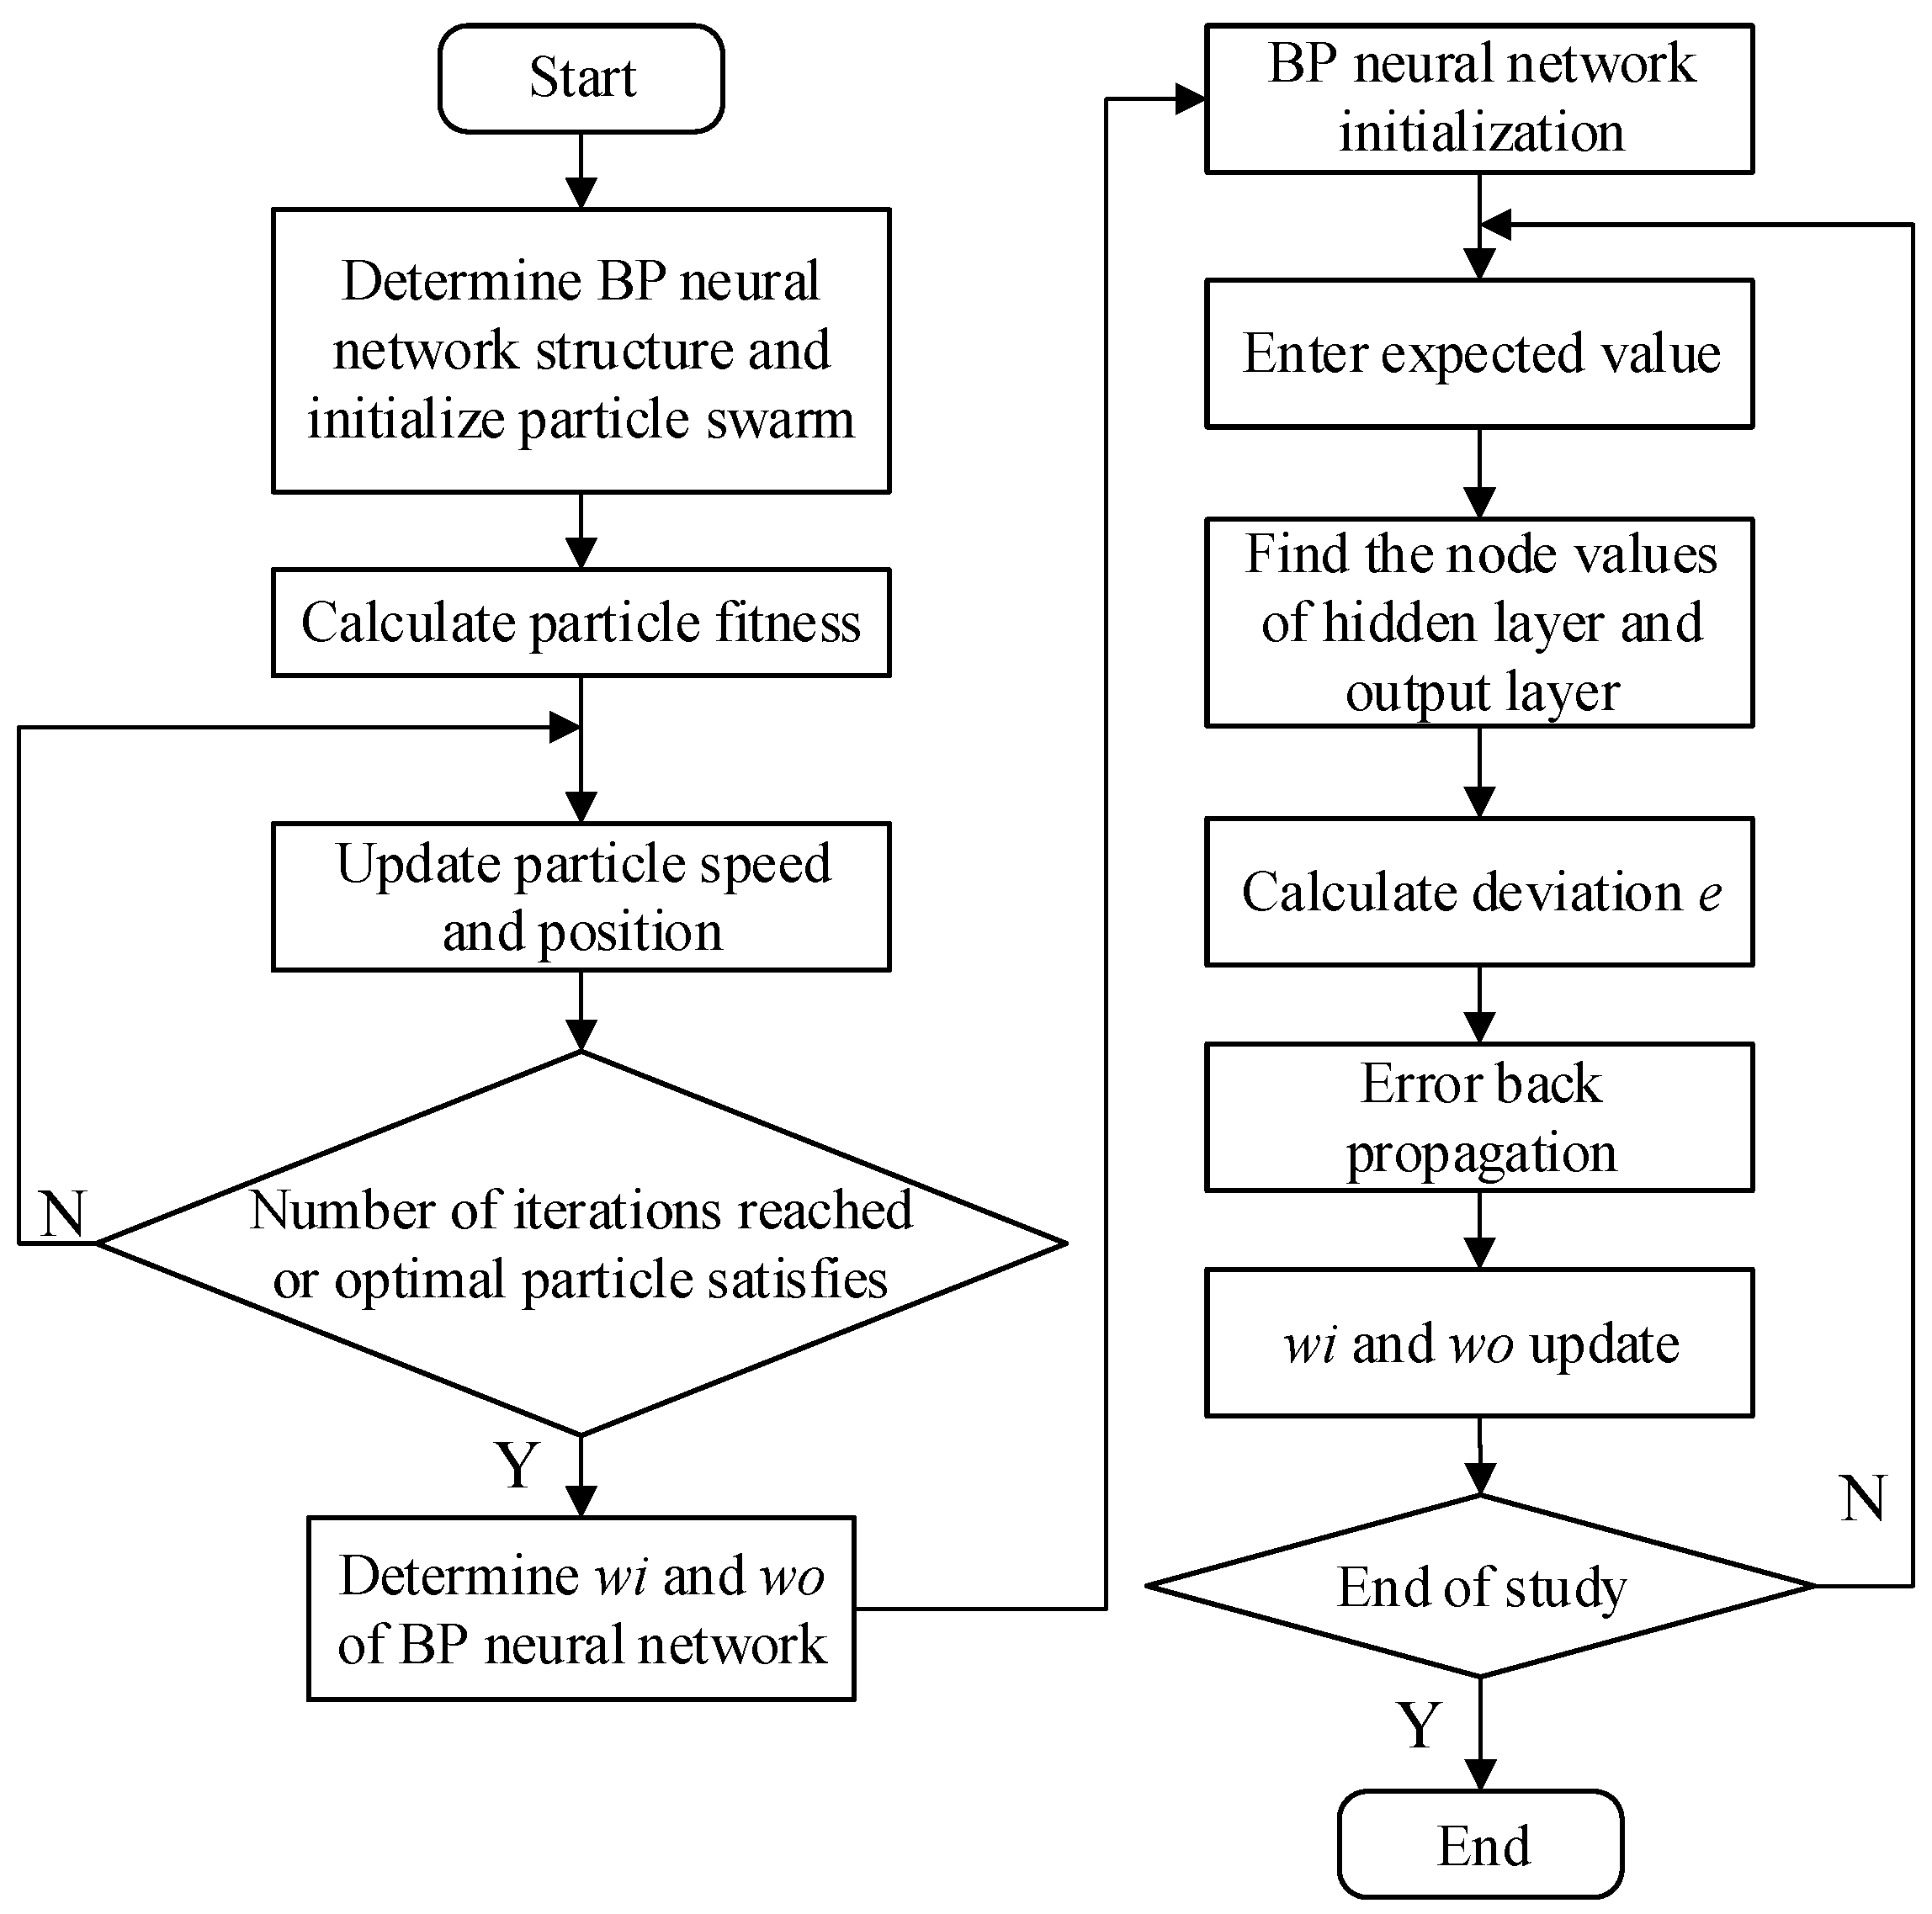
2.3.1. Principle of Particle Swarm Optimization Algorithm

The basic idea of Particle Swarm Optimization (PSO) is to randomly initialize a group of particles without volume and mass. Each particle is a feasible solution to the optimization problem, and the quality of particles is evaluated by a predetermined fitness function. Each particle flies in the feasible solution space, and its direction and distance are determined by a velocity variable. The current optimal particle will be tracked through the particles, and the global optimal solution will be finally found through iterative search [15,16,17,18].
In each iteration, the particle will track its optimal solution and the optimal solution of the whole population. The formula for the particle swarm optimization algorithm is shown in Equation (8).
{ v i + 1 = ω · v i + c 1 r 1 ( P i x i ) + c 2 r 2 ( G i x i ) x i + 1 = x i + v i + 1
where i is the particle serial number; v i is the velocity of the ith particle; x i is the position of the ith particle; ω is the inertia weight; c 1 and c 2 are learning factors; r 1 and r 2 are random numbers within the range of [0, 1]; P i is the optimal position of the individual; and G i is the optimal position of the population.
For inertia weight ω, when ω is small, it is conducive to the local search ability of particles, and the accuracy of solving the problem is relatively high. When ω is large, it is conducive to the global search ability of particles, and to a certain extent it can avoid falling into local optimization. The inertia weight ω decreases by 0.4 from 0.9 linearly, which will generally achieve good optimization results. Therefore, the current inertia weight is calculated according to Equation (9) during iteration.
ω = ω s t a r t ω s t a r t ω e n d i t e r max × i t e r  
where ω s t a r t is the initial inertia weight; ω e n d is the ending inertia weight; iter is the number of iterations; and i t e r max is the maximum number of iterations.

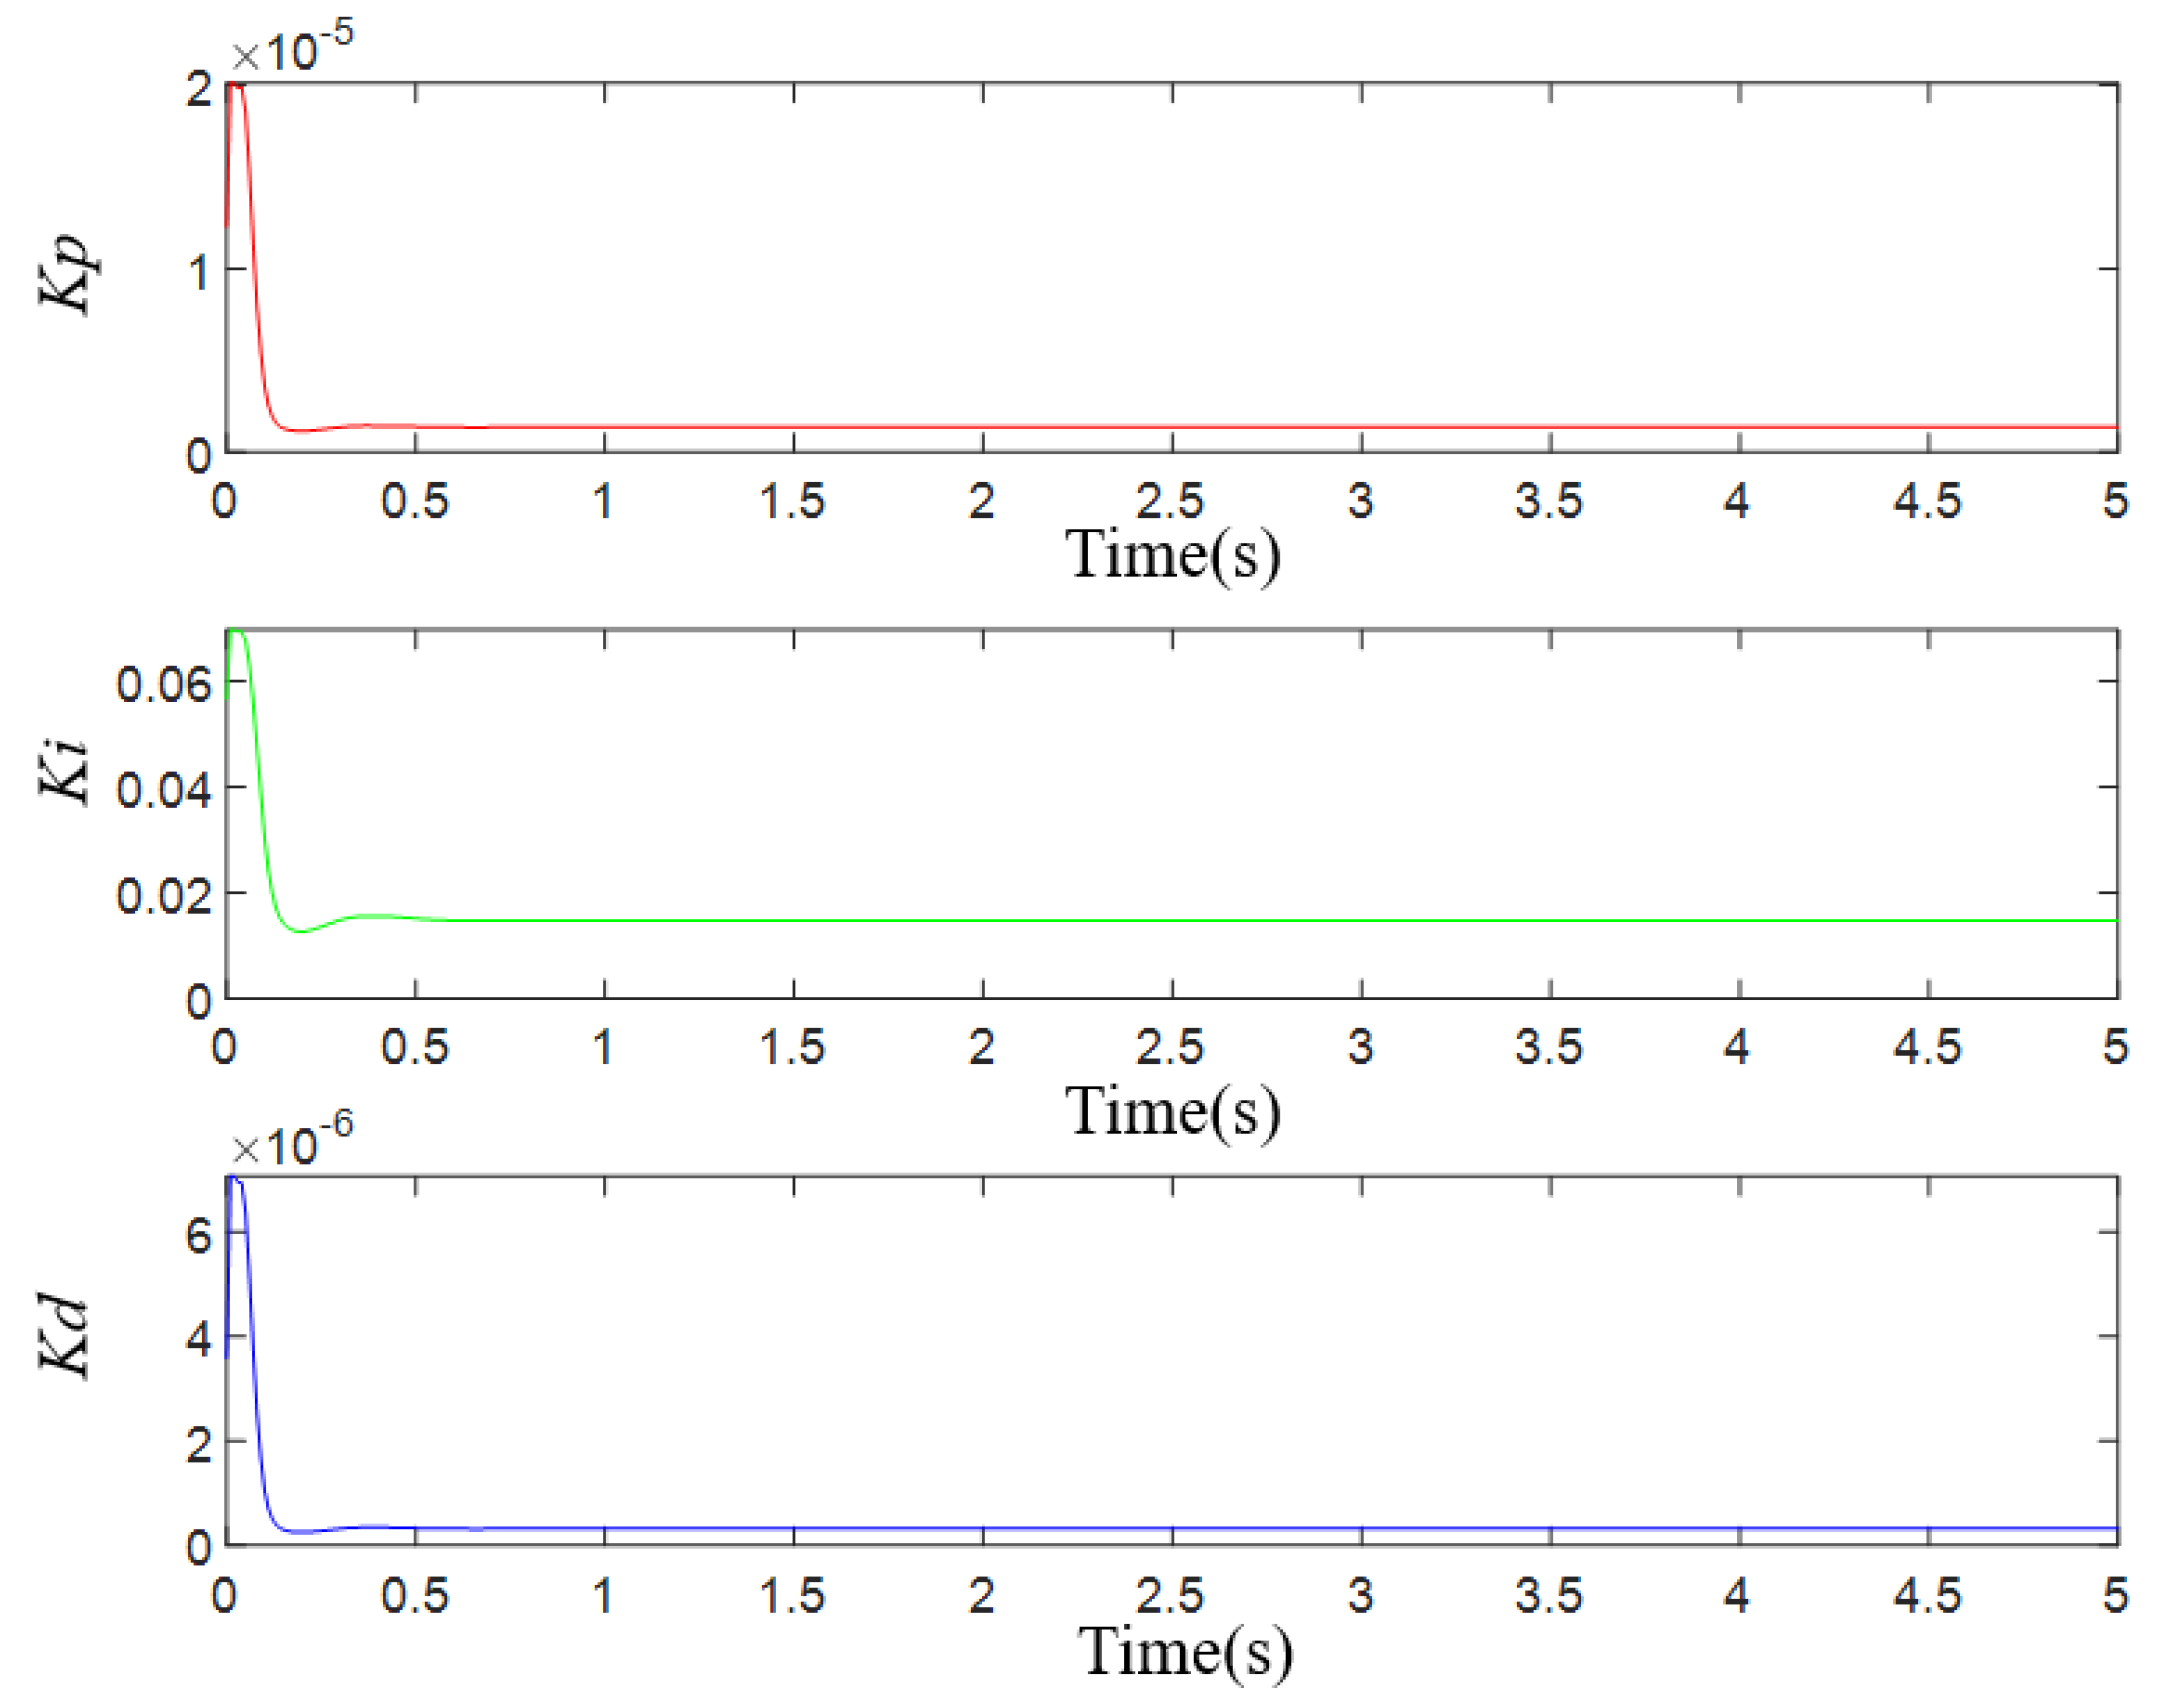
2.3.2. Design of the BP Neural Network PID Controller Based on PSO Optimization

The BP neural network is a neural network using the backpropagation algorithm. By combining the BP neural network algorithm with PID control, an adaptive PID controller based on the BP neural network can be designed, which improves the poor control effect of PID in nonlinear systems. The initial weights of the traditional BP neural network are generally generated by using random numbers. After adjusting the network connection weights through backpropagation, it is easy to fall into the local optimal solution, which cannot achieve the optimal control effect. However, the BP neural network optimized by the PSO algorithm can search in a larger space, avoiding the problem of the local optimal solution to a certain extent. The structure diagram of the PSO-BP neural network PID parameter self-tuning control is shown in Figure 6.
The learning process of the BP neural network has two parts: forward propagation and backpropagation. The input signal is transmitted to the output layer through the processing of the hidden layer through forwarding propagation. If the expected result cannot be obtained at the output layer, the error signal will return along the original path, and the error signal will be minimized by modifying the weights between the layers. The key to solving nonlinear problems in neural networks is the activation function. If there is no activation function, no matter how many layers of neural networks, the output is a linear combination of inputs, and the nonlinear activation function can effectively solve the problem. There are several types of activation functions: relu activation function, sigmoid activation function, tanh activation function, etc. Since PID parameters must be nonnegative, the sigmoid activation function is selected in this paper. As shown in Equation (10), the mapping range of the output value of the activation function is between 0 and 1.
f ( x ) = 1 1 + e x
In this paper, the BP neural network structure is 3-5-3. With three layers of input including expected value rin, actual value yout, and deviation e, the hidden layer has five layers, and the output layer has three layers: Kp, Ki, Kd. The value of the learning rate η is 0.5. The weight between the input layer and the hidden layer is wi, and the weight between the hidden layer and the output layer is wo.
In the forward propagation process, the network input layer input, hidden layer input, hidden layer output, output layer input, and output layer output are calculated by sampling the expected value rin (k), actual value yout (k), and deviation e (k) of the system at time k. The output of the input layer is:
O j ( 1 ) = x ( j ) , j = 1 , 2 , 3
The input and output of the hidden layer are:
n e t i ( 2 ) ( k ) = j = 0 4 w i j ( 2 ) O j ( 1 ) ( k )
O i ( 2 ) ( k ) = f ( n e t i ( 2 ) ( k ) ) , i = 1 , 2 , , 5
The input and output of the output layer are:
n e t l ( 3 ) ( k ) = 0 4 w l i ( 3 ) O i ( 2 ) ( k )
O l ( 3 ) ( k ) = f ( n e t l ( 3 ) ( k ) ) , l = 1 , 2 , 3  
The sigmoid function is selected as the activation function of the hidden layer and the output layer, as shown in Equation (10). Adjust the weight value w of the output layer and the hidden layer according to the gradient descent method. The performance index function is selected as:
E k = 1 2 [ r ( k ) y ( k ) ] 2  
The adjustment amount of hidden layer weight is:
Δ w i j ( 2 ) ( k ) = η φ i ( 2 ) O j ( 1 ) ( k )
Including: φ i ( 2 ) = f ( n e t i ( 2 ) ( k ) j = 1 2 φ l ( 3 ) w l i ( 3 ) ( k ) ) , i = 1 , 2 , , 5 .
The adjustment amount of the weight value of the output layer is:
Δ w l i ( 3 ) ( k ) = η φ l ( 3 ) O i ( 2 ) ( k )  
Including: φ l ( 3 ) = e ( k ) sgn ( k ) f ( n e t l ( 3 ) ( k ) ) , l = 1 , 2 , 3 .
When the performance index E(k) is less than the set value, it means that the three parameters output by the BP neural network has met the requirements of the PID controller. And the learning ends. On the contrary, let k = k + 1 and continue learning.
However, the randomness of the selection of the initial weights of the BP neural network will lead to slow convergence speed and will fall into the local optimal solution, making the whole system unable to work in the optimal state. Particle swarm optimization (PSO) is a global search algorithm with fast convergence speed and a simple algorithm. The initial weights used to optimize BP neural network can better avoid falling into the local optimal solution. It is possible to use the PSO algorithm to train the BP neural network. Firstly, the weights in the network are coded, and each weight is coded into a vector. In this paper, the structure of the BP neural network is 3-5-3, and there are 30 parameters to be optimized, that is, each particle vector is 30 dimensions. Set the particle swarm size to 20 and the maximum number of iterations to 100. Stop training when the optimal solution in the sample is less than the set fitness value or reaches the maximum number of iterations. The fitness function is shown in Equation (19).
g x = 1 2 [ r ( k + 1 ) y ( k + 1 ) ] 2 = 1 2 e ( k + 1 )
The initial weights wi and wo of the BP neural network are obtained by using particle swarm optimization (PSO) training, and then the BP neural network adjusts the weights through error backpropagation to adaptively adjust the three PID parameters. The design flow chart of the BP neural network PID controller based on PSO optimization is shown in Figure 7.

2.4. Methods of Simulation Test and Variable Rate Fertilization Test

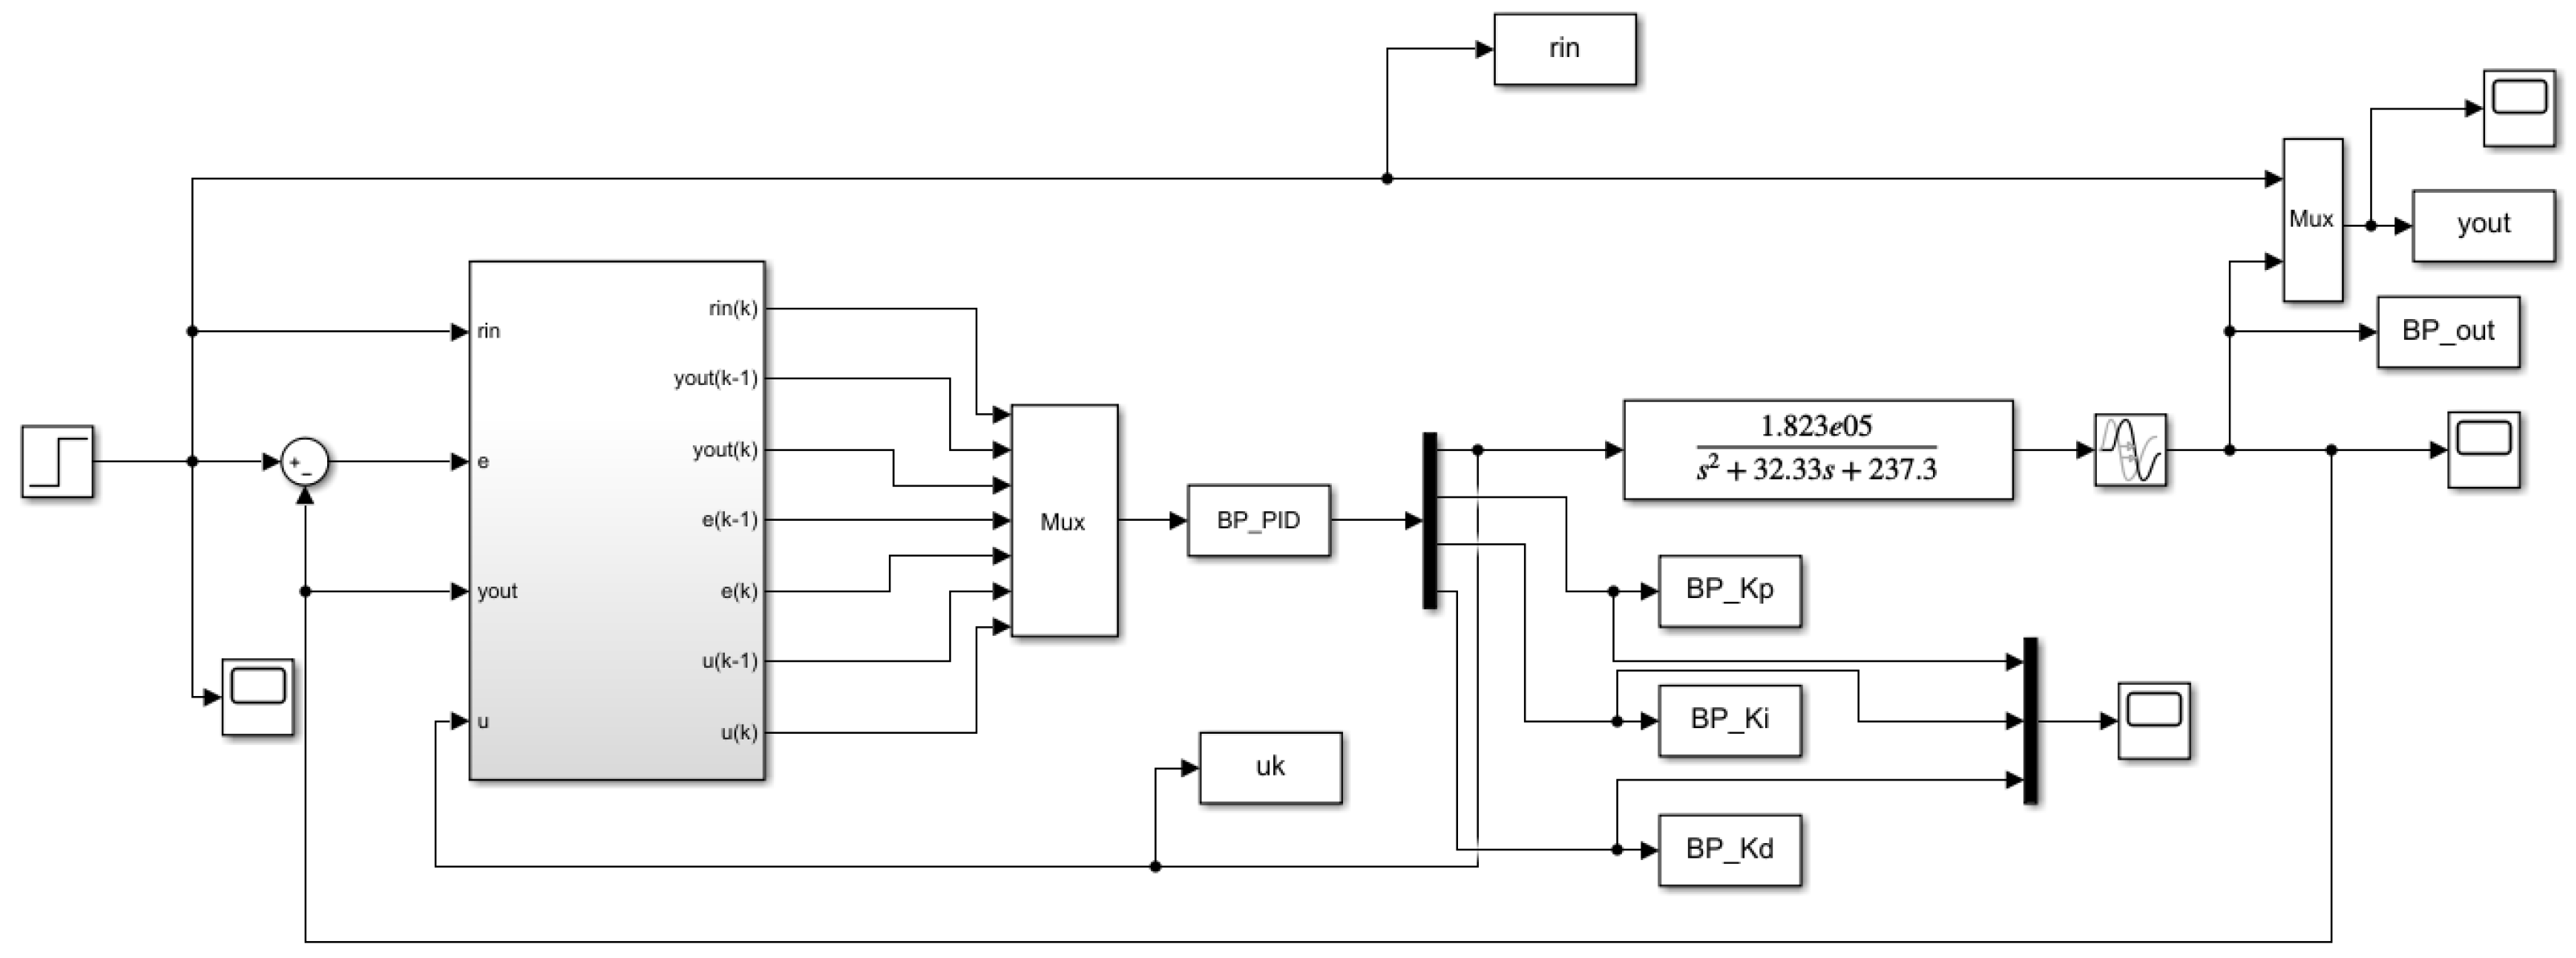
2.4.1. Methods of Simulation Test

In industrial process control, the proportion of PID control strategy in the actual system exceeds 90%. The most difficult problem in the practical application of PID controllers lies in the selection of proportion Kp, integral Ki, and differential Kd coefficients. The fuzzy PID controller can modify the proportion coefficient, integral coefficient, and differential coefficient online according to the deviation e and deviation change rate ec as well as the the fuzzy rules to meet the requirements for control parameters in different e and ec, but the quantization factor and scale factor in the controller are still obtained according to the empirical formula [19,20,21,22,23]. The BP neural network is a relatively mature neural network, which can be used to solve nonlinear problems. The BP neural network optimized by particle swarm optimization (PSO) can also effectively avoid the result falling into local optimization. Using the optimized BP neural network can improve the performance of the PID controller [24,25].
According to the transfer function of the fertilizer discharging motor, the traditional PID controller model, fuzzy PID control model, BP neural network, and the PID control models are based on the particle swarm optimization algorithm, which is built using Simulink. The step response simulation test is carried out for the fertilizer discharge motor.
The initial values of Kp, Ki, and Kd in the controller are obtained according to Ziegler Nichols (ZN) method, and the setting formula is shown in Table 1. Neglect the effect of integral and differential, change Kp to make the step response in the critical oscillation, and obtain the critical coefficient Ku = 0.005, and the oscillation period Tu = 0.0016. According to Table 1, Kp, Ki, and Kd are 0.003, 0.075, and 0.000288, respectively. The final values adjusted on this basis are 0.003, 0.2, and 0.0006.
The input and output fuzzy rules in the fuzzy controller are set according to expert experience. The fuzzy subset of input and output variables is divided into seven blocks, namely {NB, NM, NS, ZO, PS, PM, PB}. The membership function selects the trimf function. The quantification factor is obtained according to empirical Equations (20) and (21).
K e = 1 e
K e c = 2 e × e c
where, e is the absolute value of the maximum error in the response process, and ec is the absolute value of the maximum error change rate in the response process.
A PID controller based on the PSO-BP neural network cannot be built directly by using Simulink. In this section, the BP-PID controller is simulated by the S function, and the BP-PID controller is compiled through M code in the S function. The initial weights wi and wo of the BP neural network are obtained through offline training of the particle swarm optimization algorithm.
The BP-PID controller is established in Simulink using the initial weight optimized by the PSO algorithm through the S function, and the step response time domain simulation of the fertilizer discharge motor is carried out. The process is shown in Figure 8. The S function is initialized to seven inputs and four outputs, and the sampling time T is set to 0.02 s.
In the simulation, the traditional PID controller, fuzzy PID controller, and PSO-BP-PID controller are also tested for anti-interference. During the simulation process, an interference signal with a duration of 0.5 s and a size of 0.01 V is added in 2 s to test the anti-disturbance capability of the three controllers.

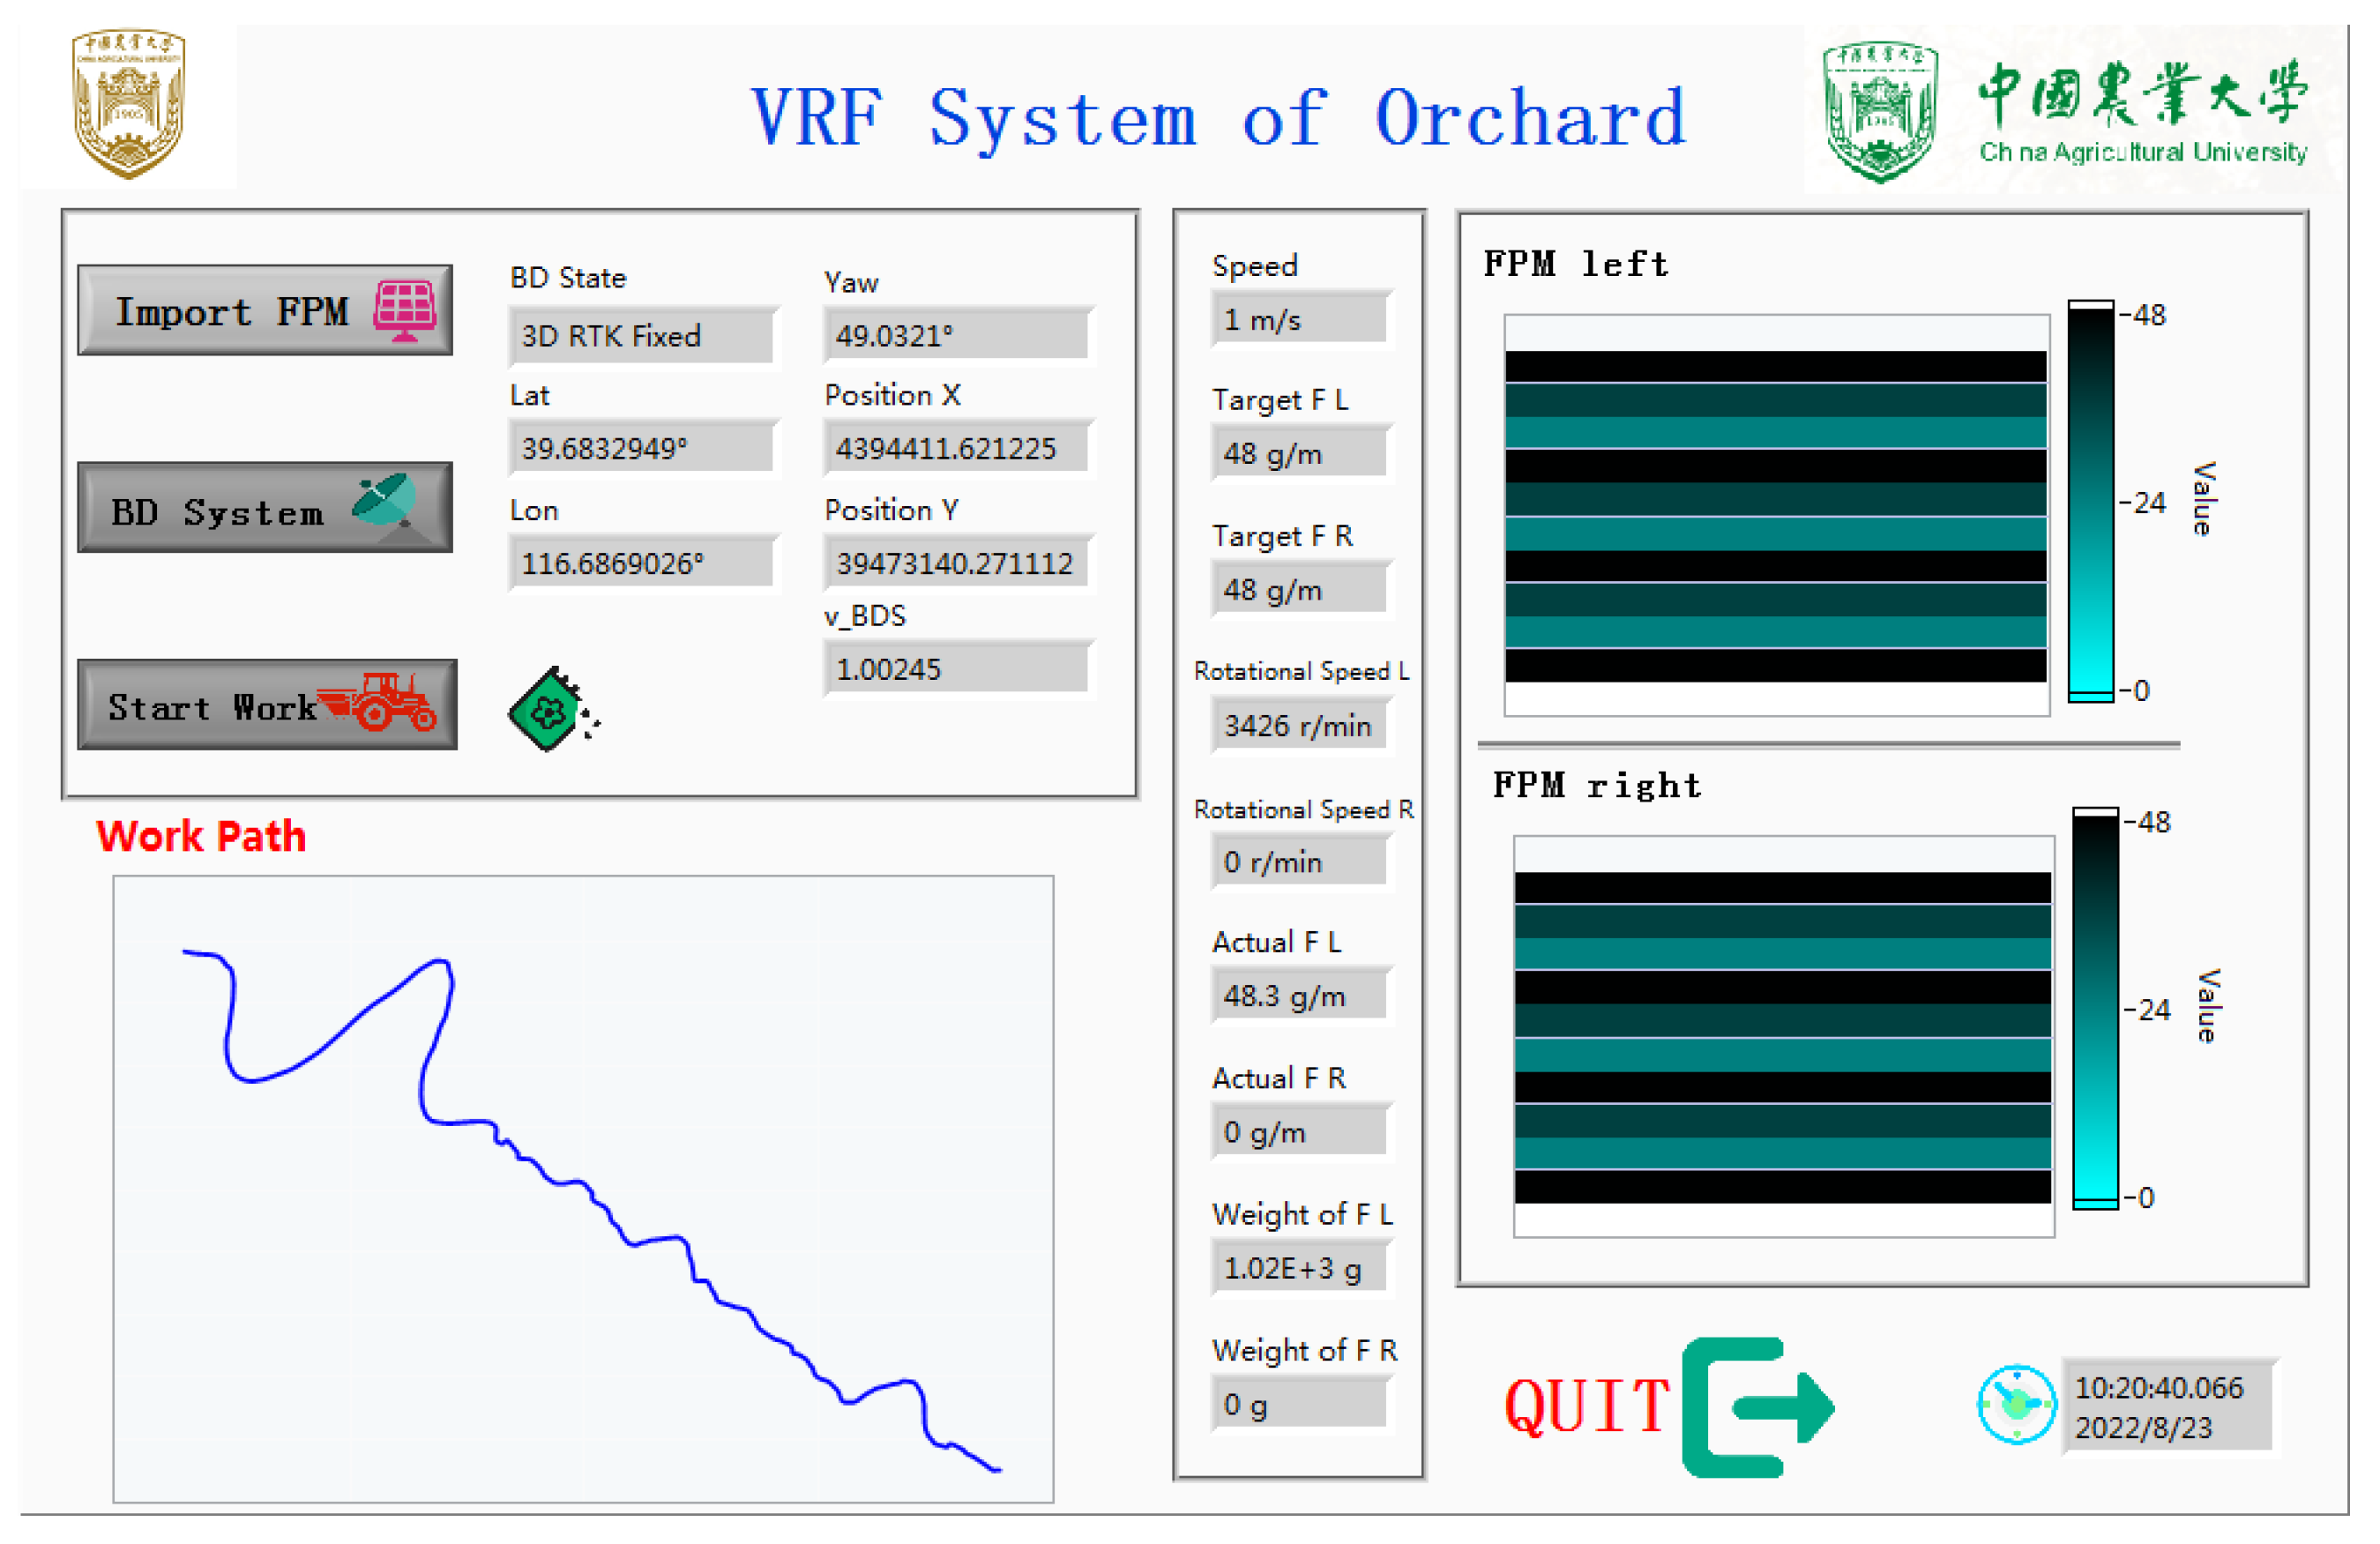
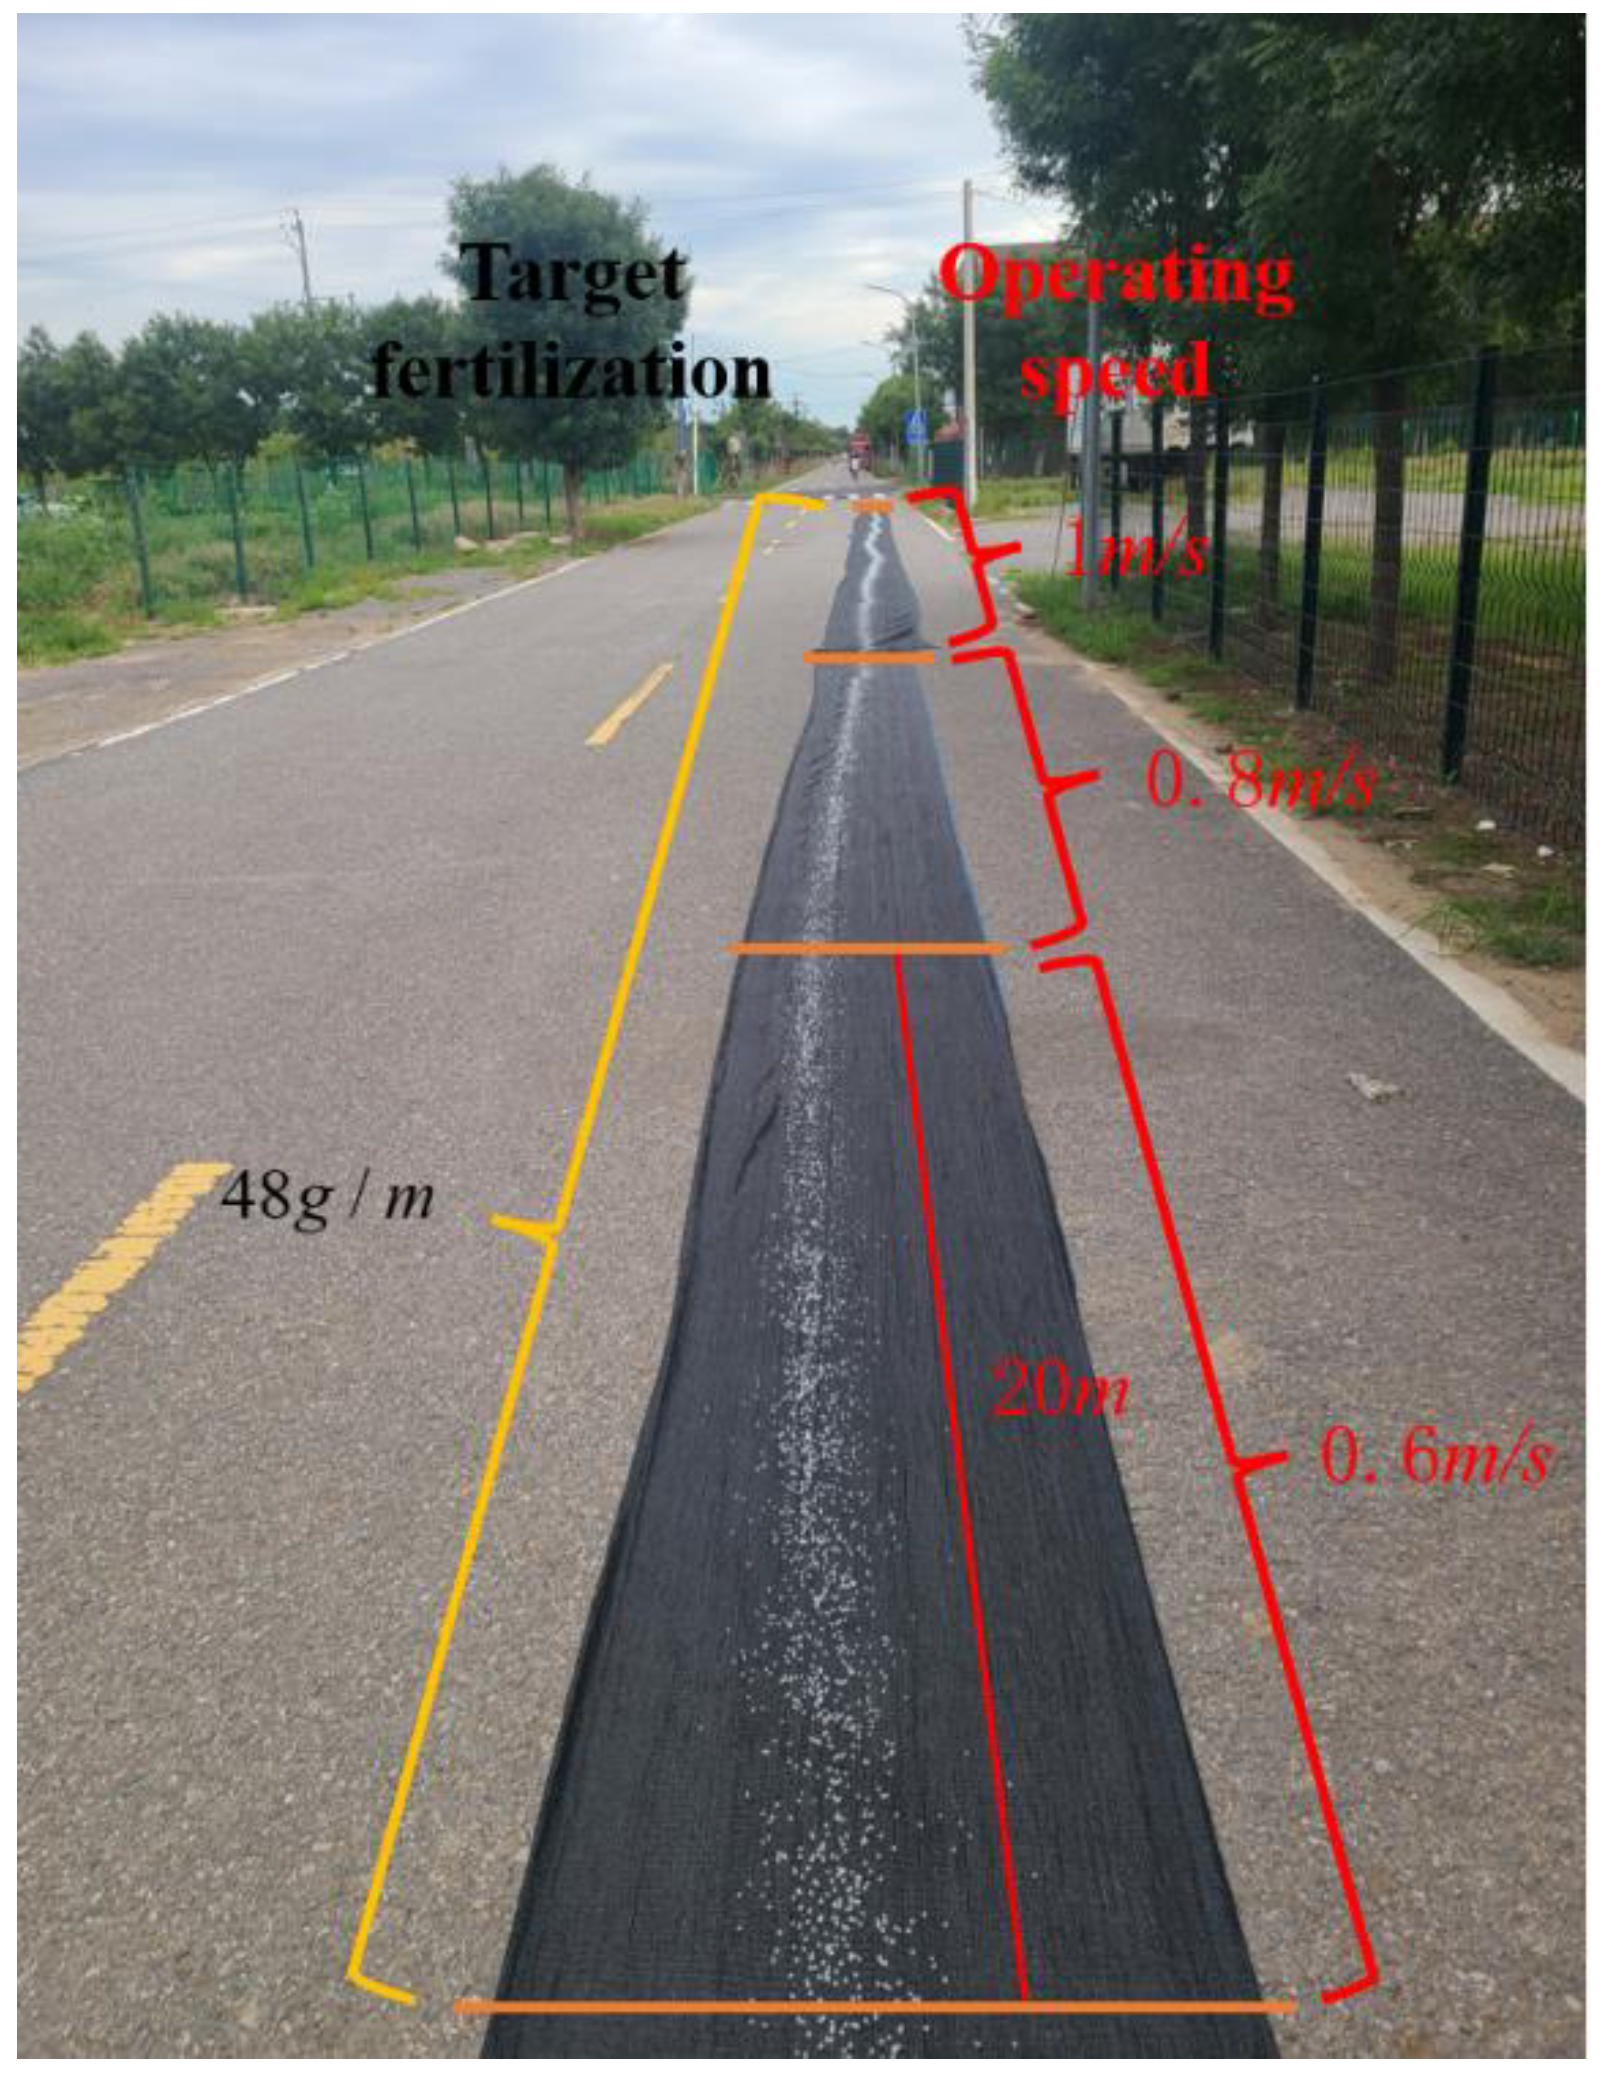
2.4.2. Methods of the Variable-Rate Fertilization Test

In order to verify the control performance of the optimized BP neural network PID controller in the variable-rate fertilization system, a variable-rate fertilization experiment was conducted, in which the control system was tested by using the optimized BP neural network PID controller. The variable fertilizer seeder control system (Chinese standard 35487-2017) is adopted to evaluate the performance indexes of the system, such as the range of fertilizer amount adjustment, the response time of fertilizer amount adjustment, and the control precision of fertilizer amount. As shown in Figure 9, to facilitate the weighing of fertilizer, the fertilizer directly falls into the black cloth through the fertilizer guide pipe.
(1)
Response test of fertilizer discharge motor speed.
The response time of the fertilizer discharge adjustment is expressed by measuring the response time of motor speed. During the test, a single fertilizer discharge motor is taken as the object, the feedback speed of the encoder is taken as the actual speed, the target speed is set to increase from 0 to 3500 r/min, and then decrease from 3500 r/min to 0. The motor speed is then recorded.
(2)
Fertilizer discharge accuracy test of fertilizer discharger.
During the test, a single fertilizer discharger is taken as the object, polyethylene plastic particles (simulated fertilizer) are used for the test, and the target fertilization and vehicle speed are separately taken as variables for the test. During the test, black havelock is laid on the ground to facilitate the collection and weighing of simulated fertilizer. The actual fertilization is calculated according to Equation (22).
Q 2 = G x
where G is the weight of fertilizer discharged, g; x is the driving distance, m.
The error of fertilizer discharge is calculated according to Equation (23).
δ = ( Q 1 Q 2 Q 1 ) × 100 %  
where δ is the control error of fertilizer discharge, %; Q 1 is the target fertilization, g/m; Q 2 is the actual amount of fertilization, g/m.
The coefficient of variation is calculated according to Equation (24).
C V = S D M e a n × 100 %
where CV is the coefficient of variation, %; SD is the standard deviation of multiple groups of tests during weighing; and Mean is the average value of multiple groups of tests during weighing.
According to the upper computer interface of the variable-rate fertilization system, the monitoring fertilization amount is obtained, and the formula for calculating the monitoring error is as Equation (25).
γ = ( Q 3 Q 2 Q 3 ) × 100 %  
where γ is the monitoring error of fertilizer discharge, %; Q 2 is the actual amount of fertilization, g/m; and Q 3 is the monitored amount of fertilization, g/m.
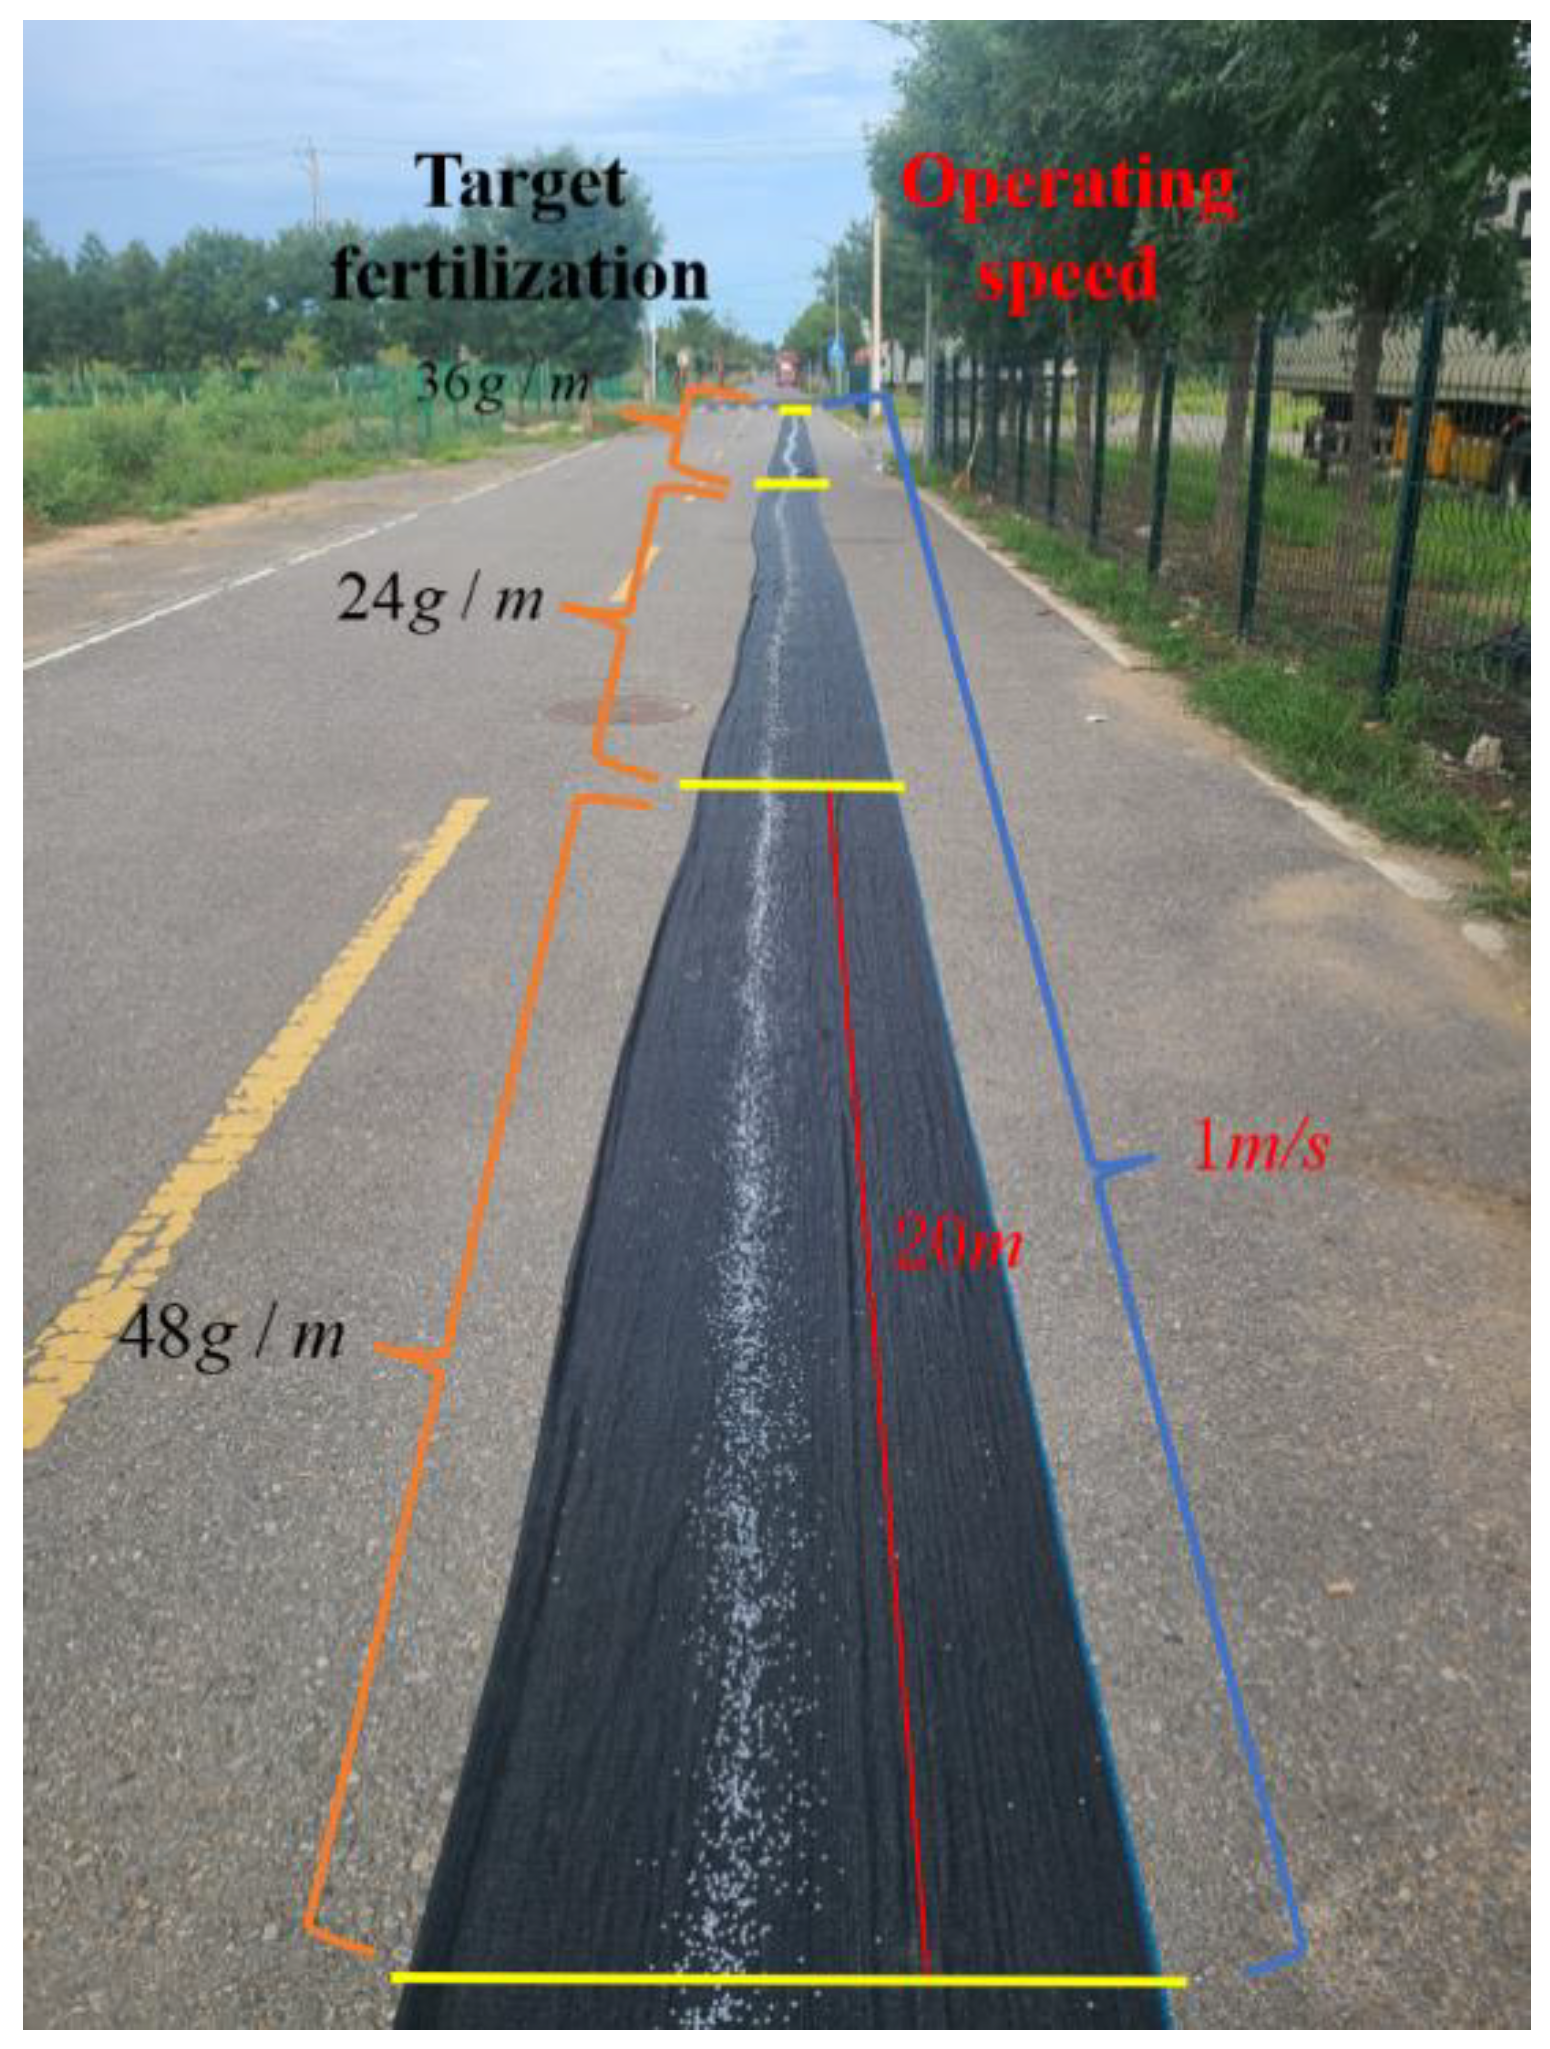
  • Target fertilization as a variable.
With the target amount of fertilizer discharged as a variable, import the prescription map into the on-board computer. During the driving process, the prescription map changes the target amount of fertilizer discharged every 20 m, which is 48 g/m, 24 g/m, and 36 g/m in sequence. During the test, the traveling speed of the four-wheel operation platform is maintained at 1 m/s. The fertilizer discharging motor directly drops the fertilizer into the black havelock and weighs the collected fertilizer. After repeated tests, record the average value. Calculate the actual fertilization, coefficient of variation, fertilizer discharge error, and other parameters according to Equations (22)–(25).
2.
Vehicle speed as a variable.
With the vehicle speed as the variable, the fertilization amount is set at 48 g/m, and the change speed is 0.6, 0.8, and 1.0 m/s every 20 m when the four-wheel operation platform is running. Collect and weigh the fertilizer discharged from the fertilizer discharger. Repeat the test three times and take the average value. Calculate the actual fertilization, coefficient of variation, error of fertilizer discharge amount, and other parameters according to Equations (22)–(25).

3. Results

3.1. Results of the Calibration Test

The calibration test results of urea, compound fertilizer, and polyethylene plastic particles (simulated fertilizer) at different rotational speeds are shown in Figure 10. The bivariate correlation analysis results of SPSS are shown in Table 1.
According to Table 2, the p-value of the three fertilizers is far less than 0.01, and the R-value is close to 1, that is, the actual fertilizer discharged by the three fertilizers is linearly and positively correlated with the rotation speed.
According to the linear correlation between the rotating speed and the actual fertilizer amount, the linear regression equation is fitted. According to Equation (3), the fitting coefficient is the fertilizer amount per turn. According to the fitting result, q values of urea, compound fertilizer, and polyethylene plastic particles are 1.016, 1.104, and 0.919 respectively.

3.2. Results of Simulation Test

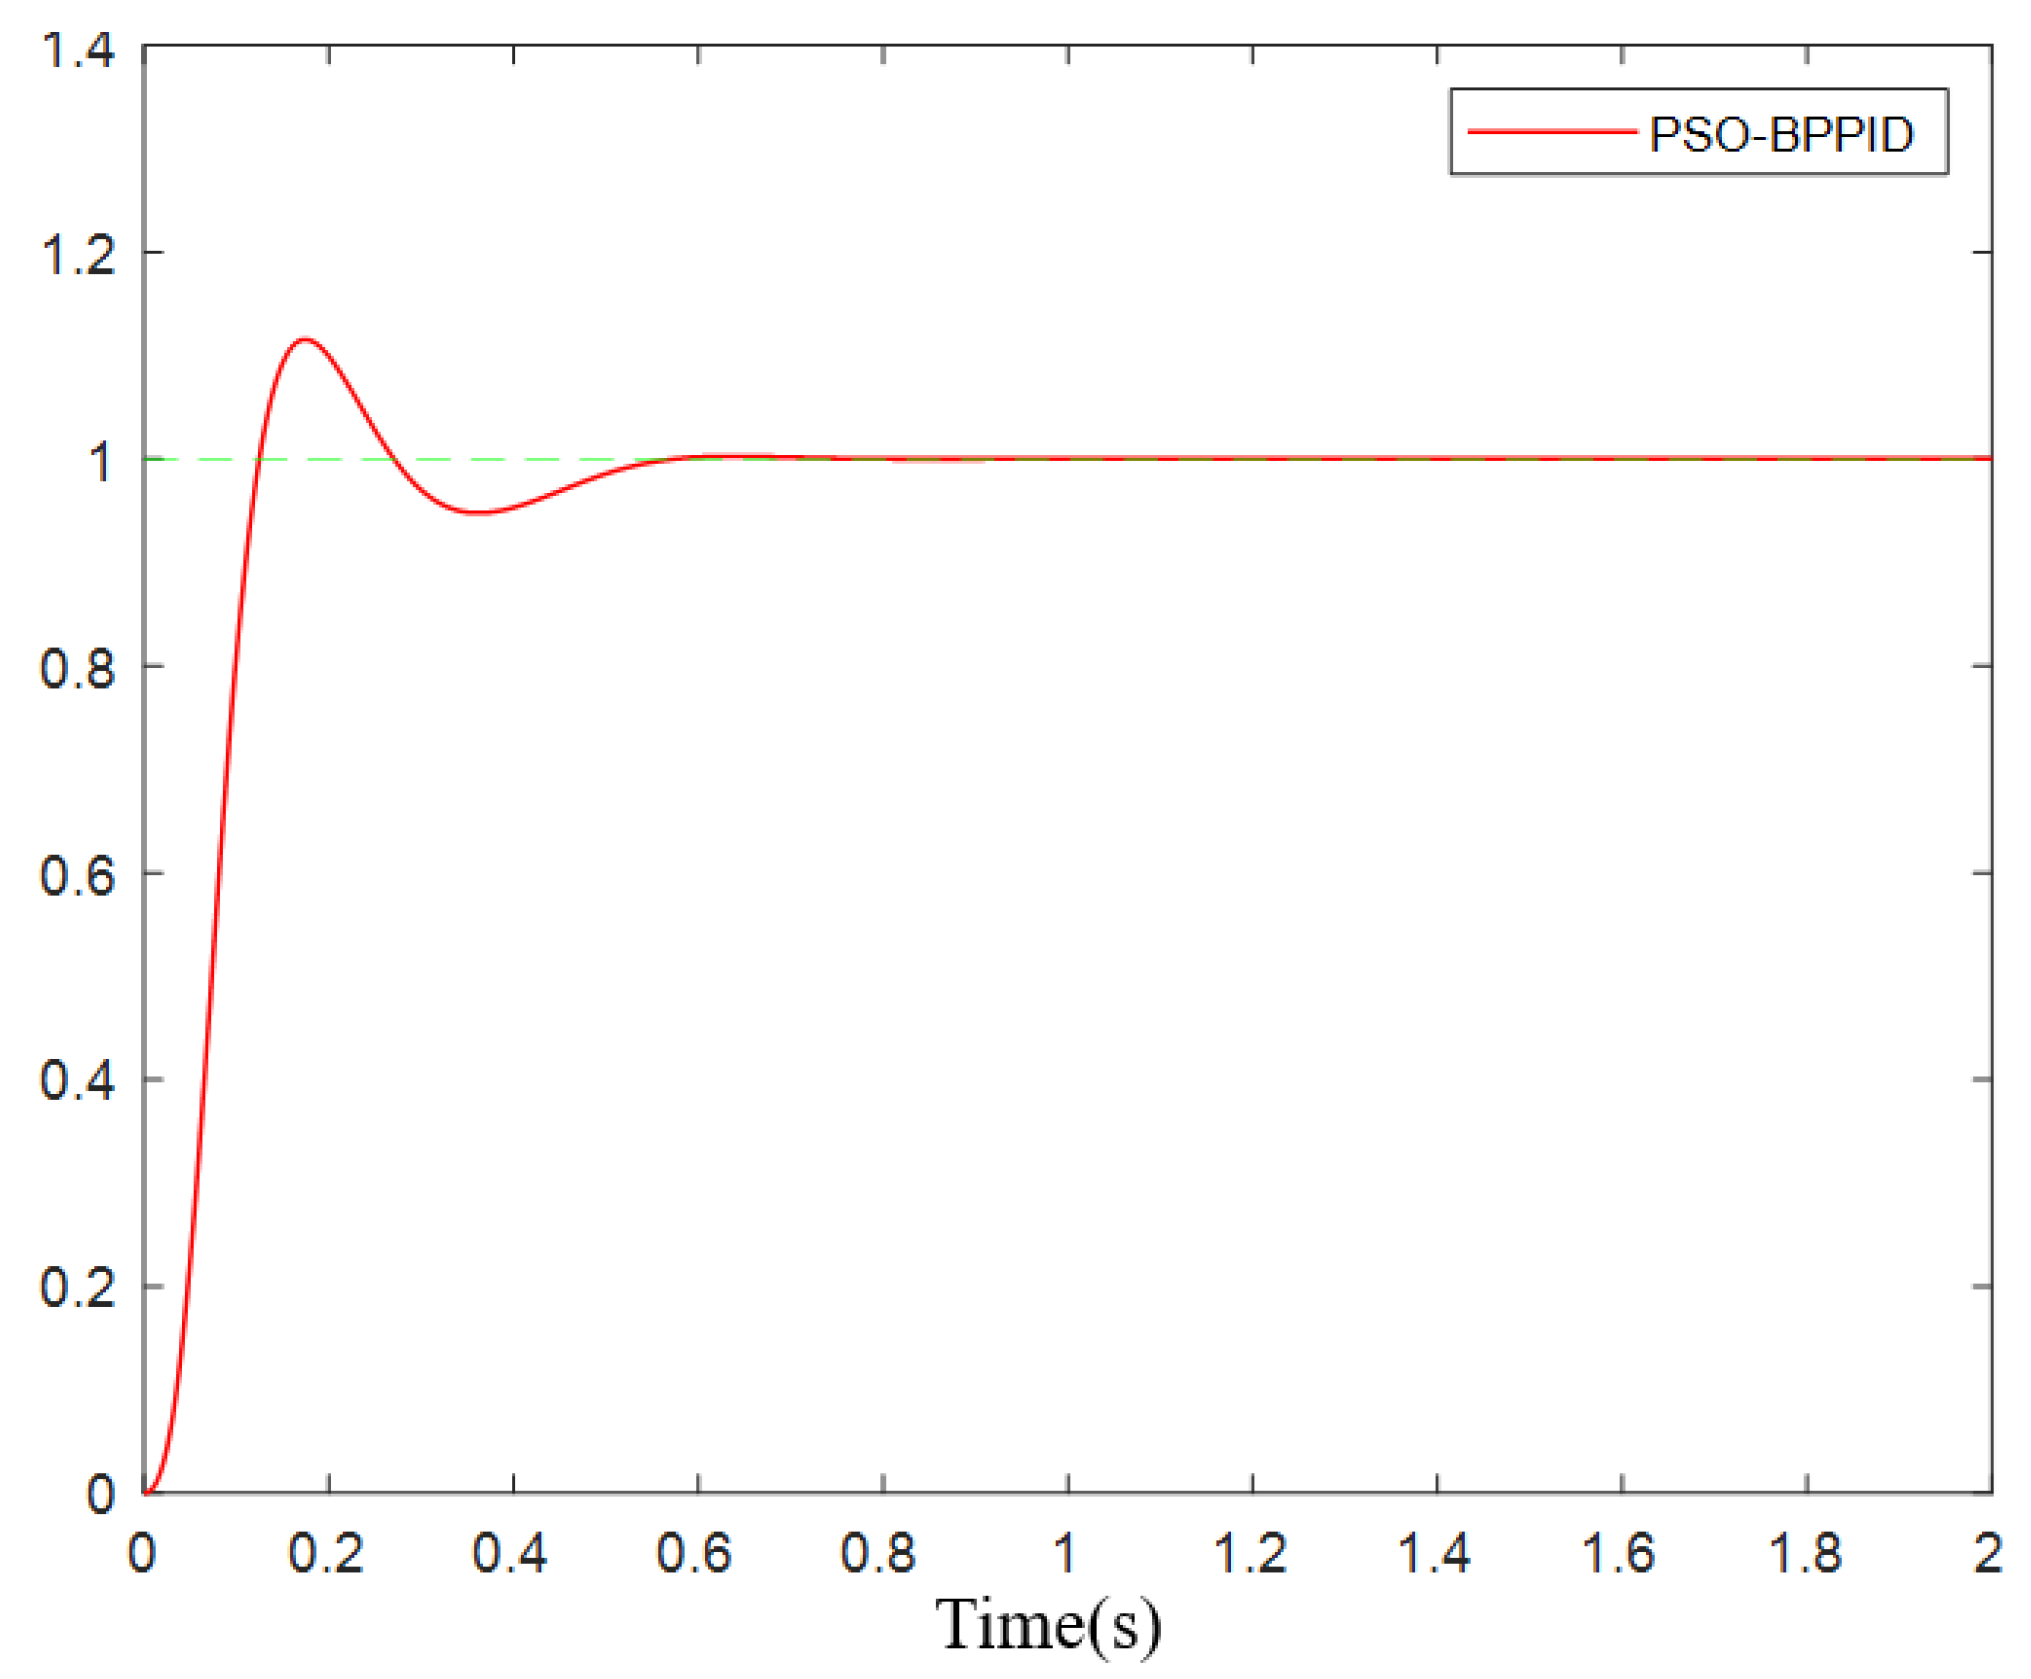
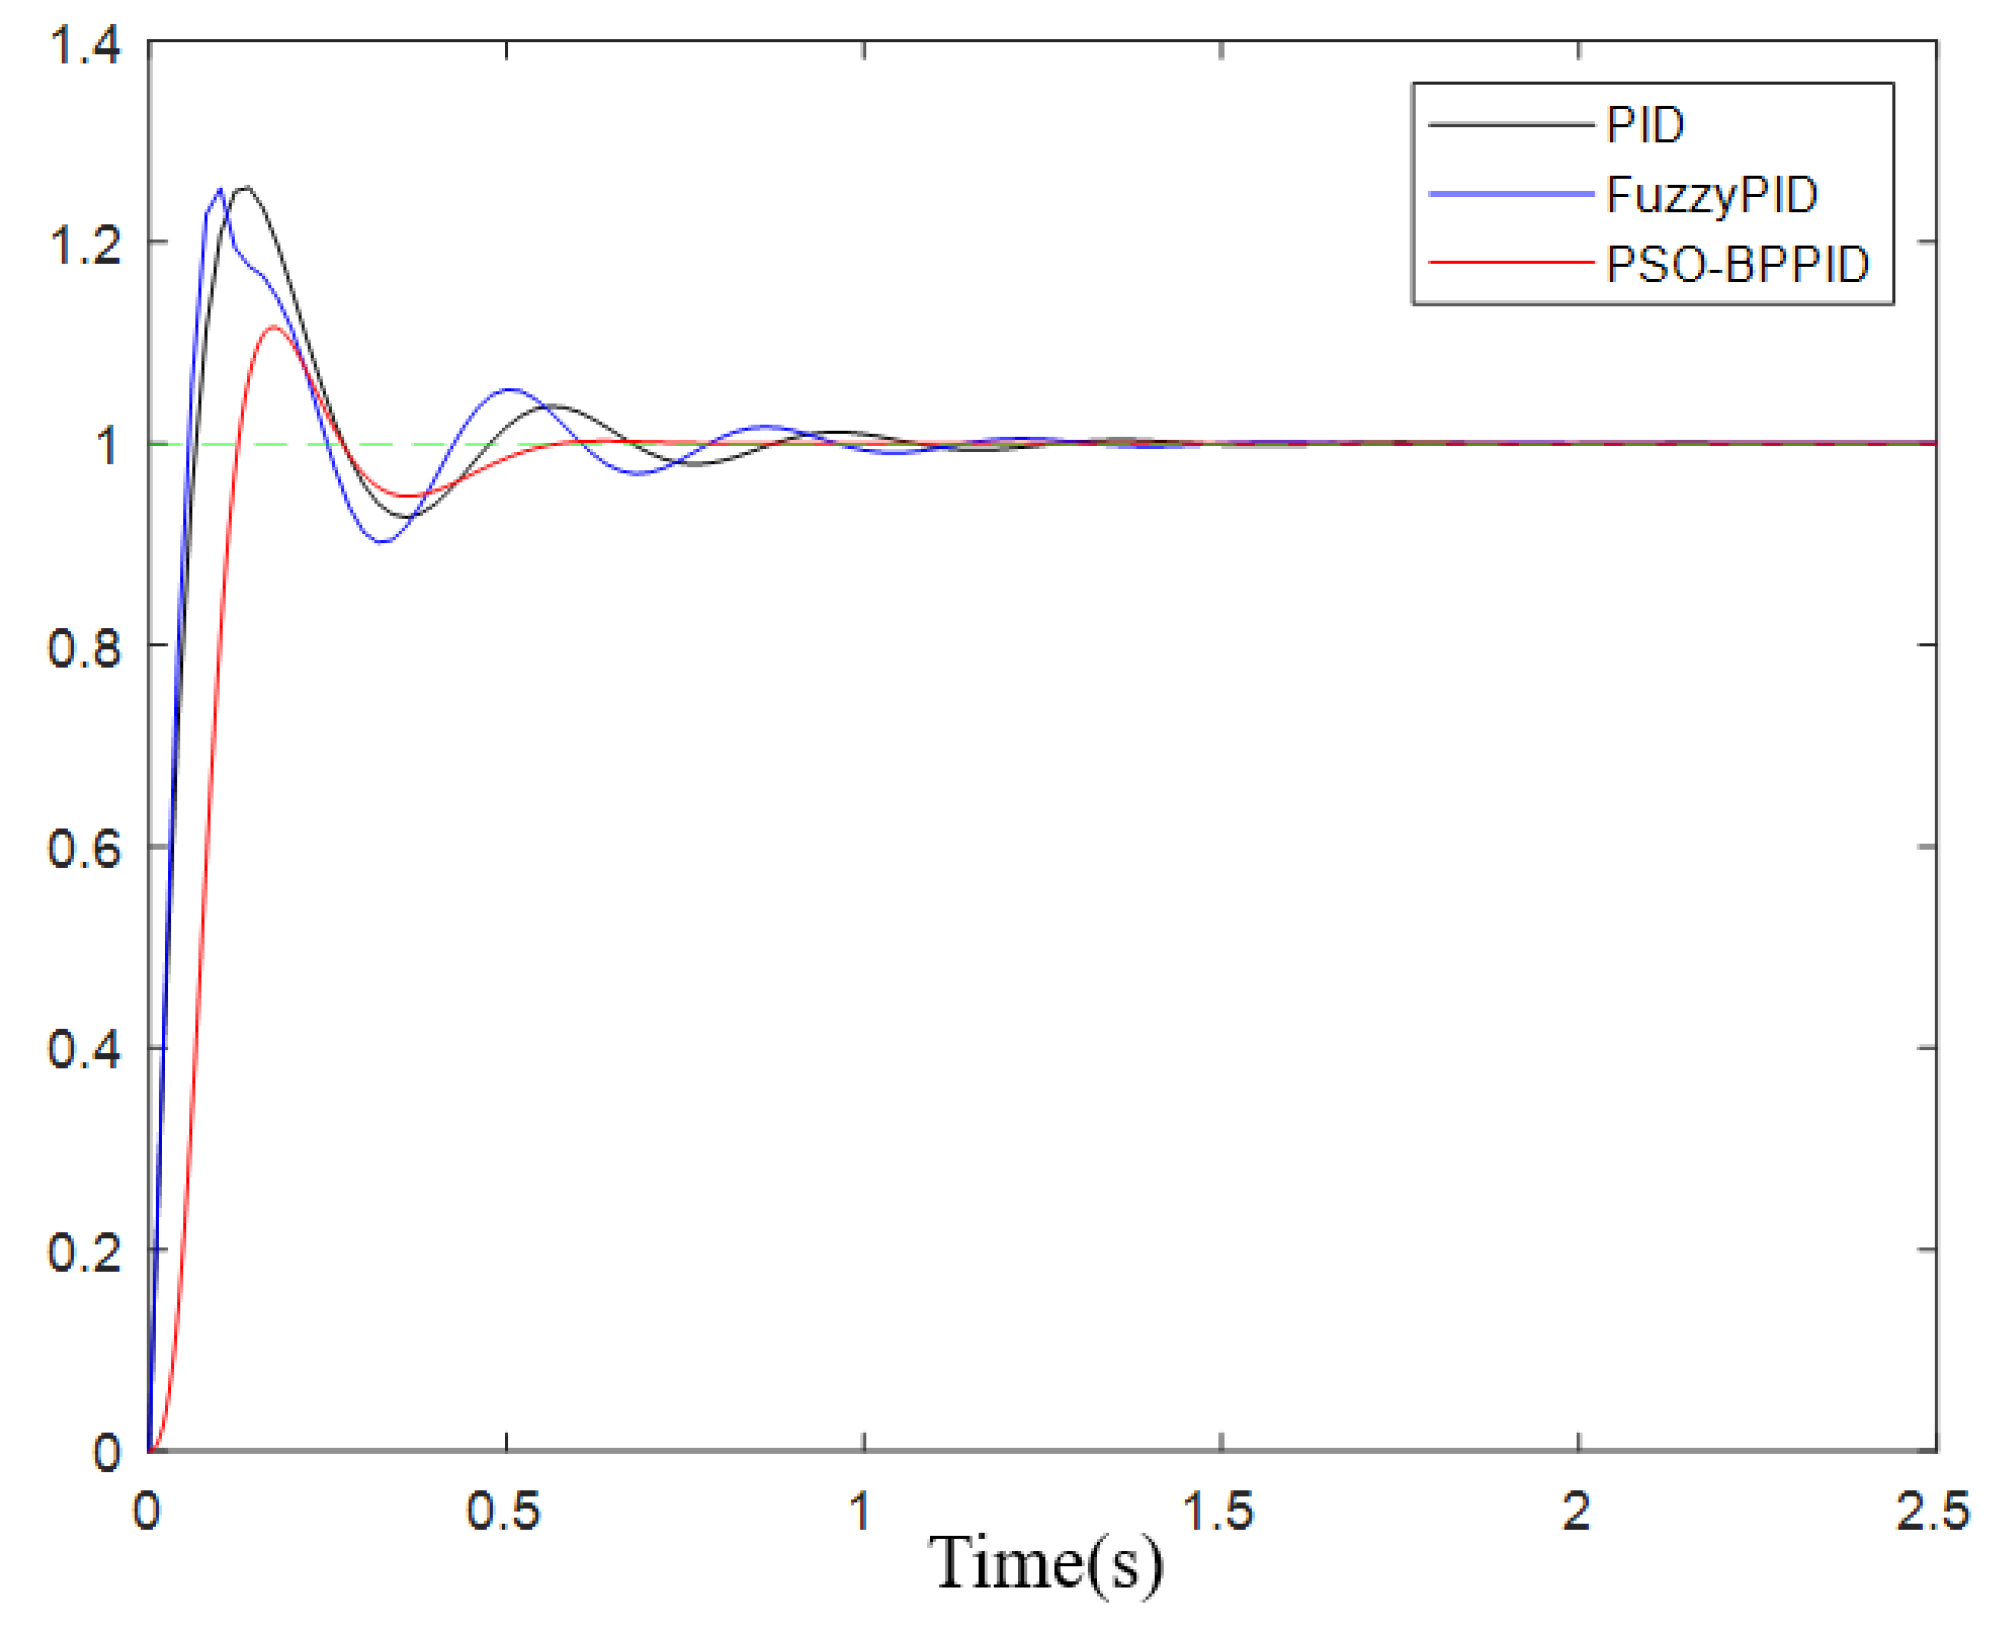
3.2.1. Results of the PSO-BP-PID Step Response Test

According to the structure of the BP neural network, the particle dimension is 30. By setting the particle swarm size to 20, the inertia weight w decreases from 0.9 to 0.4, the number of iterations is set to 100, and the minimum fitness is set to 1 × 10⁻⁵. The initial weights wi and wo of the BP neural network are obtained through offline training of the particle swarm optimization algorithm, as shown in Equations (26) and (27).
w i = [ 0.516 0.856 0.046 0.802 0.542 0.212 1.458 0.186 0.257 0.389 0.426 0.079 0.557 0.333 0.559 ]
w o = [ 0.829 1.178 0.639 2.172 2.155 0.711 0.863 2.233 1.275 0.921 0.957 1.376 0.432 1.563 1.142 ]
The time domain response curve is shown in Figure 11. The overshoot is 12.7%, the rise time is 0.105 s, and the adjustment time is 0.557 s. There is no steady-state error. The adaptive values of Kp, Ki, and Kd are shown in Figure 12. According to the simulation results, the PSO-BP-PID controller can adaptively adjust the parameters of Kp, Ki, and Kd, greatly improving the control performance.

3.2.2. Results of Step Response Contrast Test

The PID controller and fuzzy PID controller are built in Simulink to simulate the step response of the fertilizer discharging motor, and compared with the optimized BP neural network PID controller. The time domain response curve is shown in Figure 13. The performance index comparison of time domain response is shown in Table 3. Through comparison, it can be found that the performance of the fuzzy PID and the PSO-BP-PID controllers is better than that of traditional PID controllers, which can reduce the adjustment time to a certain extent, and the PSO-BP-PID controller can reduce the overshoot to a certain extent.

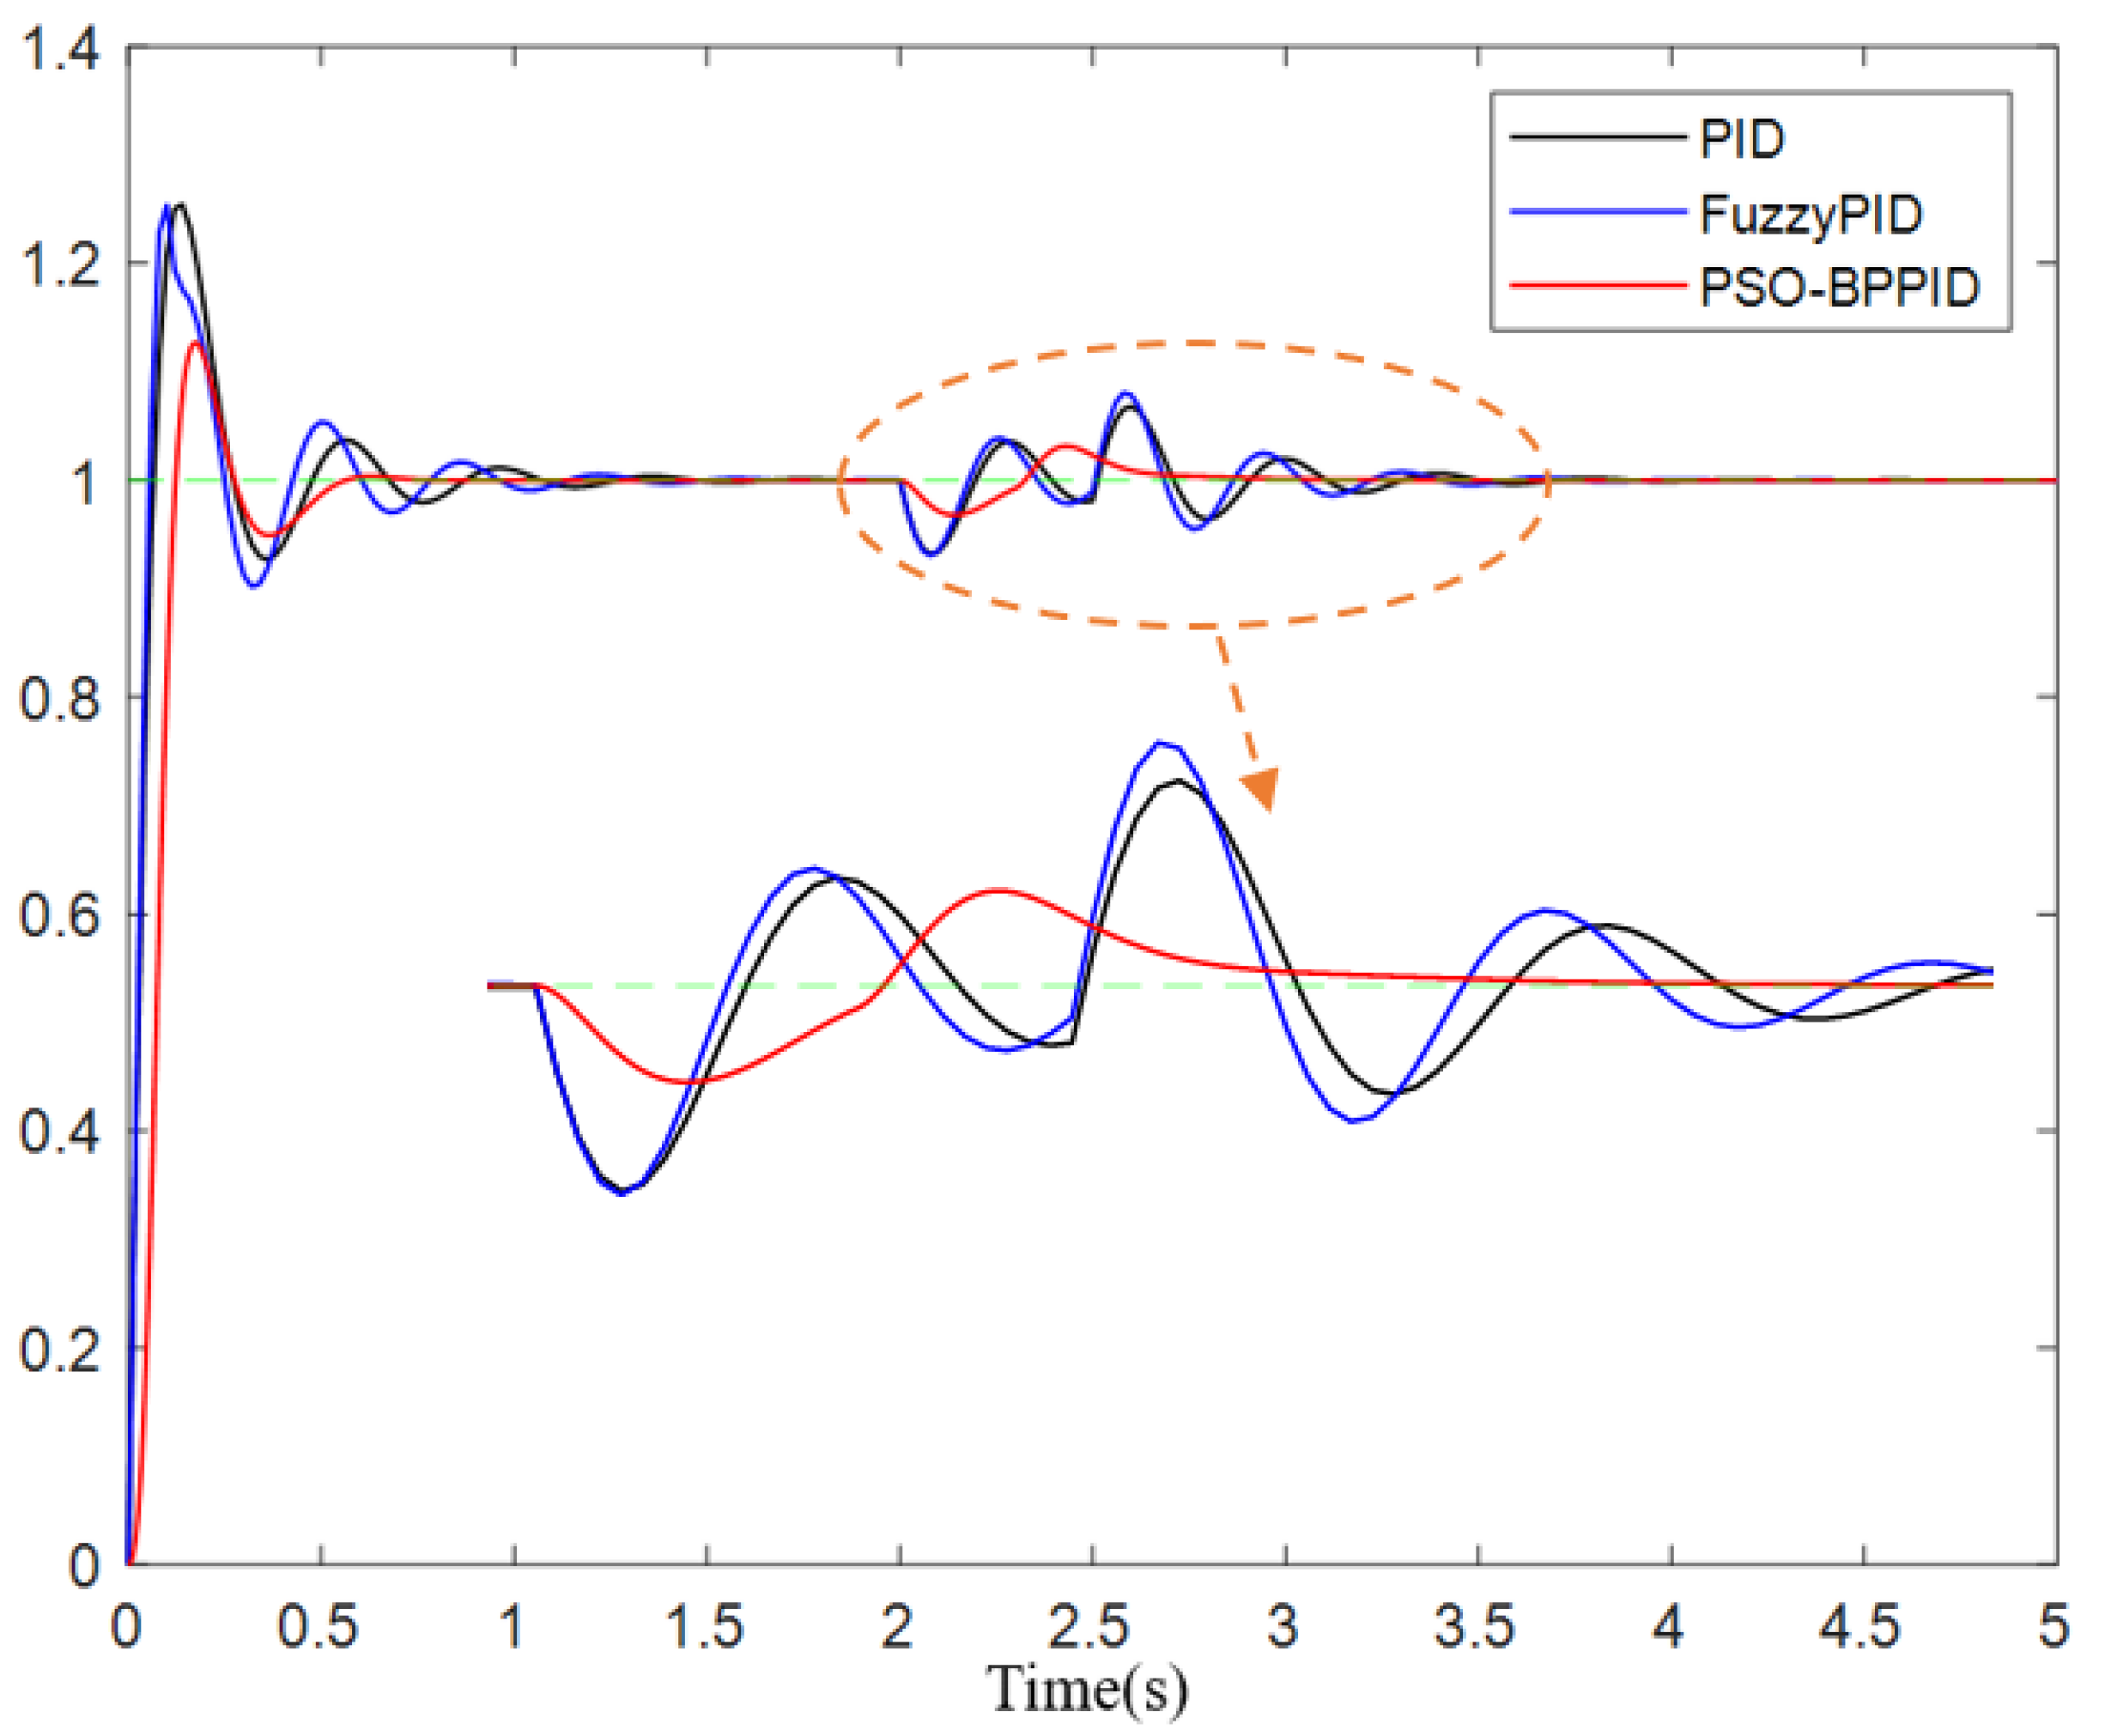
3.2.3. Results of Immunity Comparison Test

In the simulation, the traditional PID controller, fuzzy PID controller, and the PSO-BP-PID controller are also tested for anti-interference. During the simulation process, an interference signal with a duration of 0.5 s and a size of 0.01 V is added in 2 s to test the anti-disturbance capability of the three controllers. The time domain response curve of the three added disturbances is shown in Figure 14. The comparison of anti-disturbance performance indexes can be compared in Table 4, The traditional PID controller and fuzzy PID controller have a poor anti-disturbance ability, the system recovery speed is slow, and the PSO-BP-PID controller has a strong anti-disturbance ability. After the disturbance, the system recovery speed is fast and the fluctuation after the disturbance is minimal.
In conclusion, the adaptive PID controller based on the BP neural network optimized by the PSO algorithm has the best control performance and anti-disturbance ability. The variable-rate fertilization control system adopts the improved BP neural network adaptive PID controller.

3.3. Results of the Variable-Rate Fertilization Test

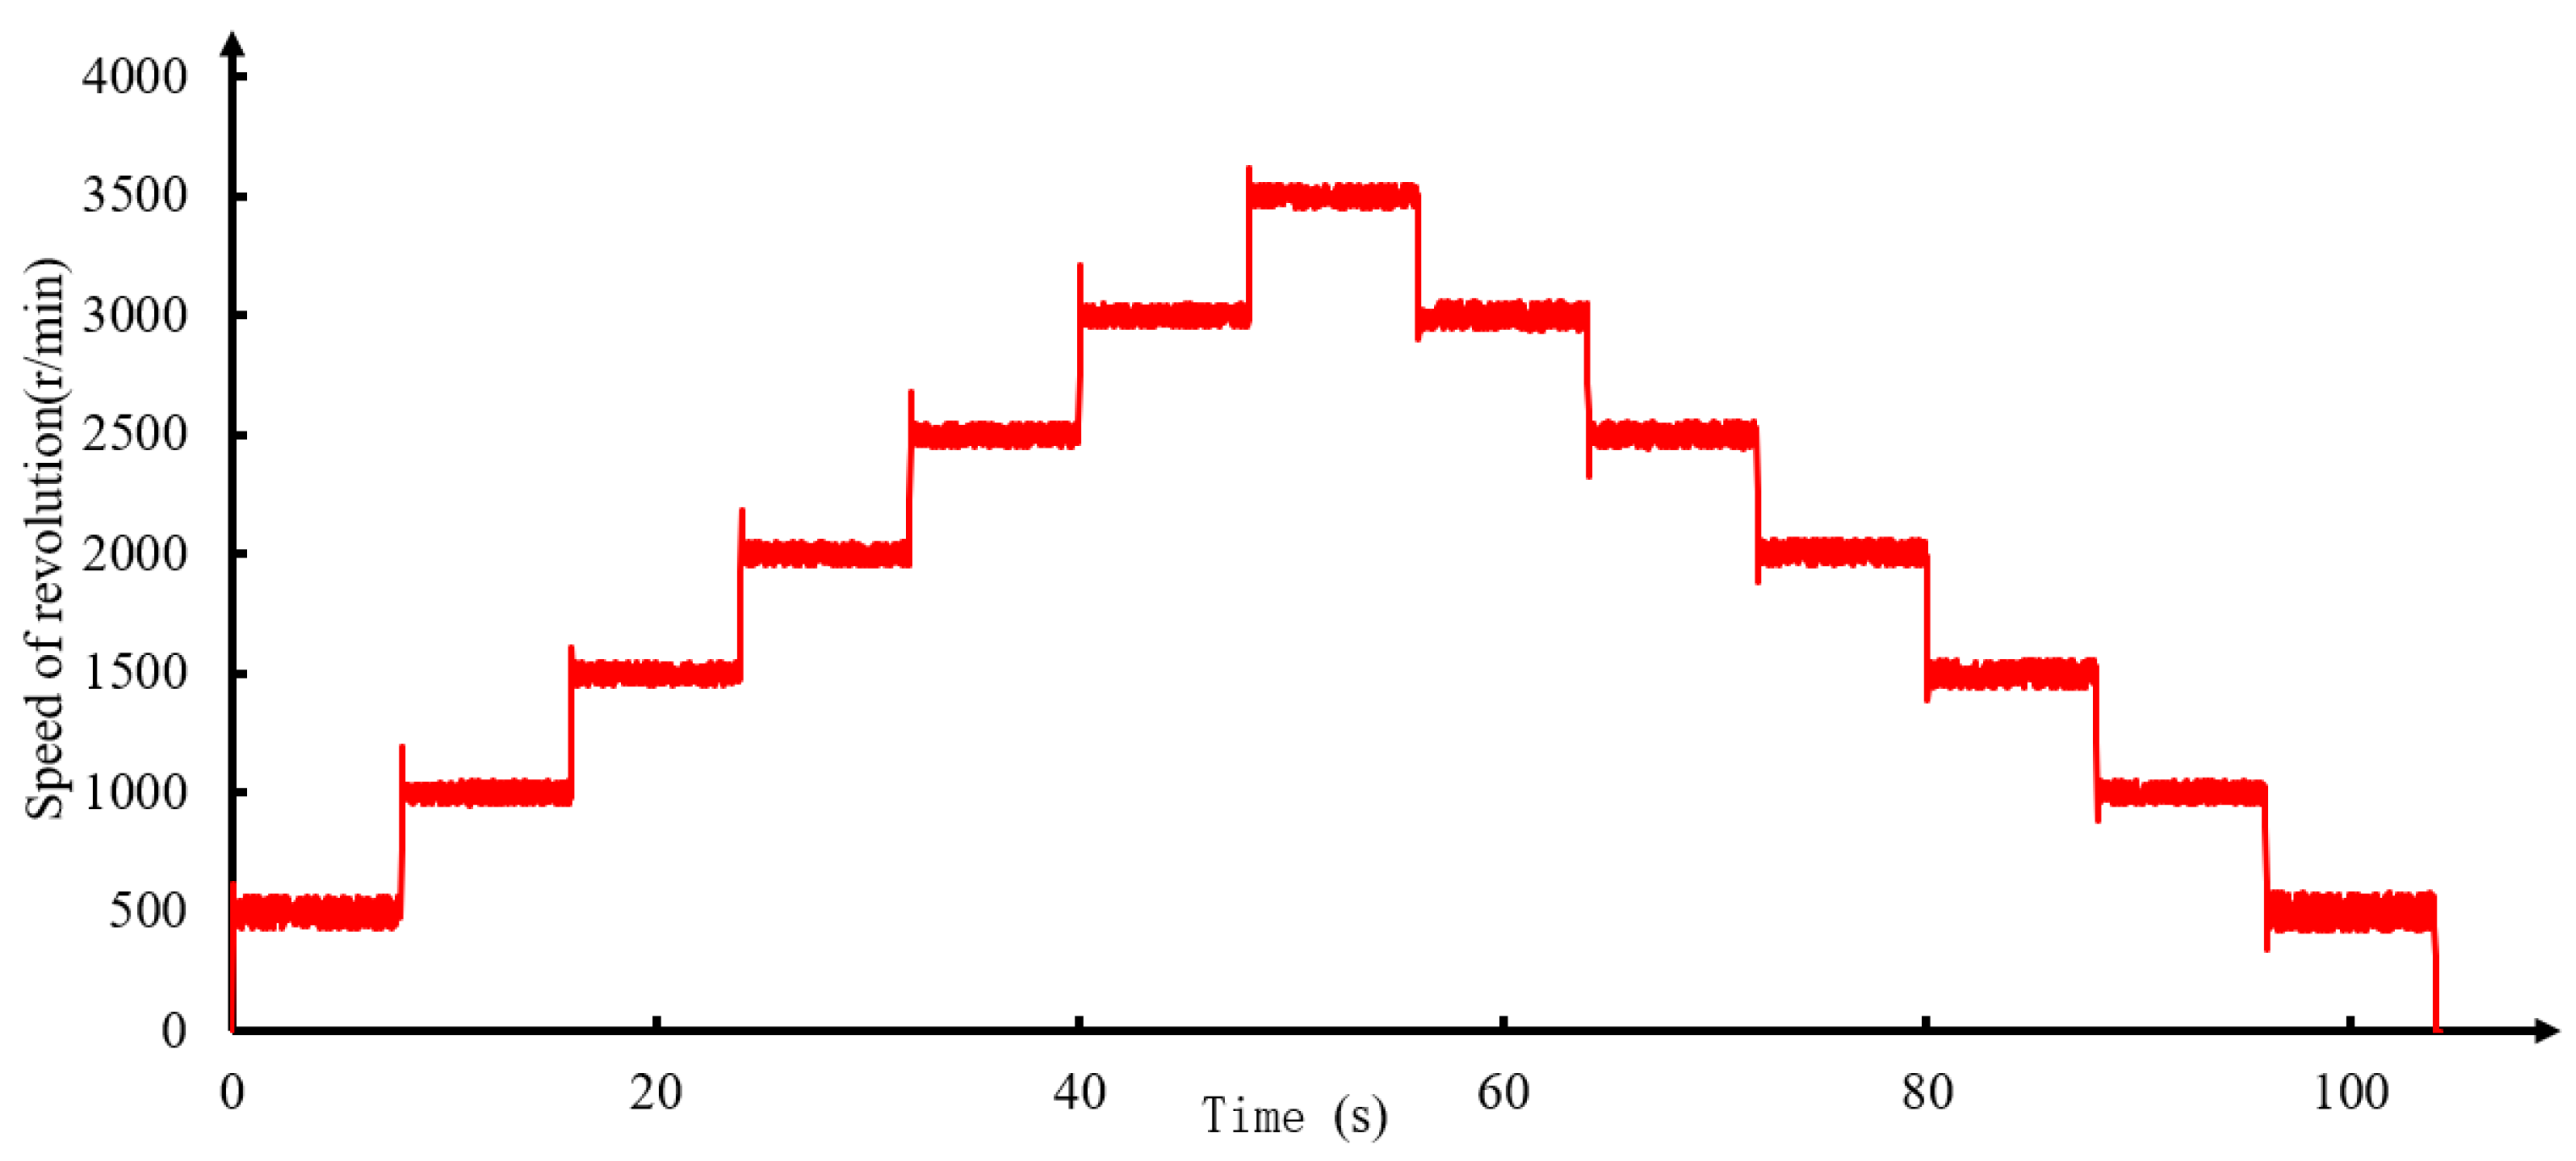
3.3.1. Result of Response Test of Fertilizer Discharge Motor Speed

The curve shown in Figure 15 is to obtain the motor response time. See Table 5 and Table 6 for the test results.
According to Table 5 and Table 6, the average response time of fertilizer discharge adjustment is 0.21 s, and the adjustment range is 500–3500 r/min. The adjustment range of a fertilizer discharge is 16−52 g/m converted from Equation (1) according to different operating speeds.

3.3.2. Result of Fertilizer Discharge Accuracy Test of Fertilizer Discharger

(1)
Result of target fertilization as a variable experiment
Figure 16 shows target fertilization as a variable experiment. According to Table 7, the variable-rate fertilization system can achieve variable-rate fertilization by adjusting the rotation speed of the fertilizer discharge axis according to the prescription map input. The average coefficient of variation of fertilizer discharge of the variable-rate fertilization system under different target fertilizer discharge amounts is 1.93%, the average value of fertilizer discharge error is 1.16%, and the average value of monitoring error is 2.63%. Compared with the traditional PID and fuzzy PID controllers in the references, the accuracy of the controller is improved by 1.68~7.91 percentage points, and the accuracy of the BP-PID controller is improved by 1.36 percentage points.
(2)
Result of vehicle speed as a variable experiment
Figure 17 shows vehicle speed as a variable experiment. According to Table 8, the variable-rate fertilization system can adjust the rotation speed of the fertilizer discharging shaft according to different vehicle speeds to achieve variable-rate fertilization. The average coefficient of variation of fertilizer discharge amount of variable-rate fertilization system at different speeds is 1.05%, the average value of fertilizer discharge error is 1.07%, and the average value of monitoring error is 1.22%. Compared with the traditional PID controller and fuzzy PID controller in the reference, the precision of the controller is increased by 1.77 to 8 percentage points, and the precision of the BP-PID controller is increased by 1.45 percentage points.
In the precision test of fertilizer discharge, only polyethylene plastic particles (simulated fertilizer) were used as test materials. The variable-rate fertilization control performance of urea, compound fertilizer, and other fertilizers needs further experimental analysis.

4. Discussion

In this paper, the PSO-BP-PID controller is designed and verified by simulation and variable-rate fertilization experiments. In the simulation test, the PSO algorithm was used to optimize the initial weight of the BP neural network, which made the adaptive performance of the BP-PID controller better, that is, the overshoot of the PSO-BP-PID controller in the test was reduced, and the anti-interference performance was improved. The experiment of variable-rate fertilization proves that the PSO-BP-PID controller can complete variable-rate fertilization with small errors.
PSO is a global optimization algorithm, which can be used for offline iteration. Previous researchers used this algorithm to optimize the initial parameters of each controller, including the PID controller and fuzzy PID controller. The initial parameters of the PID controller and fuzzy PID controller are few and can be obtained by trial and error, but the weights of the BP neural network are too large to be obtained by trial and error. In this case, the performance of the BP neural network can be greatly improved by using a PSO algorithm for optimization.
Because the parameters of the PSO-BP-PID controller are adaptively adjusted, the controller is also suitable for nonlinear systems. Since the orchard fertilization work requires ditching, the resistance is large. Most of the fertilization machinery is powered by hydraulic systems. The controller can still effectively control the nonlinear hydraulic motors and other controlled objects.

5. Conclusions

Through the mathematical model test of rotation speed and fertilizer discharge amount, it is proved that the rotation speed is a linear positive correlation with the actual fertilizer discharge amount, further proving the feasibility of controlling the fertilizer discharge amount by controlling the rotation speed of the fertilizer discharge motor, and calibrating the fertilizer discharge amount per rotation through the regression coefficient. This establishes the transfer function of the fertilizer discharge motor.
The initial weights of the BP neural network are optimized by particle swarm optimization algorithm, and the adaptive PID controller of the BP neural network is designed. By comparing with the traditional PID controller and fuzzy PID controller through simulation tests, it can be concluded that the optimized BP neural network adaptive PID controller can reduce overshoot, reduce adjustment time, and have a strong ability to resist disturbance. The overall performance is better than other controllers.
The variable-rate fertilization experiment shows that the PSO-BP-PID control system conducts better fertilization performance according to the prescription chart and vehicle speed. The average adjustment response time of fertilizer discharge is 0.21 s, and the adjustment range of a fertilizer discharge is 16–52 g/m according to different operating speeds. The result of target fertilization as variable experiment show that the average fertilizer discharge error is 1.16%, and the result of vehicle speed as variable experiment show that the average fertilizer discharge error is 1.07%. The above results of fertilization control accuracy meet the national standard, and are 1.36 to 8 percentage points higher than the existing fertilizer discharge accuracy. The results provide a feasible scheme for the control strategy of variable-rate fertilization system in orchards.

Author Contributions

Conceptualization, J.Y. and C.W.; methodology, J.Y. and Y.T.; software, J.Y.; validation, J.Y., S.W. and Y.T.; formal analysis, J.Y.; investigation, J.Y.; resources, C.W., L.Z. and Y.T.; data curation, J.Y. and S.W.; writing—original draft preparation, J.Y. and C.W.; writing—review and editing, J.Y., J.P. and C.W.; supervision, Y.T. and C.W.; funding acquisition, C.W., L.Z. and Y.T. All authors have read and agreed to the published version of the manuscript.

Funding

This paper was supported by the following projects: the Innovation and Development Support Program for Key Industries in Southern Xinjiang supported by Xinjiang Production and Construction Corps in China (Grant No. 2020DB003), the Key Program of Open Project from Key Laboratory of Modern Agricultural Engineering of Xinjiang Uygur Autonomous Region in China (Grant No. TDNG20180101), Alar City Science and Technology Project of the First Division of Xinjiang Production and Construction Corps in China (Grant No. 2020ZB03).

Institutional Review Board Statement

Not applicable.

Informed Consent Statement

Not applicable.

Data Availability Statement

Not applicable.

Acknowledgments

The author would like to thank Beijing Zhong Nong Lv Tong Co., Ltd. for providing the test site.

Conflicts of Interest

The authors declare no conflict of interest. The funders had no role in the design of the study; in the collection, analyses, or interpretation of data; in the writing of the manuscript; or in the decision to publish the results.

References

  1. Meng, Z.J.; Zhao, C.J.; Fu, W.Q.; Ji, Y.X.; Wu, G.W. Prescription Map Identification and Position Lag Calibration Method for Variable Rate Application of Fertilizer. Trans. Chin. Soc. Agric. Mach. 2011, 42, 204–209. [Google Scholar]
  2. Bai, J.B.; Tian, M.; Li, J.Q. Control System of Liquid Fertilizer Variable-Rate Fertilization Based on Beetle Antennae Search Algorithm. Processes 2022, 10, 357. [Google Scholar] [CrossRef]
  3. Martins, R.N.; Pinto, F.A.; Moura, A.D.; Siqueira, W.C.; Villar, F.M. Nitrogen variable rate fertilization in corn crop prescribed by optical sensor. J. Plant Nutr. 2020, 43, 1681–1688. [Google Scholar] [CrossRef]
  4. Alameen, A.A.; Al-Gaadi, K.A.; Tola, E.K. Development and performance evaluation of a control system for variable rate granular fertilizer application. Comput. Electron. Agric. 2019, 160, 31–39. [Google Scholar] [CrossRef]
  5. An, X.F.; Fu, W.Q.; Wei, X.L.; Cong, Y.; Wang, P. Evaluation of Four-element Variable Rate Application of Fertilization Based on Maps. Trans. Chin. Soc. Agric. Mach. 2017, 48, 66–70. [Google Scholar]
  6. Meng, Z.J.; Zhao, C.J.; Liu, H.; Huang, W.Q.; Fu, W.Q.; Wang, X. Development and performance assessment of map-based variable rate granule application system. J. Jiangsu Univ. 2009, 30, 338–342. [Google Scholar]
  7. Yang, S.; Zhai, C.Y.; Long, J.; Zhang, B.; Li, H.Z. Wolfberry tree dual-model detection method and orchard target-oriented fertilization system based on photoelectric sensors. Int. J. Agric. Biol. Eng. 2018, 11, 65–73. [Google Scholar] [CrossRef]
  8. Huai, B.F.; Zhang, C.S.; Zhang, P.X.; Han, J.; Wang, X.; Zhuang, W.D. BP-PID Control Method in Control System of Variable Rate Fertilizer Application. J. Heilongjiang Bayi Agric. Univ. 2015, 27, 95–98. [Google Scholar]
  9. Wang, X.C.; Chen, M.; Sun, G.X.; Zhang, Y.; Zhang, Y.N. Design and test of control system on variable fertilizer applicator for winter wheat. Trans. Chin. Soc. Agric. Eng. 2015, 31, 88–92. [Google Scholar]
  10. Zhang, J.C.; Yan, S.C.; Ji, W.Y.; Song, B.G.; Zheng, P. Precision Fertilization Control System Research for Solid Fertilizers Based on Incremental PID Control Algorithm. Trans. Chin. Soc. Agric. Mach. 2021, 52, 99–106. [Google Scholar]
  11. Yuan, Q.C.; Xu, L.M.; Niu, C.; Ma, S.; Yan, C.G.; Zhao, S.J. Design and Test of Layered Variable Rate Fertilizer Discharge Control System for Organic Fertilizer Deep Applicator. Trans. Chin. Soc. Agric. Mach. 2020, 51, 195–202. [Google Scholar]
  12. Sun, Y.J.; Shen, J.X.; Dou, Q.Q.; Li, Q.L.; Chen, G.; Sun, Y.T. Design and Test of Monitoring System of Notillage Planter Based on Cortex-M3 Processor. Trans. Chin. Soc. Agric. Eng. 2018, 49, 50–58. [Google Scholar]
  13. An, X.F.; Fu, W.Q.; Wang, P.; Wei, X.L.; Li, L.W.; Meng, Z.J. Development of Variable Rate Fertilization Control System Based on Matching Fertilizer Line and Seed Line of Wheat. Trans. Chin. Soc. Agric. Eng. 2019, 50, 96–101. [Google Scholar]
  14. Zhang, J.Q.; Liu, G.; Hu, H.; Huang, J.Y. Development of bivariate fertilizer control system via independent control of fertilizing unit. Trans. Chin. Soc. Agric. Eng. 2021, 37, 38–45. [Google Scholar]
  15. Ren, H.J.; Hou, B.; Zhou, G.; Shen, L.; Wei, C.; Li, Q. Variable Pitch Active Disturbance Rejection Control of Wind Turbines Based on BP Neural Network PID. IEEE Access 2020, 8, 71782–71797. [Google Scholar] [CrossRef]
  16. Luo, Q.Y.; Li, J.X.; Zhang, H. Drag coefficient modeling of heterogeneous connected platooning vehicles via BP neural network and PSO algorithm. Neurocomputing 2022, 484, 117–127. [Google Scholar] [CrossRef]
  17. Ibrahim, B.; Abdelkader, H.; Patrice, W. Advanced Control of Doubly Fed Induction Generator for Wind Power Systems: Optimal Control of Power Using PSO Algorithm. Appl. Mech. Mater. 2022, 905, 29–42. [Google Scholar]
  18. Chavoshian, M.; Taghizadeh, M.; Mazare, M. Hybrid Dynamic Neural Network and PID Control of Pneumatic Artificial Muscle Using the PSO Algorithm. Int. J. Autom. Comput. 2020, 17, 428–438. [Google Scholar] [CrossRef]
  19. Chen, M.; Lu, W.; Wang, X.C.; Sun, G.X.; Zhang, Y.; Pan, F. Design and Experiment of Optimization Control System for Variable Fertilization in Winter Wheat Field Based on Fuzzy PID. Trans. Chin. Soc. Agric. Mach. 2016, 47, 71–76. [Google Scholar]
  20. Song, X.; Li, H.; Chen, C.; Xia, H.; Zhang, Z.; Tang, P. Design and Experimental Testing of a Control System for a Solid-Fertilizer-Dissolving Device Based on Fuzzy PID. Agriculture 2022, 12, 1382. [Google Scholar] [CrossRef]
  21. Yao, Y.F.; Chen, X.G.; Ji, C.; Chen, J.C.; Zhang, H.; Pan, F. Design and experiments of the single driver for maize precision seeders based on fuzzy PID control. Trans. Chin. Soc. Agric. Eng. 2022, 38, 12–21. [Google Scholar]
  22. Nuchkrua, T.; Leephakpreeda, T. Fuzzy Self-Tuning PID Control of Hydrogen-Driven Pneumatic Artificial Muscle Actuator. J. Bionic Eng. 2013, 10, 329–340. [Google Scholar] [CrossRef]
  23. Li, K.; Boonto, S.; Nuchkrua, T. On-line Self Tuning of Contouring Control for High Accuracy Robot Manipulators under Various Operations. Int. J. Control Autom. Syst. 2020, 18, 1818–1828. [Google Scholar] [CrossRef]
  24. Zhang, M.L.; Zhang, Y.J.; He, X.L.; Gao, Z.J. Adaptive PID Control and Its Application Based on a Double-Layer BP Neural Network. Processes 2021, 9, 1475. [Google Scholar] [CrossRef]
  25. Pei, G.J.; Yu, M.; Xu, Y.H.; Ma, C.; Lai, H.H.; Chen, F.K.; Lin, H. An Improved PID Controller for the Compliant Constant-Force Actuator Based on BP Neural Network and Smith Predictor. Appl. Sci. 2021, 11, 2685. [Google Scholar] [CrossRef]
Figure 1. Schematic diagram of fertilization operation in an orchard.
Machines 10 00982 g001
Figure 2. Fertilization experiment platform.
Machines 10 00982 g002
Figure 3. Principle of fertilization platform.
Machines 10 00982 g003
Figure 4. Man-machine Interface.
Machines 10 00982 g004
Figure 5. Variable-rate fertilization system in an orchard control block diagram.
Machines 10 00982 g005
Figure 6. A PID control system diagram based on the PSO-BP neural network.
Machines 10 00982 g006
Figure 7. Flow chart of the BP neural network optimization based on particle swarm optimization algorithm.
Machines 10 00982 g007
Figure 8. Simulation flow chart of the PSO-BP-PID controller.
Machines 10 00982 g008
Figure 9. Variable-rate fertilization test.
Machines 10 00982 g009
Figure 10. Actual fertilizer discharge amount at different rotating speeds.
Machines 10 00982 g010
Figure 11. Time domain simulation curve of the PSO-BP-PID controller step response.
Machines 10 00982 g011
Figure 12. The adaptive curve of step response parameter of the PSO-BP-PID controller.
Machines 10 00982 g012
Figure 13. Comparison of time domain response curves.
Machines 10 00982 g013
Figure 14. Anti-disturbance simulation curves.
Machines 10 00982 g014
Figure 15. Speed response curve.
Machines 10 00982 g015
Figure 16. Precision test of fertilizer discharge under different amounts.
Machines 10 00982 g016
Figure 17. Fertilizer discharge accuracy test under different vehicle speeds.
Machines 10 00982 g017
Table 1. ZN Critical Scaling Method Parameter Tuning.
PID ControllerKpTiTd
P0.5Ku//
PI0.45Ku0.85Tu/
PID0.6Ku0.5Tu0.12Tu
Ki = Kp × T/Ti, Kd = Kp × Td/T, T = 0.02.
Table 2. Correlation analysis between different fertilizer rotation speeds and fertilizer discharge.
Fertilizer Typep-ValueR-Value
Urea3.4 × 10−90.99968
Compound fertilizer1.08 × 10−80.99950
Polyethylene plastic particles1 × 10−100.99997
Table 3. Step response performance index comparison.
ControllerOvershoot σ Rise Time t r Adjustment Time t s
Traditional PID25.4%0.058 s1.555 s
Fuzzy PID25.4%0.053 s1.443 s
PSO-BP-PID12.7%0.105 s0.557 s
Table 4. Comparison of anti-disturbance performance indexes.
ControllerDisturbance Recovery Time t i Maximum Fluctuation μ
Traditional PID3.654 s6.8%
Fuzzy PID3.923 s8.1%
PSO-BP-PID2.849 s3.2%
Table 5. Response test for increasing speed of dc motor of single fertilizer apparatus.
Rotating Speed (Increasing)
r/min
0 to 500500 to 10001000 to 15001500 to 20002000 to 25002500 to 30003000 to 3500
Response time s0.28 s0.24 s0.2 s0.14 s0.18 s0.22 s0.24 s
Table 6. Response test of dc motor speed decline of single fertilizer apparatus.
Rotating Speed (Decreasing) r/min3500 to 30003000 to 25002500 to 20002000 to 15001500 to 10001000 to 500500 to 0
Response time s0.22 s0.22 s0.18 s0.16 s0.18 s0.2 s0.26 s
Table 7. Fertilizer discharge precision test of variable-rate fertilization system under different fertilizer discharge amounts.
Operating Speed m/sTarget
Fertilization
g/m
Actual
Fertilization g/m
Coefficient of Variation %Fertilizer Discharge Error %Monitoring Fertilization g/mMonitoring
Error %
1.02423.4722.832.2024.524.47
3635.7841.340.6036.4481.86
4848.3201.630.6749.0681.55
Table 8. Fertilizer discharge accuracy test of variable-rate fertilization system at different speeds.
Target
Fertilization g/m
Operating Speed m/sActual
Fertilization g/m
Coefficient of Variation %Fertilizer Discharge Error %Monitoring Fertilization g/mMonitoring
Error %
480.647.4321.061.1848.2521.69
0.847.3961.221.2548.3441.96
1.048.3720.880.7848.8681.02
Publisher’s Note: MDPI stays neutral with regard to jurisdictional claims in published maps and institutional affiliations.

