Technical Note

Simulation and Post-Processing for Advanced Driver Assistance System (ADAS)

by
Matteo Dollorenzo
1,
Vincenzo Dodde
1,
Nicola Ivan Giannoccaro
2,* and
Davide Palermo
1
1
Nardò Technical Center S.r.l., A Porsche Engineering Company, 73048 Nardò, Italy
2
Department of Engineering Innovation, University of Salento, 73100 Lecce, Italy
*
Author to whom correspondence should be addressed.
Machines 2022, 10(10), 867; https://doi.org/10.3390/machines10100867
Submission received: 15 August 2022 / Revised: 6 September 2022 / Accepted: 23 September 2022 / Published: 27 September 2022

Abstract

:
Considering the continuous development in the automotive sector and autonomous driving technology, it is necessary to conduct continuous research to identify the main points that can allow continuous improvement of system autonomy. In addition to designing new components, an important aspect is characterizing the test procedures uniformly. The present work is related to analyzing the testing phases of a vehicle concerning the post-processing of the tests, using suitable software and routines, and creating an overall summary report that includes information on the type of instrumentation and type of test and post-processing results. The paper proposes the generation of an innovative tool designed to improve the generation capacity of test maneuvers for Advanced Driver Assistance Systems (ADASs) and to automate the collection and analysis phase of data relating to tests for a Lane System’s Support System (LSS), Autonomous Emergency Braking (AEB), and Car to Pedestrian Nearside Child (CPNC) comply with Euro NCAP LSS 3.0.2, Euro NCAP AEB C2C 3.0.2 and UNECE R-152. The goal was achieved with the collaboration of the company Nardò Technical Center S.r.l. The entire post-processing routine was developed from data relating to experimental tests carried out in the company.

1. Introduction

In Advanced Driver Assistance Systems (ADASs), many steps have been made to make vehicle drivability increasingly safer and avoid the risk of collisions or accidents. As evidenced by sources released by the European Union in 2017 [1], there has been a decrease of about 50% in fatal road accidents since 2001, compared to an increase of about 20% in cars transiting on European roads. Given the continuous development in the automotive sector, it is necessary to carry out continuous research to identify the main points that can allow a continuous improvement of the system. In this sense, it is necessary to carry out the same test procedure in addition to the design of new components.
The main cause of accidents is human error (distraction and violation of the traffic code). For this reason, the automotive industry has focused on reinforcing and making passenger and commercial vehicles safer. Security measures can be classified into active and passive measures:
  • Active Safety Systems help prevent accidents altogether or at least reduce the degree of damage in an emergency situation. Among these systems, the systems that avoid wheel locking (anti-blocking systems, ABS), electronic stability control (ESC), and Autonomous Emergency Braking (AEB) systems are highlighted that autonomously intervene in stopping the vehicle when the driver alert does not intervene quickly enough, and finally, the systems that allow lane maintenance (Lane Support System, LSS).
  • Passive safety systems, on the other hand, protect the vehicle’s occupants and other motorists if an accident occurs. This is performed by reducing the severity of the impact or injury to the person. There is currently a set of protection systems installed in the car, such as pre-tensioned seat belts, airbags, and energy-absorbing deformation zones, better known as crumple zones.
This work considers the LSS and AEB systems implemented in the cars under test. These are part of the second generation of active safety systems based on the latest technologies, such as onboard sensors, radar, cameras, GPS, and lasers.
Lane Support Systems (LSSs) are a group of active safety technologies that help the car stay within the demarcation lines of the lane in which it is passing. These systems can identify the lines drawn on the asphalt (both continuous and dashed) and alert the driver or apply corrective action to the vehicle to prevent it from moving away from its trajectory. Furthermore, some systems can identify the edge of the road (in addition to the lane demarcation lines) and implement suitable maneuvers to move the vehicle away. LSS may be a suitable complement for addressing the residual crashes involving unintentional drift out of lane [2]; in Reference [3], the authors analyzed fatal in-depth cases and showed that these crashes represented 14% of unintentional drift-out-of-lane crashes.
The Autonomous Emergency Braking (AEB) system is a system that allows the vehicle to be decelerated in situations where the probability of a frontal collision is high, assisting the driver in avoiding a collision or reducing the speed before the impact granting the driver the possibility to override the function (by steering, by acceleration, and braking above the function braking request) [4,5]. An AEB system is usually limited by the fact that it cannot be designed to activate too early because it would be a nuisance rather than a help to the driver, or it could even be the source of accidents caused by the excessive braking force being exerted; therefore, this system is designed to mitigate rather than avoid collision [6].
Testing a vehicle can be divided into four main processes:
  • Vehicle instrumentation, which involves the installation phase of the instruments and sensors necessary to acquire the data;
  • Test on the track, execution of the maneuvers on the track with attached data acquisition;
  • Post-processing of tests, using software and routines suitable for this purpose;
  • Creation of a report, which allows you to summarize the results obtained from the previous steps, indicating the type of instrumentation, test type, and post-processing results.
The paper focuses mainly on the third and partly on the fourth point of this list, while still providing information on the instrumentation and the track tests [7]. It adds an analysis tool for the data obtained from the simulation of maneuvers, also useful for the Advanced Driver Assistance System (ADAS) for pre-validation and pre-rating. This work proposes the generation of innovative algorithms designed to improve the generation capacity of test maneuvers for ADASs and to automate the data-collection-and-analysis phase relating to different tests. The goal was achieved with the collaboration of the company Nardò Technical Center S.r.l. The entire post-processing routine was developed from data relating to experimental tests carried out in the company.
The following aspects were developed in this study:
-
A post-processing automatic routine for tests performed on LSS, according to Euro NCAP LSS 3.0.2 [8]; on AEB, according to Euro NCAP AEB C2C 3.0.2 [9]; and on Car to Pedestrian Nearside Child (CPNC), according to UNECE R152 CPNC [10]. In particular, the entire routine was schematized by a flowchart that contains all the functions developed to achieve the purpose. At the end of the process, tables were obtained that allow the graphical display of the results by using a scientific software [11] and the export of the score assigned to the single test, according to Euro NCAP SA 9.0.1 [12], on a spreadsheet prepared in the purpose of serving as a report; it contains all the information obtained from post-processing;
-
An analysis of the main aspects of Euro NCAP LSS 3.0.2 [8], Euro NCAP AEB C2C 3.0.2 [9], and UNECE R152 CPNC [10] regulations, highlighting, in particular, the maneuvers carried out on the track and the requirements that must be respected for the validation of the tests. The realized tool also includes the possibility of using other American and Chinese test regulations standards, such as GB/T 39901-2021 [13] (Car-to-Car static, moving, and braking tests) or National Highway Traffic Safety Administration (NHTSA) [14] (Car-to-Car moving and braking tests);
-
The development of a data-analysis tool to guarantee the correct generation and analysis of maneuvers for the ADAS and check the correctness of the environmental conditions, as requested by the normative. In particular, through a diagram of the car in a finite number of points, it was possible to verify the correct execution of the maneuver. Moreover, it identifies useful information for this purpose, such as the distances between the vehicles involved or between vehicles and pedestrians and the vehicle’s capacity or not using the sensors under test to detect vehicles in their surroundings.
The main contribution of the report is to show the methodology and the results of a complete and innovative tool to maneuver servers used in ADAS tests, whether from simulated or real data. For simulated data, it allows us to check if the set maneuvers comply with the regulations; for real data, it allows us to perform an immediate check, including for multiple runs.

2. Materials and Methods

Regulations describe system performances to be matched during the tests to validate the functionality of the driver assistance system for the VUT properly. The examined signals are both physical and triggered and are listed below:
-
Forward and lateral velocities;
-
Forward and lateral accelerations;
-
Yaw angle and yaw velocity;
-
Steering wheel angle and steering wheel velocity;
-
Relative longitudinal and lateral distances between VUT and target object;
-
Time-to-collision longitudinal between the VUT and target object;
-
Forward-collision warning signals (acoustic and visual).
The conventional reference system, according to the Euro NCAP standard, is shown in Figure 1. A particular quantity evaluated in NCAP regulation is the lateral path error, which is determined as the lateral distance between the center’s desired path and the one measured by the acquisition data. Moreover, the same regulation dictates that the data must be sampled with a frequency of at least 100 Hz and provides a series of limits on the statistical characteristics of the parameters that must be respected for the validity of the tests. The tests in which the Global Vehicle Target (GVT) is present, particularly the system, must be carried out. It is a mobile piloted target that reflects, in all respects, a real car; in fact, there is a self-propelled platform that carries a soft target for vehicles (Soft Car 360, Dynamic Research Inc. California, USA) that was developed to be aerodynamically stable and to separate at the moment of impact, avoiding causing damage to the VUT. The shape of the target is radar reflected and detected by the camera and laser scanner.

2.1. LSSs

Although LSSs are classified as active safety technology, it is important to note that they are only driver-assistance systems, as they can be modified and replaced by the driver’s action. For example, systems that help the car steer to get it back into its lane can be changed by the driver simply by applying more torque to the steering than the system [15,16].
Depending on the action performed by the system, three main categories of LSSs can be distinguished:
  • Lane-Departure Warning (LDW), a warning of lane departure;
  • Lane-Keeping Assist (LKA), lane-keeping assistance;
  • Emergency Lane Keeping (ELK), maintenance of the emergency lane.
LDW is the simplest Lane Support System that does not provide direct driver support action but generates an alarm to allow for a correction of the maneuver. It is based on a camera connected to a computer that uses an embedded machine-learning algorithm, such as the “Hough transform” [17]. This extraction technique, used in digital image processing, in its simplest mechanism, allows one to recognize the lines of an image by approximating the various points of a dataset to a common line: to do this, for each point, a bundle of straight lines at different angles and the one that has a similar distance from the origin of the reference system for all points are identified.
LKA is based on the functionality offered by the LDW system. In addition to the alarm given by the latter system’s sensors, the lane-keeping aid system is integrated with the car’s power steering or ESP systems that allow you to bring the car back into your lane. Unlike the LDW system, this system acts on the steering or brake to bring the car back into the lane. The intensity of the action carried out by the LKA depends on the speed at which the vehicle moves away from the lane (lane-departure velocity).
ELK is a more advanced version of the LKA system that works; however, in more dangerous driving scenarios, i.e., when you go off the road on the nearest side or when there is another vehicle nearby, it is necessary to avoid a collision suddenly. For this reason, in addition to the camera, this system also uses radar sensors placed around the car.

2.1.1. Measurements for LSS Testing (NCAP Regulation)

The following data are highlighted on which to check the test requirements and, therefore, to post-process the data:
-
T0, the time in which the maneuver begins with 2 s of the straight path;
-
TLDW, the time in which the LDW system is activated;
-
TLKA, the time in which the LKA system is activated;
-
TSTEER, the time in which the VUT enters the curvilinear section;
-
TSSC, the time in which the VUT settles its lateral velocity.
The position of the VUT (XVUT and YVUT) is determined when the reference systems are in Cartesian coordinates concerning a coordinate system pre-established before the test. The origin point (0,0) is obtained by the GPS position [18,19], VUT speed (Vlong, VUT and Vlat, VUT), VUT angular yaw rate ( Ψ ˙ V U T ), and angular speed of the VUT steering ( Ω ˙ V U T );
Finally, the legislation requires that some of the acquired data be filtered through a 12-pole Butterworth low-pass filter and a cutoff frequency of 10 Hz. A Butterworth filter is one of the simplest filters used to maintain the frequency response modulus of the passband to be as flat as possible [20].
The filter used in the Euro NCAP procedure is a second-order filter (12 dB/decade).
The test must be conducted on a dry uniform pavement, with a maximum inclination in the longitudinal direction of 1%. In addition, the asphalt must have a minimum peak braking coefficient (PBC) of 0.9.
The demarcation lines must comply with the UNECE Regulation 130 to correctly delineate the lane, which must be of a width between 3.50 and 3.70 m, measured between the two inner sides of the lines.
The environmental conditions that must be respected concerning the following main aspects, which could influence the correct execution of the test, are as follows:
  • Ambient temperature, between 5 and 40 °C;
  • Asphalt temperature, not expressly specified but such as not to affect the performance of the tires;
  • Precipitation, absent and horizontal visibility greater than 1 km;
  • Wind speed below 10 km/h to avoid disturbances to the car;
  • Wind direction, not expressly specified but such as not to influence the dynamics of the vehicle;
  • Natural, homogeneous lighting greater than 2000 lux for tests carried out during the day, in the absence of excessive shadows in the test area.
These measurements must be taken before the start of each test or at least every 30 min.

2.1.2. Test Execution for LSS Testing (NCAP Regulation)

The conditions defined in Table 1 must be met in the time bands for the validity of LSS testing.
In Table 1, the VOT is the target lateral velocity value in the stationary section that follows the constant radius curve established at the start of the test. To steer the car, it is necessary to apply an action that is not excessively abrupt and guarantees the minimum oscillations to the maneuver to make it as clean as possible.
The end of the LDW test is assumed when the system activates and alerts the driver. The end of the LKA and ELK tests is considered to be 2 s after one of the following events occurs:
  • The LKA/ELK system fails to maintain the VUT within the permitted lane departure distance;
  • The LKA/ELK system intervenes to keep the VUT within the permitted lane departure distance to obtain a maximum value in the lateral position curve, which subsequently decreases until the VUT is brought back toward the center of the lane.
If the test ends because the system does not intervene sufficiently in time or, in the case of the presence of GVT, if this deviates excessively from its path, it is convenient to manually steer the VUT to avoid the impact or mitigate it.

2.2. Autonomous Emergency Braking (AEB) System

The AEB system allows the vehicle to be decelerated in situations where the probability of a frontal collision increases. The purpose of the brake pedal is to eliminate or mitigate the collision when the VUT collides with the vehicle in front. The AEB system uses the friction braking system as an actuator to fully brake the car with decelerations requesting 14 m/s2 as the maximum deceleration value and reaching up to 11 m/s2. An AEB system is usually limited by the fact that it cannot be designed to activate too early because it would be a nuisance rather than a help to the driver or could even be the source of accidents caused by the excessive braking force being exerted: therefore, this system is designed to mitigate rather than avoid a collision.
Conceptually, an AEB algorithm works on an estimated parameter known as the time to collision (TTC). This quantity is defined as the ratio between the relative position between the vehicles and the relative speed between the two vehicles and represents the time in which the collision between the two vehicles takes place if there is no relative speed variation (1):
T T C = x E G O x o b j e c t v E G O v o b j e c t           [ s ]
This is the TTC formula calculated by the instrumentation mounted on board. The vehicle AEB system intervenes on the TTC, but the value is calculated by the vehicle detection systems (camera, radar, or fusion camera–radar system); the calculation depends on the design of the position and speed of the sensor, and the algorithm is the property of the supplier.
This parameter is the basis of the action of the AEB system; in fact, the underlying function continuously processes the input signals from the sensors and decides whether to activate the trigger or not to implement the braking action. The emergency braking system can intervene when it is assumed that the driver cannot avoid the obstacle independently with the driving conditions he has at that moment. The “avoidance maneuvers” to be considered in this system are decelerations and lateral turns to the right or to the left to avoid the collision of a normal entity (i.e., without excessively high values of acceleration, steering angle, or angular speed).
The reasoning used to evaluate the TTC is simple: a straight path is considered without relative lateral speed. Therefore, a dynamic model is considered in which the car is schematized as a material point with a predicted constant speed and a certain assumed acceleration capacity. Additional information allows you to get closer to reality, for example, knowing if, in a lateral avoidance maneuver on one side of the target vehicle, the passage is blocked, if the target vehicle is decelerating and knowing the road-tire contact conditions (for example, the coefficient of road friction).
The AEB system consists mainly of three phases based on the time to collision [21]:
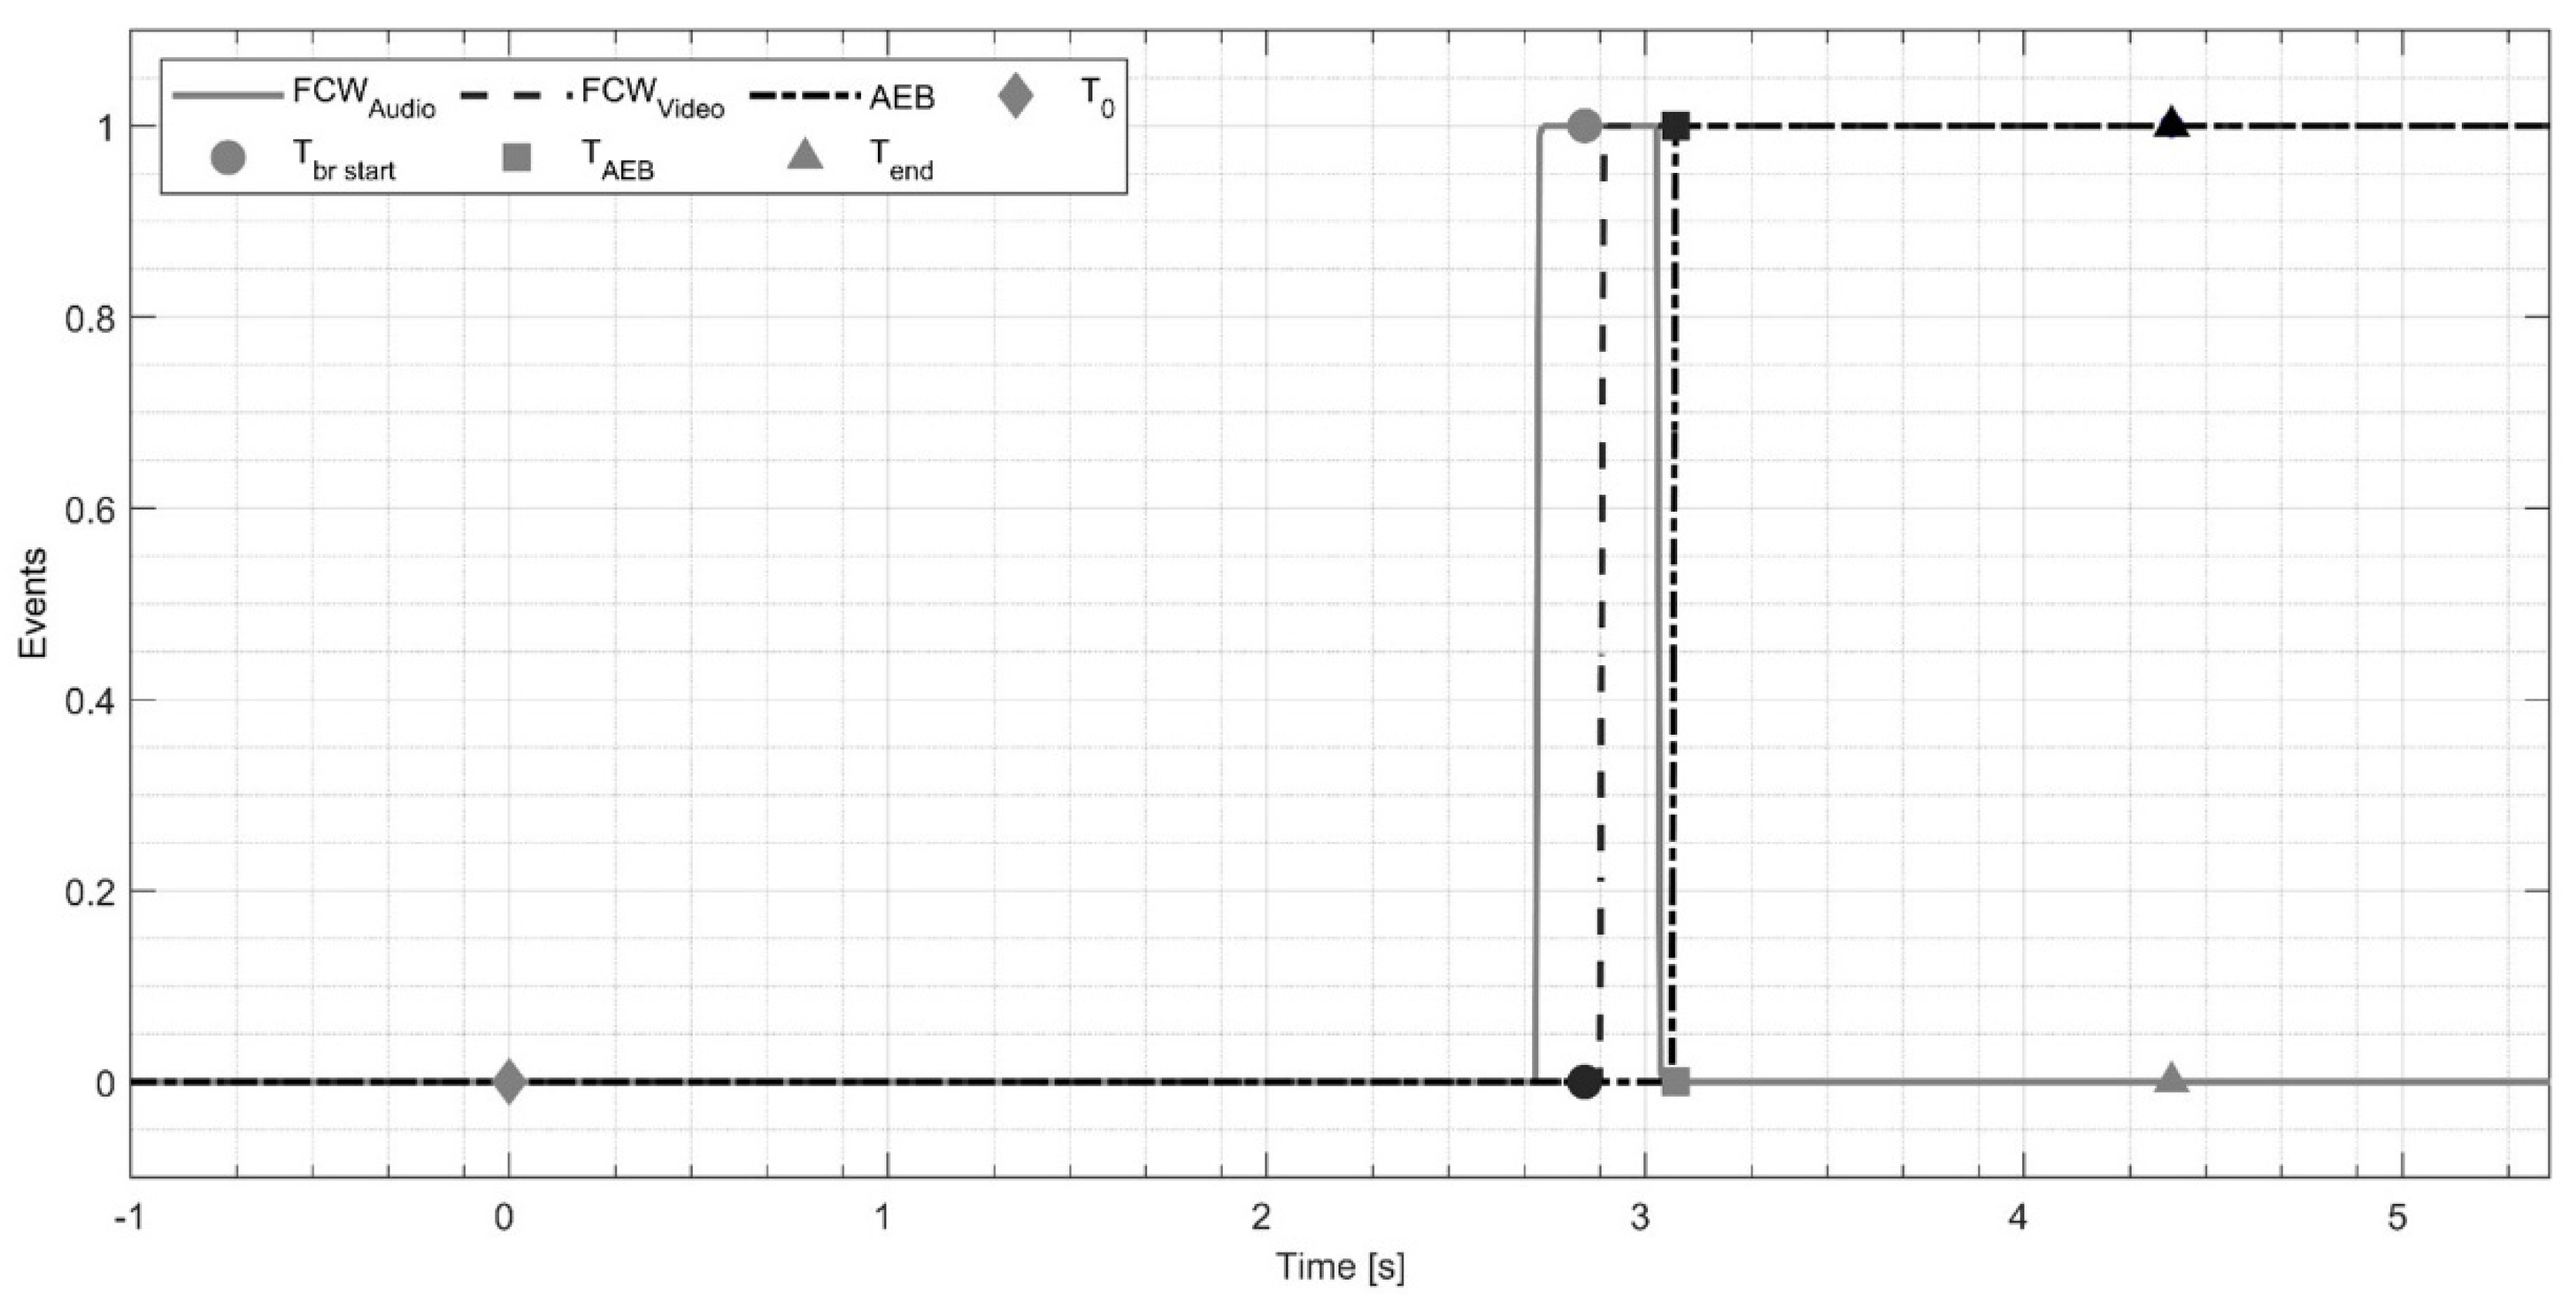
  • Forward-Collision Warning (FCW) intervention, the instant in time in which the FCW system is activated because it has detected an obstacle and alerts the driver of the imminent danger without taking any action;
  • Partial Braking, the time range in which the AEB system performs a partial action to slow down the vehicle without stopping it. Often this action can be performed in various stages, divided by braking-force intensity;
  • Full Braking, the instant in which the AEB system completely influences the car’s motion, imparting a high braking force (within the limit of wheel locking) to bring the vehicle to a complete stop.

2.2.1. Measurements for AEB Testing (NCAP Regulation)

Since two vehicles are involved in this test, it is necessary to evaluate two fundamental quantities for the correct execution of the test:
  • Lateral path error, as already seen for NCAP regulation, is determined as the lateral distance between the center desired path and the one measured.
  • Lateral overlap is the percentage of the VUT width that overlaps the GVT, measured by taking the vehicle center line as a reference. In case of 100% overlap, the two-vehicle center lines are aligned.
The performance of the AEB system is assessed on the test Car-to-Car stationary (CCRs), on the test Car-to-Car moving (CCRm), and on the test Car-to-Car braking (CCRb) scenarios. The CCRs scenario is a combination of speed and overlap between VUT and GVT: once a speed value is set, the overlap is increased in steps of 25%; then the speed is increased by 5 km/h, and the tests are carried out again at the different overlap. In the CCRm scenario, both vehicles move, the VUT ranges in the speed ranges indicated in Table 2, and the GVT moves at a constant speed of 20 km/h. On the other hand, the overlap range remains the same as in the previous test. The CCRb scenario differs from the other two tests because, rather than varying the speed of VUT and GVT and the overlap between the two vehicles, in this case, it changes the deceleration of the GVT and the relative distance between the two vehicles, which must be kept constant until the instant in which braking begins.

2.2.2. Test Execution for AEB Testing (NCAP Regulation)

For the test to be valid, the following conditions must be met in the time bands, as defined in Table 2.
In Table 2, VOT represents the vehicle speed set at the start of the test, which must be respected for the duration of the test, and DOT represents (in the case of the CCRb test) the relative distance between the two vehicles set at the start of the test and which must be respected until the start of the GST braking.
The test ends when one of the following conditions is met:
  • The speed of the VUT is zero: VVUT = 0 km/h;
  • The speed of the VUT is lower than that of the GVT: VVUT < VGVT;
  • Contact occurs between the two vehicles: XVUT − XGVT = 0 m.

2.3. UNECE R-152 Car to Pedestrian Nearside Child (CPNC) [12]

The UNECE R-152 CPNC is related to validating the Autonomous Emergency Braking function in a probable collision with a child pedestrian actor. For the complete function validation, the tests should be repeated in unladen and laden conditions and according to car manufacturer specifications for max weight load admitted for a vehicle in running conditions. The VUT or subject vehicle (SV) is the main actor in the test scenario related to the system validation. The soft pedestrian target (SPT) is the other actor in the test scenario. It is a pedestrian dummy mounted over a sledge dragged by a belt controlled by an electric motor set, as shown in Figure 2.

2.3.1. Measurements for CPNC Testing (UNECE R-152 Regulation)

The analysis needs to be applied in a certain range of the acquisition, delimited by the time sample calculated as follows: T0, start range validation time corresponding to the sample in which the time-to-collision longitudinal is less than or equal to 4 s; and TEnd, stop range validation time corresponding to the sample in which one of the following conditions is matched:
-
Collision happens between the VUT and the SPT;
-
The VUT velocity drops to 0 km/h;
-
The SPT crosses out of the VUT width (this is the condition of no collision).
For this reason, a bounding box is defined, including the SPT silhouette different for an adult or a child pedestrian dummy, as shown in Figure 3.
If more than one condition is satisfied, TEnd is identified, with the first occurring temporally. Other important time samples required for the validation are related to the following conditions:
-
TFCW, time sample corresponding to the FCW trigger’s activation on the vehicle’s instrument cluster. In particular, the FCW alert may be acquired in two different ways (audio and video): it is defined as expressed in (1), considering the minimum of these values.
-
TSV, start braking, time sample corresponding to the condition in which the VUT deceleration assumes a value less than or equal to 0.3 m/s2.
-
TSPT, start moving, time sample corresponding to the first value of SPT speed more than 0 km/h.
-
TAEB, time sample, corresponding to the condition in which the vehicle’s deceleration assumes a value less than or equal to 0.5 m/s2 for the last time before it assumes a value more than or equal to 5 m/s2. It is considered the time sample of the AEB activation:
T F C W = min ( T F C W , A u d i o ,   T F C W , V i d e o )

2.3.2. Test Execution for CPNC Testing (UNECE R-152 Regulation)

The signals examined for validating the CPNC tests shall respect the regulation limits reported in Table 3.
The nominal speed depends on the type of test, and it changes from 20 to 60 km/h. Moreover, the weather-condition limits reported in Table 4 shall be validated to ensure the right environment for the function of the assistance system.
The VUT instrumentation set used in CPNC testing is schematically depicted in Figure 4, and it is listed below:
-
battery pack: a power supply unit for driving the robot and for the power supply.
-
Automotive Dynamic Motion Analyzer (ADMA) and highly precise Inertial Measurement Unit (IMU). It is hard-wired with the following:
  • GNSS Antenna Novatel;
  • Real-time kinematic positioning (RTK) Radio Modem to improve the GPS positioning accuracy;
  • Driving-Robot motion-controller unit.
-
Onboard control PC unit and Robot Controller (RC) software.
-
Robot Controller unit (including motion controller). It is directly connected with the following:
  • Steering Robot (SR);
  • Combined Braking and Accelerator Robot (CBAR).
A static IP radio set grants the synchronization between actors as a Wi-Fi telemetry system.

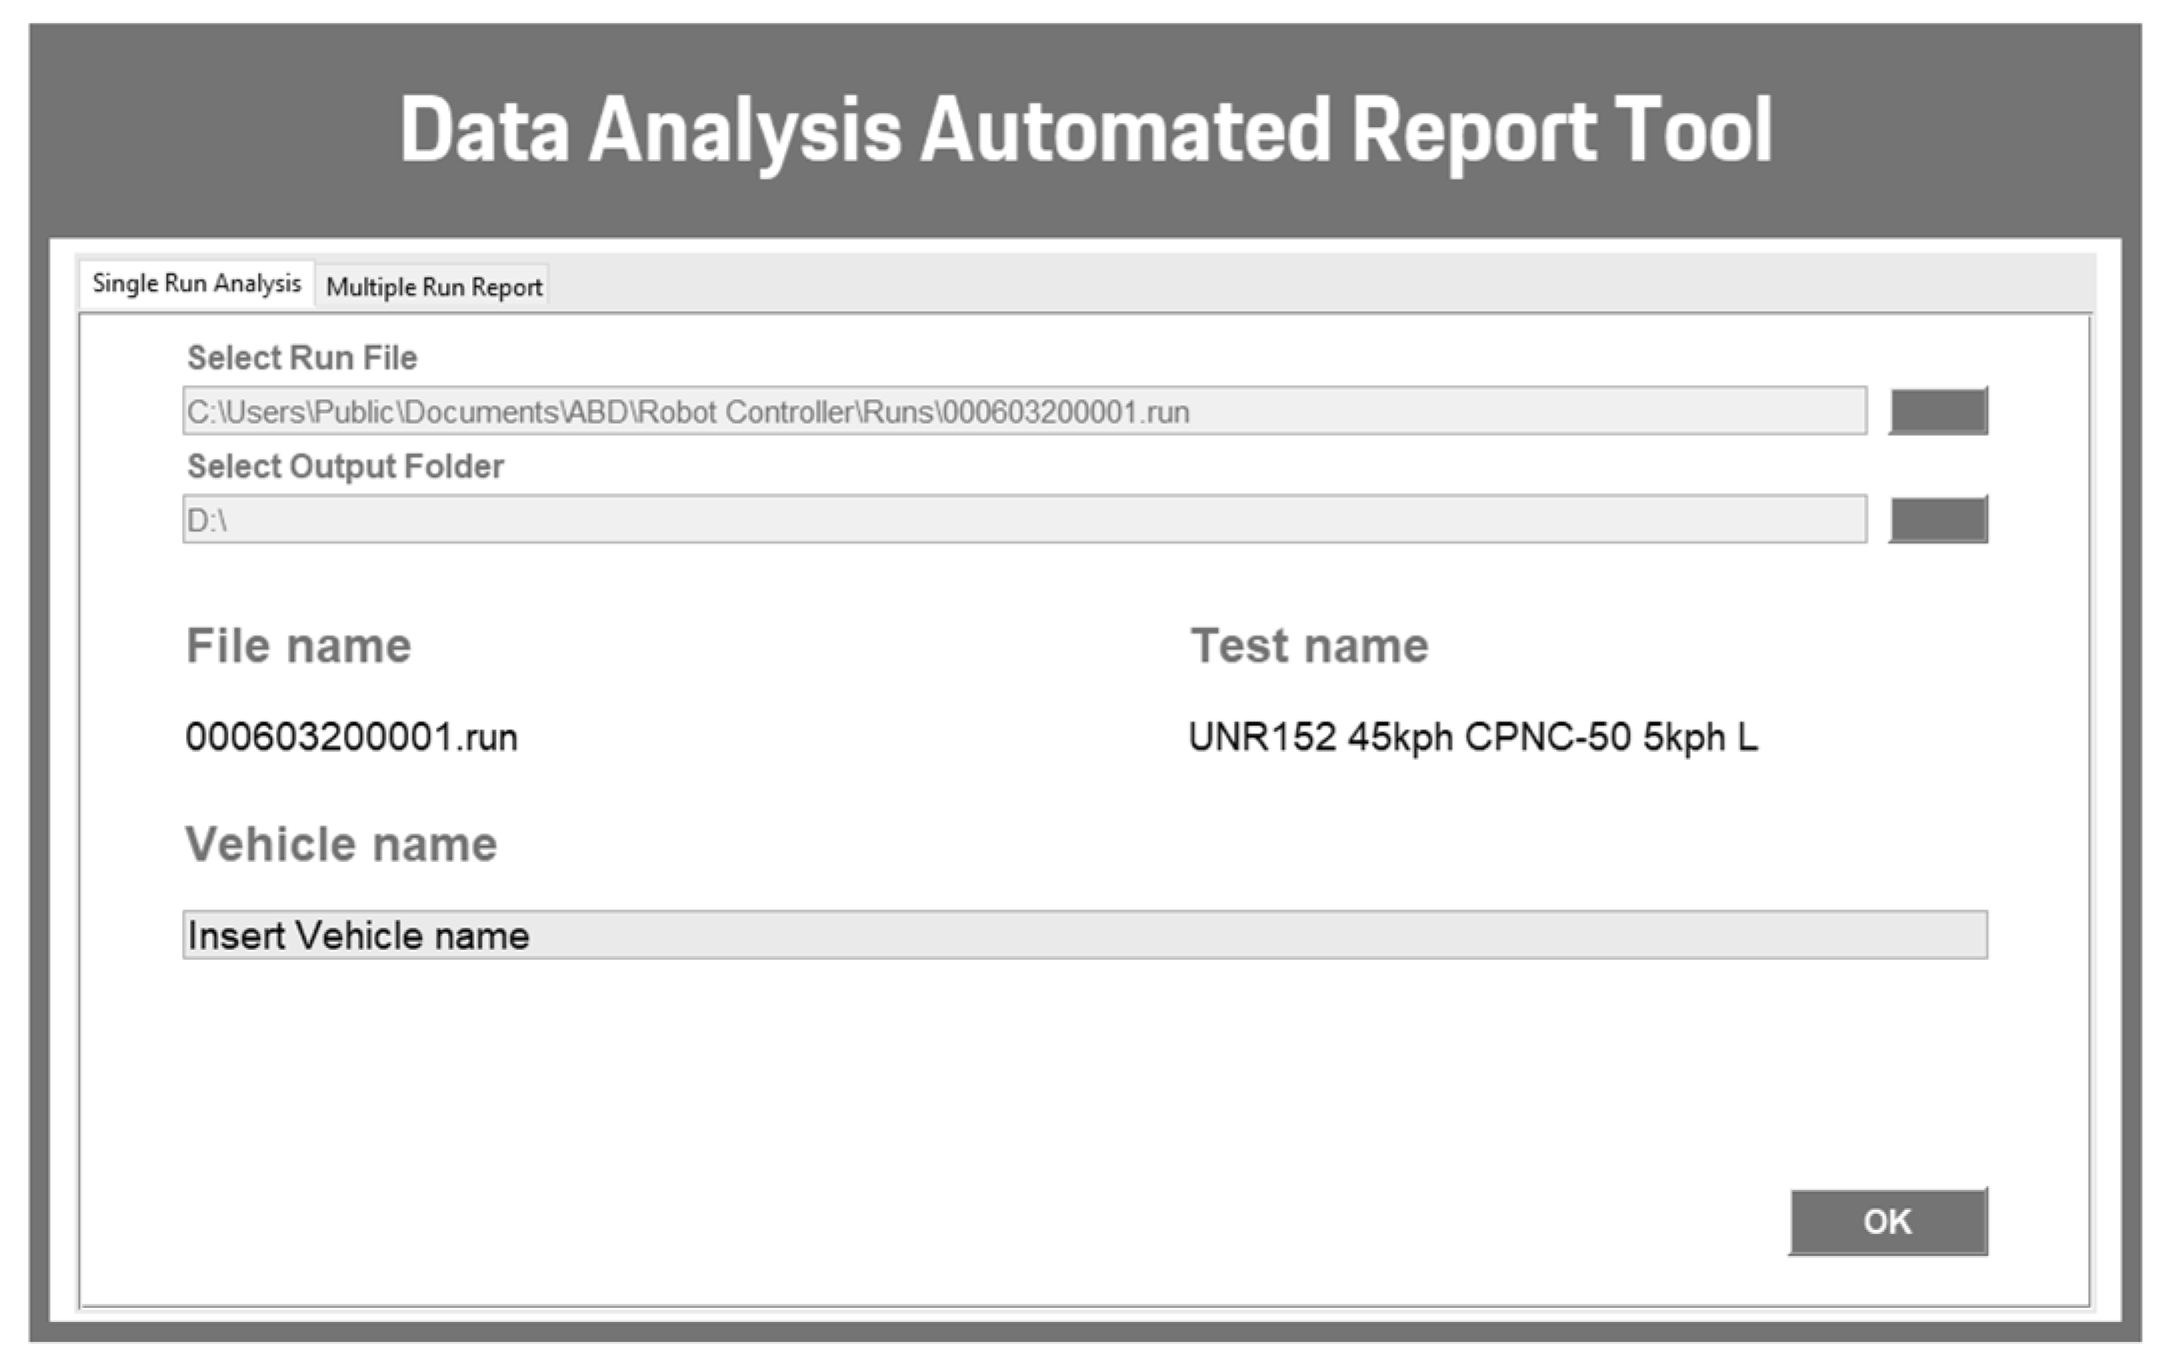
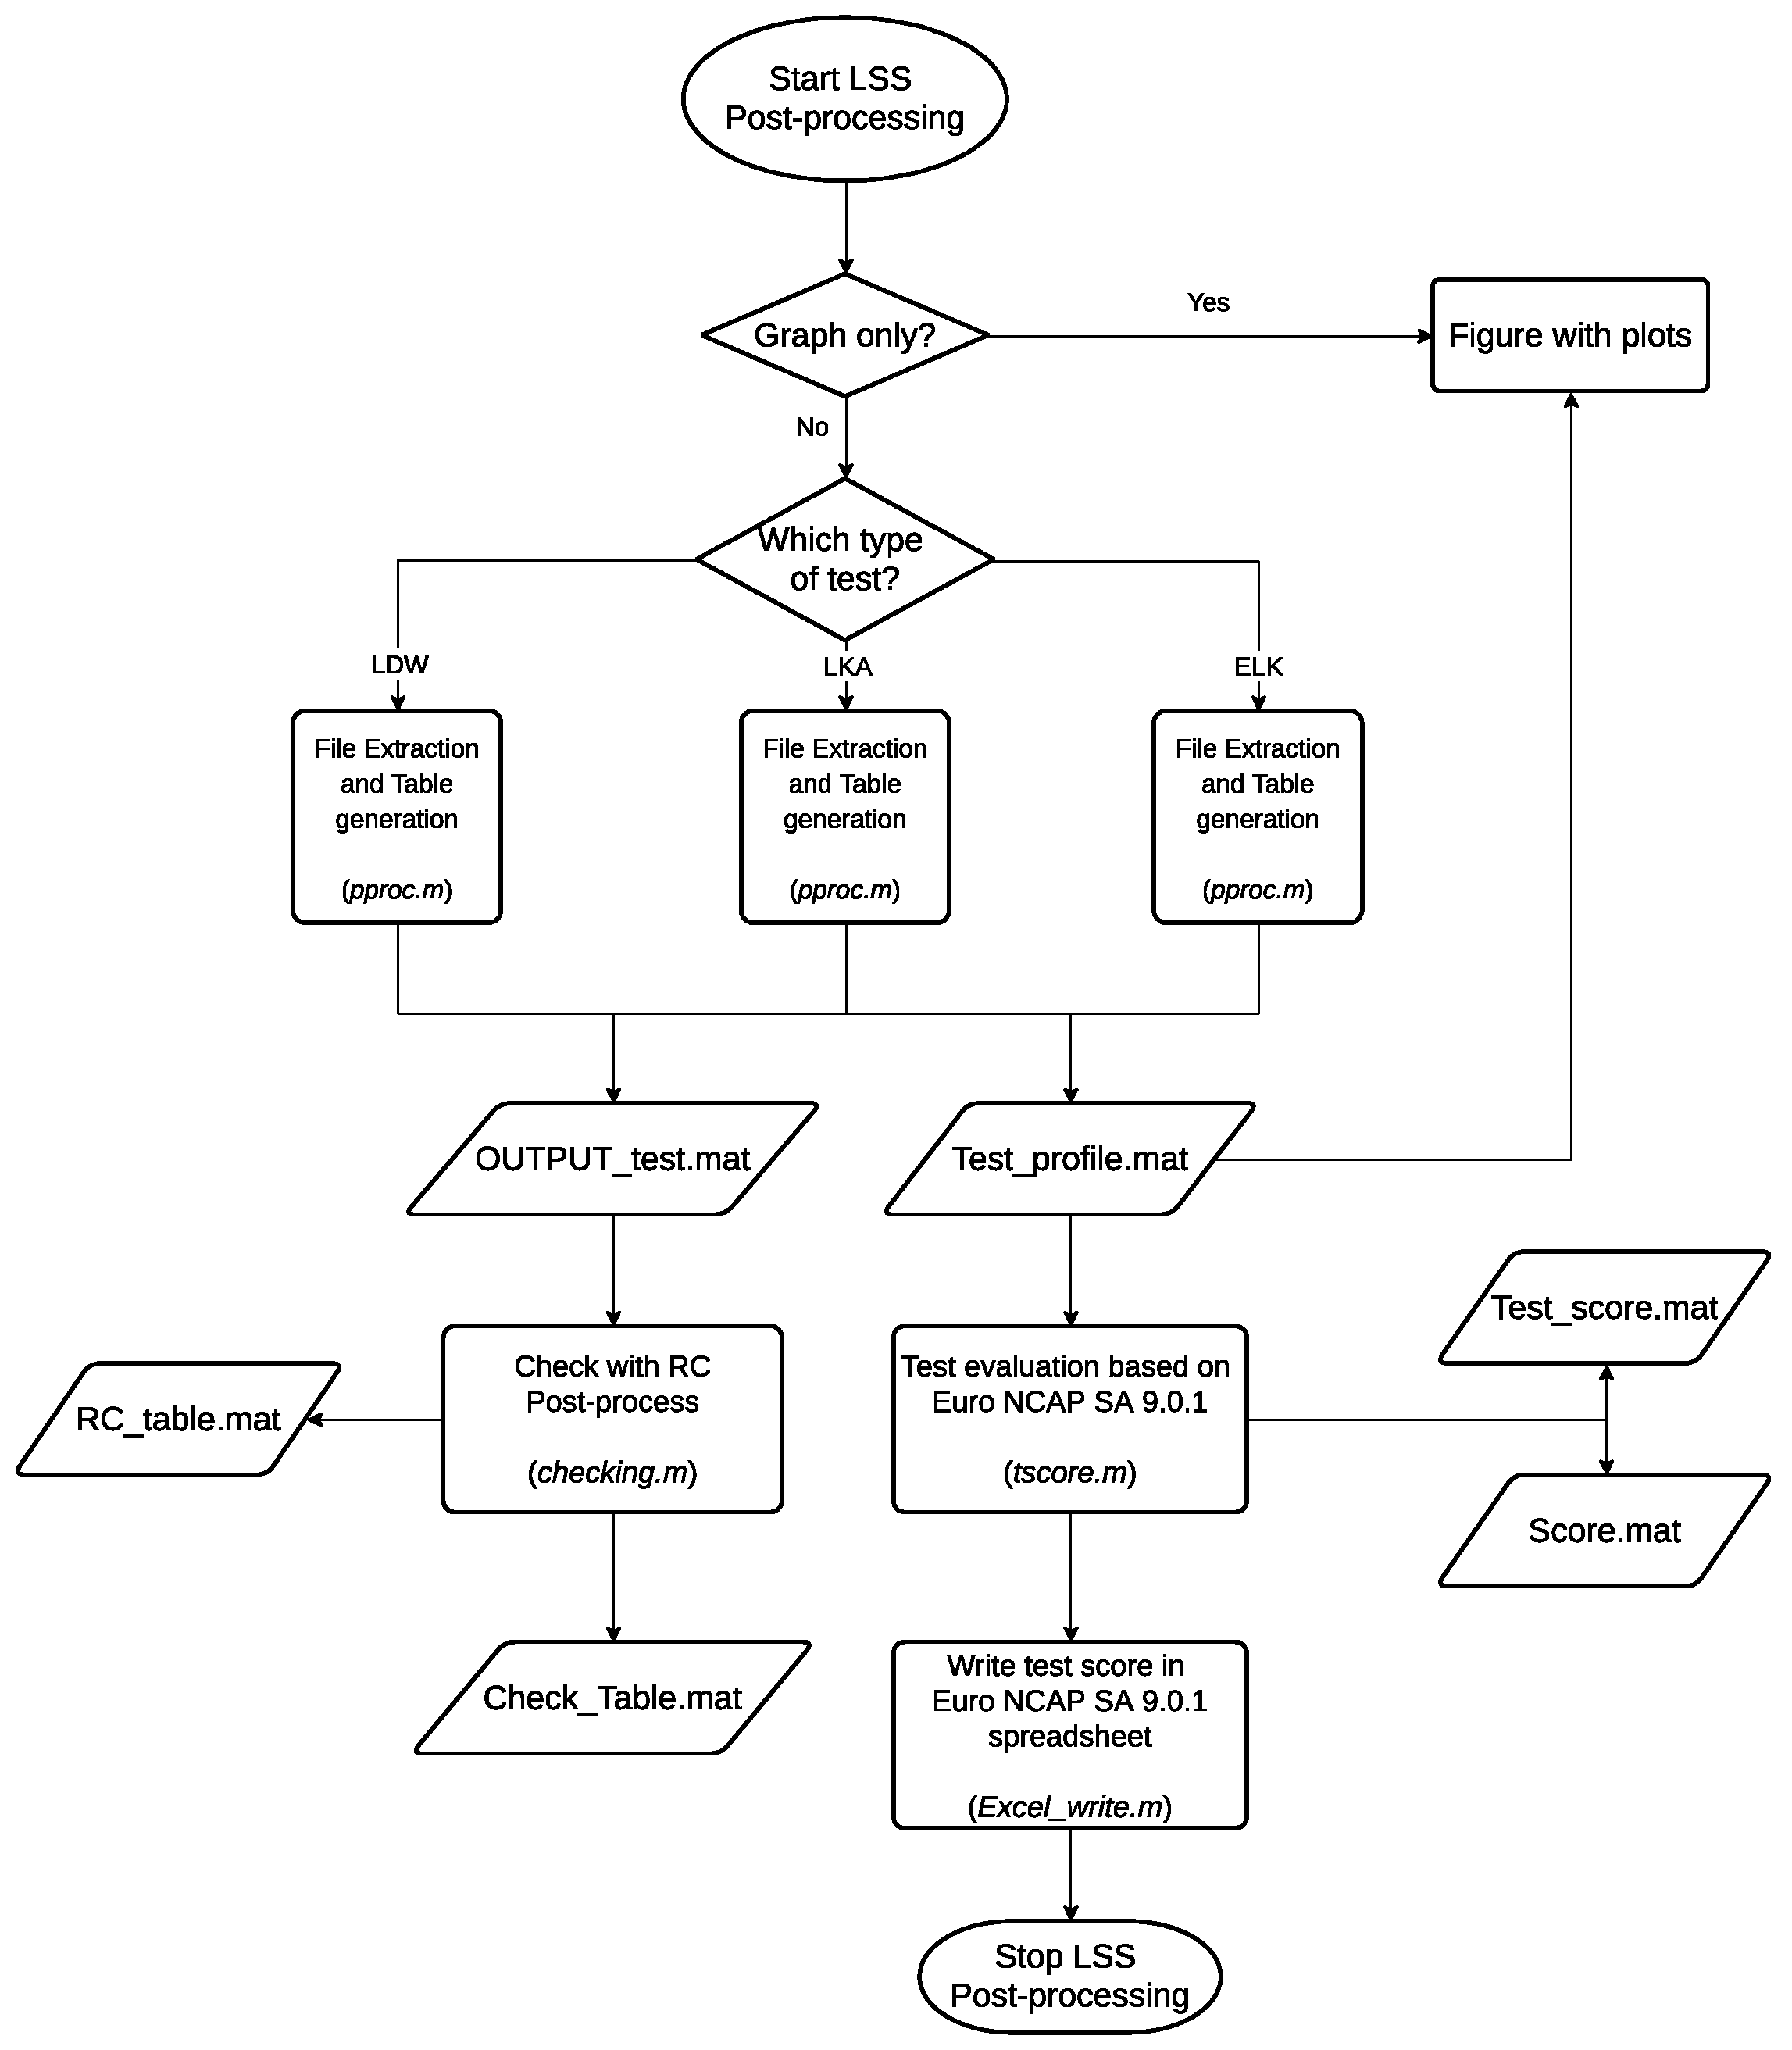
2.4. Test Data Post-Processing Tool

The tool has two main targets:
-
Data analysis, the analysis of a single test-run datum and the validation of it according to the regulation targets;
-
Automated report, the result of the tool as a single run PDF summary plots file and test session key run data Excel summary file.
The main data-analysis function is a switch function between the different regulations, using the variable TESTNAME (e.g., for the UNECE R152 Pedestrian test, VUT speed of 45 km/h and Laden condition, the TESTNAME is “UNR152 45 kph CPNC-50 5 kph L”). The panel automatically generated by the data analysis is shown in Figure 5.

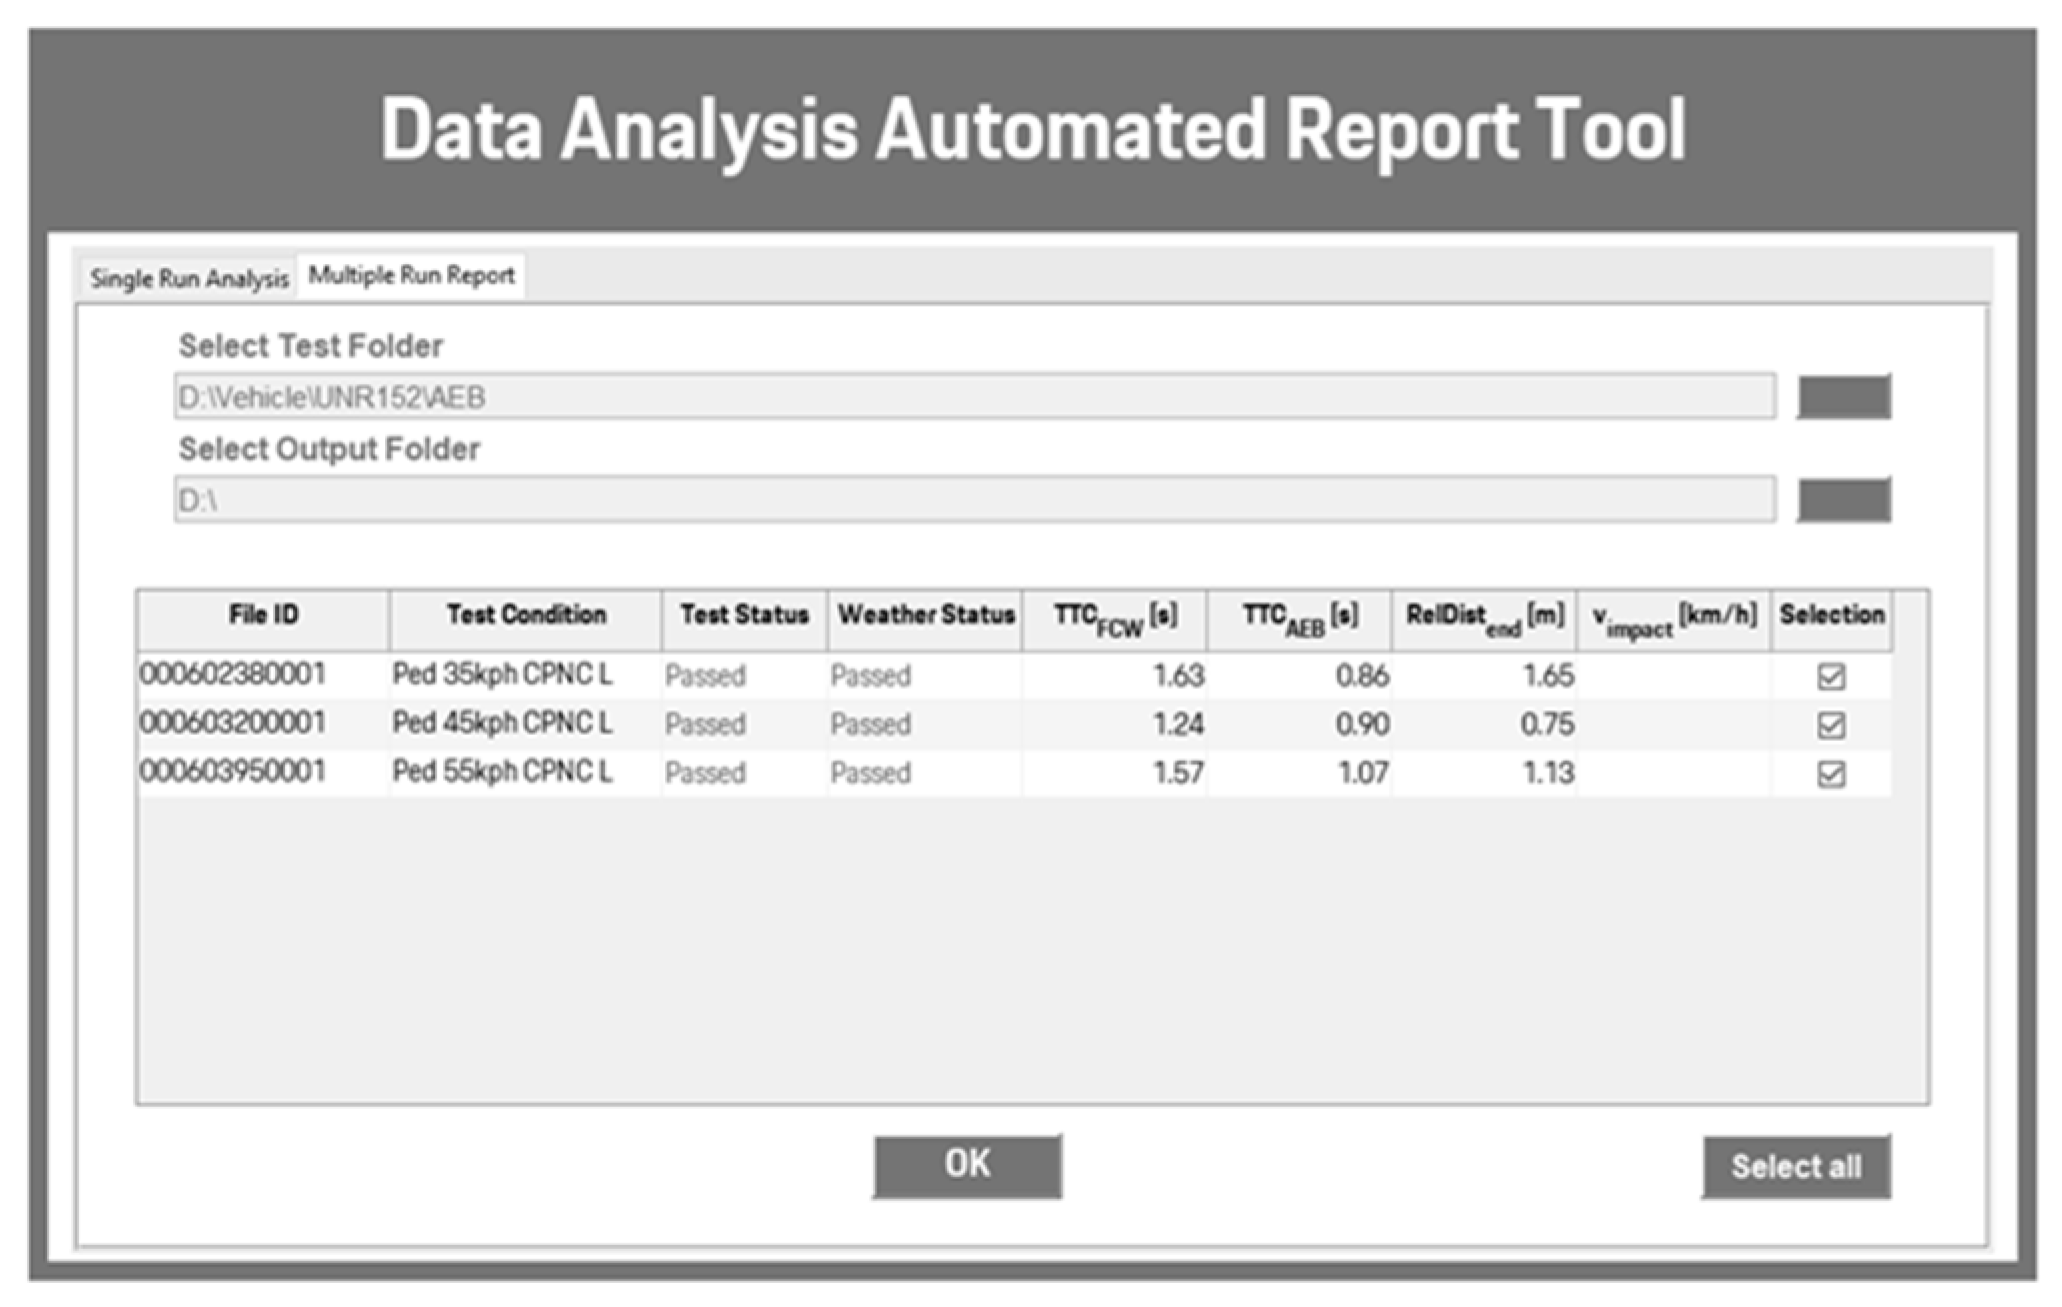
2.5. Multiple Run Report

The second panel on the main interface allows the user to create a report summary of a specific test session. Selecting the test folder, the function enables all the test files analyzed previously. The table includes some important values for the test selection, as depicted in Figure 6:
-
File ID, the variable “FILENAME” described in the following;
-
Test Condition, the variable “TESTNAME” described in the following;
-
Test Status, the result of the post-processing as “Passed” or “Failed”;
-
Weather Status, the result of the weather conditions analysis as “Passed” or “Failed”;
-
TTCFCW, the value of TTC at the minimum of the video and audio trigger activation time samples;
-
TTCAEB, the value of TTC at the AEB trigger activation time sample;
-
RelDistend, the value of relative distance at the Tend time sample;
-
vimpact, the value of the impact velocity. This value can be empty if there is no collision during the test;
-
Selection, the last column editable by the user that is used to select or select one between more runs.
Pressing the “OK” button, the user chooses all the selected runs and saves them in the main vehicle folder (e.g., for the UNECE R152 test session, the file name is “Report_UNR152.mat”). Moreover, the function Excel sheet report is used to create the report file by switching on the TESTNAME: the function creates the heading of the file and the same table of Figure 6 in an Excel file. Finally, the creation of the PDF summary report is performed, including the selected runs single PDF report in one: to achieve this target, the Ghostscript is used to create a single PDF file with all the runs selected by the user.

2.6. ADAS Test Replay Tool

The second part of the tool is the test replay function: this is an important functionality for the test in which the other target has a different trajectory from the subject one (the test with the pedestrian actor or the AEB turning type of test).
The function Actors definition (shown in Figure 7) is used to schematize the vehicle shape with a defined number of points.
The first window includes four choices that the user should make:
-
Ego vehicle, chosen from a list of vehicle models;
-
Head Tracker vehicle, chosen from a list of vehicle models;
-
Start point, chosen from a list of signals: (i) time-to-collision longitudinal, (ii) relative longitudinal distance, (iii) relative lateral distance, and (iiii) default that means the first sample in acquisition;
-
End point, chosen from the same list of signals of the start point option (default means the last sample in acquisition).
The button Add Vehicle can be used to add a new vehicle to the list seen before (as shown in Figure 8).
As can be seen in Figure 8, the measures that need to be inserted are as follows:
-
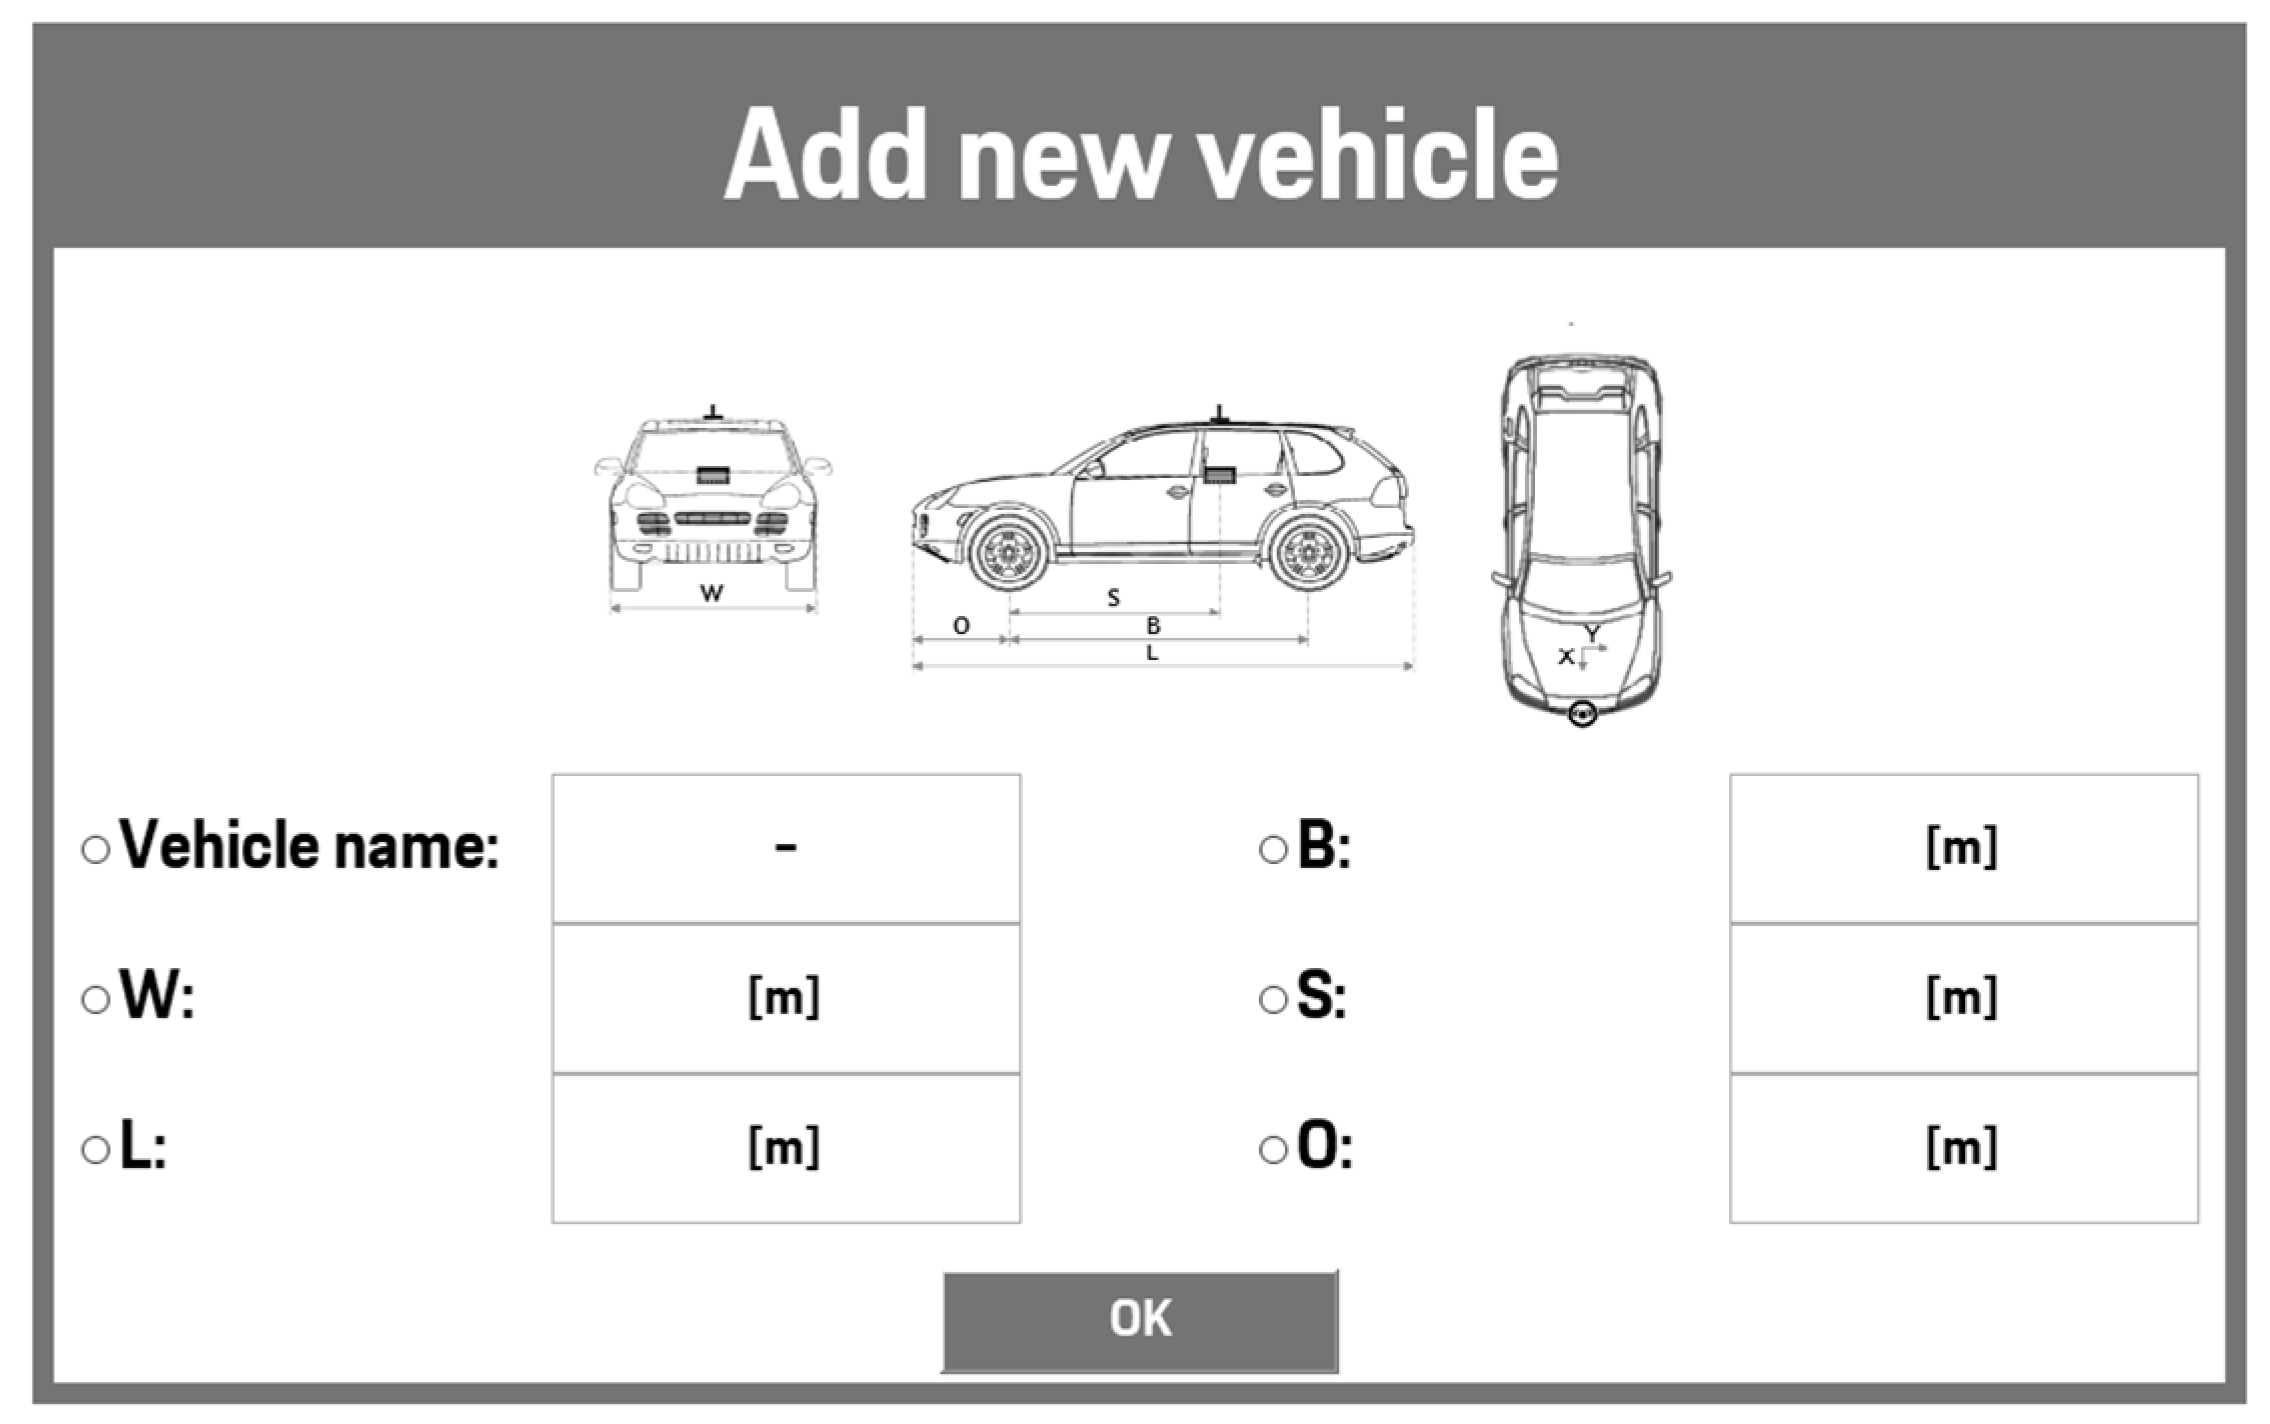
Vehicle name, a string with the vehicle model name;
-
Width (W), measured without the mirrors;
-
Length (L), measured from bumper to bumper;
-
Wheelbase (B), measured from the front axle to the rear axle;
-
Distance from ADMA to the front axle (S);
-
Front overhang (O), measured from front axle to front bumper.
The vehicle shape is schematized according to the user selection:
-
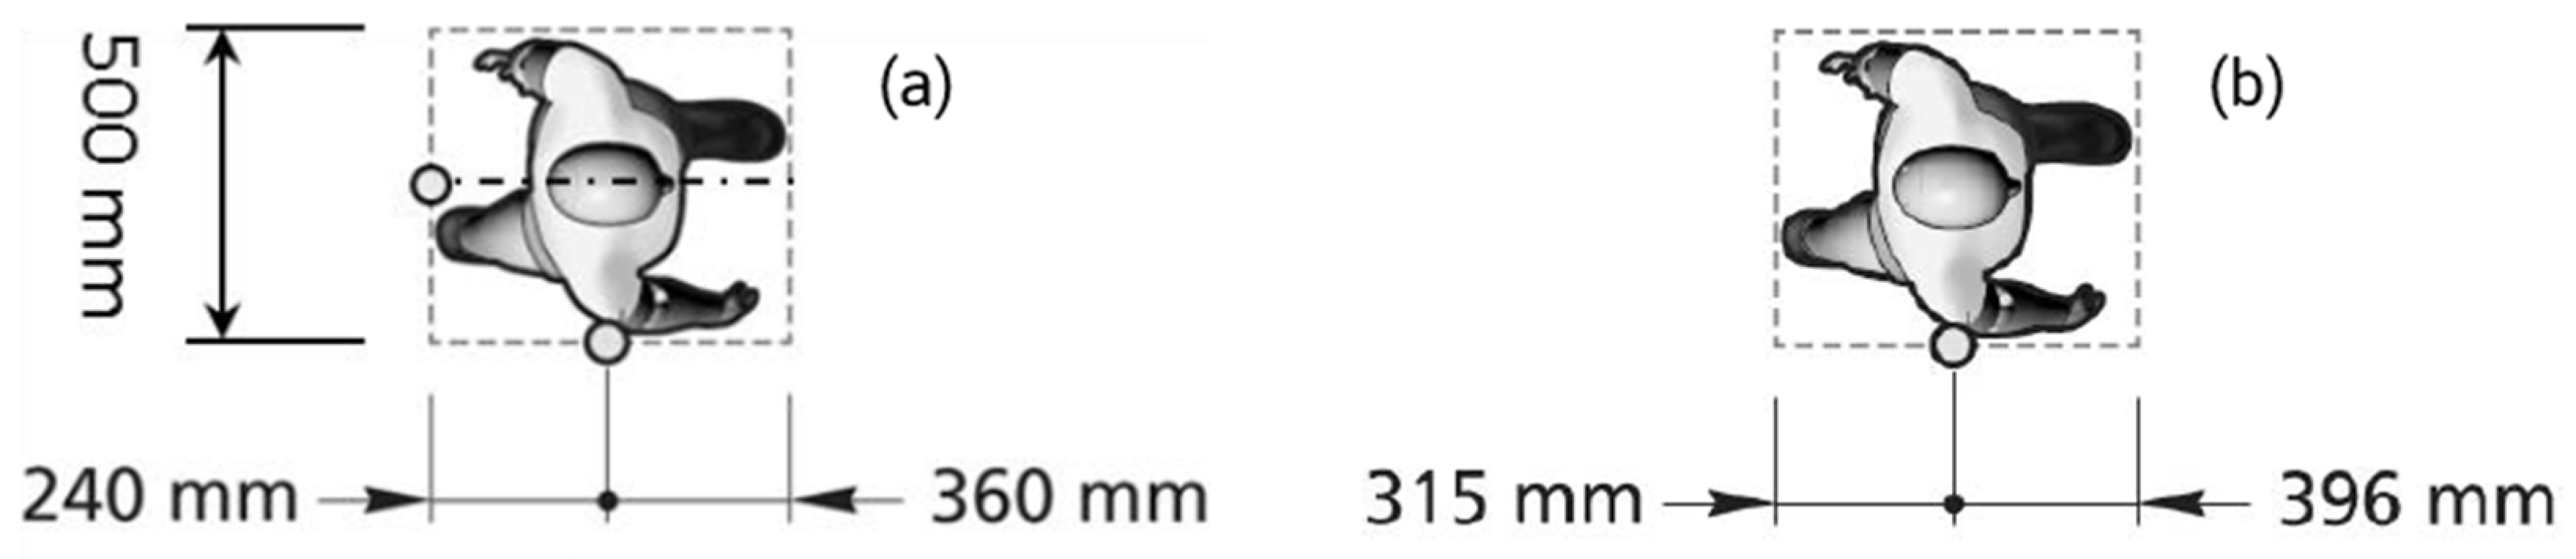
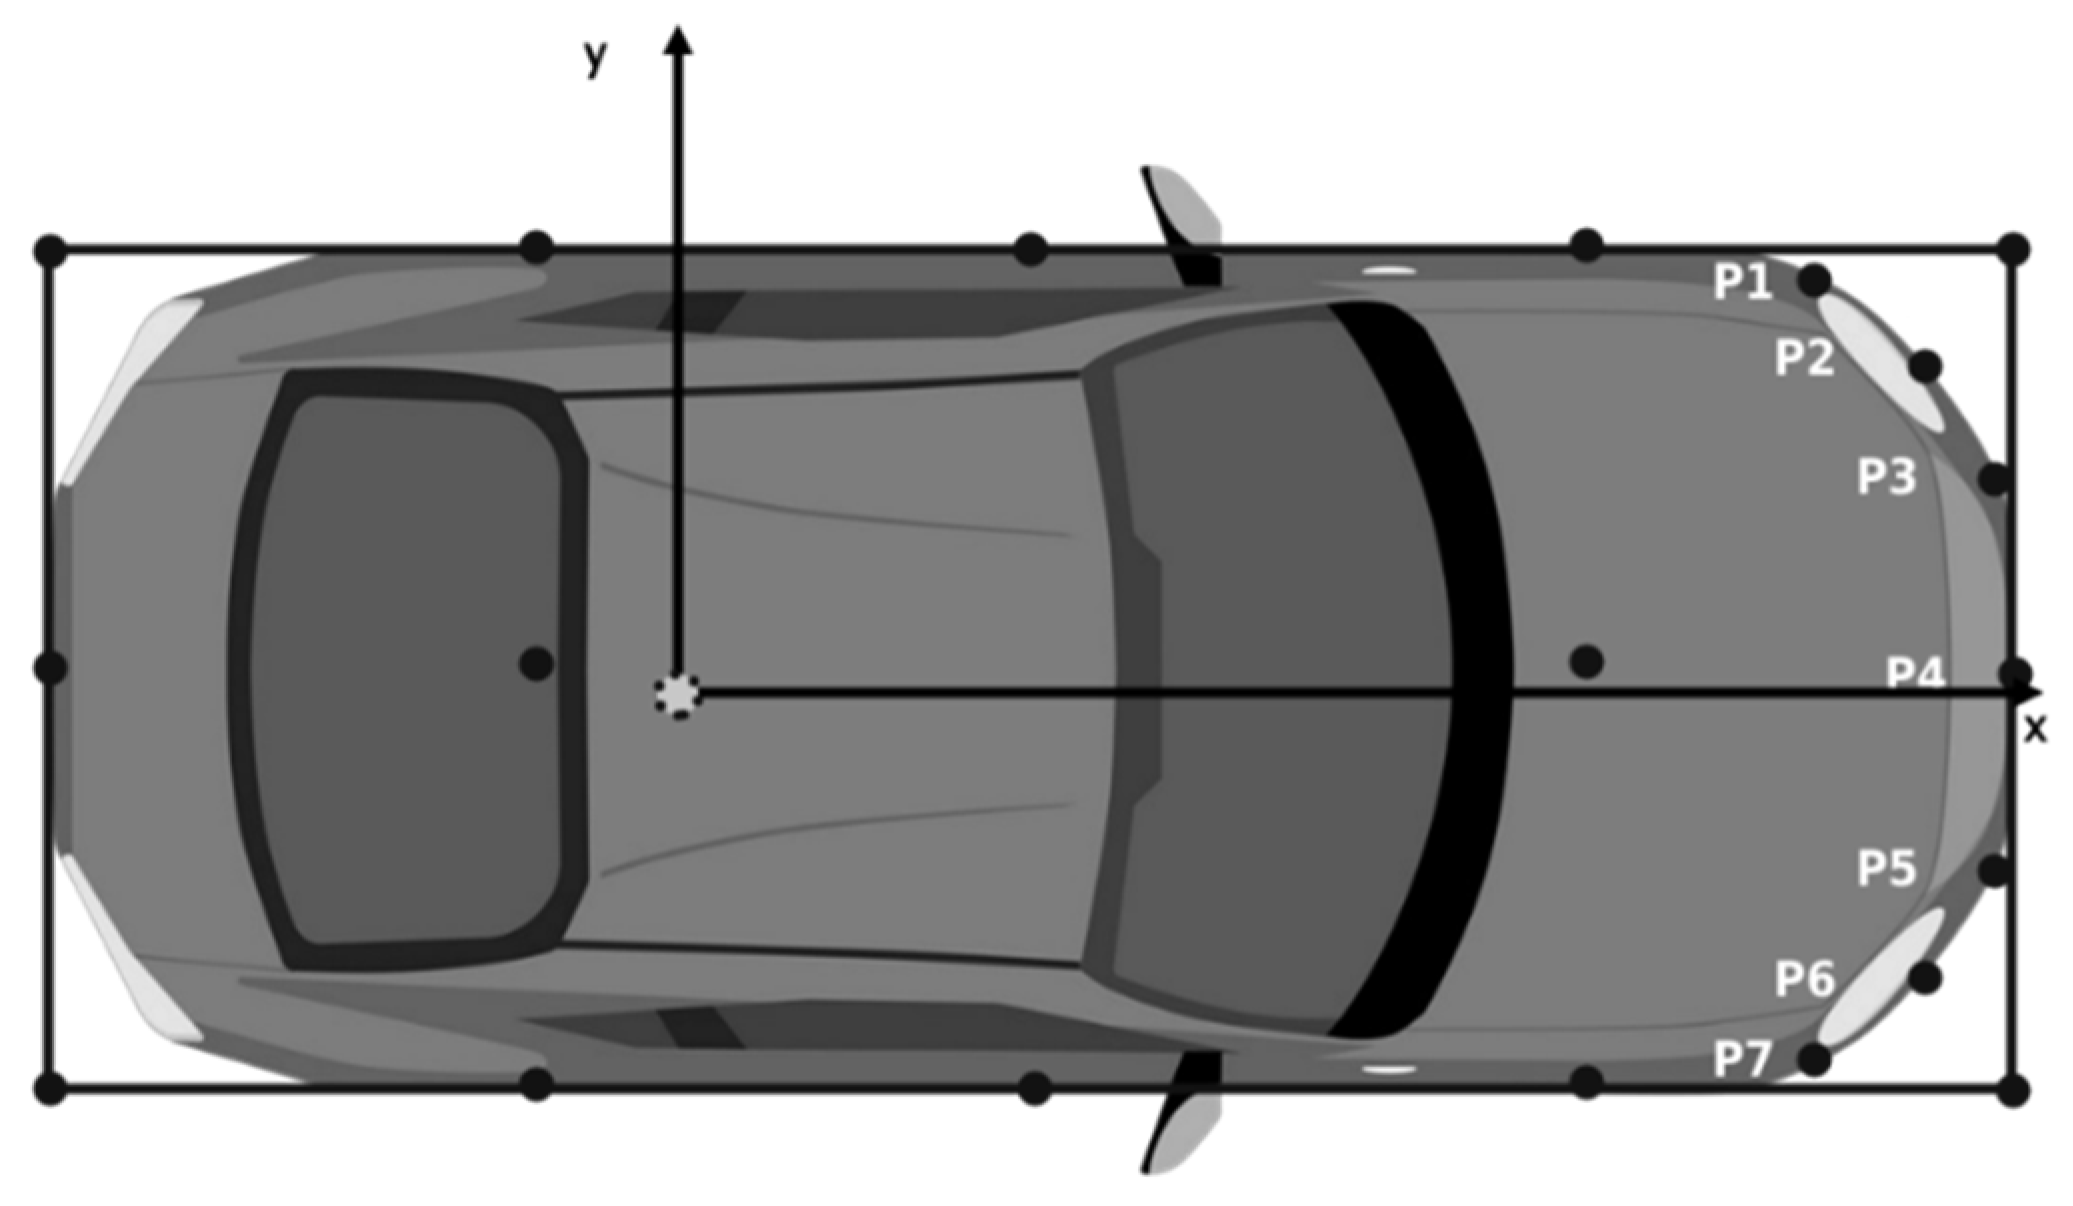
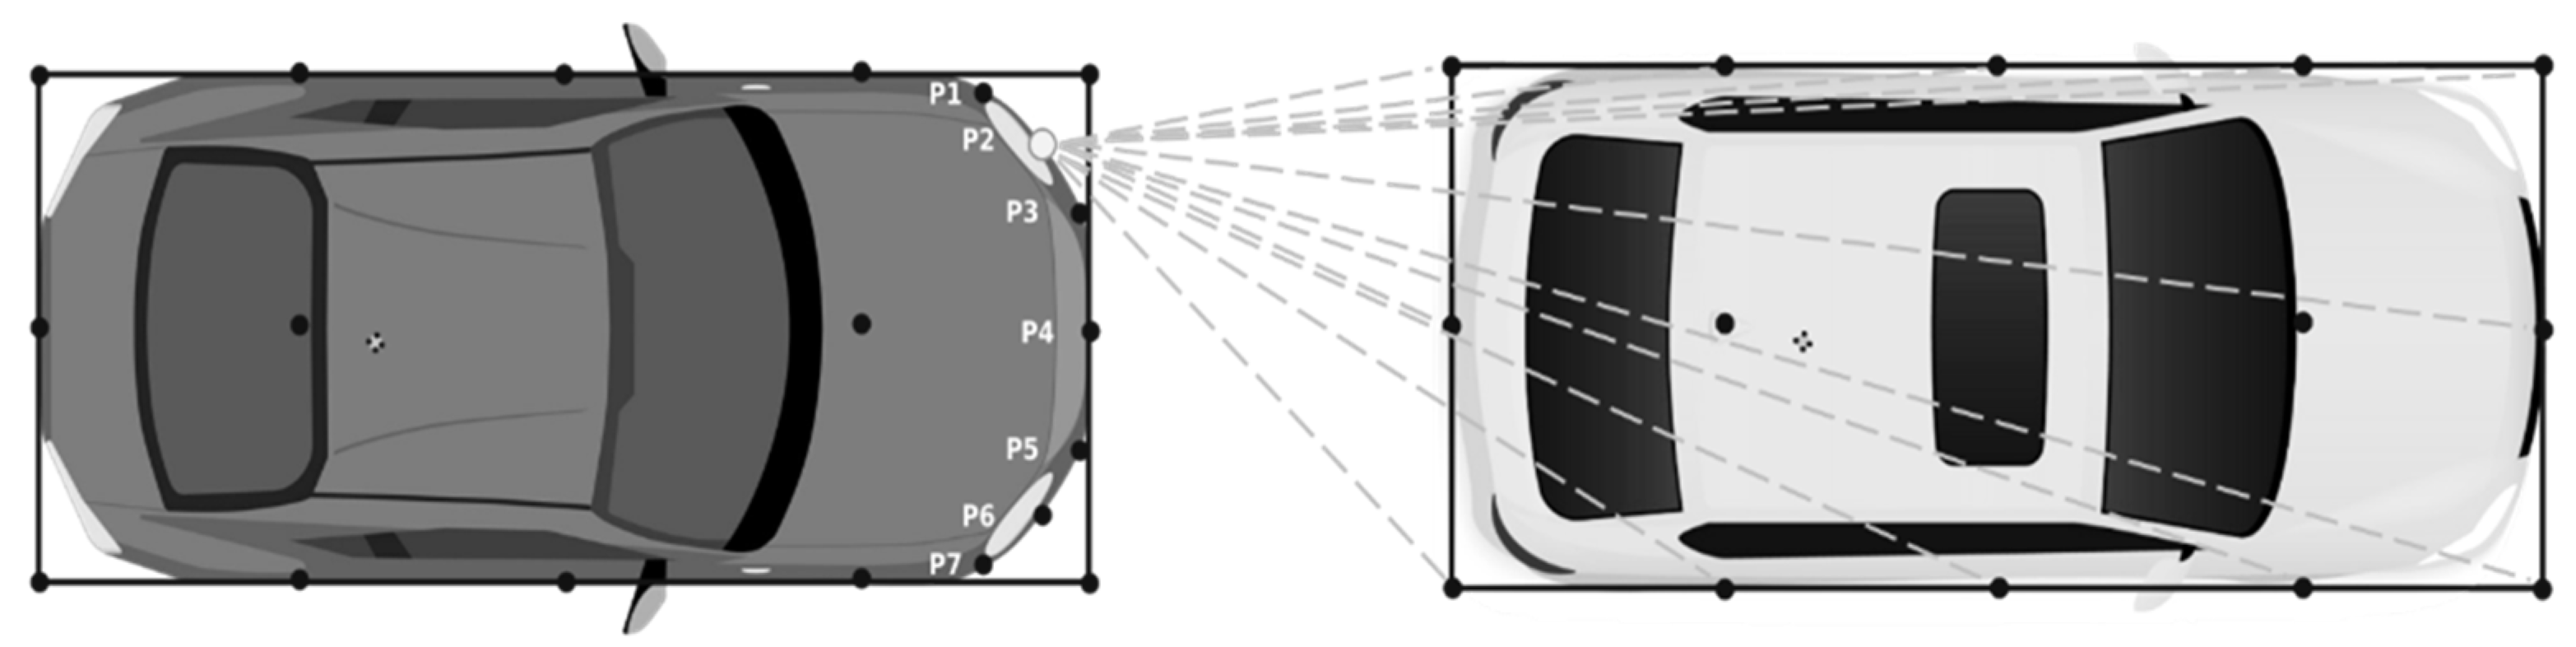
Vehicle actor, schematized in 20 points, as shown in Figure 9. As specified by the Euro NCAP regulation, the bumper for AEB system testing should be discretized in seven points distributed as reported in Figure 9 (points P1, P2, P3, P4, P5, P6, and P7). The distance between each point (named Segment) shall be as follows, in (3):
S e g m e n t = W i d t h ( 0.05 2 ) 6
The other points in Figure 9 indicate the front and rear axle, the rear bumper, the middle of the vehicle, and the position of the ADMA reference point. It should be specified that the ADMA, in that type of inertial system required for testing activities, has the installation procedure and settings of the vehicle direction that must be considered and respected.
-
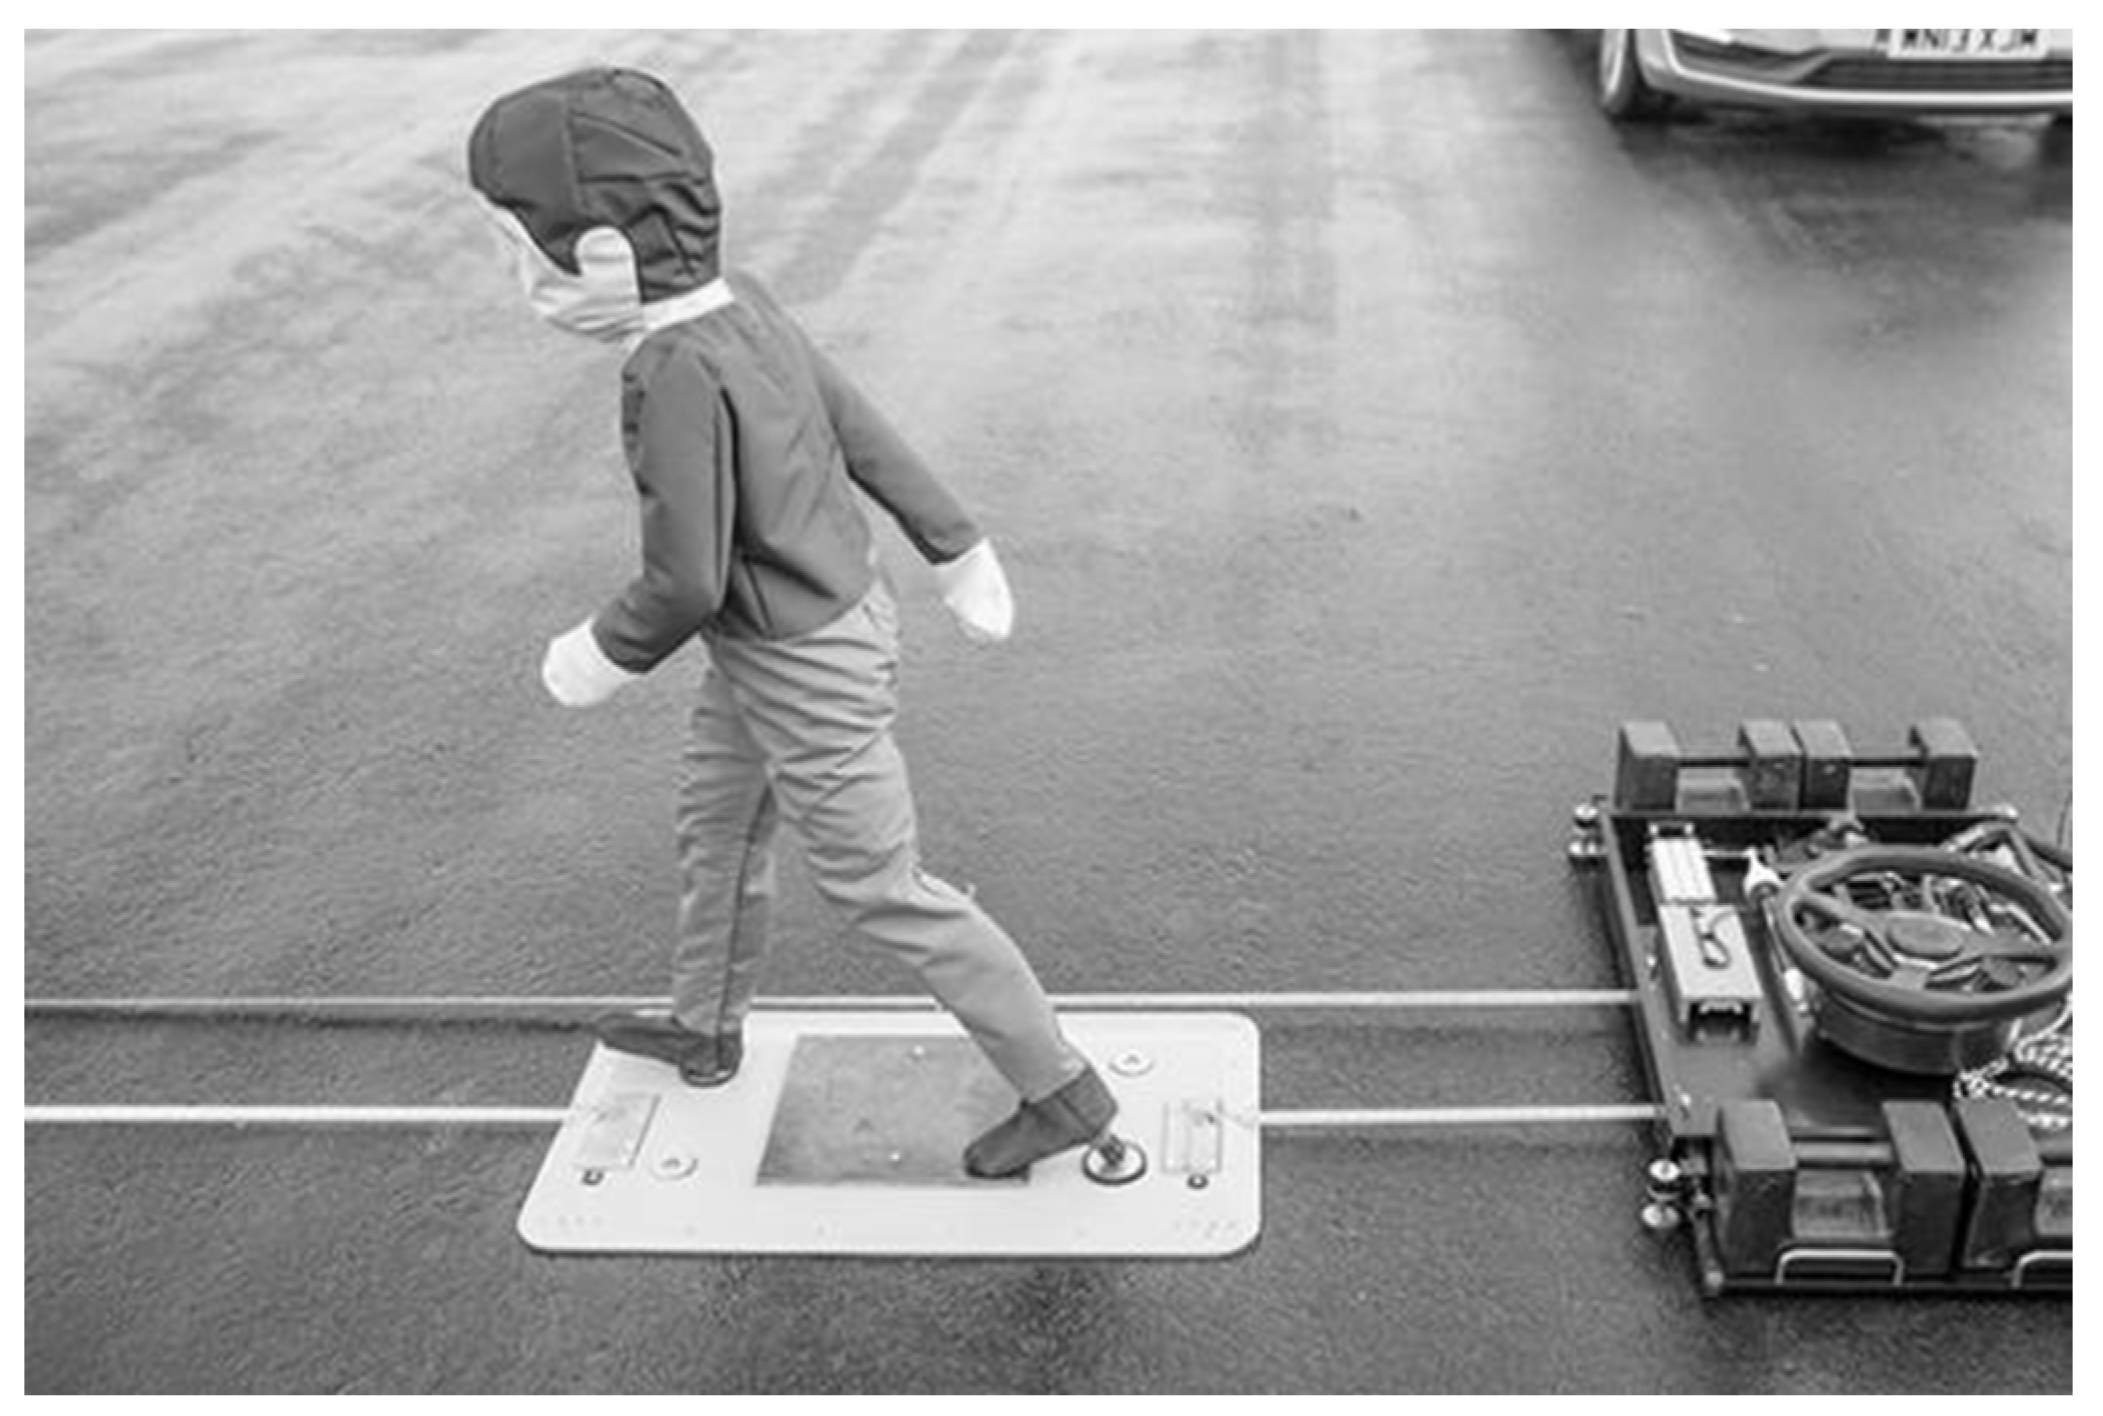
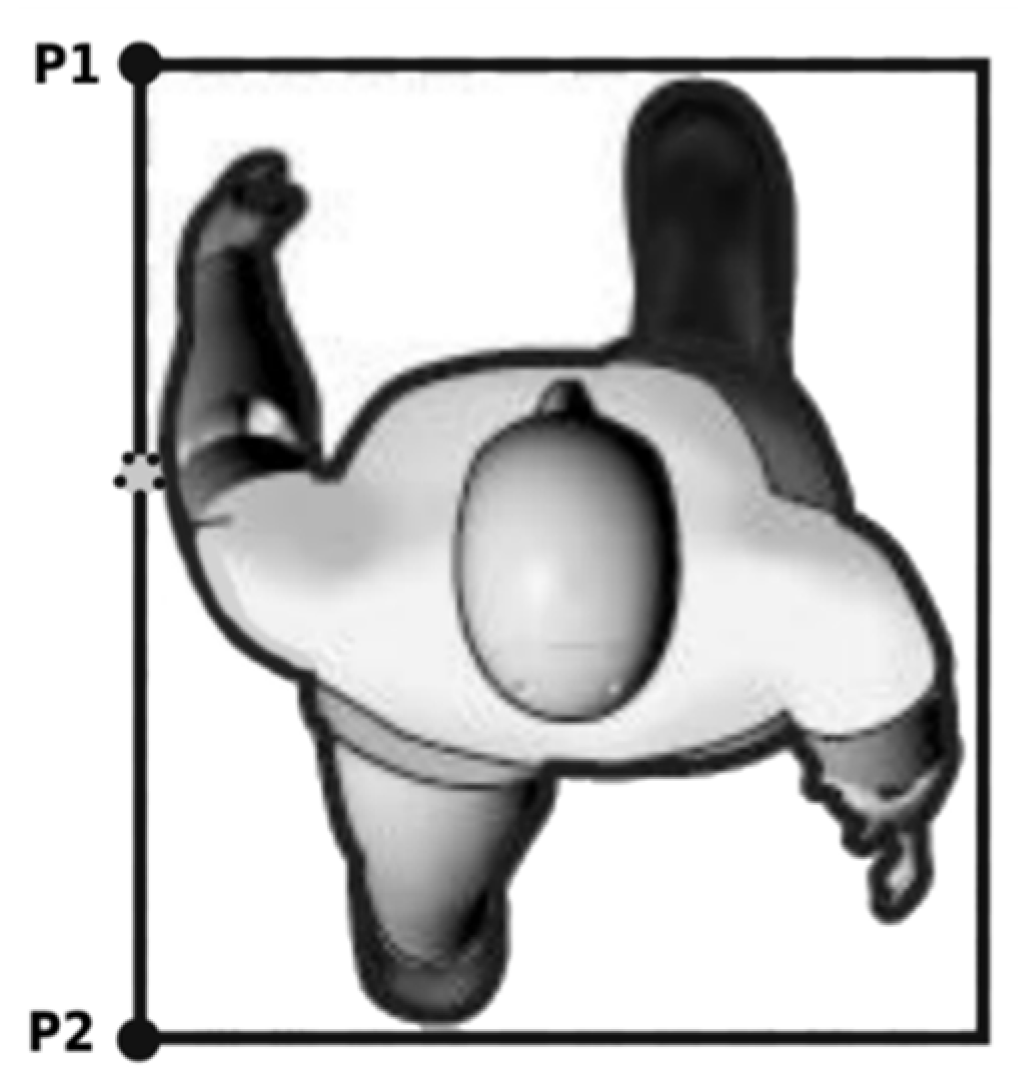
Pedestrian target (for CPNC tests) schematized in 3 points, as depicted in Figure 10, the reference point position, the front offset (P1), and the rear offset (P2). The Euro NCAP regulation defines the width of the bounding box, which differs for child and adult pedestrians.
Table 5 presents the evaluation of the points in vehicle schematization, based on the ADMA position:
The data are measured from the ADMA, and the definition of the points is related to polar coordinate systems to the ADMA. The positioning of actors in time is defined in polar coordinates ( P x y ), defined in (4) and (5) and shown in Figure 11:
P x y ρ e j θ
{ ρ = P x 2 + P y 2 θ = atan ( P y P x )             { P x = ρ cos θ P y = ρ sin θ

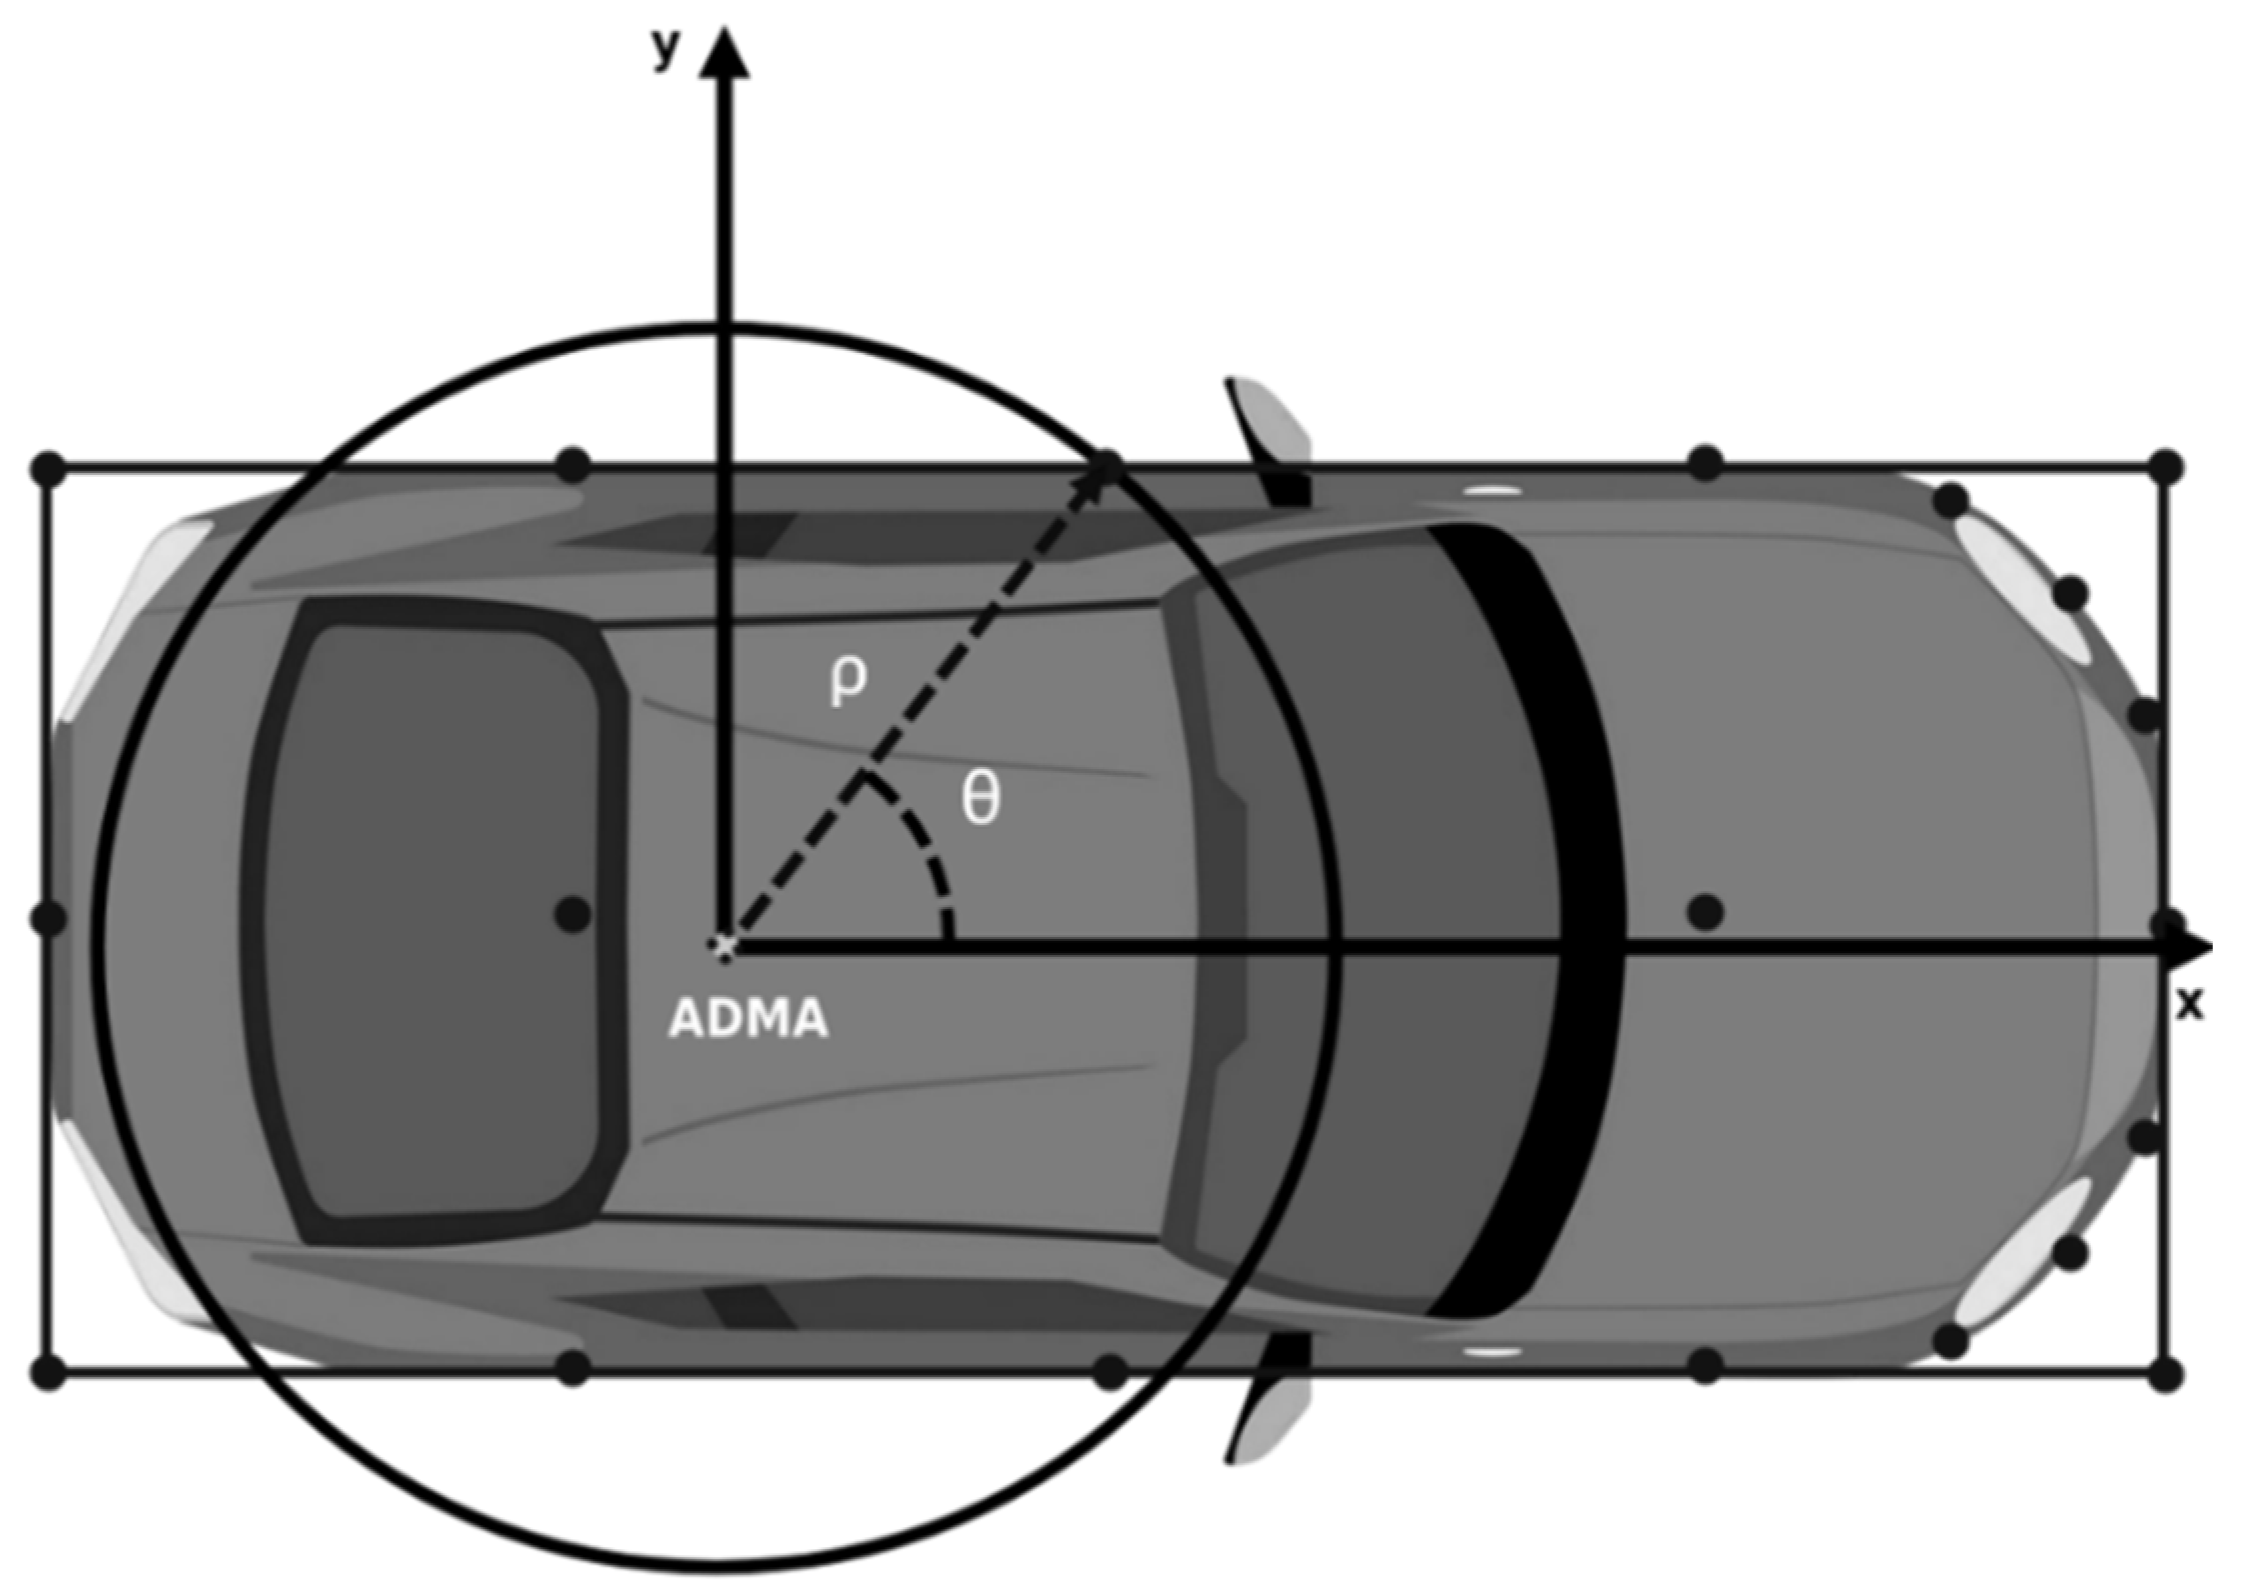
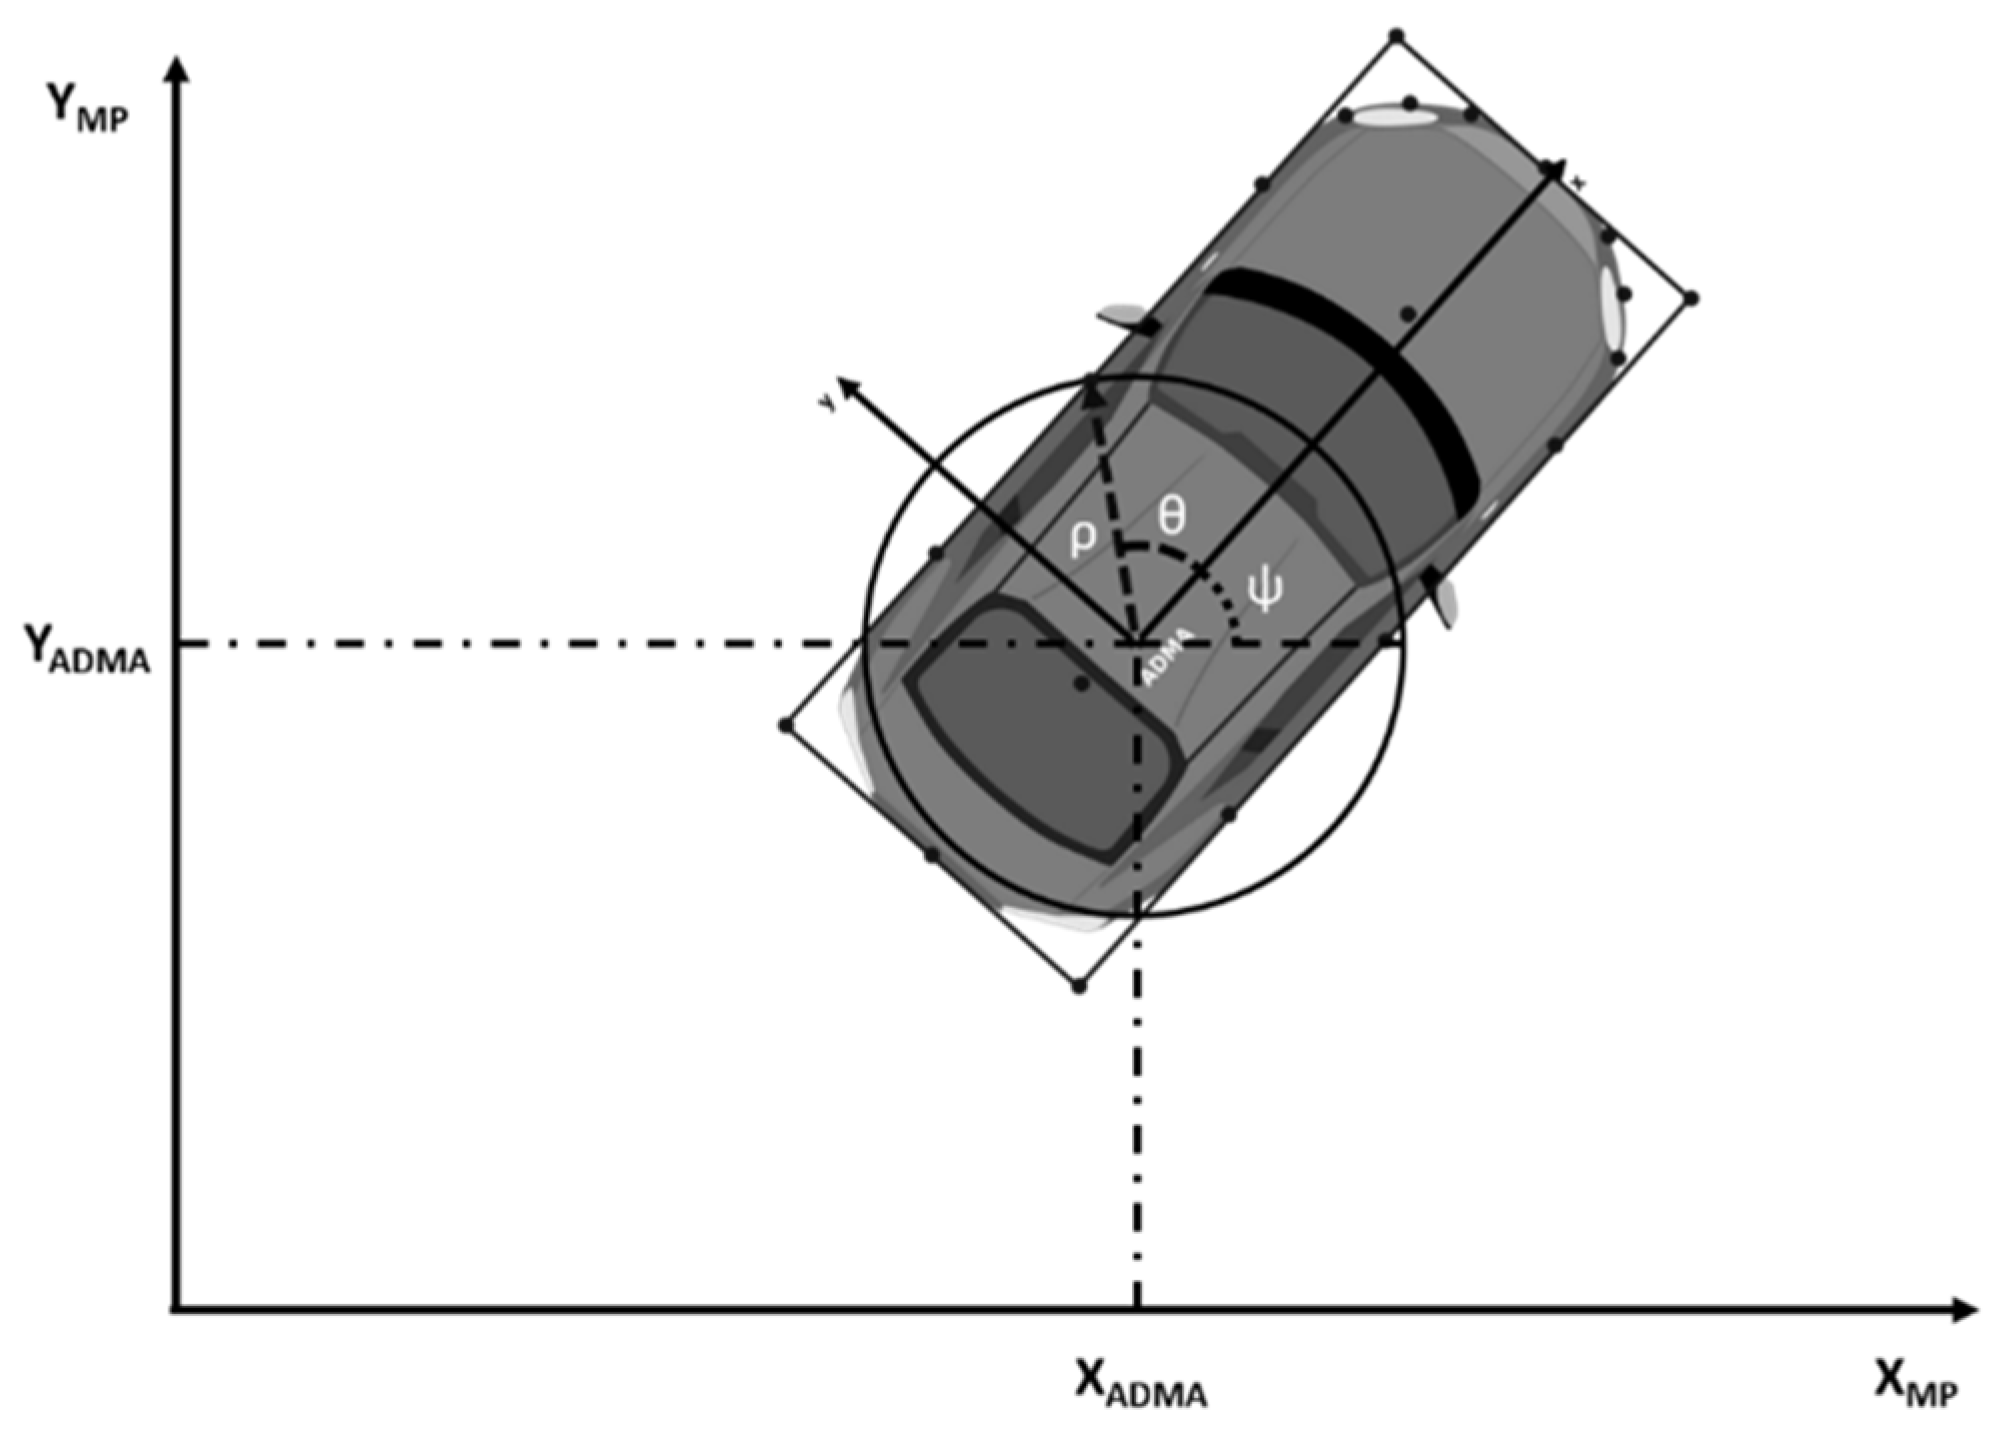
2.7. Kinematic Maneuver, Referring to ADMA Position

The ADMA position for each ith point at time t, ( x i ( t ) ,   y i ( t ) ) , is evaluated through (6), with reference to the Motion Pack, the absolute system of reference of the map used to design the path of the test (as shown in Figure 12):
{ x i ( t ) = x A D M A ( t ) + ρ i cos ( ψ ( t ) + θ i )         [ m ] y i ( t ) = y A D M A ( t ) + ρ i sin ( ψ ( t ) + θ i )         [ m ]                 i = 1 , , n p o i n t s

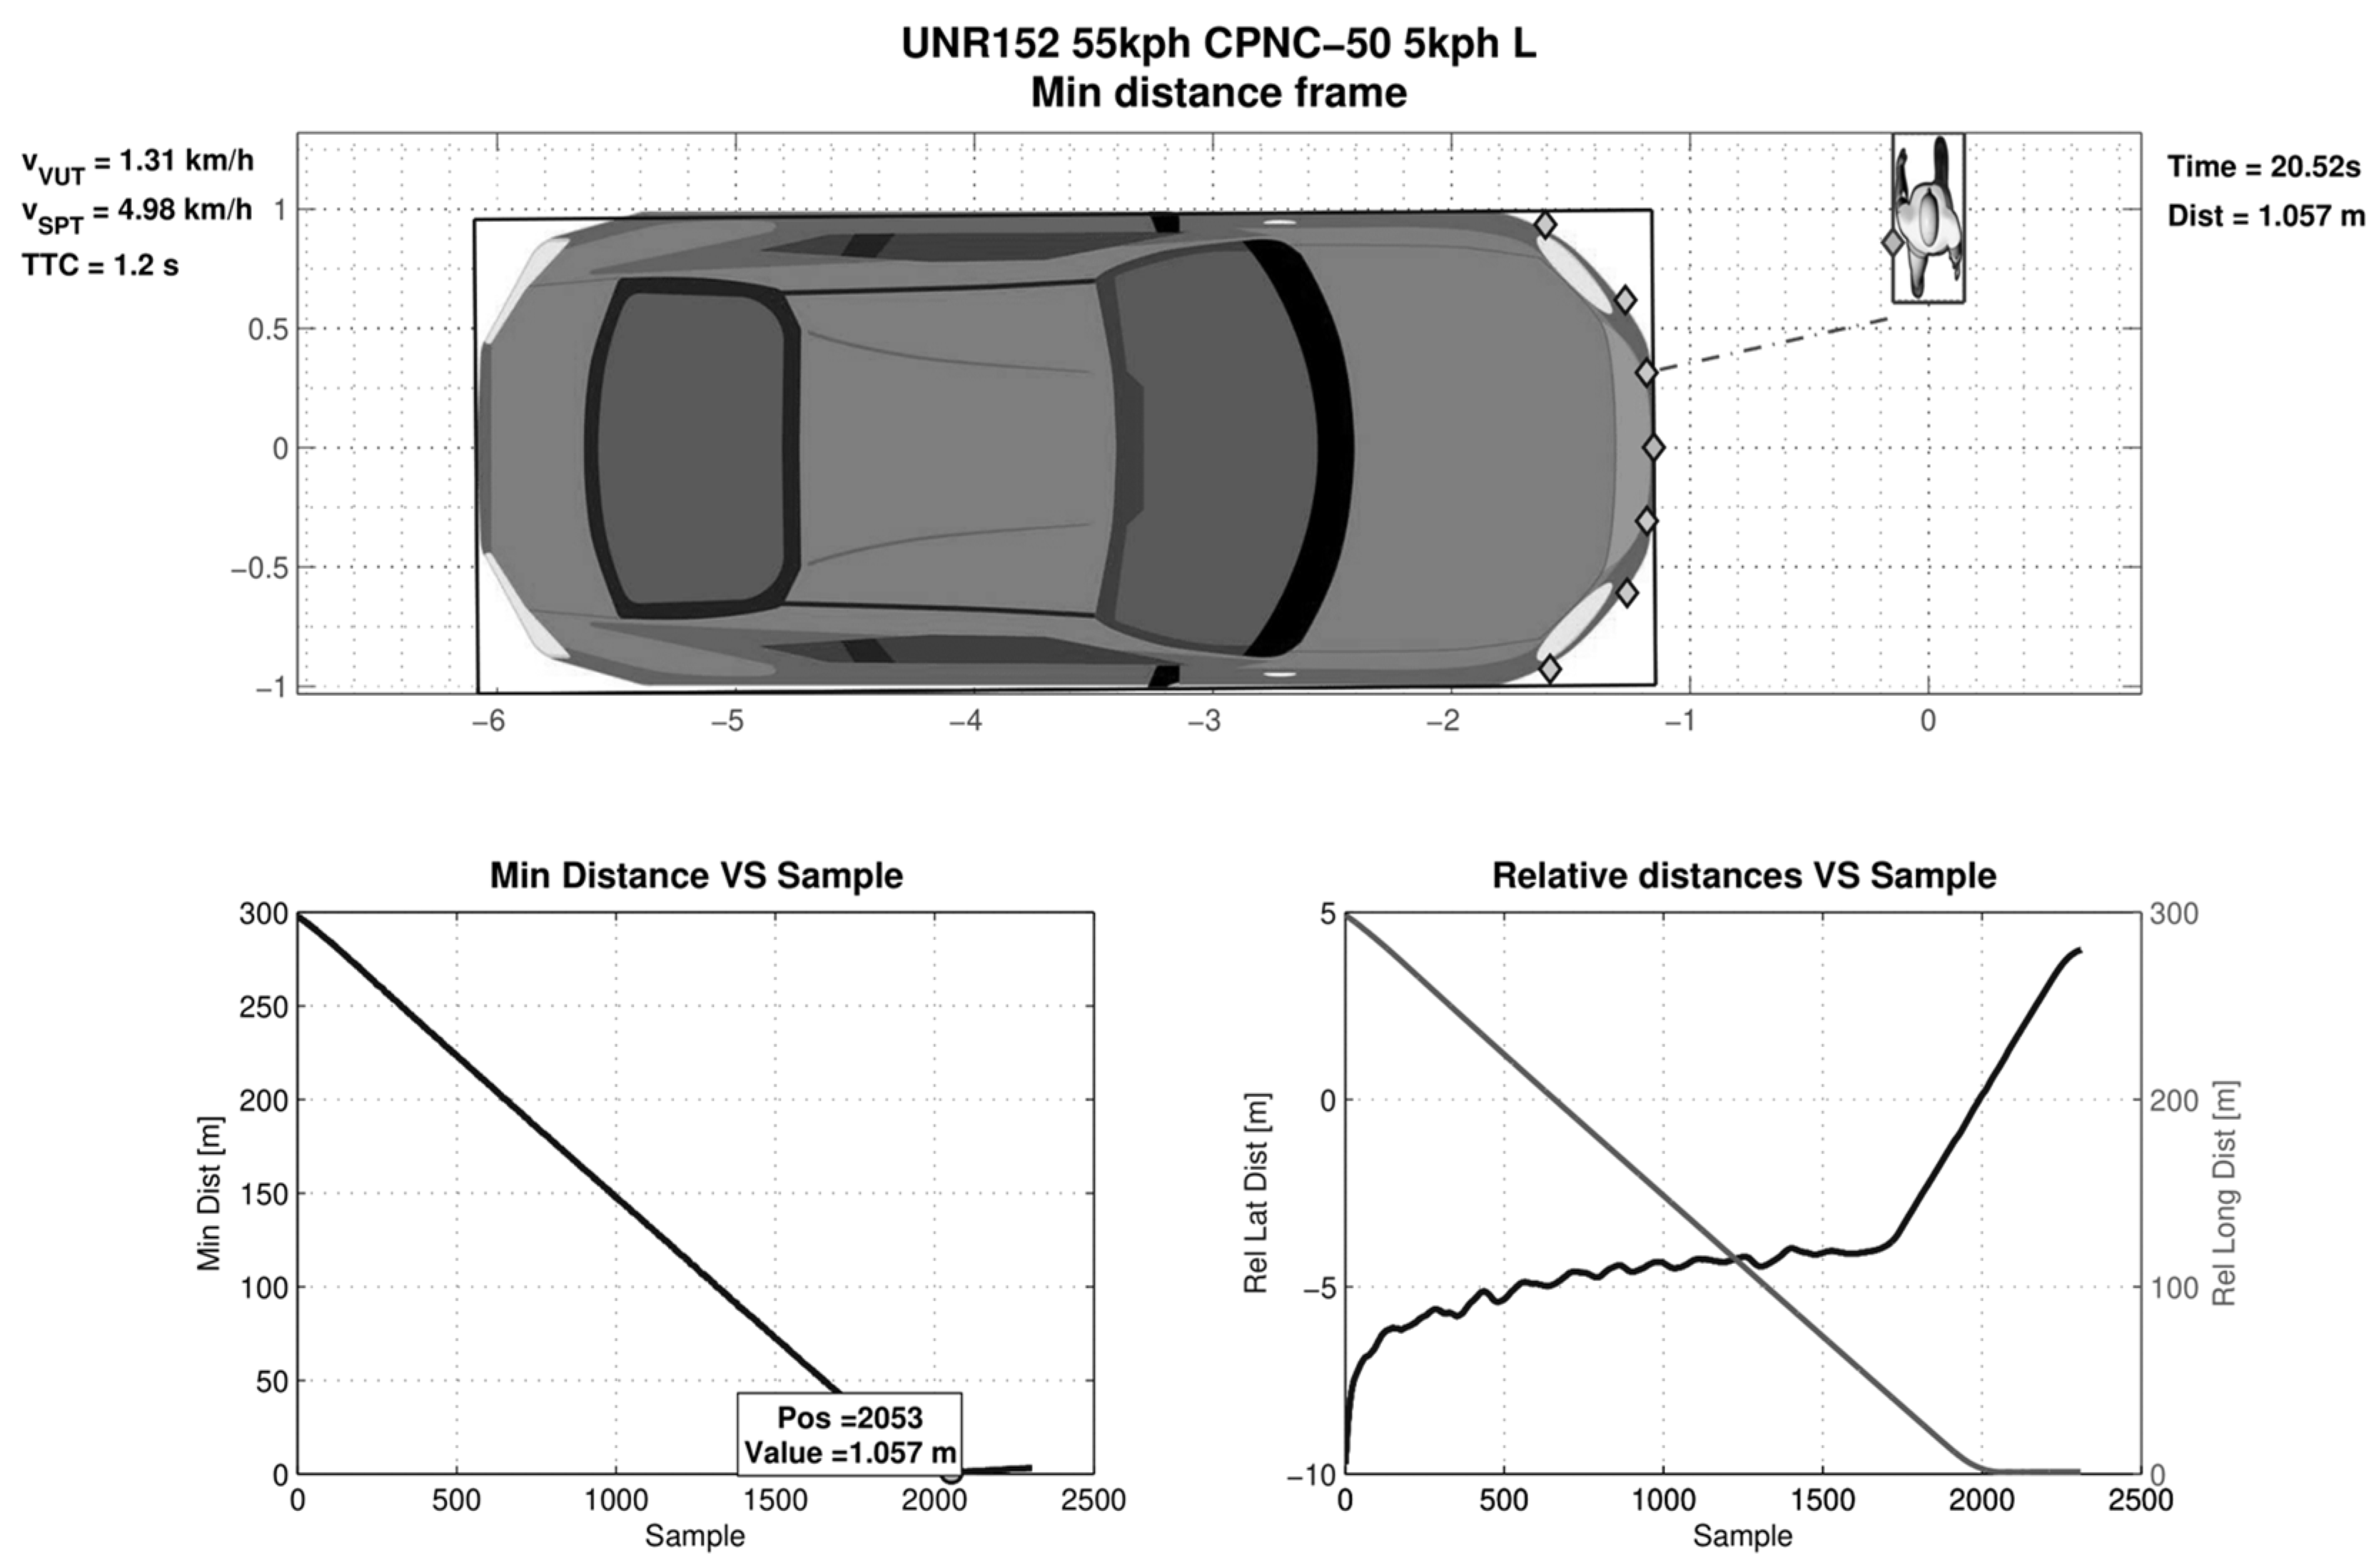
Minimum-Distance Evaluation

The evaluation of the minimum distance is calculated between every point of the subject and every point of the other actor (in the case of a test with only two actors) or the other actors (in the case of multiple actors).
The schematization of the code part for the minimum distance is described in Figure 13; the picture represents the evaluation of every distance between the left point of the front bumper of the subject and all the vehicle target points in a specific time sample:
In the formula for the two-actors test, the minimum distance evaluation is given by (7)–(9):
{ d i s t x , k s ( t ) = x E G O , k ( t ) x T a r g e t . s ( t ) d i s y , k s ( t ) = y E G O , k ( t ) y T a r g e t , s ( t )
d i s t E u c l , k s ( t ) = d i s t x , k s ( t ) 2 + d i s t y , k s ( t ) 2
d i s t E u c l , m i n ( t ) = min ( d i s t E u c l , k s )
where k is the subject points, s is the target points, and min is the minimum of the elements.
The result is the value of the minimum Euclidean distance in a certain time sample and the two extreme points of the segment.
Suppose that the second actor is a pedestrian (CPNC test). In that case, the minimum distance is automatically evaluated only between the subject’s front bumper’s seven points and the SPT’s three points nearest the subject’s front bumper.

3. Results

The tool presented in this work started from the data processing and analysis of the simplest tests (LSS and AEB) and was then perfected to manage even the most complex test (CPNC).

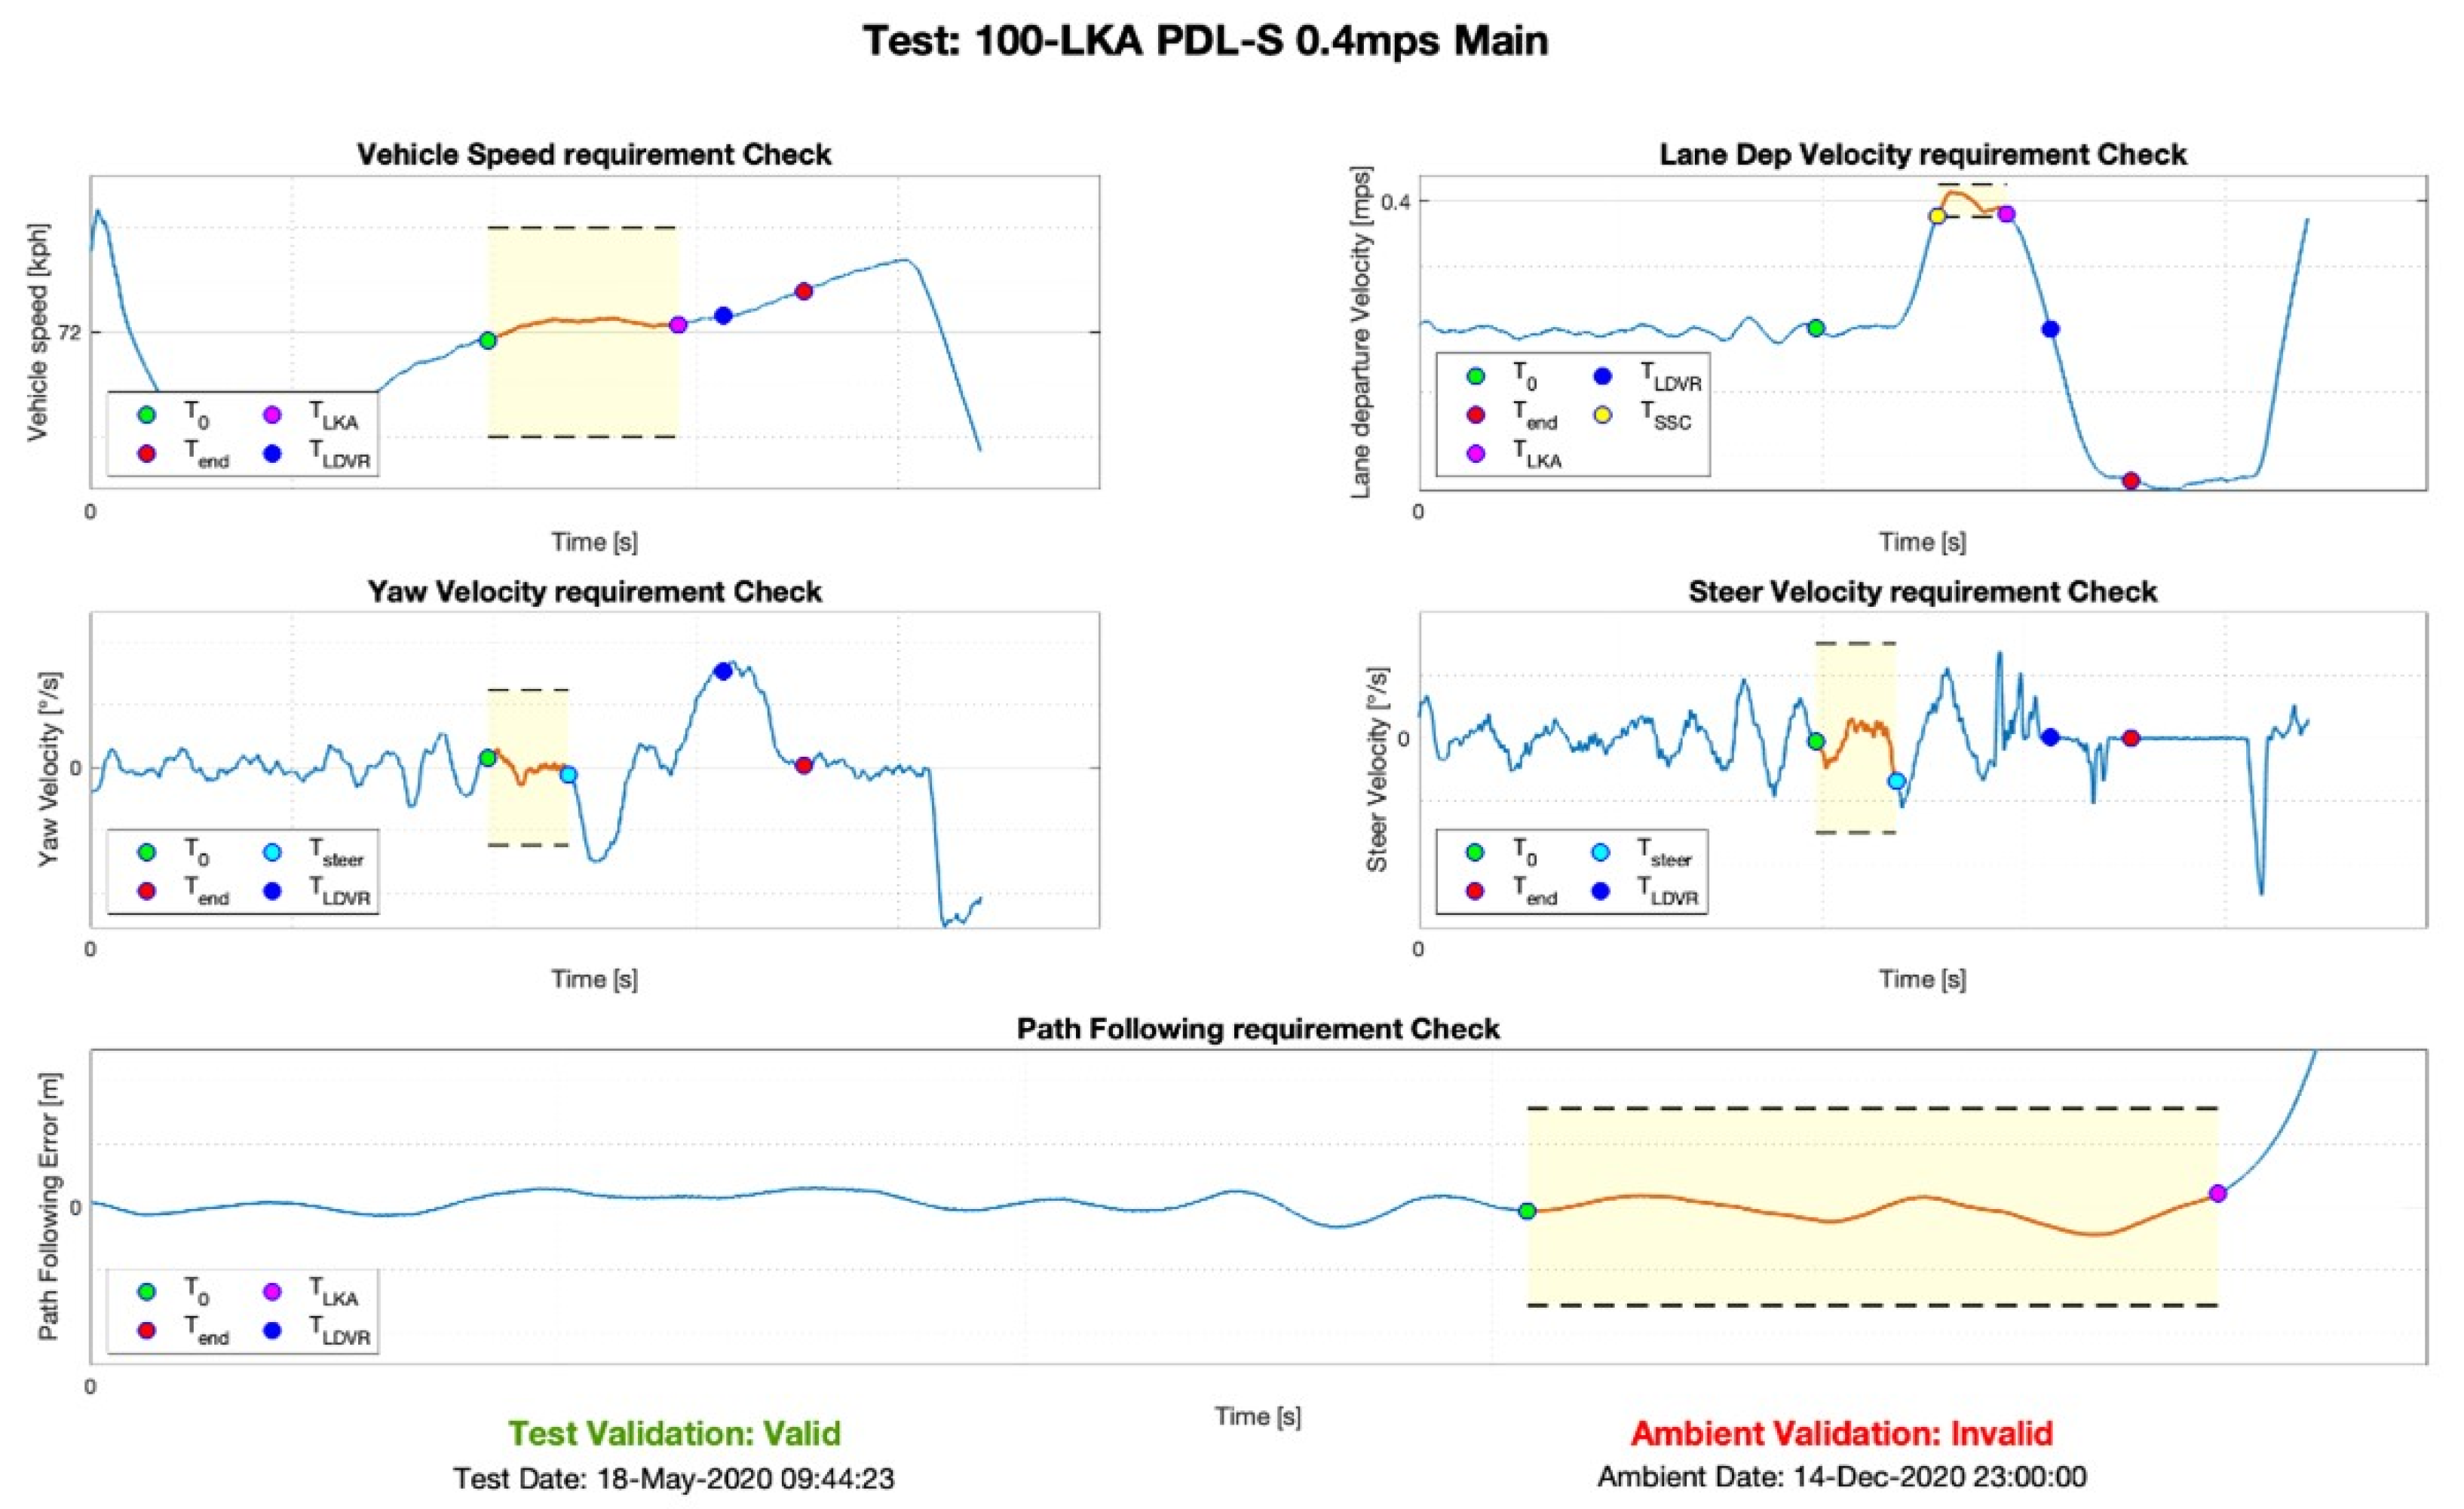
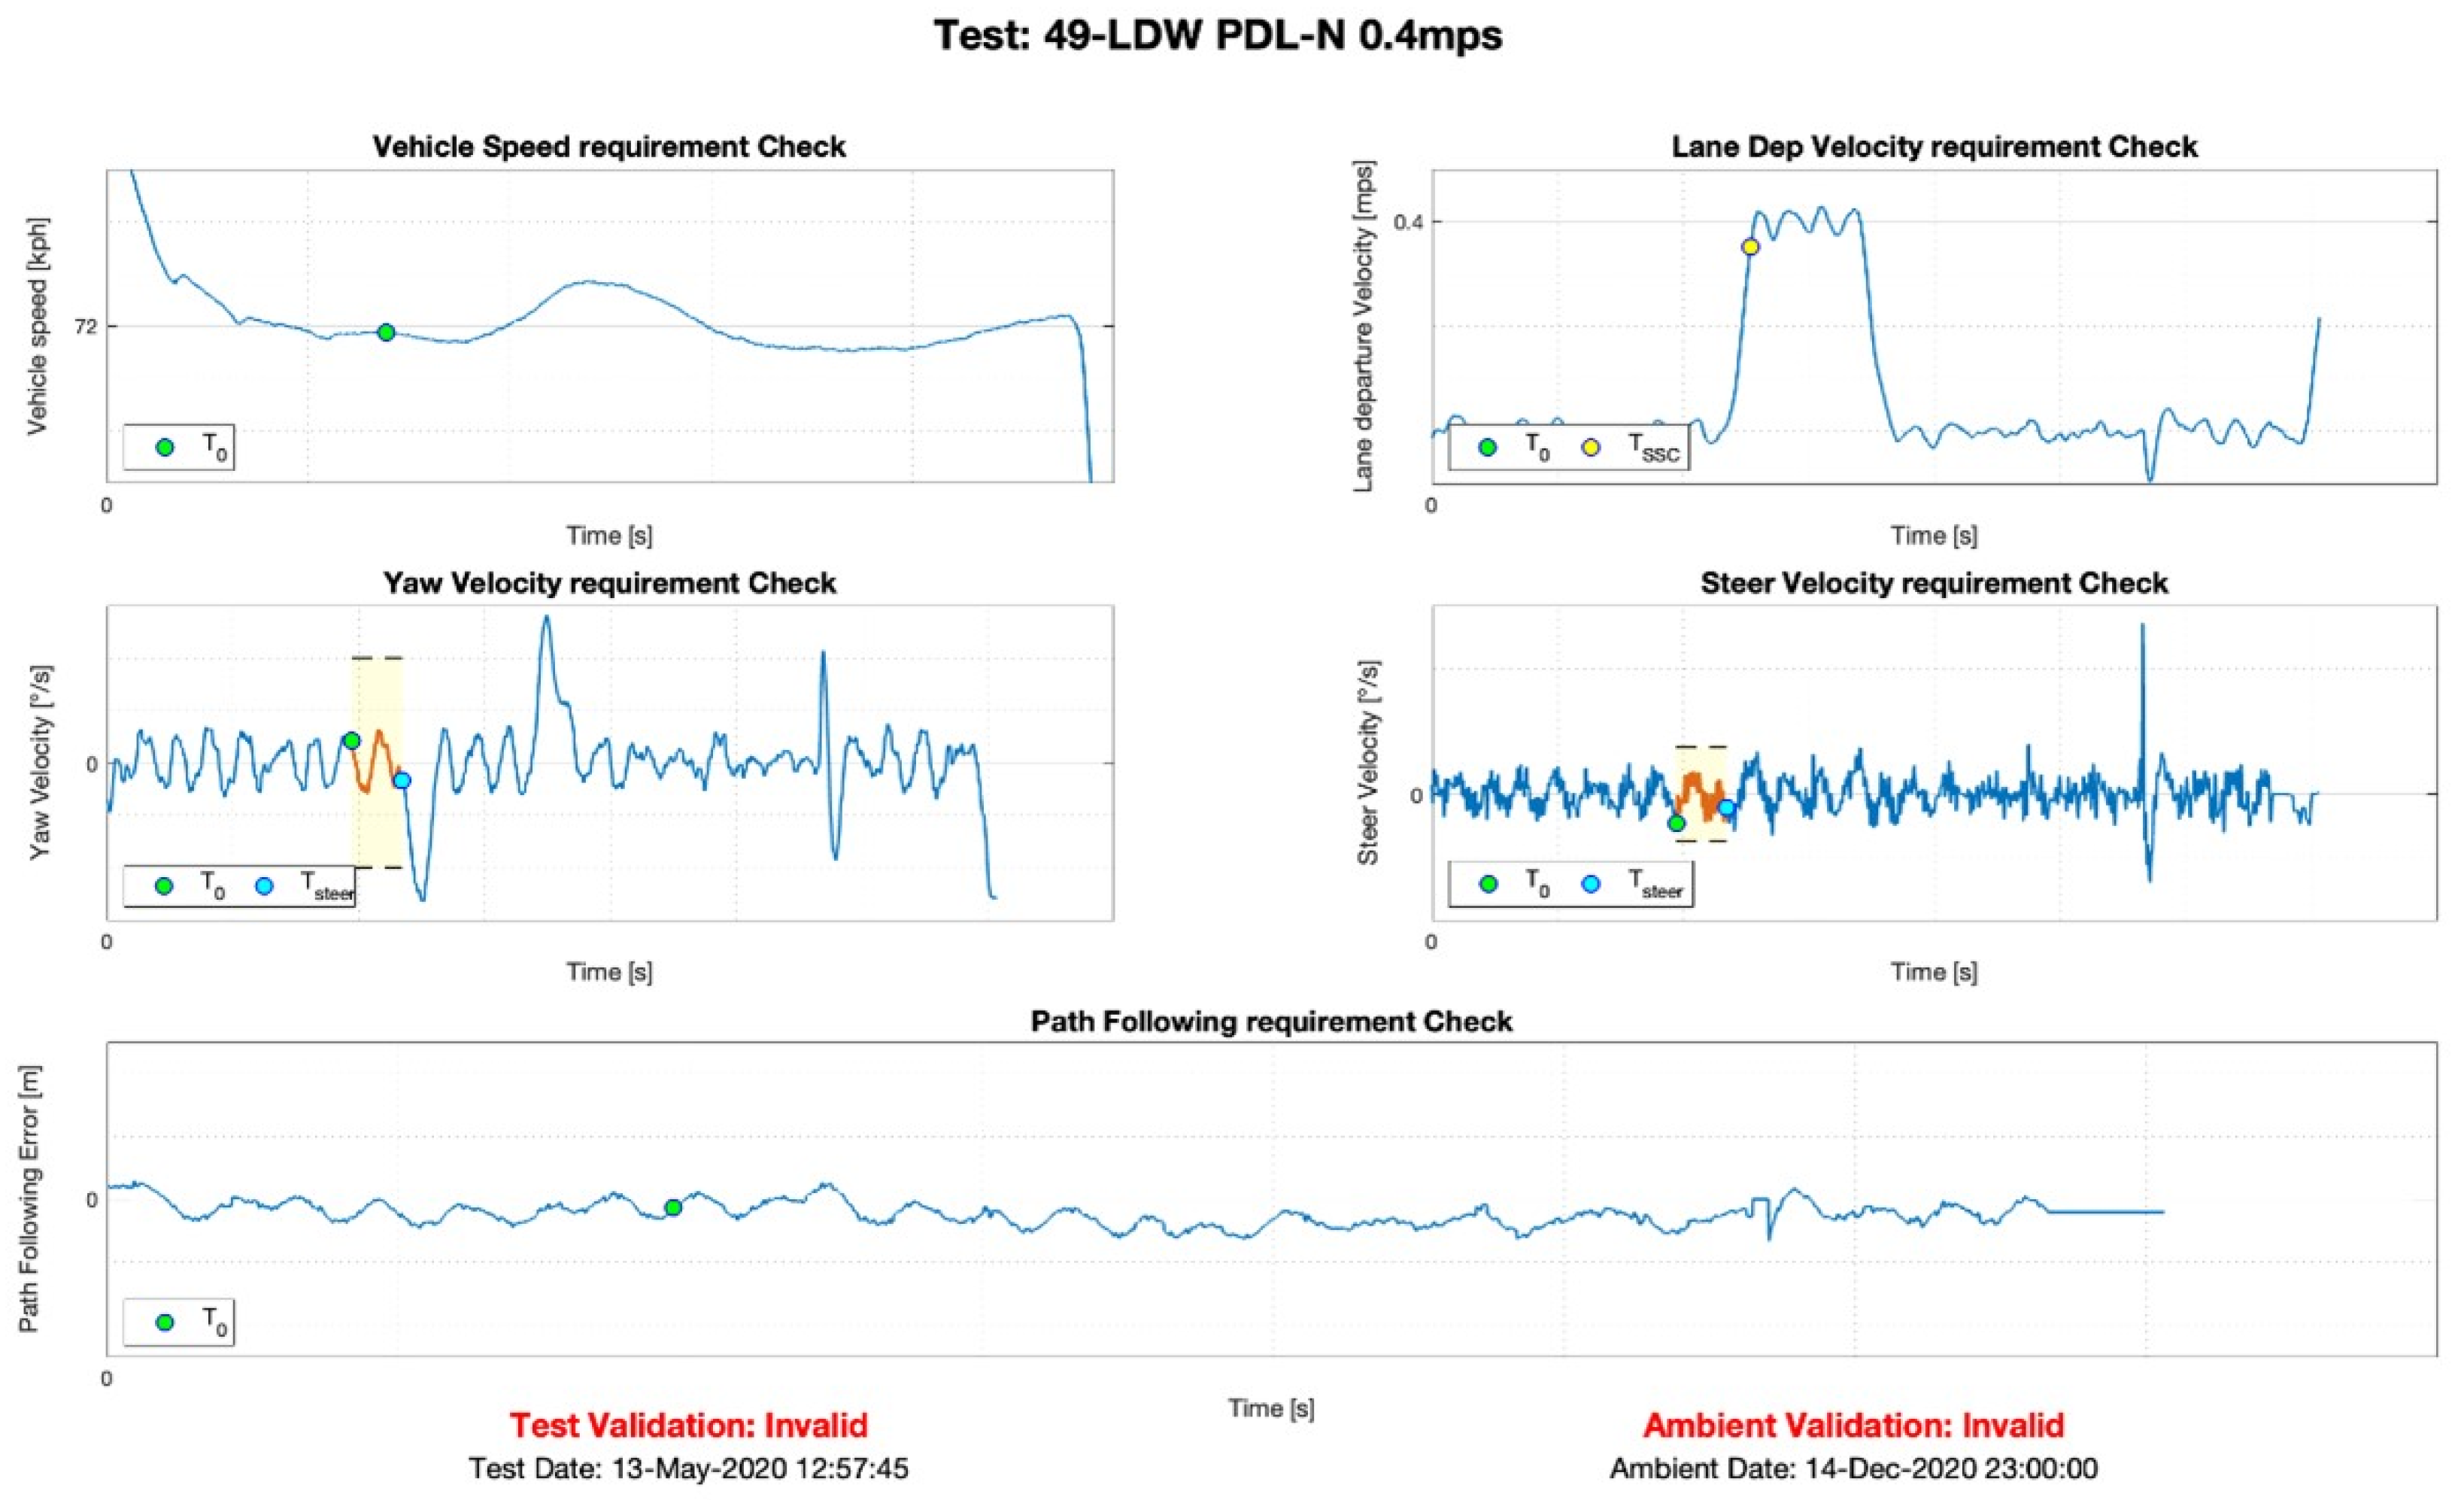
3.1. Post-Processing for LSS Tests

This paragraph describes the code generated to guarantee an effective and rapid post-processing process of the homologation tests according to the Euro NCAP protocol for LSS. In particular, the functions underlying this routine produced in the environment are analyzed. MATLAB and some graphical results were obtained for the tests on a C-segment car. This is the main post-processing code which contains the various functions necessary to analyze the acquisitions of the tests carried out on the track.
Figure 14 shows a flowchart that briefly and schematically describes the logical process that is followed by the code:
The first part of the code opens with a quest dialog box, in which the user is asked if the function will be started only for purposes of the graphical display of the results (the post-processing has already been carried out previously) or if it is necessary to export the file containing the analysis results.
If the answer to this question is negative, the data are post-processed. In particular, by using the function named pproc.m in the flowchart in Figure 14, the user is asked to select the car on which to carry out the analysis and the test category to be considered (LDW, LKA, or ELK) by selecting the reference folder; in this way, the code is positioned in this path and has the possibility of extracting the reference text files (* .txt) from which to obtain the necessary information. In fact, by choosing the folder, the selected test type is extracted from its path, and the “procedure” variable is constructed, consisting of the union of the characters “proc_” and the test category (for example, if the LDW category is selected, the variable will be equal to “proc_LDW”). They were having defined this variable and the other two, “mfld” and “fld”, which respectively define the position where the “LSS_main.m” code is located, and the path that leads to the folder of the test category in question continue by executing the functions which carry out the actual post-processing.
If the answer is positive, we go directly to the second part of the code.
The second part of the code opens with the choice by the user of the file to be used for the graphic display of the results: from the reference folder for the LSS, navigate to the category to be displayed and select the “Test_profile.mat” generated by the post-processing tool. Once this table has been imported, the empty rows are eliminated and used to separate the different runs of each subcategory of tests visually. A list box is generated from which to select the reference run to depict the trends of the test analysis parameters. Once the run is selected, some data to be used for the subsequent plots are extrapolated; in particular, the start and end times and other available time instants for the analysis of the test are extracted from the table “Test_profile.mat”, the absolute speed profiles of the vehicle, yaw angular velocity, steering angular velocity, path-following error (error in following the path generated by Robot Controller (RC) [22] software that creates the table OUTPUT_test.mat), and lane-departure velocity, as well as the name of the reference run from which to extract also the reference lane-departure velocity at which the test must be carried out. The function checking.m (Figure 14) compares the results obtained by the MATLAB routine and those of the RC software. The function tscore performs the assignment of the test score according to Euro NCAP Safety Assist 9.0.1.
Once this is completed, the code automatically generates a single graph in which five subplots are shown, one for each of the profiles described above, highlighting the traits of interest for the validation of the test and the limits that must be respected for the test validation.
Finally, the title of the plot indicates the reference test. At the bottom of the figure is an inscription to identify the validity of the test and one for the validation of the environmental conditions, which bear the wording “Valid” and are colored green if they are valid; otherwise, it has the wording “Invalid” and is colored red. An example of what has been described is reported in Figure 15, Figure 16 and Figure 17, showing the result for LSS tests, LDW, LKA, and ELK, respectively.
In Figure 15, Figure 16 and Figure 17, the realized algorithm automatically shows all the useful information extracted from the data saved for the selected LLS test. The results, output of the proposed code, are distributed in a single figure that contains five subplots, representing the velocity profiles, the lane departure velocity, the yaw angular velocity, the steering angular velocity, and the path-following error.
The lane-departure velocity is the speed at which the system moves away from the lane. This variable is not directly obtainable from the data of the inertial system. Still, it is necessary to identify it from an act of rigid motion, considering the speed profile in the reference point, which, for these tests, was positioned at the outermost point of the car or the front bumper. In particular, this point will vary between the right or left side depending on whether the test was carried out on the passenger or driver side. The relationships that define this variable (lane-departure velocity) are the following:
v x , p = V x , I M U + ( y p Y I M U ) · ψ ˙ f i l t e r e d
v y , p = V y , I M U + ( x p X I M U ) · ψ ˙ f i l t e r e d
V y , p = v x , p 2 + v y , p 2 · sin ( ψ + atan ( v y , p v x , p ) )
In (10)–(12), we have the following:
  • v x , p is the longitudinal velocity of the reference point (km/h);
  • v y , p is the lateral velocity of the reference point (km/h);
  • V x , I M U is the longitudinal velocity of the inertial system (km/h);
  • V y , I M U is the lateral velocity of the inertial system (km/h);
  • x p is the longitudinal position of the reference point (m);
  • y p is the lateral position of the reference point (m);
  • X I M U is the longitudinal position of the inertial system (m);
  • ψ is the yaw angle of the inertial system (rad);
  • ψ ˙ f i l t e r e d is the filtered angular yaw rate (rad/s).
Furthermore, the path-following error is calculated with simple relations that consider that the lanes have a length of 3.5 m and that it is possible to use the distance between the more external point of the car and the lane mark, named Distance to Lane Edge (DTLE).
In the plots of Figure 15, Figure 16 and Figure 17, we have the following:
-
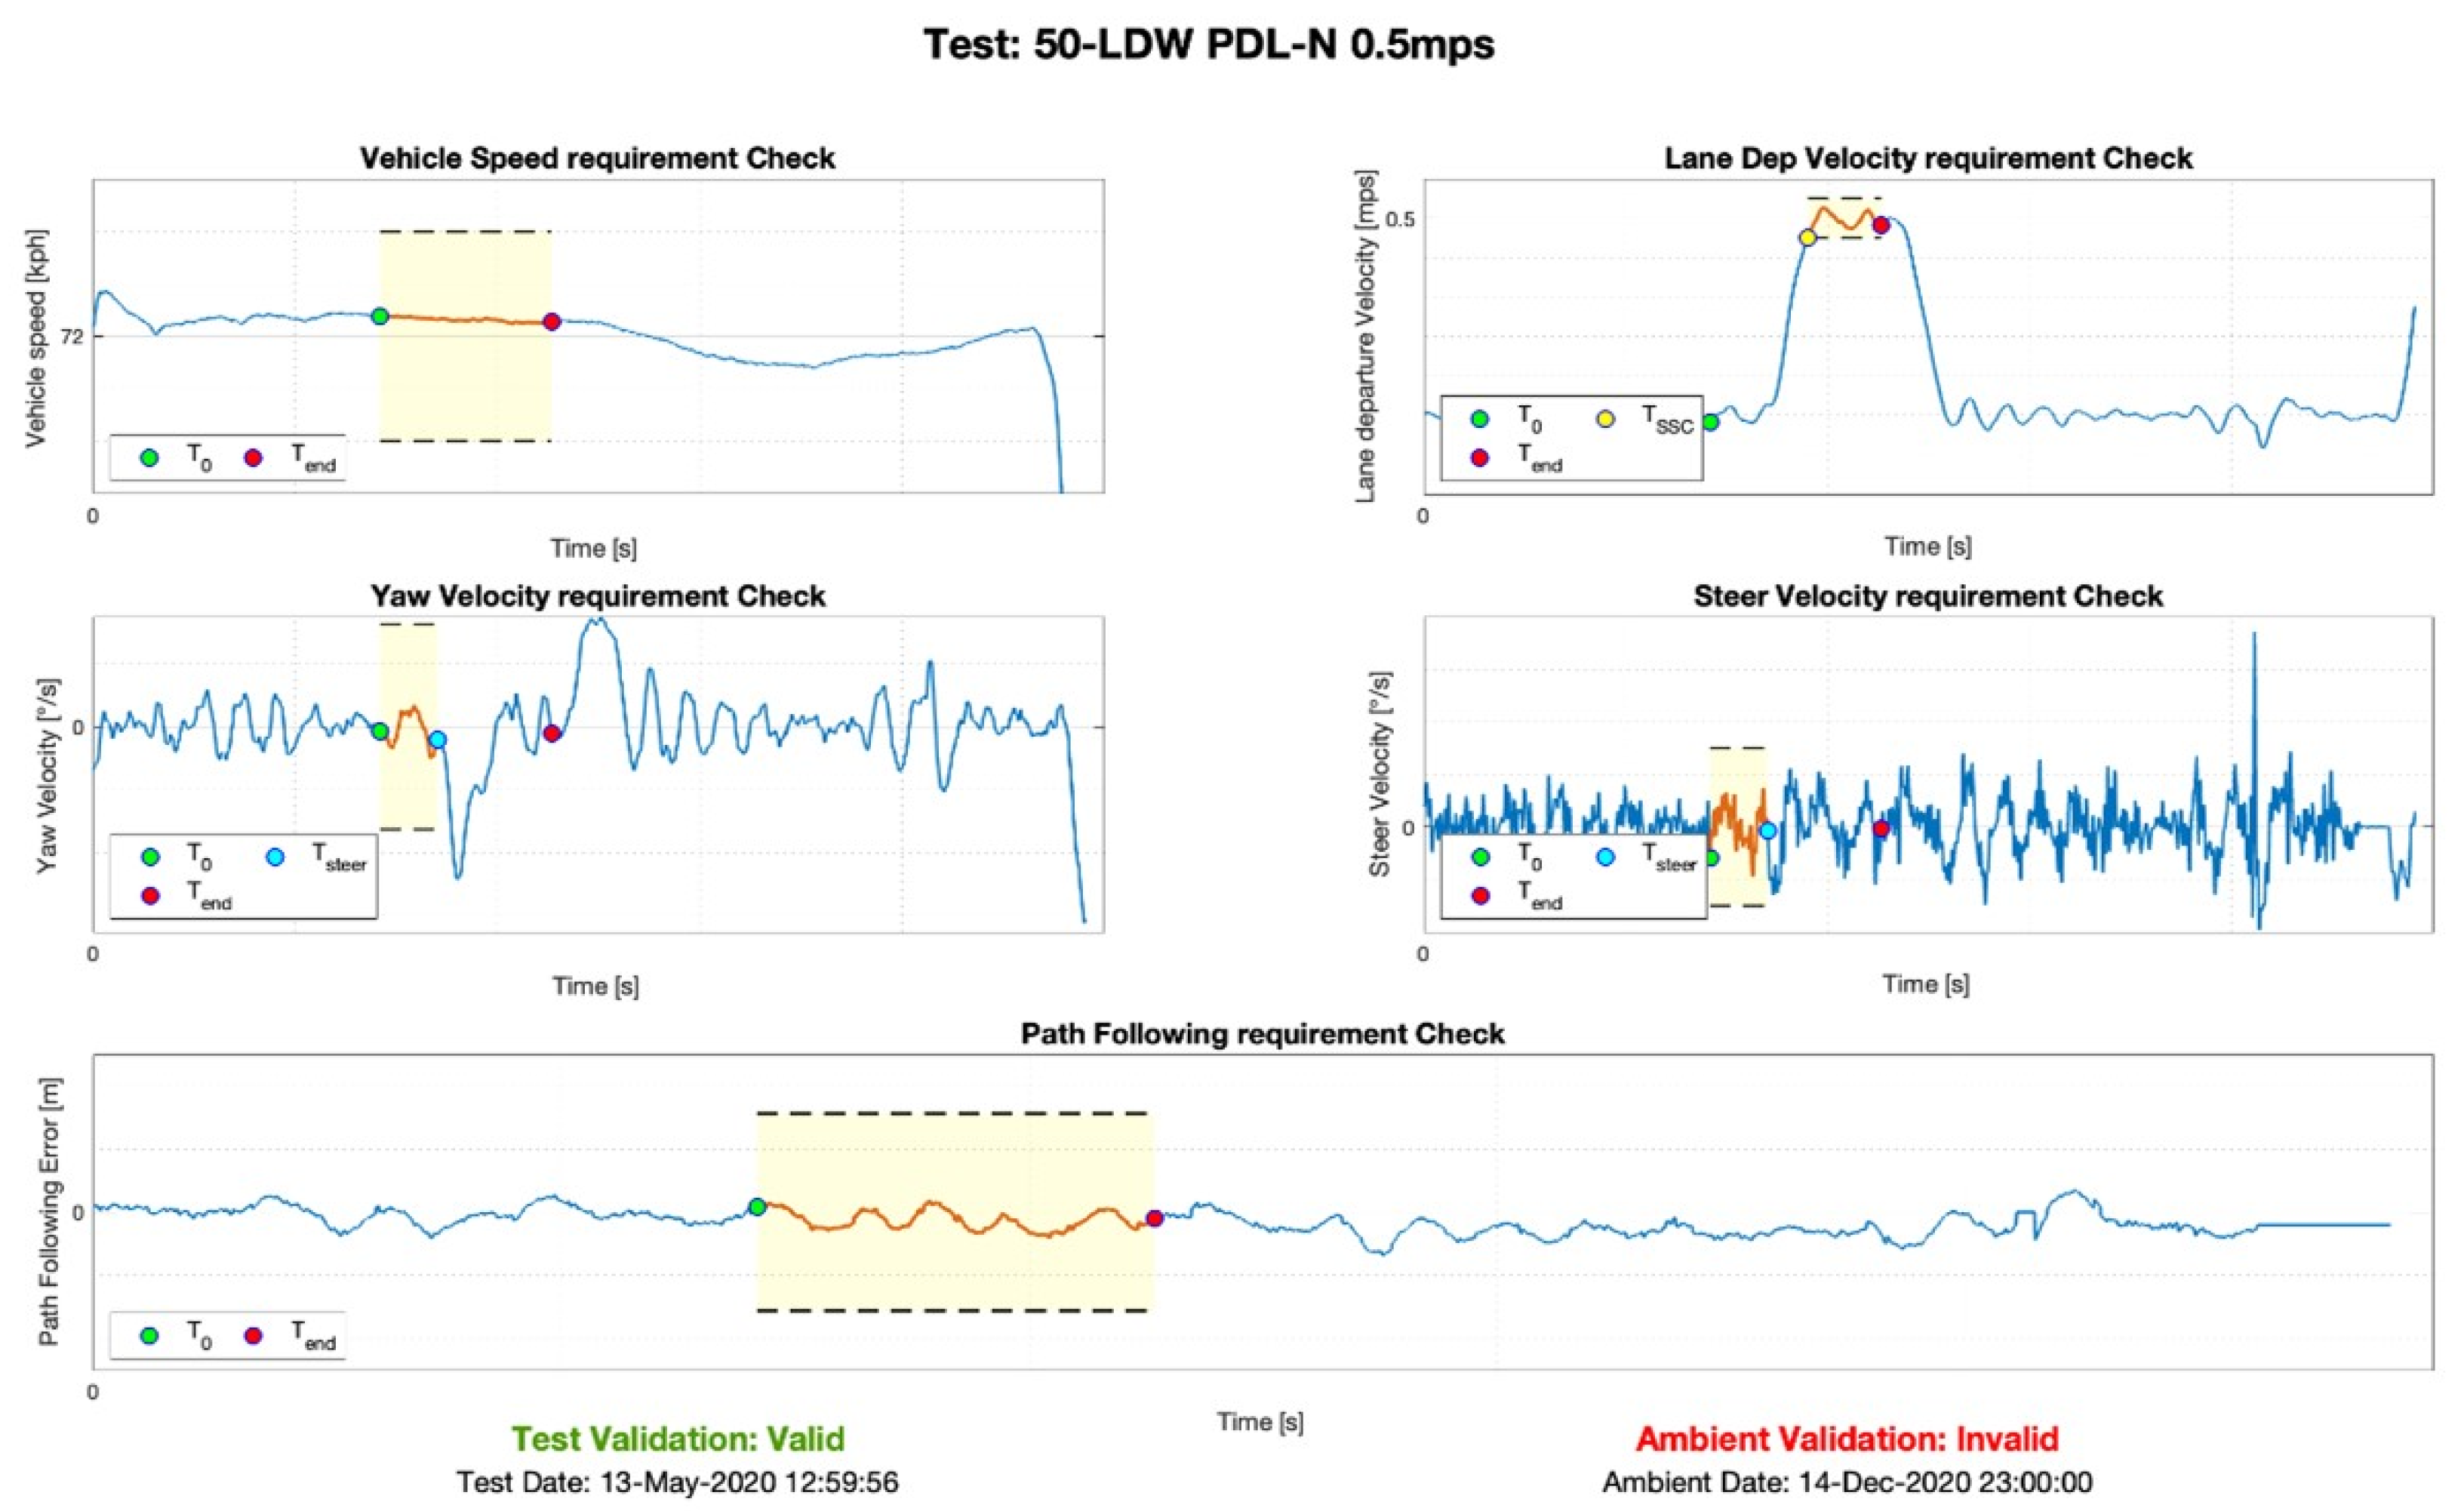
TSTEER is automatically identified when the lateral position, measured by IMU, changes from the initial values;
-
T0 is directly calculated two seconds lower than TSTEER;
-
TLDVR, valid only for the LKA and ELK tests, is defined as the instant in time in which the lane-departure velocity reaches zero after passing the stretch at a constant speed. Therefore, to identify it, the stretch with constant lateral speed was searched (identified as the range in which the lane-departure velocity is included between the test value ± 0.05 m/s) and, starting from the last value of this, the first instant in which the lateral velocity profile reaches the zero value was sought;
-
TLKA, valid only for the LKA and ELK tests, is identified as the instant in which the LKA system is activated;
-
Tend has a different value according to the test typology: for LDW, it is identified as the time when the system activates, and it corresponds to the instant when the alarm sound is heard; for LKA and ELK is calculated as 2 s after TLDVR.
The test validation is based on comparing the test variables and the limits imposed by legislation. In particular, this comparison must be made for five parameters:
  • Vehicle speed, to be analyzed between T0 and Tend, in the case of LDW system, or between T0 and TLKA, in the case of LKA or ELK system, which must be included in a range that goes from 72 − 1 km/h to 72 + 1 km/h;
  • Path-following error, to be evaluated between T0 and Tend, in the case of LDW system, or between T0 and TLKA, in the case of LKA or ELK system, which must be null or at most within a range of ±0.05 m;
  • Lane-departure velocity, to be considered between TSSC (time in which the stretch begins at constant lateral speed) and Tend, in the case of LDW system, or between TSSC and TLKA, in the case of LKA or ELK system, which must be equal to the value test ± 0.05 m/s;
  • Angular speed of yaw, to be analyzed between T0 and Tsteer, which must be equal to zero or at most within a range of ±1°/s;
  • Steering angular speed, to be evaluated between T0 and Tsteer, which must be zero or at most within a range of ±15°/s.
If all these conditions are met, the test is valid, and a score can be assigned; if not, then it is invalid.
After extracting the environmental data from the weather station, it is necessary to compare these data with the test data. In particular, it is necessary to check the following:
  • Temperature, which must be between 5 and 40 °C;
  • Wind speed, which must be less than 10 m/s;
  • Rain rate and presence of rain, which must be zero;
  • Brightness value, which must be higher than 2000 lux.
If all of these conditions are valid, it is possible to say that the test can be performed correctly; otherwise, the environmental variables could affect the system’s functionality.
Figure 18 shows the result of the post-processing proposed algorithm carried out for an LDW test in which it can be seen a highlighted area (an orange line between two dashed horizontal bars with a yellow highlighted background), which represents the section of interest in which the validation of the test was carried out. The dotted lines denote the limits that must be respected for each variable. By way of example, the result of a test that was found to be invalid is also reported. As you can see in Figure 18, it was impossible to define a time value of Tend (the LDW system did not come into operation), and, therefore, it is impossible to establish its validity.

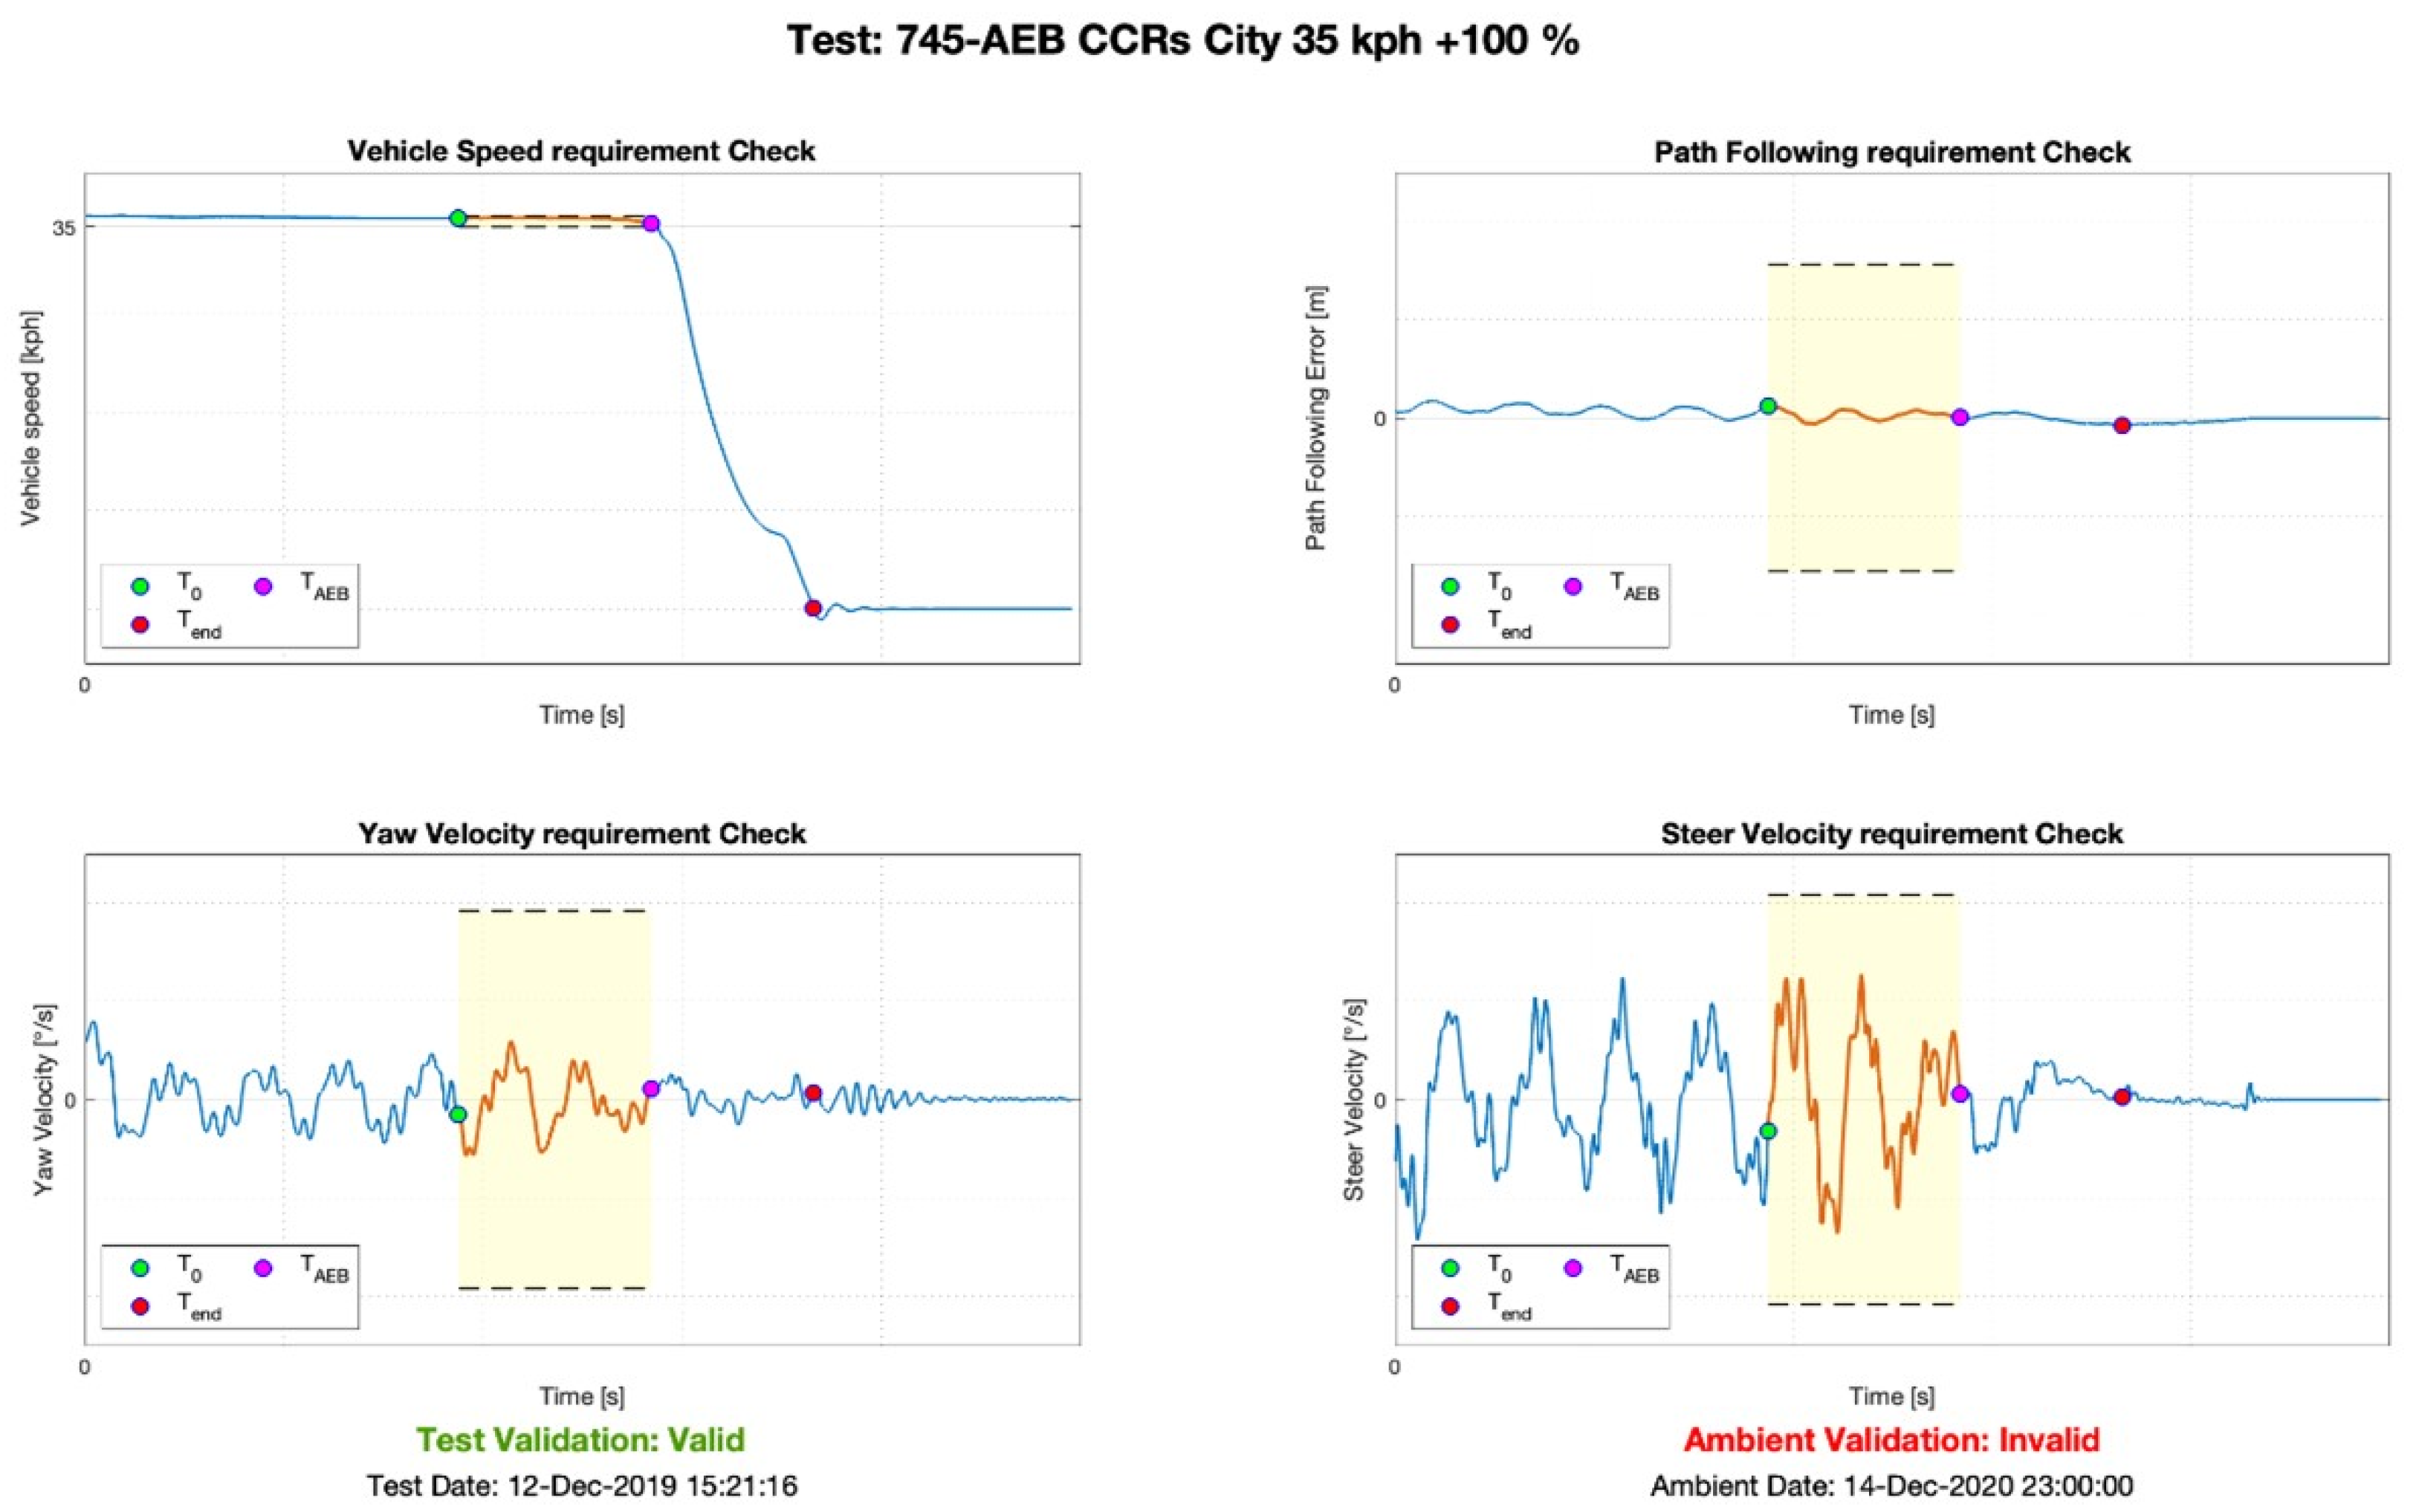
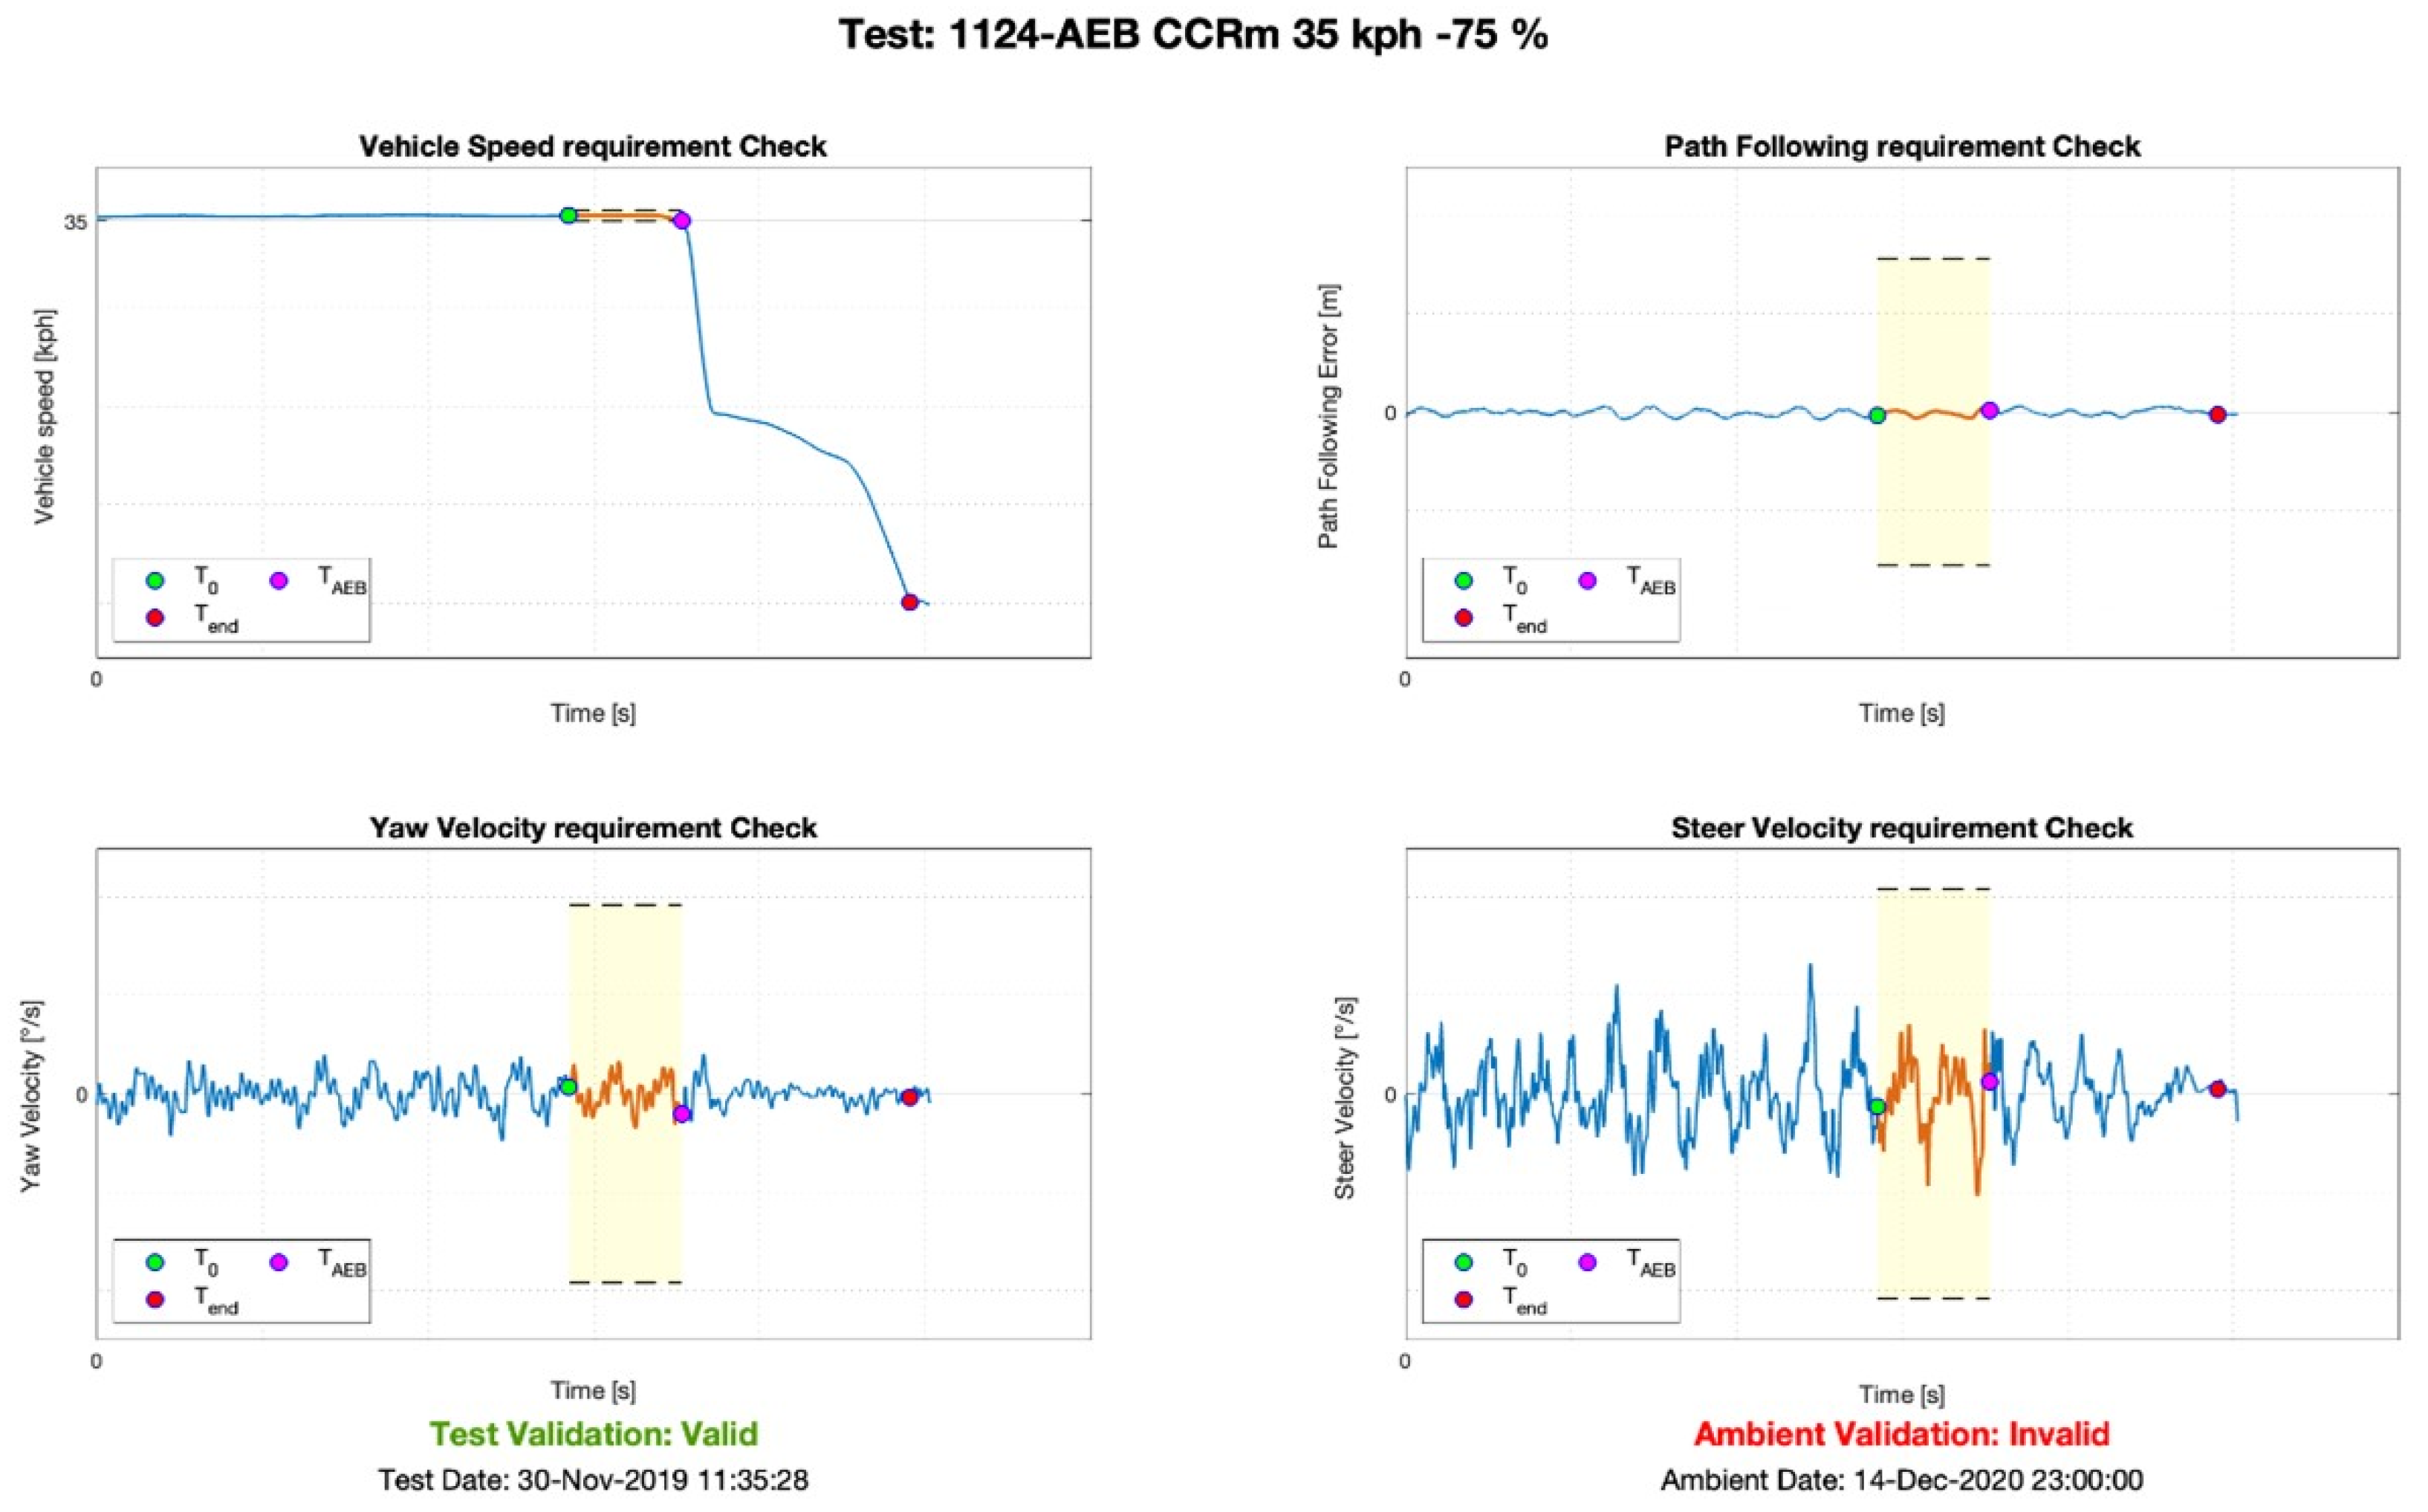
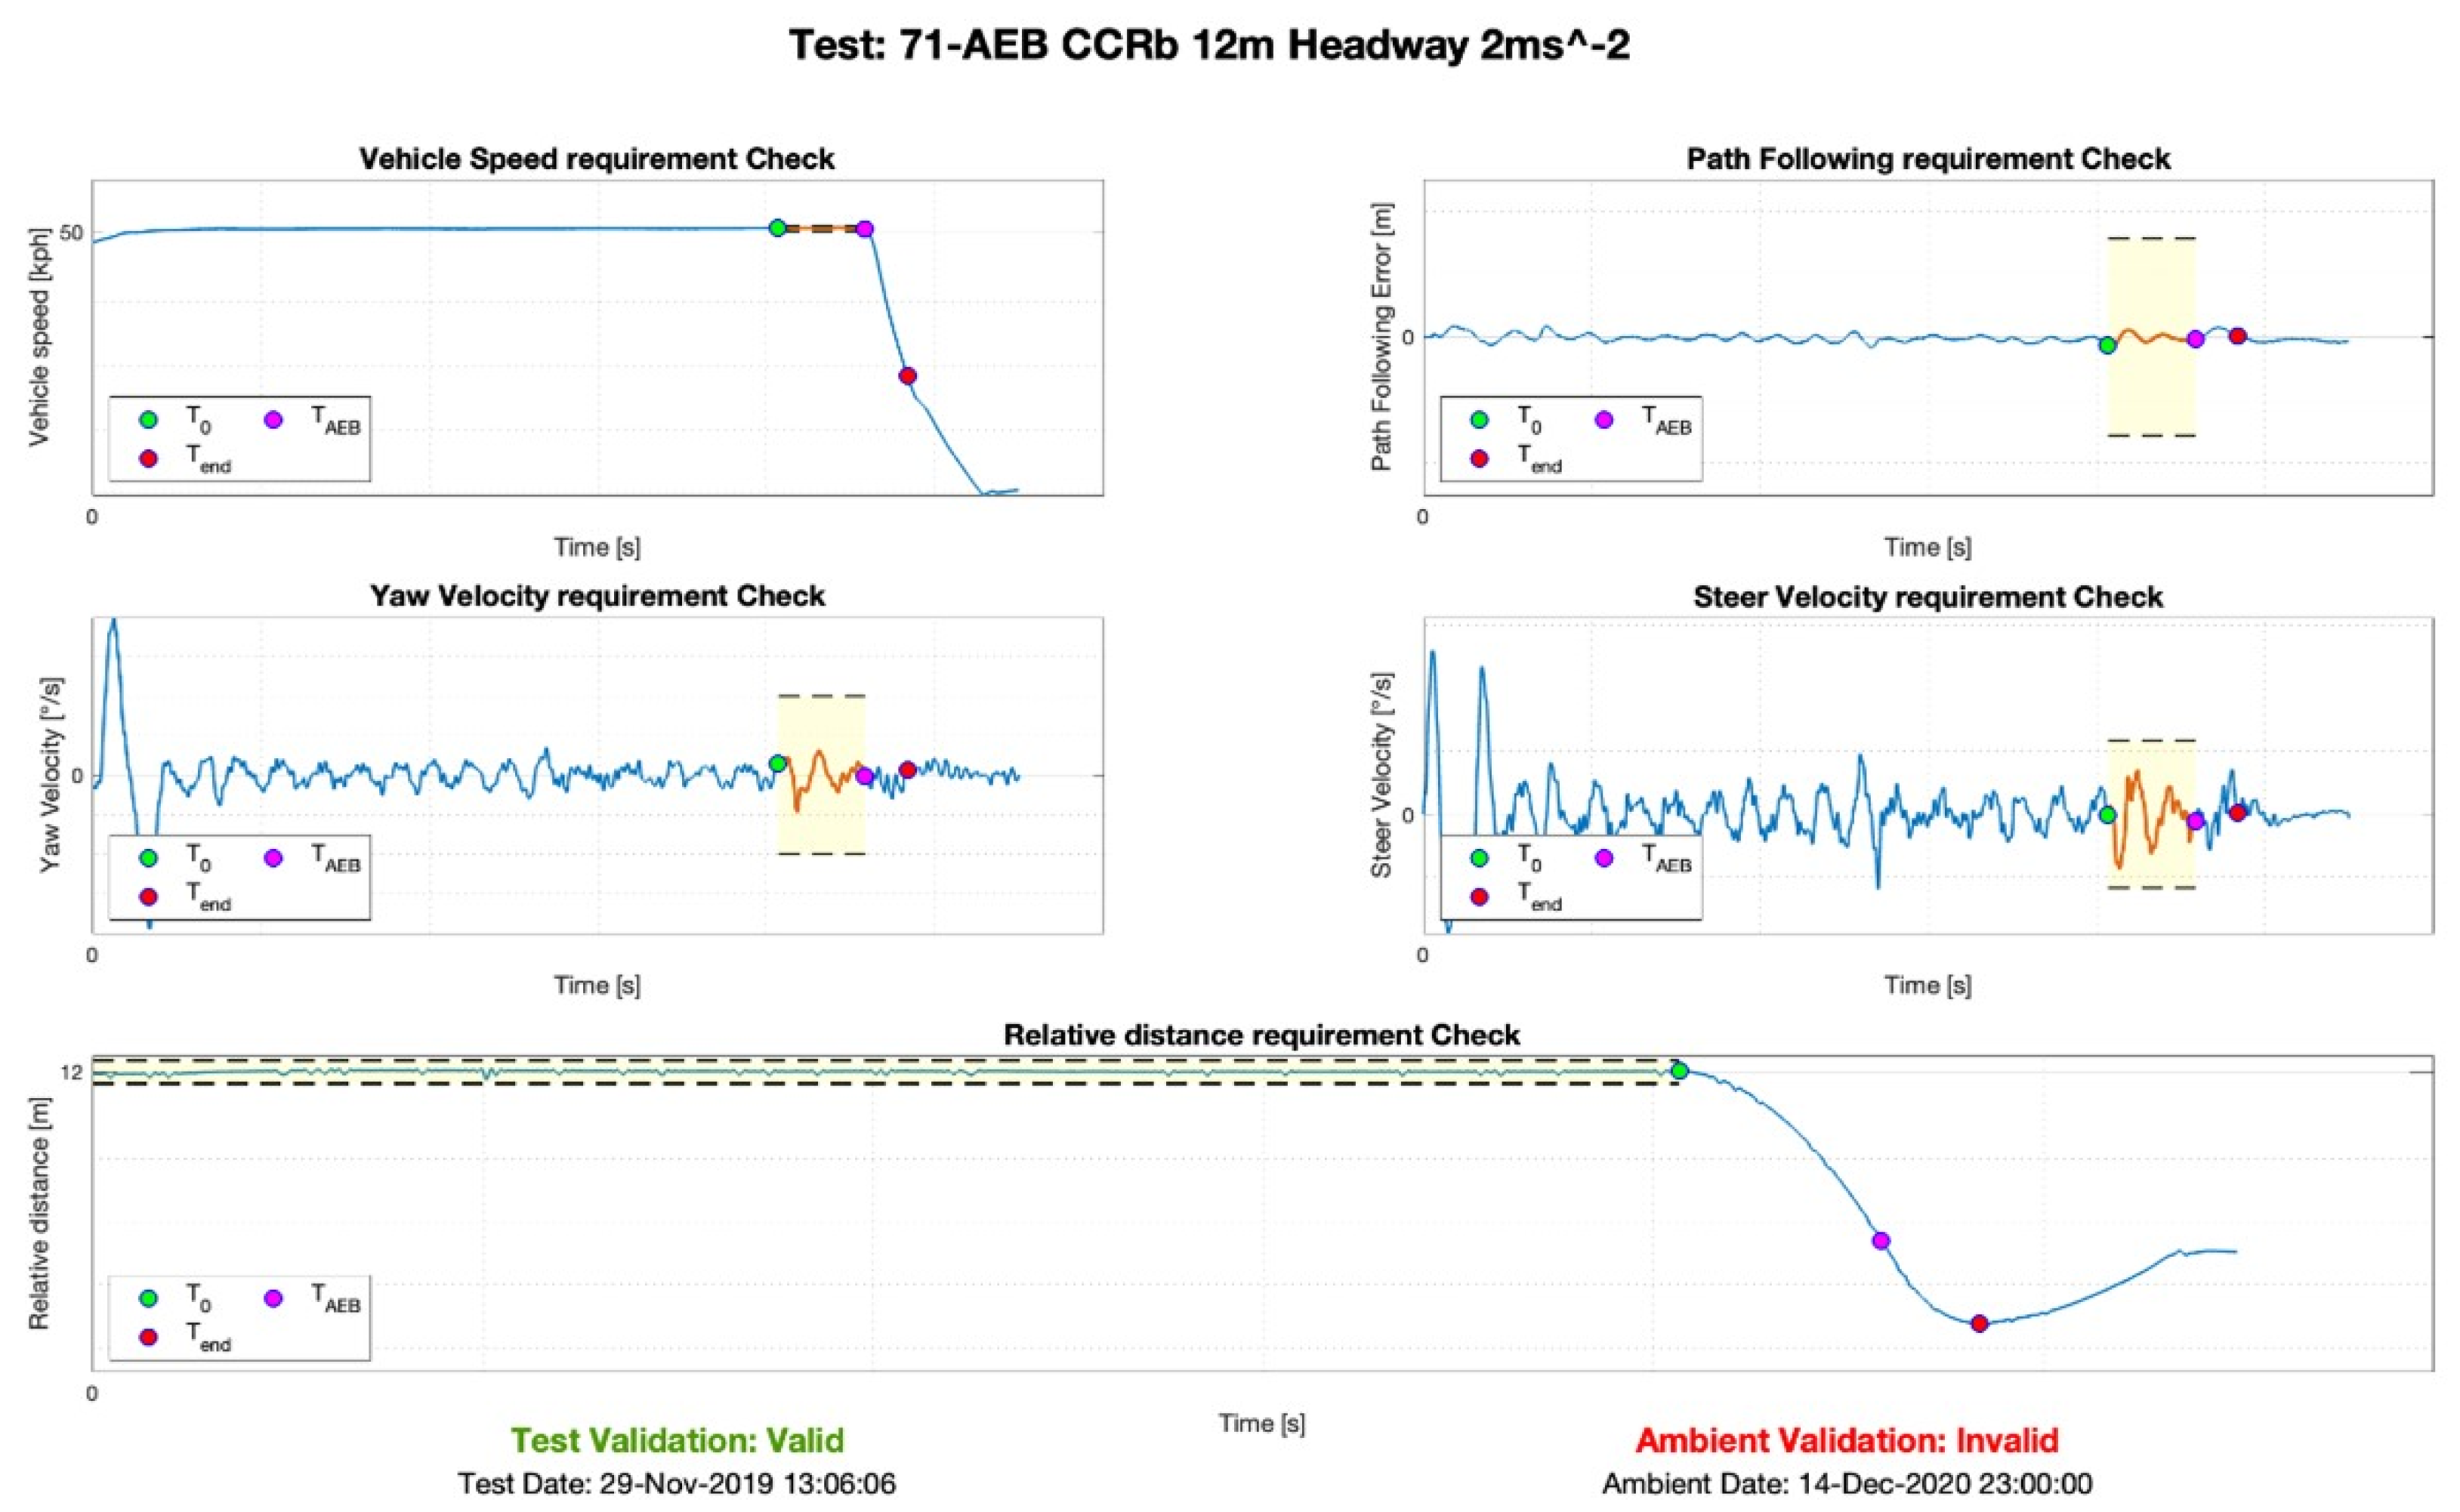
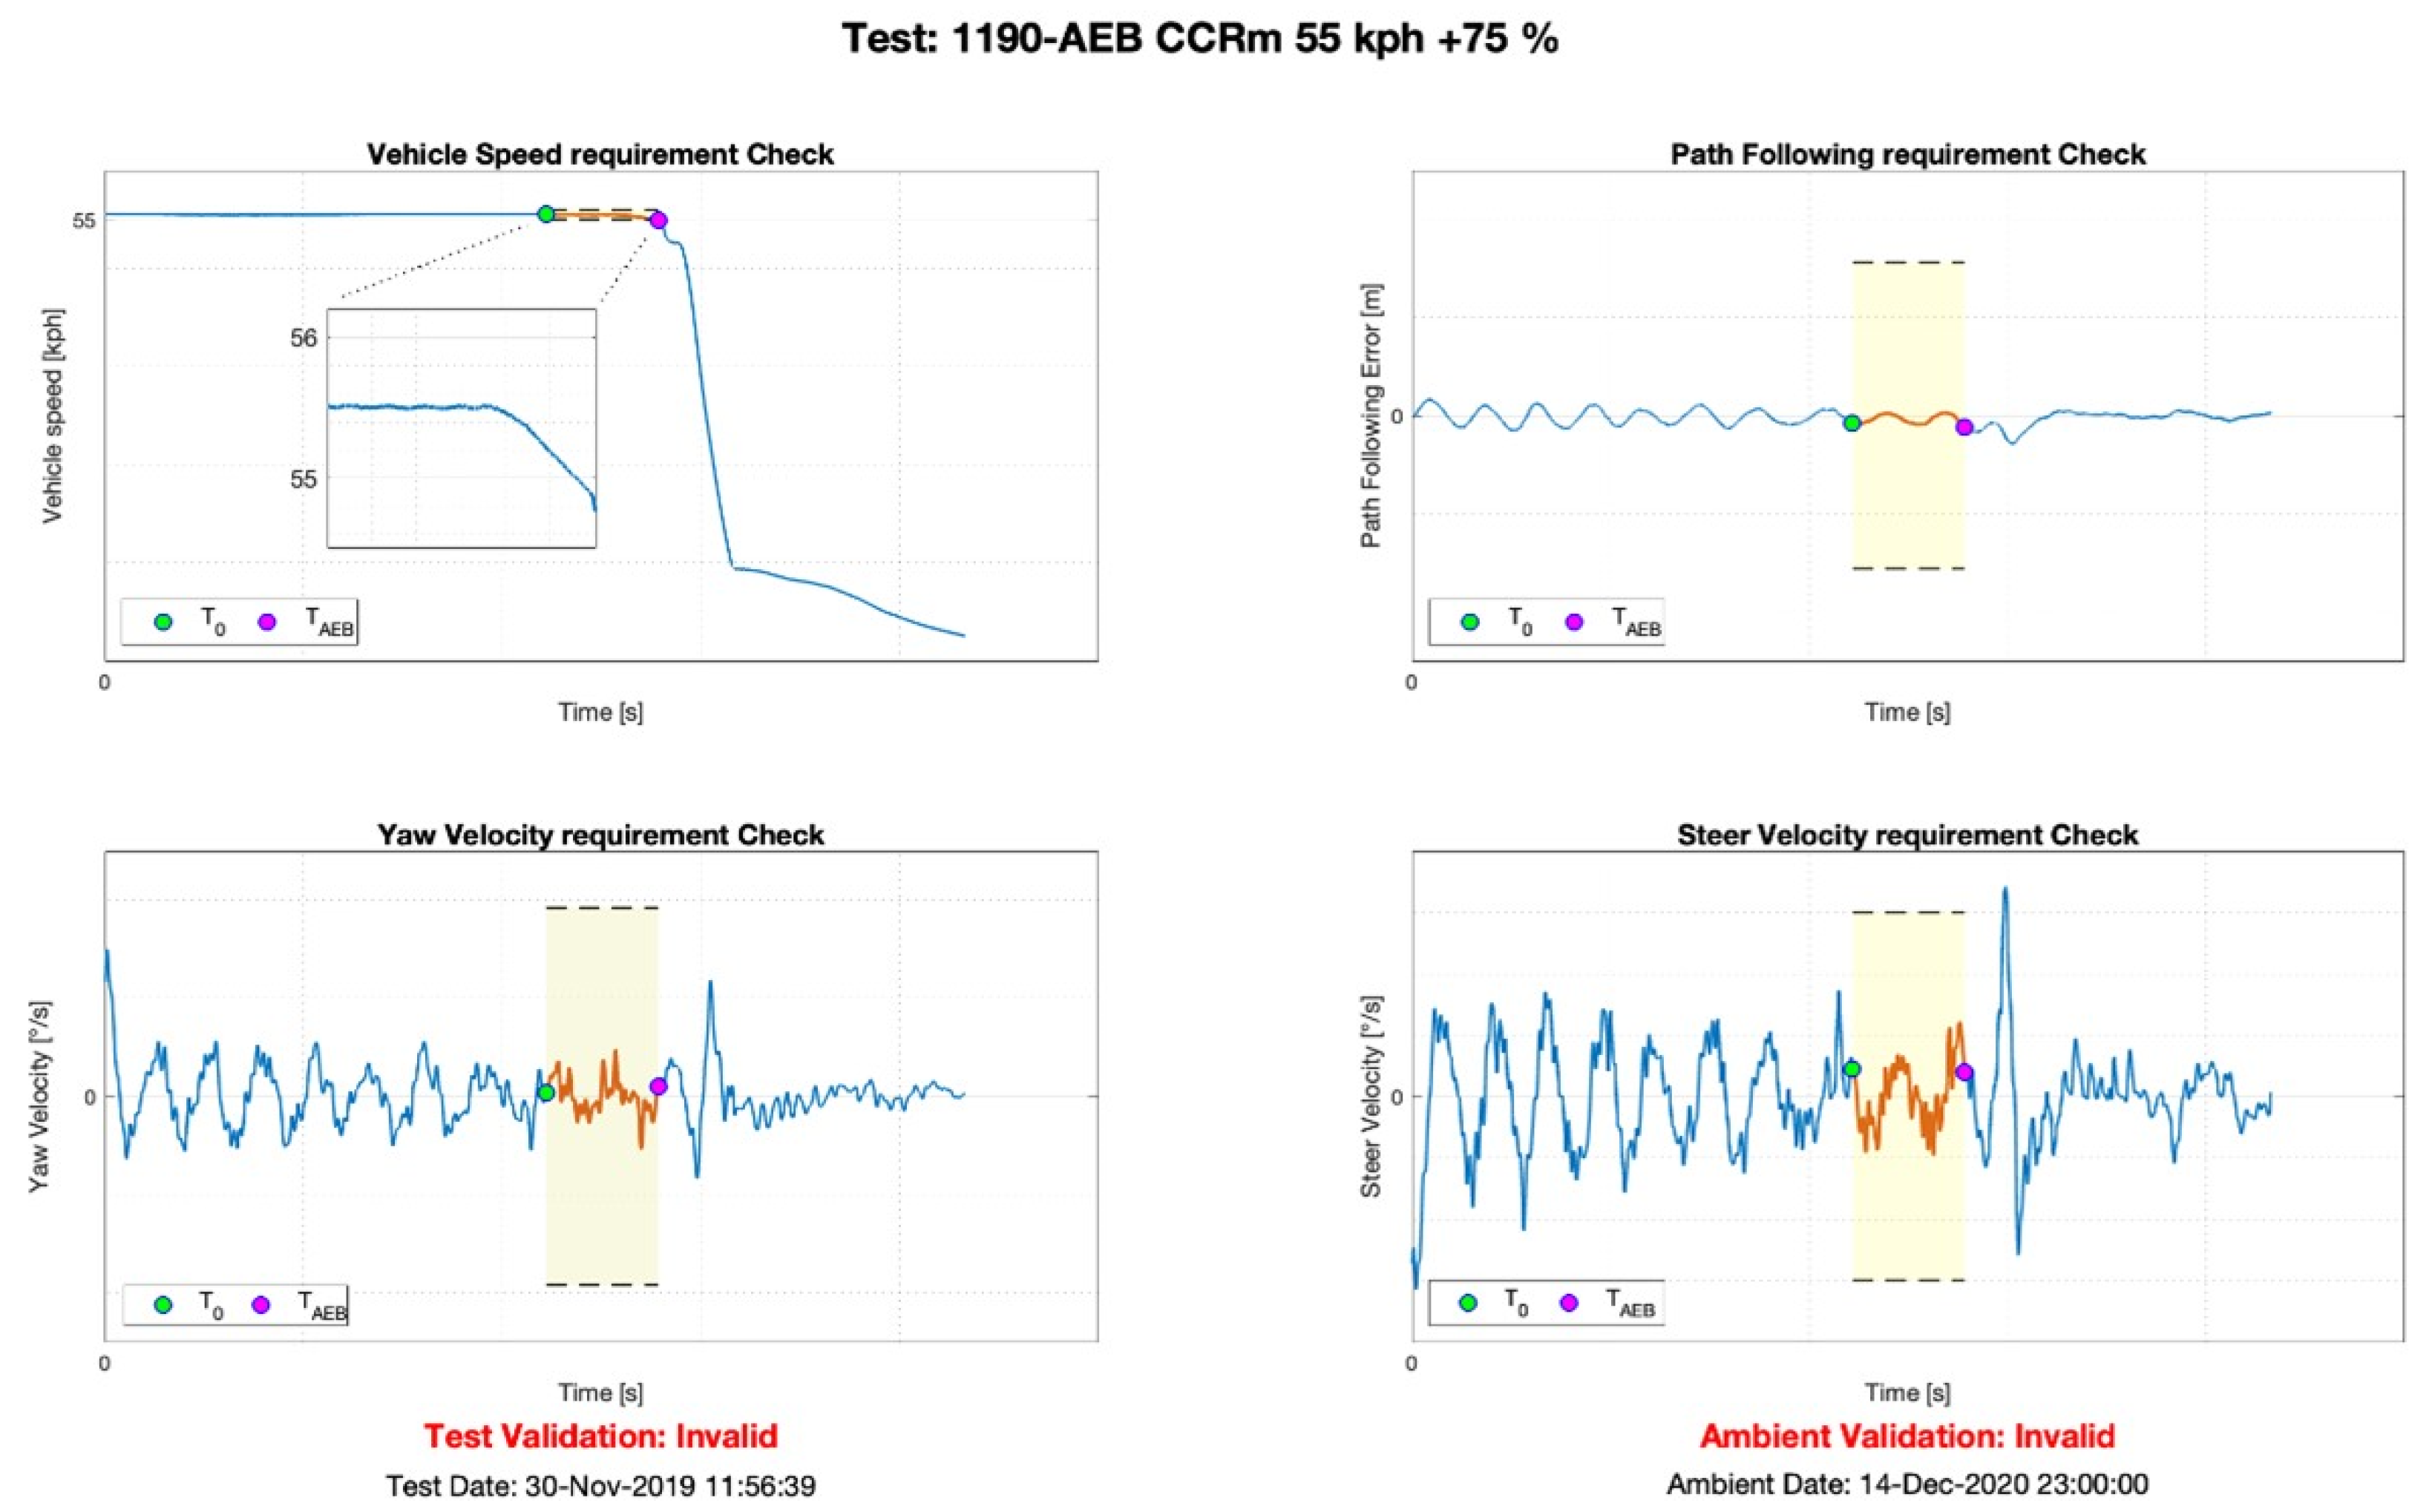
3.2. Post-Processing for AEB Tests

The code structure is similar to that already analyzed for post-processing for LSS tests. The first part of the function also opens, in this case, with a quest dialog box, in which the user is asked how to use the code, in the display of the results only or in the full version in which the post is carried out first—data processing and then the transition to the graphic representation of the same. The second part of the function is dedicated directly to the graphs: differently from the above case, there are four graphs rather than five representing the profiles of speed, path-following error, yaw angular velocity, and steering angular velocity. The configuration returns to five graphs only in the case of CCRb category tests since the relative distance profile between the vehicles is added. For the data processing, the variables are defined differently concerning the LSS tests according to Euro NCAP:
T0 represents the instant in time in which the test begins: it is evaluated as the moment in which TTC takes on a value of 4 s. The TTC is a variable exportable through the inertial system, directly calculated by the same without the need to express it analytically, as already explained:
-
TAEB is the time in which the AEB system is activated, and it can be identified, as specified by the regulations, as the instant in time in which the acceleration of the VUT intersects the value −0.3 m/s2, in the interval that goes from T0 to Tend;
-
TIMPACT corresponds to the instant in which the two vehicles involved in the test collide: in analytical form, it is identified as the temporal instant in which the relative distance between the reference points of the vehicles is zero;
-
TVZERO identifies the instant in which the speed of the VUT is canceled. The identification was made by detecting in the interval between T0 and Tend, the instant in which the speed assumes a null value;
-
Tend is the minimum between TIMPACT and the time when VUT velocity becomes zero or lower than GVT velocity.
The test is valid when all of the following conditions are met in the range from T0 to TAEB:
  • Vehicle speed, which for the CCRs and CCRm categories must respect the limits imposed by the particular type of test + 1 km/h (for example, if the test is carried out at a VUT speed of 50 km/h, the condition to respect is that the profile in the designated range is between 50 and 51 km/h);
  • Path-following error, which must be equal to the null value ± 0.05 m;
  • Angular speed of yaw, which must be equal to 0 ± 1°/s;
  • Steering angular speed must be between −15 and 15°/s.
The environmental variables to be respected are as follows:
  • Ambient temperature, between 5 and 40 °C;
  • Ambient lighting, higher than 2000 lux;
  • Wind speed, not exceeding 10 m/s;
  • Presence of precipitation, equal to 0 mm.
The graphical results of the post-processing for AEB tests are shown in Figure 19, Figure 20, Figure 21 and Figure 22. Figure 19 shows a CCRs category test, and the main elements can be highlighted as follows:
  • Highlighted area, representing the test area of interest, between T0 and TAEB;
  • Points of interest of different colors, which highlight the value assumed by each variable in the instants of time reported;
  • Text boxes show the test date and validity (bottom left) and environmental conditions (bottom right). Similarly, examples are shown below regarding tests for categories CCRm (Figure 20 and Figure 22) and CCRb (Figure 21).
The profiles are similar in the three tests because the maneuver and the system’s intervention always occur in the same way; only in the case of CCRm category tests can different trends be noted. Since both vehicles are in motion, the AEB system could intervene by slowing down the vehicle but not stopping it: this could lead, taking the speed profile as a reference, to a ‘different peak. Figure 22, by way of example, is an invalid test for the CCRm category. As you can see, it is invalid because the speed does not respect the range allowed by the regulations.

3.3. Post-Processing for CPNC Tests

The post-processing function is divided into multiple common sub-functions, allowing us to check every part of the regulation.
The function Time Test extracts the year, month, day, hour, minutes, and seconds of the moment the test started.
The function Resampling is related to the signals received by the other target, the SPT: the data are collected into the VUT, and the transferring is affected by a delay called the incoming-data extrapolation time. The following correction processing is implemented:
-
Computation of time error (wireless data-transfer time delay from target to subject unit) as expressed in (13), where incoming-data-extrapolation time is the time of each received sampled signal:
time error = time-incoming data extrapolation time
-
Resampling signals in the new time series using the computed time error.
The filter type used for the data post-processing is a 12-pole phase-less low-pass Butterworth filter with a cutoff frequency of 10 Hz. The signals are requested to be filtered for the actors’ accelerations and yaw rate.
The function T0 evaluates the starting time defined as the time when TTC is at least 4 s, while the function TFCW calculates both the time samples of the activation of the FCW audio signal and video signal. The AVAD3 system acquires these signals from DTC GmbH Navigation & Security Solutions, an audio/visual detector for warnings and messages. This system is configured to detect audio and visual warnings and sends external triggering signals to the Robot Controller on CAN messages. The delay due to the AVAD3 is measured, and the processing tool uses this time delay to take the correct warning time by stepping back the algorithm. The audio delay is evaluated by comparing the CAN signal with the audio wave signal captured by the microphone. The video delay is evaluated by comparing the CAN signal with the video acquisition. This function is implemented as described above:
-
Evaluation of step-back samples for audio and video signals (14):
s a m p l e s t e p   b a c k = d e l a y f s
where fs is the sampling frequency and delay is the measured delay time in seconds.
-
Evaluation of FCW video trigger sample, finding the first value different from 0.
-
Evaluation of FCW audio trigger sample, finding the first value different from 0. This is completed by cleaning the signal from false positives obtained from noises during the test execution.
The function TAEB evaluates the AEB trigger sample defined as the time value in which, for the last time, the forward deceleration assumes a value of 0.5 m/s2 before it reaches, for the first time, the value 5 m/s2. Hence, the trigger signal is defined (15) as follows:
A E B t r i g g e r = { 0             T < T A E B , a c t i v e 1         T T A E B , a c t i v e
The function test end time, TEnd, is evaluated with the following general conditions:
-
VUT velocity is 0 km/h;
-
VUT velocity is less than the other actor velocity;
-
VUT collides with the other actor.
If one of these is matched, the corresponding time sample can be identified as TEnd. If more than one of these conditions is matched, the first one that occurred temporally is the TEnd.
The function test validation check matches the test validation conditions by analyzing the signals relating to validation boundaries. The result of the analysis resumes the validation of the test: if all conditions are matched, the test is “Passed”, with a green flag; if one or more conditions are not matched, the test is “Passed”, with a green flag; if there is a collision between the actors during the test execution, the test is “Failed”, with a red flag.
The function weather conditions validation checks the weather conditions defined by the regulations; in particular, the weather conditions are collected by a weather station on track. The processing implements dedicated queries and store the values for the checking algorithm.
The last function of post-processing is the plotting function. The signals plotted are the same one that are analyzed in the test-validation-check phase and defined for each test.
In Figure 23, the trigger signals are plotted over the time signal. The markers also identify the value of the signals in the specific time sample, as previously described.
In Figure 24, the signal plotted is the TTC for a test UNECE R152 CPNC. For this type of test in which the actors move in a perpendicular line, the TTC is calculated by the general Equation (16), which is obtained by adapting Equation (1) to the CPNC scenario:
T T C = x S V x S P T v x , S V v x , S P T
In (16), vx,SPT is always 0 km/h because the target moves in the Y direction (reference system in Figure 1). The equation is specialized in different cases depending on the actors’ positioning during the test. When the silhouette of the SPT is not in the projection of the frontal silhouette of the VUT, the TTC assumes a value equal to +∞. Still, when the silhouettes are in the same area, the TTC should be evaluated between the two points at the minimum distance.
Figure 25 plots the velocity of the subject vehicle (SV). It is a UNECE R152 CPNC test with a VUT nominal speed of 45 km/h. As can be seen, the validation limits are satisfied because the speed remains inside the gray area that is the check range: the time samples of the validation are T0 when the TTC assumes value 4 s, and TFCW; the minimum between audio and video triggers activation.
The result of the plots is a PDF report that includes the test check as “Passed” or “Failed”, the representation of all signals, and the check of weather conditions.

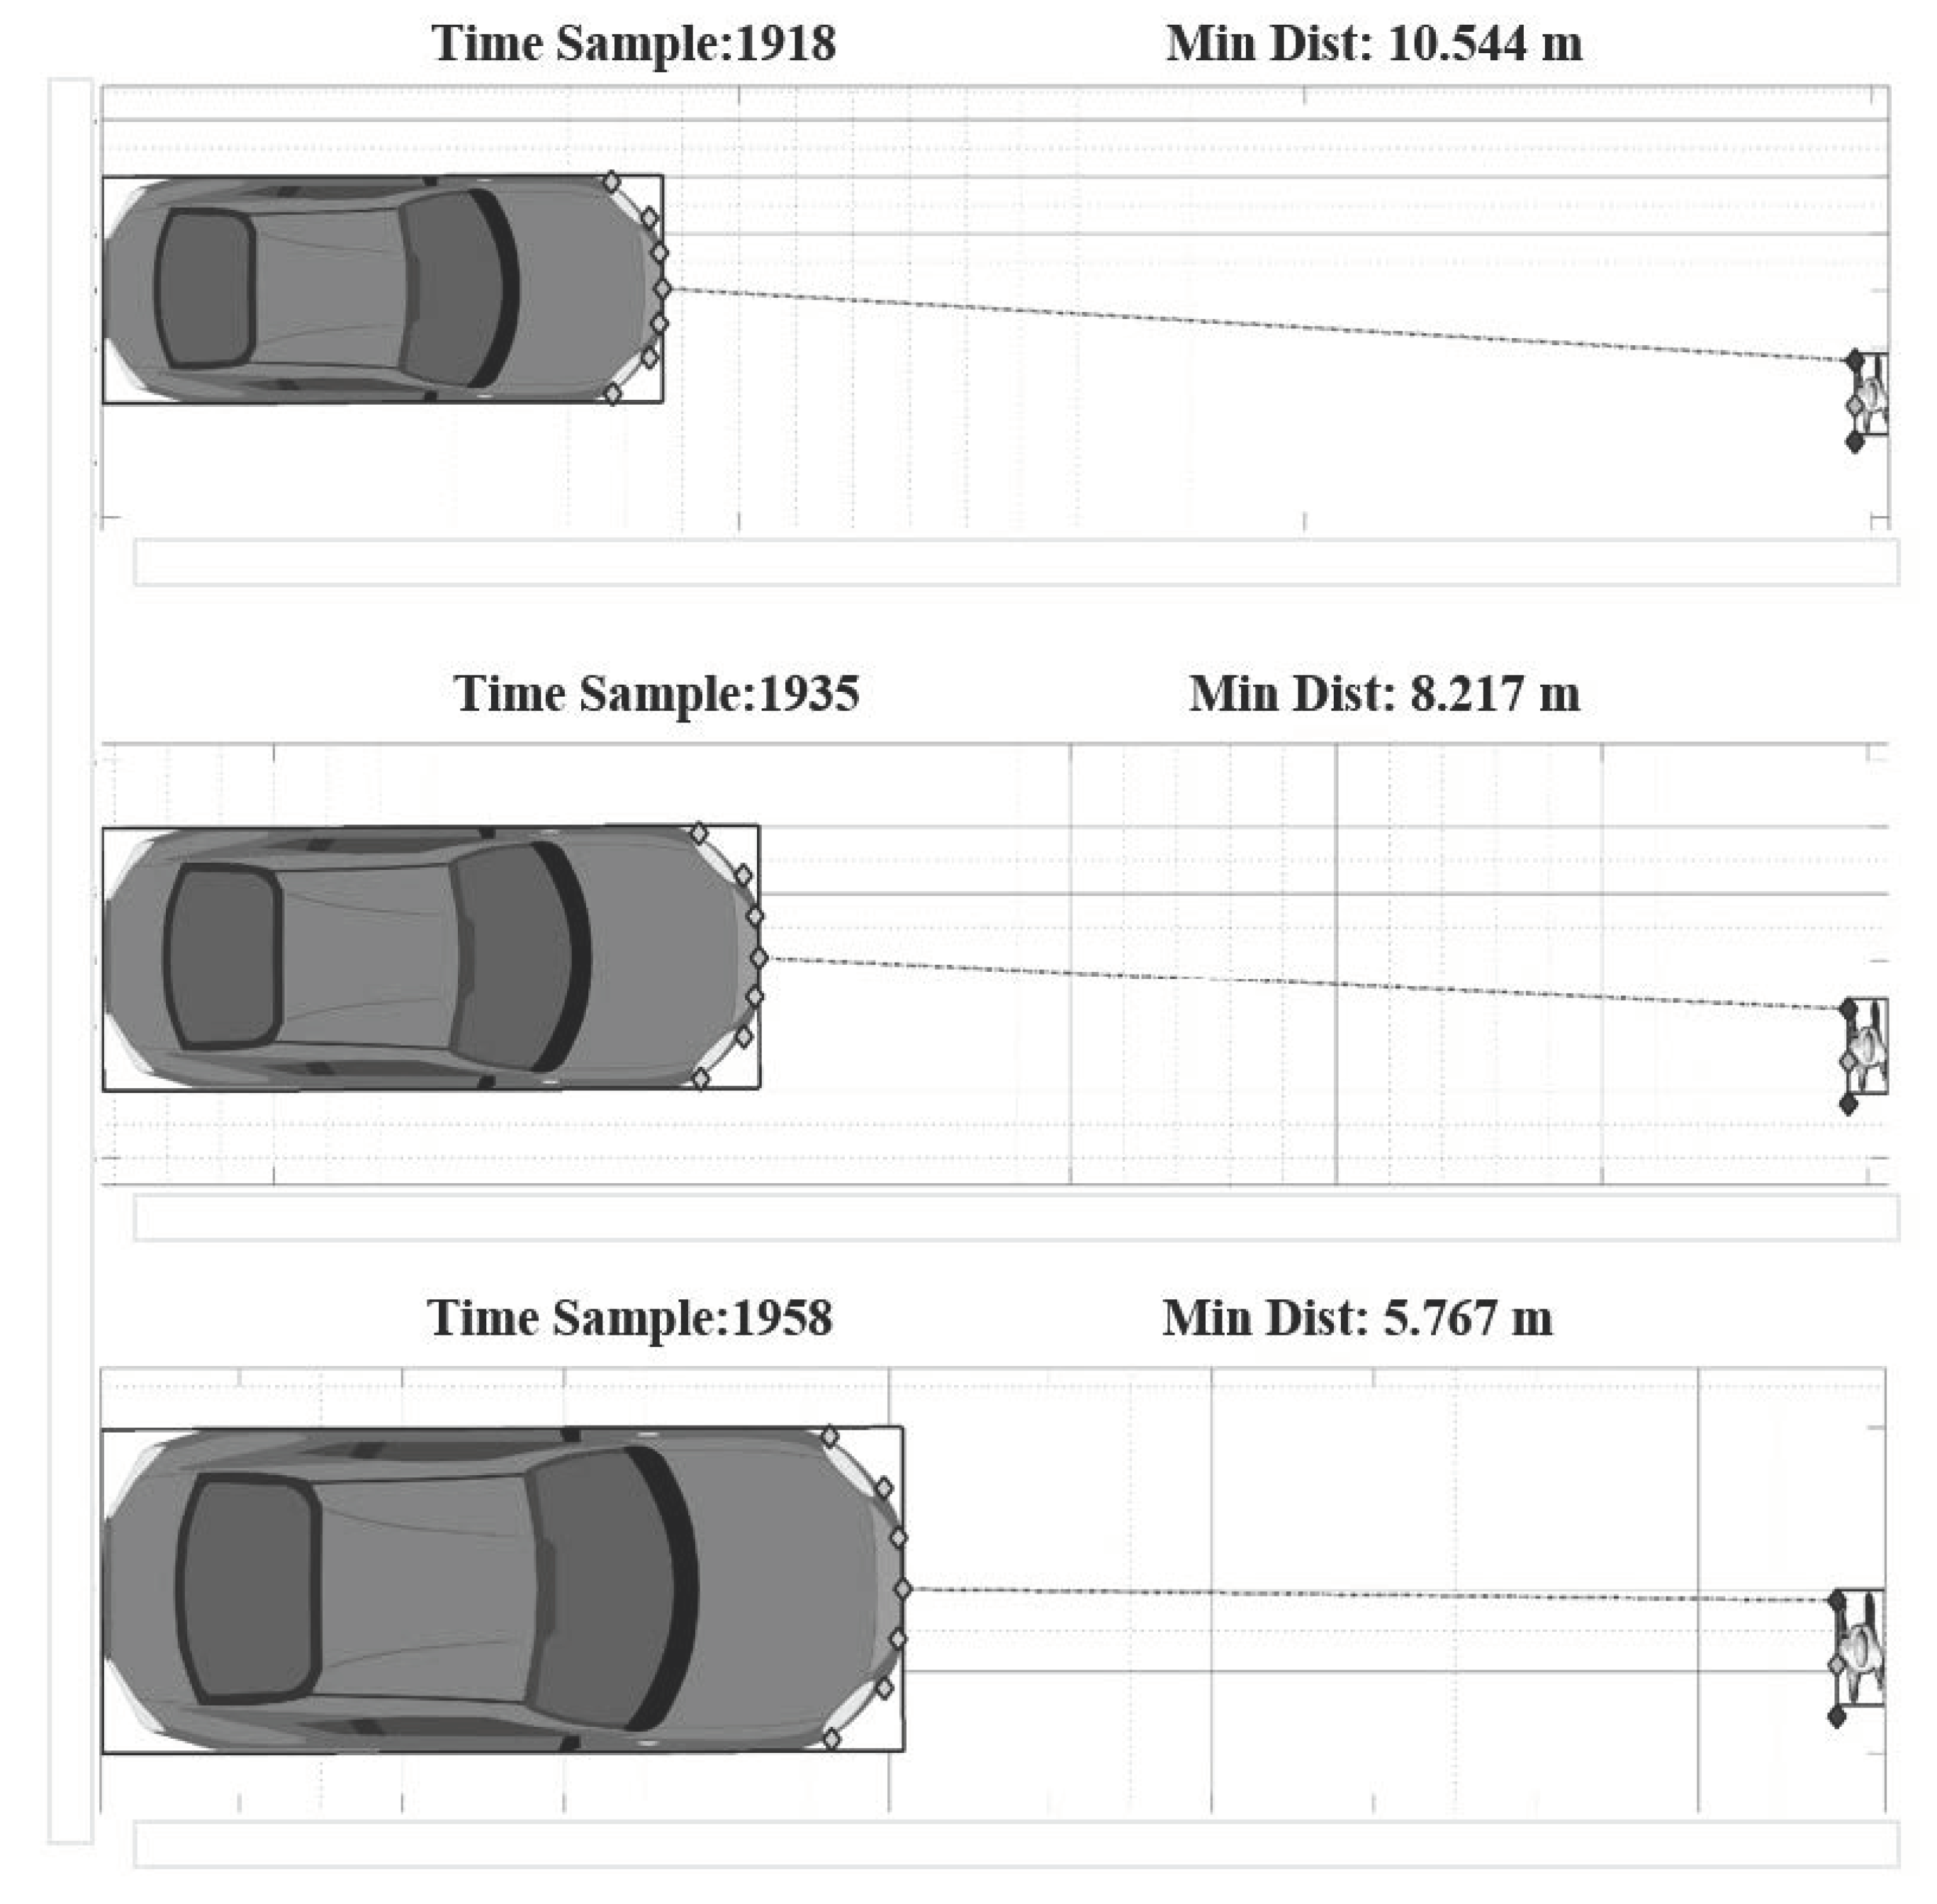
3.4. Visualization of the Maneuver: Test Replay Tool

Visualizing the maneuver involves an updating plot representing the vehicle’s positioning and the minimum distance in a time step [23]: the “for” loop refreshes the plot from the initial sample to the ending one, as previously selected by the user (see Figure 26).
After the simulation, the exports are a file “Simulation.mat” in MATLAB environments [11] and a PDF report with the picture of the disposition of the actors at the minimum distance time sample. In Figure 27, as can be seen, the report includes three different plots:
-
Actors positioning and minimum distance representation;
-
Minimum distance versus time sample graph;
-
Relative longitudinal and lateral distances versus time sample graph.
The result generated automatically by the proposed tool (Figure 27) allows us to obtain all the information of interest relating to the operation of the safety systems in the analyzed case; in particular, the TTC of 1.2 s makes it possible to manage the situation with awareness from an autonomous-driving point of view

4. Discussion

The proposed algorithms included in a complete tool were designed to improve the ability to generate test maneuvers for Advanced Driver Assistance Systems (ADASs) and to automate the collection and analysis of data relating to tests for LSSs and AEB systems in compliance with Euro NCAP LSS 3.0.2 [8], Euro NCAP AEB C2C 3.0.2 [9], and UNECE CPNC [10].
The main purposes for which the algorithms were created are as follows:
  • Need to improve the process of generating maneuvers for ADASs (data-analysis tool), ensuring a correct display of the distances between vehicles and the times in which the maneuvers occur.
  • Need to improve the post-processing process of normalized tests for ADASs (post-processing routines), in particular for LSS, AEB, and CPNC, allowing the introduction of additional information compared to software currently used in the company relating to the validation of environmental conditions and to variables that were not considered by the same.
  • Need to generate an algorithm for automatically writing results on a specific spreadsheet to provide the customer with a complete test report.
The problems were addressed by dividing the case series into various sub-problems and addressing each in sequence, identifying various functions that reflect each solution. In particular, a flowchart was drawn up for the two post-processing routines, allowing you to view the macro-areas of intervention of the routine.
The final result is the algorithms that address two different aspects of the testing process of a vehicle: the first deals with the phase that precedes the actual track test, going to elaborate an easy method of generation, visualization of action, and possible modification of the paths to be provided to the steering robots and of the accelerator and brake actuators; the second concerns the phase following the actual test, i.e., the collection and processing of data. As output, the tool provides a graphic display of the maneuver, which represents the arrangement of the vehicles, frame by frame, according to the sampling frequency of the data, and allows us to read the data relating to the relative distances between the vehicles under testing. The two post-processing routines, on the other hand, have a dual output, one of the graphic type and a final report of the numerical type; therefore, in the exported figure, the profiles of the variables necessary for the validation of the test are identified, as well as information relating to the type of test displayed, on the date of the test and of the database used for the validation of the environmental conditions and the validation of both the test and the environmental conditions themselves [23].

5. Conclusions

The proposed tool’s main advantage is checking whether maneuvers are from simulated or real data. For simulated data, it allows a check if the set maneuvers comply with the regulations; for real data, it allows a quick check to be carried out on the vehicle even before performing a subsequent run [23]. Furthermore, the automatic generation of the report is an improvement for data cataloguing and report creation at the end of the test and allows you to save time linked to the traditional sequence of phases (design of the maneuver and its import into robots/runway tests/verification of the validity of the maneuver during the test/modifications/return to the runway and so on), until the correct result is reached for which it can be carried out the test, bypassing the central and more expensive phase linked to the calibration tests of the maneuver and performing them through simulation; on the other hand, for the post-processing routines, the savings are linked to the fact of not having to analyze every single run manually, having the possibility of carrying out a single operation for the entire test session relating to the same category of systems and to create a single easy-to-consult report.
Among the future developments of this work, we can identify the following:
  • The implementation of the post-processing routine in the VeDApost environment (Vehicle Dynamics Analysis Postprocessing), an internal software owned by Porsche created in collaboration with Porsche Motorsport and with the entire Volkswagen group, which works in the MATLAB environment and us allows to import, archive, and analyze the data relating to each type of measurement carried out on the track.
  • A 3D-type visualization of the maneuver was introduced in the MATLAB environment by importing the obtained data into a MATLAB tool called Driving Scenario Designer [24]; about this point, some interesting preliminary results have already been carried out.
To conclude, it should be noted that the proposed tool does not in any way replace the work of the engineer, who will decide which tests are suitable to be validated and which are not, but provides help in terms of time, reducing the amount of work. The goal is to speed up the whole process.

Author Contributions

Conceptualization, M.D. and V.D.; methodology, V.D.; software, M.D.; validation, M.D. and D.P.; formal analysis, V.D.; investigation, M.D.; resources, D.P.; data curation, D.P.; writing—original draft preparation, M.D. and N.I.G.; writing—review and editing, N.I.G.; visualization, M.D.; supervision, N.I.G. and D.P. All authors have read and agreed to the published version of the manuscript.

Funding

This research received no external funding.

Conflicts of Interest

The authors declare no conflict of interest.

References

  1. Road Safety: What Progress Has Been Made? Available online: https://roadsafetyfacts.eu/road-safety-what-progress-has-been-made (accessed on 27 June 2022).
  2. Cafiso, S.; Pappalardo, G. Safety effectiveness and performance of lane support systems for driving assistance and automation—Experimental test and logistic regression for rare events. Accid. Anal. Prev. 2020, 148, N.105791. [Google Scholar] [CrossRef] [PubMed]
  3. Sternlund, S.; Strandroth, J.; Rizzi, M.; Lie, A.; Tingvall, C. The effectiveness of lane departure warning systems—A reduction in real world passenger car injury crashes. Traffic Inj. Prev. 2017, 18, 225–229. [Google Scholar] [CrossRef] [PubMed]
  4. Branstom, M.; Coelingh, E.; Sjoberg, L. Decision-making on when to brake and when to steer to avoid a collision. Int. J. Veh. Saf. 2014, 7, 87–106. [Google Scholar] [CrossRef]
  5. Eidehall, A.; Pohl, J.; Gustafsson, F.; Ekmark, J. Towards autonomous collision avoidance by steering. IEEE Trans. Intell. Transp. Syst. 2007, 8, 84–94. [Google Scholar] [CrossRef]
  6. Chelbi, N.A.; Gingras, D.; Sauvanage, C. Proposal of a new virtual evaluation approach of preventive safety applications and advanced driver assistance functions–application: AEB system. IET Intell. Transp. Syst. 2018, 12, 1148–1156. [Google Scholar] [CrossRef]
  7. Lomartire, S.; Giannoccaro, N.I.; Toma, A. A smart procedure for data analysis relative to a vehicle ‘Coast-down’ test. Int. J. Veh. Syst. Model. Test. 2021, 15, 122–140. [Google Scholar] [CrossRef]
  8. Test Protocol—Lane Support Systems, version 3.0.2; European New Car Assessment Programme; REV 07/2019; Euro NCAP: Leuven, Belgium, 2019.
  9. Test Protocol—AEB Car-to-Car Systems, version 3.0.2; European New Car Assessment Programme; REV 07/2019; Euro NCAP: Leuven, Belgium, 2019.
  10. United Nations Economic Commission for Europe (United Nations Economic and Social Council). UN Regulation No 152. Off. J. Eur. Union 2020, L 360, 66–89. [Google Scholar]
  11. The Matworks. Matlab, R2020b; The MathWorks Inc.: Natick, MA, USA, 2020. [Google Scholar]
  12. Assessment Protocol—Safety Assist, version 9.0.1; European New Car Assessment Programme; REV 02/2019; Euro NCAP: Leuven, Belgium, 2019.
  13. GB/T 39901-2021; Performance Requirements and Tests Methods for Advanced Emergency Braking System (AEBS) of Passenger Cars. National Standard of the People’s Republic of China: Beijing, China, 2009.
  14. Department of Transportation; National Highway Traffic Safety Administration Docket. Visual-Manual NHTSA Driver Distraction Guidelines for In-Vehicle Electronic Devices; Department of Transportation; National Highway Traffic Safety Administration Docket: Washington, DC, USA, 2013; N° NHTSA-2010-0053. [Google Scholar]
  15. Shimakage, M.; Kawazoe, H.; Sadano, O.; Murakami, T. Design of Lane-Keeping Control with Steering Torque Input for a Lane Keeping Support System. SAE Trans. J. Passeng. Car Mech. Syst. J. 2001, 110, 448–455. [Google Scholar]
  16. Comolli, F.; Gobbi, M.; Mastinu, G. Study on the Driver/Steering wheel interaction in emergency situations. Appl. Sci. 2020, 10, 7055. [Google Scholar] [CrossRef]
  17. Mukhopadhyay, P.; Chaudhuri, B.B. A survey Hough Transform. Pattern Recognit. 2015, 48, 993–1010. [Google Scholar] [CrossRef]
  18. Abaya, K.A. Investigating the nature and impact of reporting bias in road crash data. Transp. Res. Part A Policy Pract. 2015, 71, 31–45. [Google Scholar] [CrossRef]
  19. Visconti, P.; Iaia, F.; de Fazio, R.; Giannoccaro, N.I. A Stake-Out Prototype System Based on GNSS-RTK Technology for Implementing Accurate Vehicle Reliability and Performance Tests. Energies 2021, 14, 4885. [Google Scholar] [CrossRef]
  20. Anju, M.K. Design of Butterworth and Chebyshev1 Lowpass Filter for Equalized Group Delay. Int. J. Adv. Res. Comput. Sci. Softw. Eng. 2012, 2, 524–528. [Google Scholar]
  21. Kapse, R.; Adarsh, S.; Ritesh, K. Implementing an Autonomous Emergency Braking with Simulink using two Radar Sensors. arXiv 2019, arXiv:1902.11210. [Google Scholar]
  22. Available online: https://www.abdynamics.com/en/news/2020/robot-controller-software-version-9-00-releasing-early-2021 (accessed on 27 June 2022).
  23. Schubert, A.; Erbsmehl, C.; Hannawald, L. Standardized pre-crash scenarios in digital format on the basis of the VUFO simulation input data from GIDAS. In Proceedings of the 5th International Conference on ESAR, Expert Symposium on Accident Research, Hanover, Germany, 7–8 September 2012; pp. 366–372. [Google Scholar]
  24. Available online: https://it.mathworks.com/help/driving/ref/drivingscenariodesigner-app.html (accessed on 27 June 2022).
Figure 1. Reference system convention according to Euro NCAP.
Machines 10 00867 g001
Figure 2. Child soft pedestrian target (SPT) for AEB system tests.
Machines 10 00867 g002
Figure 3. The bounding box for adult (a) and child pedestrian (b) dummy.
Machines 10 00867 g003
Figure 4. Instrumentation layout.
Machines 10 00867 g004
Figure 5. Single-run analysis panel.
Machines 10 00867 g005
Figure 6. Multiple-run report panel.
Machines 10 00867 g006
Figure 7. Actors’ definition window.
Machines 10 00867 g007
Figure 8. New vehicle window.
Machines 10 00867 g008
Figure 9. Vehicle schematization.
Machines 10 00867 g009
Figure 10. SPT schematization.
Machines 10 00867 g010
Figure 11. Vehicle schematization polar coordinates.
Machines 10 00867 g011
Figure 12. Vehicle kinematic maneuver.
Machines 10 00867 g012
Figure 13. Representation of minimum V2V distance.
Machines 10 00867 g013
Figure 14. Flowchart of the main code for LSS tests.
Machines 10 00867 g014
Figure 15. Post-processing results for a valid test LDW.
Machines 10 00867 g015
Figure 16. Post-processing results for a valid test LKA.
Machines 10 00867 g016
Figure 17. Post-processing results for a valid test ELK.
Machines 10 00867 g017
Figure 18. Post-processing results for an invalid test LDW.
Machines 10 00867 g018
Figure 19. Post-processing results for a valid test CCRs.
Machines 10 00867 g019
Figure 20. Post-processing results for a valid test CCRm.
Machines 10 00867 g020
Figure 21. Post-processing results for valid test CCRb.
Machines 10 00867 g021
Figure 22. Post-processing results for invalid test CCRm.
Machines 10 00867 g022
Figure 23. Trigger FCWs and AEBs signals.
Machines 10 00867 g023
Figure 24. Time-to-collision longitudinal signal.
Machines 10 00867 g024
Figure 25. SV velocity signal.
Machines 10 00867 g025
Figure 26. UNECE R152 CPNC 55 km/h replay pictures.
Machines 10 00867 g026
Figure 27. UNECE R152 CPNC 55 km/h PDF export: actors positioning and minimum distance representation; minimum distance versus time sample graph; relative longitudinal and lateral distances versus time sample graph.
Machines 10 00867 g027
Table 1. Regulation limits for LSS testing according to NCAP regulation.
SignalValidity ConditionsTime Range for Validity
VUT GPS velocity72 ± 1 km/hT0–TLKA/LDW
Path-following error0 ± 0.05 mT0–TLKA/LDW
Lane-departure velocity in the stationary partVOT ± 0.05 m/sTSSC–TLKA/LDW
VUT angular yaw rate0 ± 1°/sT0–TSTEER
Angular speed of the VUT steering0 ± 15°/sT0–TSTEER
Table 2. Regulation limits for AEB testing according to NCAP regulation.
SignalValidity ConditionsTime Range for Validity
VUT GPS velocityVOT + 1 km/hT0–TAEB/FCW
GVT GPS velocityVOT ± 1 km/hT0–TAEB/FCW
Path-following error (VUT)0 ± 0.05 mT0–TAEB/FCW
Path-following error (GVT)0 ± 0.05 mT0–TAEB/FCW
VUT angular yaw rate0 ± 1°/sT0–TAEB/FCW
GVT angular yaw rate0 ± 1°/sT0–TAEB/FCW
Angular speed of the VUT steering0 ± 15°/sT0–TAEB/FCW
Relative distance (scenario CCRb)DOT ± 0.5 mT0–TAEB/FCW
Table 3. Regulation limits for analyzed signals according to UNECE R152 CPNC.
SignalLimitsTime Range
VUT velocityNominal ÷ Nominal − 2 km/hT0–TFCW
SPT velocity5 km/h ± 2 km/hTSPT,start moving–TFCW
VUT yaw rate0°/s ± 1°/sT0–TFCW
VUT steering rate0°/s ± 15°/sT0–TFCW
VUT path-following error0 m ± 0.1 mT0–TFCW
Table 4. Regulation limits for analyzed signals according to UNECE R152 CPNC.
SignalLimits
Ambient temperature0 °C: 45 °C
Wind speed≤36 km/h
Rainfall0 mm
Illuminance≥2000 lux
Sun altitude≥15°
Table 5. Evaluation of vehicle schematization points.
PointXY
Front BumperLeft x A D M A + S + O y A D M A + W / 2
Middle x A D M A + S + O y A D M A
Right x A D M A + S + O y A D M A W / 2
Rear BumperLeft x A D M A ( L ( S + O ) y A D M A + W / 2
Middle x A D M A ( L ( S + O ) ) y A D M A
Right x A D M A ( L ( S + O ) ) y A D M A W / 2
Front AxleLeft x A D M A + S y A D M A + W / 2
Middle x A D M A + S y A D M A
Right x A D M A + S y A D M A W / 2
Rear AxleLeft x A D M A + S B y A D M A + W / 2
Middle x A D M A + S B y A D M A
Right x A D M A + S B y A D M A W / 2
Middle VehicleLeft x A D M A ( L ( S + O ) ) + L / 2 y A D M A + W / 2
Right x A D M A ( L ( S + O ) ) + L / 2 y A D M A W / 2
Publisher’s Note: MDPI stays neutral with regard to jurisdictional claims in published maps and institutional affiliations.

