Article

Investigation of Transient Characteristics of a Vertical Axial-Flow Pump with Non-Uniform Suction Flow

1
Research Center of Fluid Machinery Engineering and Technology, Jiangsu University, Zhenjiang 212013, China
2
Wenling Fluid Machinery Technology Institute of Jiangsu University, Wenling 317525, China
3
China Water Huaihe Planning Design and Research Co., Ltd., Hefei 230601, China
4
Crane Fengqiu (Zhejiang) Pump Co., Ltd., Zhuji 311800, China
*
Author to whom correspondence should be addressed.
Machines 2022, 10(10), 855; https://doi.org/10.3390/machines10100855
Submission received: 25 August 2022 / Revised: 15 September 2022 / Accepted: 16 September 2022 / Published: 26 September 2022
(This article belongs to the Special Issue Optimization and Flow Characteristics in Advanced Fluid Machinery)

Abstract

:
The aim of this paper is to study the influence of non-uniform suction flow on the transient characteristics of a vertical axial-flow pump device. The unsteady calculation is employed to forecast the unstable flow structure with three inlet deflection angles α , and the calculation accuracy under uniform inlet flow is verified by the external characteristic test. The results depict that a promotion in the α will increase the head and shaft power and thus improve the stress and fatigue failure risk of the impeller. At the impeller inlet, the pressure pulsation intensity (PPI) with α = 40° is lower than that with α = 0° caused by a decline in the axial velocity. The dominant frequency of the unsteady pressure signal is the blade-passing frequency (BPF), and the dominant frequency amplitude rises with the increase in α due to the improvement of the pre-rotation impact intensity. At the guide vanes inlet, the dominant frequency of the unsteady pressure signal at the guide vane inlet is also the blade-passing frequency. An improvement in α magnifies the angle between the trailing edge jet of the impeller and the leading edge of the guide vanes under 0.8Qdes and 1.0Qdes, while it diminishes the angle under 1.2Qdes. Thus, the PPI and dominant frequency amplitude with α = 40° are higher than that with α = 0° under 0.8Qdes and 1.0Qdes, but these are lower than that with α = 0° under 1.2Qdes.

1. Introduction

A vertical axial-flow pump is a common piece of hydraulic machinery widely used in inter-regional water transfer, agricultural irrigation [1,2], and flooding projects [3] due to its large flow rate and compact structure. However, the hydrodynamic pulsation characteristics of vertical axial-flow pumps have been being a key concern due to the fact that the curved elbow area of the inflow conduit is susceptible to the formation of a flow separation caused by the inverse pressure gradient [4]. Furthermore, the inlets of some vertical axial-flow pumps present a non-uniform velocity profile in actual applications due to a forebay with a side intake, which further increases the internal vortex scale, aggravates unit vibration, and directly threatens the safety of the operation of the vertical axial-flow pump [5]. The characteristic parameter of pressure pulsation is an important evaluation index of the operational stability of a vertical axial-flow pump [6,7]. Establishing a physical connection between the non-uniform suction flow and pressure pulsation characteristics can provide a theoretical reference to ensure that vertical axial-flow pumps operate safely and efficiently.
Recently, with the rapid growth of meshing techniques [8], numerical algorithms [9], and post-processing methods [10], the investigation of the internal pressure pulsation of axial-flow pumps based on computational fluid dynamics (CFD) has made remarkable progress [11,12]. Yang et al. [13] found that rotor–stator interference between the impeller and guide vanes is one of the most important inductors for strong pressure pulsation inside the axial-flow pump. As a result, the main frequency amplitude of pressure pulsation at the impeller outlet is high due to the turbulent flow regime, and the main frequency is the blade-passing frequency. Shi et al. [14] showed that blade angle deviations enhanced the rotor–stator interference effect resulting from the enhanced strength of the blade wake vortex, which increased the pulsation amplitude of the flow-field pressure and shaft power. Zhang [15] used a two-way fluid–structure coupling method to investigate the effect of hydrodynamic excitation forces induced by dynamic–static interference on the structural dynamics of an axial-flow pump. They reported that the main frequency of the equivalent force pulsation on the guide vanes is the same as the blade-passing frequency. In addition, the clearance leakage flow is another important inducer of strong pressure pulsation [16]. Shen et al. [17] studied the effect of the radius of tip clearance on the unsteady flow characteristic inside an axial-flow pump. The pressure difference at the blade surface drives the impeller outflow back to the impeller inlet along the clearance passage, which leads to tip leakage vortex formation and an improvement in the pressure pulsation amplitude in the tip clearance.
Previous studies of the pressure pulsation characteristics of axial pumps were mainly based on uniform inflow. Although non-uniform inflow leads to the formation of large-scale secondary vortices and a deteriorated outflow state inside the inflow conduit of vertical axial pumps [18], the impact of non-uniform inflow on the pressure pulsation characteristic inside the impeller and guide vanes of vertical axial pumps has hardly been explored in detail. The existed investigation of the unsteady characteristics of other types of pumps under non-uniform inflow can be used as a guideline. In a reactor coolant pump, the non-uniform inflow caused by the channel head significantly increased the pressure pulsation amplitude at the inlet and impeller radial force [19]. The main frequency of pressure pulsation at the inlet of the guide vanes is the blade-passing frequency and its harmonics [20]. The main frequency amplitude in the impeller and guide vanes are susceptible to rotational speed so a reduction in the rotational speed can significantly result in a drop in the pressure pulsation energy level and thus enhance the operational stability [21]. In a waterjet pump, the non-uniform inflow caused by the intake duct enhances the main frequency amplitude of pressure pulsation near the surfaces of the blades and guide vanes. The main frequency of the blade surface pressure pulsation is the shaft frequency and 11 times the shaft frequency, respectively, under non-uniform inflow and uniform inflow [22]. Under cavitation conditions with non-uniform inflow, the pressure pulsation characteristics were found to have a close relationship with the cavity volume near the blades’ surfaces. In a time-domain analysis, the pressure pulsation curve on the monitor near the front of the impeller was similar to the cavity volume acceleration curve [23].
The inflow non-uniformity of vertical axial-flow pumps can be quantitatively described by the inflow deflection angle. Therefore, the main aim of this paper was to study the effect of the inflow deflection angle on the spatial distribution characteristics of the pressure pulsation intensity (PPI) and pressure signal transmission characteristics inside a vertical axial-flow pump. The external characteristic parameters of the vertical axial-flow pump under different inflow angles were predicted by solving the unsteady Reynolds time-averaged equation. The calculated results under uniform inflow were verified by an external characteristic test. The standard deviation of pressure pulsation was used as the evaluating indicator to spatially analyze the PPI inside the impeller and guide vanes. Time- and frequency-domain analyses of the unsteady pressure pulsation signals at the monitoring points near the inlet of the impeller and guide vanes were performed.

2. Numerical Simulation

2.1. Computational Model

A vertical axial-flow pump device with n s = 893.4 was the subject of investigation in this study. The main hydraulic components are the elbow inlet channel, impeller, guide vanes, and elbow outlet channel, which are presented in Figure 1. In the calculation domain, the Z axis of the Cartesian coordinate system was the impeller rotation axis. Based on the engineering requirements, the design rotation speed and flow rate were 1340 r/min and 308 L/s, respectively. The design efficiency and head of the pump device were 78.3% and 4.4 m according to the unsteady numerical simulation. The impeller diameter, tip radius, and blade number were 300 mm, 0.3 mm, and 3, respectively. The number of guide vanes was finally determined to be 6 to better match the impeller.

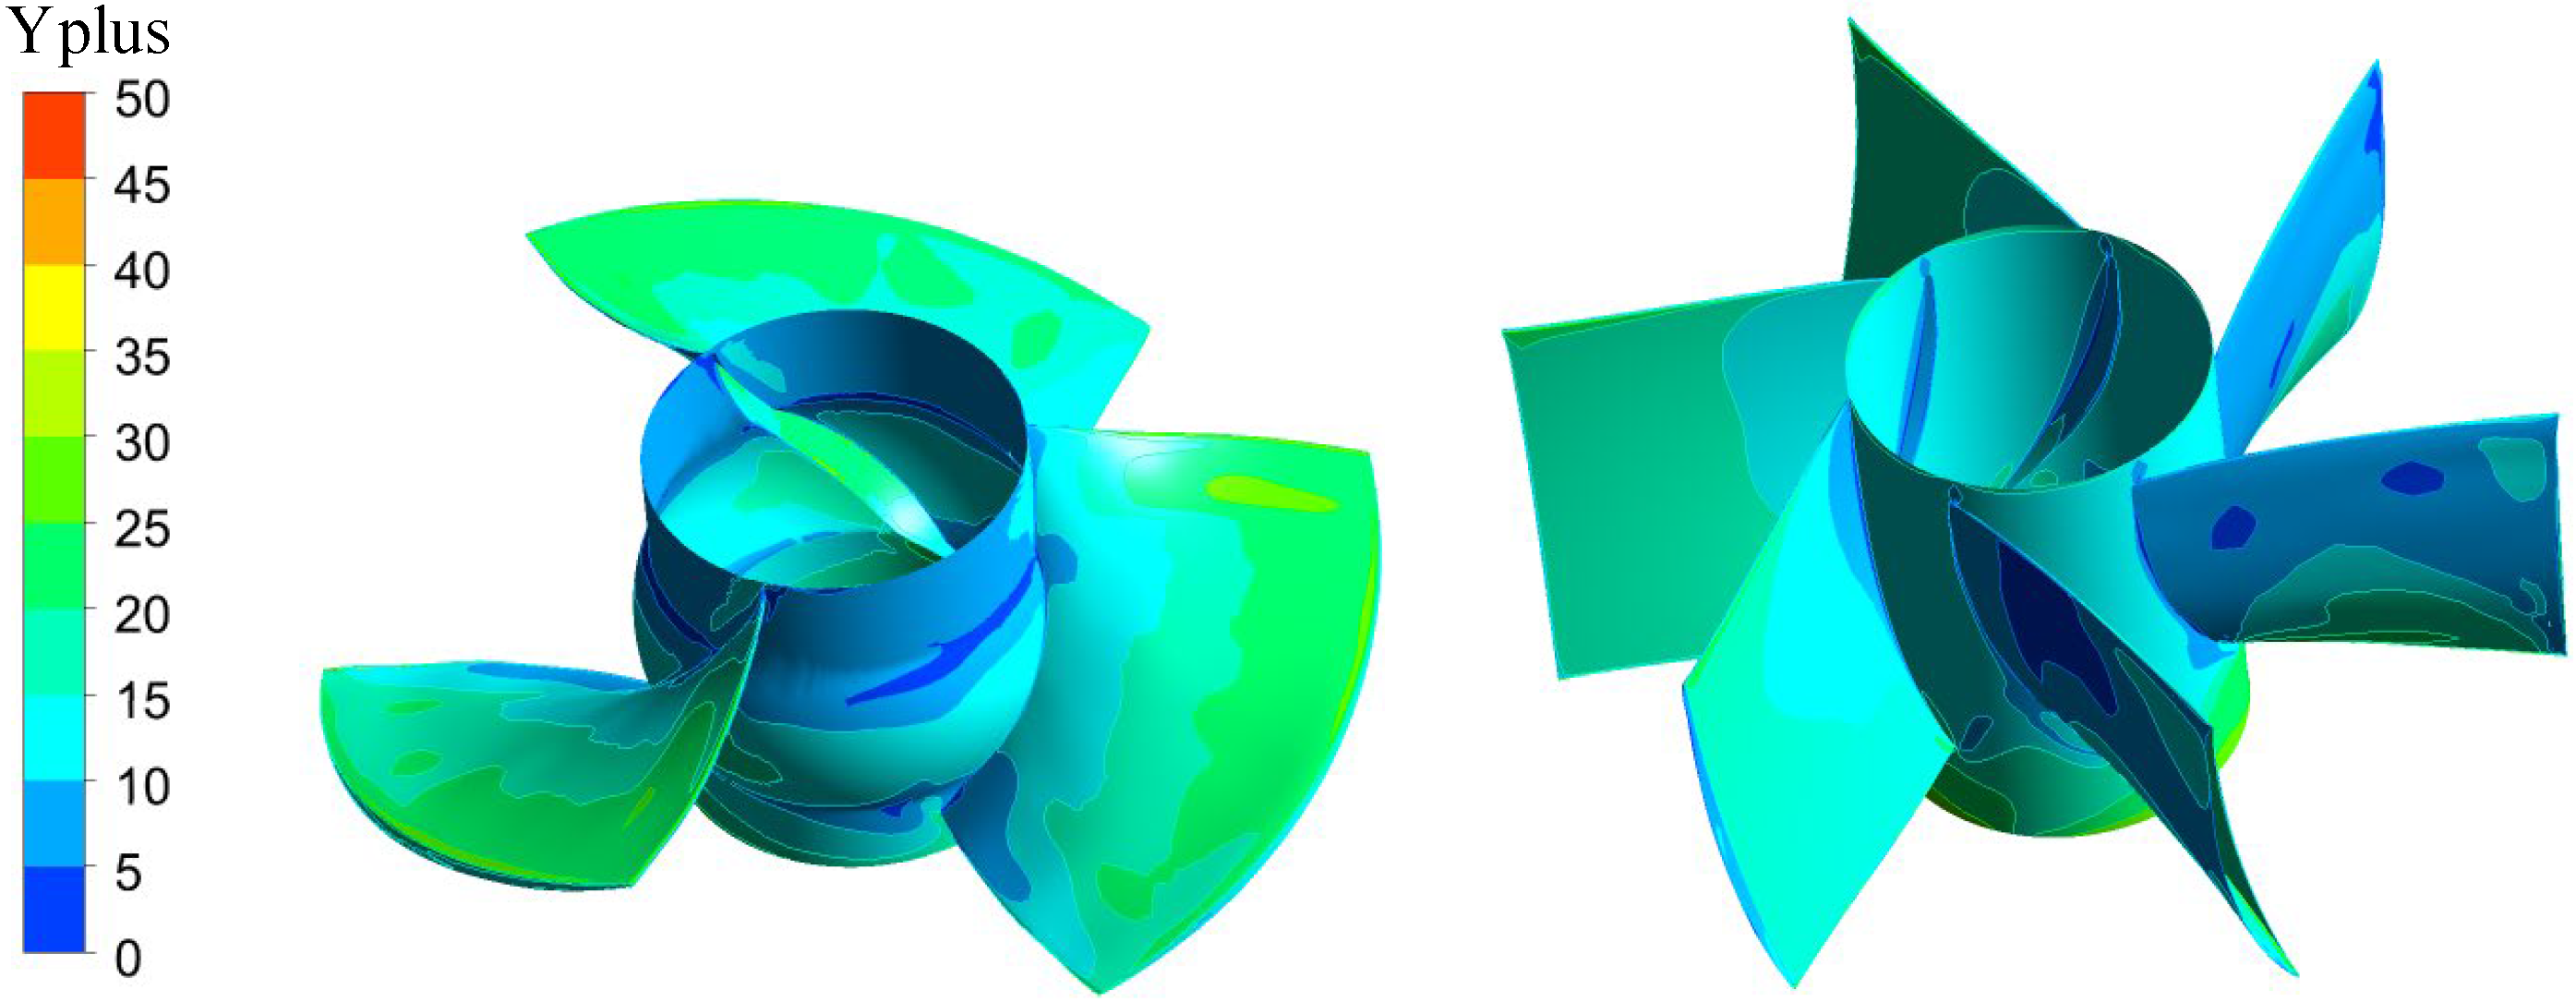
2.2. Mesh and Boundary Conditions

To accurately predict the hydraulic performance and capture the unstable flow structure, all the calculation domains were divided into hexahedral grids, as shown in Figure 2a, and the near-wall grids were refined as shown in Figure 2b. The computational domains of the impeller, elbow inlet channel, and elbow outlet channel were meshed by using ICEM CFD and that of the guide vanes was meshed by applying TurboGrid.
The three-dimensional Navier–Stokes equations with the Reynolds-averaged method were solved using Ansys CFX to carry out the numerical simulation. The roughness values of the wall of the impeller and guide vanes were set at 0.0125 mm and those of the elbow inlet channel and elbow outlet channel were set at 0.05 mm. The inlet condition was set to “Normal Speed” or “Cart. Vel Components” depending on the inflow deviation angle. The outlet condition was determined as “Opening Pres. and Dirn”. Furthermore, the results of the steady numerical simulation were taken as the initial values in the unsteady numerical simulation. In the steady numerical simulation, the interface condition between stators was “None” and that between the impeller and stator was “Stage”. In the unsteady numerical simulation, the interface condition between stators was also “None”, but that between the impeller and stator was “Transient Rotor Stator”. In addition, the root mean square was selected as the convergence criterion and the residual target was set at 5 × 10⁻⁵. The time step was 0.000373134 s, i.e., a rotation of 3° for each step, and the total time was 0.62686567 s, i.e., the number of rotations was 14.
Figure 2. (a) Mesh of the vertical axial-flow pump device and (b) Mesh refinement of the impeller and guide vane wall.
Machines 10 00855 g002
The grid independence analysis was completed to accurately capture the internal vortex structure and turbulent characteristics of the vertical axial-flow pump with limited computational resources. The head and efficiency were calculated using Equations (1) and (2) [10].
H = p out p in ρ g
Here, H, p out , and p in stand for the head, outlet total pressure, and inlet total pressure, ρ and g are the water density and gravity acceleration.
The design head Hdes of the last 120 time steps were recorded and then averaged as the quantitative evaluation criteria for the grid independence analysis due to the fluctuating nature of the unsteady calculation results. The number of grid nodes (Ng) for each hydraulic component and the Hdes for the four cases are shown in Table 1. The error deviation can be calculated by H des , c a s e i H des , c a s e 3 × 100 % (i = 1, 2, 3, 4). Grid 3 was finally selected as the optimal case for the next study due to the relative deviation of the Hdes being only 0.28% compared with Grid 4. Moreover, Figure 3 shows the local distribution of Yplus on the wall of the impeller and guide vanes. The Yplus value is defined as a dimensionless variable that indicates the distance between the first layer mesh and the wall surface of the computational domain. It can be employed to detect whether the quality of the boundary layer mesh is consistent with the requirements of the turbulence model. In Grid C, the average Y+ values of the elbow inlet channel, impeller guide vanes, and elbow outlet channel are 4.97, 10.11, 10.79, and 15.95. These results can be considered as being within the constraint conditions of the turbulence model SST k-omega for Yplus.

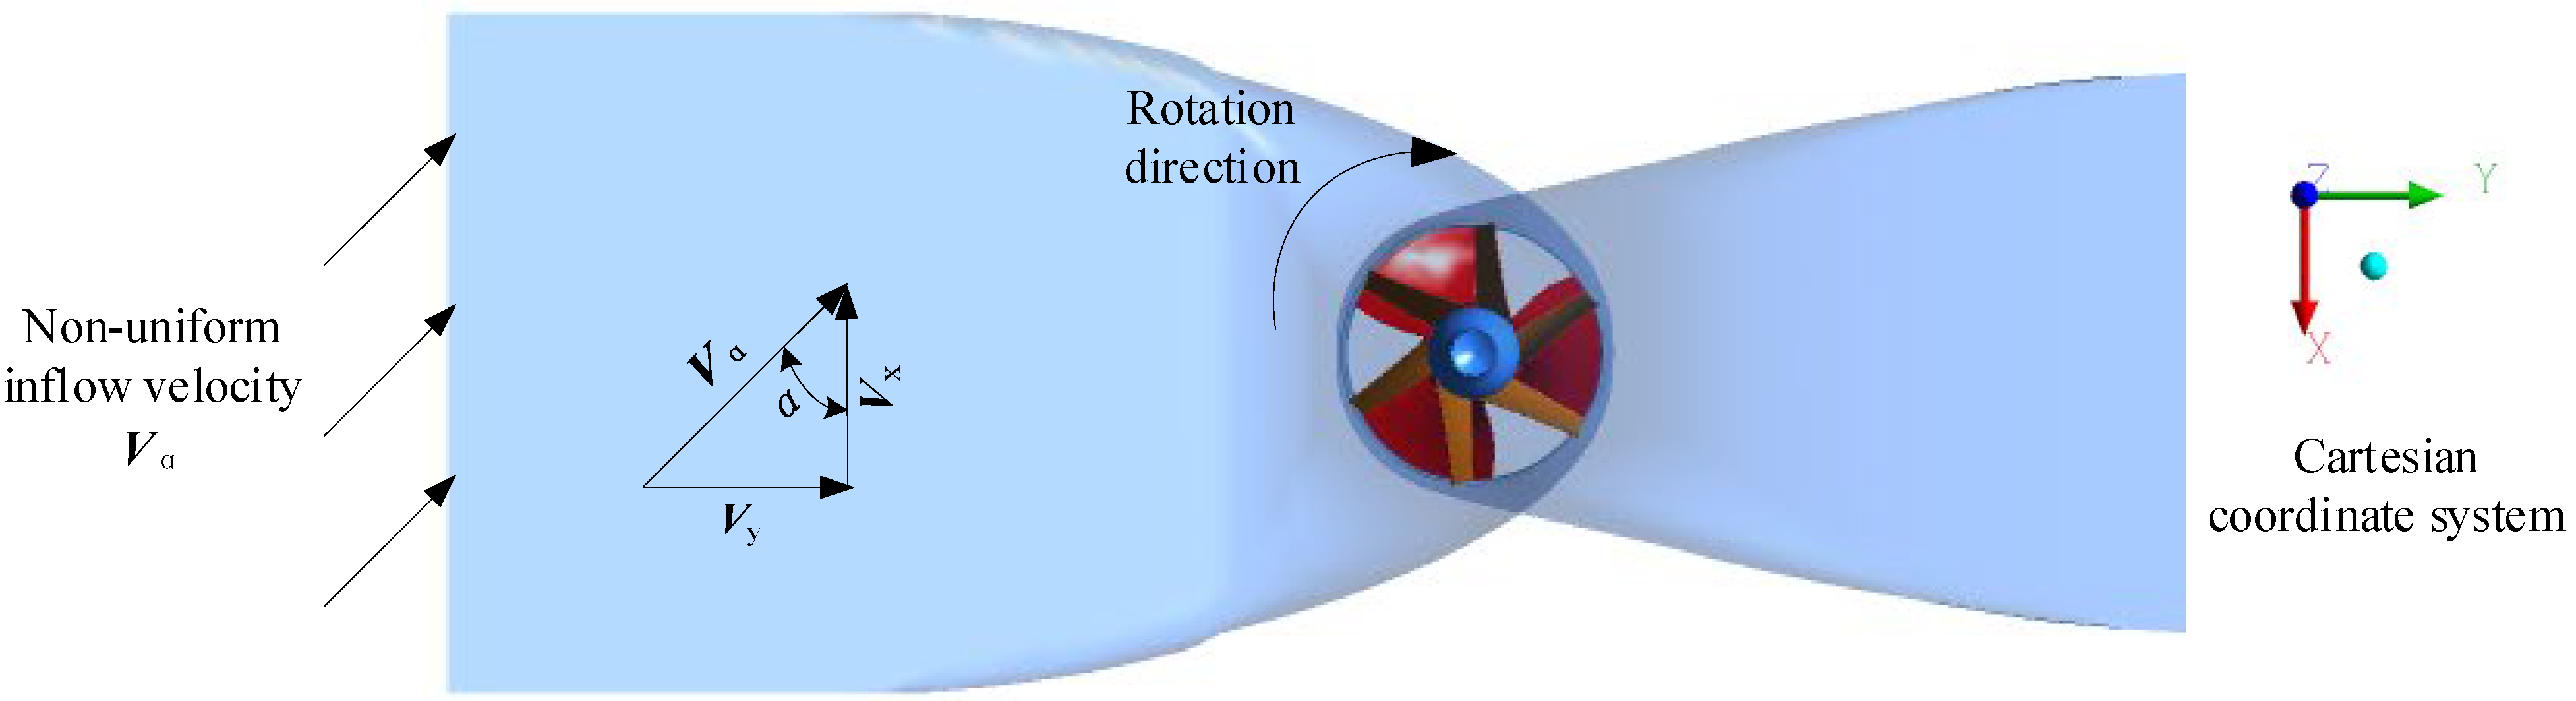
2.3. The Definition of Non-Uniform Inflow

In this work, the uniform area-averaged velocity and non-uniform area-averaged velocity at the inlet are defined as two-dimensional velocity vectors in the X-Y plane, which is perpendicular to the axis of rotation, and the Z axis is identical to the axis of rotation, as shown in Figure 4. V α can be divided into two parts: one is the velocity in the X-direction and the other is the one lone Y-direction in a Cartesian coordinate system, where the α is the angle between V α and V x . The uniform inflow conditions are represented by | V α | = | V y | and | V x | = 0 , which means α = 0 . Under non-uniform inflow conditions (or α 0 ), two velocity components | V x | and | V y | can be calculated by ( cos α ) × | V α | and sin α × | V α | , respectively. It is worth noting that the inlet flow rate is equal to V α multiplied by the inlet area.

3. Results and Discussion

3.1. Test Validation

An external characteristic test of the vertical axial-flow pump device was conducted to verify whether the mesh generation method and the boundary conditions were appropriate. Figure 5 depicts the specific structure of the test bench, which can be divided into an upper layer and a lower layer. The intelligent electromagnetic flowmeter was adopted for the measurement of the operating flow, which was arranged in the lower layer and the measurement uncertainty was 0.2%. An intelligent differential pressure transmitter with 0.1% measurement uncertainty was adopted for the head, and the monitoring points of the inlet and outlet pressures were arranged in the low-pressure tank and high-pressure tank, respectively, to relieve the interference of water pressure pulsation. Intelligent torque and speed sensors were used to measure the torque and the measurement uncertainty was 0.1%.
Figure 6 shows the performance results of the unsteady numerical simulation and test measurement data under uniform inflow conditions ( α = 0). The unsteady numerical simulation head and efficiency coefficients are the average value of the last 120 time-steps. As shown in the figure, the head and efficiency curves based on computational fluid dynamics (CFD) are similar to those of the test. The head of the CFD and test decreases with the increase in the flow rate, and the best efficiency point of the CFD and test can be found near 1.0Qdes. Compared with the design head and efficiency of the test, the relative deviations of those of the CFD are 2.58% and 1.34%, respectively, which indicates that the calculation results are reliable.

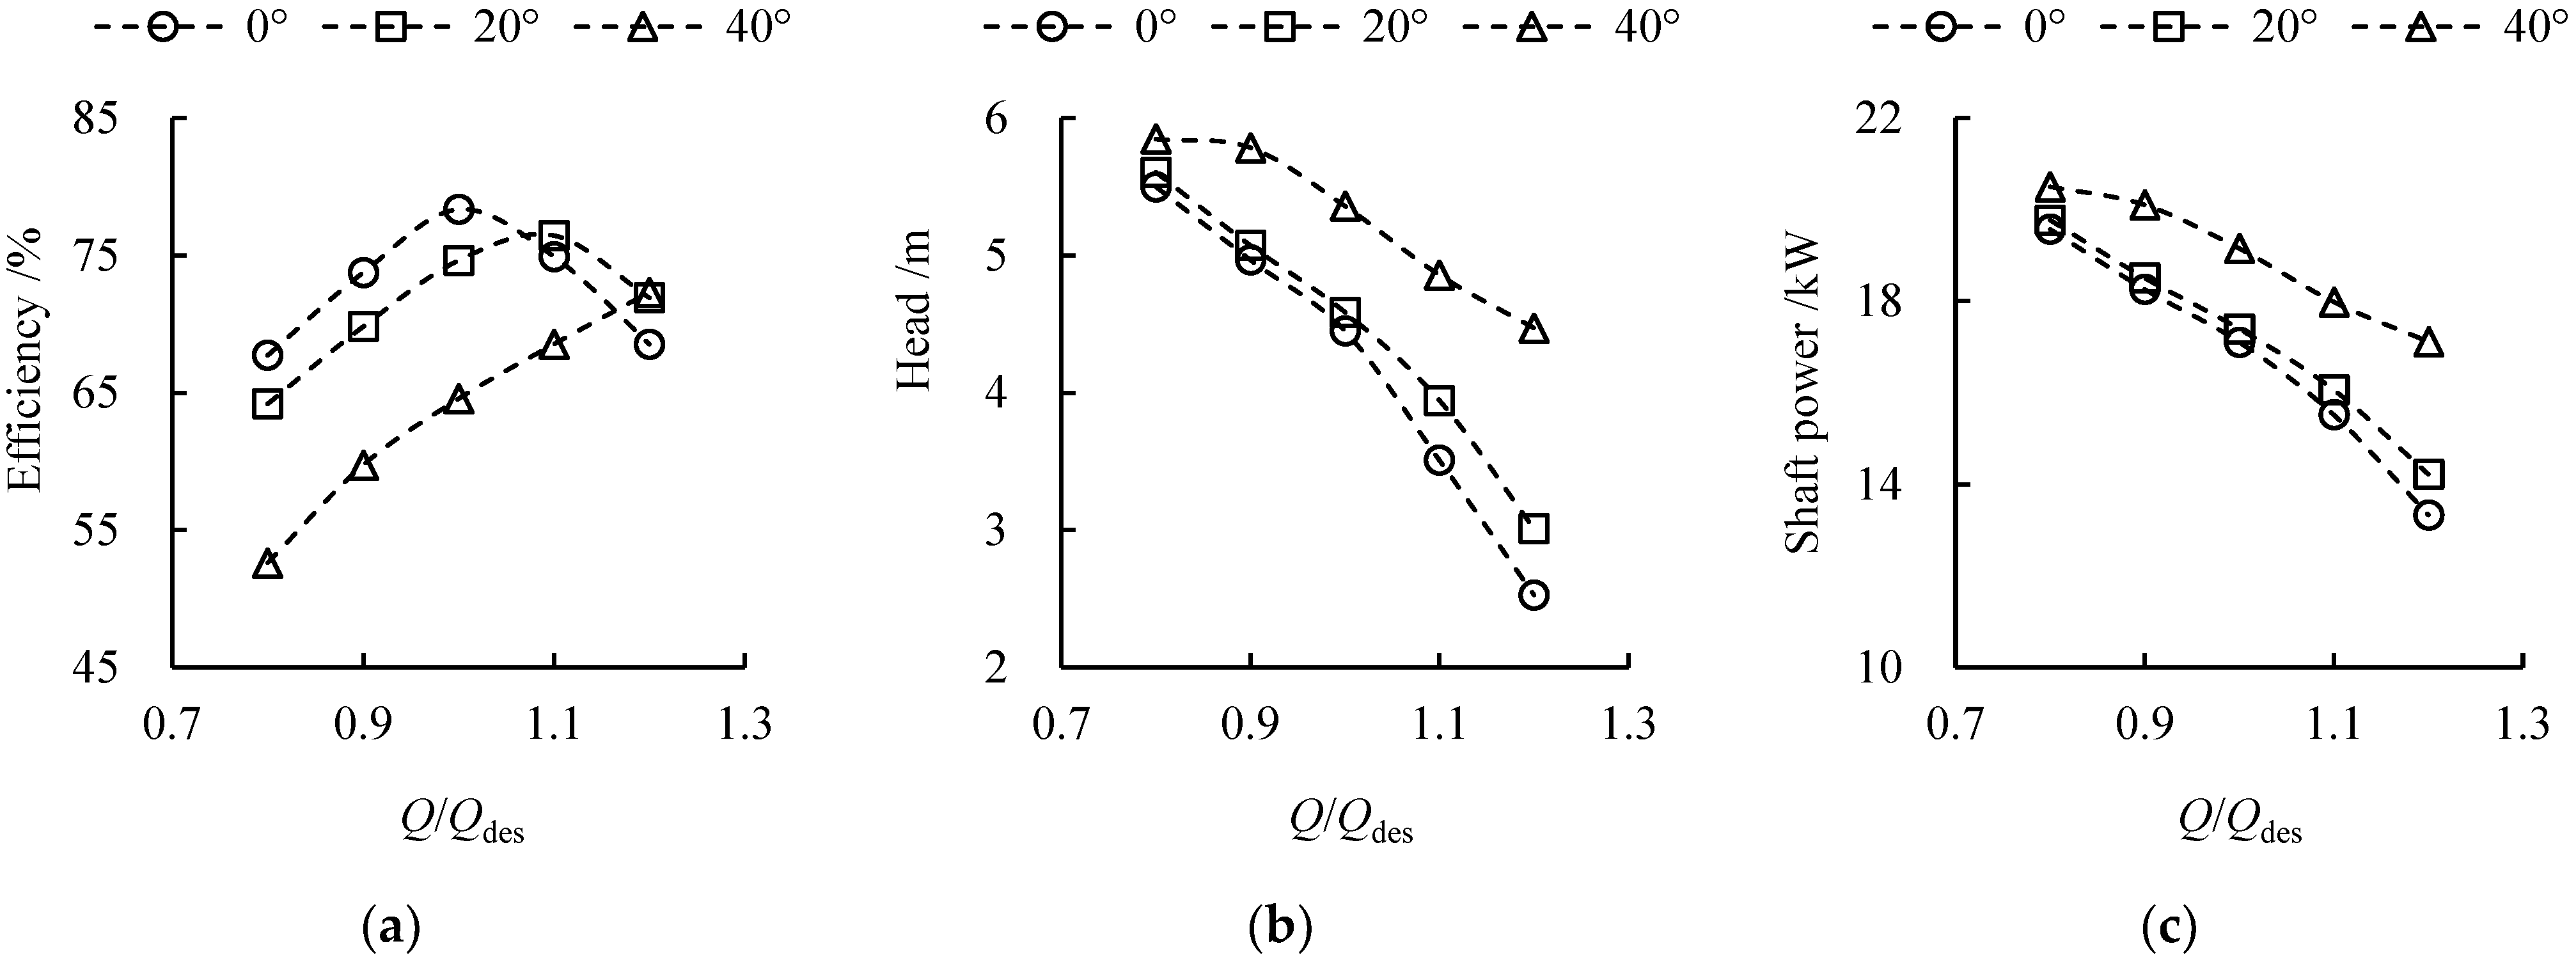
3.2. External Characteristic Parameters under Three Inlet Deflection Angles

Figure 7a–c denote the efficiency, head, and shaft power under three α values, respectively. The efficiency drops with the increase in α under 0.8Qdes–1.0Qdes, but it ascends with the increase in α under 1.2Qdes. This means that an improvement in α varies the impeller attack angle and thus causes the best efficiency point (BEP) to shift toward the larger flow rate. Moreover, the head and shaft power elevate with the increase in α under the same flow rate. The improvement of the force on the impeller due to the elevation of the shaft power not only magnifies the inner vibration energy but also raises the risk of fatigue failure. Therefore, the effect of α on the spatial distribution of the PPI and the transmission characteristics of the unsteady pressure signal need to be compared and analyzed to ensure the safe operation of the vertical axial-flow pump device.

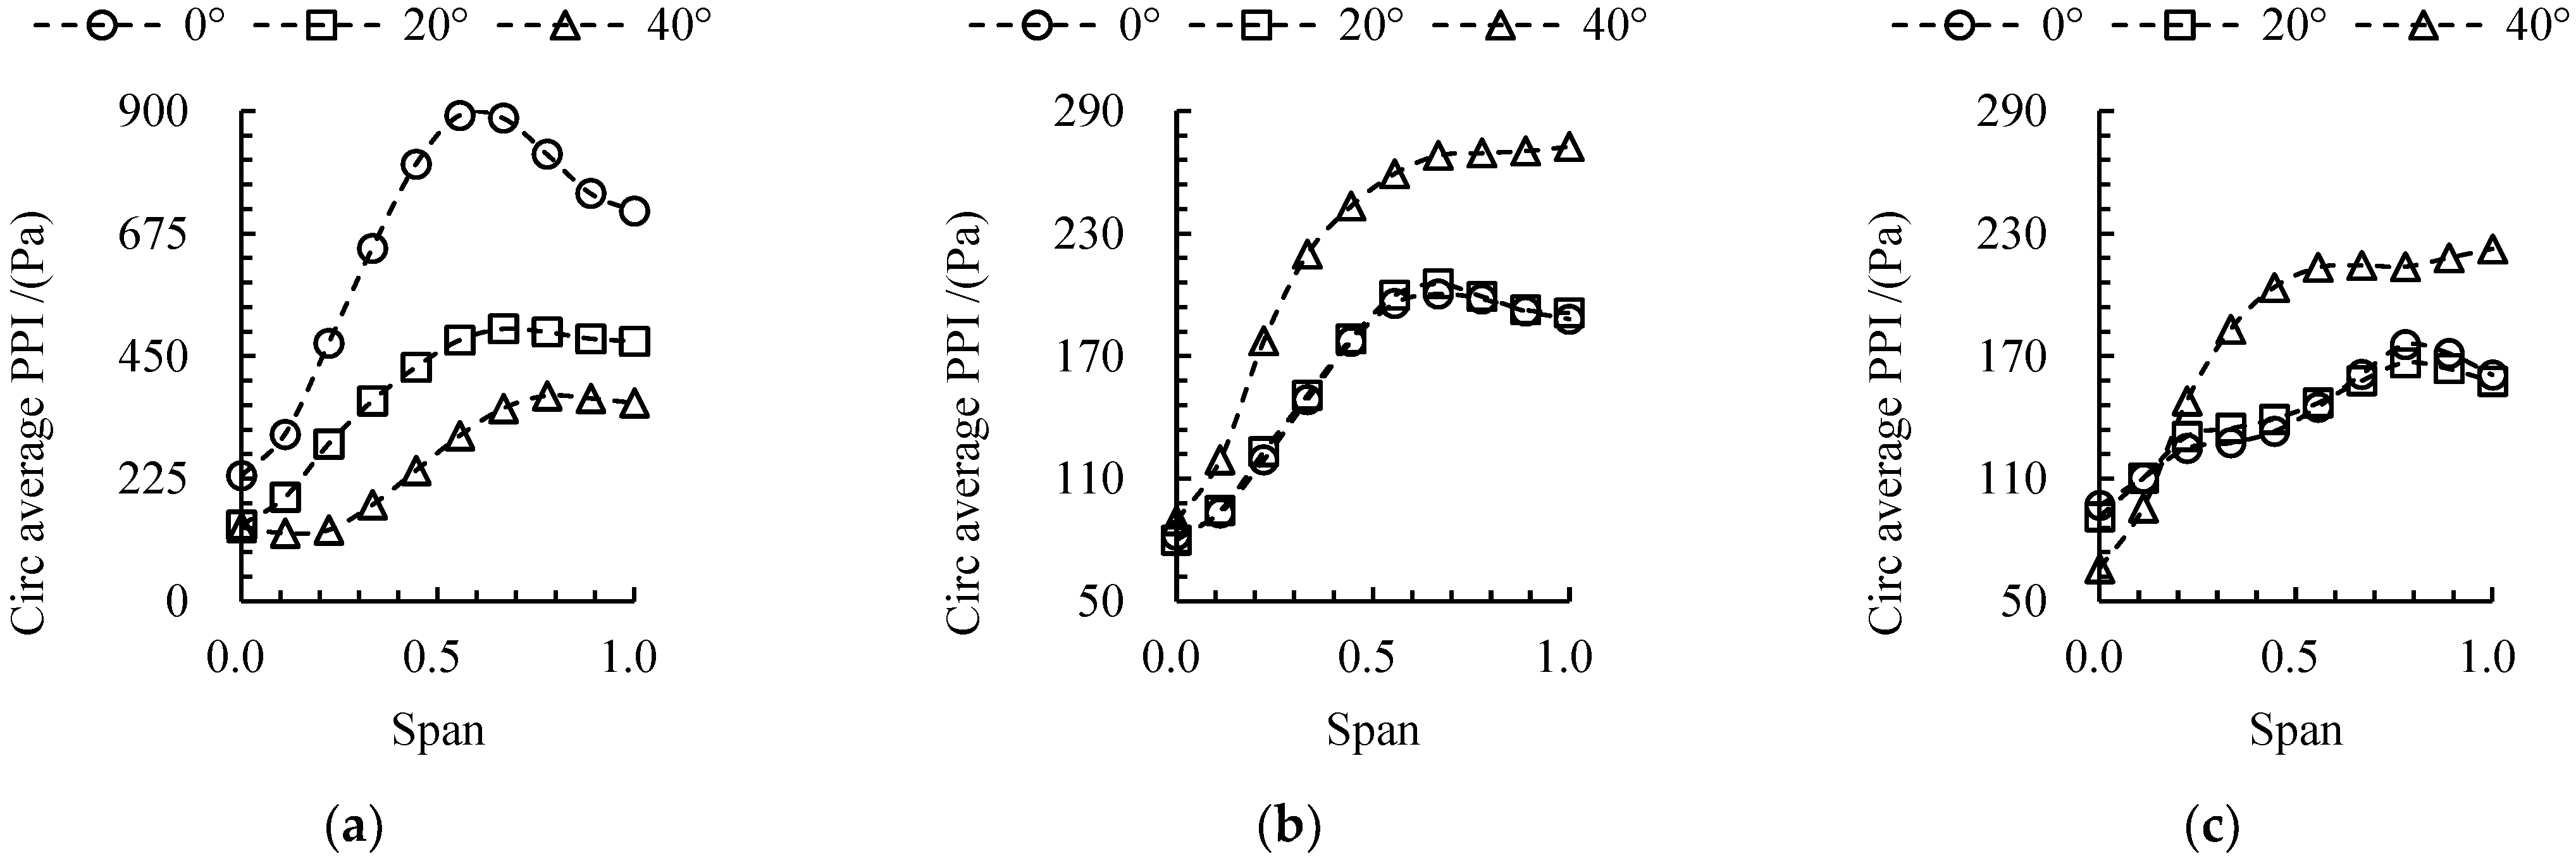
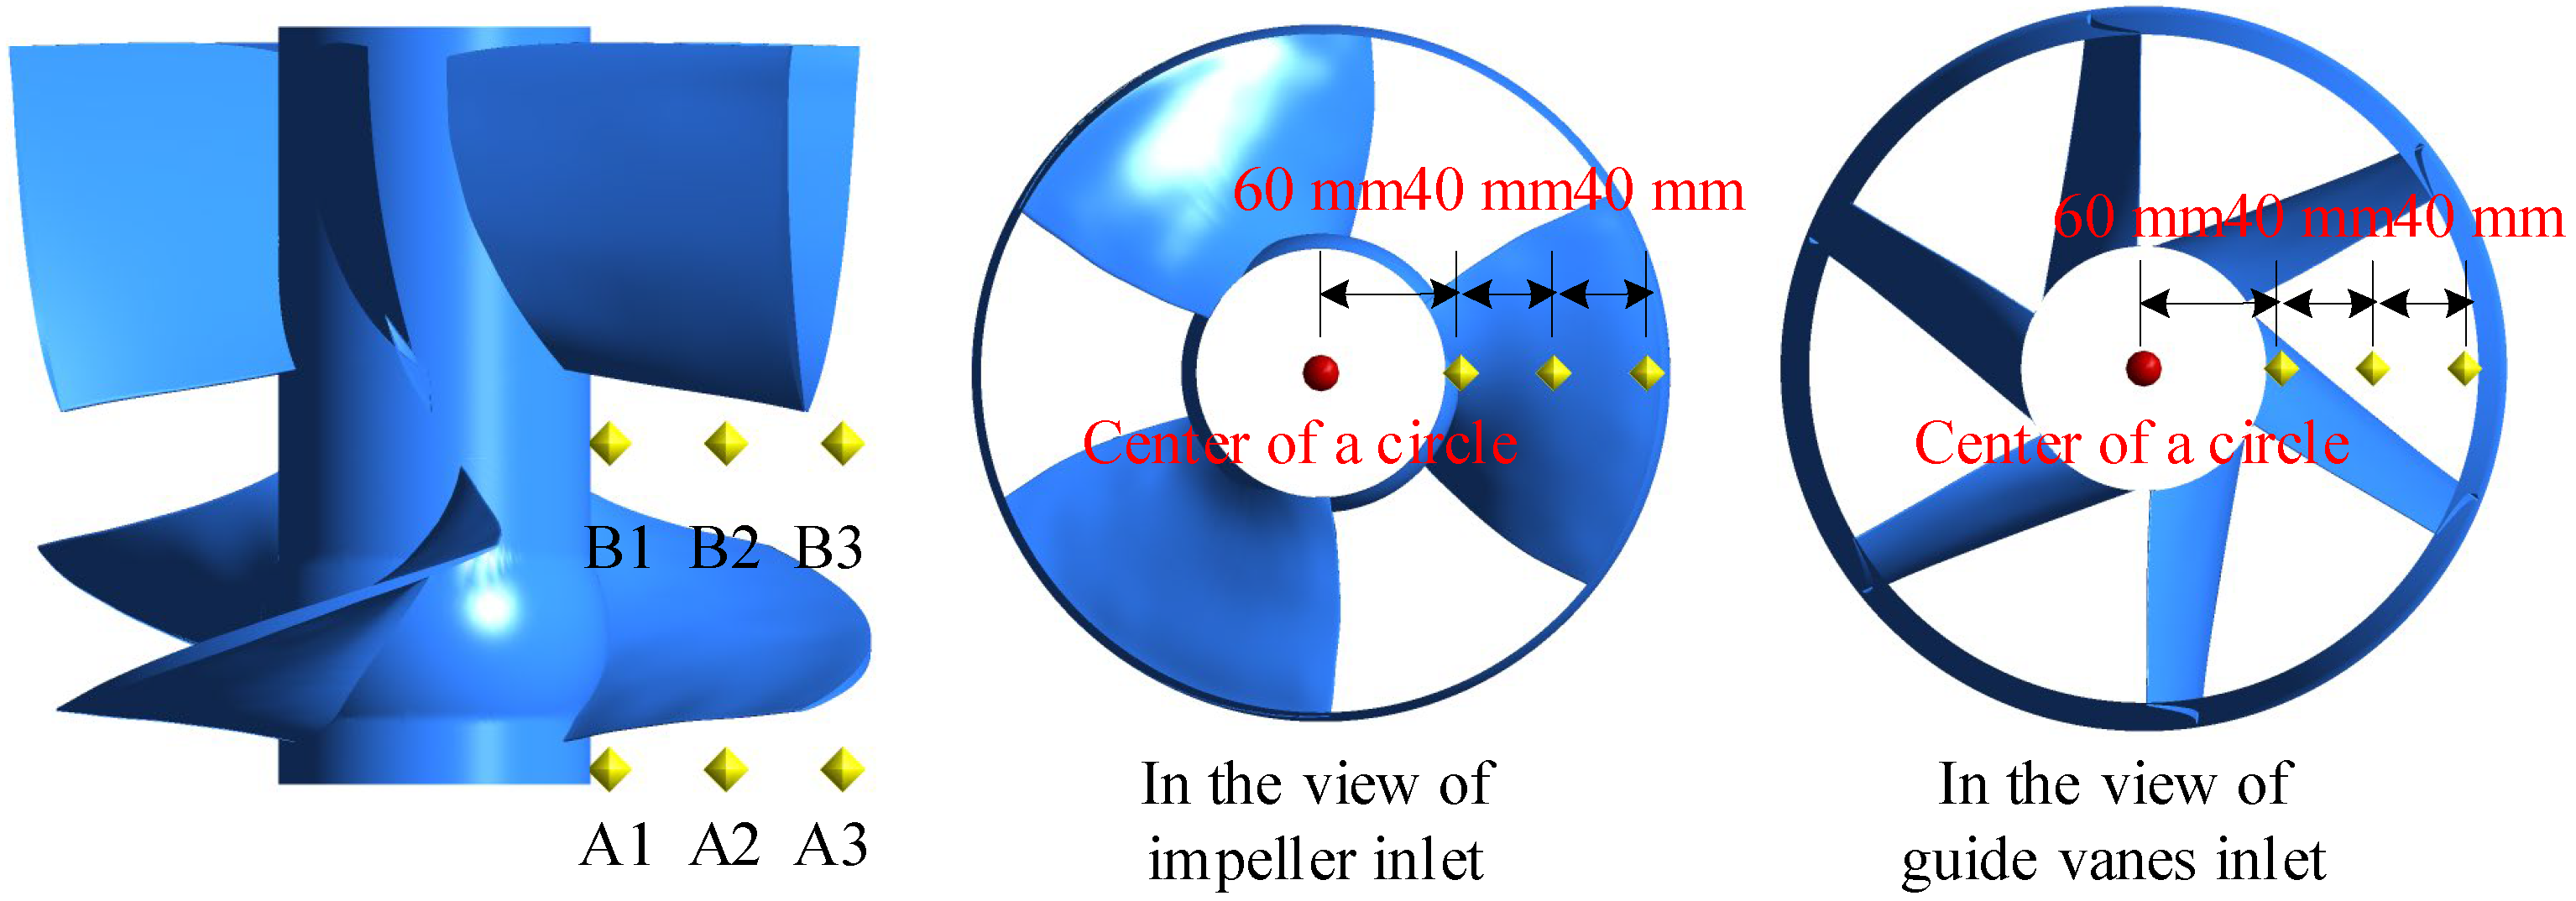
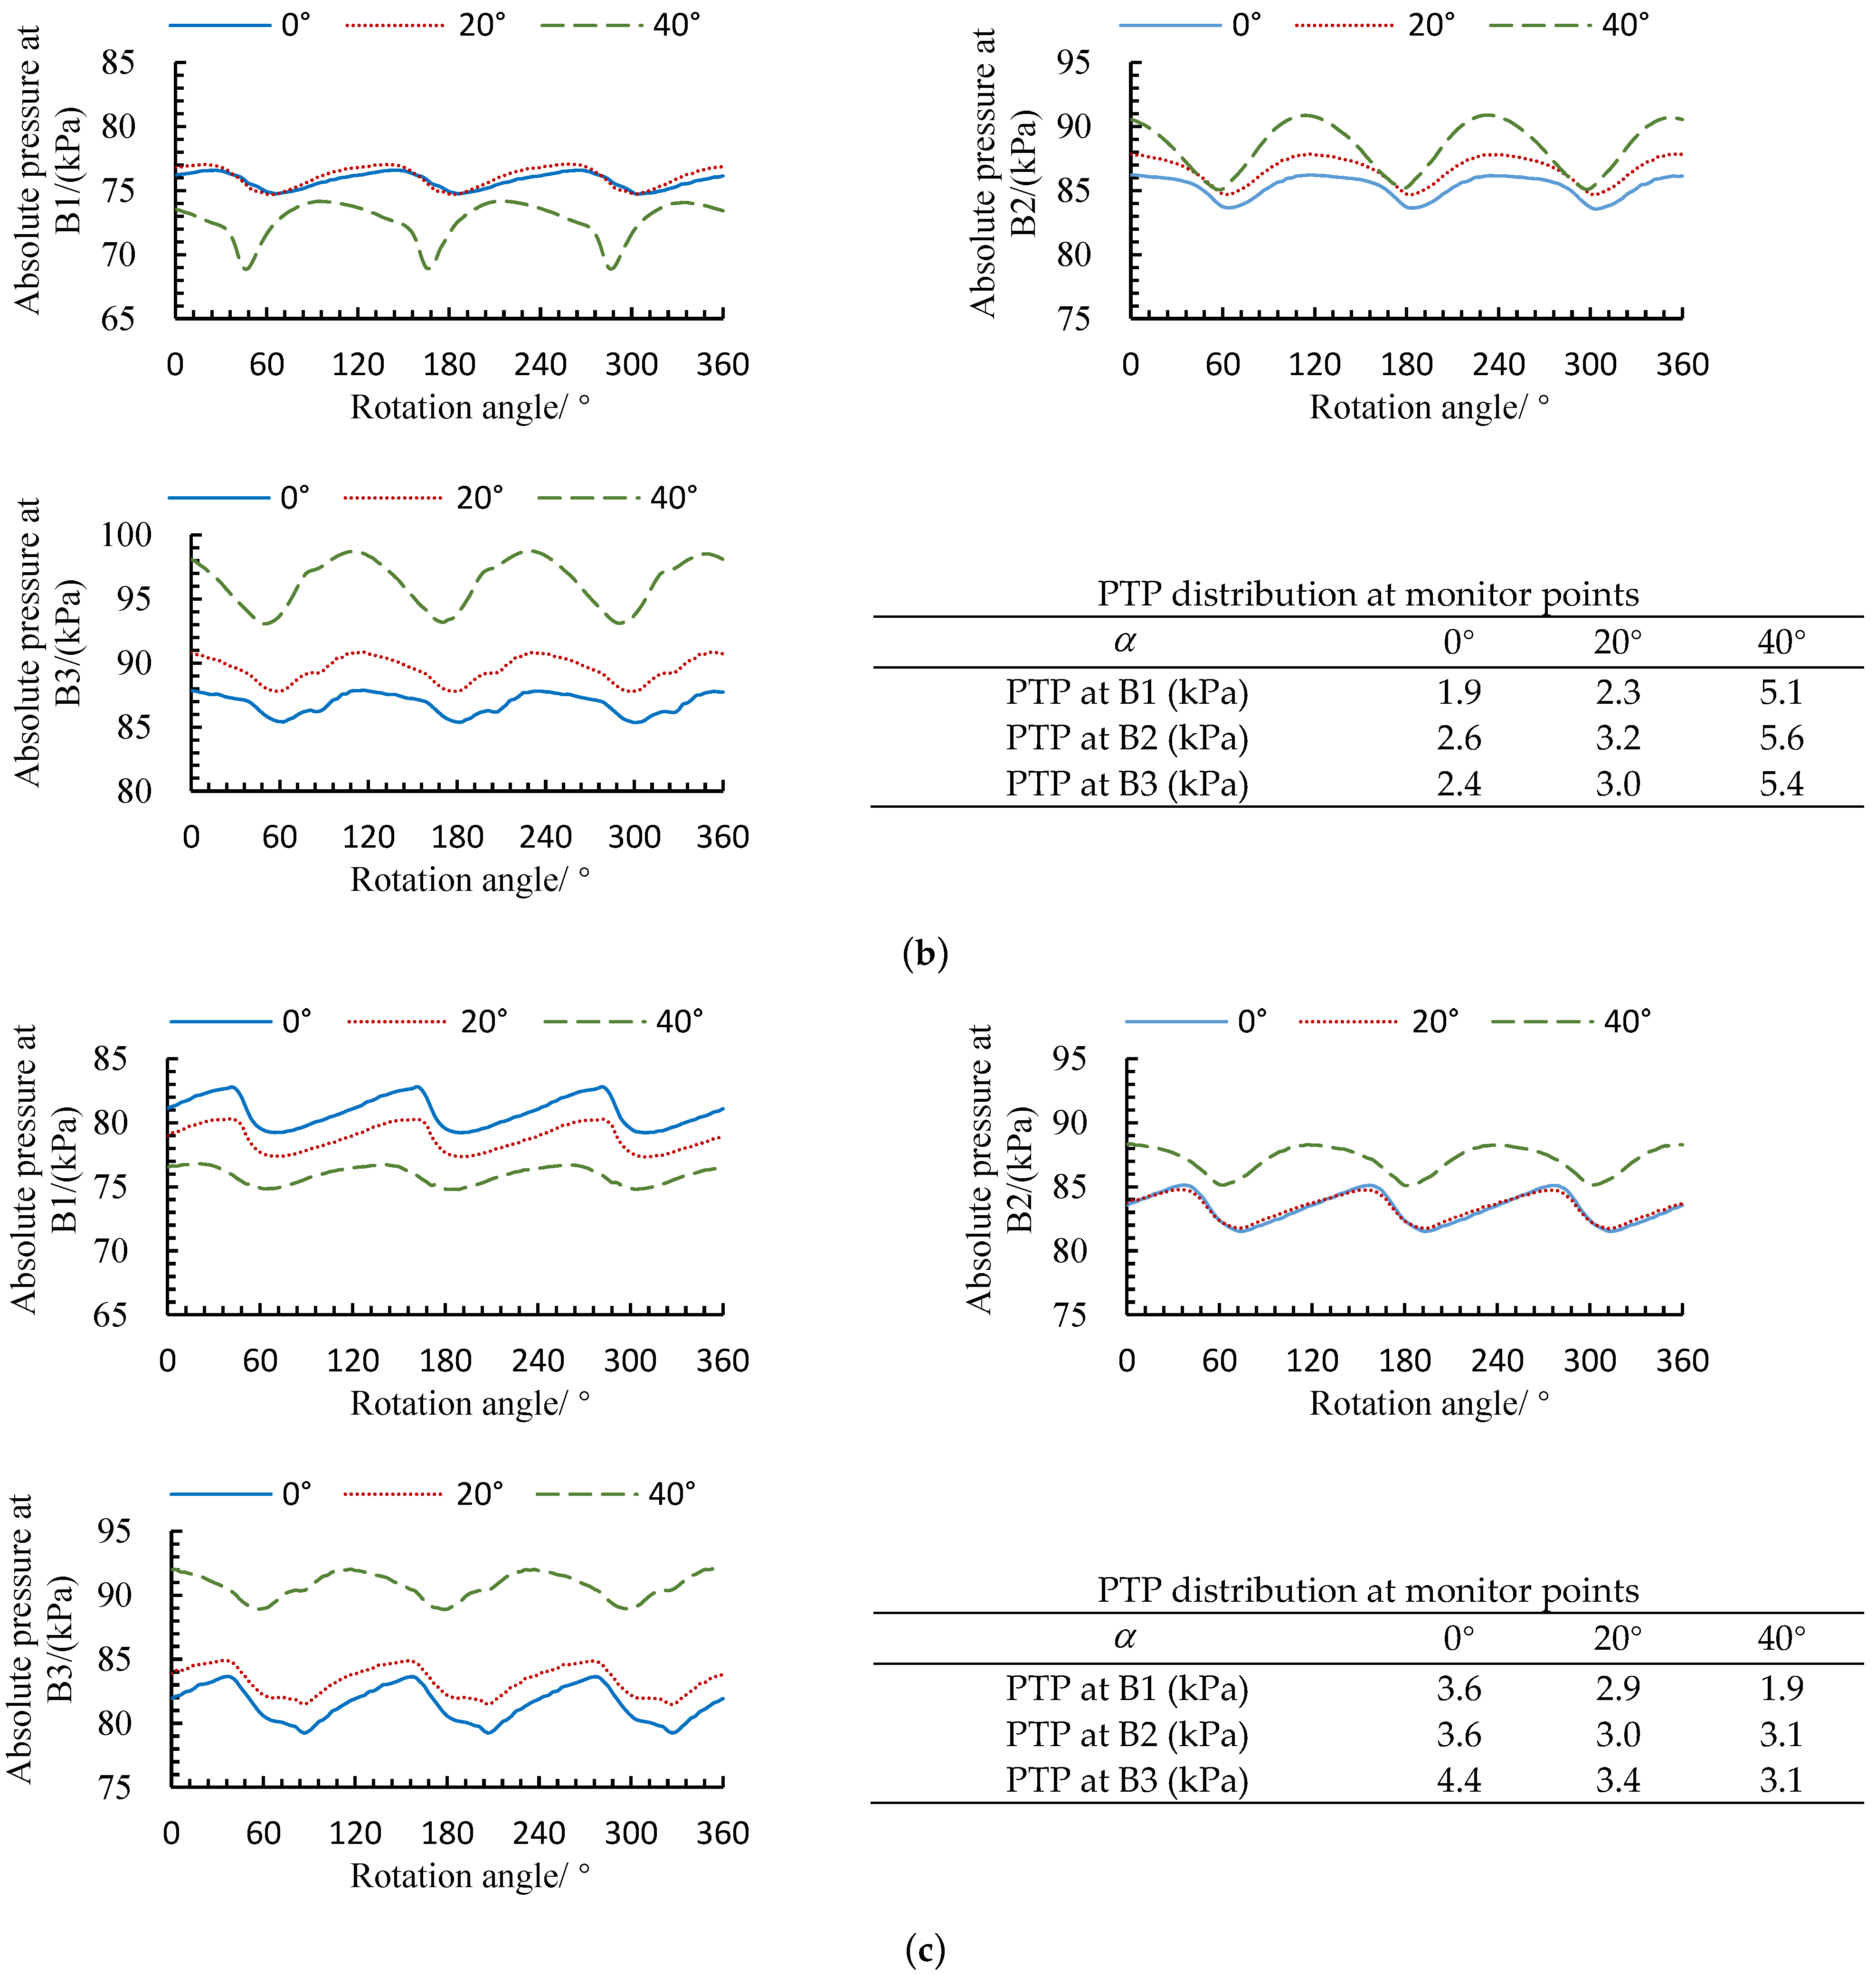
3.3. Spatial Distribution of PPI under Different Inlet Deflection Angles

In this work, the standard deviation of pressure for the last 120 time-steps was employed as the evaluation parameter of PPI. The PPI and radial coefficient span can be calculated as follows:
Span = R R h R s R h
P P I = 1 m 1 i = 1 m ( p i p ¯ ) 2
p ¯ = 1 m i = 1 m p i
where R h , R s , and R depict the hub radius, shroud radius, and calculated radius, respectively. p i and m are the instantaneous pressure at the ith time step and time step number, respectively.
Figure 8 and Figure 9 show the radial distribution of the PPI in the impeller inlet and the axial velocity distribution in the vertical mid-section of the impeller, respectively. The flow field inside the impeller is a rotating domain and the high PPI at the impeller inlet is mainly caused by the impact effect of the axial inflow on the pre-rotation. Thus, firstly, the PPI increases with the increase in the flow rate owing to the improvement of the axial velocity. Secondly, the pre-rotation intensity at the impeller inlet gradually increases along the direction from the hub to the shroud, which leads to the PPI near the shroud being significantly higher than that near the hub. Thirdly, under a small flow rate, the influence of α on the PPI is not significant due to the fact that the impact effect of the axial inflow on pre-rotation is weak caused by the low axial velocity. However, under the design and large flow rate, the PPI decreases with the increase in α due to the decline in the axial velocity of the inflow.
Figure 10 shows the radial diction of the PPI at the inlet of the guide vanes under three α values. The impact effect of the trailing edge jet (TEJ) of the impeller blade on the guide vanes is the major effect of the high PPI at the inlet of the guide vanes. Under small design flow rates, the angle of the TEJ with α = 0° is more than the inlet angle of the guide vanes. An improvement of α will further increase the angle and impact effect of the TEJ, which leads to the elevation of the PPI. Under a large flow rate, the angle of the TEJ with α = 0° is less than the inlet angle of the guide vanes, and an increase in α can reduce the angle between the TEJ and the leading edge of the guide vanes. Consequently, the PPI with α = 0 is higher than that with α = 20° and 40° due to the decreased impact effect.
Figure 11 is the radial distribution of the PPI at the outlet of the guide vanes under three α values. The PPI at the outlet of the guide vanes is significantly lower than that at the inlet of the impeller and guide vanes. This indicates that the guide vanes have converted most of the unstable rotational kinetic energy inside the impeller outflow into stable static energy. However, the PPI with α = 0° is higher than that with α = 20° and 40° under 0.8Qdes, but the PPI with α = 40° is higher than that with α = 0° and 20° under 1.0Qdes and 1.2Qdes. To explain this phenomenon, the velocity distributions at the vertical mid-sections of the guide vanes and outlet channels are depicted in Figure 12. Under a small flow rate, the outflow angle of the guide vanes is too large and a large area of backflow occurs at the outlet of the guide vane, which collides with the main flow and generates a strong pressure pulsation. With the increase in α , the impact position of the main flow and the backflow gradually moves away from the guide vanes outlet, and thus the impact effect on guide vanes outlet decreases. Under the design flow rate, the impact effect of the backflow at the outlet of the guide vane improves as the α increases due to the enlargement of the impact area between the backflow and the main flow. Under a large flow rate, the flow pattern at the outlet of the guide vane is relatively stable under α = 0°. However, the large-area backflow occurs near guide vanes outlet under α = 40°.
Figure 13 describes the distribution of the PPI in the passage of the impeller and guide vanes with three α . Under a small flow rate, the large area of the high PPI is mainly located near the inlet and the suction side of the guide vanes due to the impact of the main flow on the flow separation vortex boundary. As the α increases, the flow separation area at the suction side increases and forms a barrier effect on the inlet and the area of the high PPI near the inlet rises with the increase in α in the guide vanes. For the design flow rate, an area with a high PPI is found near the impeller outlet from the mixing between the TEJ and main flow and there is no large area of high PPI in the guide vane caused by the stable flow regime. However, as the α increases, the TEJ angle will also change naturally, and a flow separation can be found near the suction side in the guide vane. Therefore, the high PPI area in the vicinity of the suction side of the guide vanes rises with the increase in α . Under a large flow rate, the axial-flow rate is high and a stable flow pattern can clearly be observed inside the guide vane. Thus, the high PPI is found to be mainly located at the outlet and suction side of the impeller. When α increased to 40°, the area of high PPI in the vicinity of the outlet and suction side of the blade declined sharply due to the drop in the axial velocity, and some high PPIs in the vicinity of the suction surface of the guide vanes occurred induced by flow separation.

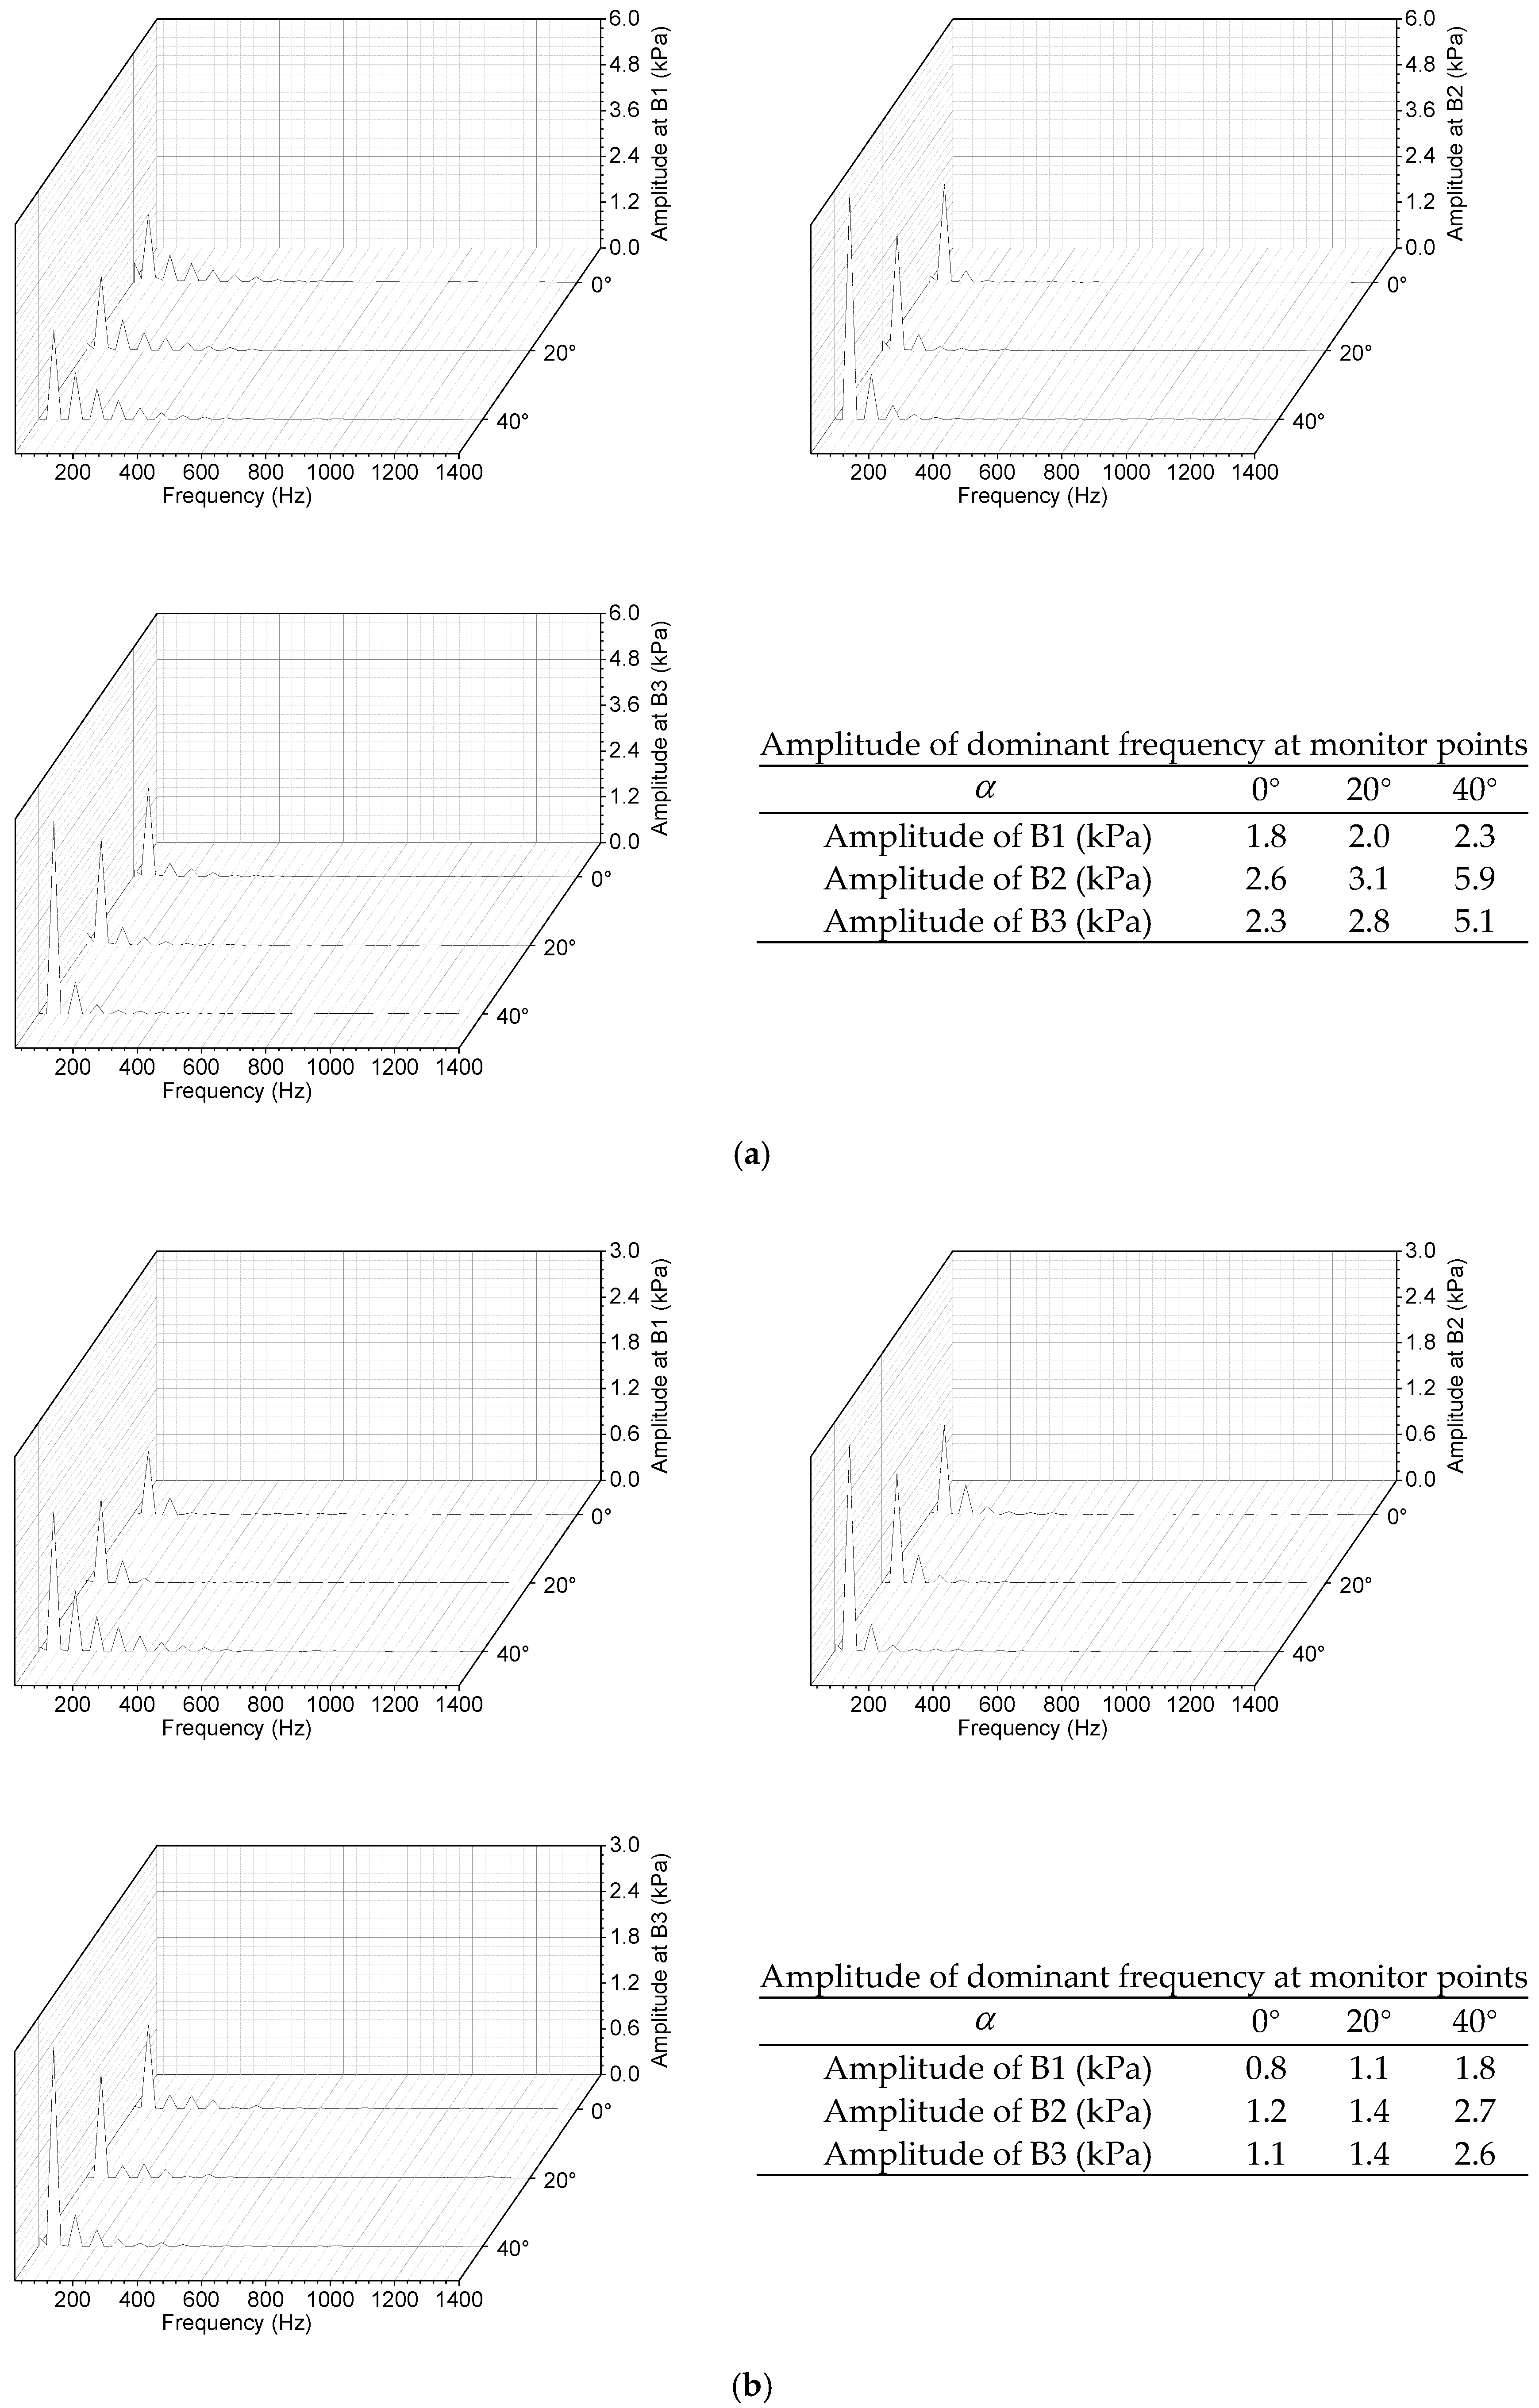
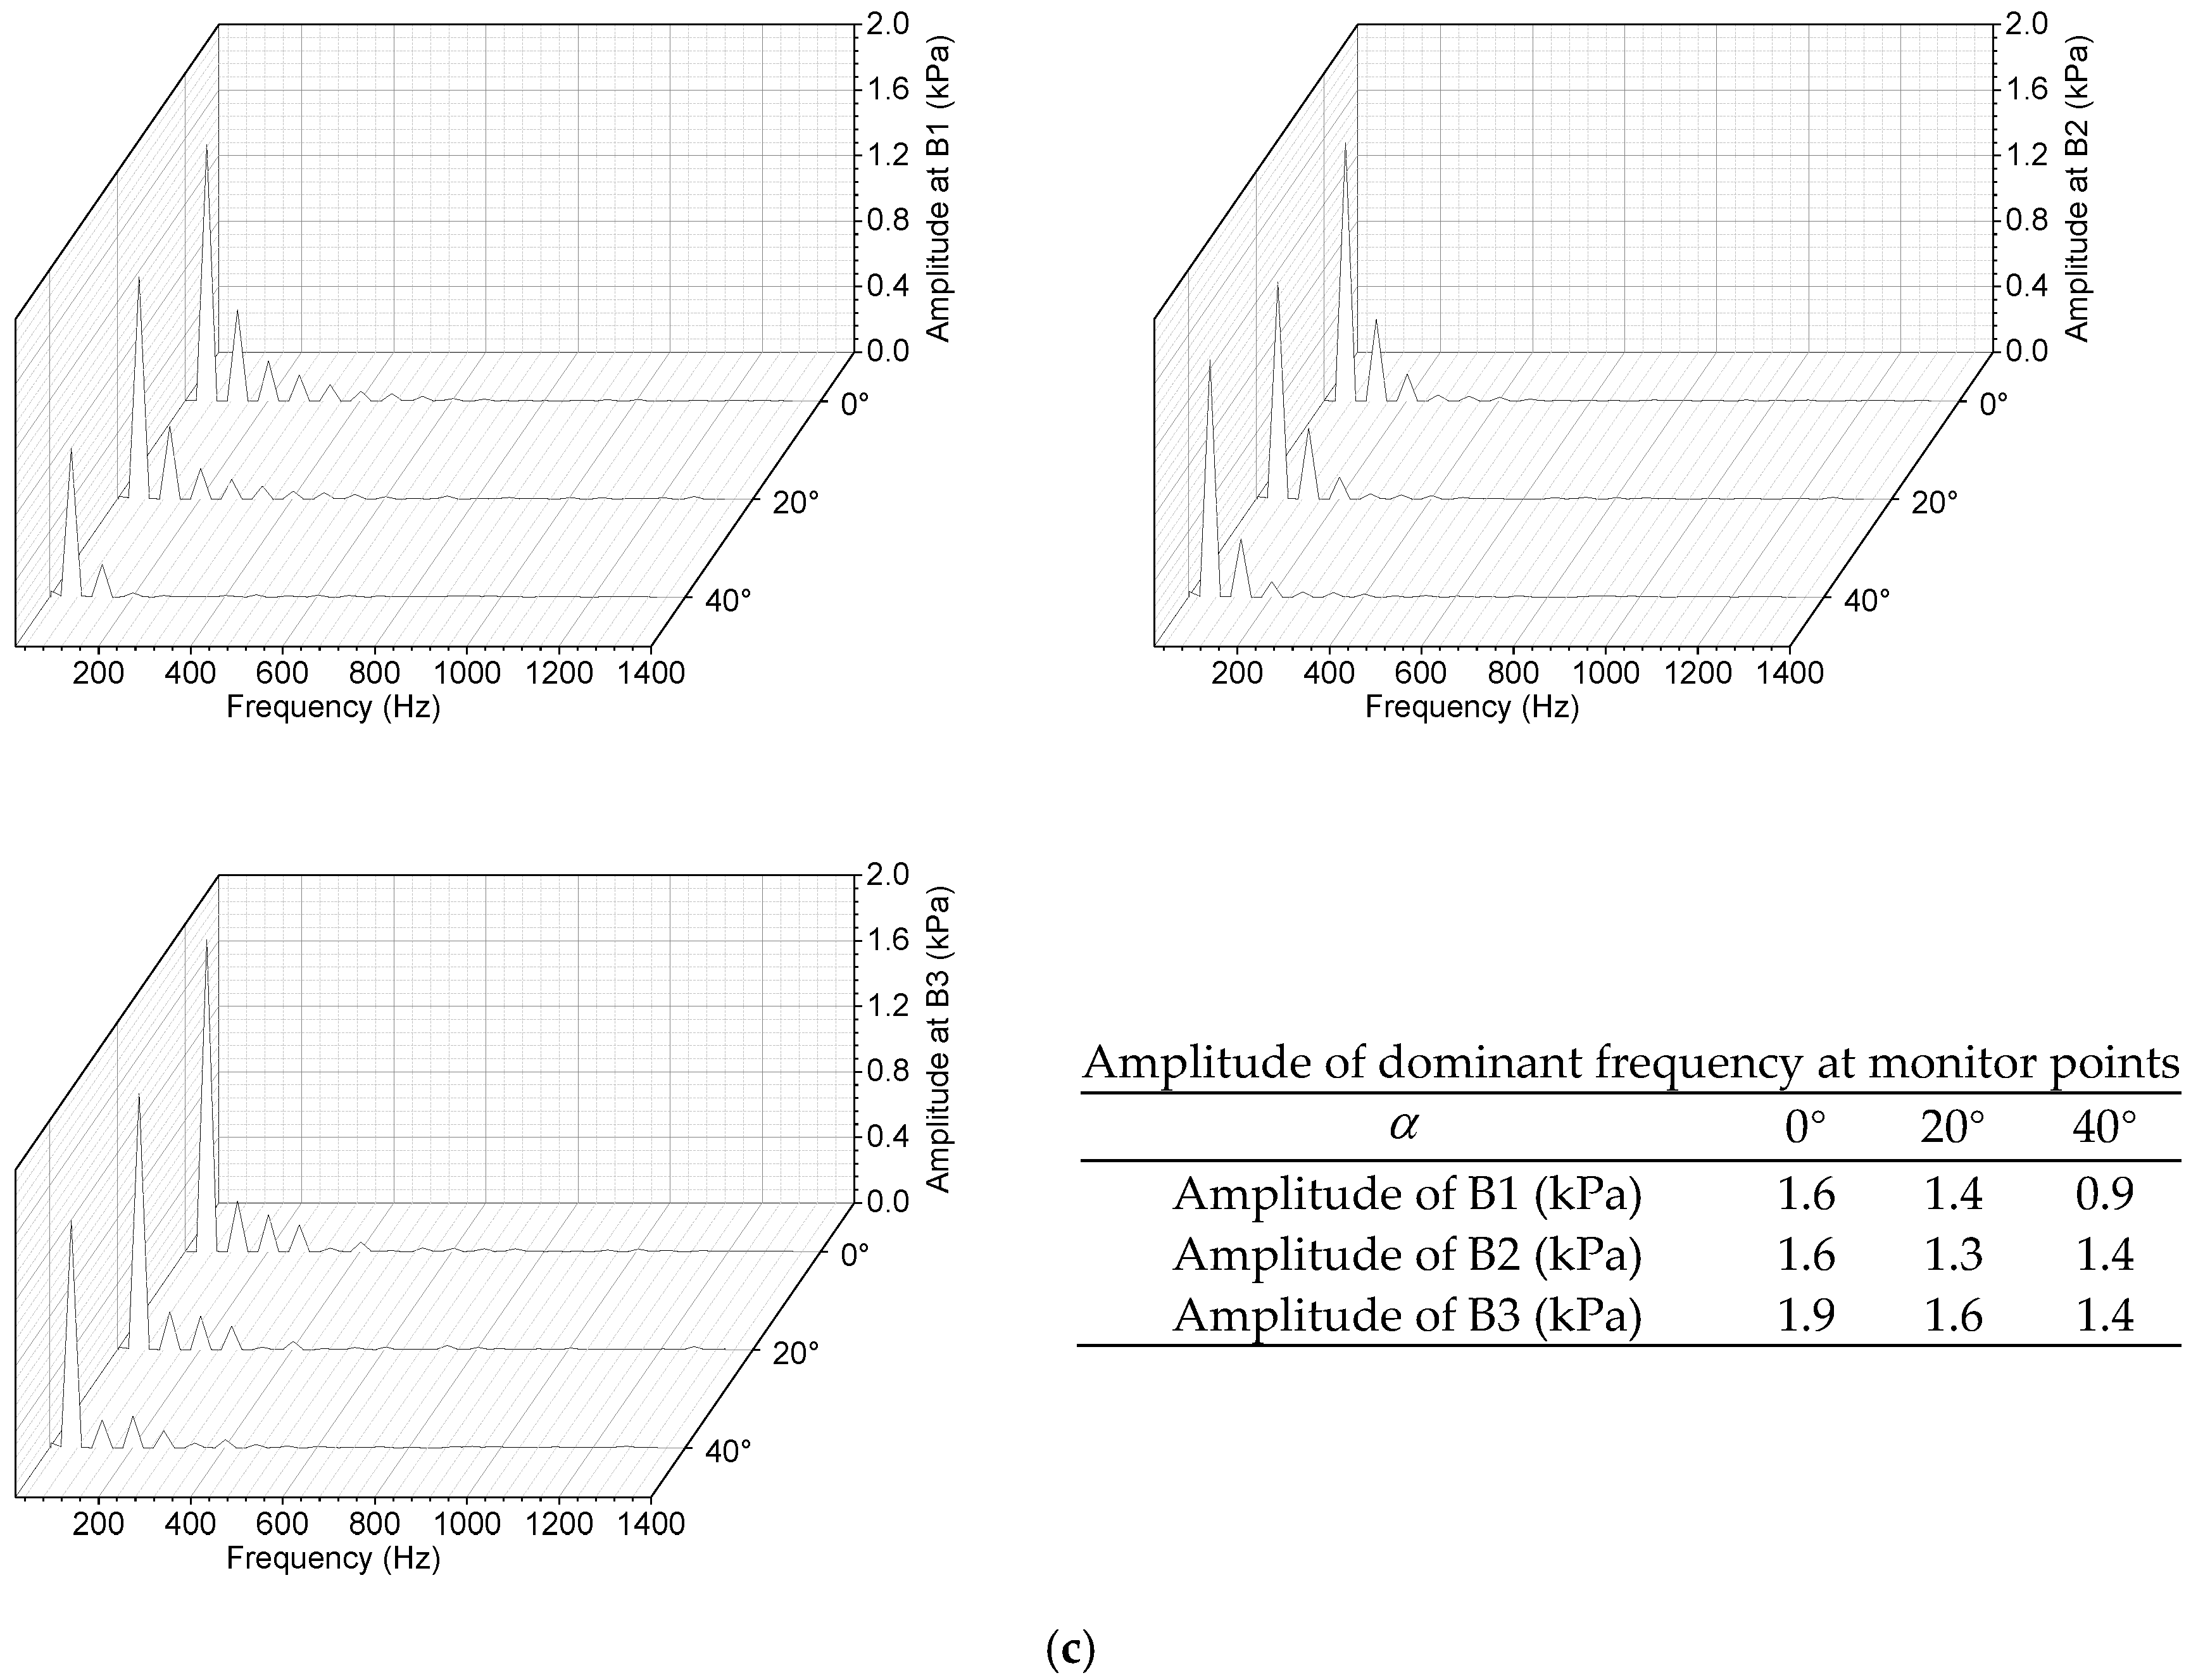
3.4. Transmission Characteristics of Unsteady Pressure Signal under Three Inlet Deflection Angles

According to Figure 8, Figure 10, and Figure 11, the PPI at the rotor–stator interface (inlet channel–impeller and impeller–guide vanes interface) is more obvious than at the stator interface (guide vanes–outlet channel). To analyze the transmission characteristics of the pressure fields upstream and downstream in the rotating domain, six monitoring points were arranged at the inlet of the impeller and guide vane interface as presented in Figure 14. The results of the time-domain analysis of the unsteady pressure signal at A1–A3 with three α are shown in Figure 15. For the last rotation period, there are three peak points and three valley points (three pulsation periods). In addition, peak-to-peak (PTP) of the pressure pulsation equals the difference between the maximum and the minimum in the last pulsation period. Since the impact of axial inflow on the pre-rotation is key to the pressure pulsation amplitude near the impeller inlet, the PTP in the vicinity of the shroud seems higher than that near the hub due to the fact that the pre-rotation intensity increases along the radial coefficient. The improvement of α can aggravate the pre-rotation caused by the increase in the circumferential velocity, and thus the PTP with α = 40° is higher than that with α = 0°. The relative growth rates of PTP at A3 are 63.3%, 35.3%, and 21.7% under 0.8Qdes, 1.0Qdes, and 1.2Qdes, respectively.
Figure 16 presents the time-domain analysis of the unsteady pressure signal at B1–B3 with three α . Similar to the unsteady pressure signal at A1–A3, three peak points and three valley points can be found in the last rotating period. The PTP of the pressure pulsation in the vicinity of the shroud seems also higher than that near the hub. Under 0.8Qdes and 1.0Qdes, the angle of the TEJ with α = 0° is more than the inlet angle of the guide vanes, and the improvement of α will further increase the jet angle and impeller–guide vanes’ interference effect. Compared with α = 0°, the growth rate of α = 40°at A2 is 132.8% under 0.8Qdes and that at A1 is 174.8% under 1.0Qdes. Under 1.2Qdes, the angle of the TEJ with α = 0° is less than the inlet angle of the guide vanes, and the improvement of α decreases the angle between the jet angle and inlet angle, which leads to the reduction in the impeller–guide vane interference effect. Compared with α = 0°, the decrease in α = 40° at A1 is 46.9%.
In this work, the fast Fourier function with a rectangular window was used to transform the pressure signal from the time-domain to the frequency-domain. Figure 17 shows the frequency-domain analysis of the unsteady pressure signal at A1–A3 with three α . The dominant frequency of the pressure signal at A1–A3 means the blade-passing frequency (BPF), and the dominant frequency amplitude of A3 is found to be the highest. The frequency with high amplitude is mainly the harmonic frequency of the BPF and it is within 0–400 Hz. In addition, an improvement in the α cannot change the dominant frequency of the pressure signal but can promote the dominant frequency amplitude of the pressure signal. This indicates that the frequency characteristics of the flow field inside the impeller for upstream transmission are mainly determined by the pre-rotation caused by the blade rotation, and the intensity of the pre-rotation is promoted with an increase in α . Under 0.8Qdes and 1.2Qdes, compared with α = 0°, the relative growth rates in α = 40° at A3 are 43.9% and 34.8%, respectively. Under 1.0Qdes, the increase at A1 is 28.2%.
Figure 18 depicts the frequency-domain analysis of the unsteady pressure signal at B1–B3 with three α . The BPF is still the main frequency of the pressure signal on B1–B3, which is not influenced by the inflow deflection angle. The high amplitude frequencies can be found within 0–400 Hz and are mainly the harmonic frequencies of the BPF. Moreover, the increase in α has a significant effect on the dominant frequency amplitude of the pressure signal on B1–B3 due to the change in the TEJ angle of the blade. Under 0.8Qdes and 1.0Qdes, the dominant frequency amplitude with α = 40° is more than α = 0° resulting from the increased angle between the TEJ and inlet angle of the guide vanes caused by the improvement of α . The maximum relative growth rates are 126.9% (at B2) and 136.4% (at B3) under 0.8Qdes and 1.0Qdes, respectively. However, the dominant frequency amplitude with α = 40° is less than α = 0° due to the fact that the angle between the TEJ and inlet angle of the guide vanes decreased with the promotion of α . The maximum relative drop rate can be obtained at B1 and it is 43.8%.

4. Conclusions

In this work, the unsteady calculation in a vertical axial-flow pump device with three α was employed, and the standard deviation of the pressure pulsation was applied as an evaluation parameter to describe the spatial distribution of the PPI. To investigate the transmission features of the pressure signal, the PTP and fast Fourier function were applied to perform the time- and frequency-domain analyses. The main conclusions are as follows:
(1) As the α increases, the BEP of the vertical axial-flow pump device shifts to a large flow and the head and shaft power gradually increase. This indicates that an increase in α will increase the force on the impeller and further hazard fatigue failure.
(2) The PPI at the impeller inlet with α = 0° is higher than α = 40°, resulting from the increased α that reduces the impact effects and axial velocity of the impeller inflow. In addition, an increase in α magnifies the angle between the TEJ and inlet angle of the guide vanes under 0.8Qdes and 1.0Qdes, but it diminishes the angle between the TEJ and inlet angle of the guide vanes under 1.2Qdes. Thus, the PPI at the inlet of the guide vanes with α = 40° is higher than that with α = 0° under Q = 0.8Qdes and 1.0Qdes, while the PPT with α = 40° is lower than that with α = 0° under Q = 1.2Qdes.
(3) Under 0.8Qdes and 1.0Qdes, the PTP near the inlet of the impeller and guide vanes increases with the improvement of α . Under 1.2Qdes, the PTP with α = 40° is lower and higher than that with α = 0° near the inlet of guide vanes and impeller, respectively. Furthermore, the dominant frequency is the blade-passing frequency under three α and the amplitude of the dominant frequency rises with an increase in α under 0.8Qdes and 1.0Qdes.
This work can provide a theoretical reference for fault diagnosis and the optimization design of a vertical axial-flow pump device.

Author Contributions

Conceptualization, F.M. and Z.Q.; Data curation, F.M. and Y.L.; Methodology, F.M.; Formal analysis, F.M. and Z.Q.; Funding acquisition, F.M.; Resources, F.M. and Y.L.; Investigation, F.M.; Software, F.M. and J.C.; Project administration, Y.L.; Supervision, Z.Q.; Validation, F.M. and Z.Q.; Visualization, F.M.; Writing—original draft, F.M.; Writing—review and editing, J.C. and Z.Q. All authors have read and agreed to the published version of the manuscript.

Funding

This research was funded by ranking the top of the list for science and technology projects in Yunnan Province (Grant No. 202204BW050001).

Data Availability Statement

Not applicable.

Conflicts of Interest

The authors declare that there are no conflict of interest.

Nomenclature

H (m)Head of vertical axial-flow pump device
P out (Pa)Total pressure in the outlet
P in (Pa)Total pressure in the inlet
ρ (kg/m3)Water density
g (m/s2)Gravity acceleration
α (°)Inlet deflection angle
SpanRadial coefficient
Rs (mm)Shroud radius
Rh (mm)Hub radius
CFDComputational Fluid Dynamics
PPIPressure pulsation intensity
PTPPeak to peak
BPFBlade-passing frequency
BEPBest efficiency point
TEJTrailing edge jet

References

  1. Zhang, X.; Tang, F.; Liu, C.; Shi, L.; Liu, H.; Sun, Z.; Hu, W. Numerical Simulation of Transient Characteristics of Start-Up Transition Process of Large Vertical Siphon Axial Flow Pump Station. Front. Energy Res. 2021, 9, 382. [Google Scholar] [CrossRef]
  2. Yang, F.; Li, Z.; Hu, W.; Liu, C.; Jiang, D.; Liu, D.; Nasr, A. Analysis of flow loss characteristics of slanted axial-flow pump device based on entropy production theory. R. Soc. Open Sci. 2022, 9, 211208. [Google Scholar] [CrossRef] [PubMed]
  3. Liu, C. Technical Innovation and Development Analysis of Axial Flow Pump System. Trans. Chin. Soc. Agric. Mach. 2015, 46, 49–59. [Google Scholar]
  4. Liu, X.; Xu, F.; Cheng, L.; Pan, W.; Jiao, W. Stress Characteristics Analysis of Vertical Bi-Directional Flow Channel Axial Pump Blades Based on Fluid–Structure Coupling. Machines 2022, 10, 368. [Google Scholar] [CrossRef]
  5. Duan, X.; Tang, F.; Duan, W.; Zhou, W.; Shi, L. Experimental investigation on the correlation of pressure pulsation and vibration of axial flow pump. Adv. Mech. Eng. 2019, 11, 1687814019889473. [Google Scholar] [CrossRef]
  6. Li, Y.; Lu, R.; Zhang, H.; Deng, F.; Yuan, J. Improvement of intake structures in a two-way pumping station with experimental analysis. Appl. Sci. 2020, 10, 6842. [Google Scholar] [CrossRef]
  7. Yang, F.; Zhao, H.; Liu, C.; He, J.; Tang, F. Experiment and Analysis on Outlet Flow Pattern and Pressure Fluctuation in Inlet Conduit of Vertical Axial-flow Pumping System. Trans. Chin. Soc. Agric. Mach. 2017, 48, 141–146. [Google Scholar]
  8. Gao, B.; Zhang, N.; Li, Z.; Ni, D.; Yang, M. Influence of the blade trailing edge profile on the performance and unsteady pressure pulsations in a low specific speed centrifugal pump. J. Fluids Eng. 2016, 138, 051106. [Google Scholar] [CrossRef]
  9. Cui, B.; Li, W.; Zhang, C. Effect of blade trailing edge cutting angle on unstable flow and vibration in a centrifugal pump. J. Fluids Eng. 2020, 142, 101203. [Google Scholar] [CrossRef]
  10. Zhang, H.; Zang, J.; Zhang, D.; Shi, W.; Shen, J. Analysis of the Formation Mechanism of Secondary Tip Leakage Vortex (S-TLV) in an Axial Flow Pump. Machines 2022, 10, 41. [Google Scholar] [CrossRef]
  11. Yang, F.; Chang, P.; Hu, W.; Mao, B.; Liu, C.; Li, Z. Numerical study on pressure pulsation in a slanted axial-flow pump device under partial loads. Processes 2021, 9, 1404. [Google Scholar] [CrossRef]
  12. Yang, F.; Chang, P.; Li, C.; Shen, Q.; Qian, J.; Li, J. Numerical analysis of pressure pulsation in vertical submersible axial flow pump device under bidirectional operation. AIP Adv. 2022, 12, 025107. [Google Scholar] [CrossRef]
  13. Yang, F.; Chang, P.; Yuan, Y.; Li, N.; Xie, R.; Zhang, X.; Lin, Z. Analysis of Timing Effect on Flow Field and Pulsation in Vertical Axial Flow Pump. J. Mar. Sci. Eng. 2021, 9, 1429. [Google Scholar] [CrossRef]
  14. Shi, L.; Zhu, J.; Yuan, Y.; Tang, F.; Huang, P.; Zhang, W.; Liu, H.; Zhang, X. Numerical simulation and experiment of the effects of blade angle deviation on the hydraulic characteristics and pressure pulsation of an axial-flow pump. Shock Vib. 2021, 2021, 6673002. [Google Scholar] [CrossRef]
  15. Zhang, L.; Wang, S.; Yin, G.; Guan, C. Fluid–structure interaction analysis of fluid pressure pulsation and structural vibration features in a vertical axial pump. Adv. Mech. Eng. 2019, 11, 1687814019828585. [Google Scholar] [CrossRef]
  16. Shi, L.; Yuan, Y.; Jiao, H.; Tang, F.; Cheng, L.; Yang, F.; Jin, Y.; Zhu, J. Numerical investigation and experiment on pressure pulsation characteristics in a full tubular pump. Renew. Energy 2021, 163, 987–1000. [Google Scholar] [CrossRef]
  17. Shen, J.; Xu, F.; Cheng, L.; Pan, W.; Ge, Y.; Li, J.; Zhang, J. Simulation of Internal Flow Characteristics of an Axial Flow Pump with Variable Tip Clearance. Water 2022, 14, 1652. [Google Scholar] [CrossRef]
  18. Yang, F.; Li, Z.; Yuan, Y.; Liu, C.; Zhang, Y.; Jin, Y. Numerical and experimental investigation of internal flow characteristics and pressure fluctuation in inlet passage of axial flow pump under deflection flow conditions. Energies 2021, 14, 5245. [Google Scholar] [CrossRef]
  19. Long, Y.; Wang, D.; Yin, J.; Hu, Y.; Ran, H. Numerical investigation on the unsteady characteristics of reactor coolant pumps with non-uniform inflow. Nucl. Eng. Des. 2017, 320, 65–76. [Google Scholar]
  20. Zhou, Q.; Li, H.; Pei, L.; Zhong, Z. Research on non-uniform pressure pulsation of the diffuser in a nuclear reactor coolant pump. Nucl. Eng. Technol. 2021, 53, 1020–1028. [Google Scholar] [CrossRef]
  21. Xu, R.; Long, Y.; Wang, D. Effects of rotating speed on the unsteady pressure pulsation of reactor coolant pumps with steam-generator simulator. Nucl. Eng. Des. 2018, 333, 25–44. [Google Scholar] [CrossRef]
  22. Luo, X.; Ye, W.; Huang, R.; Wang, Y.; Du, T.; Huang, C. Numerical investigations of the energy performance and pressure fluctuations for a waterjet pump in a non-uniform inflow. Renew. Energy 2020, 153, 1042–1052. [Google Scholar] [CrossRef]
  23. Huang, R.; Wang, Y.; Du, T.; Luo, X.; Zhang, W.; Dai, Y. Mechanism analyses of the unsteady vortical cavitation behaviors for a waterjet pump in a non-uniform inflow. Ocean. Eng. 2021, 233, 108798. [Google Scholar] [CrossRef]
Figure 1. Geometrical structure of vertical axial-flow pump device.
Machines 10 00855 g001
Figure 3. Yplus distribution on the wall of the impeller and guide vanes.
Machines 10 00855 g003
Figure 4. Schematic diagram of the inlet deflection angle.
Machines 10 00855 g004
Figure 5. Test bench structure. (1 Low-Pressure Tank; 2 High-Pressure Tank 1; 3 High-Pressure Tank 2; 4 Circulating Pump; 5 Valve).
Machines 10 00855 g005
Figure 6. Comparison of (a) efficiency and (b) head between the CFD and the test under uniform inflow. ( α = 0°).
Machines 10 00855 g006
Figure 7. The (a) efficiency, (b) head, and (c) shaft power curves with flow rates under three α values.
Machines 10 00855 g007
Figure 8. The PPI at the impeller inlet with three α values under (a) 0.8Qdes, (b) 1.0Qdes, and (c) 1.2Qdes.
Machines 10 00855 g008
Figure 9. The axial velocity at the vertical mid-section of the impeller with three α values under (a) 0.8Qdes, (b) 1.0Qdes, and (c) 1.2Qdes.
Machines 10 00855 g009aMachines 10 00855 g009b
Figure 10. The PPI at the inlet of guide vanes with three α values under (a) 0.8Qdes, (b) 1.0Qdes, and (c) 1.2Qdes.
Machines 10 00855 g010
Figure 11. The PPI at the outlet of guide vanes with three α values under (a) 0.8Qdes, (b) 1.0Qdes, and (c) 1.2Qdes.
Machines 10 00855 g011
Figure 12. The velocity at the vertical mid-section of the guide vanes and elbow outflow channel with three α values under (a) 0.8Qdes, (b) 1.0Qdes, and (c) 1.2Qdes.
Machines 10 00855 g012aMachines 10 00855 g012b
Figure 13. The PPI distribution in the passage of the impeller and guide vanes with three α values under (a) 0.8Qdes, (b) 1.0Qdes, and (c) 1.2Qdes.
Machines 10 00855 g013
Figure 14. The position of monitor points near the inlet of the impeller and guide vanes.
Machines 10 00855 g014
Figure 15. Time-domain analysis of different monitor points (A1, A2 and A3) with three α values near the impeller inlet under (a) 0.8Qdes, (b) 1.0Qdes, and (c) 1.2Qdes.
Machines 10 00855 g015aMachines 10 00855 g015b
Figure 16. Time-domain analysis of different monitor points (B1, B2 and B3) with three α values near the inlet of the guide vanes under (a) 0.8Qdes, (b) 1.0Qdes, and (c) 1.2Qdes.
Machines 10 00855 g016aMachines 10 00855 g016b
Figure 17. Frequency-domain analysis of different monitor points (A1, A2 and A3) with three α values near the impeller inlet under (a) 0.8Qdes, (b) 1.0Qdes, and (c) 1.2Qdes.
Machines 10 00855 g017aMachines 10 00855 g017b
Figure 18. Frequency-domain analysis of different monitor points (B1, B2 and B3) with three α values near the inlet of the guide vanes under (a) 0.8Qdes, (b) 1.0Qdes, and (c) 1.2Qdes.
Machines 10 00855 g018aMachines 10 00855 g018b
Table 1. Mesh independence analysis.
CaseNg of
Inlet Channel
Ng of
Impeller
Ng of
Guide Vanes
Ng of
Outlet Channel
Total NgHdesError Deviation
Grid 1725,010813,522521,532748,2122,808,2764.393 m−2.16%
Grid 2986,9101,346,832848,952937,2724,119,9664.398 m−1.58%
Grid 31,332,6351,965,9421,226,3521,150,6325,675,5614.449 m0.0%
Grid 41,613,4602,462,5321,773,4861,379,3927,228,8704.454 m0.28%
Publisher’s Note: MDPI stays neutral with regard to jurisdictional claims in published maps and institutional affiliations.

