Article

Impact of Condensation on the System Performance of a Fuel Cell Turbocharger

Institute of Jet Propulsion and Turbomachinery, Technische Universität Braunschweig, Hermann-Blenk-Straße 37, 38108 Braunschweig, Germany
*
Author to whom correspondence should be addressed.
Machines 2022, 10(1), 59; https://doi.org/10.3390/machines10010059
Submission received: 31 October 2021 / Revised: 16 December 2021 / Accepted: 24 December 2021 / Published: 13 January 2022
(This article belongs to the Special Issue High Speed Air Compressor for a Fuel Cell System for Use in a Vehicle)

Abstract

:
A mobile fuel cell systems power output can be increased by pressure amplification using an electric turbocharger. These devices are subject to frequent transient manoeuvres due to a multitude of load changes during the mission in automotive applications. In this paper, the authors describe a simulation approach for an electric turbocharger, considering the impact of moist air and condensation within the cathode gas supply system. Therefore, two simulation approaches are used: an iterative simulation method and one based on a set of ordinary differential equations. Additional information is included from turbine performance maps taking into account condensation using Euler–Lagrange CFD simulations, which are presented. The iterative calculation approach is well suited to show the impact of condensation and moist air on the steady state thermodynamic cycle and yields a significant shift of the steady state operating line towards the surge line. It is shown that a substantial risk of surge occurs during transient deceleration manoeuvres triggered by a load step.

1. Introduction

With the increasing demand for CO 2 neutral automotive transportation, electric drive concepts are moving into the focus of development. Battery-powered systems are conceivable for short distances and are already in production. For heavy commercial vehicles, however, the battery mass is substantially higher than for personal mobility, so that alternative energy storage systems are needed for electric drive systems. Fuel cells are a promising power source for the mobility sector, especially for land and air transportation. With the help of hydrogen from green sources, proton exchange membrane fuel cells (PEMFCs) can be operated in mobile machines without direct emission of CO 2 . Currently, this is the most common type used in this field of application [1,2]. In particular, rapid refuelling due to the drop-in character of hydrogen in contrast to long charging times is one of the greatest advantages of these systems. As the stack is currently still cost-intensive, there is great interest in reducing the stack size by increasing efficiency. One possibility is to operate the system at higher pressures [3]. The anode gas supply is usually achieved by pressurised tanks. On the cathode side, a compressor is required. At the same time, the compression of the cathode gas (ambient air) consumes the largest amount of parasitic power in the whole system [4,5]. The main task of the cathode gas supply is to provide preconditioned cathode gas that has a temperature, humidity and pressure set according to the operation of the stack [6]. In addition, the correct humidification is important for the transient response of the stack and to decrease the voltage drop when a load step is applied [7]. The optimum operating pressure for a PEMFC, according to Pischinger [8], is around two bar due to advantages of water management. Furthermore, the compressor is the main device to control the system and ensure adequate stoichiometry [9]. The predominant architecture of the air compression device is a radial compressor, which is well known from turbochargers in internal combustion engines [10]. The pressure potential is extracted from the exhaust gas in a radial turbine downstream of the fuel cell stack. Since the power generated by the turbine only provides about 30% of the power required for the compressor, an electric motor is complementing the machine. The expansion of humid air in the turbine leads to the homogeneous nucleation of droplets and, subsequently, growth by condensation. The underlying mechanisms have been investigated by Wittmann et al. [11]. It was found that a significant impact on the turbine efficiency and mass flow rate occurs, which needs to be taken into account when analysing the overall system performance.
The electric turbocharger investigated in this study is used in an automotive fuel cell system. Since the volumes throughout the gas flow path have capacities which are much larger than those of the turbomachinery components, special attention has to be paid to the transient performance of the system. In an earlier study by Lück et al. [12], a multiphysical simulation setup based on the Pseudo Bond Graph notation for such a system has been presented and will be used throughout the present work. It is based on the ordinary differential equations for the conservation of mass, momentum and energy, resembling a reduced order model (ROM) within the ASTOR (Aircraft Engine Simulation for Transient Operation Research) framework. The transient performance simulation capabilities have been discussed for a generic acceleration–deceleration manoeuvre. Hence, the advantages of using the Pseudo Bond Graph approach for the description of multiphysical systems were shown. Especially, obtaining clear instructions on how to connect various physical domains involved are a significant benefit over other approaches. The additional information about condensation in the radial turbine is obtained from CFD simulations based on the discrete phase model in ANSYS Fluent. The model and its validation as well as the aerodynamic and thermodynamic phenomena that occur are described in detail by Wittmann et al. [11,13]. The generated performance maps are then included in the performance model from [12]. Since the release of latent heat due to condensation has to be accounted for, an extended set of performance map data is used compared to conventional dry air simulations. To consider condensation downstream of the turbine before reaching thermodynamic equilibrium, the model is extended by the approach of Young [14] for condensation in parallel ducts.
The overall dynamics of a fuel cell system including compressor are presented in Pukrushpan [9]. However, this work does not include a turbine. Further investigations of the operating range of radial turbomachinery in a fuel cell system have been conducted by [15]. The authors point out the importance of a broad turbomachinery operating range due to the range of fuel cell operating points that occur during operation. Additionally, the impact of the moist air flow at the stack outlet compared to dry air flow has not been elaborated yet. Since most turbomachinery components are designed with dry air in mind, this will be of importance. In the work of Roumeliotis et al. [16], a turbocharger was operated using moist air in the turbine section. However, the operating conditions differ greatly from those in a high-performance fuel cell system. Especially, the significantly reduced temperature has a major effect on water-to-air ratio, which makes a comparison difficult. In a recent study, Filsinger et al. [17] have gathered a broad overview on the topic of electric turbochargers in fuel cell vehicles. As they point out, a turbine is essential for efficiency improvement since it would provide up to 40% of the required compressor power. While the issue of droplet erosion due to condensation is pointed out, the impact of moist air in the gas path is not elaborated. This underlines the necessity for further work in this field.
This study aims to highlight the steady state and transient performance of an electric turbocharger for mobile fuel cell applications. A flow without the addition of water vapour and moist air in the gas path downstream of the fuel cell are both investigated. For this purpose, cycle calculations are carried out to show the effect of moisture on the machine performance at steady state operation. In particular, effects occur due to the shift of the turbine operating points, which have feedback on the compressor and the overall system. Due to large capacitive storage volumes of air between the turbomachinery components, critical operating points have to be avoided during transient operation. Hence, transient simulations during acceleration and deceleration manoeuvre are executed to show how the system responds to dynamic manoeuvres such as acceleration and deceleration from idle to maximum continuous rpm.

2. Materials and Methods

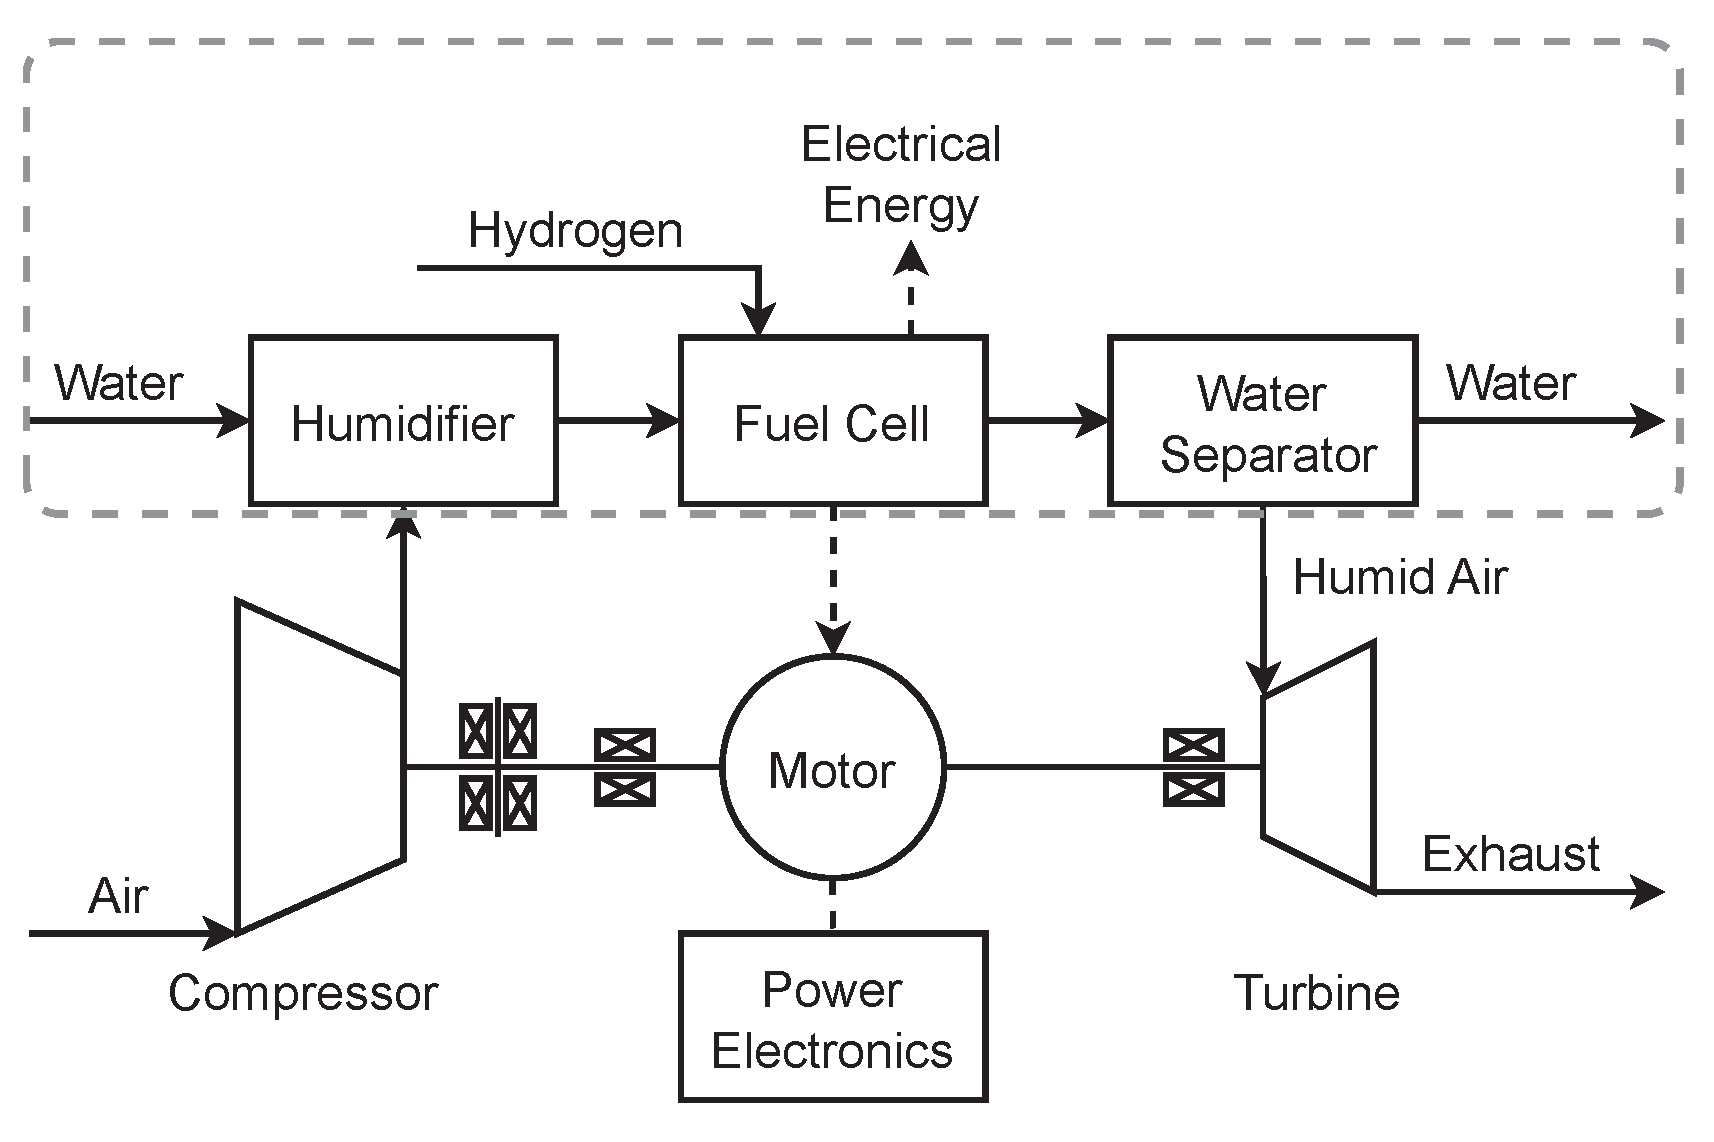
2.1. Electric Turbocharger System

The system architecture of the electric turbocharger is depicted in Figure 1. It consists of a radial compressor and a turbine connected by a shaft, where the electric motor’s permanent magnet is located. The gas path downstream of the compressor consists of a fuel cell stack combined with a humidifier upstream and water separator downstream. In the scope of this work, the latter two are simplified and not modelled in detail. Hence, they are included in the domain of the fuel cell stack (dashed box). Downstream of the fuel cell stack, ideal separation of liquid water is assumed. This is important for the logical link between system model and boundary conditions for condensation modelling within the turbine described in Section 2.2. Downstream of the turbine, thermodynamic equilibrium is not necessarily reached. Therefore, condensation occurs in the exhaust duct (see Section 2.5). Additional components in the system are axial and herringbone radial gasdynamic bearings. Further information about this type of axial bearing can be found in [18]. Without accounting for hydrogen consumption, the efficiency can be quantified as η = P t u r b o c h a r g e r / P o u t .

2.2. Non-Equilibrium Simulation of the Turbine

Sufficiently detailed measurement data covering the condensation in the turbine are not yet available. Hence, an accurate method to calculate the effect of the condensation is required. Analytical approaches, such as those of Roumeliotis and Mathioudakis [16], rely on the assumption of equilibrium conditions for calculating the condensation of moist air. However, for the turbine studied here, this assumption leads to significant errors. The expansion in the turbine first leads to supersaturation of the water vapour and then to nucleation and condensation of water droplets. Multiphase simulations taking into account these non-equilibrium conditions were performed to overcome the equilibrium limitation. The turbine performance maps generated by the simulations of Wittmann et al. are used for this study [19]. The basis of these simulations is the classical theory of nucleation and condensation. Its application to wet steam was reviewed by Bakhtar et al. [20]. The classical homogenous nucleation rate J C L per unit volume of mixture is given by
J C L = q c ρ g 2 ρ f 2 σ g π m m 3 exp 4 π σ g 3 k B T g r c r i t 2 with r c r i t = 2 σ g ρ f R T g ln ( S )
where S = p / p s is the supersaturation ratio and r c r i t the radius of a critical droplet in unstable equilibrium with the surrounding vapour. A common correction of this theory was proposed by Kantrowitz [21]. His non-isothermal correction (NISO) overcomes the assumption of equal vapour and droplet temperatures and typically reduces the nucleation rate for water by a factor of 50–100. It takes the form
J C L , N I S O = J C L 1 + ϕ with ϕ = 2 γ 1 γ + 1 h f g R T g h f g R T g 1 2
The subsequent growth of droplets after nucleation is commonly modelled with semi-empirical growth laws. Reviews on this topic have been carried out by Young [22] and, more recently, by Lamanna [23]. In principle, the droplet growth process consists of the net flux of vapour molecules towards the droplet and the concurrent latent heat flux away from the droplet. For this study, the growth law by Young [22], which is an advancement of the growth law by Gyarmathy [24], is used. It is based on the assumption that the droplet growth is limited by the possible heat flux away from the droplet. Young’s growth law takes the form
d r d t = λ g 1 r c r i t r Δ T ρ f h f g r 1 1 + 2 β K n + 3.78 1 ν K n P r
with the quantity ν
ν = R T s h f g α 0.5 2 q c 2 q c γ + 1 2 γ c p g T s h f g
The above presented theory was implemented into the discrete phase model (DPM) of ANSYS Fluent 19.2, as described by Wittmann et al. [25]. Such a Euler–Lagrange approach offers a resolution of the full droplet spectrum and the calculation of individual droplet parcel trajectories. Thus, the droplet phase is represented with high fidelity. The principle of the implementation is as follows: Nucleation was activated in each cell where a minimal nucleation rate of J 1 × 14 / ( m 3   s ) is exceeded. This threshold guarantees a feasible runtime while maintaining a high accuracy of the solution. All droplets from one cell were grouped in one droplet parcel and formed a DPM particle. The droplet parcels were initialised with the critical radius and a velocity equal to the vapour phase. The trajectory calculation took into account the drag law of Schiller–Naumann [26] with the Cunningham correction for submicron particles [27], as well as the thermophoretic force due to the temperature gradient acting on the droplet. All simulations used the SST-k- ω turbulence model with viscous heating and were performed as steady state. The equations of The International Association for the Properties of Water and Steam (IAPWS) [28] were used for all water properties necessary for the calculation of nucleation and condensation. The Euler phase itself was modelled with ideal gas equations. Humid air was assumed to be an ideal gas mixture of nitrogen, oxygen and water vapour. The described model was thoroughly validated with supersonic nozzle flows provided by the International Wet Steam Modeling Project (IWSMP). A good agreement with experimental data could be achieved with the classical nucleation theory, NISO correction, Young’s growth law with α = 13 , β = 0 and the surface tension of planar water scaled by a factor of 1.05 [11]. The same parameter set was used in this study.
Wittmann et al. have discussed the application of the above described Euler–Lagrange model to the turbine studied here earlier [13]. Figure 2a shows the computational domain representing the turbine. According to Hellstrom and Fuchs [29], in case of a vaned stator, the volute has only a limited influence on the rotor flow. The majority of nucleation and condensation takes place in the rotor. Thus, the volute was omitted, which also significantly reduces the required computing power. The stator channel is slightly widened for an exact stage matching of three stator vanes and four rotor blades. At the mass flow inlet (green), the inflow is assumed with zero incidence to the stator vanes. The average static pressure at the outlet (red) is set to 1030 h Pa and held constant for all simulations. A frozen rotor interface (orange) was chosen between stator and rotor because discrete particles cannot be transferred over a mixing plane. The structured mesh consists of 492 k nodes for each stator vane and 756 k nodes for each rotor blade. The Euler–Lagrange approach leads to an increase in computational cost by a factor of five. All data presented in this study were evaluated at the inlet and at the analysis plane P (blue). The mass flow was varied at the inlet to obtain different operating points. The total temperature at the inlet and static pressure at the outlet were kept constant for all simulations while the inlet mass flow was varied along a throttle line of constant speed. The mass fraction of oxygen at the inlet was reduced to 11.3% due to the fuel cell reaction. The relative humidity of the inflow is specified by the mass fraction of water vapour at the turbine inlet.
Wittmann et al. described three main effects of condensation on turbine performance [13]. These are a significant increase in the turbine outflow temperature, a thermal throttling of the turbine and a reduced efficiency. These effects are visualised in Figure 3. The graphs show the results of simulations with the constant design mass flow and changing relative humidity φ at the inlet. On the left (Figure 3a), the static temperature T s and subcooling Δ T s u b c o o l i n g right after the turbine rotor (blue plane in Figure 2) are plotted against the relative humidity at the inlet. All values shown are obtained by mass flow averaging. The subcooling temperature is defined as the difference between current static temperature to saturation temperature given the current water-to-air ratio x and static pressure p s :
Δ T s u b c o o l i n g = T s a t ( p s , x ) T s
At 60% or less relative humidity, the subcooling is not sufficient for nucleation and condensation. Thus, the outflow temperature is constant. At higher humidities, the onset of nucleations enables a strong condensation. Thus, substantial condensation enthalpy is released, the static temperature rises sharply and the subcooling is reduced. The dash-dotted line shows additional information for an analytic calculation assuming thermodynamic equilibrium at the turbine exit with the same pressure ratio and mass flow based on [14]. The deviations at inlet and outlet static temperature result from the assumption of purely axial flow in the analytic model while a three-dimensional flow is present in the CFD. Thus, the static temperature is reduced by the additional three-dimensional velocity components. In Figure 3b, the total-to-static pressure ratio π t s and efficiency η t s are plotted against the relative humidity φ at the turbine inlet. The rising pressure ratio between 0% and 60% relative humidity is an effect of the changing gas mixture. The local minimum at 80% relative humidity is due to the strong condensation directly in the analysis plane. The strong pressure ratio increase at relative humidities of 80% and above shows the strong thermal throttling due to condensation. At the same time, the overall efficiency drops significantly due to condensation losses. A detailed discussion of these phenomena can be found in [13,19]. With the same methods as discussed above, a wide range of turbine operating points were calculated.
According to [30], humidity significantly influences performance maps of turbomachinery components such as compressors and turbines.
AGARD [30] conducts proofs that flows with gasses of different isentropic exponent γ cannot achieve full flow similarity. Nevertheless, correction approaches can substantially improve representation of the resulting performance maps. Correction methods based on the guidelines presented in Method A of [30] are used to correct the influence of gas mixture on isentropic exponent γ and gas constant R. The rotational speed of the turbine N T is corrected as follows:
N T , C o r r = N T T t · γ d r y · R d r y γ · R
The turbine mass flow m ˙ T correction is as follows:
m ˙ T , C o r r = m ˙ T T t p t · γ d r y · R γ · R d r y
The Euler work w u , T of the turbine is calculated as follows
w u , T = c p · T t , i n π t t γ 1 γ 1 .
and has to be corrected:
w u , T , C o r r = w u , γ d r y · R d r y γ · R .
The corrected total-to-total turbine pressure ratio can then be calculated vice versa using Equation (8).
The impact is shown in Table 1 for an isolated operating point at 86.7% absolute rotational speed. Figure 2b shows the resulting turbine performance map based on data from [19] which is used for this study. In comparison to [19], where rotational speeds shown were only related to absolute speed, the relevant correction was performed in the present work. Additionally, all corrected rotational speeds shown herein are of the same value, which results in varying absolute speeds, which is evident from Equation (6) with changes in R and γ . Therefore, additional speedlines have been interpolated using the algorithm presented in [31]. From the representation of the performance map, the impact of humidity correction is clearly visible since speedlines in the low-pressure region collapse onto each other. Only regions with strong condensation above 80% humidity split up, as seen in the highlighted region of the performance map. Based on these results, it becomes clear that models with a higher level of detail than an equilibrium approach (such as Euler–Lagrange CFD) are necessary in operating areas with large degrees of subcooling. Only in this way can the thermodynamic effects be accurately reproduced. As a relevant influence on system performance, this applies in particular to efficiency and pressure ratio.

2.3. Steady State Cycle Calculation

The steady state performance calculation (short: STACY, steady state cycle calculator) is based on the established engine matching scheme [32], which is also used in [33,34,35]. The thermodynamic gas properties are calculated at each component of the machine, such as compressor, fuel cell stack or turbine, where changes of state occur. These changes of state can either be driven by turbomachinery components, total pressure losses in connecting ducts or released condensation enthalpy. The calculation process enforces conservation of mass as well as conservation of energy. In combination with the related total pressure ratios π t t and isentropic efficiencies η i s obtained from performance maps, all required information can be processed. To account for real gas information, gas tables are used to model the state changes using tabulated data of temperature T, enthalpy function values h, entropy function values s, specific isobaric heat capacity c p and gas constant R [36].
The majority of the non-turbomachinery components used in the electric turbocharger are referred to as ducts. They are used to apply total pressure losses or supply and deduct sealing air. Each of these elements is considered adiabatic with respect to the environment. Compressor performance map data are available either from measurements or based on CFD simulations. The mass flow m ˙ C is corrected for Mach-number similarities from ambient deviations from standard conditions according to [34]:
m ˙ C , C o r r = m ˙ C · Θ δ with Θ = T t , i n 288.15 K and δ = p t , i n 101,325 Pa
Subsequently, the compressor rotational speed N C is corrected using the total temperature ratio Θ :
N C , C o r r = N C Θ = N C 288.15 K T t
As an auxiliary coordinate, the G L -lines are used [37]. The concept partly follows the concept of β -lines in GasTurb [33], which splits the performance map’s throttle lines by using second degree polynomials that enclose the throttle lines from stability limit to choke. NPSS [35], on the other hand, uses R-lines as an auxiliary coordinate, which are not predefined by polynomials. The G L -lines are created by numerically determining the length of each throttle line and splitting it up into equidistant segments which are referred to as the breakpoints of the G L -lines. In contrast to β -lines, a higher degree of flexibility is provided since the shape is not bound to a polynomial description. As the aforementioned concepts, the G L -lines run from 0 to 1. By knowing the current corrected rotational speed N C o r r as well as the value of G L , the pressure ratio π , mass flow m ˙ and efficiency η can be read from the map. The map resolution is chosen according to [31], with 50 interpolated characteristics and a mass flow axis resolution of 1000 points.
For further evaluation of performance, the surge margin S M at a given operating point (OP) and constant angular velocity ω is defined as
S M = π S L π O P · m ˙ O P m ˙ S L 1 ω = c o n s t .
The relative change in surge margin compared to dry flow at constant ω can be calculated as follows
Δ r e l S M = S M O P S M d r y S M d r y ω = c o n s t . .
The thermodynamic cycle calculation for a given target variable Φ is executed by iterating rotational speed N and G L -lines in compressor and turbine. A target variable can be, e.g., rotational speed N, compressor pressure ratio π C , turbine pressure ratio π T , mass flow m ˙ , electric motor power P e l or net power output P o u t . According to the Newton–Raphson algorithm, the thermodynamic cycle of the electric turbocharger is evaluated as described in, e.g., [34]. By defining three error equations f i , the conservation of mass can be enforced and the corresponding values of the error equations are calculated. The first equation to be fulfilled is the deviation from the current value of Φ i t to the target value Φ t a r g e t :
f 1 = Φ t a r g e t Φ i t .
To obtain mass flow continuity, the pressure required for achieving the current mass flow through a non-choked nozzle p t , N Z , r e q u i r e d at the exhaust outlet is compared to the current pressure at the exhaust outlet nozzle p t , N Z , i t :
f 2 = p t , N Z , r e q u i r e d p t , N Z , i t
Ultimately, the mass flow through the turbine m ˙ T , which is iterated through the G L -lines, has to match the current compressor mass flow m ˙ C :
f 3 = m ˙ C m ˙ T .
In comparison to a gas turbine, where the entire power for the compressor is generated by the turbine due to the added combustor enthalpy, the electric turbocharger is mainly driven by its electric motor. The motor is able to supply almost constant torque τ e l throughout the entire operating range. During steady state operation, only 50% of the maximum available torque is used. The conservation of energy at the shaft is realised by adding the remaining torque to the shaft that results from the power imbalance of compressor, turbine, bearing and friction losses:
τ e l = τ C + τ T + τ b e a r i n g + τ f r i c
Hence, the thermodynamic cycle of the machine is computed in each iteration until the error equations f 1 to f 3 converge to a satisfactory residual error ϵ < 10 10 .

2.4. Fuel Cell Stack Model

For further evaluation of the electric turbocharger in a system environment, a fuel cell stack performance map is calculated. In the work of Schröter et al. [2], measurement data and a modelled performance map for an automotive stack with a design power output of P f c , D e s = 64 kW of the type NM5 by ElringKlinger was presented. The data are used in the present work to calibrate a generic fuel cell model based on the basic electrochemical equations [38] for a stoichiometry of λ = 1.7 according to [2]. For the present study, a performance map is calculated at an operating temperature of 346.15 K, which is 7 K below [2]. Furthermore, the stack’s design power is doubled to P f c , D e s = 128 kW at the same design point pressure p f c , D e s = 2.5 bar to account for the use case present in this study. The latter is achieved by doubling the reactive area of the stack while the cell number is kept constant at 300. A model in the same power range would be, e.g., the ElringKlinger NM12 automotive fuel cell stack. The normalised stack performance map is shown in Figure 4a. The map is limited towards increasing mass flows by truncating the power curves at their maximum. The importance of increasing the pressure to increase performance can be illustrated by means of the characteristic diagram. If the stack was operated at ambient pressure (with a blower that can provide sufficiently large mass flows), only 77% of the nominal power output would be possible. By increasing the pressure accordingly, the maximum possible power output is increased to nominal power. When operating above the design pressure, a further 2% increase in maximum power can be achieved for the maximum pressure shown in this study.

2.5. Condensation Modelling in Reduced Order Models

As explained in detail in Section 2.2, the process of condensation within a radial turbine is a highly nonlinear and non-equilibrium phenomenon. Therefore, simulations are necessary to determine the amount of condensation within the turbine that can significantly influence performance. On the other hand, an equilibrium approach cannot deliver the required information on subcooling, throttling effects and outlet temperature. Subsequently, information is read from the CFD performance maps which have been calculated for four levels of water-to-air ratios x. Each x corresponds to a relative humidity of φ = 0 % , 60 % , 80 % and 110 % at the design point of the turbine, related to corresponding turbine inlet pressure and temperature.
Initially, to obtain information within the STACY and ASTOR simulation, additional information has to be read out from the performance map. The required additional information set includes total-to-static temperature ratio τ t s , total-to-static pressure ratio π t s and subcooling temperature Δ T s u b c o o l i n g . While the first two are needed to represent the water vapour states, the latter provides the degree of non-equilibrium.
Since the classic definition of the total-to-total efficiency is not valid in flow with condensation due to the high outlet temperature, an alternative definition of the efficiency is used:
η t t = τ T · n 2 π 60 w u , T · m ˙ T
Additionally, the Euler work of the turbine corrected for efficiency and including condensation effects is calculated as follows, according to:
w u , C o r r = c p · T t , i n π t t η t t κ 1 κ 1 .
Comprehensive information about condensation is then included in steady state and transient simulations by either including the enthalpy rise related to the release of latent heat in the conservation of energy (0-junction) and the deduction of condensed mass flow in the conservation of momentum and mass. It is presumed that mass flow of condensed water is deducted from the flow after the station where condensation occurs.

Condensation to Equilibrium Conditions

The flow in the exhaust part downstream of the turbine is in a non-equilibrium state for most operating points with condensing flow (see Figure 3a). Subsequently, a model for condensation in an adiabatic flow is implemented according to Young [14]. Therein, the equations for conservation of mass, energy and momentum are solved iteratively. Required input for the calculation are cross-sectional areas, inlet pressure, inlet temperature, water-to-air ratio and mass flow. Since an iterative solution of the system of equations is computationally costly and slow, the equations are solved beforehand for the entire feasible operating range. During simulation runtime, the solution is read out from lookup tables. These additional data include temperature as well as water-to-air ratio and total pressure loss due to condensation. As described previously for additional information in the turbine, these data are used to alter the system of equations in the solution process.
The model, referred to as the analytical model in Section 2.2, is also used as an example to calculate the equilibrium state behind the turbine based on known pressure gradient and mass flow from the CFD calculation. Figure 3a emphasises that results are valid based on the comparison at 0% and 110% relative humidity. For the former, no condensation occurs. The deviation results from the assumption of purely axial flow in the analytical model, whereas the flow inside the turbine is three dimensional. The additional velocity components account for the discrepancy. At the point of maximum relative humidity, subcooling has reached nearly 0 K and the flow is almost at equilibrium. The analytical model is able to predict this state. Again, the deviation occurs due to the non-axial flow in the turbine. In summary, this model provides accurate results and is integrated into the system model.

2.6. Transient Performance Simulation

ASTOR is a simulation code based on the system theory approach of the Pseudo Bond Graph Theory. A model of the electric turbocharger has been presented in [12]. The approach makes the simulation of multiphysical systems feasible by coupling various physical domains typically encountered within turbomachinery. Therefore, to predict the performance, the three equations of motion are solved for conservation of mass:
d ρ s , o u t d t = m ˙ i n m ˙ o u t V C o m p o n e n t = ρ s , i n A i n v i n ρ s , o u t A o u t v o u t V C o m p o n e n t .
Conservation of energy:
d h t , o u t + p t , o u t ρ s , o u t d t = m ˙ i n h t , G T m ˙ o u t h t , o u t V C o m p o n e n t .
In addition, the conservation of momentum:
d m ˙ i n d t = p s , i n A i n p s , o u t A o u t + p s , i n + p s , o u t 2 A o u t A i n + m ˙ i n v i n m ˙ o u t v o u t V C o m p o n e n t .
Ultimately, the change of rotational speed of the shaft can be calculated, accounting for bearing friction resistance τ b e a r i n g and shaft moment of inertia J:
d ω d t = τ t u r b τ c o m p τ b e a r i n g + τ e l J .
Finally, the system can be transformed into a vector notation. The efforts e (e.g., temperature, pressure or torque) as well as the flows f (e.g., rotational speed, flow of energy, mass flow) can be written in a vector x ¯ ( t ) . The coefficient matrices A and B provide information on geometry, materials and volume dynamics. In addition, information on pressure ratio π and efficiency η from the performance maps is stored. The external disturbance u ¯ in this case is the input signal of electric motor torque which is added within matrix B. The pressure ratios are boundary conditions dependent on mass flow and rotational speed. They are obtained from the performance maps without the need for auxiliary G L -lines. The system of ordinary differential equations (ODE) in ASTOR is discretised using a one-dimensional forward finite differences scheme for the discretisation of the flow path of the turbomachinery components. Subsequently, an initial value problem has to be solved. The system is implemented in MATLAB/Simulink and is solved by a variable-step variable-order solver [39]. A study on the impact of the solver on the results has been performed and no significant discrepancies between variable order solver (ode15s), second/third (ode23) and fourth/fifth (ode45) order solvers were detected. Simulation performance is ca. 4 s wall clock time per 1 s of simulation time.
The initial solution for the ODE system is obtained with the calculation approach from Section 2.3. The two systems differ fundamentally in the way they are solved. While STACY iteratively calculates a cycle, ASTOR calculates changes in the variables from Equations (20)–(23). Therefore, a mismatch between both systems can occur. For a single spool turbojet, this was discussed in [37]. The same study has been conducted and is presented in Figure 5 for mean deviation and maximum spread averaged over the entire operating range in steps of 5000 rpm. The mean deviation at steady state operation for total pressure, mass flow and temperature during dry operation is well below 0.01%. When condensation occurs, total temperature deviations increase slightly. The total pressure and mass flows are more affected but still below 0.1%. The impact of condensation is amplified even with small changes of the operating point since saturation variables are extremely sensitive to changes in pressure and temperature. Hence, temperature and mass flow show a greater impact because of the release of latent heat and changes in condensed water mass flow. Overall, the deviations account for average changes smaller than 0.05 g/s, 0.15 K and 20 Pa. The impact on the relevant performance parameter surge margin S M is averaged below 0.04%, on average. In a nutshell, the results show very good agreement of ASTOR results in comparison to the established steady state cycle calculation method and are used as the baseline validation for ASTOR in the following investigations. Performance simulations are conducted without a control loop. For the simulations (Section 3.3), electric motor torque τ e l is increased by a step input from initial to final torque.

3. Results and Discussion

3.1. Steady State Operation

In this section, an overview of the steady state performance of the electric turbocharger considering dry as well as moist air flow in the cathode gas path of the fuel cell power system is presented. The thermodynamic cycle of the machine was calculated for four water-to-air ratios x f c , which are shown in the legend of Figure 6a. Each water-to-air ratio represents a relative humidity of 0%, 60%, 80% or 110% at the turbine inlet at design conditions. Steady state operating lines have been calculated over the operating range from a net system power output of 19.5% to 82.8% of the stack design power output P f c , D e s . This accounts for stack power output reduced by losses in the turbomachinery components as well as electrical losses in the electric motor and power electronics. In the compressor performance map in Figure 6a, the operating lines are shifted towards the stability limit when water-to-air ratio behind the fuel cell stack increases. The effect increases significantly when rotational speed is increased. On the one hand, the shift of the operating lines results from the significant shift of the turbine operating point due to the change of gas properties. This leads to the turbine operating at lower corrected speeds N c o r r , T and hence reduced mass flow rates. This can be seen in Figure 6b. On the other hand, condensation occurs in the upper speed range and thermal throttling of the turbine due to condensation adds to the previously described shift of operating points and the compressor is throttled even more. To better quantify the impact of condensation in the radial turbine on the system, the compressor surge margin S M is shown in Figure 7a together with its relative change in relation to the dry operating line in Figure 7b. The surge margin during dry operation is above 20% for most of the operating range with a significant drop only at high speeds. However, if moist air is added, the surge margin decreases notably. Especially, in the low-speed regime, a relative decrease of up to 25% is found if the maximum water-to-air ratio is applied. In contrast, the diminution at medium speeds is almost constant for speeds of 40 % < N r e l < 75 % . At maximum speeds and humidity, surge margin decreases up to 30% compared to dry flow.

3.2. Impact of Condensation on Temperature during Steady State Operation

To visualise the impact of condensation on the temperature distribution along the gas path, the total temperature is plotted in Figure 8a for an operating point at net system power output of P o u t = 83 % , 78% and 68% of the stack design power for all previously mentioned levels of x f c , the first power setting being the highest operating point in Figure 6a. As expected, the temperature rise in the compressor increases with rotational speed due to increased pressure ratio. Behind the compressor, humidification and intercooling take place. As explained in Section 2.1, modelling of intercooling and humidification is not addressed in the scope of this work. Therefore, temperature decreases to the fuel cell operating temperature. The slight increase in between fuel cell and turbine results from adding high temperature bleed air that seals the bearings against possible water leakage. Afterwards, condensation occurs in the turbine with varying degrees of intensity which is most evident at the highest power output when comparing the solid lines. The relative temperature increase due to condensation in the turbine compared to dry flow at the same net power setting can be as high as 8% at this operating point at maximum humidity compared to dry operation. Even at slightly reduced power outputs, the effect diminishes clearly as seen in the dashed and dash-dotted lines where condensation at maximum water-to-air ratio only leads to 4% and 1% temperature increase. These operating points correspond to 90% and 81.7% corrected speed of the turbine. As seen in Figure 2b, the latter is at the edge of the zone relevant for condensation which is represented by the very low temperature increase. At lower water-to-air ratios, no condensation can be seen at all since the pressure ratio is not high enough to facilitate strong condensation in the turbine.
As explained in detail in Section 2.5, a second step of condensation from non-equilibrium at the turbine outlet to equilibrium conditions is modelled in the downstream exhaust duct. The corresponding temperature rise is detected at the “exhaust” station in Figure 8b. It should be emphasised that even a slight subcooling at the turbine outlet will trigger the condensation model. Since condensation nuclei are present at various degrees due to droplets from the upstream turbine, further condensation on these nuclei is conceivable. At low speeds, however, this might not be the case. Nevertheless, the potential of the condensation to equilibrium is displayed for all operating points discussed previously.
At maximum net power output (solid line), no further increase in temperature is detected. Since strong condensation occurs in the turbine, the flow has nearly reached equilibrium at the turbine outlet and only slight condensation is predicted within the preceding exhaust duct. At lower water-to-air ratios at the same speed, the impact is larger. While condensation at x f c = 0.11 (green line) is less profound in the turbine, the imbalance at the turbine outlet is even stronger and temperature increases by another 4.85%. The most significant example for the modelling approach, however, is the lowest power setting where condensation is almost absent in the turbine. In the downstream duct, however, the temperature increase is even more visible. Concluding the observations at steady state operation, condensation can only influence the operation of the machine at highly loaded operating points with pressure ratios high enough to allow the occurrence of condensation in the turbine. For the operating range of the present automotive application, only a few operating points meet the criteria necessary for condensation in the turbine. In order to investigate the impact on the system performance, operating points with higher pressure ratios are necessary, such as high-altitude application. Nevertheless, especially from the results of the equilibrium condensation model, it can be concluded that liquid water is likely to occur downstream of the fuel cell and turbine. With respect to the overall water budget, it can be advantageous to recover the liquid water to avoid additional water storages for humidification upstream of the stack.

3.3. Transient Operation

In order to achieve a general understanding of the transient performance of the electric turbocharger, the operating characteristics are highlighted in more detail. The manoeuvre for acceleration and deceleration is taken from the machine specifications and includes a rapid acceleration from idle to maximum continuous power in 1 s. It is emphasised at this point that no control strategy has been included in the model yet. A control strategy for this type of machine usually includes a high-fidelity model of the fuel cell stack to be controlled, with the goal of controlling stoichiometry for a given output power of the stack [9]. One of the most common manoeuvres for this type of machine is the rapid acceleration from idle to maximum continuous power, e.g., when the driver requests maximum power from the drivetrain during acceleration. Therefore, electric motor torque is increased by a load step and the system response is predicted. During acceleration, the shaft rotational speed increases abruptly. The pressure ratio of the compressor rises faster with increasing rotational speed than the mass flow, which is delayed since it will only change as a result of pressure imbalance (Equation (22)). At the same time, the turbine pressure ratio increases since both components are connected by the same shaft. Subsequently, pressure buildup in the machine is delayed while the mass flow increases. The surge margin increases drastically at the beginning of the manoeuvre.
When a deceleration manoeuvre is performed, the initial load step leads to an immediate loss in rotational speed and, thus, decreasing compressor pressure ratio before the mass flow changes substantially. Later on, reduced compressor pressure buildup at constant back-pressure leads to a diminishing mass flow which, in turn, leads to a pronounced approach towards the stability line. In the lower speed range N r e l < 0.4 , the torque gradient becomes very small and therefore the discrepancies between transient and steady state operating line diminish. After the description of the overall transient performance of the electric turbocharger, particular cases of transient operation with condensation will be evaluated. The predicted transient operating lines are shown in Figure 9a. The steady state operating lines as an initial solution are shown in the background. Overall, the offset due to humidity is preserved in the same quantity as discussed during steady state operation. The most significant effect occurs during deceleration; as depicted in Figure 9b,c, the compressor surge margin decreases sharply by almost 12%. Consequently, the surge margin is down to 8% at N r e l = 0.8 and maximum humidity. At this condition, a slightly faster deceleration can obviously lead to exceeding the surge margin which, in turn, can lead to critical operating conditions. In a scenario where a control loop would increase the load step’s amplitude further than the load step used here, or even use the electric motor in generator mode, it is conceivable that the surge margin would be exceeded quickly. This underlines the importance of monitoring the surge margin during rapid transient operation. During acceleration, less critical operating conditions are observed and the surge margin increases by up to 16%. Interestingly, the overall increase and decrease in the surge margin are largest for dry operating conditions. Hence, condensation and changes in gas mixture do not contribute significantly to the worsening of the dynamic operating characteristics, except for the general shift of operating lines that has been discussed in the previous chapter. Finally, it can be observed that the surge margin during transient operation in Figure 9b does not show a deviation from the steady state operating line from N r e l = 0.3 to 0.25. This is due to the fact that the deceleration at the end of the manoeuvre occurs with a very low gradient and therefore no transient effects are visible.

3.4. Impact on Stack Performance

Ultimately, the performance of the turbomachinery components is brought together with the fuel cell stack performance. Figure 4a shows the performance map of a fuel cell stack as discussed in Section 2.4. In addition, the steady state and transient operating lines are plotted analogous to Figure 9. The normalised power achievable in the performance map has the largest gradient with respect to the mass flow rather than pressure. To highlight this impact, the normalised stack power is shown in Figure 4b over the relative rotational speed. The stack power output barely changes due to the low change of mass flow and pressure ratio. Nevertheless, a dry flow (though physically not feasible since a shift of turbine operating points would always be present with a fuel cell stack in operation) would provide the requested power output at slightly lower compressor speeds. During acceleration, the power output is augmented above the steady state operating line due to the increased mass flow (see Figure 9) while the compressor is still in acceleration. In the lower part of Figure 4b, the power output of the turbomachinery components are depicted. The power output of the turbine reaches up to 3.6–3.9% of the stack’s design power at the maximum operating point. The compressor, on the other hand, consumes up to 9.9% of the nominal stack power in dry and 9.0% in moist flow. Therefore, 36–43% of the compressor power required can be provided at the highest load setting. Additionally, the variance of compressor power consumption during transient operation is larger since the variation in mass flow is higher than in the turbine. In both components, power consumption and generation, respectively, are higher for the dry case due to increased mass flow.
In a nutshell, the overall energetic cost at maximum net power output and wet flow are 8.9% and 9.0% of the net output power, which is being provided by the electric motor. On the other hand, stack power output is at 90.2%. In a non-pressurised scenario, maximum power output of the stack would be 77% of the design power. Hence, the net improvement in stack power output is 9.2% due to the use of the electric turbocharger.

4. Summary and Conclusions

In this paper, an electric turbocharger for mobile fuel cell applications has been investigated, with special focus on condensation within the radial turbine of the machine. The principal goal of the work was to highlight the operating performance of the machine in steady state and transient operating conditions. Therefore, condensation is modelled and predicted using a Euler–Lagrange CFD approach, resulting in a particular performance map for four water-to-air ratios. Condensation occurs above 80% relative humidity and rotational speeds above 55%. It has been pointed out that this non-equilibrium approach is necessary since the conditions at the turbine outlet can significantly deviate from thermodynamic equilibrium which was assumed in studies from literature [16]. For the exhaust flow, an equilibrium calculation approach has been implemented and is used downstream of the turbine.
The steady state performance of the electric turbocharger under influence of condensation in the turbine was subsequently analysed. Due to the use of moist air, the operating points within the turbine performance map are shifted to lower corrected speeds and thus lower mass flows. The operating line is shifted to lower mass flows and the compressor surge margin is reduced by 5% in the high-speed regime compared to dry operation. Condensation in the turbine occurs only at the highest water to air ratio and speed. At lower operating points, the flow downstream of the turbine is far from thermodynamic equilibrium. The condensation model downstream of the turbine predicts strong temperature rises due to condensation in the exhaust. Furthermore, it is evident that the turbine is operated outside of the critical range for condensation for most of the machine’s operating range.
During transient operation, the deceleration manoeuvre poses great risks to overall stability. The compressor surge margin decreases up to 12% compared to steady state operation at the same speed. The impact of condensation is minor, and the offset seen in steady state simulations is present in transient operation. Nevertheless, the compressor surge margin can be as low as 8%. Without an optimal control loop, exceeding the surge margin could be a risk for safe operation. The overall efficiency of the system is not influenced significantly. At constant net power output, a decrease efficiency of only 0.1% is detected.
With regard to future work, a machine operating at higher compressor and turbine pressure ratios should be investigated, e.g., in a high altitude scenario. Significant impact of condensation in the turbine with thermal throttling can only be expected in these conditions, where the turbine operates at higher pressure ratios. Since the danger of exceeding the surge limit was observed, the addition of a surge model for the radial compressor could provide further insight into the impact of compressor stall on the entire system. Especially, pressure fluctuations in the stack could lead to damage of the membrane itself. Furthermore, a control system along with a higher-quality stack model have to be developed. Hereby, a control loop with regard to the actual centre of the system, the fuel cell stack, can be implemented with, e.g., stoichiometry as the control target for a given load demand. In terms of system architecture, the aspect of condensation can become interesting for multi-stage applications: condensation raises the turbine inlet temperature in subsequent stages and thereby increases the power output. Finally, experimental validation of performance prediction models is needed. In particular, the validation of steady state operation should be possible with experiments and is proposed by [15]. Additionally, validation of the condensation is planned. However, the measurement of droplet size in gas flows can be challenging.

Author Contributions

Conceptualisation, J.F., C.B. and S.L.; methodology, J.G., S.L. and T.W.; software, J.G., S.L. and T.W.; validation, S.L., J.G. and T.W.; formal analysis, S.L., J.G. and T.W.; investigation, S.L. and T.W.; resources, J.F.; data curation, S.L. and T.W.; writing—original draft preparation, S.L. and T.W.; writing—review and editing, S.L. and T.W.; visualisation, S.L. and T.W.; supervision, J.F. and C.B.; project administration, J.F. and C.B.; funding acquisition, J.F. and C.B. All authors have read and agreed to the published version of the manuscript.

Funding

The financial support from the German Federal Ministry of Transport and Digital Infrastructure is gratefully acknowledged for funding of the ARIEL-project (Grant No. 03B10105D2). We acknowledge support by the Open Access Publication Funds of Technische Universität Braunschweig.

Institutional Review Board Statement

Not applicable.

Informed Consent Statement

Not applicable.

Data Availability Statement

The electric turbocharger data are not publicly available due to non-disclosure agreements with Volkswagen AG.

Acknowledgments

The authors would like to thank Manuel Meier and Daniel Grundei of the Volkswagen AG for sharing their insight into the research topic which greatly improved this manuscript. Finally, the authors thank all researchers of ima and iMAB of TU Braunschweig, TFD of University of Hannover and Ostfalia University of Applied Sciences for sharing their insight and helpful discussions on the topic.

Conflicts of Interest

The authors declare no conflict of interest.

Abbreviations

The following abbreviations are used in this manuscript:
ASTORAircraftEngine Simulation for Transient Operation Research
CFDComputational Fluid Dynamics
DPMDiscrete phase model
DPDesign point
exp.Experimental
NISONon-isothermal correction
ODEOrdinary differential equations
OPOperating point
PEMFCProton exchange membrane fuel cell
ROMReduced order model
SLSurge line
SSTShear Stress Transport
STACYSteady state cycle calculator
IAPWSInternational Association for the Properties of Water and Steam
IWSMPInternational Wet Steam Modeling Project
Nomenclature
a c c e l . Acceleration
α , β Modelling parameters
c p Isobaric specific heat capacity
δ Reference pressure ratio
d e c e l . Deceleration
fError equation
F F T Turbine flow parameter
γ Isentropic index
G L , β or RAuxiliary performance map coordinate
h , h t Static or total enthalpy
h f g Latent heat
JShaft moment of inertia
J C L Classical homogenous nucleation rate
k B Boltzmann constant
K n Knudsen number
λ Stoichiometry
m ˙ Mass flow
m m Molecule mass
NRotational speed
ω Angular velocity
Φ Quantity
φ Relative humidity
P r Prandtl number
p s , p t Static or total pressure
r , r c r i t Droplet radius or critical radius
PPower
RGas constant
σ Surface tension
SSupersaturation ratio
sEntropy function
S M Surge margin
S L Surge line
T s , T t Static or total temperature
τ Torque
Θ Reference temperature ratio
VVolume
w u Euler work
x = m H 2 O m a i r Water-to-air-ratio
Indices
absAbsolute
C, Comp.Compressor
Corr.Corrected
dryDry flow
exp.Experimental
fSaturated liquid phase
fcFuel cell stack
fricFriction
gVapour phase phase
G T Gas table
Norm.Normalised
NZOutlet nozzle
itIteration
outOutput
OPOperating point
sStatic
satSaturation
tTotal
targetTarget value
T,Turb.Turbine
elElectric motor
relRelative
req., requiredRequired quantity

References

  1. Pollet, B.G.; Kocha, S.S.; Staffell, I. Current status of automotive fuel cells for sustainable transport. Curr. Opin. Electrochem. 2019, 16, 90–95. [Google Scholar] [CrossRef]
  2. Schröter, J.; Graf, T.; Frank, D.; Bauer, C.; Kallo, J.; Willich, C. Influence of pressure losses on compressor performance in a pressurized fuel cell air supply system for airplane applications. Int. J. Hydrogen Energy 2021, 46, 21151–21159. [Google Scholar] [CrossRef]
  3. Cunningham, J.M.; Hoffman, M.A.; Friedman, D.J. A Comparison of High-Pressure and Low-Pressure Operation of PEM Fuel Cell Systems. SAE Trans. 2001, 110, 464–470. [Google Scholar] [CrossRef]
  4. Venturi, M.; Sang, J.; Knoop, A.; Hornburg, G. Air Supply System for Automotive Fuel Cell Application; SAE Technical Paper Series; SAE International 400 Commonwealth Drive: Warrendale, PA, USA, 2012. [Google Scholar] [CrossRef]
  5. Zhao, D.; Blunier, B.; Gao, F.; Dou, M.; Miraoui, A. Control of an Ultrahigh-Speed Centrifugal Compressor for the Air Management of Fuel Cell Systems. IEEE Trans. Ind. Appl. 2014, 50, 2225–2234. [Google Scholar] [CrossRef] [Green Version]
  6. Blunier, B. Air Management in PEM Fuel Cells: State-of-the-Art and Prospectives. In Proceedings of the International Aegean Conference on Electrical Machines and Power Electronics, Bodrum, Turkey, 10–12 September 2007. [Google Scholar]
  7. Edwards, R.L. Regression analysis of PEM fuel cell transient response. Int. J. Energy Environ. Eng. 2016, 7, 329–341. [Google Scholar] [CrossRef] [Green Version]
  8. Pischinger, S.; Schönfelder, C.; Bornscheuer, W.; Kindl, H.; Wiartalla, A. Integrated Air Supply and Humidification Concepts for Fuel Cell Systems. SAE Trans. 2001, 110, 86–92. [Google Scholar] [CrossRef]
  9. Pukrushpan, J.T.; Peng, H.; Stefanopoulou, A.G. Control-Oriented Modeling and Analysis for Automotive Fuel Cell Systems. J. Dyn. Syst. Meas. Control 2004, 126, 14. [Google Scholar] [CrossRef]
  10. Yu, W.; Sichuan, X.; Ni, H. Air Compressors for Fuel Cell Vehicles: An Systematic Review. SAE Int. J. Altern. Powertrains 2015, 4, 115–122. [Google Scholar] [CrossRef]
  11. Wittmann, T.; Bode, C.; Friedrichs, J. The Feasibility of an Euler–Lagrange Approach for the Modeling of Wet Steam. J. Eng. Gas Turbines Power 2021, 143, 1301. [Google Scholar] [CrossRef]
  12. Lück, S.; Göing, J.; Bode, C.; Friedrichs, J. Volume 8: Industrial and Cogeneration; Manufacturing Materials and Metallurgy; Marine; Microturbines, Turbochargers, and Small Turbomachines. In Pseudo Bond Graph System Modelling of Electric Air Compressors with Energy Recovery for Fuel Cell Applications; American Society of Mechanical Engineers: New York, NY, USA, 2020. [Google Scholar] [CrossRef]
  13. Wittmann, T.; Lück, S.; Bode, C.; Friedrichs, J. Modelling the Condensation Phenomena within the Radial Turbine of a Fuel Cell Turbocharger. Int. J. Turbomach. Propuls. Power 2021, 6, 23. [Google Scholar] [CrossRef]
  14. Young, J.B. Condensation in Jet Engine Intake Ducts During Stationary Operation. J. Turbomach. 1995, 117, 227. [Google Scholar] [CrossRef]
  15. Schödel, M.; Menze, M.; Seume, J.R. Experimentally validated extension of the operating range of an electrically driven turbocharger for fuel cell applications. Machines 2021, 9, 31. [Google Scholar] [CrossRef]
  16. Roumeliotis, I.; Mathioudakis, K. Analysis of moisture condensation during air expansion in turbines. Int. J. Refrig. 2006, 29, 1092–1099. [Google Scholar] [CrossRef]
  17. Filsinger, D.; Kuwata, G.; Ikeya, N. Tailored Centrifugal Turbomachinery for Electric Fuel Cell Turbocharger. Int. J. Rotating Mach. 2021, 2021, 3972387. [Google Scholar] [CrossRef]
  18. Schlums, H. Grundlagen für die Auslegung von Aerodynamischen Axiallagern und Hochdruck-Gasdichtungen. Ph.D. Thesis, TU Braunschweig, Braunschweig, Germany, 1997. [Google Scholar]
  19. Wittmann, T.; Lück, S.; Hertwig, T.; Bode, C.; Friedrichs, J. The Influence of Condensation on the Performance Map of a Fuel Cell Turbocharger Turbine. In Turbo Expo: Power for Land, Sea, and Air; American Society of Mechanical Engineers: New York, NY, USA, 2021. [Google Scholar]
  20. Bakhtar, F.; Young, J.B.; White, A.J.; Simpson, D.A. Classical Nucleation Theory and Its Application to Condensing Steam Flow Calculations. Proc. Inst. Mech. Eng. Part C J. Mech. Eng. Sci. 2005, 219, 1315–1333. [Google Scholar] [CrossRef]
  21. Kantrowitz, A. Nucleation in Very Rapid Vapor Expansions. J. Chem. Phys. 1951, 19, 1097–1100. [Google Scholar] [CrossRef]
  22. Young, J.B. Spontaneous Condensation of Steam in Supersonic Nozzles: N81-13307; Whittle Laboratory, University of Cambridge: Cambridge, UK, 1980. [Google Scholar]
  23. Lamanna, G. On Nucleation and Droplet Growth in Condensing Nozzle Flows. Ph.D. Thesis, Technische Universiteit Eindhoven, Eindhoven, The Netherlands, 2000. [Google Scholar] [CrossRef]
  24. Gyarmathy, G. Grundlagen Einer Theorie der Nassdampfturbine. Ph.D. Thesis, Eidgenössische Technische Hochschule Zürich, Zürich, Switzerland, 1962. [Google Scholar] [CrossRef]
  25. Wittmann, T.; Lück, S.; Bode, C.; Friedrichs, J. Numerical Simulation of Nucleation and Condensation in Nozzles and Radial Turbines. In Proceedings of the CADFEM ANSYS Simulation Conference, Kassel, Germany, 16–18 October 2019. [Google Scholar]
  26. Naumann, Z.; Schiller, L. A drag coefficient correlation. Z. Ver. Deutsch. Ing 1935, 77, e323. [Google Scholar]
  27. Cunningham, E. On the velocity of steady fall of spherical particles through fluid medium. Proc. R. Soc. London. Ser. A Contain. Pap. A Math. Phys. Character 1910, 83, 357–365. [Google Scholar] [CrossRef] [Green Version]
  28. Cooper, J.R.; Dooley, R.B. Revised Release on the IAPWS Industrial Formulation 1997 for the Thermodynamic Properties of Water and Steam. Int. Assoc. Prop. Water Steam 2012, 1, 48. [Google Scholar]
  29. Hellstrom, F.; Fuchs, L. Effects of Inlet Conditions on the Turbine Performance of a Radial Turbine. In Volume 6: Turbomachinery, Parts A, B, and C Proceedings of the ASME Turbo Expo 2008: Power for Land, Sea, and Air, Berlin, Germany, 9–13 June 2008; ASME: New York, NY, USA, 2008; pp. 1985–2001. [Google Scholar] [CrossRef]
  30. NATO (Ed.) Recommended Practices for the Assessment of the Effects of Atmospheric Water Ingestion on the Performance and Operability of Gas Turbine Engines: = (Recommandations Concernant les méThodes à Utiliser Pour le Traitement de l’humidité dans les Turbines à gaz); Number 332 in AGARD Advisory Report; NATO: Neuilly-sur-Seine, France, 1995. [Google Scholar]
  31. Göing, J.; Lück, S.; Bode, C.; Friedrichs, J. Performance Simulation to Investigate the Impact of a Deteriorated High-Pressure Compressor on Turbofan Engine Using a Pseudo Bond Graph Modelling Approach. Glob. Power Propuls. Soc. 2019. [Google Scholar] [CrossRef]
  32. Sellers, F. DYNGEN: A Program for Calculating Steady-State and Transient Performance of Turbojet and Turbofan Engines; National Aeronautics and Space Administration: Washington, DC, USA, 1975; p. 208.
  33. Kurzke, J. Gasturb 12: A Program to Calculate Design and Off-design Performance of Gas Turbines. User’s Manual. Available online: https://www.gasturb.de/Downloads/Manuals/GasTurb14.pdf (accessed on 10 October 2021).
  34. Kurzke, J.; Halliwell, I. Propulsion and Power; Springer International Publishing: Cham, Switzerland, 2018. [Google Scholar] [CrossRef]
  35. Lytle, K. The Numerical Propulsion System Simulation: A Multidisciplinary Design System for Aerospace Vehicles; National Aeronautics and Space Administration, Glenn Research Center: Cleveland, OH, USA, 1999; p. 14.
  36. Gordon, S.; McBride, B.J. Computer Program for Calculation of Complex Chemical Equilibrium Compositions and Applications; Part 1: Analysis; National Aeronautics and Space Administration, Glenn Research Center: Cleveland, OH, USA, 1994.
  37. Göing, J.; Hogrefe, J.; Lück, S.; Friedrichs, J. Validation of a dynamic simulation approach for transient performance using the example of a turbojet engine. In STAB/DGLR Symposium; Springer: Cham, Switzerland, 2020; pp. 559–568. [Google Scholar]
  38. O’Hayre, R.P.; Cha, S.W.; Colella, W.G.; Prinz, F.B. Fuel Cell Fundamentals, 3rd ed.; John Wiley & Sons Inc: Hoboken, NJ, USA, 2016. [Google Scholar]
  39. Shampine, L.F.; Reichelt, M.W. The MATLAB ODE Suite. SIAM J. Sci. Comput. 1997, 18, 1–22. [Google Scholar] [CrossRef] [Green Version]
Figure 1. Structure of the electric turbocharger embedded in the fuel cell system.
Machines 10 00059 g001
Figure 2. CFD domain and results. (a) CFD domain. (b) Normalised corrected turbine performance map with annotations of normalised corrected speed N c o r r , n o r m . for four water-to-air ratios x f c at the fuel cell outlet.
Machines 10 00059 g002
Figure 3. CFD results for variation of turbine inlet humidity at constant absolute rotational speed. Data are obtained at the blue plane in Figure 2a. (a) Static temperature T s (CFD and analytic equilibrium calculation) and subcooling Δ T s u b c o o l i n g . (b) Total-to-static pressure ratio π t s and total-to-static efficiency η t s .
Machines 10 00059 g003
Figure 4. Fuel cell system performance. Markers shown for every 20th data point. (a) Fuel cell stack performance map with electric turbocharger operating lines and isolines of constant stack power. (b) Normalised stack, net output power, compressor and turbine power.
Machines 10 00059 g004
Figure 5. Mean deviation between ASTOR at steady state and STACY in relation to STACY result, with additional information of maximum range. Station values of (a) total temperature T t , (b) total pressure p t and (c) mass flow m ˙ .
Machines 10 00059 g005
Figure 6. Steady state operating lines in turbomachinery performance maps for varying water-to-air ratio x f c . Additional operating points (OP) used in Figure 8a are shown. Markers shown for every 20th data point. (a) Experimental compressor map with annotations of relative speed N r e l . (b) CFD turbine map (opaque) from Figure 2b for given levels of water-to-air ratio with annotations of normalised corrected speed N c o r r . , n o r m . . Steady state turbine operating lines in the foreground.
Machines 10 00059 g006
Figure 7. Compressor surge margin. Markers shown for every 20th data point. (a) S M according to Equation (12) for variation of x f c . (b) Change in surge margin Δ r e l S M compared to dry flow with x f c = 0 (Equation (13)) in %.
Machines 10 00059 g007
Figure 8. Total temperature along the gas path for varying x f c . (a) Total temperature at selected stations. Operating points highlighted in Figure 6. (b) Relative change of total temperature compared to the dry reference case x f c = 0 at constant output power.
Machines 10 00059 g008
Figure 9. Prediction of the transient operating line. Markers shown for every 20th data point. (a) Transient operating lines with variation of water-to-air ratio x f c . (b) Compressor surge margin S M . (c) Change of surge margin Δ S M to steady state operation. Same x-axis applies to (b,c).
Machines 10 00059 g009
Table 1. Change of quantities at constant absolute shaft speed N of 86.7% design speed.
Unit x fc = 0 x fc = 0.079 x fc = 0.11 x fc = 0.162
R J kg · K 291.92304.13308.43315.13
γ 1.397941.388501.385451.38096
c p J kg · K 1025.51086.91108.61142.3
Δ N c o r r %-−1.7−2.3−3.2
Publisher’s Note: MDPI stays neutral with regard to jurisdictional claims in published maps and institutional affiliations.

