
Safety Control Architecture for Ventricular Assist Devices

 , , , , and
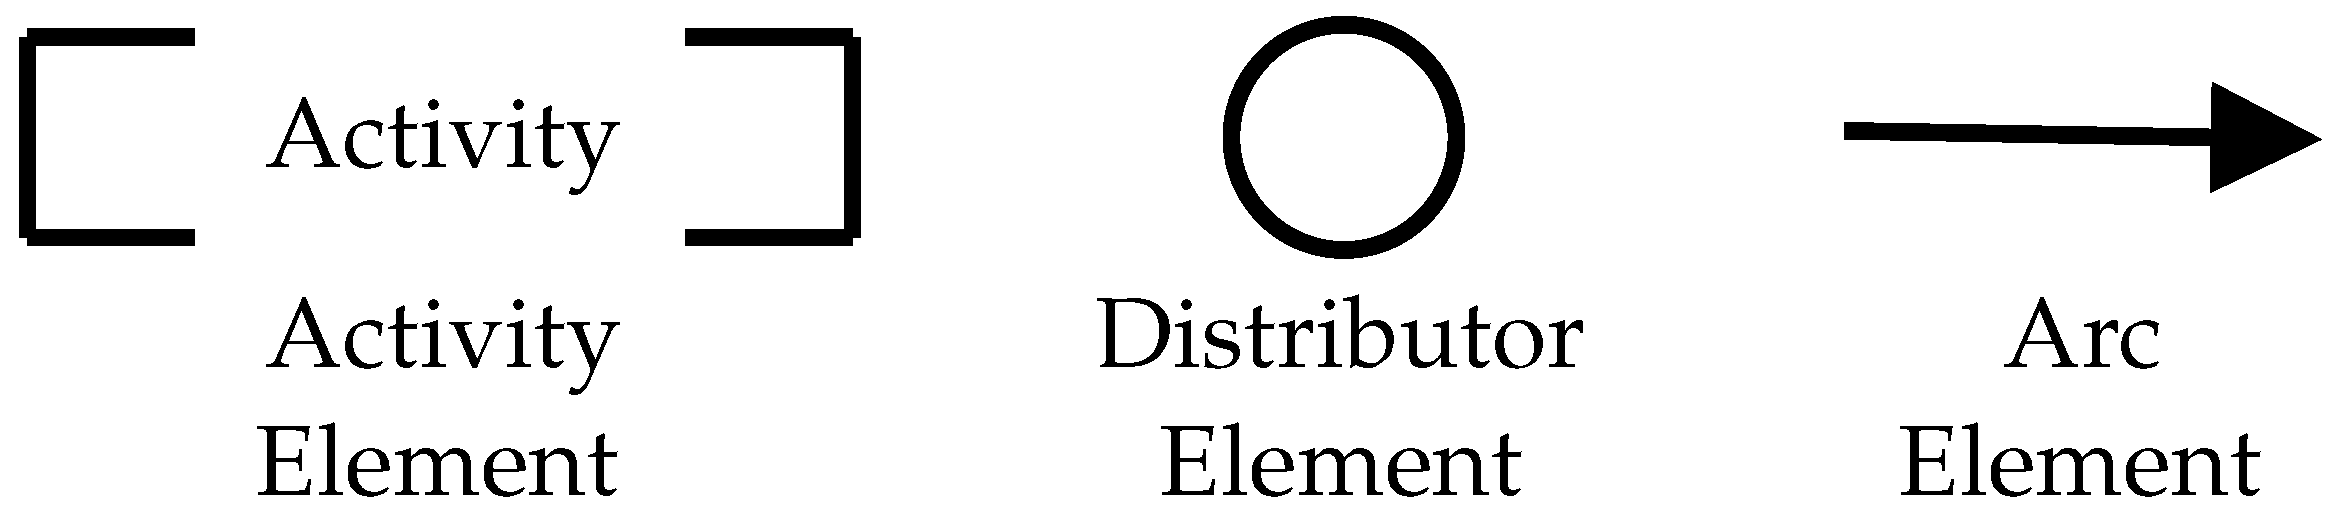
Abstract
:1. Introduction
- First: the device must perform effectively and accurately; otherwise, if the pump fails during operation and there is no control system capable of interpreting and autonomously handling failures, serious risks to the patient are inevitable [4]. Medical equipment should provide personalized care to reduce such risks [5];
- Second: many VADs keep the blood flow constant regardless of the patient’s daily needs, they assist the blood circulation, and do not react adequately to changes in the patient’s behavior [6]. If the patient is at rest and needs to perform physical activity, the patient’s heart automatically changes its behavior, pumping more blood, but some VADs do not follow the need of the patient’s circulatory system by keeping the rotation speed of the VAD fixed.
1.1. Evolution of VADs
1.2. Research Motivation
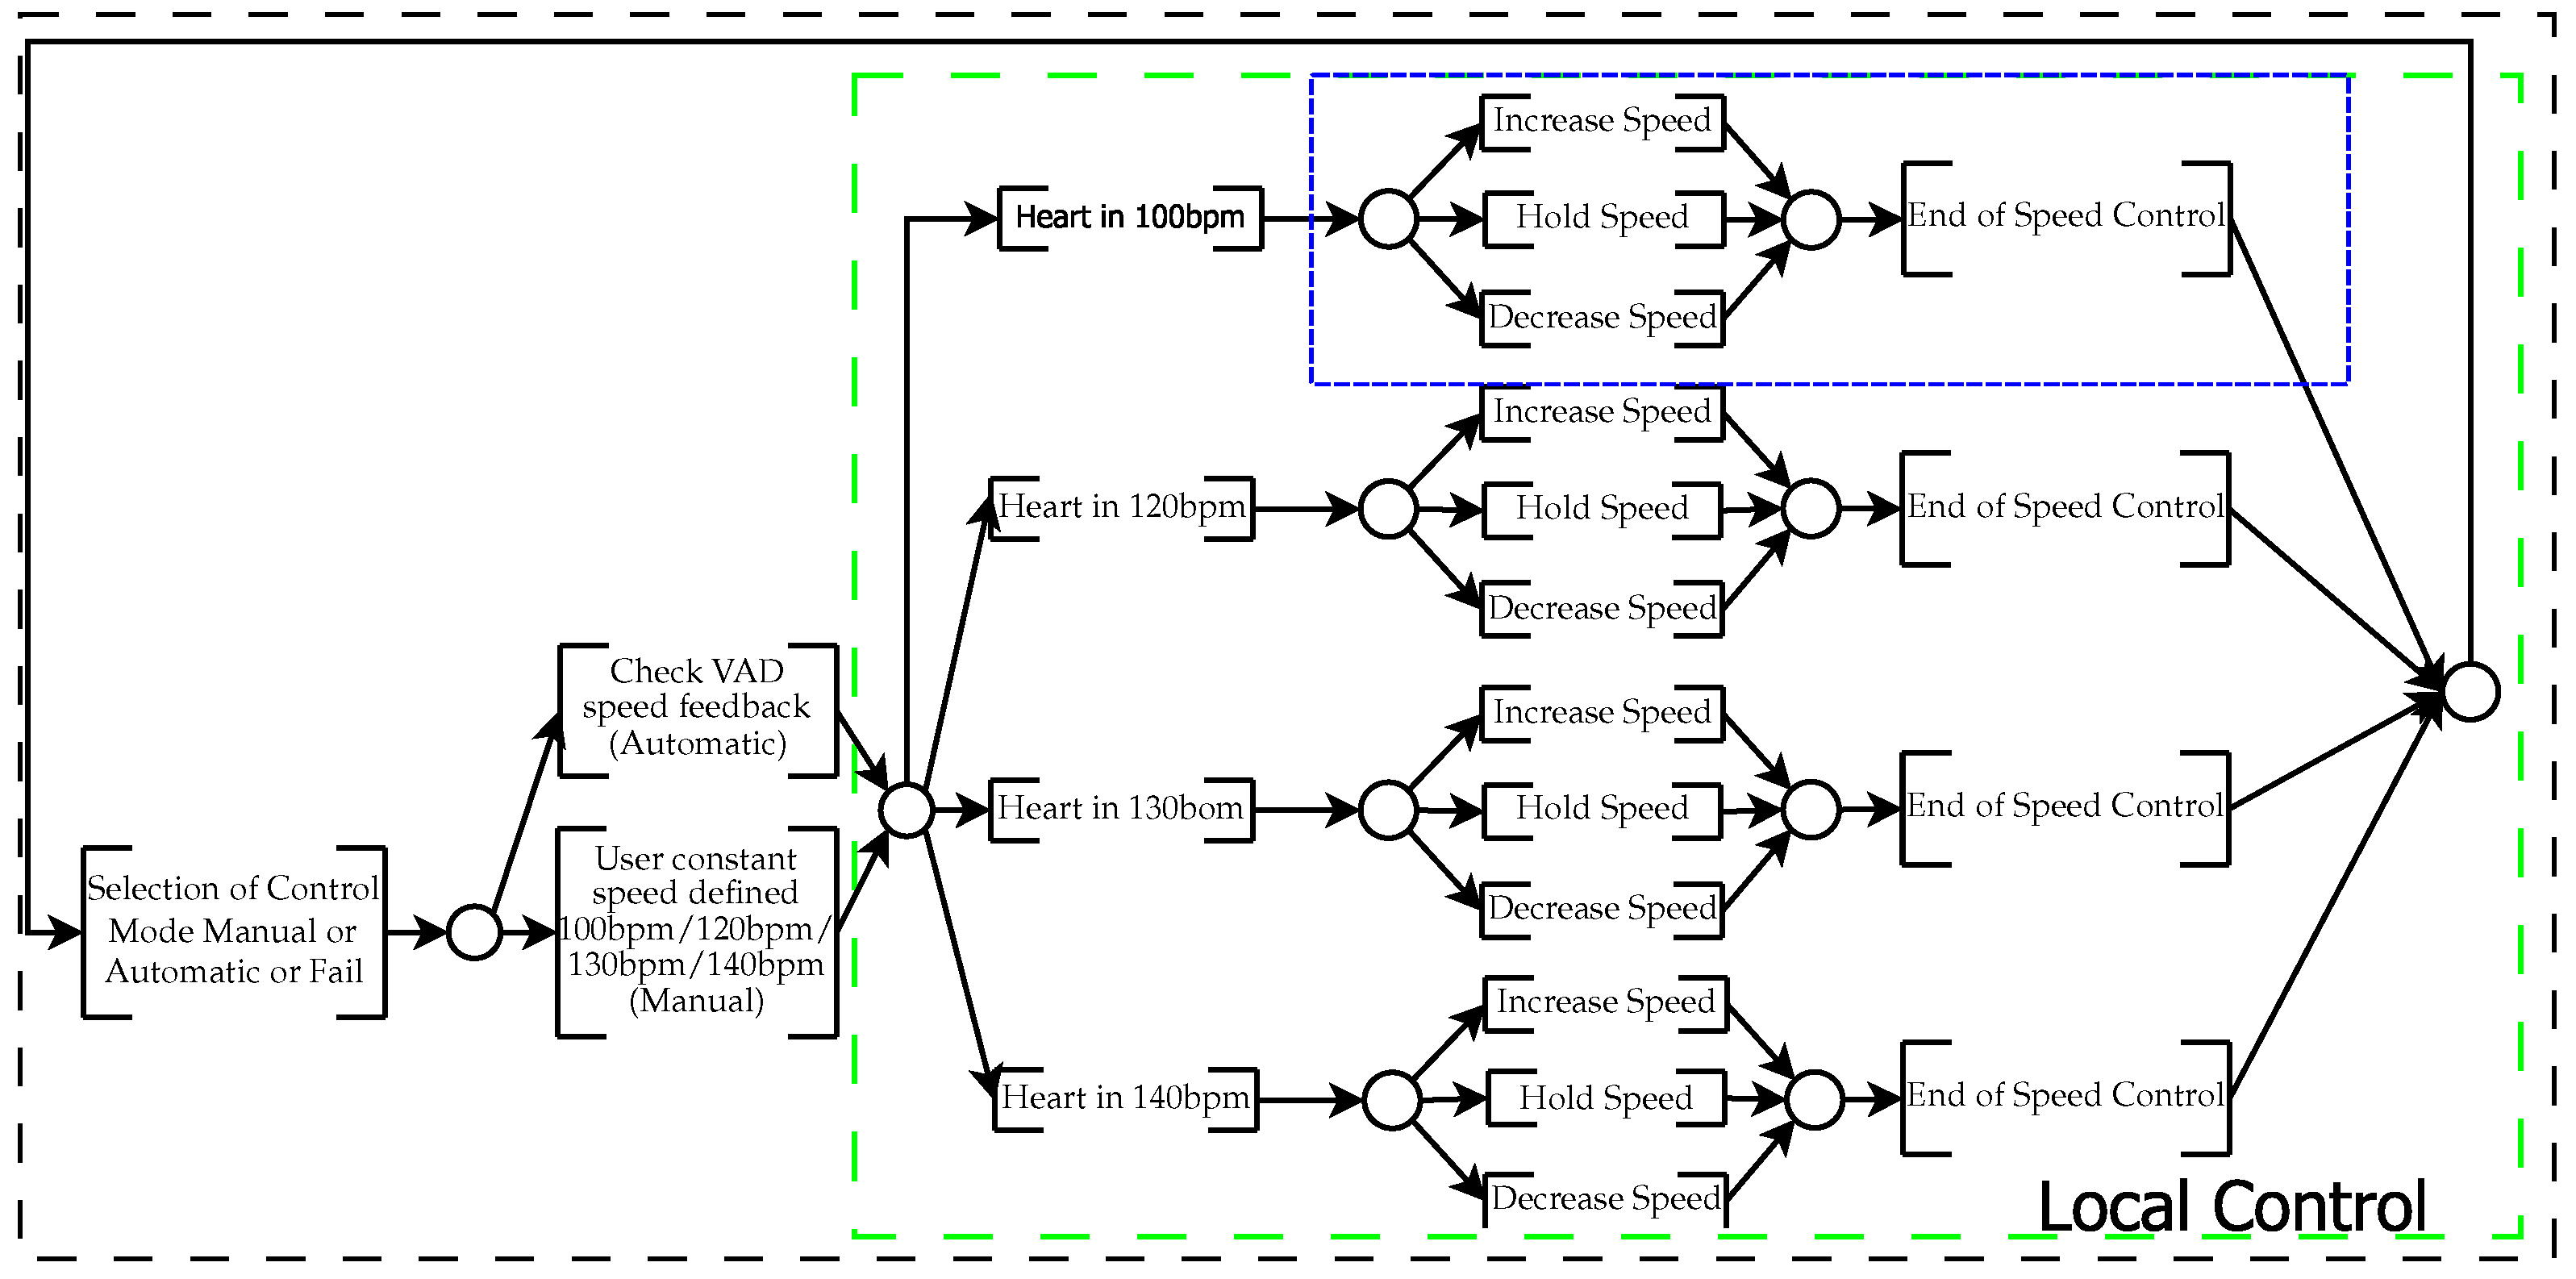
- Specifies a logic for the pump speed control, according to the dynamic behavior of the patient. Models based on Bayesian network (BN) [13] should be applied to diagnose the dynamic state of the patient at each moment and to act in controlling the VAD;
- Specifies a safety interlocking logic to prevent failures in the VAD that could generate risks to the patient’s life. To do this, the critical states will be diagnosed by means of BN and, from these, implement a real-time diagnostic control system by means of Petri nets (PN).
- Check the supervisory model observing the human cardiovascular electronical model, considering the proposed model [17]. Making the supervisory control system validation, the next step is the “in vitro” and “in vivo” validation.
2. Basic Concepts
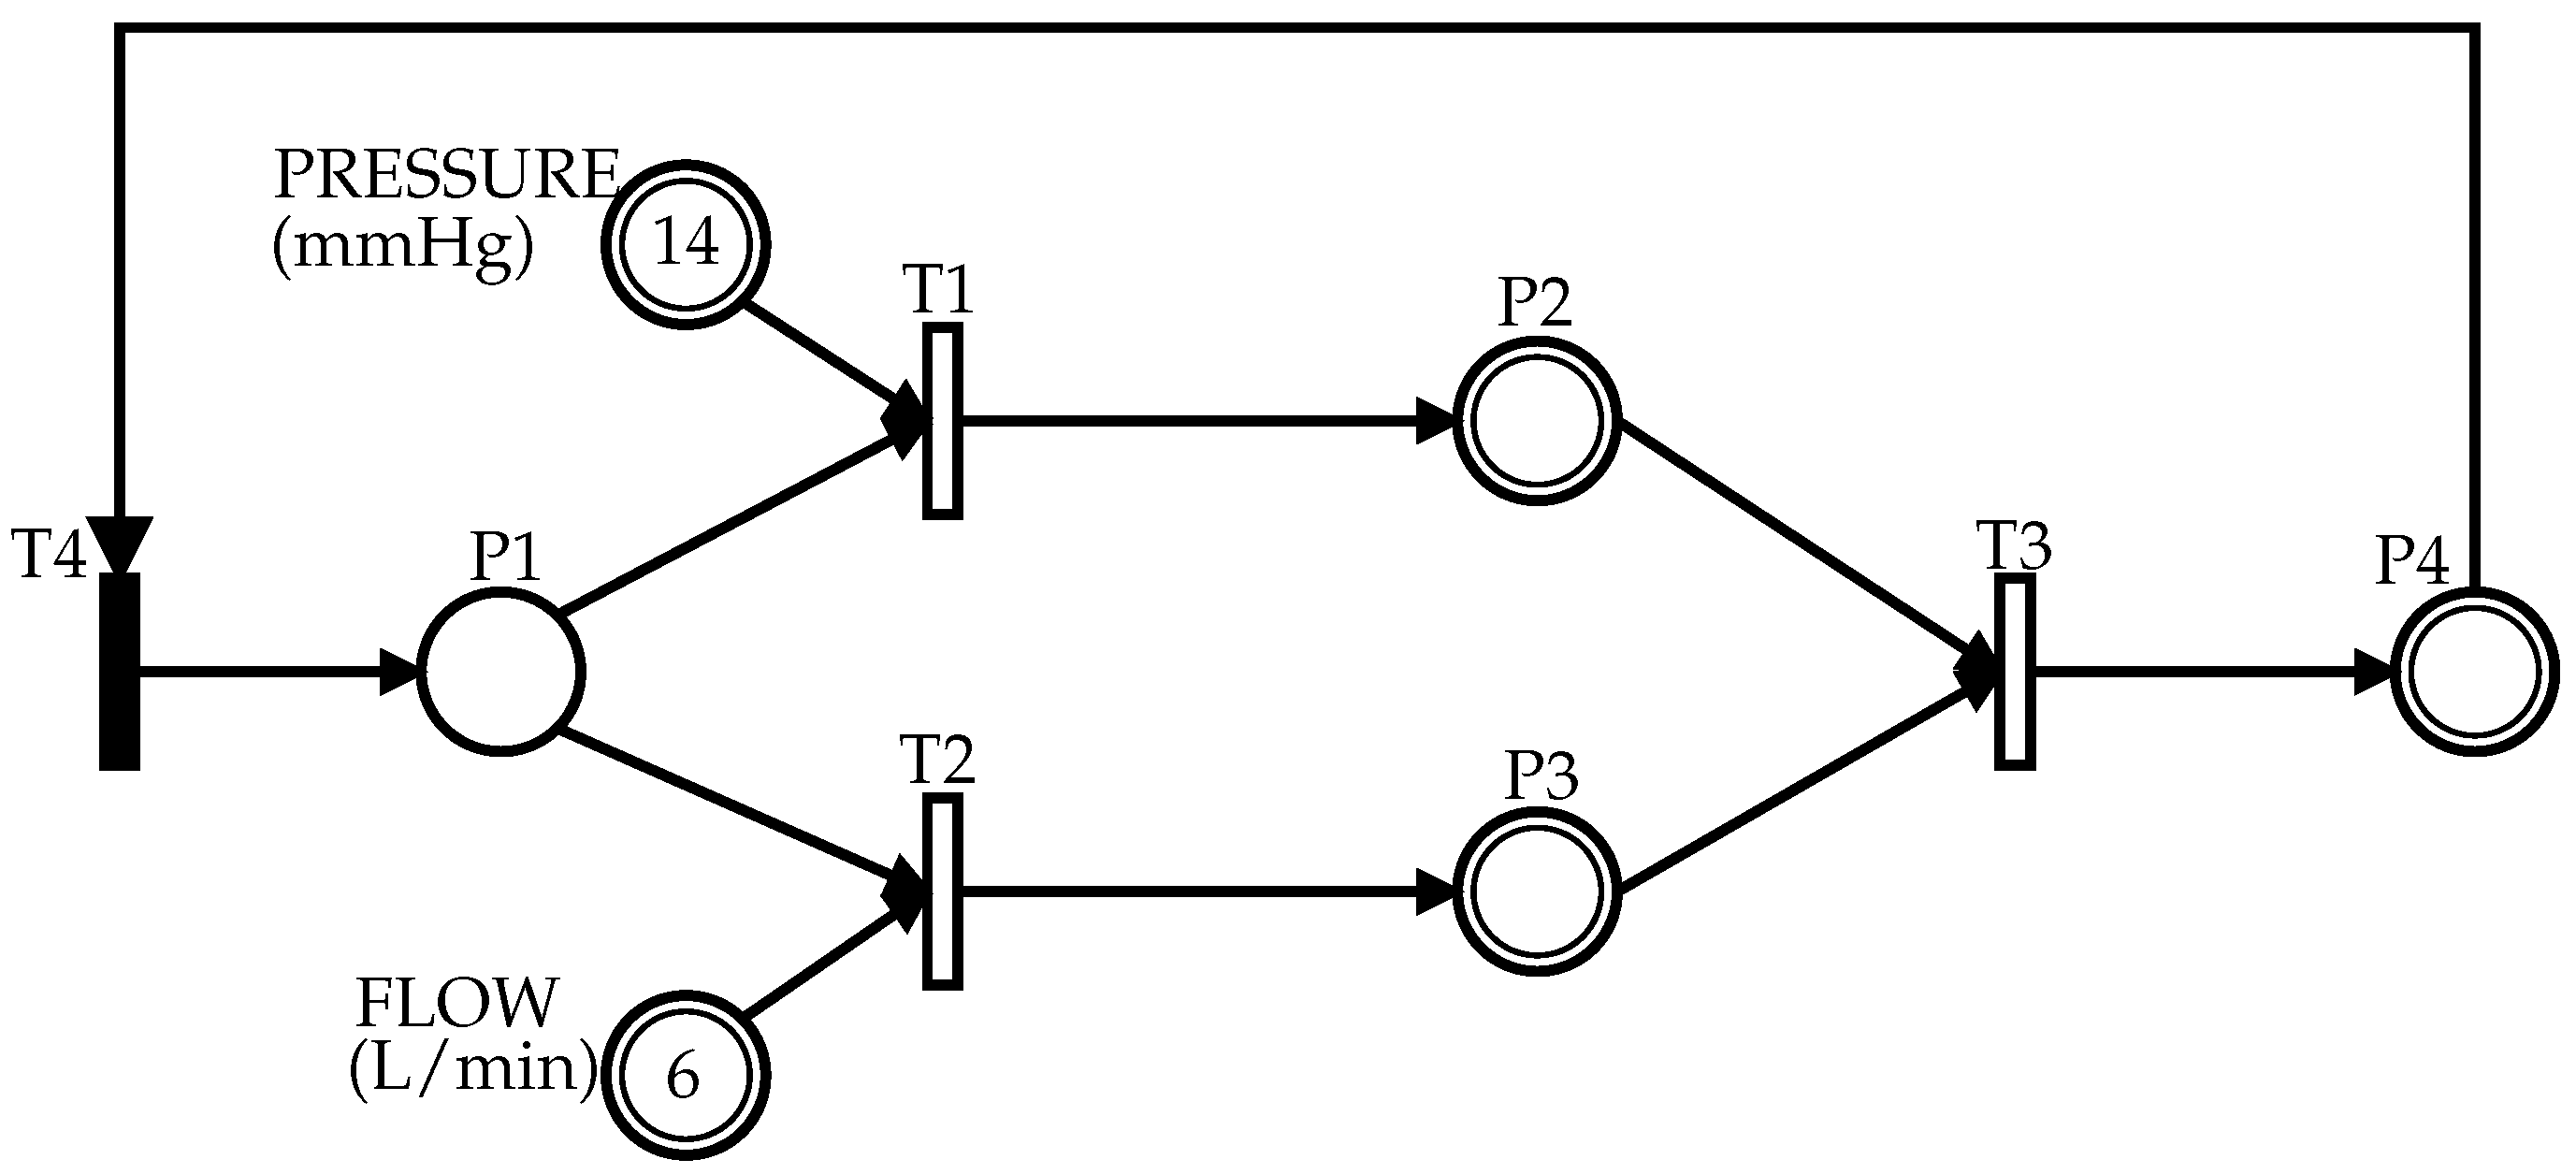
2.1. Product Flow Schema (PFS)
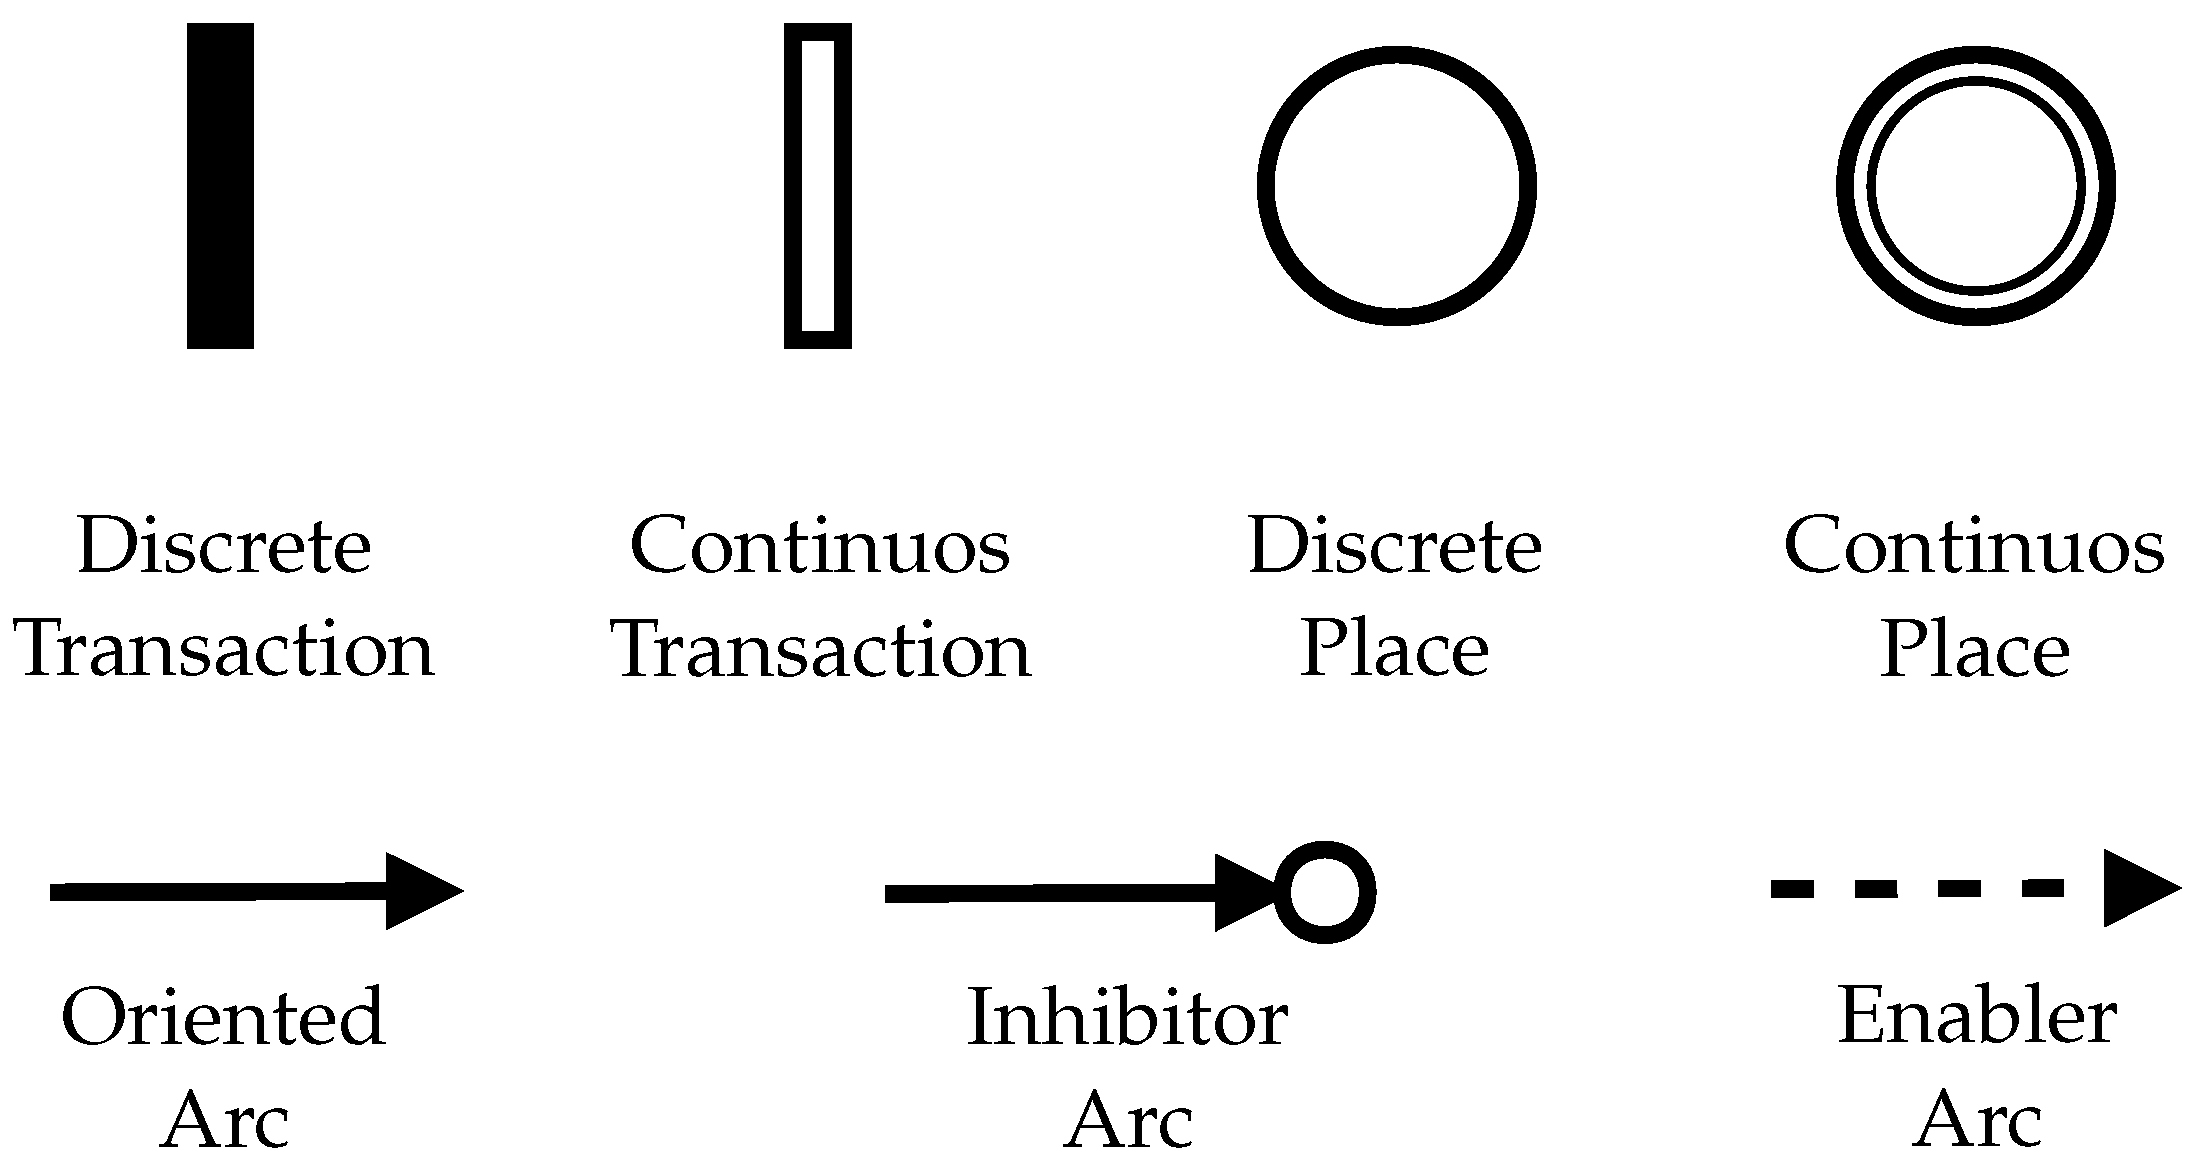
2.2. Hybrid Petri Net (HPN)
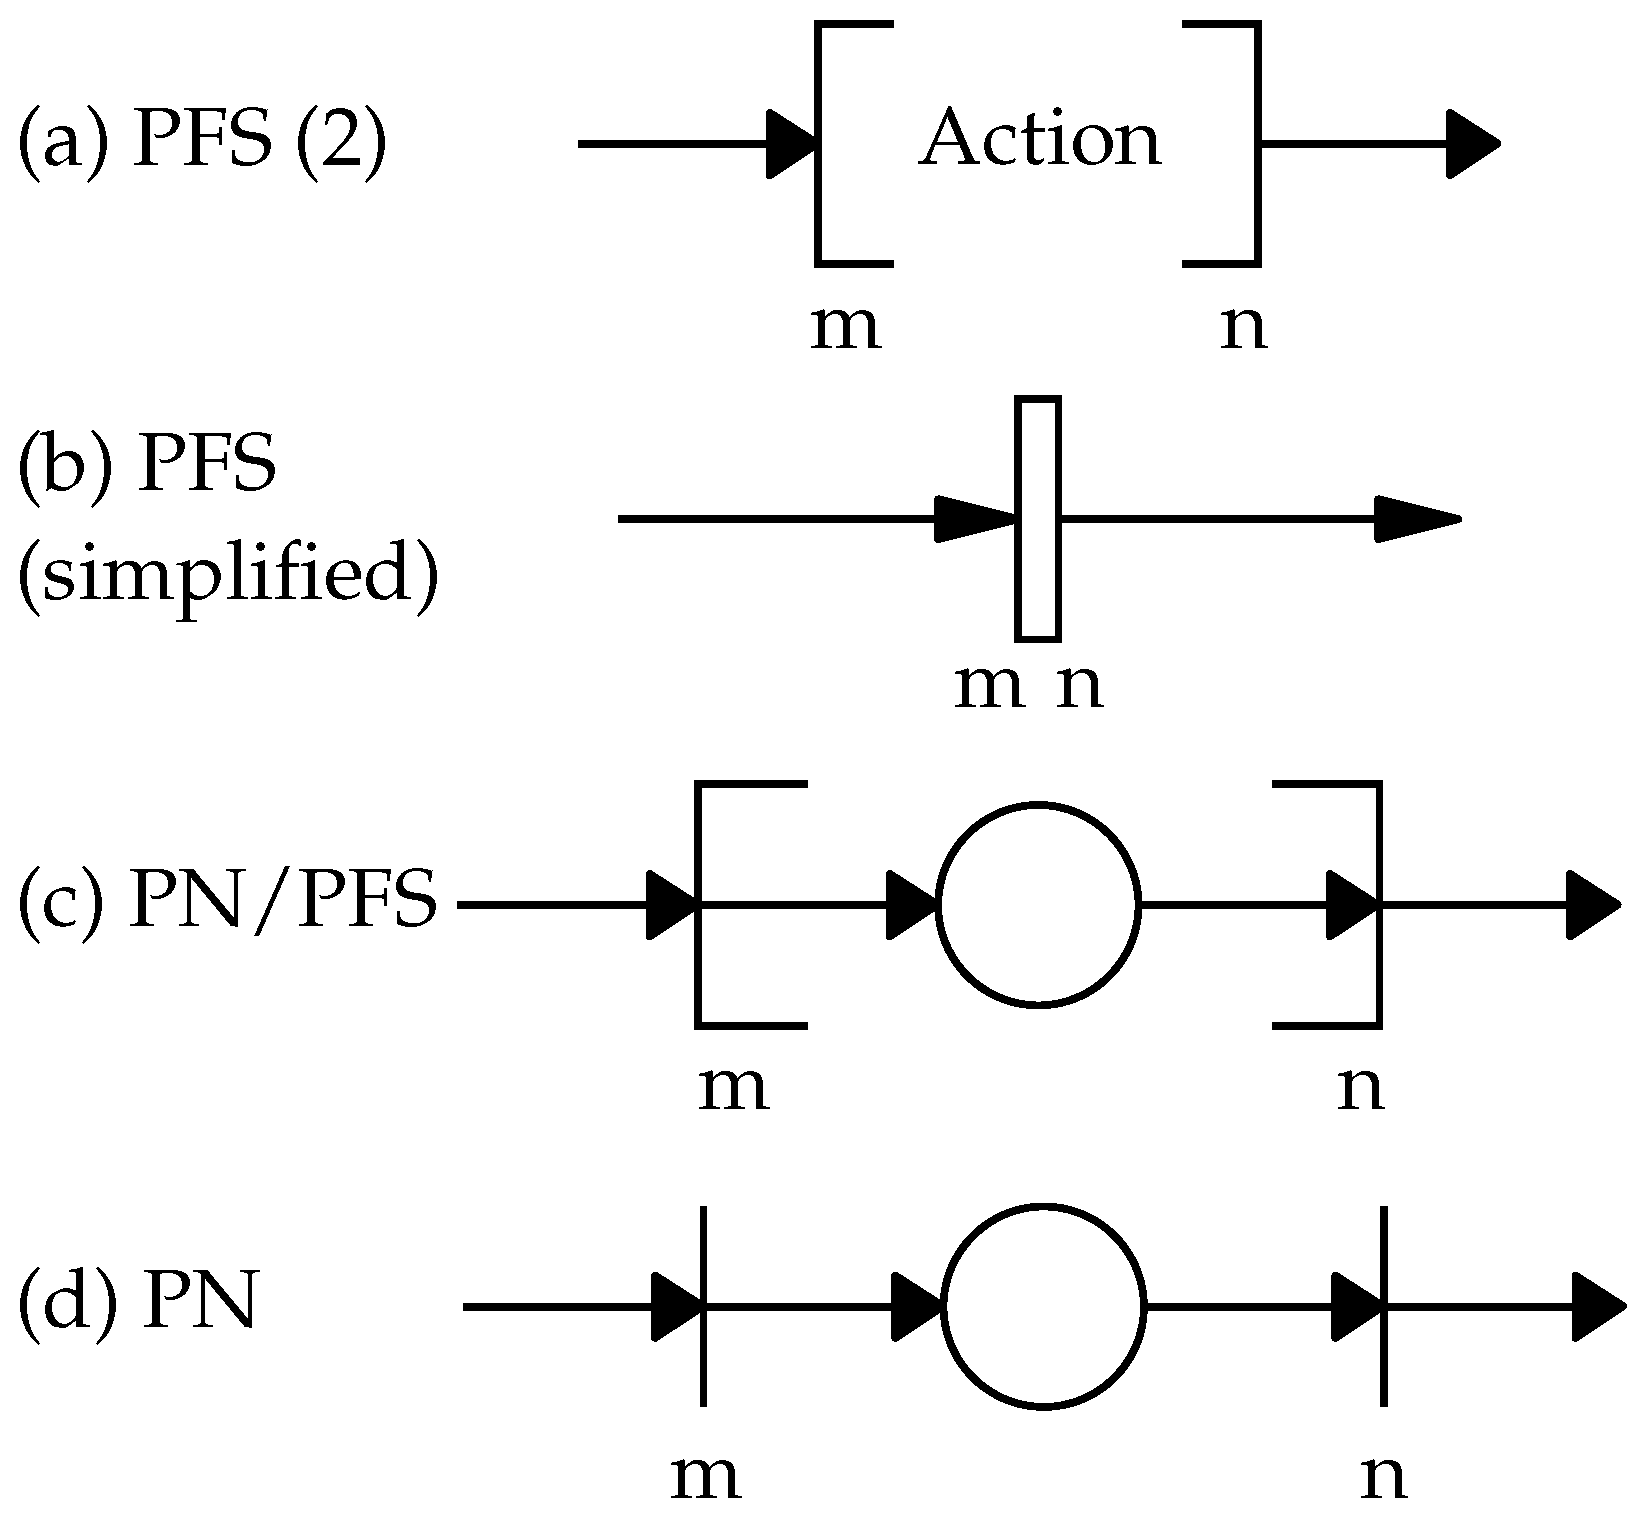
2.3. The Top-Down PFS/HPN Approach
2.4. SIS and BN/PN Approach
- Obtain the causal dependency relationships from the BN for each failure;
- Obtain the logical relationships between external variables (sensors) from the causal relationship;
- Build the HPN from the diagnostic reasoning, obtain an effect versus cause structure to represent the BN diagnostic model in HPN, so that it is possible to carry out the control;
- Consider in the HPN design that it must allow its restart to meet the required restartability property and consider the possibility of the failure being spurious, that is, the possibility of the diagnosis not being carried out considering the calculated uncertainties in the BN;
- Represent in the model the events associated with the transitions and how to represent them, indicating, in particular, the events that require an interaction with the external environment (for example, sensors and actuators).
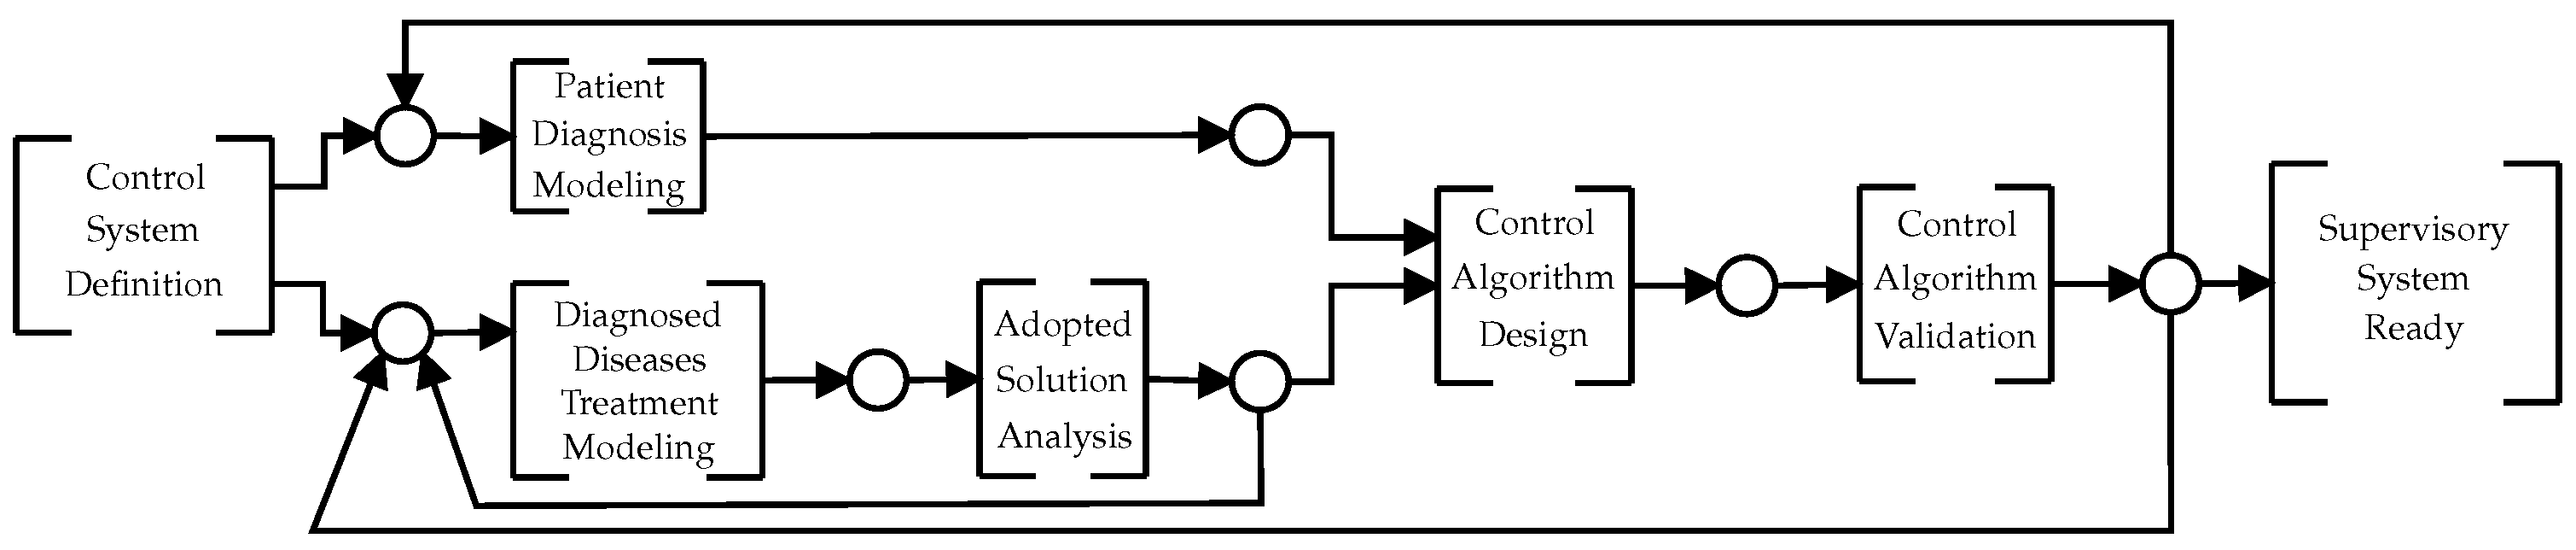
3. Proposed VAD Supervisory Control System Design Methodology
- Control System Definition—physicians, engineers, and specialist teams are defined to define the VAD autonomy. This is the team that is responsible for developing the control system. They need to select ideas that can be implemented taking into consideration: available sensors, performance characteristics of the VAD, and technological limitations. The VAD control functions are specified in this phase.
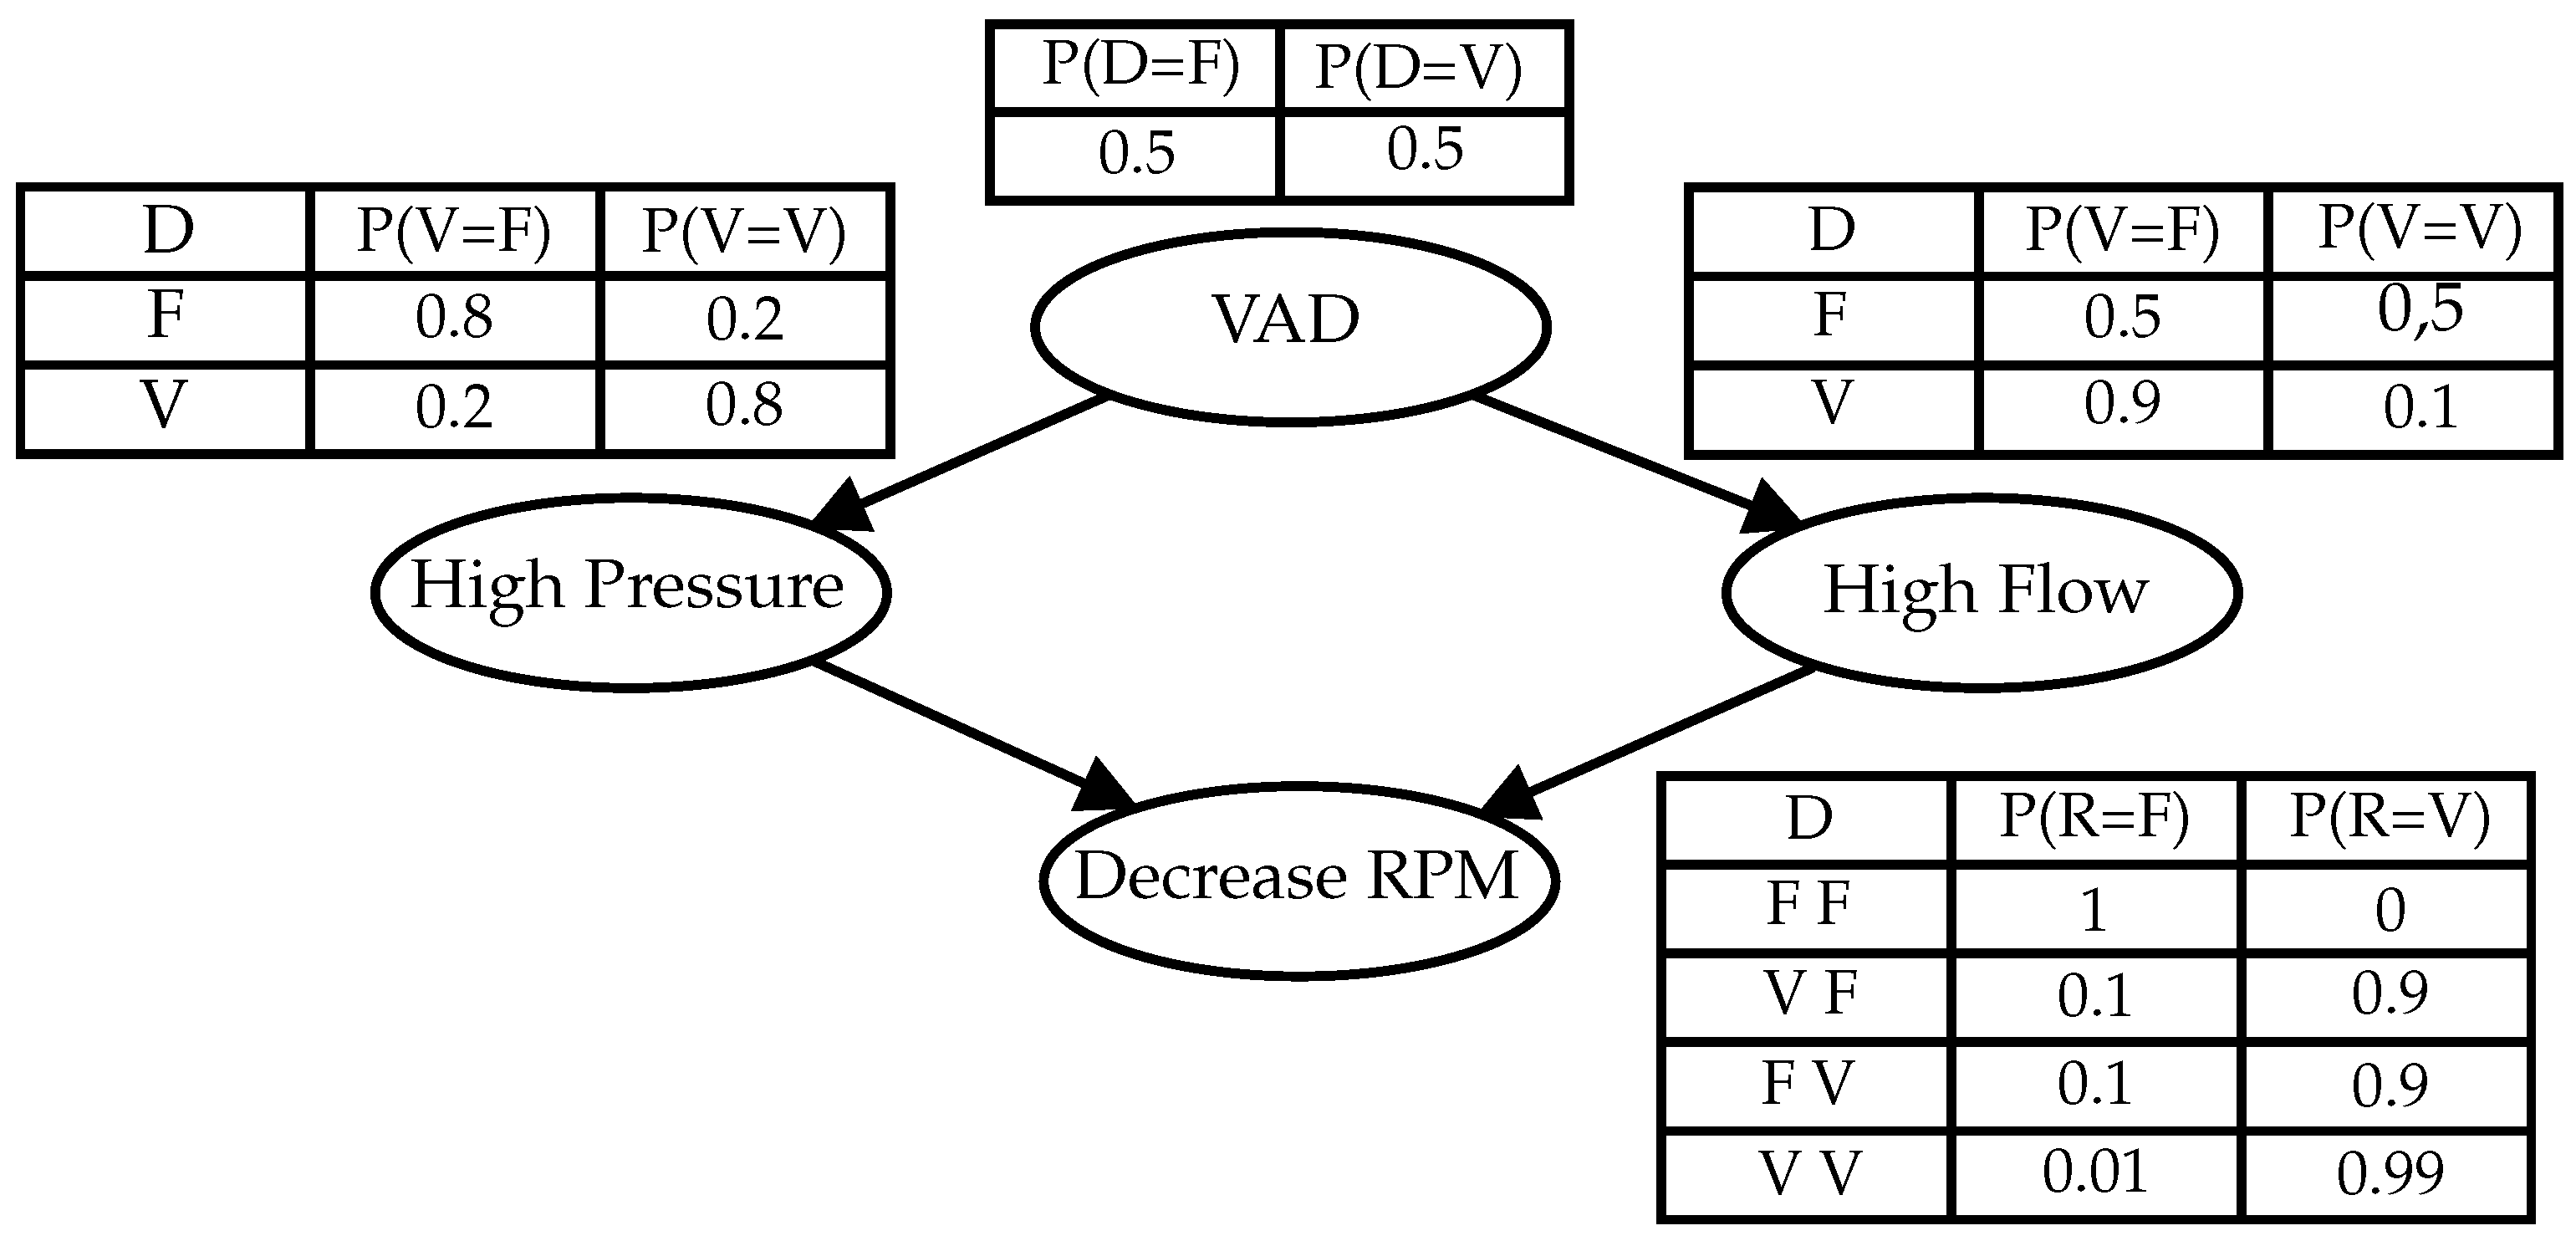
- Patient Diagnosis Modeling—The cause and effect matrix is created considering the definitions made in the last step. Every effect considered is converted to a node of a BN. Then, following the procedures proposed in [24] this fault diagnosis network can be converted into a PN control model.
- Diagnosed Diseases Treatment Modeling—To obtain the HAZOP (hazard and operability) study [15] for VAD, a risk analysis report can be used for the IEC 31010 standard. Thus, the SIL and events (from sensors) and actions (for actuators) for each SIF are obtained. Then, to obtain the safety instrumented systems (SIS), each SIFs are modeled in PN.
- Adopted Solution Analysis—To validate the obtained PN models, first a structural analysis is performed. Then, it is verified by PN deadlock (markings where no transition is enabled). For this, the Visual Object Net simulator [25] can be used.
- Control Algorithm Validation—To make “in vitro” tests, a mathematical model can be used to simulate the human cardiovascular system [17]. Once the control system is validated, the next step is to implement the prototype physically to confirm the functionality of the cardiovascular simulator system. At the Institute Dante Pazzanese of Cardiology (IDPC), there is a programmable mechanical simulator to perform in vitro tests. This equipment allows to simulate a real patient cardiovascular system [27].
- Supervisory System Ready—This step amounts the in vivo validation of the control algorithm. Once the in vitro simulation is validated, the VAD control algorithm is ready for in vivo testing [2].
4. Results
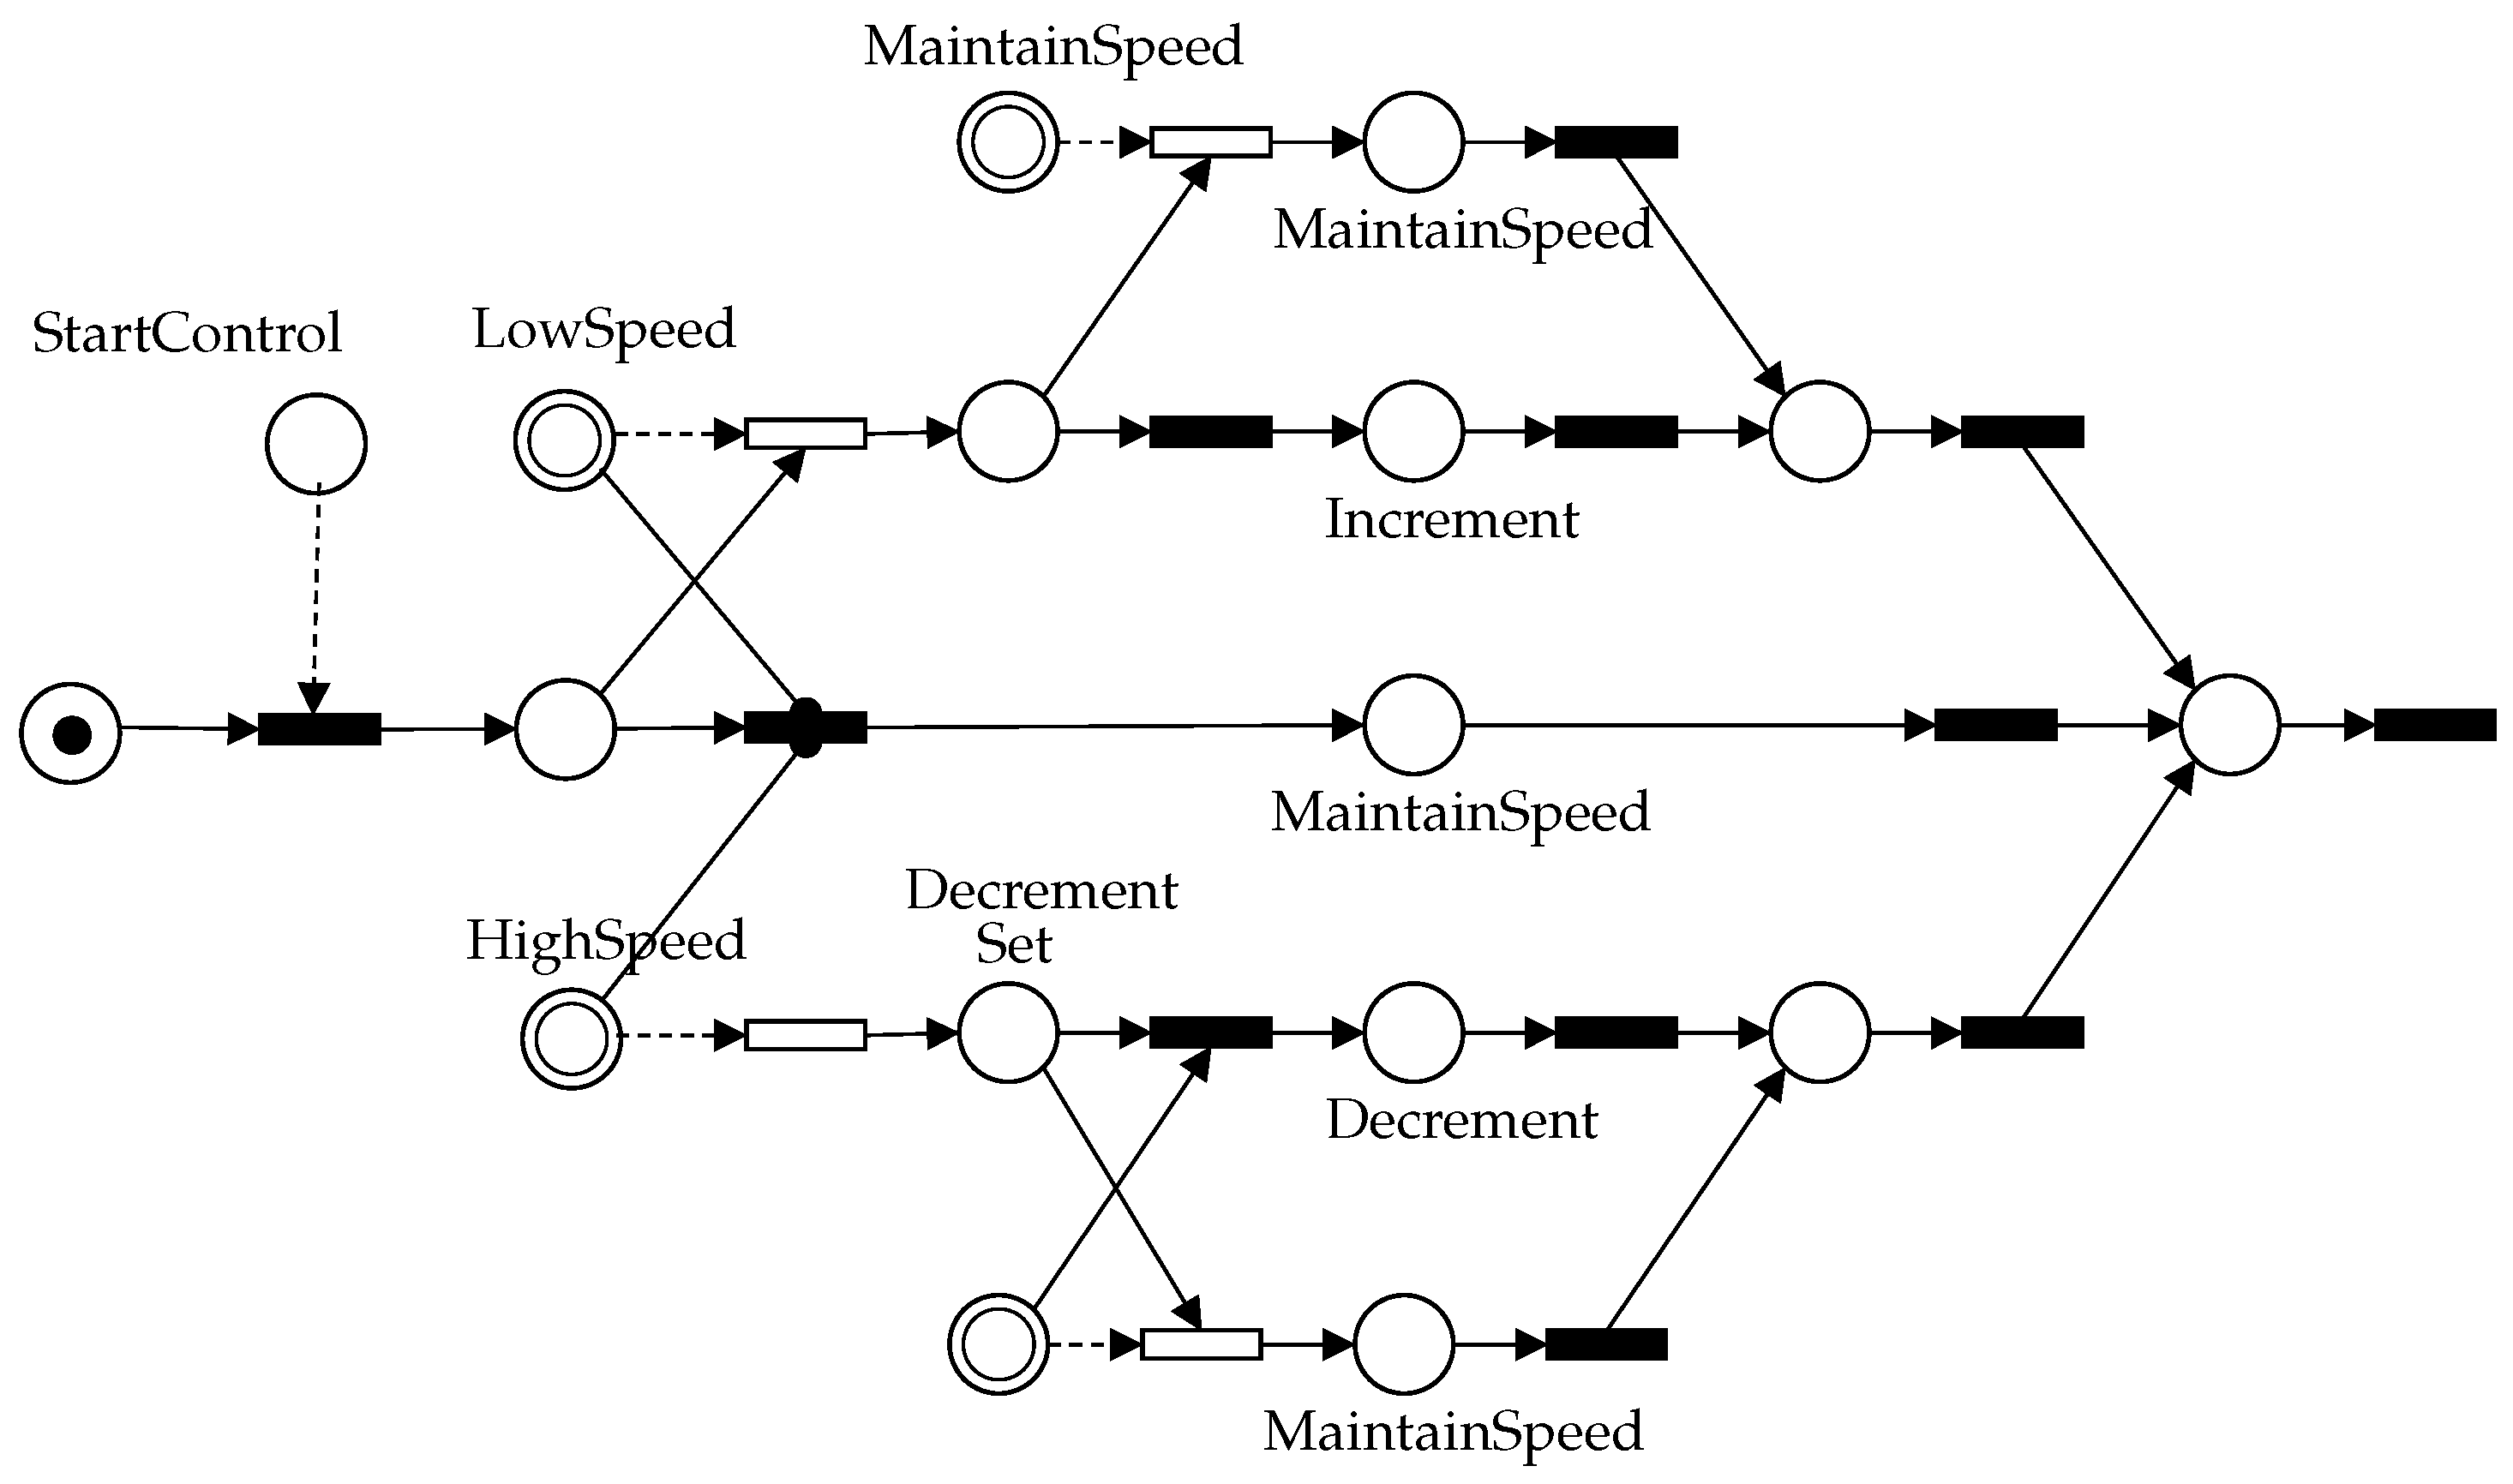
4.1. Supervisory Design
4.2. Control Design
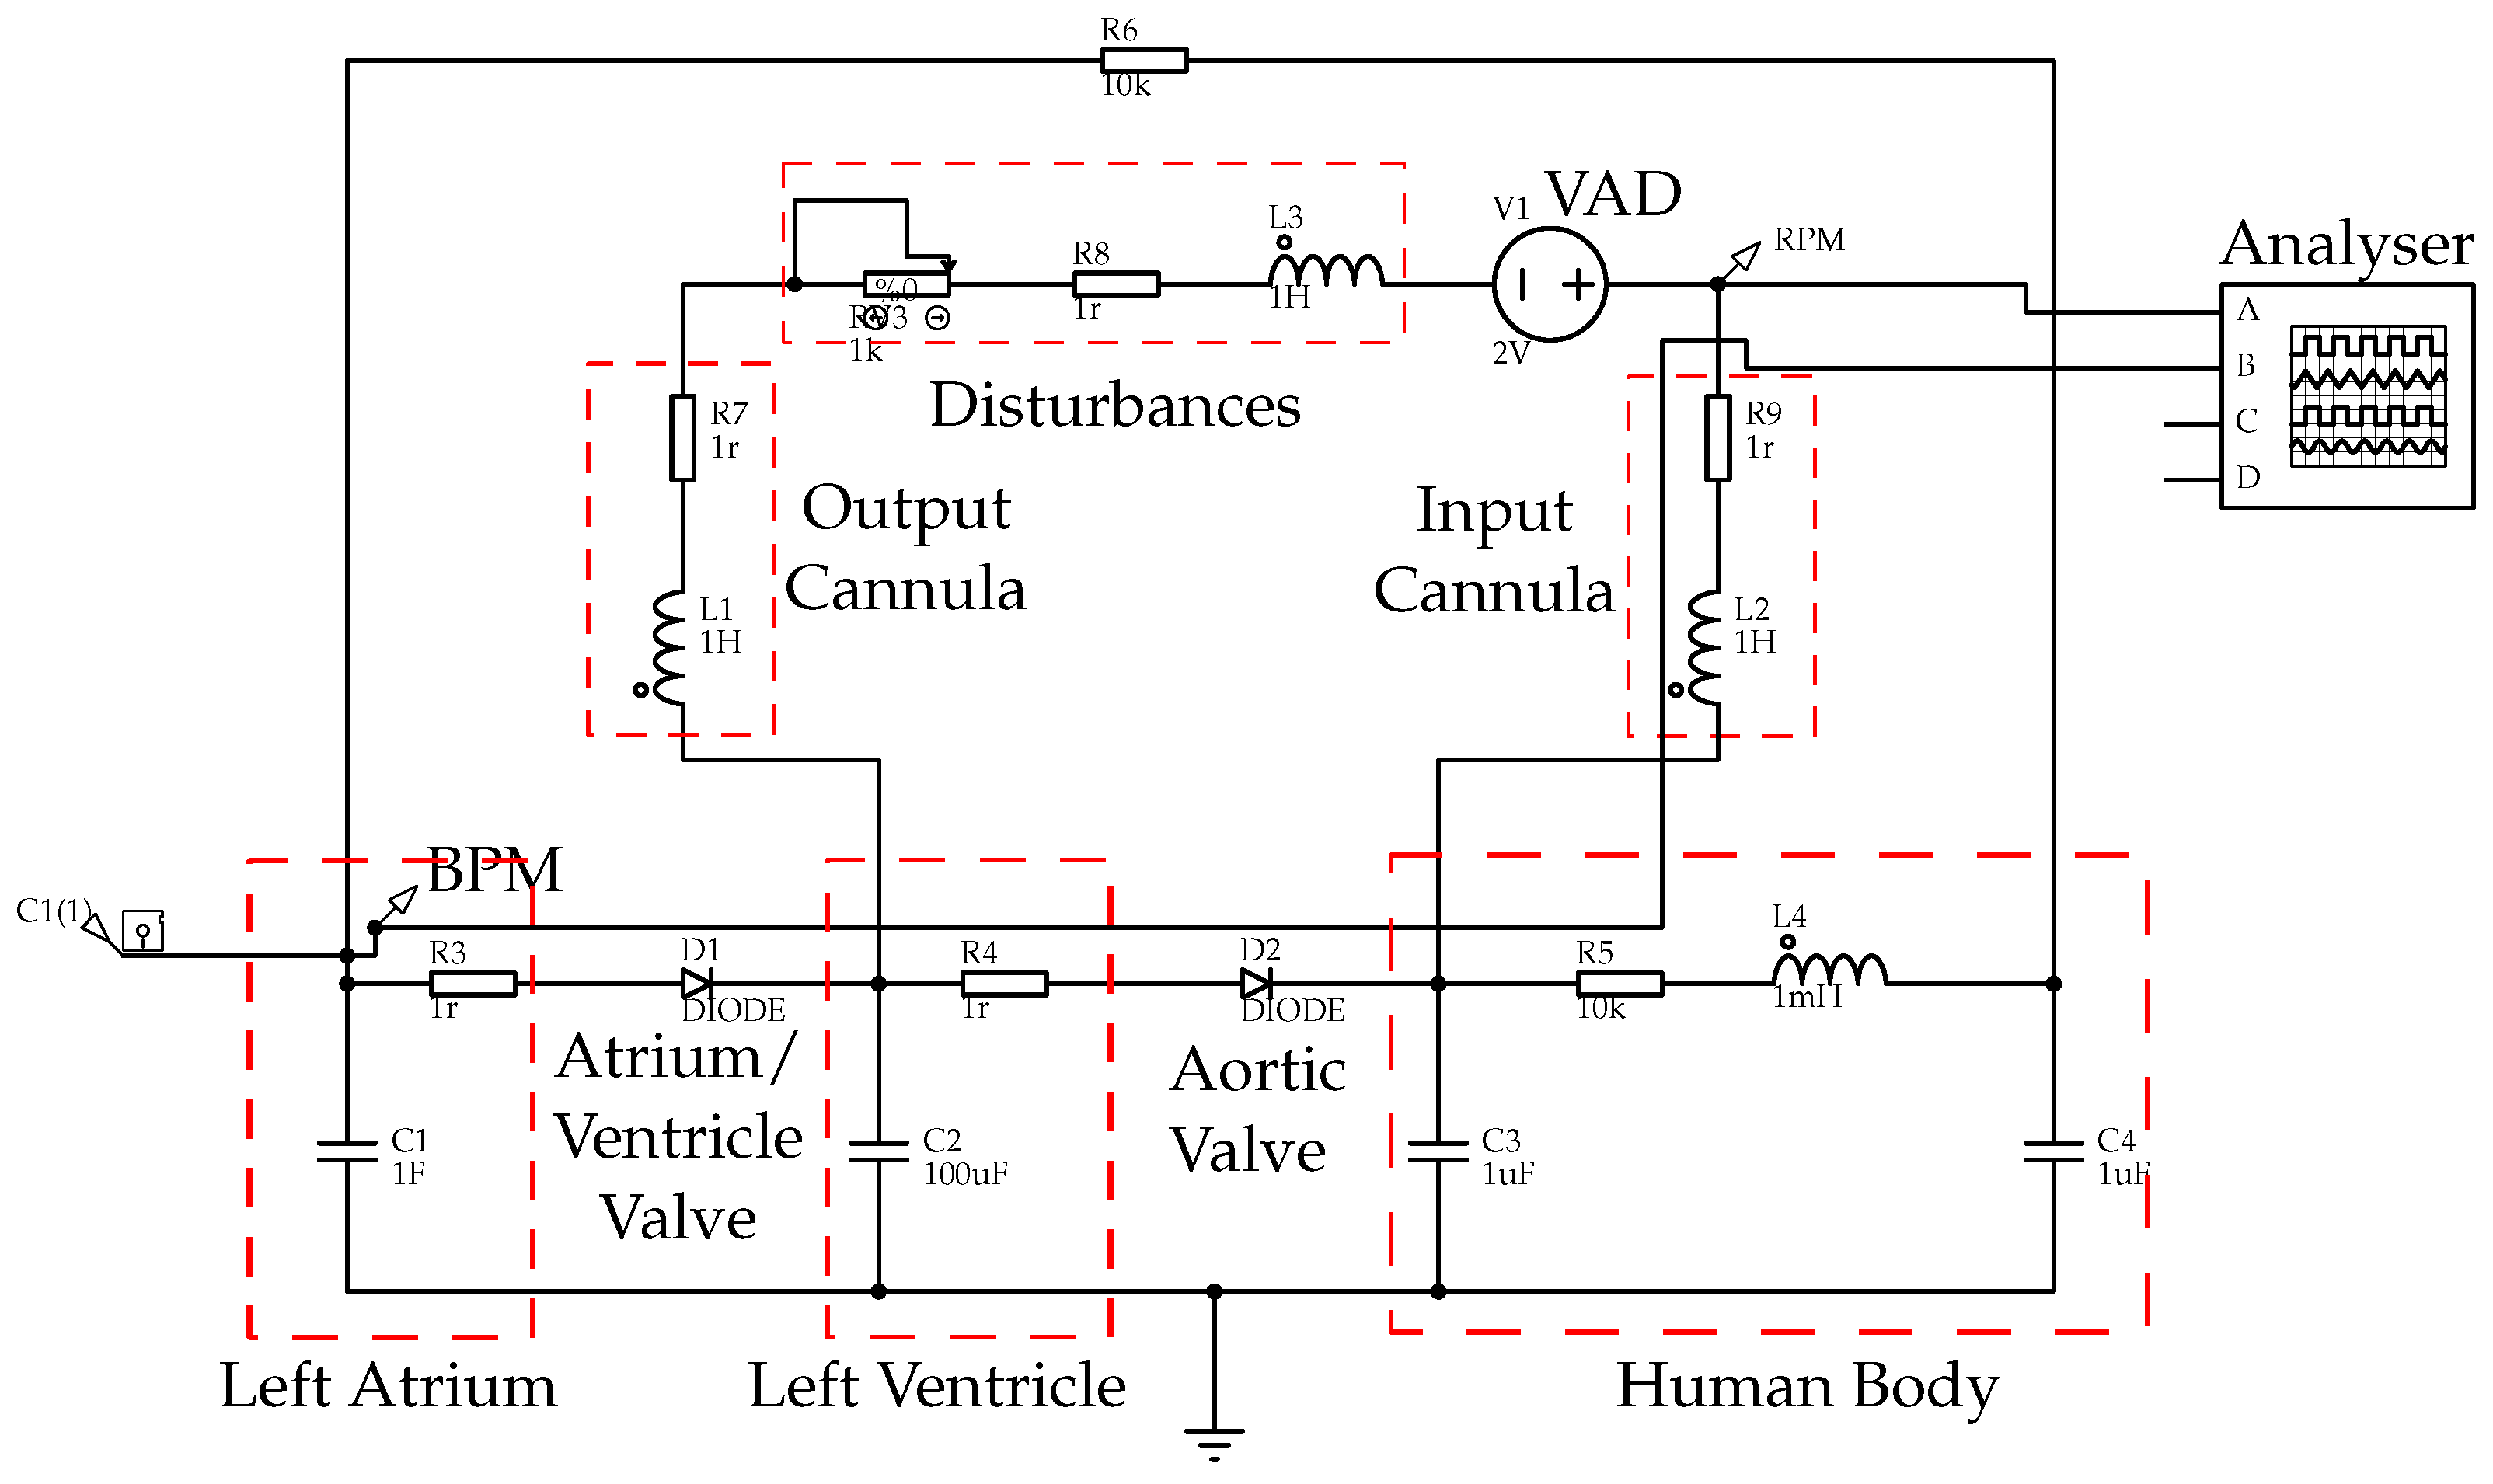
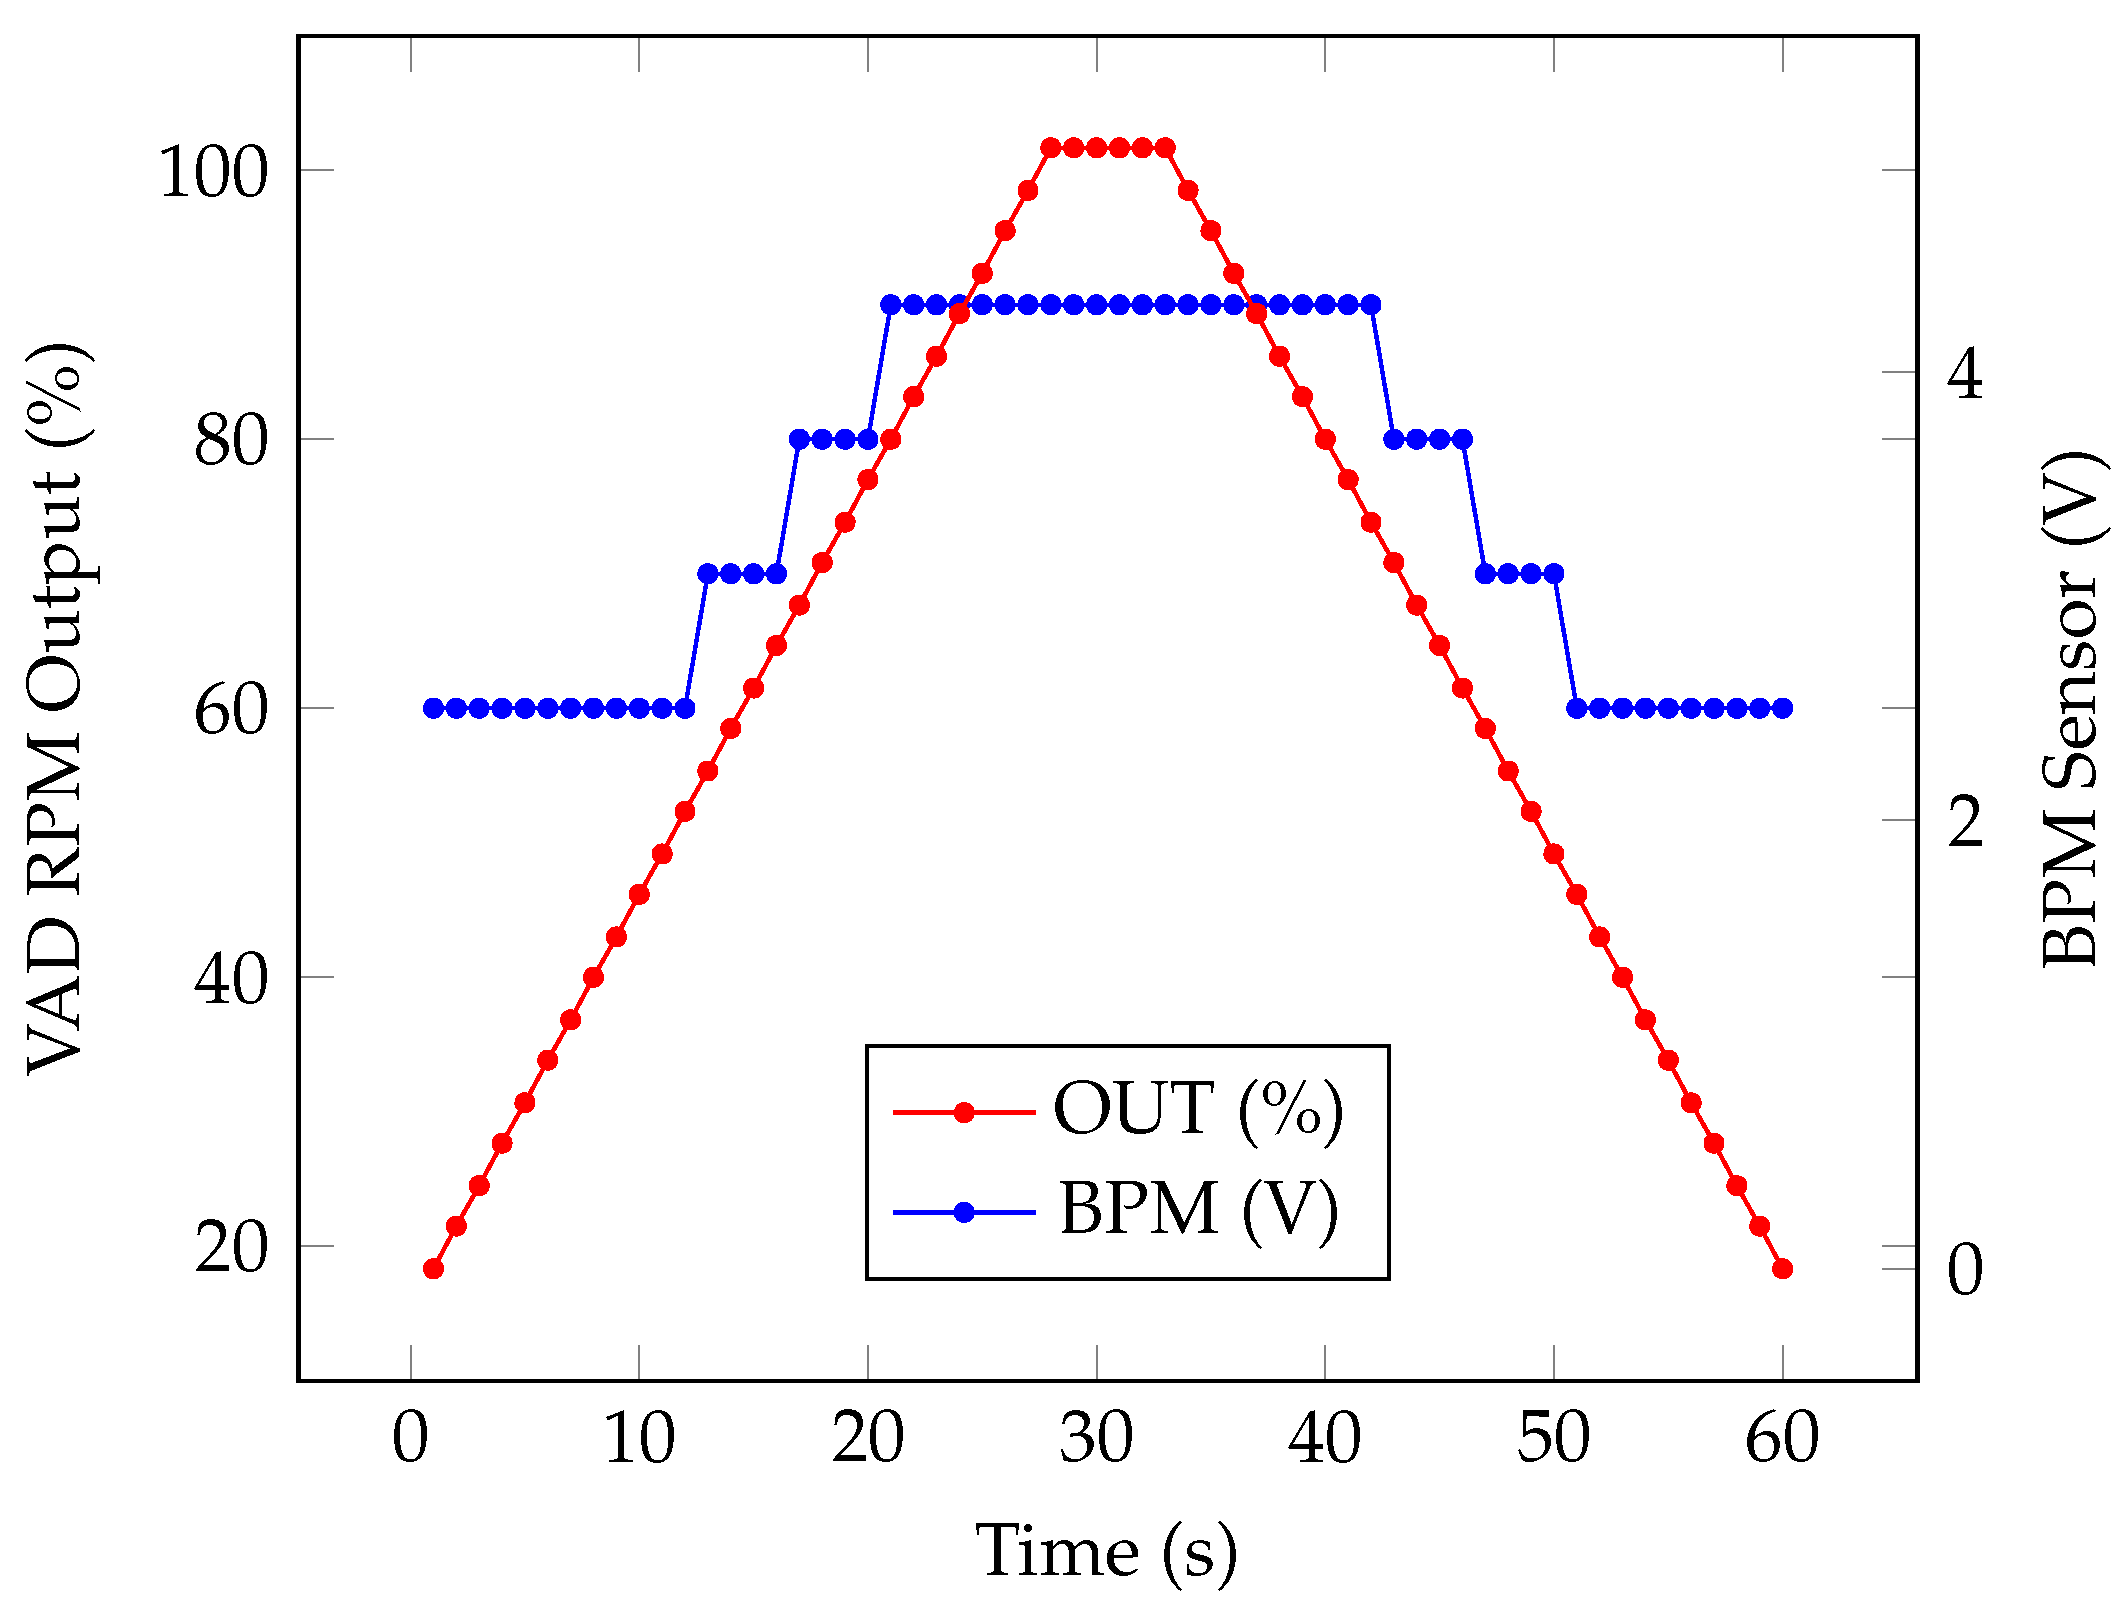
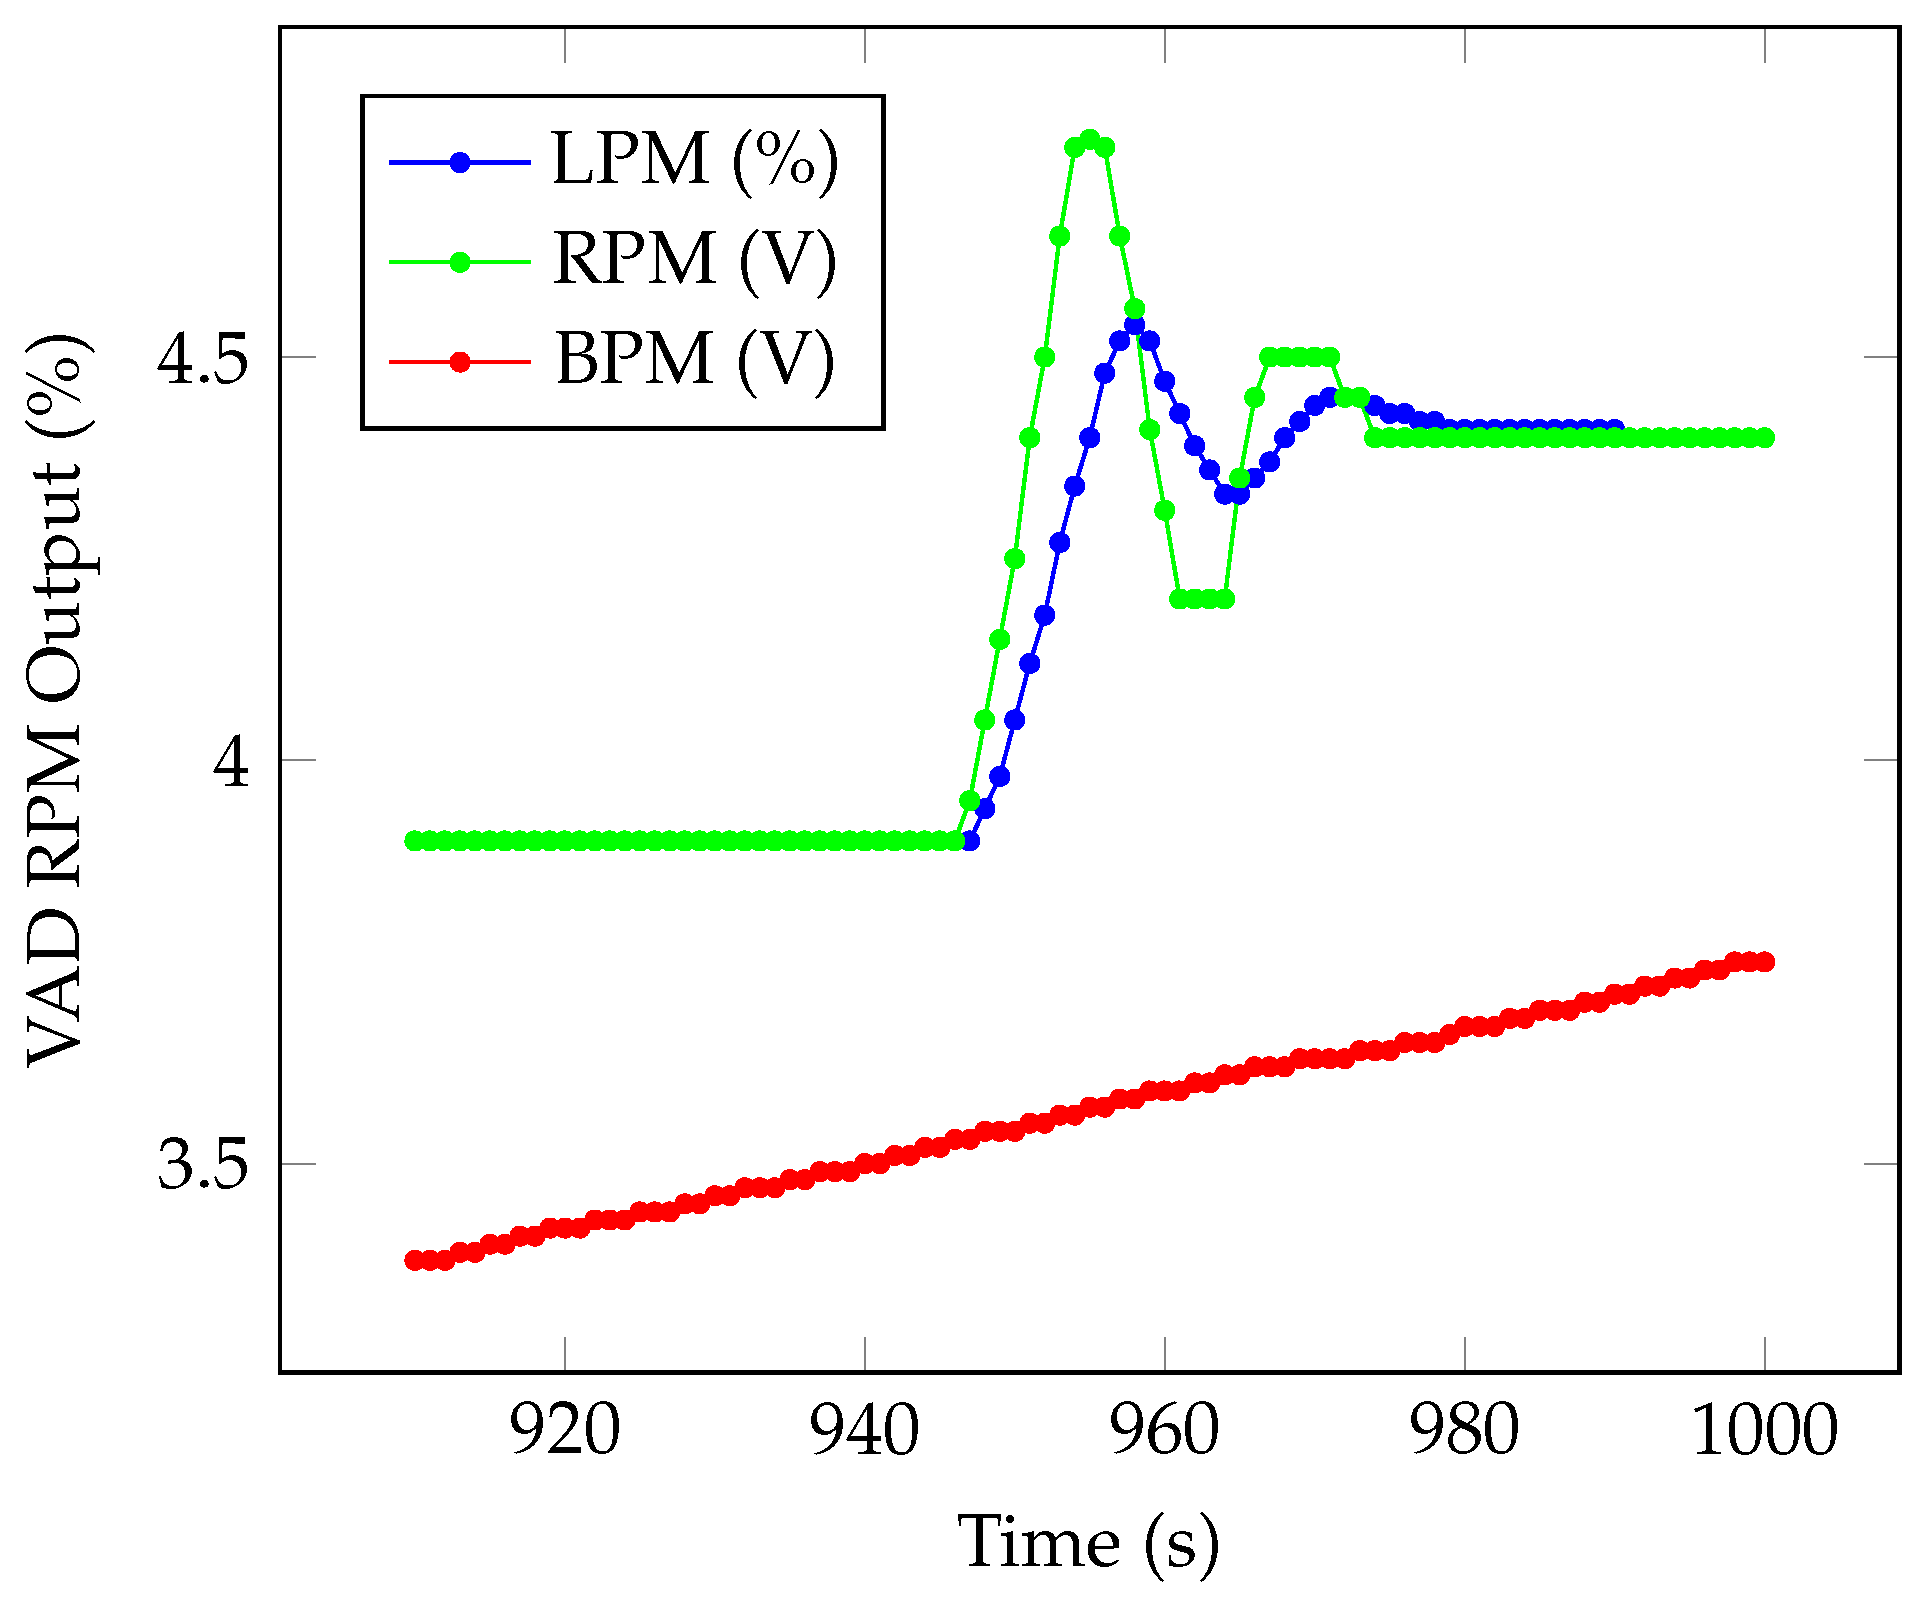
4.3. Numerical Simulation
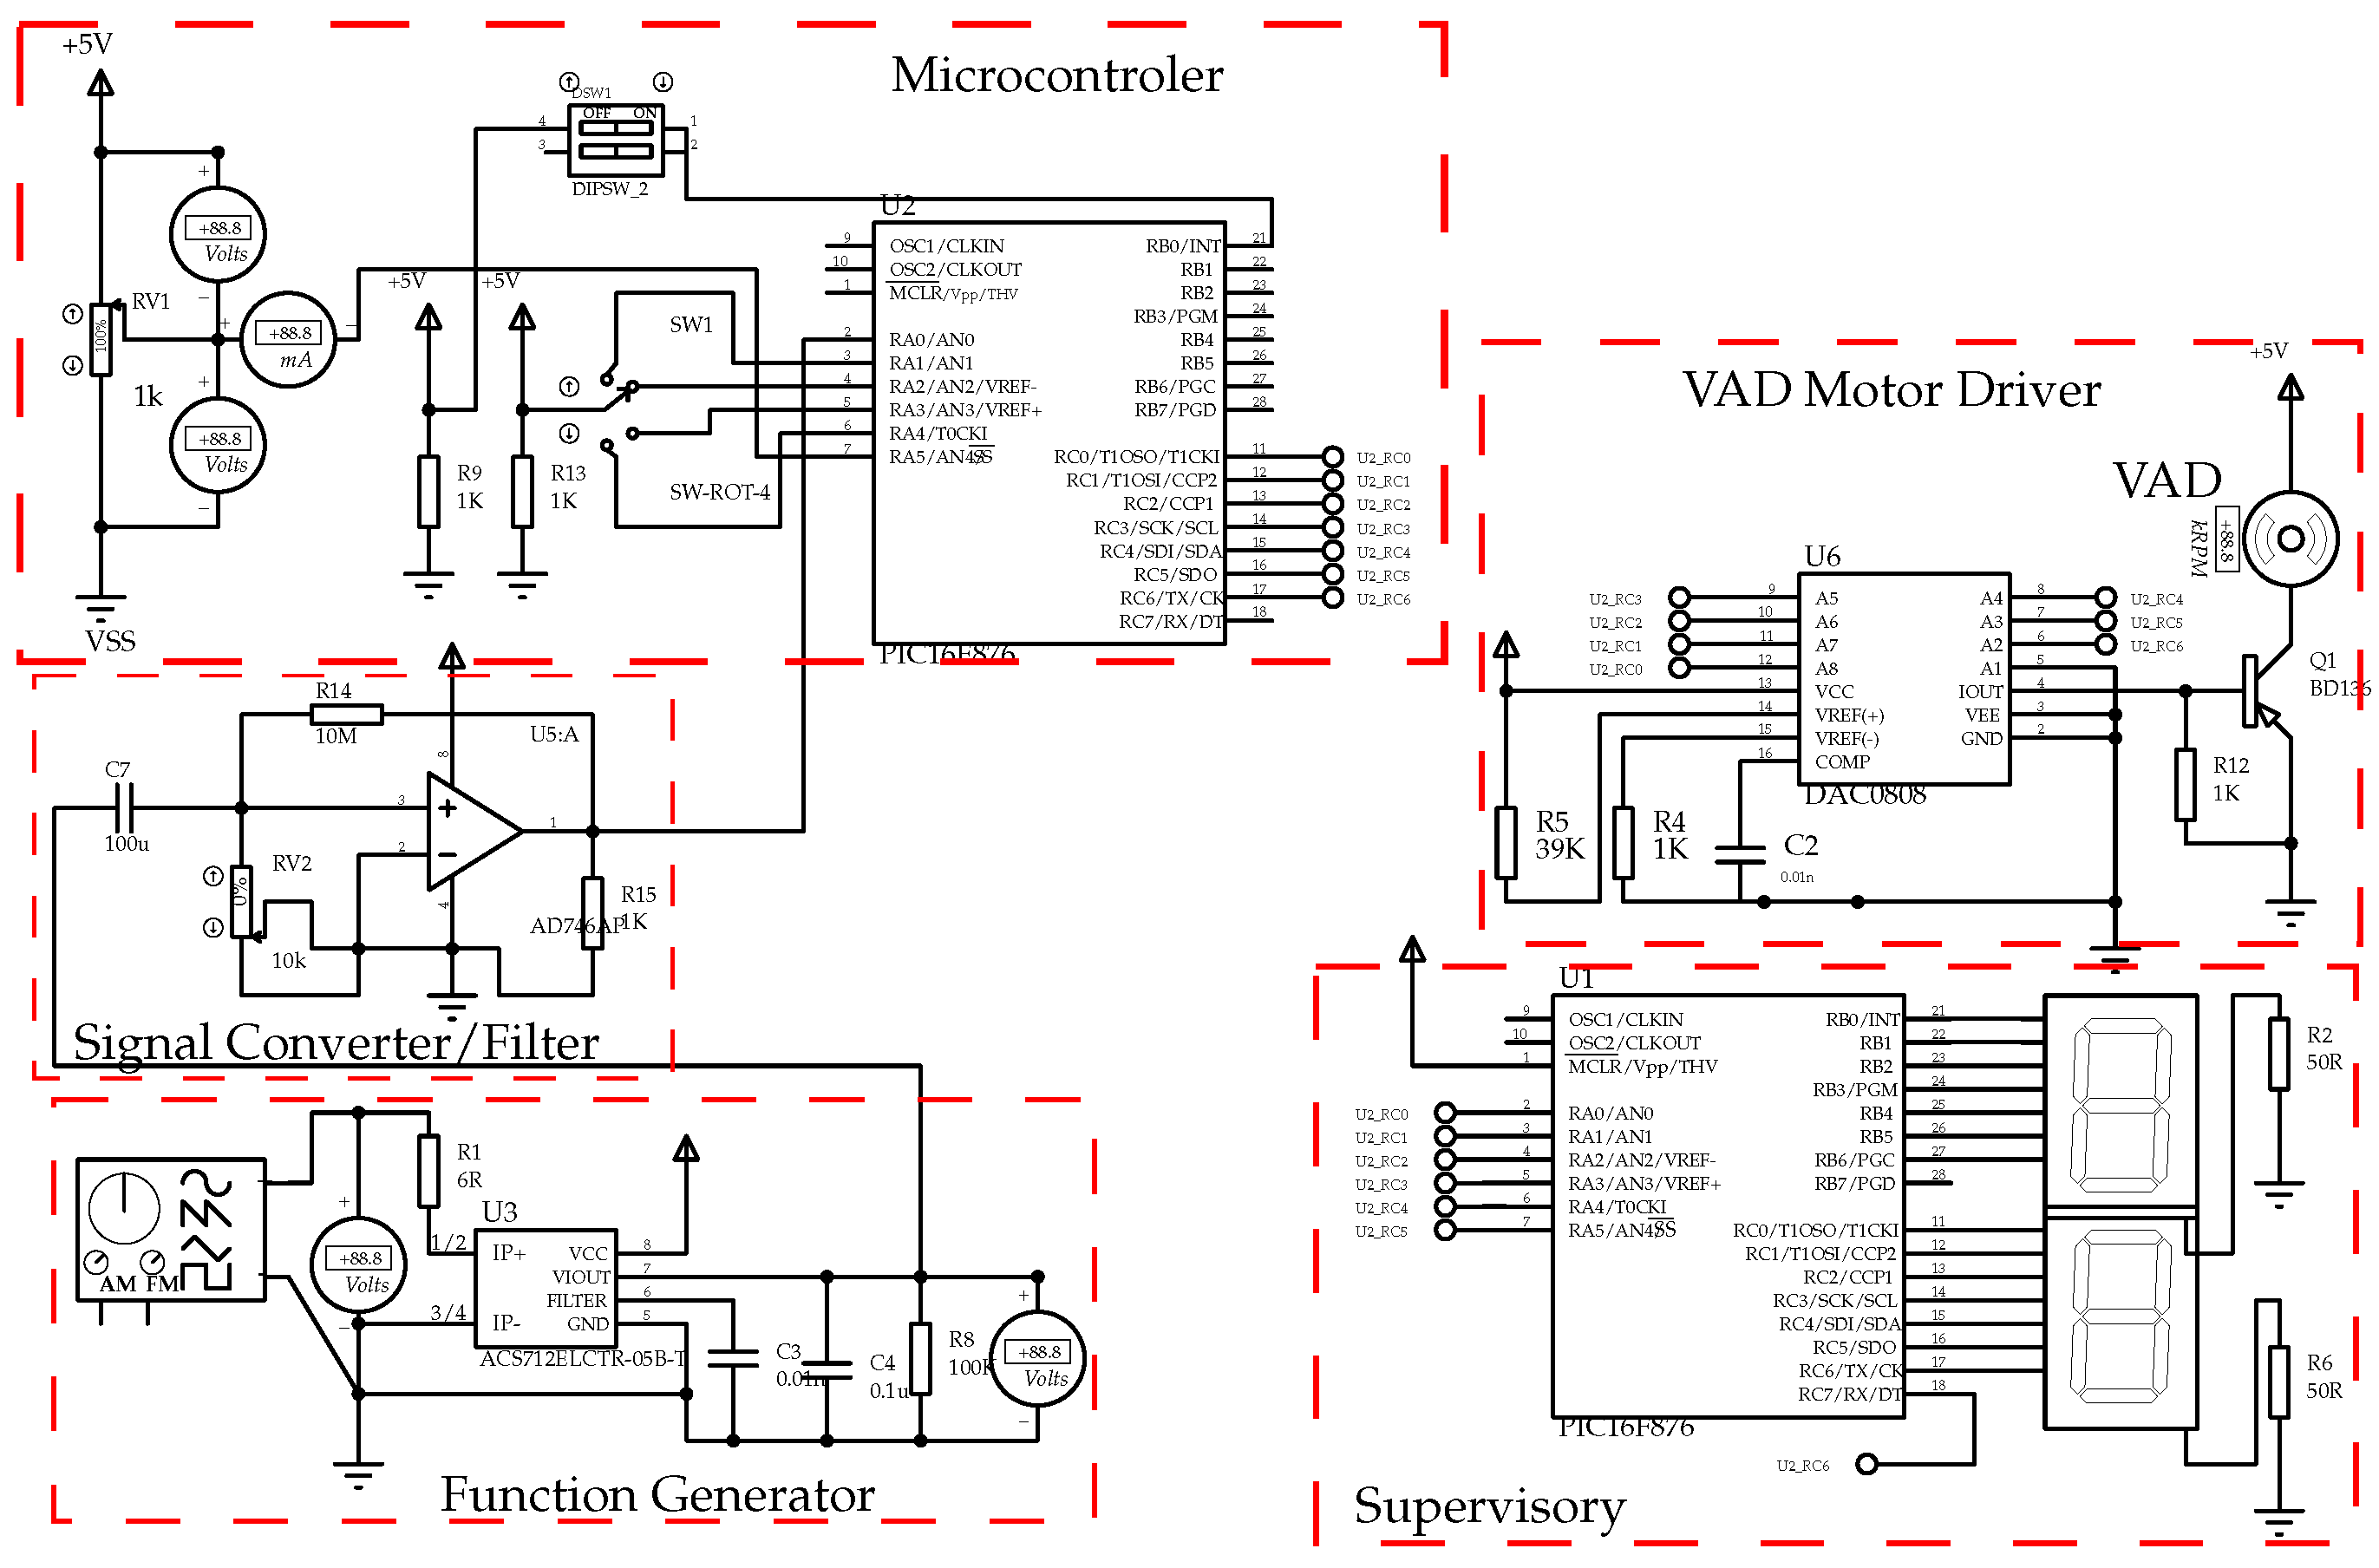
- Microcontroller: device responsible for executing the security control;
- VAD Motor Driver: device responsible for driving the VAD motor;
- Supervisory: device responsible for the human-machine interface;
- Function Generator: equipment used to simulate the signals coming from the sensors and generate disturbances to carry out analysis of the control system;
- Signal Converter/Filter: device responsible for conditioning the signals generated by the function generator.
5. VAD Validation
6. Conclusions and Future Works
Author Contributions
Funding
Institutional Review Board Statement
Informed Consent Statement
Data Availability Statement
Conflicts of Interest
References
- Wada, E.A.E.; Andrade, A.J.P.; Nicolosi, D.E.C.; Bock, E.G.P.; Fonseca, J.W.G.; Leme, J.; Dinkhuysen, J.J.; Biscegli, J.F. Review of the spiral pump performance test, during cardiopulmonary bypass, in 43 patients. In Proceedings of the Technology Meets Surgery International, ABCM, São Paulo, Brazil, 18–19 July 2005. [Google Scholar]
- Andrade, A.; Nicolosi, D.; Lucchi, J.; Biscegli, J.; Arruda, A.C.; Ohashi, Y.; Mueller, J.; Tayama, E.; Glueck, J.; Nosé, Y. Auxiliary total artificial heart: A compact electromechanical artificial heart working simultaneously with the natural heart. Artif. Organs 1999, 23, 876–880. [Google Scholar] [CrossRef]
- Ohashi, Y.; de Andrade, A.; Müller, J.; Nosé, Y. Control System Modification of an Electromechanical Pulsatile Total Artifical Heart. Artif. Organs 1997, 21, 1308–1311. [Google Scholar] [CrossRef]
- DeVore, A.D.; Patel, P.A.; Patel, C.B. Medical Management of Patients With a Left Ventricular Assist Device for the Non-Left Ventricular Assist Device Specialist. JACC Heart Fail. 2017, 5, 621–631. [Google Scholar] [CrossRef] [PubMed]
- Chase, J.G.; Tsuzuki, M.S.G.; Benyó, B.; Desaive, T. Editorial: Special Section on Biological Medical Systems. Annu. Rev. Control 2019, 48, 357–358. [Google Scholar] [CrossRef]
- Shafiee, M.; Animah, I. Life extension decision making of safety critical systems: An overview. J. Loss Prev. Process Ind. 2017, 47, 174–188. [Google Scholar] [CrossRef] [Green Version]
- Ghista, D.N.; Patil, K.M.; Gould, P.; Woo, K.B. Computerized left ventricular mechanics and control system analyses models relevant for cardiac diagnosis. Comput. Biol. Med. 1973, 3, 27–46. [Google Scholar] [CrossRef]
- Antaki, J.F.; Boston, J.R.; Simaan, M.A. Control of Heart Assist Devices. In Proceedings of the 42nd IEEE Conference on Decision and Control, Maui, HI, USA, 9–12 December 2003; Volume 4, pp. 4084–4089. [Google Scholar]
- Su, S.W.; Wangt, L.; Celler, B.G.; Savkin, A.V.; Guo, Y. Modelling and control for heart rate regulation during treadmill exercise. In Proceedings of the Annual International Conference of the IEEE Engineering in Medicine and Biology, New York, NY, USA, 30 August–3 September 2006; pp. 4299–4304. [Google Scholar]
- Leão, T.F. Técnica de Controle Automático da Rotação de Bombas de assistência Ventricular. Ph.D. Thesis, Universidade de São Paulo, São Paulo, Brazil, 2015. [Google Scholar]
- Cavalheiro, A.; Fo, D.S.; Andrade, A.; Cardoso, J.R.; Bock, E.; Fonseca, J.; Miyagi, P.E. Design of Supervisory Control System for Ventricular Assist Device. In IFIP Advances in Information and Communication Technology; Springer: Berlin/Heidelberg, Germany, 2011; Volume 349 AICT, pp. 375–382. [Google Scholar]
- Tsuzuki, M.S.G.; Martins, T.C.; Takimoto, R.T.; Tanabi, N.; Sato, A.K.; Scaff, W.; Johansen, C.F.D.; Campos, C.A.T.; Kalynytschenko, E.; Silva, H.F.; et al. Mechanical Ventilator VENT19. Polytechnica 2021, 4, 33–46. [Google Scholar] [CrossRef]
- Cooper, G.F.; Herskovits, E. A Bayesian method for the induction of probabilistic networks from data. Mach. Learn. 1992, 9, 309–347. [Google Scholar] [CrossRef]
- Squillante Jr, R.; Santos Filho, D.J.; Garcia Melo, J.I.; Junqueira, F.; Miyagi, P.E. Safety instrumented system designed based on Bayesian network and Petri net. In Proceedings of the 8th International Conference on Mathematical problems in Engineering, Aerospace and Sciences (ICNPAA), São José dos Campos, Brazil, 30 June–3 July 2010. [Google Scholar]
- IEC. Functional Safety of Electrical/Electronic/Programmable Electronic Safety-Related Systems (IEC 61508), 1st ed.; International Electrotechnical Commission: Geneva, Switzerland, 1998. [Google Scholar]
- Matsuno, H.; Tanaka, Y.; Aoshima, H.; Doi, A.; Matsui, M.; Miyano, S. Biopathways representation and simulation on hybrid functional Petri Net. Silico Biol. 2003, 3, 389–404. [Google Scholar]
- Abdolrazaghi, M.; Navidbakhsh, M.; Hassani, K. Mathematical Modelling and Electrical Analog Equivalent of the Human Cardiovascular System. Cardiovasc. Eng. 2010, 10, 45–51. [Google Scholar] [CrossRef] [PubMed]
- Murata, T. Petri Nets: Properties, Analysis and Applications. Proc. IEEE 1989, 77, 541–580. [Google Scholar] [CrossRef]
- Li, Z.; Zhao, M. On controllability of dependent siphons for deadlock prevention in generalized Petri nets. IEEE Trans. Syst. Man, Cybern. Part A Syst. Hum. 2008, 38, 369–384. [Google Scholar]
- Villani, E.; Miyagi, P.E.; Valette, R. Landing system verification based on petri nets and a hybrid approach. IEEE Trans. Aerosp. Electron. Syst. 2006, 42, 1420–1436. [Google Scholar] [CrossRef]
- Ho, Y.C.; Society, I.C.S. Discrete Event Dynamic Systems: Analyzing Complexity and Performance in the Modern World; Institute of Electrical and Electronics Engineers: Piscataway, NJ, USA, 1992; p. 291. [Google Scholar]
- Barari, A.; Tsuzuki, M.S.G.; Cohen, Y.; Macchi, M. Intelligent manufacturing systems towards industry 4.0 era. J. Intell. Manuf. 2021, 32, 1793–1796. [Google Scholar] [CrossRef]
- Cavalheiro, A.C.; Fo, D.J.S.; Andrade, A.; Cardoso, J.R.; Horikawa, O.; Bock, E.; Fonseca, J. Specification of supervisory control systems for ventricular assist devices. Artif. Organs 2011, 35, 465–470. [Google Scholar] [CrossRef] [PubMed]
- Cavalheiro, A.C.M. Sistema de Controle para Diagnóstico e Tratamento de Falhas em Dispositivos de Assistência Ventricular. Ph.D. Thesis, Universidade de São Paulo, São Paulo, Brazil, 2013. [Google Scholar]
- Petri Net Based Engineer Tool; Version 2.7a, Copyright Dr. Rainer Drath. Visual Object Net. 2007. Available online: https://www.r-drath.de/Drath/Home/Visual_Object_Net++.html (accessed on 15 October 2021).
- IEC. Programmable Controllers Part 3, Programming Languages (IEC1131-3), 1st ed.; International Electrotechnical Commission: Geneva, Switzerland, 1993. [Google Scholar]
- Felipini, C.L.; de Andrade, A.J.; Lucchi, J.C.; da Fonseca, J.W.; Nicolosi, D. An electro-fluid-dynamic simulator for the cardiovascular system. Artif. Organs 2008, 32, 349–354. [Google Scholar] [CrossRef] [PubMed]
- Bock, E.; Andrade, A.J.; Dinkhuysen, J.; Arruda, C.; Fonseca, J.; Leme, J.; Utiyama, B.; Leao, T.; Uebelhart, B.; Antunes, P.; et al. Introductory tests to in vivo evaluation: Magnetic coupling influence in motor controller. ASAIO J. 2011, 57, 462–465. [Google Scholar] [CrossRef] [PubMed]
- Silva, B.U.D.; Jatene, A.D.; Leme, J.; Fonseca, J.W.; Silva, C.; Uebelhart, B.; Suzuki, C.K.; Andrade, A.J. In vitro assessment of the apico aortic blood pump: Anatomical positioning, hydrodynamic performance, hemolysis studies, and analysis in a hybrid cardiovascular simulator. Artif. Organs 2013, 37, 950–953. [Google Scholar] [CrossRef] [PubMed]
- Silva, C.D.; Silva, B.U.D.; Leme, J.; Uebelhart, B.; Dinkhuysen, J.; Biscegli, J.F.; Andrade, A.J.; Zavaglia, C. In vivo evaluation of centrifugal blood pump for cardiopulmonary bypass-spiral pump. Artif. Organs 2013, 37, 954–957. [Google Scholar] [CrossRef] [PubMed]
- Dinkhuysen, J.J.; de Andrade, A.J.P.; Leme, J.; Silva, C.; Medina, C.S.; Pereira, C.C.; Biscegli, J.F. Clinical evaluation of the Spiral Pump® after improvements to the original project in patients submitted to cardiac surgeries with cardiopulmonary bypass. Braz. J. Cardiovasc. Surg. 2014, 29, 330–337. [Google Scholar]


Publisher’s Note: MDPI stays neutral with regard to jurisdictional claims in published maps and institutional affiliations. |
© 2021 by the authors. Licensee MDPI, Basel, Switzerland. This article is an open access article distributed under the terms and conditions of the Creative Commons Attribution (CC BY) license (https://creativecommons.org/licenses/by/4.0/).
Share and Cite
Cavalheiro, A.C.M.; Santos Filho, D.J.; Dias, J.C.; Andrade, A.J.P.; Cardoso, J.R.; Tsuzuki, M.S.G. Safety Control Architecture for Ventricular Assist Devices. Machines 2022, 10, 5. https://doi.org/10.3390/machines10010005
Cavalheiro ACM, Santos Filho DJ, Dias JC, Andrade AJP, Cardoso JR, Tsuzuki MSG. Safety Control Architecture for Ventricular Assist Devices. Machines. 2022; 10(1):5. https://doi.org/10.3390/machines10010005
Chicago/Turabian StyleCavalheiro, André C. M., Diolino J. Santos Filho, Jônatas C. Dias, Aron J. P. Andrade, José R. Cardoso, and Marcos S. G. Tsuzuki. 2022. "Safety Control Architecture for Ventricular Assist Devices" Machines 10, no. 1: 5. https://doi.org/10.3390/machines10010005