Article

Assessing Graph Robustness through Modified Zagreb Index

School of Mathematics and Statistics, Guangdong University of Technology, Guangzhou 510006, China
*
Author to whom correspondence should be addressed.
Axioms 2022, 11(9), 484; https://doi.org/10.3390/axioms11090484
Submission received: 23 July 2022 / Revised: 9 September 2022 / Accepted: 15 September 2022 / Published: 19 September 2022
(This article belongs to the Special Issue Graph Theory with Applications)

Abstract

:
Graph robustness or network robustness is the ability that a graph or a network preserves its connectivity or other properties after the loss of vertices and edges, which has been a central problem in the research of complex networks. In this paper, we introduce the Modified Zagreb index and Modified Zagreb index centrality as novel measures to study graph robustness. We theoretically find some relationships between these novel measures and some other graph measures. Then, we use Modified Zagreb index centrality to analyze the robustness of BA scale-free networks, ER random graphs and WS small world networks under deliberate or random vertex attacks. We also study the correlations between this new measure and some other existed measures. Finally, we use Modified Zagreb index centrality to study the robustness of two real world networks. All these results demonstrate the efficiency of Modified Zagreb index centrality for assessing the graph robustness.

1. Introduction

1.1. Definitions

Let G = G ( V , E ) be an undirected graph, where V = v 1 , , v n represents the set of vertices and E V × V represents the set of edges. The order of a graph is V and the size is E . A loop is an edge whose both end vertices are the same, and multi edges are two or more edges that have common end vertices. In this paper, we study simple graphs, i.e., undirected graphs without multi edges and loops. A graph is called connected if for each pair of vertices in this graph, there is at least one path connecting them.
In a graph G with n vertices, let A = ( a i j ) n × n be its adjacency matrix, where a i j = a j i = 1 if v i and v j are adjacent, otherwise a i j = a j i = 0 . The maximum eigenvalue ρ of the adjacency matrix A is called the spectral radius, which controls the speed of the propagation of dynamic processes over a network [1,2]. It has been used to assess the robustness of the networks in [3,4]. Let D be the degree matrix, which is a diagonal matrix, and the elements on the diagonal are the degrees of each vertex. The Laplacian matrix L of a connected graph G is defined as L = D A , and its second smallest eigenvalue is called the algebraic connectivity [5]. Larger values of algebraic connectivity imply that it is more difficult for a graph to be broken into disconnected components, and it has been used to assess graph robustness [6]. The normalized Laplacian matrix L of graph G is defined as L = I D 1 2 A D 1 2 . Here, I is the identity matrix and D 1 2 is a diagonal matrix such that the elements on the diagonal are 1 / d i ( i = 1 , , n ) , where d i is the vertex degree of v i . The normalized Laplacian matrix L has many important properties related to the structure of G, such as L ( G ) is a positive semidefinite matrix, the sum of all eigenvalues is equal to n and so on. We briefly summary the important properties in Theorem 1. In this paper, we call the eigenvalues of the normalized Laplacian matrix L ( G ) as L -eigenvalues.
For terminology and notation not defined here we refer to [7].
The first and second variable Zagreb indices ([8,9,10]) are defined as
M 1 α ( G ) = u V ( d u ) α ,
and
M 2 α ( G ) = u v E ( d u d v ) α ,
with α R , respectively. It is worth noting that when α = 1 , M 1 α ( G ) is twice the number of edges of graph G, that is, M 1 ( G ) = 2 E ; M 2 ( G ) is called the second Zagreb index. M 1 1 is called the inverse degree index
I D ( G ) = u V 1 d u = u v E ( 1 d u 2 + 1 d v 2 ) .
In addition, M 1 2 ( G ) is called the first Zagreb index, M 1 3 ( G ) is called the forgotten topological index (or F-index)
M 1 3 ( G ) = F ( G ) = u V d u 3 = u v E ( d u 2 + d v 2 ) ,
when α = 1 / 2 , M 2 1 / 2 ( G ) is the Randić connectivity index. M 2 1 ( G ) is also known as the Modified Zagreb index
M Z ( G ) = u v E 1 d u d v .
The Modified Zagreb index has been applied in the structural boiling point modeling of benzenoid hydrocarbons [11], which will be studied in complex networks in this paper.
The resistance distance between vertices v i and v j in G, denoted by r i j ( G ) , is the effective resistance between vertices v i and v j of the electrical network, for which each edge of G is replaced by a resistor of unit resistance. The resistance distance was first introduced by Klein and Randić [12], and they also defined the Kirchhoff index
K f ( G ) = 1 i < j n r i j ( G ) ,
as the sum of resistance distances between all pairs of vertices. The Kirchhoff index [13] of a simple connected graph can also be written as
K f ( G ) = N i = 1 n 1 1 λ i ,
where λ i ( 1 i n 1 ) are all the non-zero Laplacian eigenvalues of G. The normalized Kirchhoff index [14] is defined as
K f N ( G ) = K f ( G ) n 2 .
Among plenty of complex network models, the Erdös−Rényi random graph model (ER random graph), the Watts−Strogatz small−world network model and the Barabási−Albert network model are the most representative. We briefly introduce these three models.
Erdös−Rényi random graph [15]:
We generate n isolated vertices and add an edge in each pair of vertices with the probability p. In addition, when the edge density p exceeds the critical threshold function l n N / N , the probability of the ER random graph being connected is infinitely close to 1 [16].
Watts−Strogatz small−world network model [17]:
We generate a ring lattice of N vertices, each vertex has an average degree of 2 M , and each vertex is connected to the nearest M neighbor vertices on both sides of it. Then, we rewire each edge generated in the graph. Each edge reconnects to the target vertex with probability p, and cannot be a multi edge or a loop. It has the properties of high clustering coefficient and small shortest average path, which can well simulate the social and ecological network structure.
Barabási−Albert scale−free network model [18]:
We generate m 0 vertices, and then we add a new vertex every step, which will connect the existing m ( m 0 ) vertices in the network. The probability that a new vertex connects to an existing vertex u is p = d u i = 1 n d i , where d i is the degree of vertex i and n is the number of all vertices in this step. The BA model is a complex network whose degree distribution conforms to a power law distribution.

1.2. Graph Robustness Measures

There are many measures of graph robustness, some of which are the classic graph measures, including the connectivity of vertices and edges, average distance, average vertices or edges betweenness, clustering coefficient etc. The clustering coefficient is a measure of the degree to which vertices in a graph tend to cluster together, and the global clustering coefficient [18] is based on triplets of vertices. The average distance traveled on the shortest paths between any two vertices is known as the average path length, which is a measure of the efficiency of information or mass transport on a network. The diameter is defined as the maximum length among all the shortest paths connecting any two vertices in the graph. Centrality is an important concept in social network analysis because it identifies the most important (central) vertices in a network. The closeness centrality [19] of a vertex is defined as the reciprocal of the sum of the shortest path lengths between that vertex and all other vertices in the graph. Betweenness centrality [20] is a measure of centrality based on the shortest path, which indicates the degree to which vertices are stood between each other.
Another type of measure is based on the spectrum of the graph or the spectrum of its Laplace matrix, including algebraic connectivity, the number of spanning trees, Kirchhoff index and so on. Wang et al. [21] used the effective graph resistance (Kirchhoff index) to improve the robustness of complex networks. De Meo et al. [22] proved that graph robustness can be quickly estimated through the Randić index and experimentally tested it in several complex networks. Martínez et al. [23] performed computational and analytical studies of the Randić index in ER random graphs. Clemente and Cornaro [24] proposed Effective Resistance centrality as a new graph measure for assessing robustness in complex networks. Eigenvector centrality [25] is a measure of the influence of a vertex, and a high eigenvector score indicates that the vertex is connected to many other vertices with high scores. PageRank centrality [26] is to assign a score to vertex based on the edges incident to the vertex and the ranks of its neighbors.
All the measures will be used in this paper are shown in Table 1. Chen et al. [27] studied the relationships between different measures in several complex networks.

1.3. Motivations and Plan of This Paper

The robustness of a network (or a graph) is to evaluate the ability of a network to maintain its original functions in the event of an attack or failure. When a measure is established, we can rely on it to improve the existing network to be more stable and efficient. How to better and quickly evaluate the robustness of a complex network, and how its robustness changes when some vertices or edges are attacked, are issues worth investigating.
Clemente and Cornaro [24] demonstrated that Effective Resistance centrality is a quite useful graph robustness measure. However, the calculations of Effective Resistance centrality for large networks take a long time. Aiming at assessing the graph robustness efficiently and quickly, we propose the Modified Zagreb index as the measure and propose a novel measure for assessing robustness in complex networks. The robustness of the ER random graph model, the WS small−world network model and the BA network model will be studied by this novel measure, and some other real world networks (European Road Network and U.S. Power Grid network) will also be studied.
The plan of this paper is as follows. We start by introducing Modified Zagreb index and Modified Zagreb index centrality in Section 2. In Section 3, we make experimental analysis in the ER random graph model, the WS small−world network model, the BA network model and two real world networks. Section 3 is also devoted to explore the relationships between these new measures and other measures mentioned in Table 1. Finally, in Section 4, we draw the conclusion.

2. Modified Zagreb Index and Modified Zagreb Index Centrality

We arrange the eigenvalues of the normalized Laplace matrix into λ 1 , , λ n in ascending order. The average square difference S ( G ) ([22]) between the eigenvalues of the normalized Laplacian matrix L ( G ) and its average eigenvalues is defined as
S ( G ) = 1 n i = 1 n λ i λ ¯ 2 ,
where λ ¯ = 1 n i = 1 n λ i . From a certain point of view, the average square difference is also a good way to measure the robustness of the graph.
Theorem 1
([28,29,30]). Let G be a connected graph, then the eigenvalues of its normalized Laplacian matrix L ( G ) have the following properties:
(1) 
L ( G ) is a positive semidefinite matrix.
(2) 
Let the eigenvalues of L ( G ) be sorted ascending as λ 1 λ 2 . . . λ n 2 , where λ 1 = 0 , which is the lower bound of its eigenvalues, and corresponds to the eigenvector 1 .
(3) 
i = 1 n λ i = n , that is, the sum of all eigenvalues is equal to n, where n is the order of the graph G.
(4) 
λ 2 = λ 3 = . . . = λ n if and only if G is a complete graph K n .
Theorem 2.
Let G be a connected graph of order n, then the bounds of S ( G ) are as follows:
1 n 1 S G 1 .
The equality on the left is attained if and only if G is a complete graph.
Proof. 
We first prove that the right side of the inequality S ( G ) 1 . From Theorem 1, we know that λ 1 = 0 and 0 λ i 2 , obviously we can obtain ( λ i 1 ) 2 1 . Then, we can deduce the upper bound,
S ( G ) = 1 n i = 1 n ( λ i 1 ) 2 = 1 n + 1 n i = 2 n ( λ i 1 ) 2 1 n + n 1 n = 1 .
Next, we prove that the left side of the inequality 1 n 1 S ( G ) .
S ( G ) = 1 n i = 1 n ( λ i 1 ) 2 = 1 n i = 1 n ( λ i 2 2 λ i + 1 ) = 1 n ( i = 1 n λ i 2 2 i = 1 n λ i + n ) = 1 n ( i = 1 n λ i 2 2 n + n ) = 1 n i = 1 n λ i 2 1 .
When n is fixed, the original problem is equivalent to finding the lower bound of i = 1 n λ i 2 , and since f ( x ) = x 2 is a convex function on ( , + ), we have:
f ( 2 n λ i n 1 ) 1 n 1 i = 2 n f ( λ i ) ( i = 2 n λ i n 1 ) 2 1 n 1 i = 2 n λ i 2 n 2 n 1 i = 2 n λ i 2 .
Finally, we can obtain the lower bound of S ( G ) . When λ 2 = λ 3 = . . . = λ n = n / ( n 1 ) , i.e., G is a complete graph, the equal sign holds.
S ( G ) 1 n · n 2 n 1 1 = 1 n 1 .
Theorem 3
([31]). Let G be an undirected, n−order, connected graph, and 0 = λ 1 λ 2 . . . λ n be the ascending eigenvalue of L ( G ) . The following equation holds between modified Zagreb index M Z ( G ) and L -eigenvalues.
M Z ( G ) = t r ( ( I L ) 2 ) 2 .
By Theorem 3, we can calculate the Modified Zagreb index of the graph through the normalized Laplacian matrix L ( G ) .
Theorem 4.
Let G be an undirected, n−order, connected graph; the following equation holds.
M Z ( G ) = n S ( G ) 2 .
Proof. 
For the sum of the eigenvalues λ i of the matrix L , we have i = 1 n λ i = n , which means that λ ¯ = 1 is a constant. Combined with Theorem 4, we can obtain its equation deformation.
S ( G ) = 1 n i = 1 n ( λ i λ ¯ ) 2 = 1 n i = 1 n ( λ i 1 ) 2 = 1 n i = 1 n ( λ i ( L I ) ) 2 = 1 n t r ( L I ) ) 2 = 2 M Z ( G ) n .
Theorem 5.
If G is a simple graph, then
2 F ( G ) M Z ( G ) I D ( G ) 2 ,
and the equality is attained if and only if G is regular.
Proof. 
By the inequality of arithmetic and geometric, we have
2 1 d u 2 + 1 d v 2 d u d v d u 2 + d v 2 2 , 2 I D ( G ) 1 M Z ( G ) F ( G ) 2 .
With the result of Theorem 4, we can obtain S ( G ) by calculating M Z ( G ) to know whether the graph is robust or not, and its time complexity is O ( E ) , which is much faster than calculating the Kirchhoff Index of the graph.
Let G be a connected graph of n vertices and m edges and G v i the graph obtained by removing the vertex v i and all its incident edges from G. The Effective Resistance Centrality ([24]) R K ( v i , G ) of the vertex v i is defined as R K ( v i , G ) = ( Δ K f N ) v i K f N ( G ) = K f N ( G v i ) K f N ( G ) K f N ( G ) . Clemente and Cornaro [24] use The Effective Resistance Centrality as a robustness measure for networks and demonstrated its efficiency by studying several well-known model networks. Since the calculation of Kirchhoff index for large networks would cost much time, we propose another robustness measure according to the Modified Zagreb index.
To better assess the robustness of the large graph, we consider the expander graph [32], which has expansion properties closely related to the robustness of the large graph and has been used for a rapid assessment in [33]. The ER random graph has good expansion properties and we use it as a reference. We use G E R to represent the ER random graph generated with G (order n and size m) as the prototype, which has n vertices and p = 2 m / n ( n 1 ) . Let G E R ( v i ) denote the ER random graph generated with G v i as the prototype.
Definition 1.
The Modified Zagreb index centrality (MZC) R S ( v i , G ) of the vertex v i is defined as
R S ( v i , G ) = M Z ( G v i ) M Z ( G ) M Z ( G ) · M Z ( G E R ( v i ) ) M Z ( G E R ) .
Aguilar−Sánchez et al. [34] proved that the average value of Modified Zagreb index of ER random graphs is n 2 4 m when n p > > 1 . Thus, for convenience, we suppose M Z ( G E R ) = n 2 4 m and M Z ( G E R ( v i ) ) = ( n 1 ) 2 4 ( m d i ) in the Modified Zagreb Index Centrality, where d i is the degree of v i in G. We need to mention that if we only use M Z ( G v i ) M Z ( G ) M Z ( G ) to be a new measure, it is highly related to the vertex degree, which is not a suitable robustness measure for complex networks. Thus, we add the item M Z ( G E R ( v i ) ) M Z ( G E R ) , which will be demonstrated to be efficient in the next section.

3. Experimental Analysis

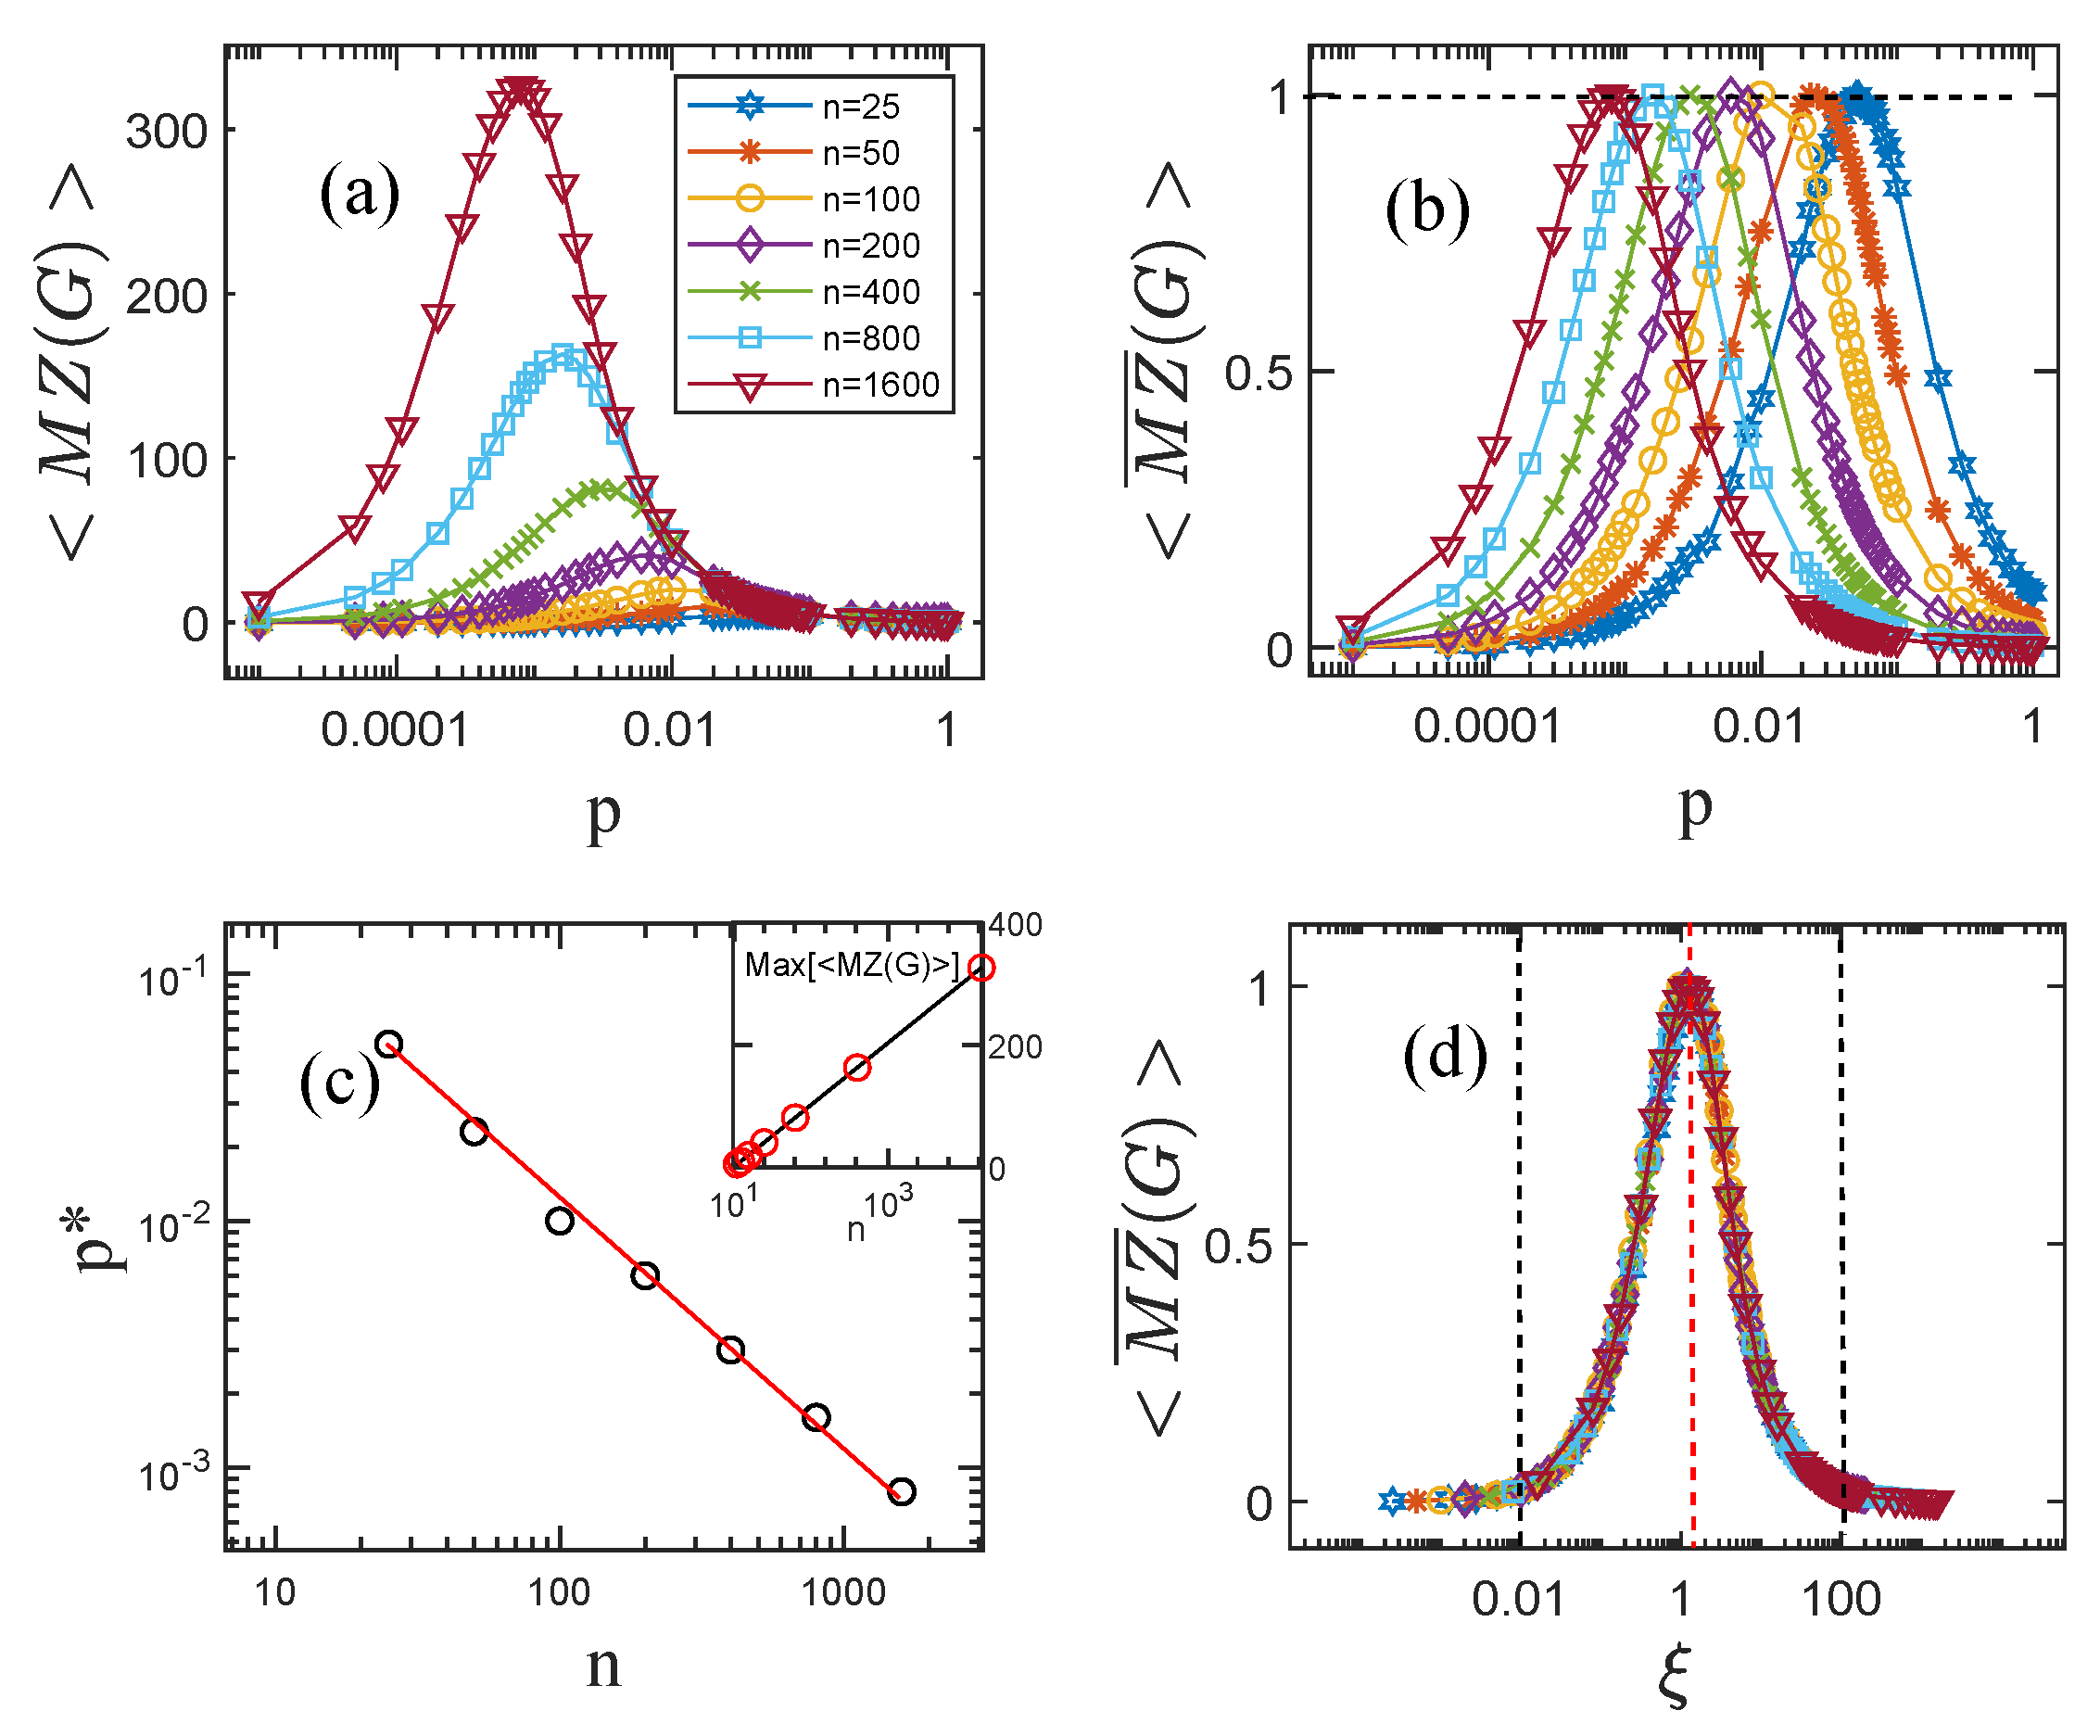
3.1. Modified Zagreb Index in Erdös-Rényi Random Graphs

We use computational and statistical analysis to study the Modified Zagreb index in the ER random graphs. In Figure 1a, we demonstrate the average Modified Zagreb index M Z ( G ) as a function of the probability p for ER random graphs with different orders. We need to mention that all the average values · are calculated by generating ER random graphs over 10 5 times. We observe that when p is small, M Z ( G ) increases rapidly as p increases, and when the Modified Zagreb index reaches the maximum value M a x [ M Z ( G ) ] , M Z ( G ) decreases monotonously with the increase in p until it approaches 0 when p = 1 . At the same time, it can be clearly observed that when the order is larger, the maximum value of the Modified Zagreb index is also larger, and can be reached at a smaller p. In order to better observe the changing law of M Z ( G ) under different sizes of ER random graphs, we normalize the Modified Zagreb index as M Z ¯ ( G ) = M Z ( G ) / max [ M Z ( G ) ] .
In Figure 1b, we find that the M Z ¯ ( G ) curve shift to the left on the p−axis when the order is increasing. This has to make us think that there is a scaling parameter associated with the order n that affects the M Z ¯ ( G ) curve. In order to find this scaling parameter, we choose the value of p when M Z ¯ ( G ) = 1 under the ER random graphs of different orders n, and then mark it as p * , as shown by the dashed line in Figure 1b.
In Figure 1c, we can observe that p * as a function of n has an obvious linear trend (in log−log scale), which implies that there is a power−law relationship between them. In addition, in the inset of Figure 1c, we observe that Max[ M Z ( G ) ] as a function of n also characterizes an obvious linear trend.
In Figure 1d, we plot M Z ¯ ( G ) as a function of the parameter ξ = n p on a semi−log scale, and we find that the curves under ER random graphs of different orders all fall on the same curve. Some lower bounds on the modified Zagreb index can be found in [35].

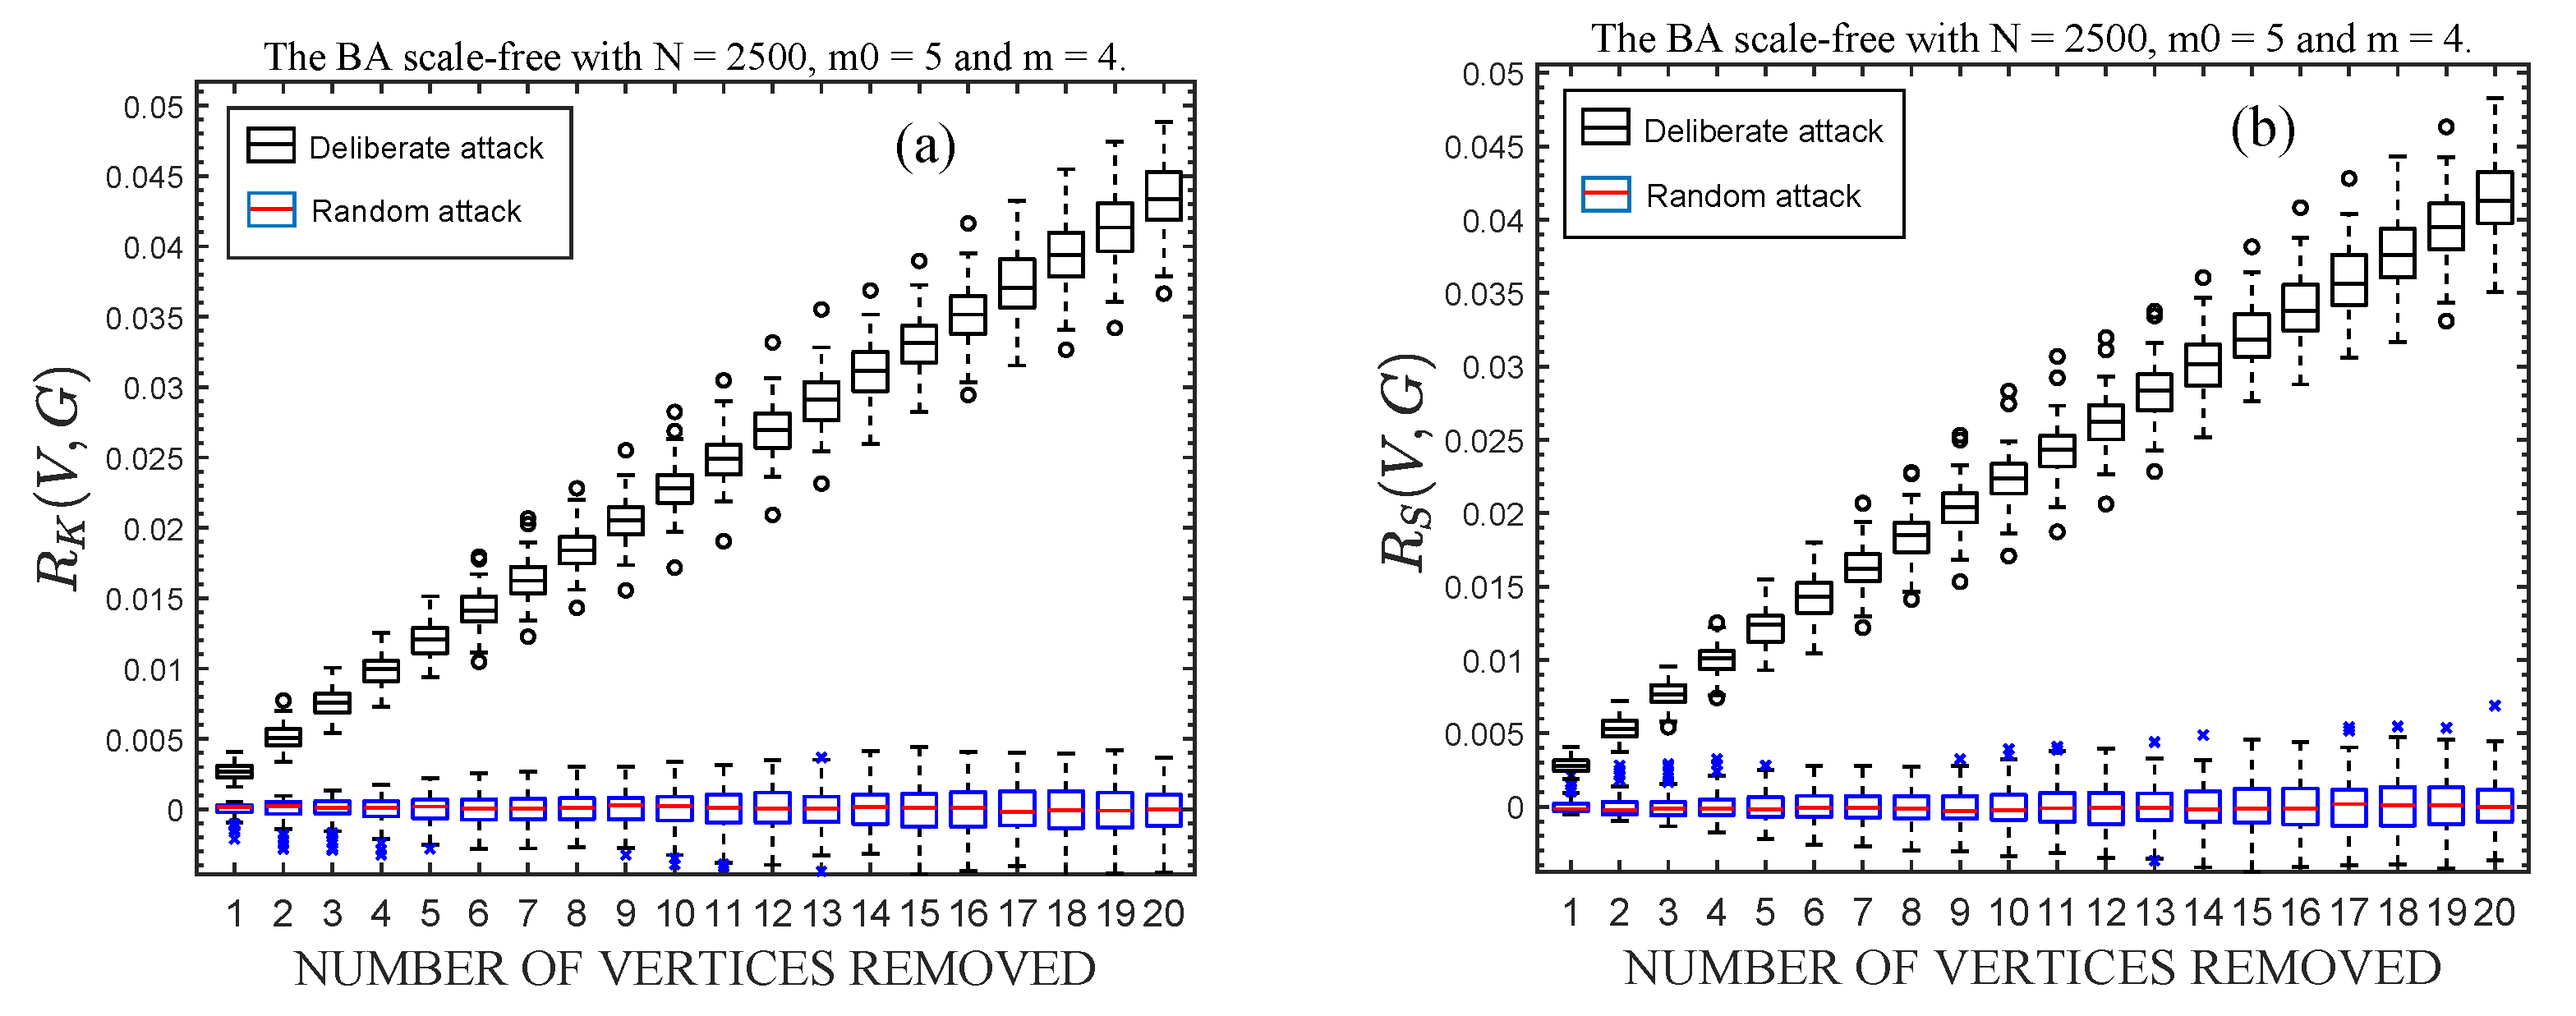
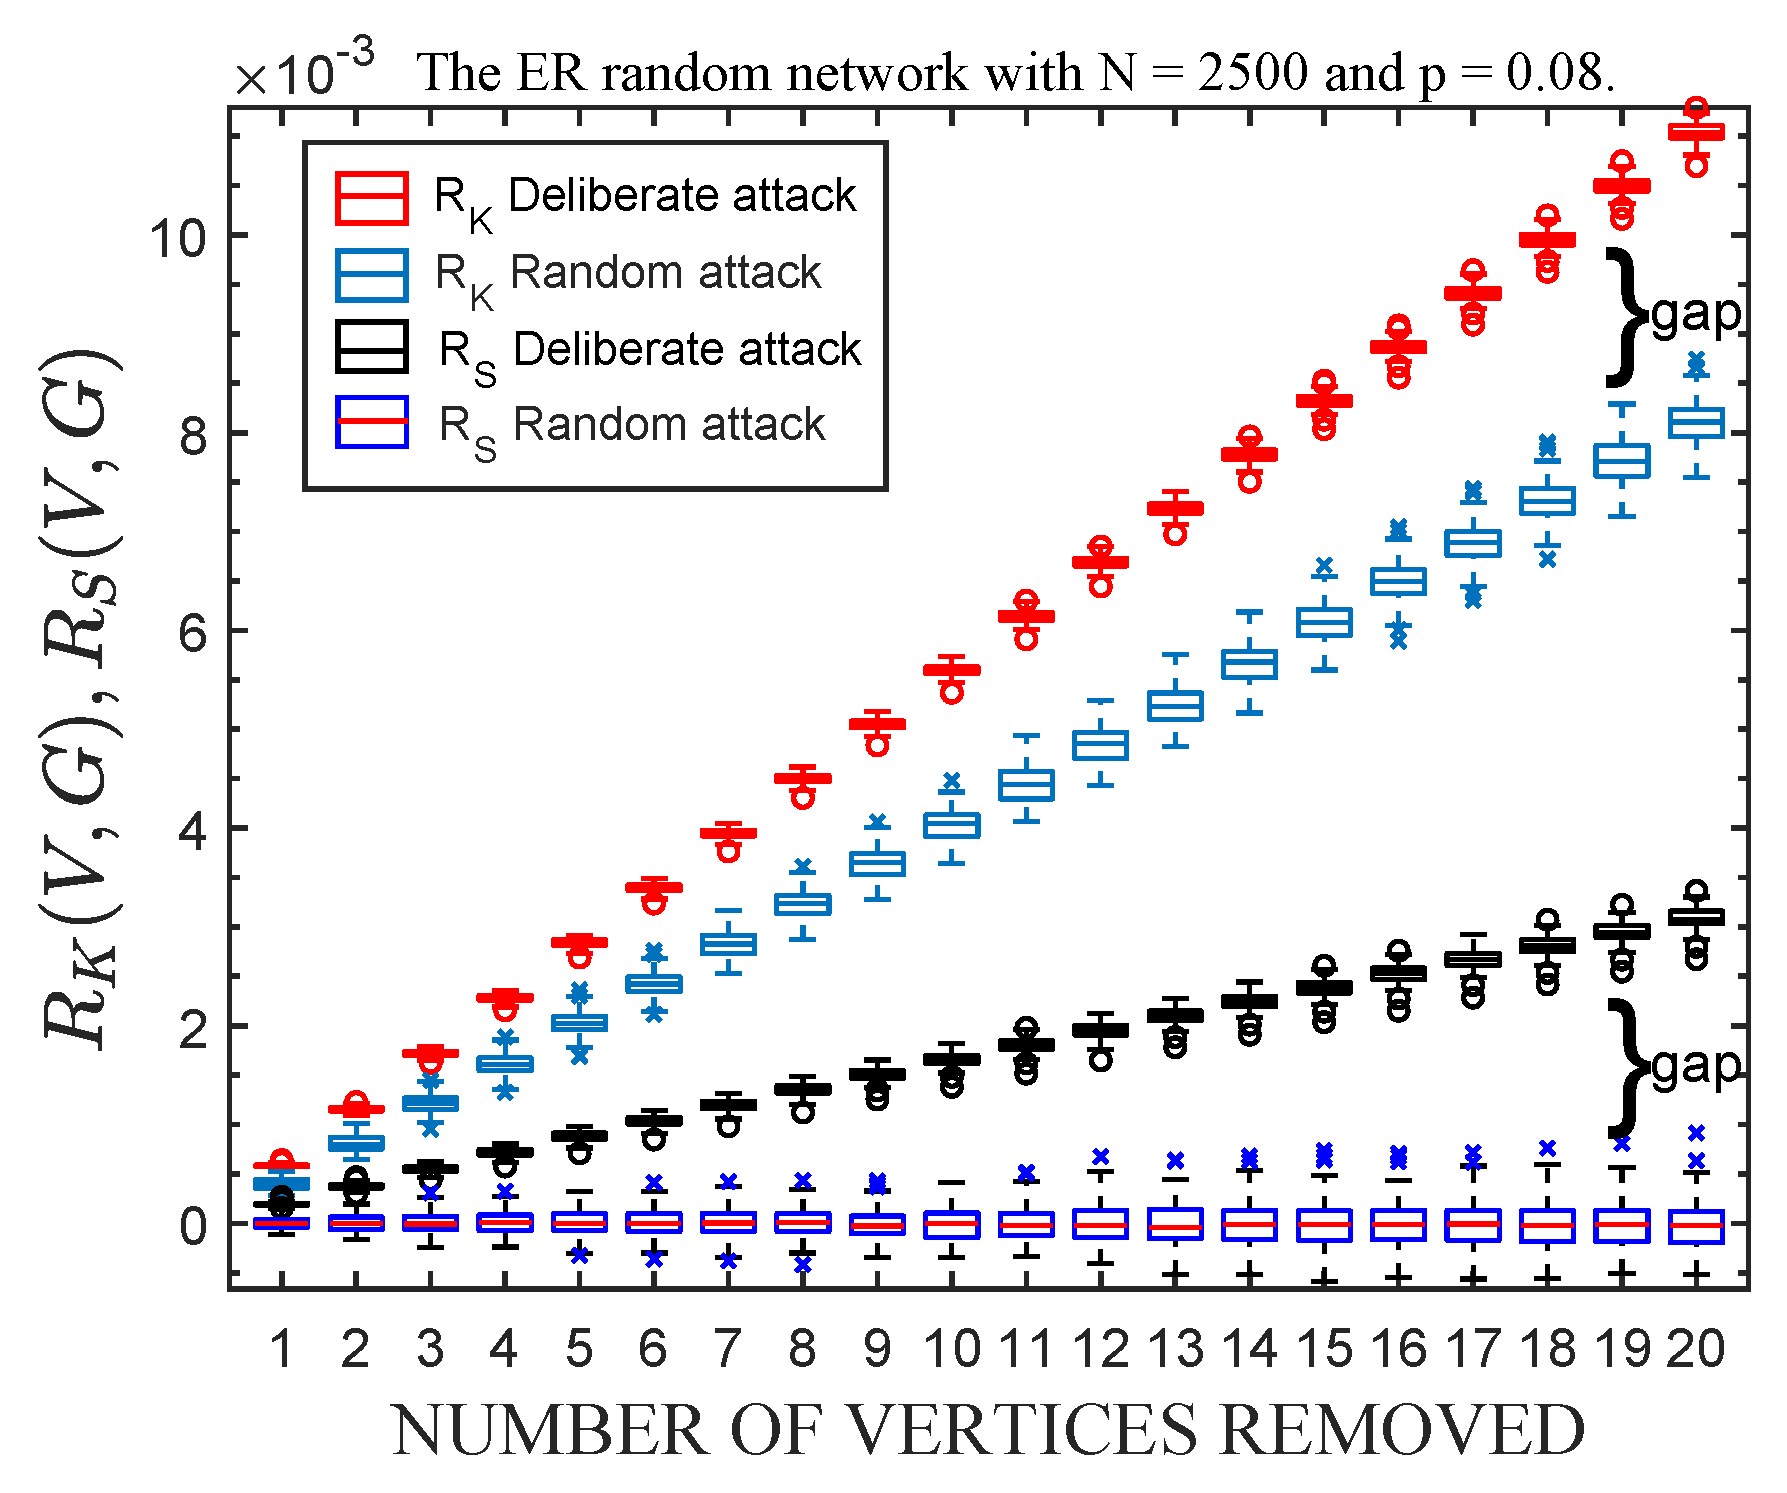
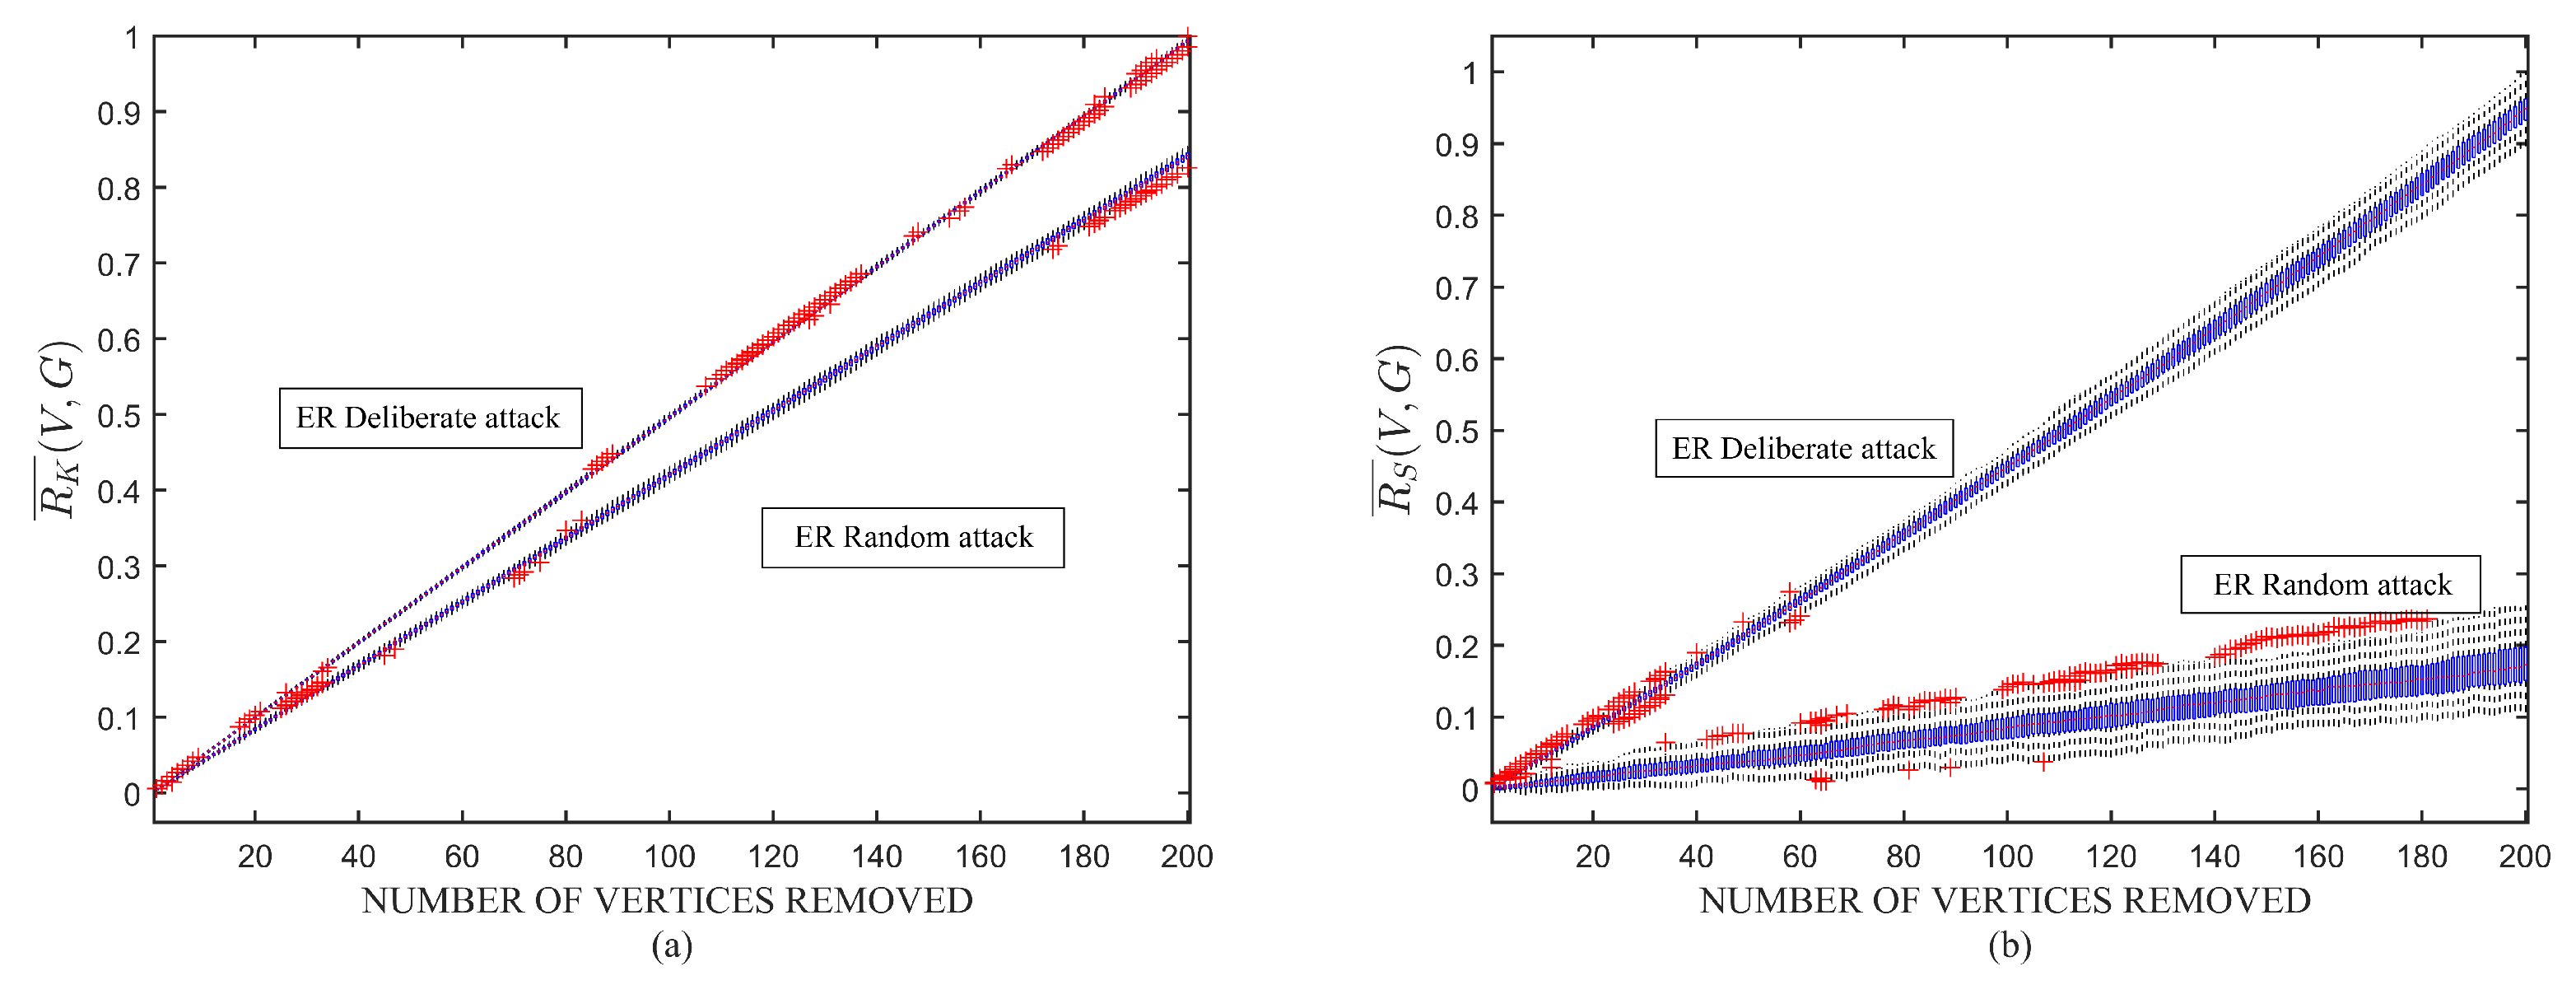
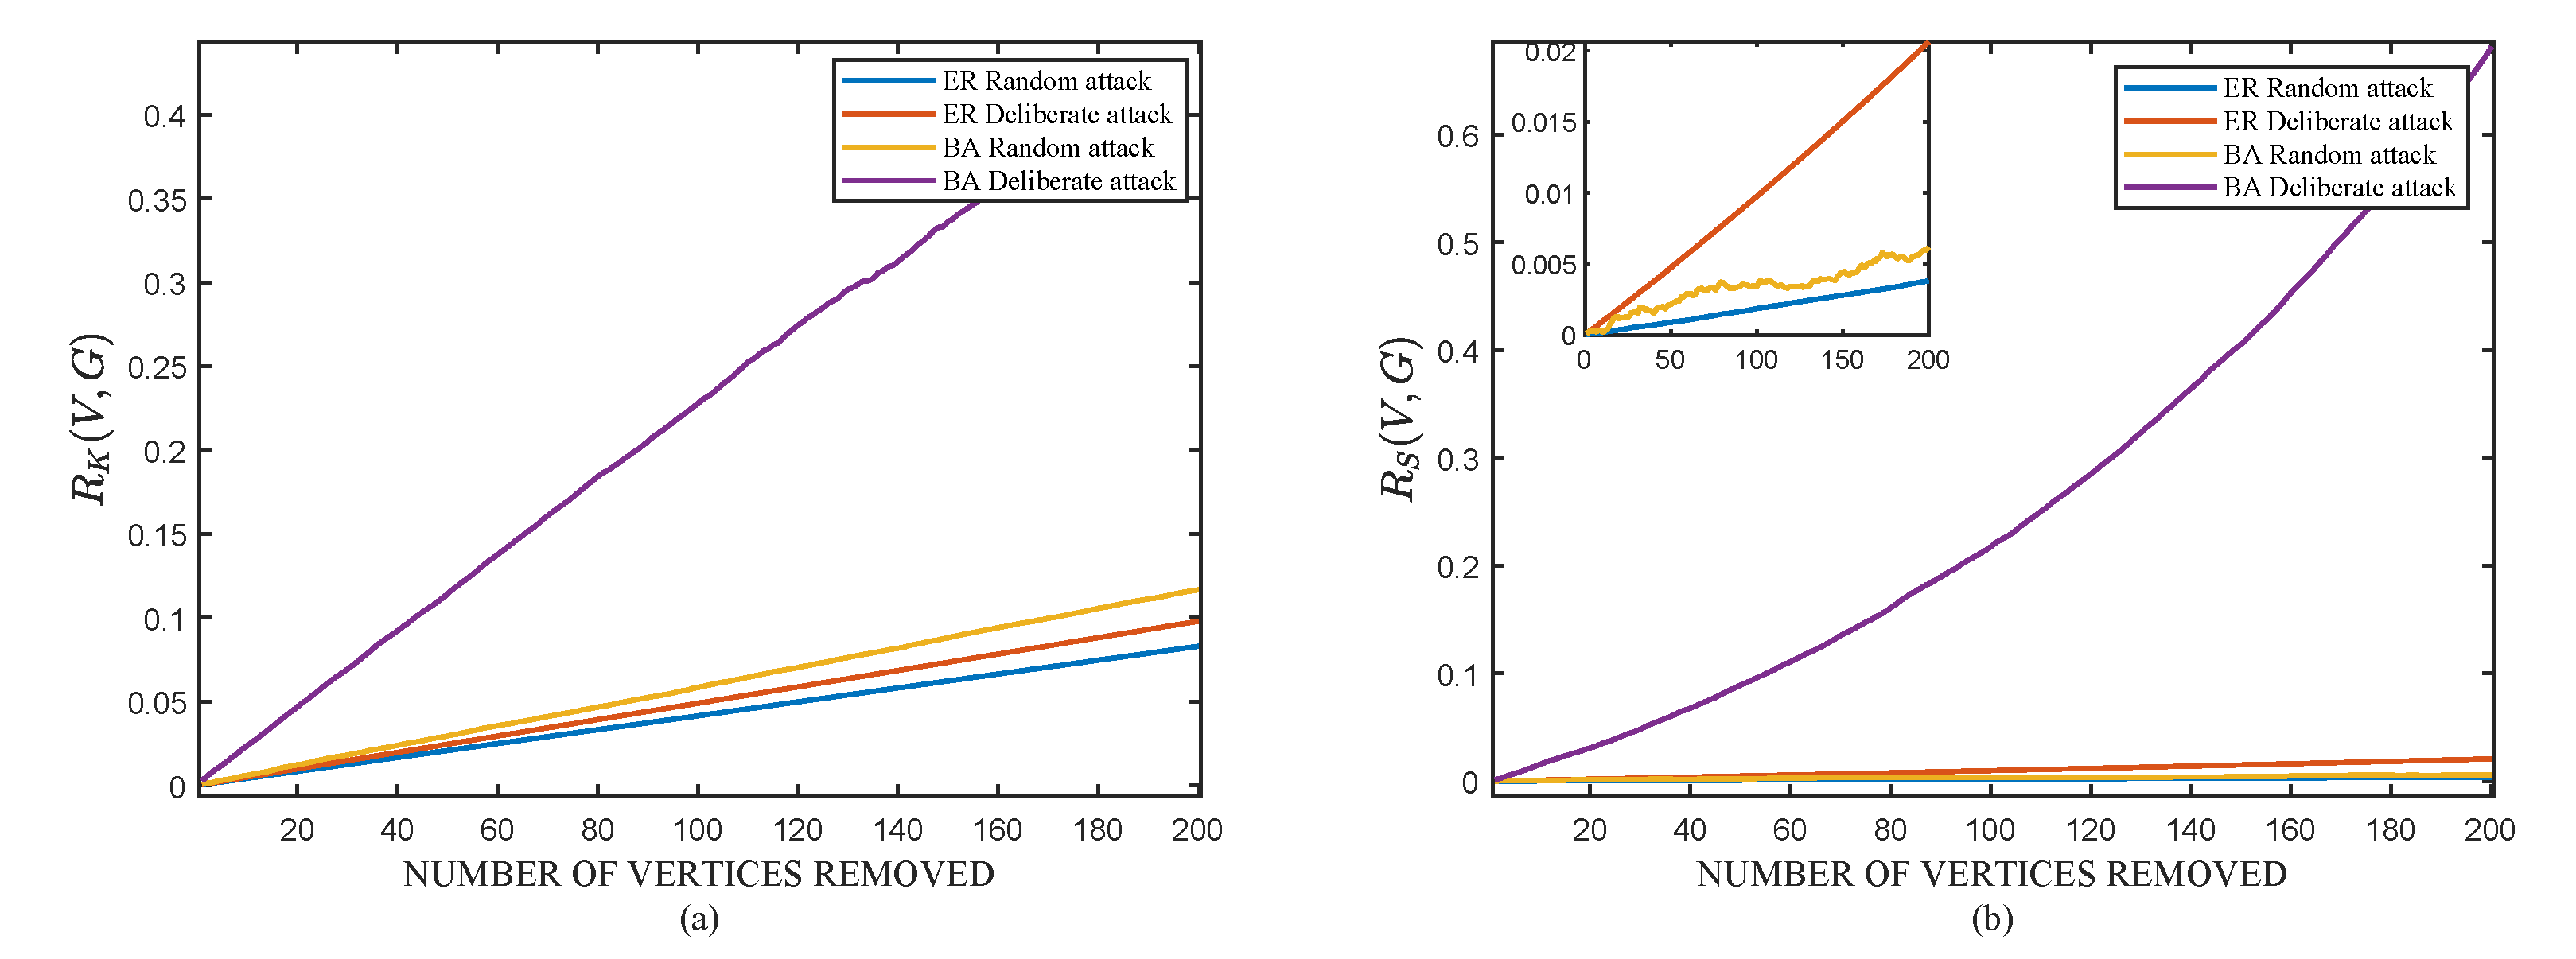
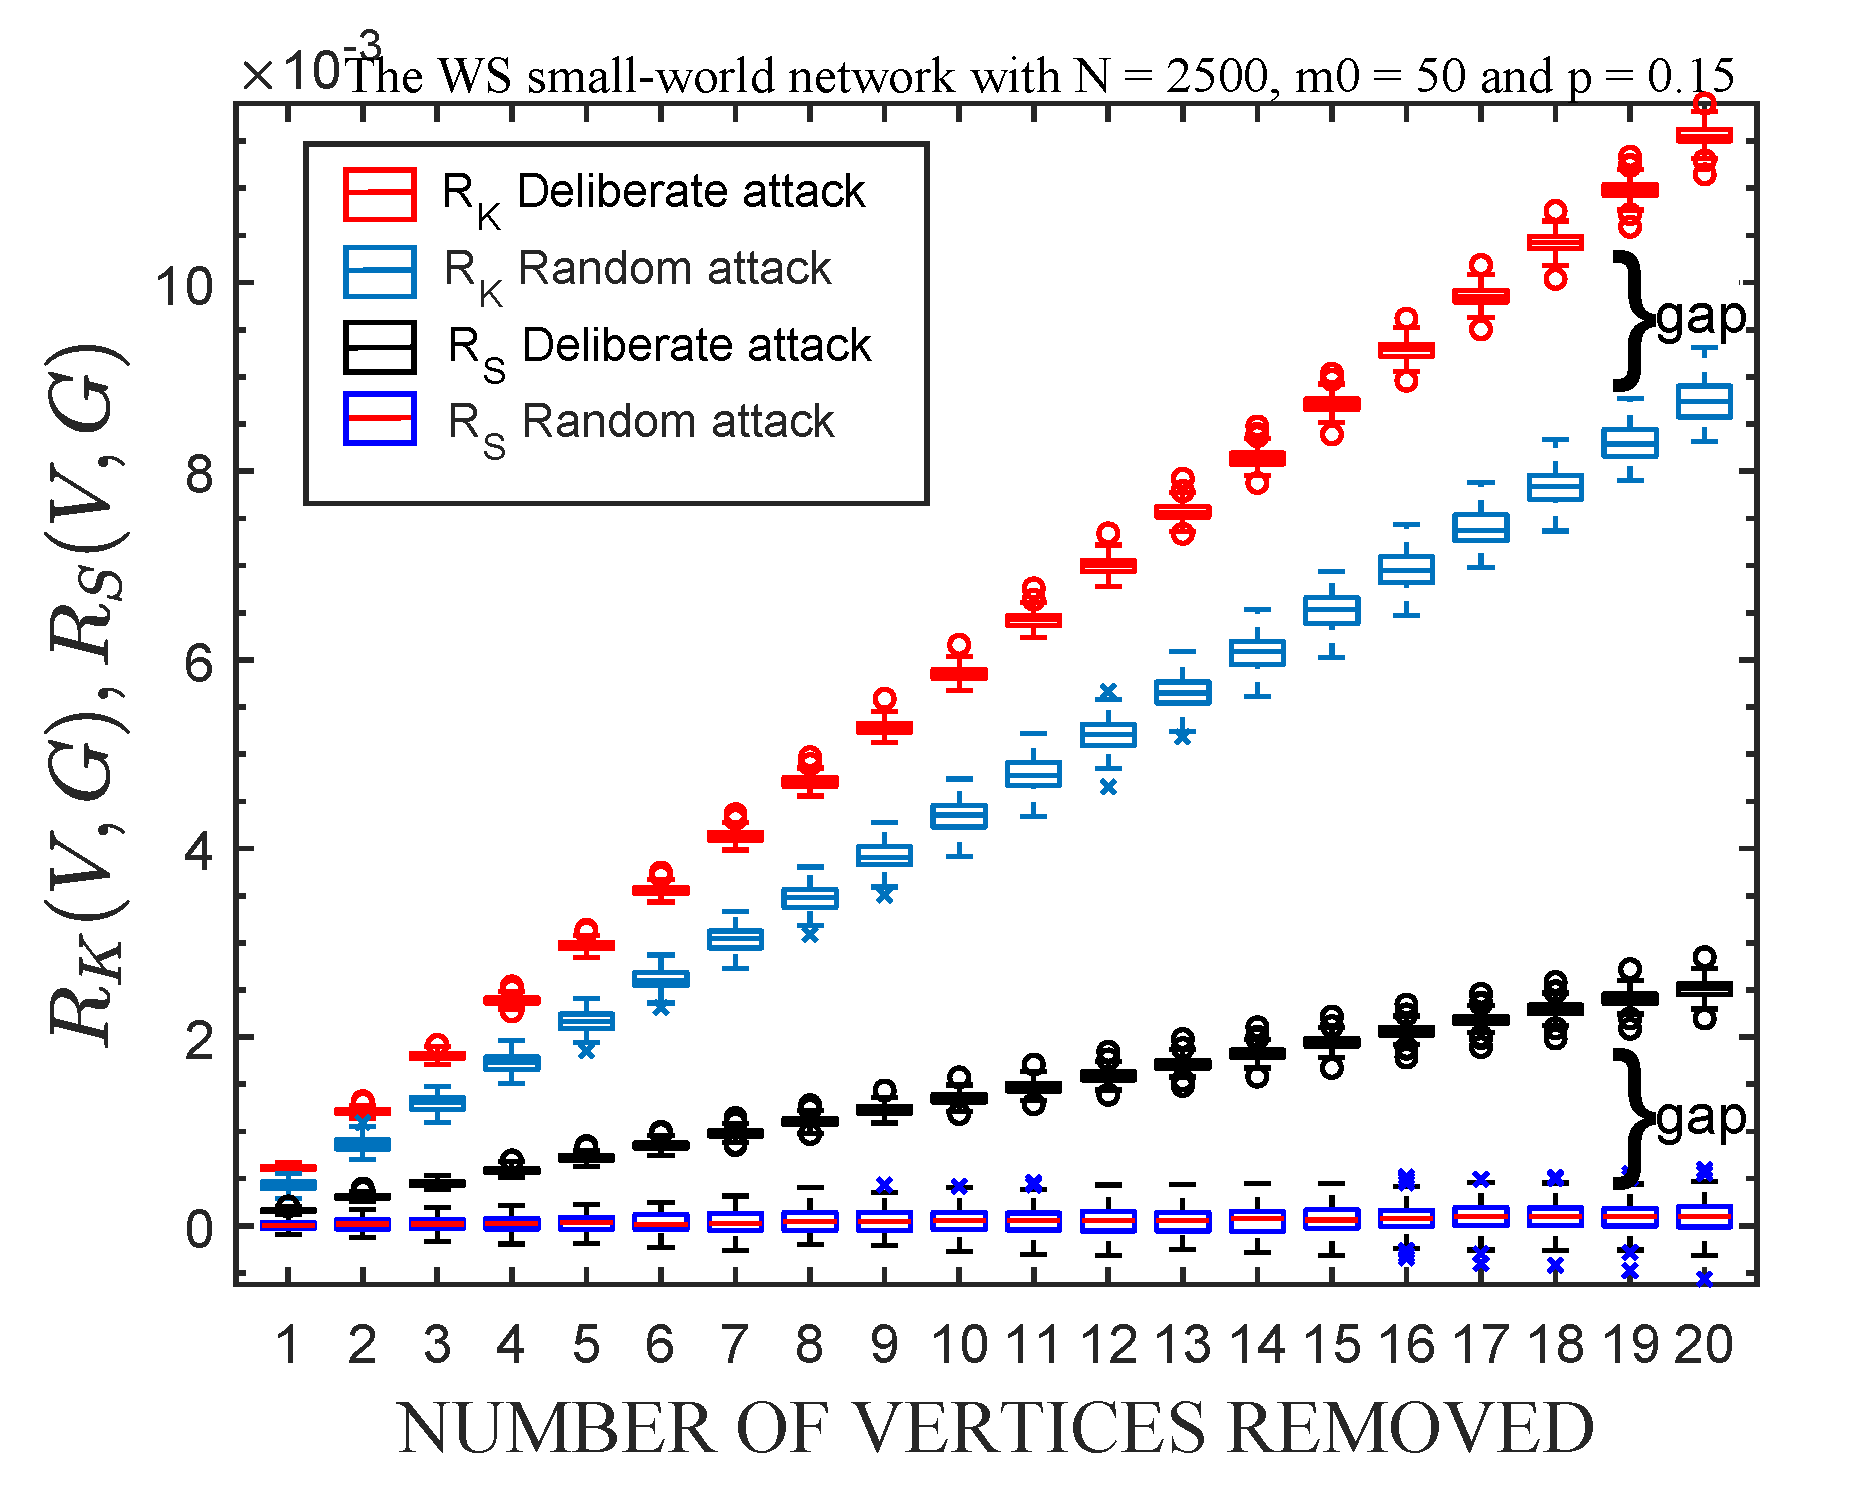
3.2. Assessment of Robustness for Different Network Models

In order to show the effect of Modified Zagreb index centrality, we use it to assess the robustness of three well-known network models and make several comparisons with the effect of effective resistance centrality.
Extending the definition of R S ( v i , G ) , we use R S ( V , G ) to denote the Modified Zagreb index centrality after removing the vertices in V. Considering that the vertices of the network are continuously removed, the subgraph obtained after the nth step vertex is removed is G V n . For the subgraphs obtained by these steps, we use R S ( V 1 , G ) , R S ( V 2 , G ) , , R S ( V , G ) ( R K ( V 1 , G ) , R K ( V 2 , G ) , , R K ( V , G ) ) to quantify the robustness of the network at each step.
In addition, we use two ways to remove vertices. One way is to remove the high degree vertices, which form the vertex set V a t t a c k . The purpose is to simulate a deliberate attack on the strategic vertices of the network. The other way is to remove vertices randomly, which form the vertex set V r a n d o m . It simulates the random attacks in the networks.
We simulate the BA scale-free network for 10 2 times (the order is 2500 and m 0 = 5 , m = 4 ), and implement a deliberate attack and a random attack on each simulated network. We find that when the BA scale-free network is under a random attack, the box plots in Figure 2a,b demonstrate smooth and no significant changes, and both fluctuate slightly with 0 as the central axis. Under random attacks, except for some outliers, the absolute values of the maximum and minimum values of R S ( V r a n d o m , G ) and R K ( V r a n d o m , G ) in Figure 2a,b do not exceed 0.005 , and their medians almost coincide with 0. At the same time, we find that the trends of R S ( V r a n d o m , G ) and R K ( V r a n d o m , G ) are very consistent, and we know that the efficiency of calculating R S ( V , G ) is much higher than that of R K ( V , G ) .
On the contrary, we find that when the scale−free network is under a deliberate attack, the box plots of Figure 2a,b have obvious changes. These all demonstrate the vulnerability of scale−free networks when they are attacked deliberately. At the same time, we find that the changing trends of R S ( V a t t a c k , G ) and R K ( V a t t a c k , G ) are also highly coincident, and the numerical results are not much different.
From the simulation calculation of the BA scale−free network, we find that both R S ( V , G ) and R K ( V , G ) have the same performance effect, and the changing trends when the vertices are removed are highly coincident. Thus, Modified Zagreb index centrality is a suitable replacement of effective resistance centrality in the assessment of the robustness.
We also simulate the experiments on the ER random graph. As shown in Figure 3, when encountering a random attack, the box plot distribution of R S ( V r a n d o m , G ) fluctuates slightly. When the number of vertices removed from the network increases, the probability of outliers and larger boundaries is greater, but the maximum absolute value does not exceed 0.001 . By simple calculations, we know that at most 20 vertices randomly attacked would not cause a significant increasing trend of the values of R S ( V , G ) as shown in Figure 3. When encountering a deliberate attack, the distribution of the box plot of R S ( V a t t a c k , G ) shifts upward with the number of vertices deleted, which means that the more vertices removed, the greater the impact on the robustness of the network. The distribution of the box plot shows that when the ER random network encounters a deliberate attack, the robustness of the network will be affected, but the impact will not be significant. This indicates that the ER random network is stable, even after removing 20 vertices, and the largest outlier does not exceed 0.0035 . The robustness of the ER random network in the face of deliberate attacks is closely related to its network structure.
On the other hand, using R K ( V , G ) as the measure, when the ER random network encounters deliberate attacks and random attacks, the distribution of the box plot shifts upwards with the number of removed vertices, but the upward trend of deliberate attacks is faster than that of random attacks. Although R S ( V , G ) and R K ( V , G ) have different trends in the results, we find that under deliberate attacks and random attacks, the gaps in their box plot distribution are very similar, that is, we rotate the box plot of R S ( V , G ) after a certain angle, and it is highly coincident with the box plot of R K ( V , G ) . In addition, when R S ( V , G ) is used as the measure, the maximum gap distance of the median of the box plot is around 0.003 , and when R K ( V , G ) is used as the measure, the maximum gap distance of the median of the box plot is also around 0.003 . Here, the maximum gap distance refers to the value of R S ( V a t t a c k , G ) R S ( V r a n d o m , G ) (or R K ( V a t t a c k , G ) R K ( V r a n d o m , G ) ) when 20 vertices have been removed from the network.
The trends of R S ( V , G ) and R K ( V , G ) in ER random graphs with respect to the vertices when subjected to random attacks are significantly different due to the difference in magnitude compared with Figure 2, which causes R S ( V , G ) to demonstrate a non-increasing trend in the first 20 vertices. Actually, they are both essentially increasing upward (the maximum value is trending upward), but the very small number of removed vertices makes the rate of R S ( V , G ) slower and does not clearly demonstrate an increasing trend.
In Figure 4, we present the experimental results for both measures when the number of vertices removed on the ER network reaches 200, where the data are normalized. In Figure 4b, R S slowly increases as the number of vertices removed increases when subjected to random attacks. In Figure 5, we present the experimental results for both measures when the number of vertices removed on the ER network and the BA network reaches 200, where the data are averaged for better observation. In Figure 5b, using the R S measure, the average value of the ER random network when subjected to deliberate attacks is much lower compared to the value of the BA network when subjected to deliberate attacks, and then compared with the value of the ER random network when subjected to random attacks, it can be demonstrated that the impact of the ER random network when subjected to deliberate and random attacks does not differ much. Similarly, in Figure 5a and Figure 4a, using the R K measure, it can be observed that the impact of the ER random network when subjected to a deliberate attack does not differ much from that of a random attack.
At last, we simulate the attack experiment on the WS small-world network. As shown in Figure 6, the numerical results are similar as in ER random networks.
For the above experiments, we have simulated vertex attacks on BA scale−free networks, ER random networks, and WS small−world networks. We know that these two local measures Modified Zagreb index centrality and effective resistance centrality are computed in different ways, but their performances are similar and they have many common characteristics. In BA scale−free networks, they are almost identical in trend and numerical results. In the performance of ER random networks and WS small−world networks, their gap distances are highly similar. Effective resistance centrality is obtained based on the effective resistance distance of the graph, which requires the calculations of the Laplacian eigenvalues of the network. However, the calculation of Modified Zagreb index centrality mainly depends on the vertex degrees of the network. Thus, we confirm that Modified Zagreb index centrality is a efficient measure for the assessment of network robustness.

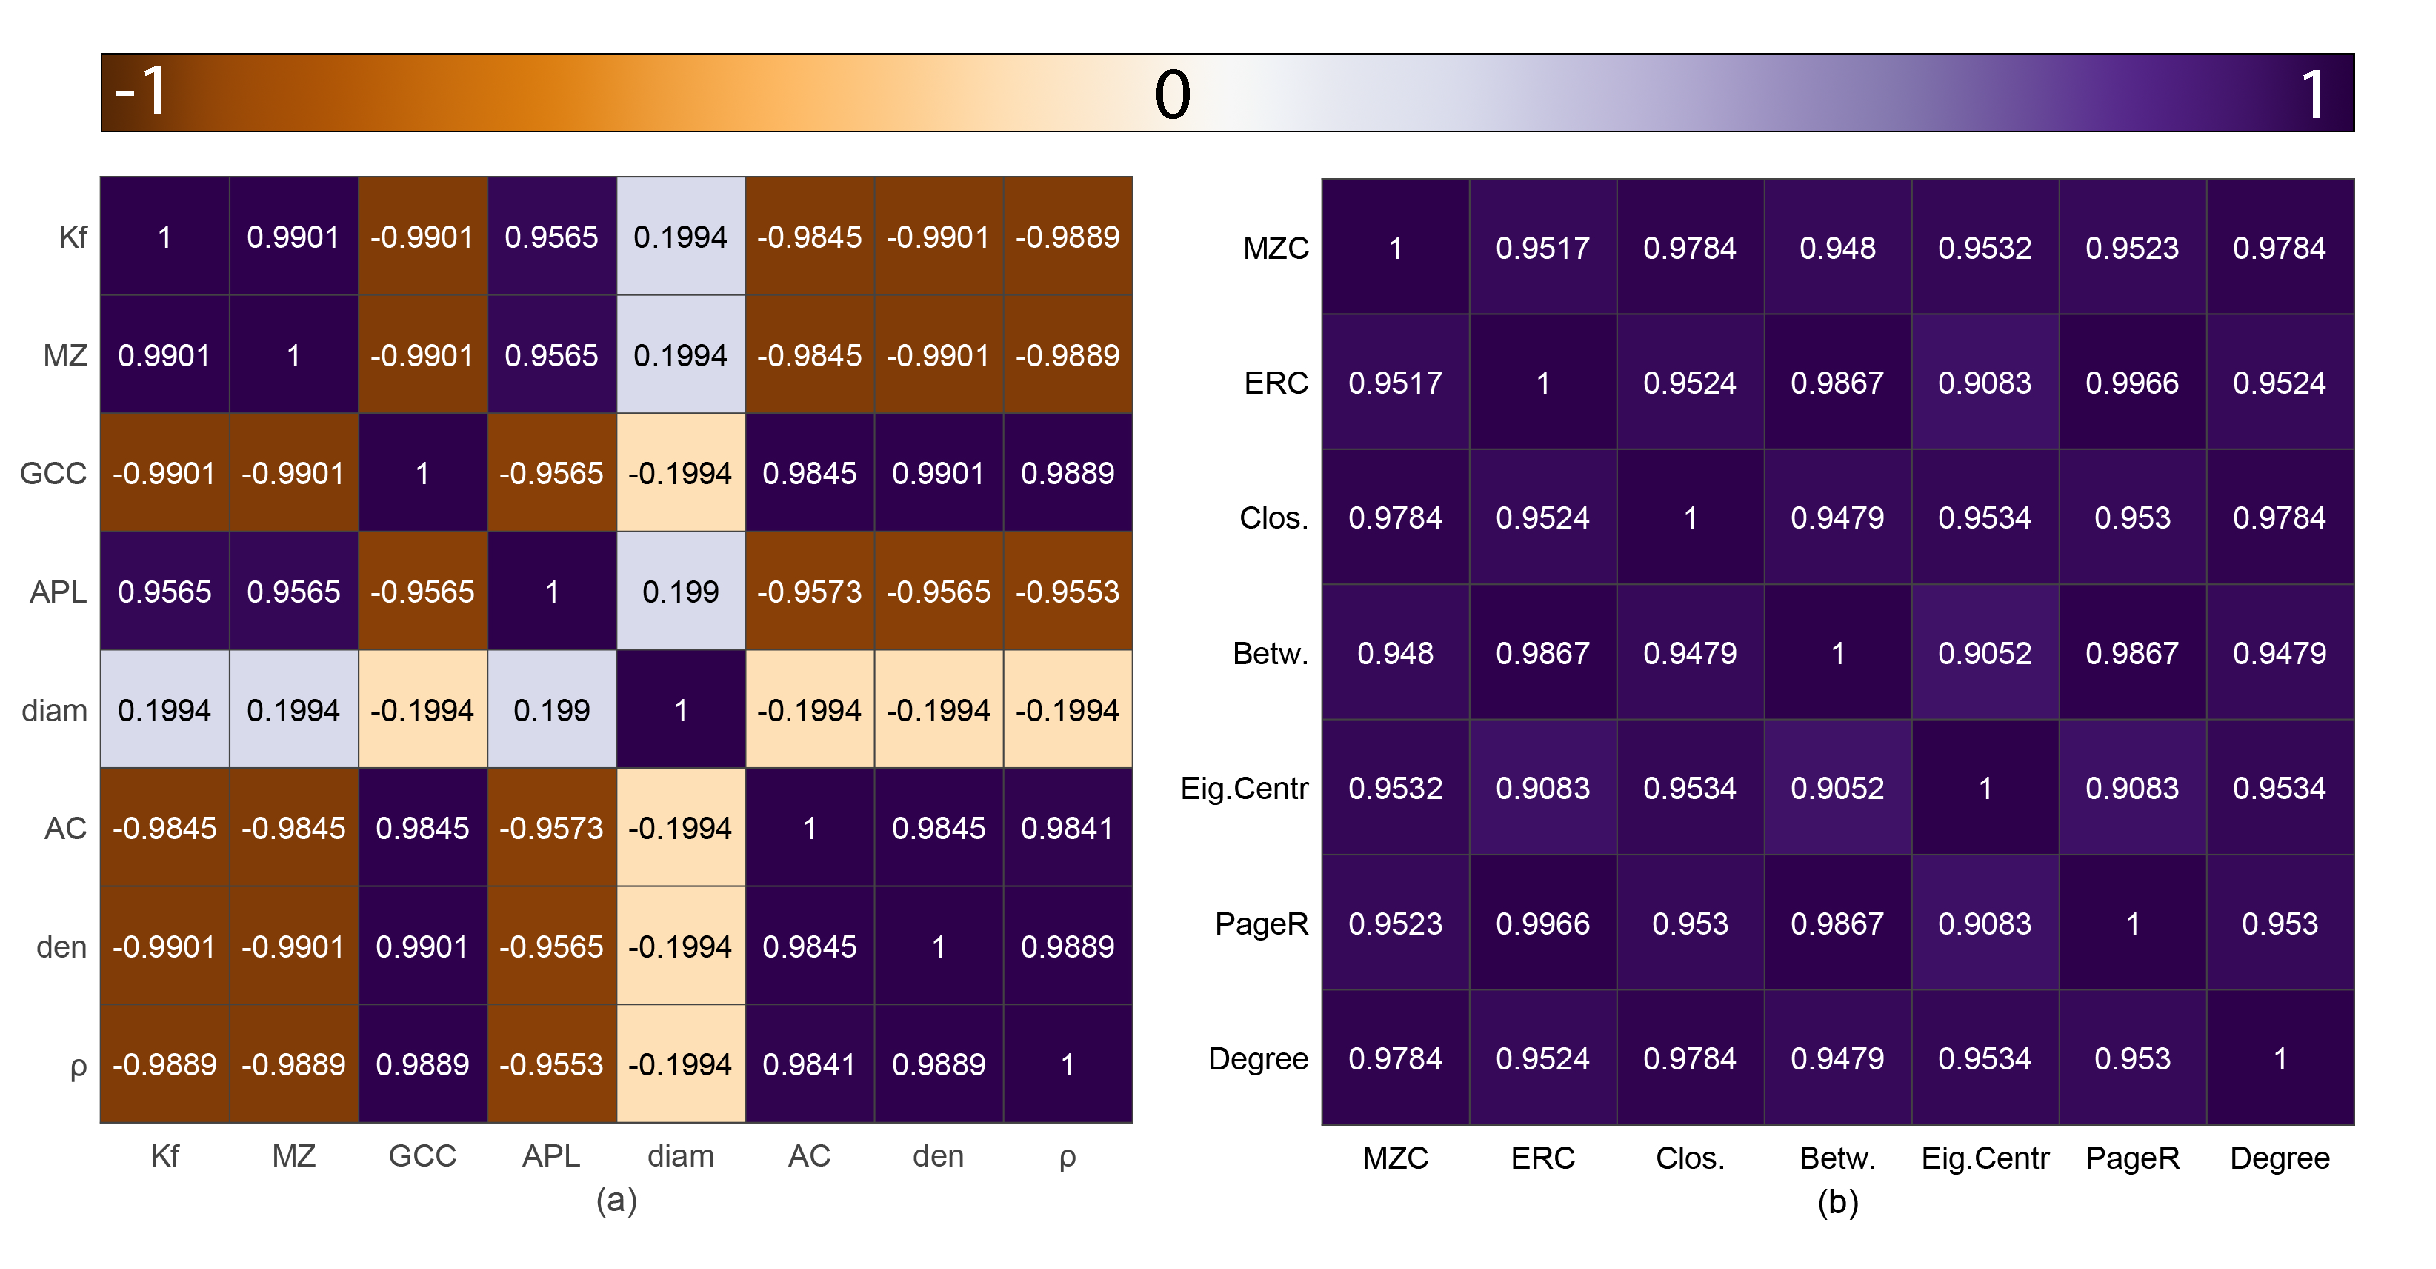
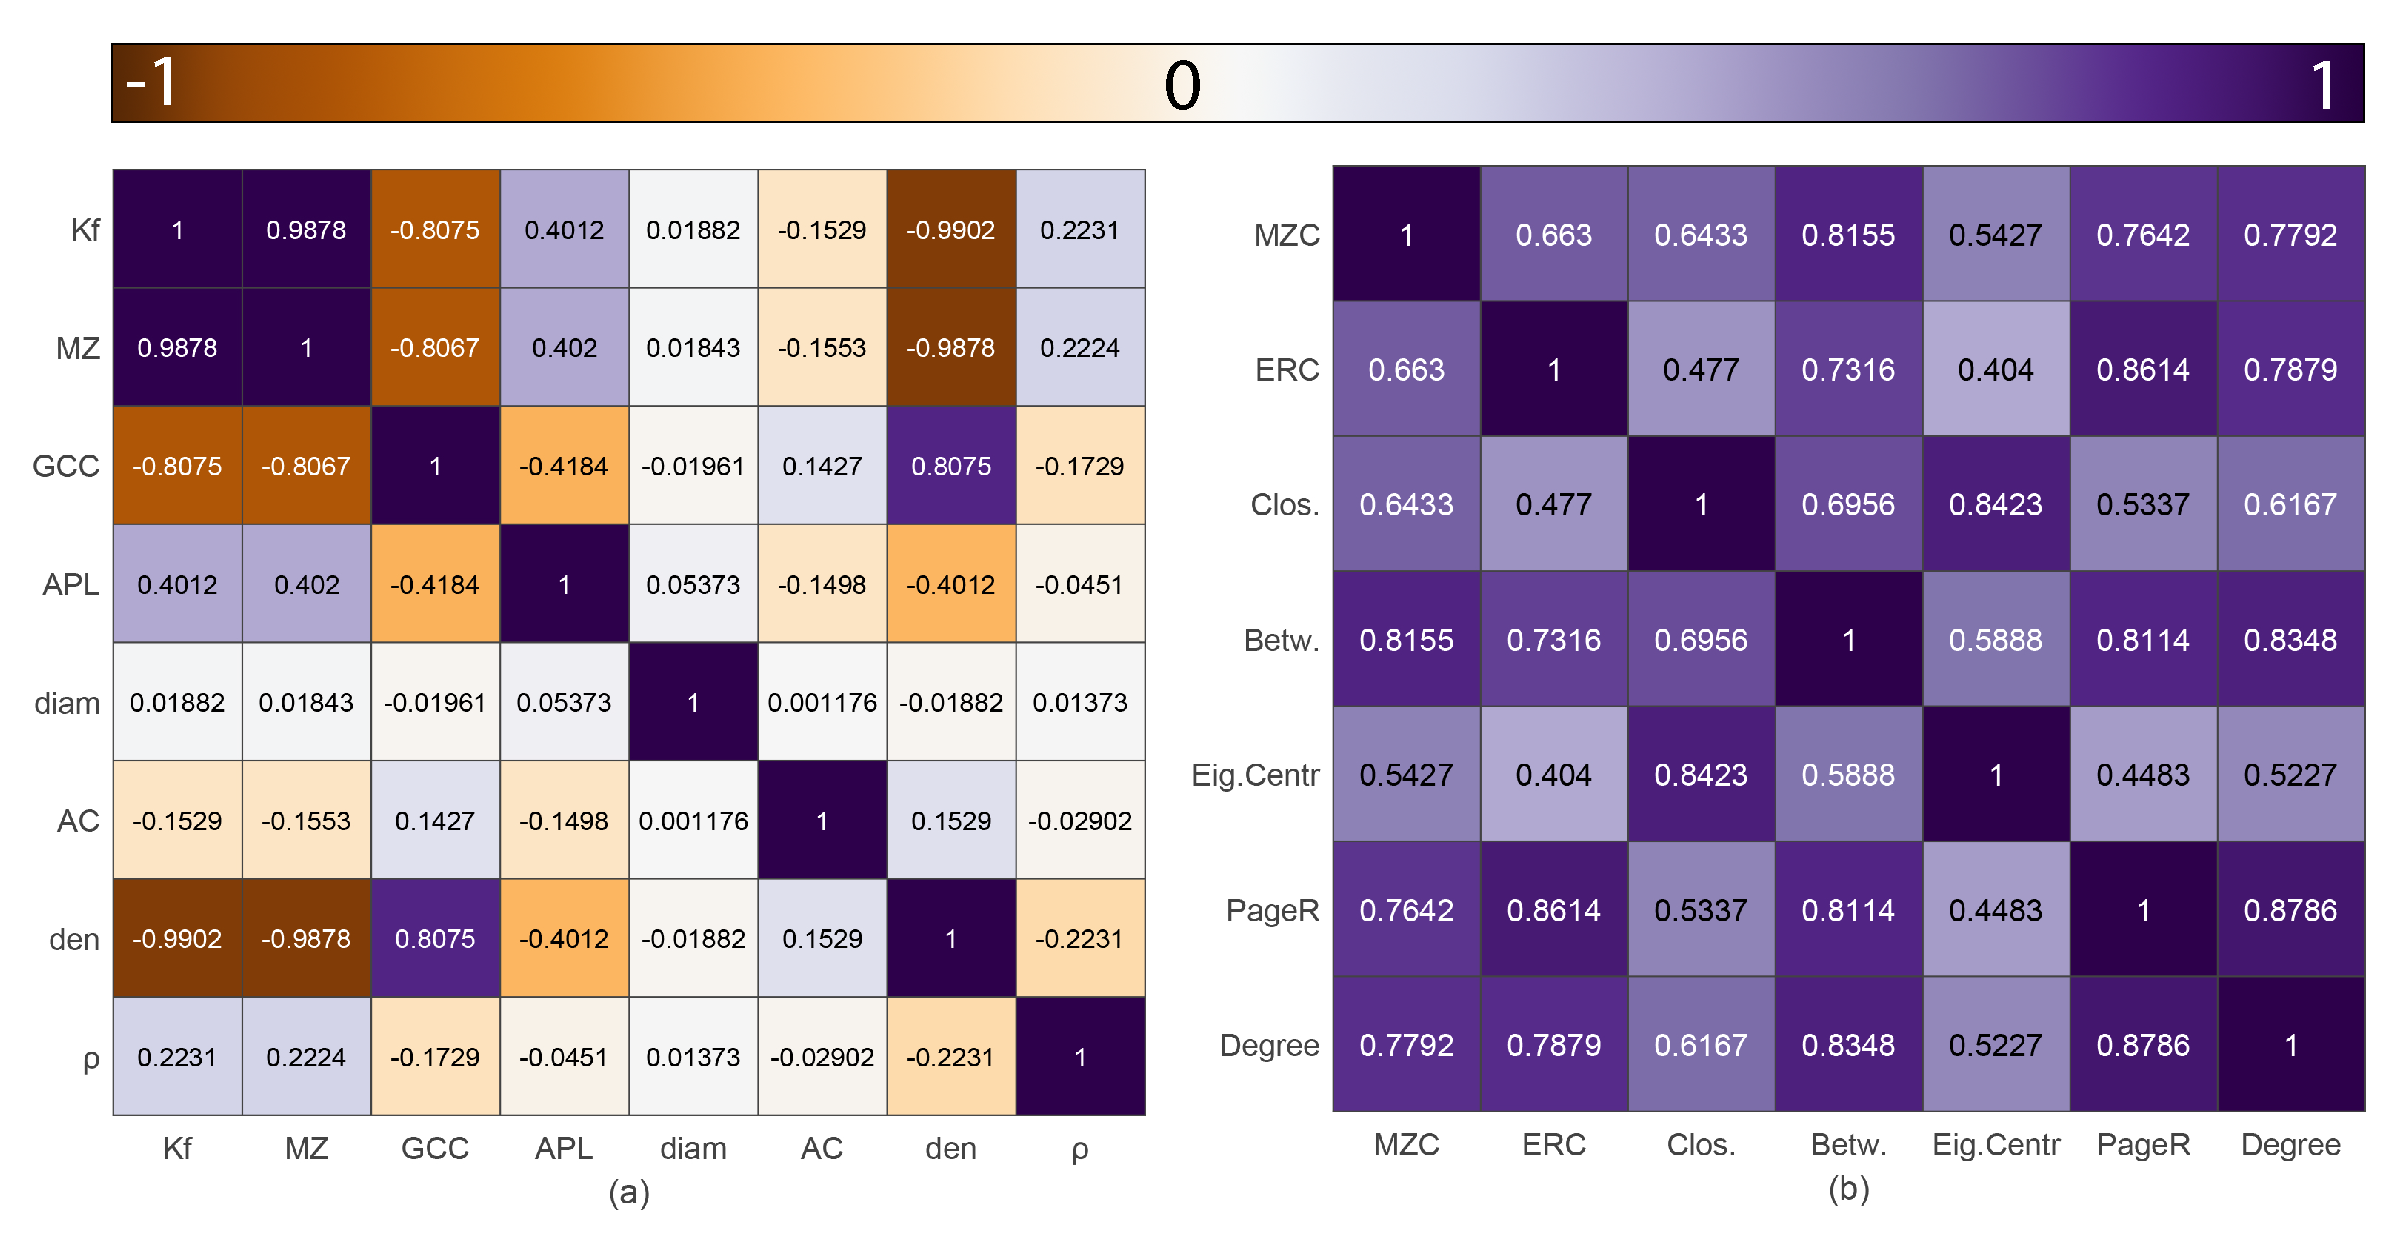
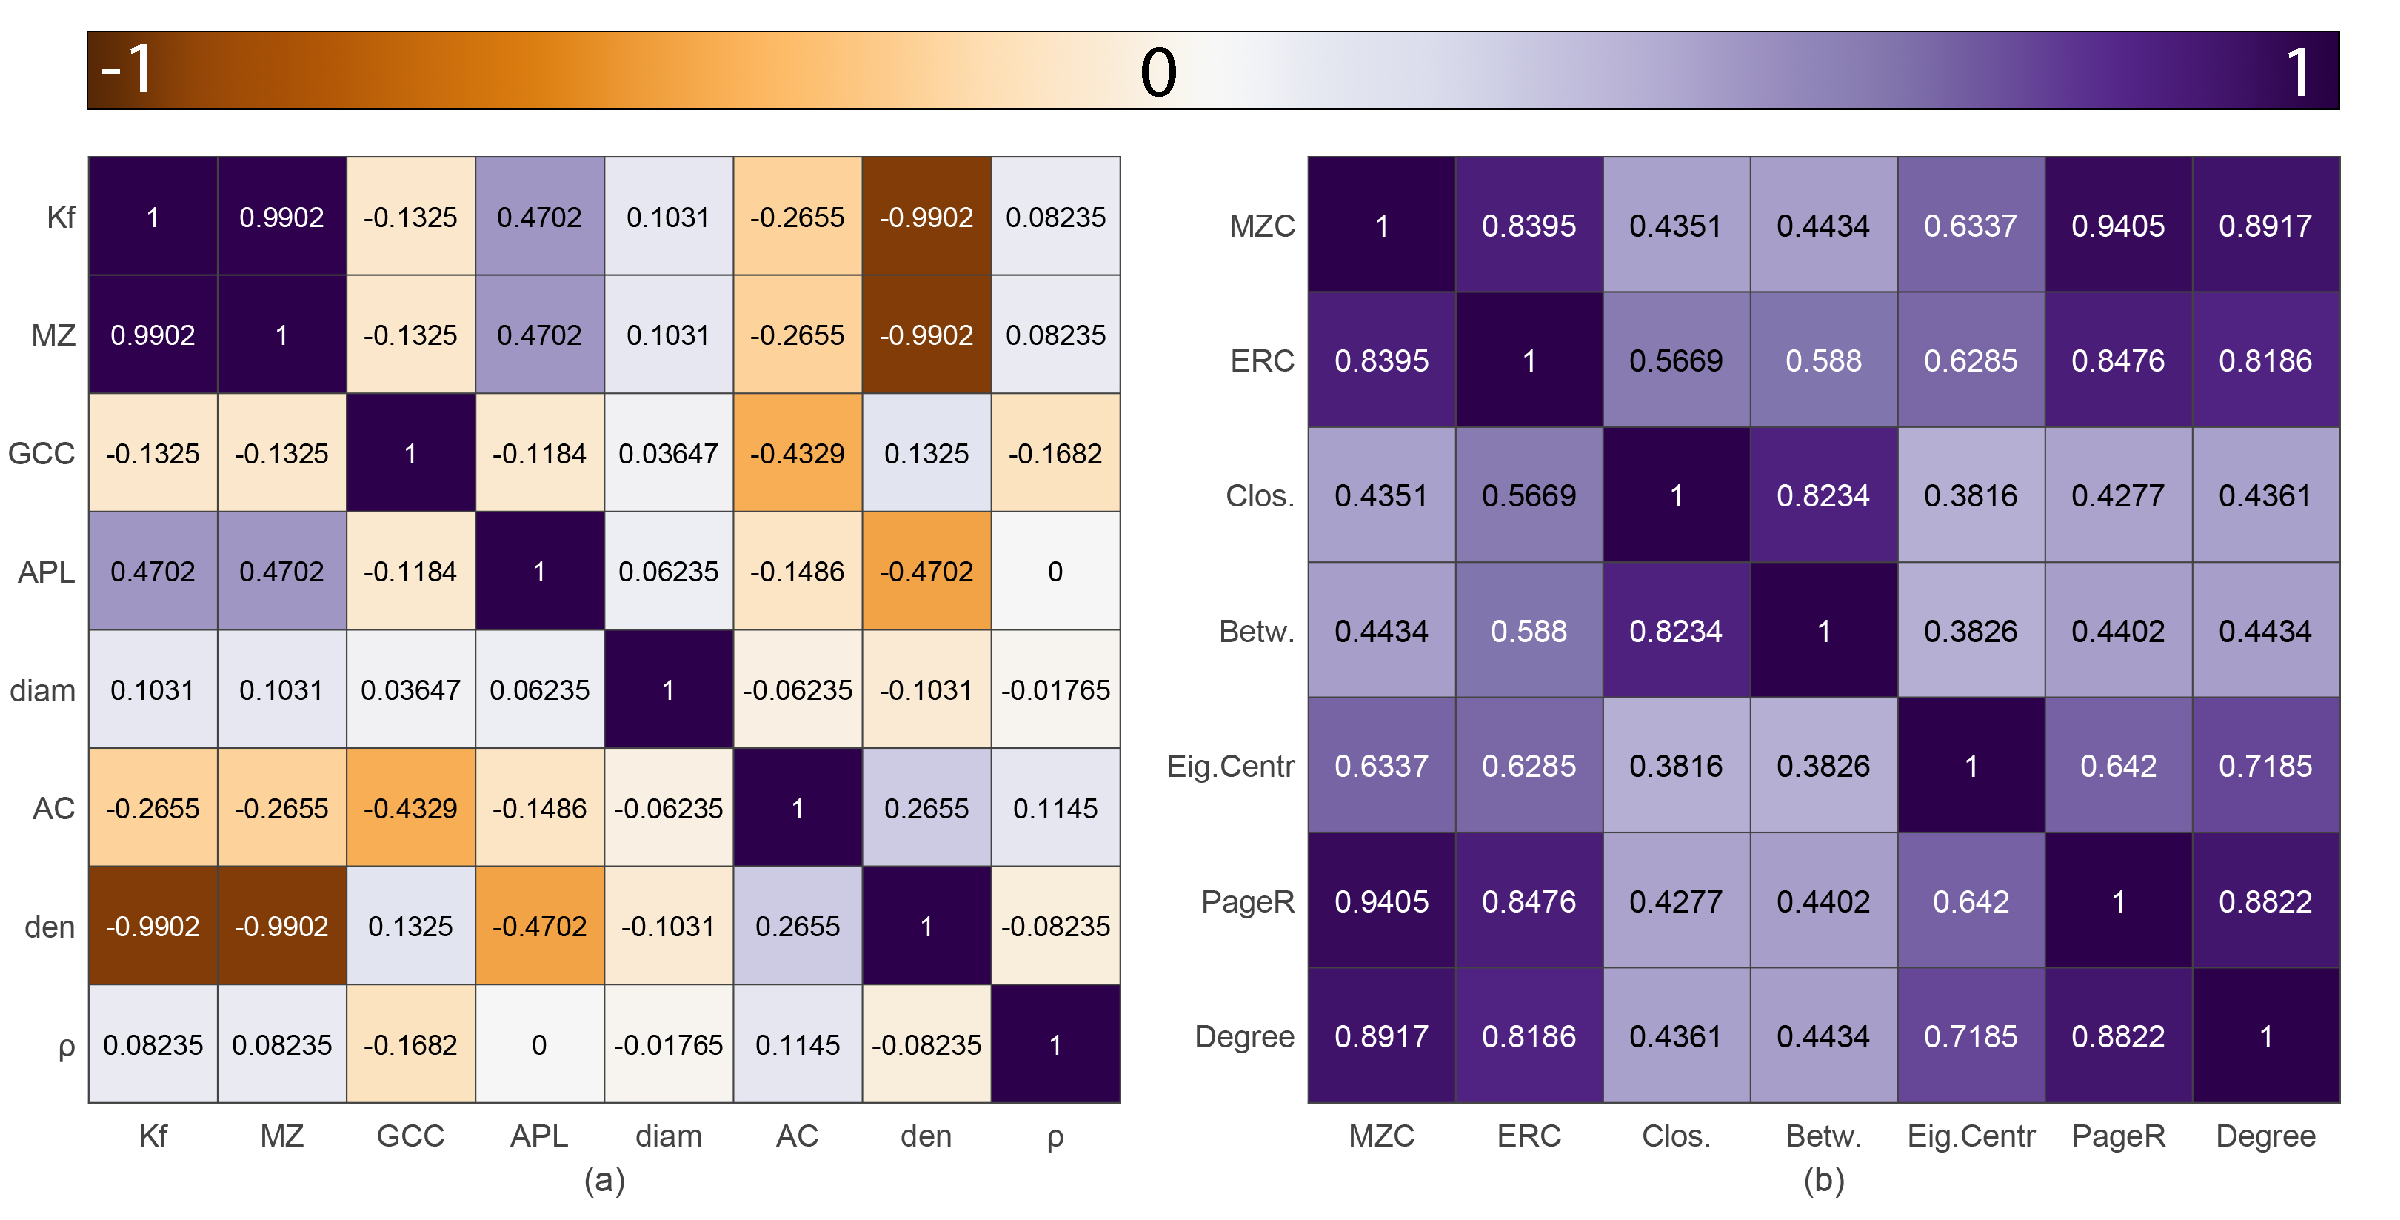
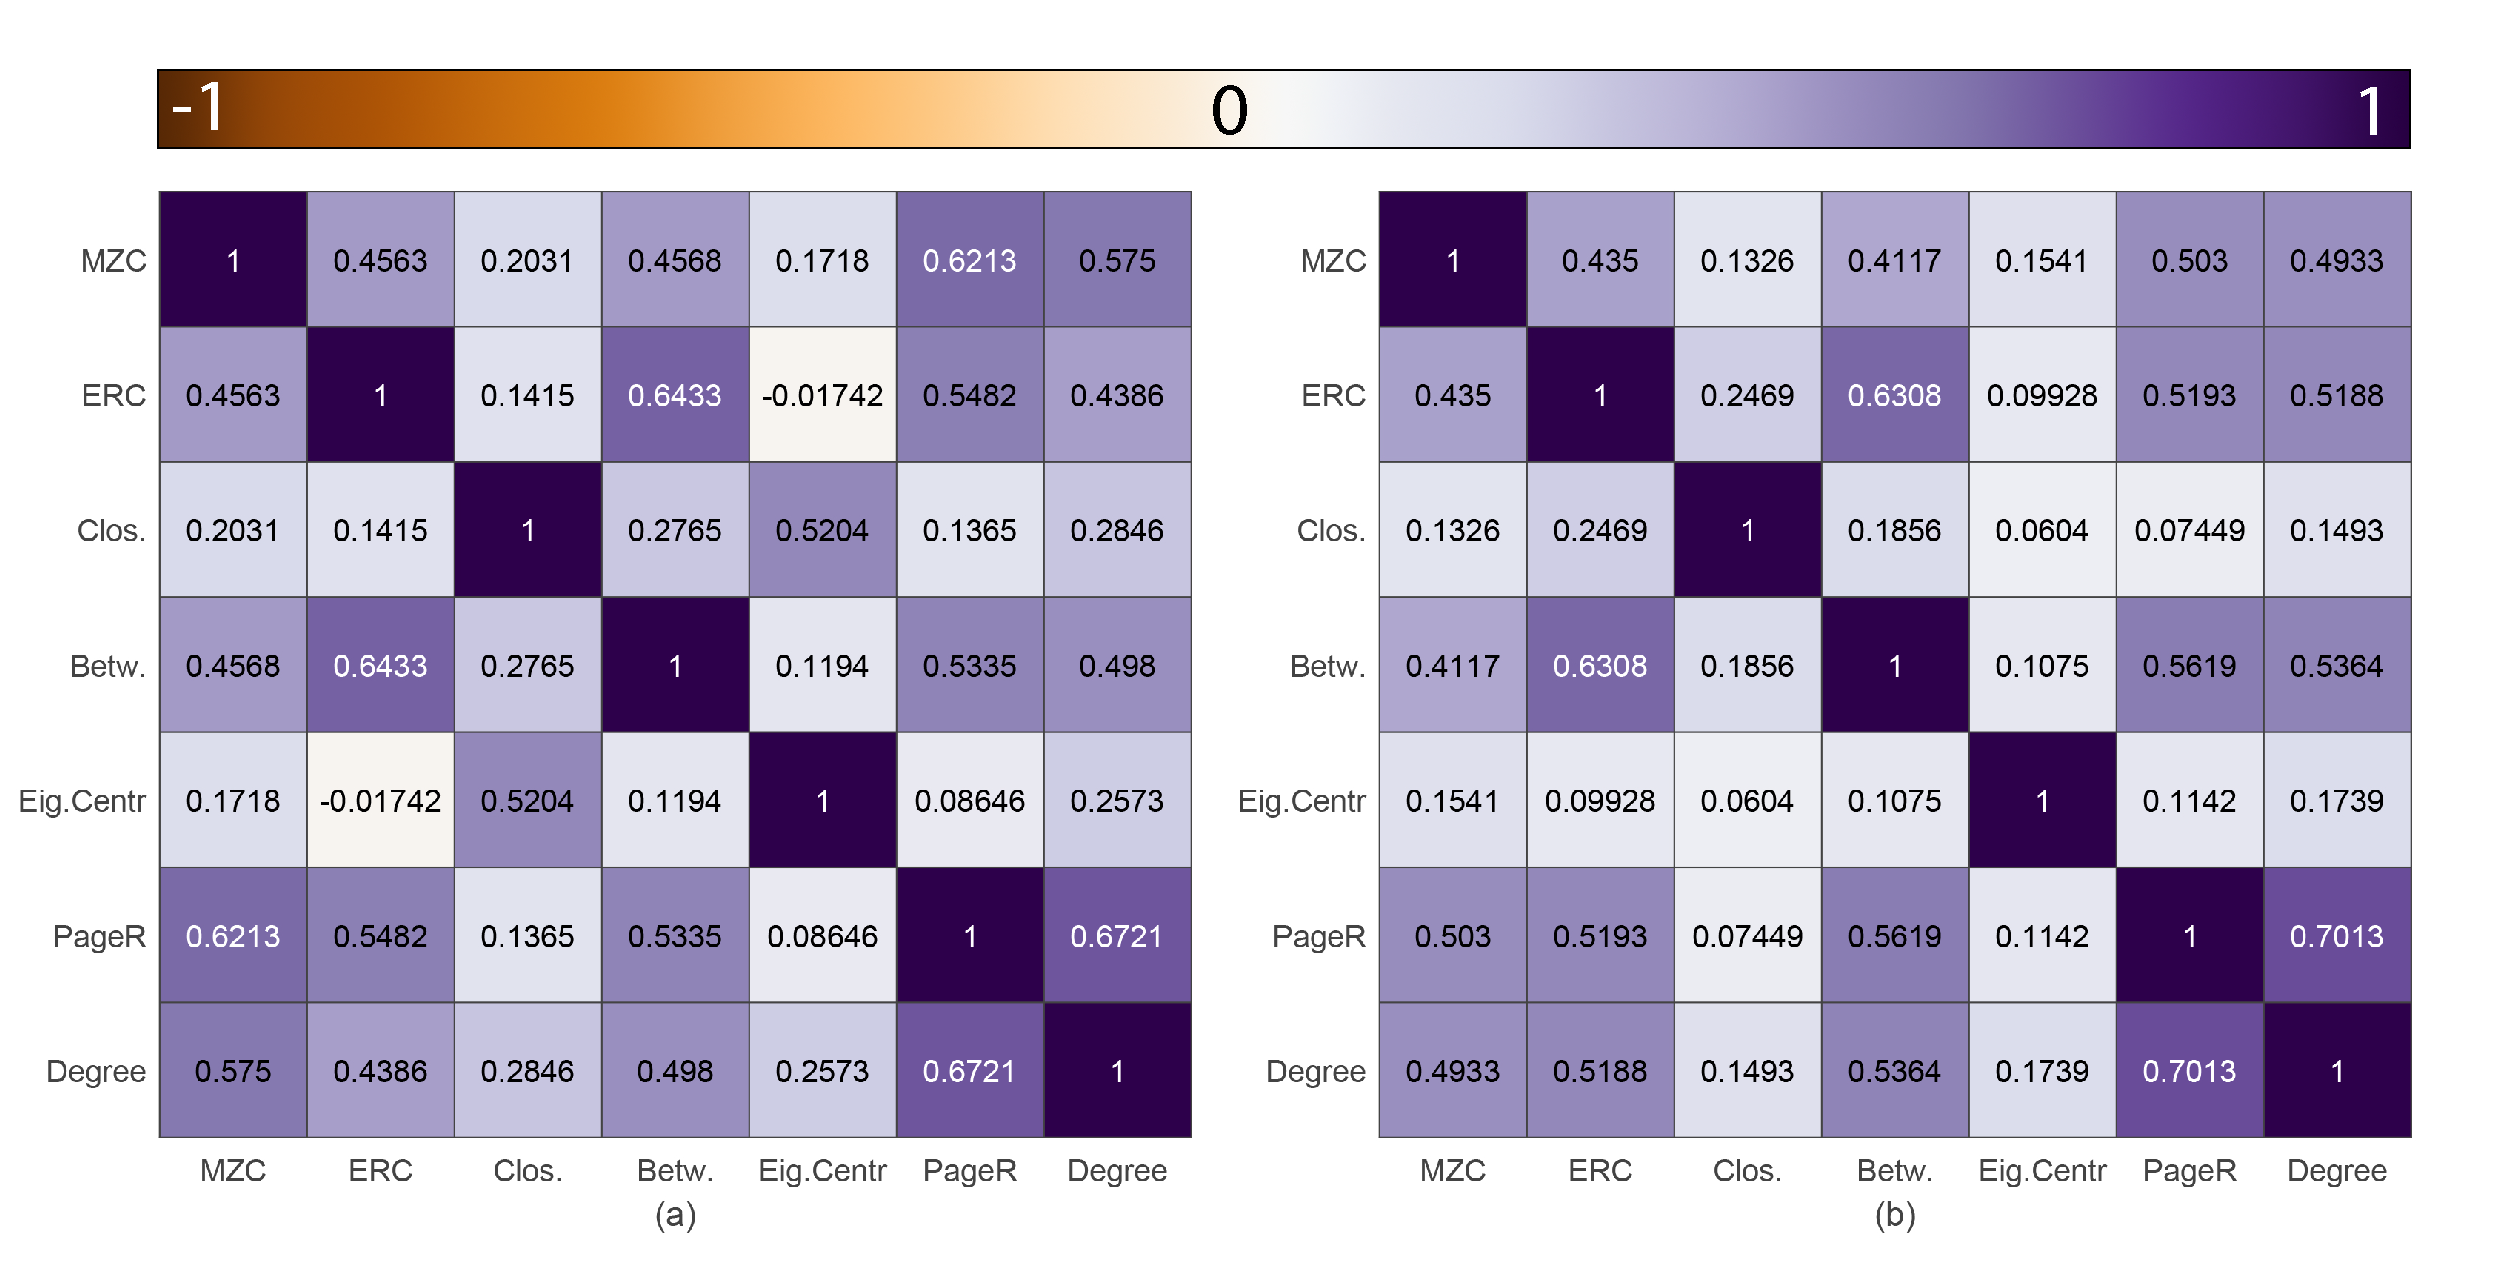
3.3. Exploring Correlations between Different Measures

Actually, there exist plenty of graph measures which could be used for the assessment of graph robustness. In this subsection, we aim to study the correlation between different graph measures, which are all listed in Table 1. We divide the graph measures into two parts. One part includes the global measures of the graph, such as the Kirchhoff index, Modified Zagreb index, global clustering coefficient, average path length, diameter, algebraic connectivity, density, and spectral radius. The other part includes the local measures, such as Modified Zagreb index centrality, efficient resistance centrality, closeness centrality, betweenness centrality, eigenvector centrality, and Page Rank centrality.
First, we calculate the correlation between the eight global measures in Erdös−Rényi random graphs with 2500 vertices and probability p [ 0.5 , 0.001 ] , as shown in Figure 7a. We generate over 10 3 different Erdös−Rényi random graphs, and then perform Kendall Tau correlation analysis. Moreover, we also calculate the correlation between the seven local measures, as shown in Figure 7b.
Then, we also study the correlation between the global measures and local measures in WS small−world networks and BA scale−free networks. The results are shown in Figure 8 and Figure 9, respectively.
All these results demonstrate that Modified Zagreb index (resp. Modified Zagreb index centrality) is quite similar as the Kirchhoff index (resp. efficient resistance centrality) in their performance. Moreover, Modified Zagreb index centrality is a good measure for the assessment of graph robustness as the other local measures.

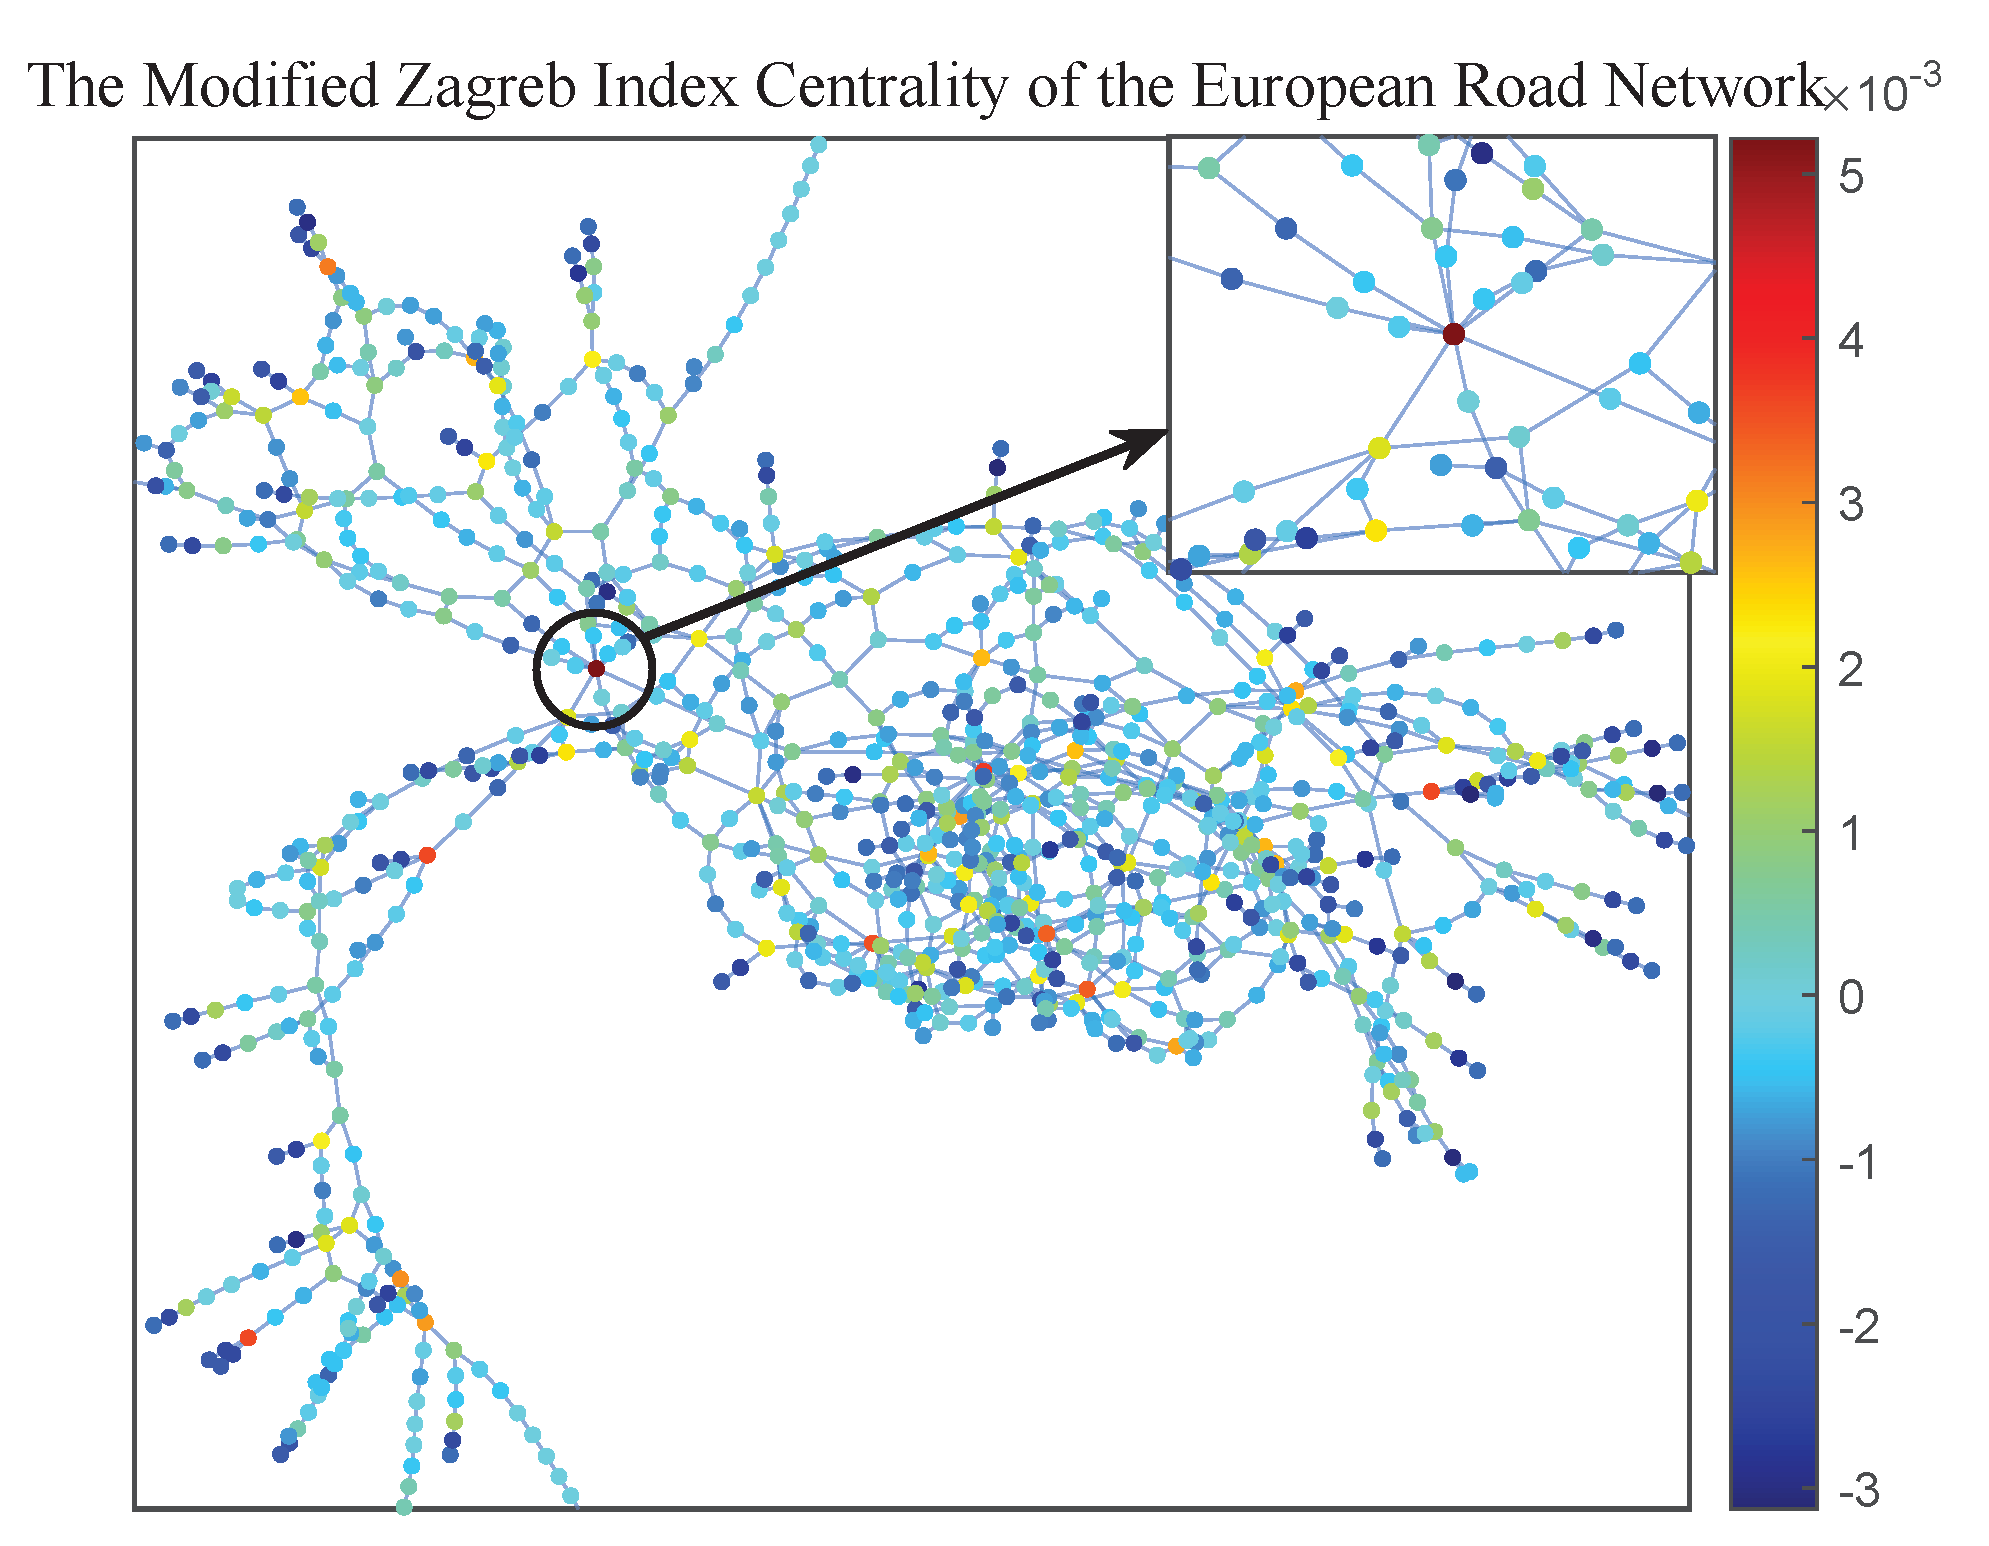
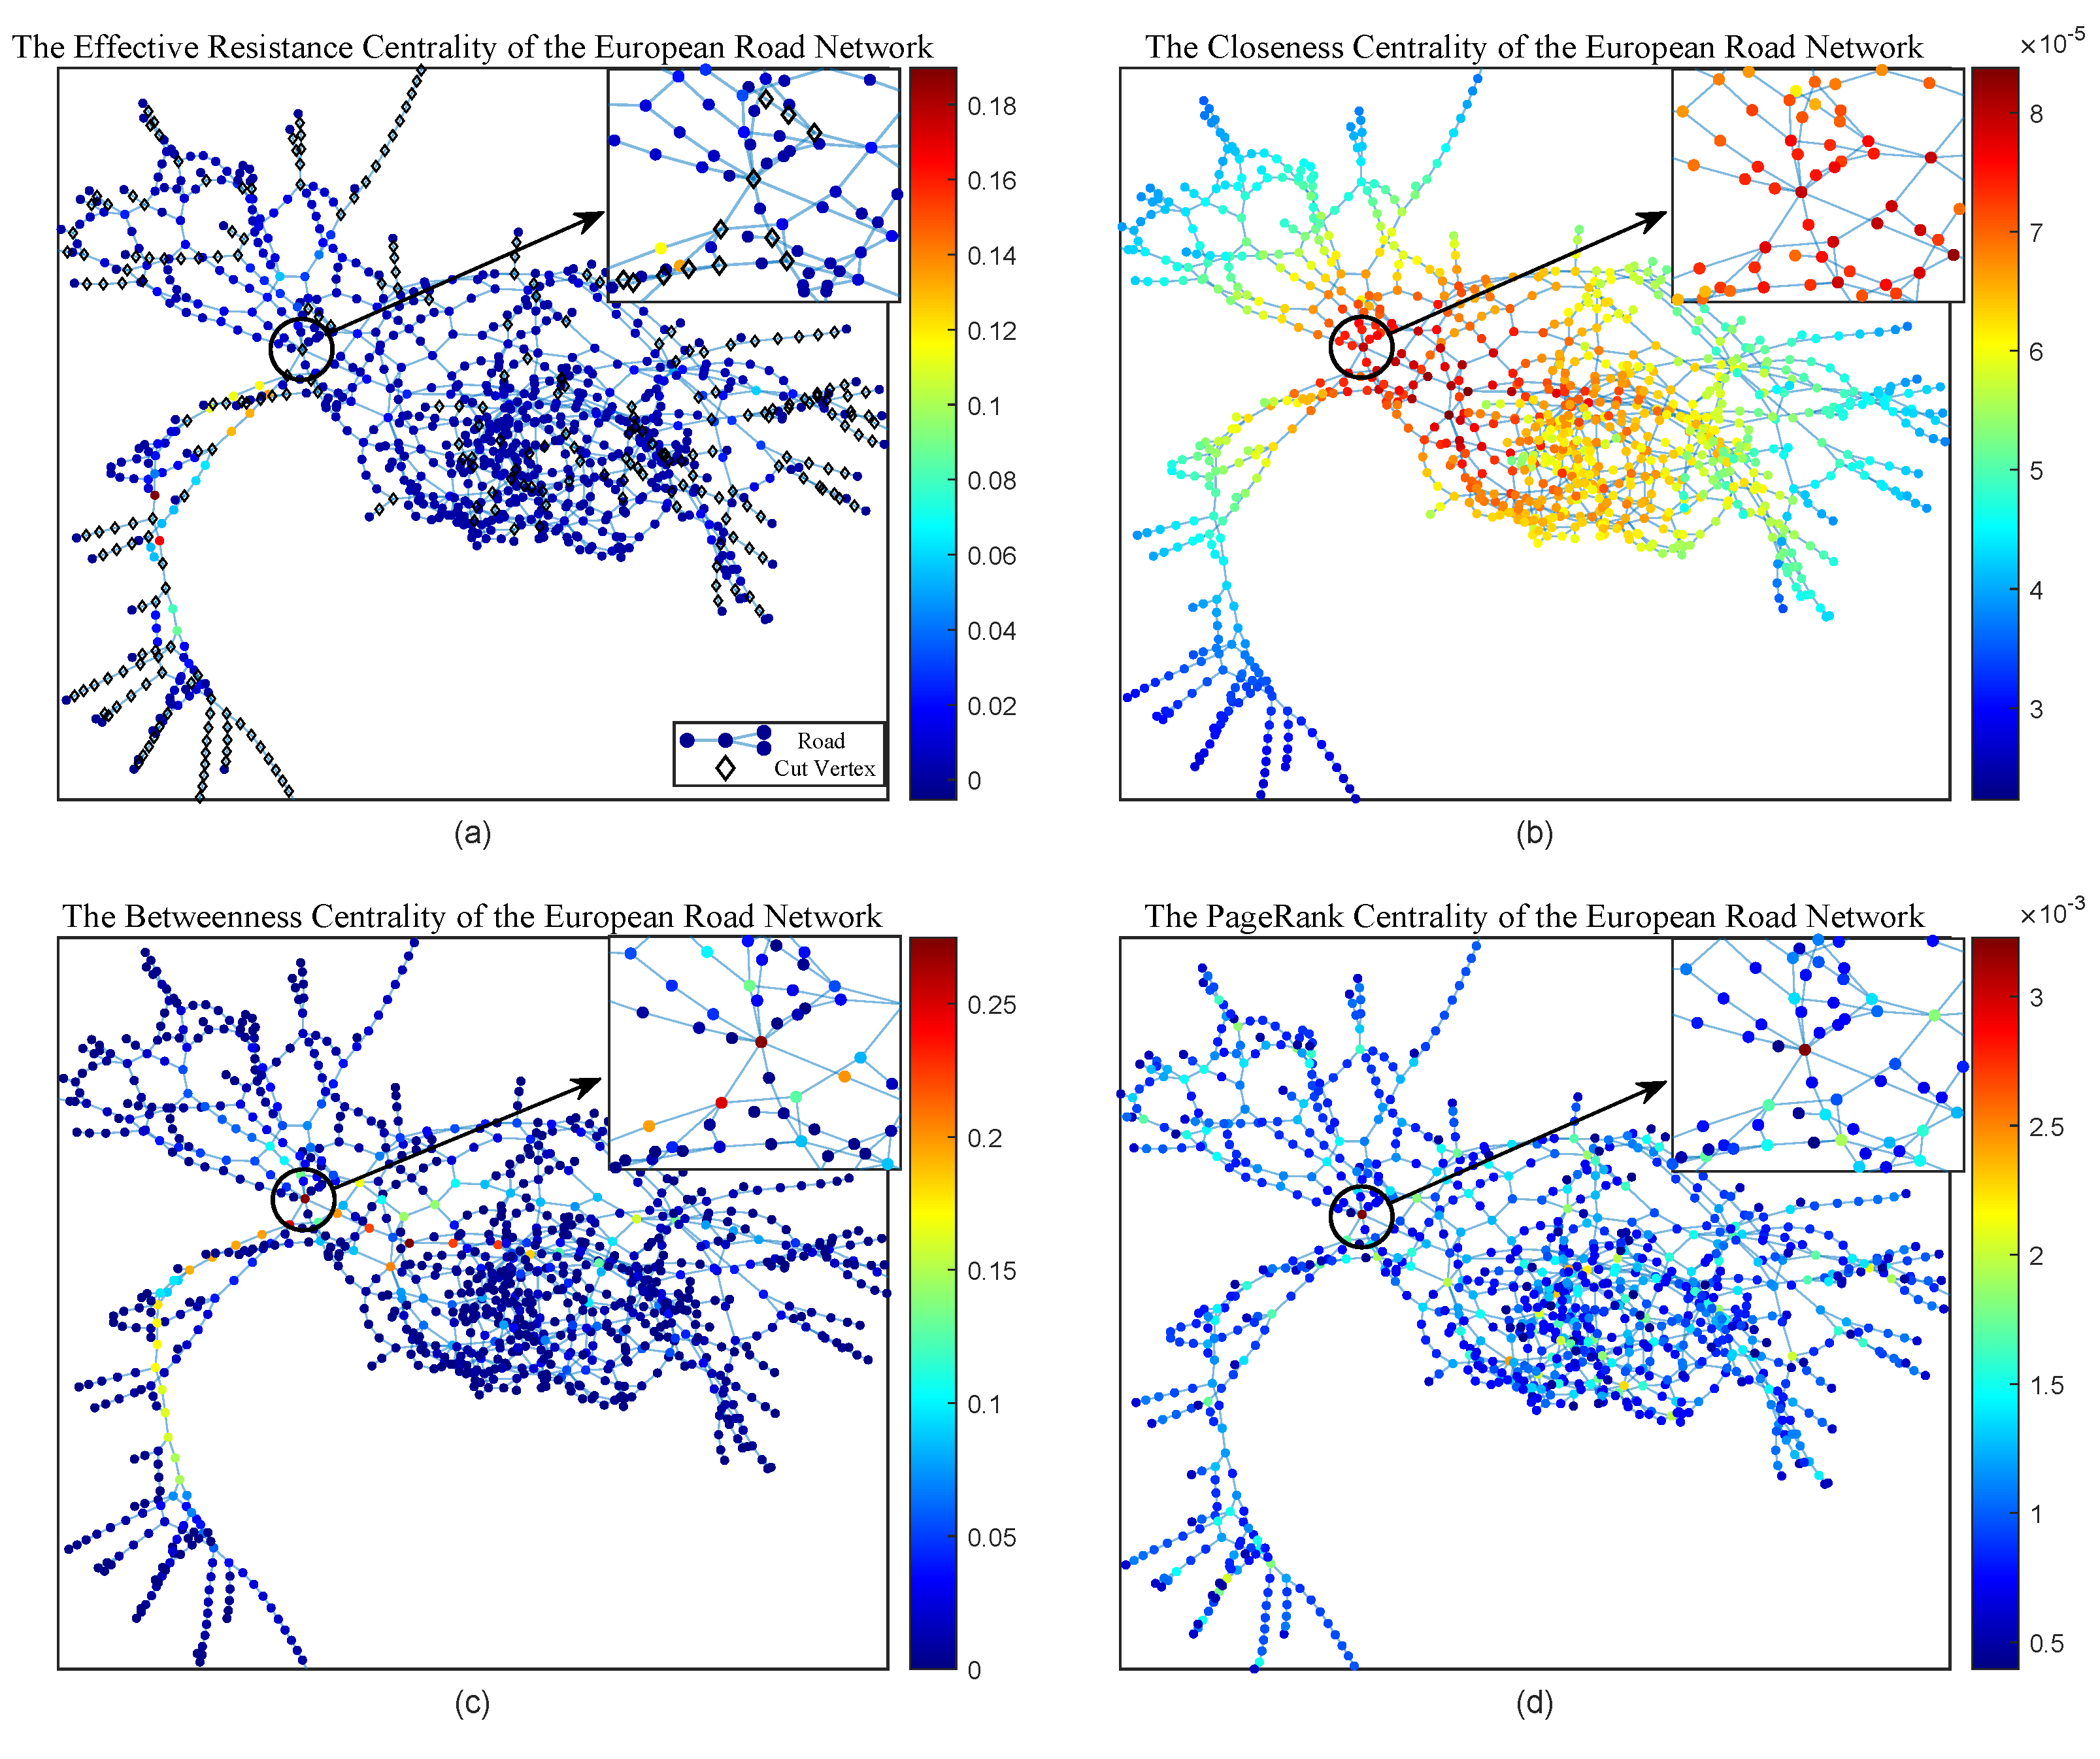
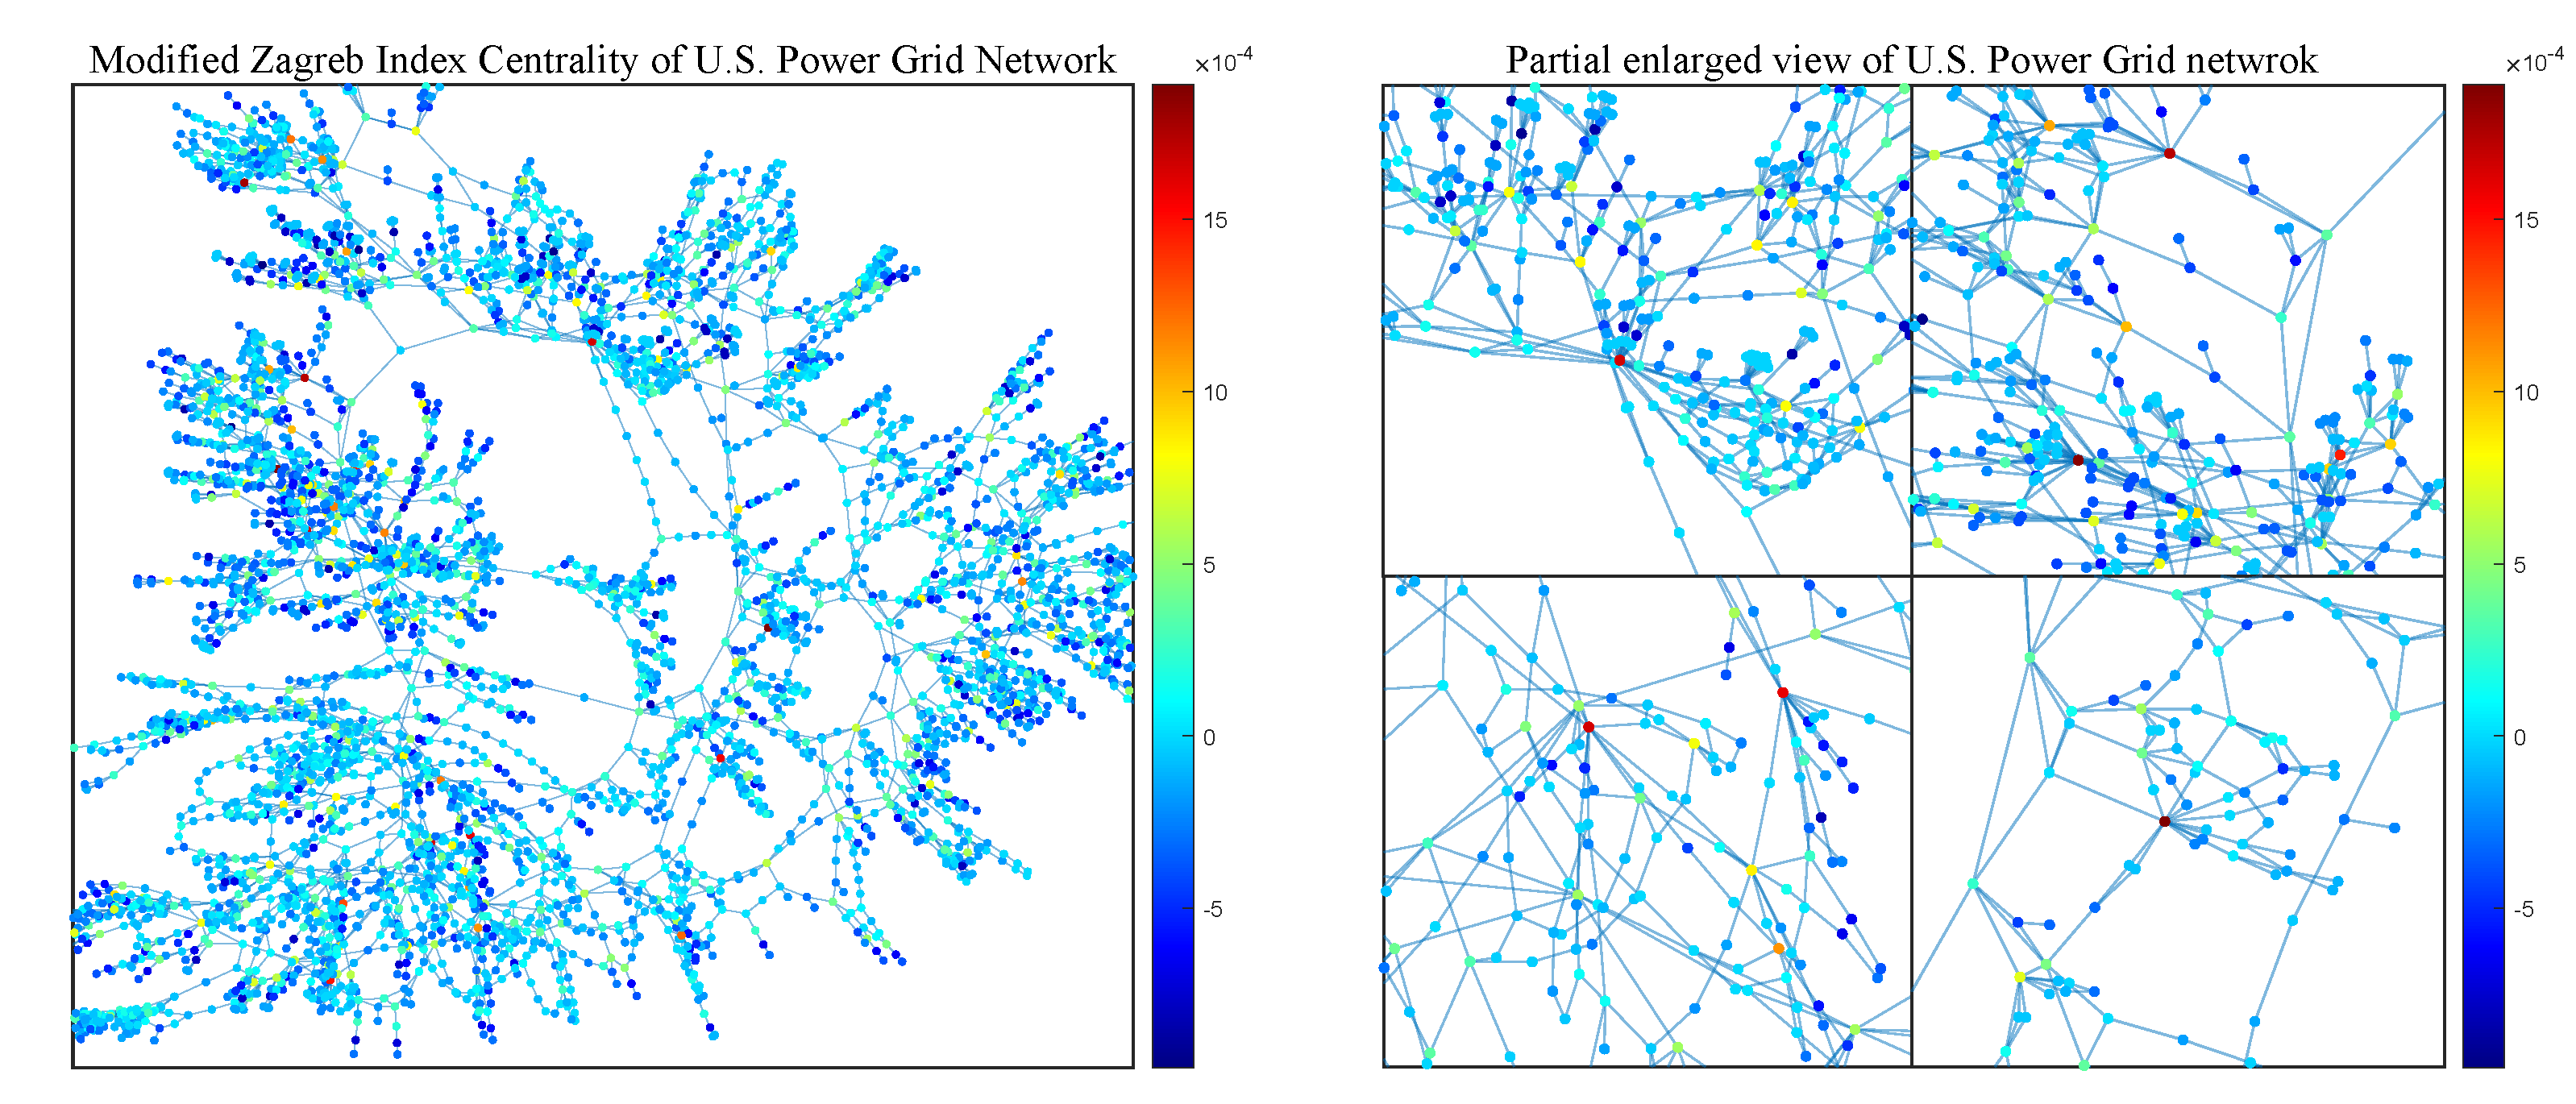
3.4. Empirical Applications in Real World Networks

In this subsection, we explore the behaviour of Modified Zagreb index and Modified Zagreb index centrality by applying the real−world networks. In our experiment, two real-world network data sets are used for analysis (all datasets are accessed on 29 November 2021 from http://networkrepository.com). The first data set describes the European Road Network: vertices of the network are the intersections between roads and road endpoints, and the edges are road segments between intersections and road endpoints. The second data set describes the U.S. Power Grid network: the vertices of the network represent substations and the edges represent transmission lines.
Firstly, we study the European road network. We evaluate the effect of the removal of vertices to better understand the performance of the European road network when a specific road section is faulty or blocked. We use local graph measures to assess the importance of each vertex of the European road network, as shown in Figure 10 and Figure 11. In the European road network, 26.49 % of the vertices are cut vertices, as shown in Figure 11a, some of which are suburban sections or hub nodes. When we use effective resistance centrality to measure how the removed vertices affect the robustness of the network, for any two cut vertices we cannot demonstrate which one is more destructive to the network. For example, in Figure 11a, some cut vertices of degree 1 or 2 are located on the outermost branch path of the European road network. Although removing these vertices can make the network disconnected, they are less destructive than the cut vertices at the center of the network transportation hub. Thus, the Modified Zagreb index centrality would be a better measure in this sense. As shown in Figure 10, most vertices on the outermost branch path of the network are blue or dark blue, which means that their removal has less impact than the other cut vertices on the whole network.
Comparing Modified Zagreb index centrality with other different local measures, Figure 11 shows the different results of these measures and Figure 12a shows the correlation between these measures. As reported in Table 2, we observe that these local measures rank the important vertices of the European Road network in different ways. The in the effective resistance centrality ranking is because this vertex is a cut vertex. It is worth noting that the vertex evaluated by Modified Zagreb index centrality as the most important is also selected by the betweenness centrality (ranking 2nd), Page Rank centrality (ranking 1st), and degree (ranking 1st). This means that the road section represented by the most important vertex measured by the Modified Zagreb index centrality is the necessary place for almost all important transportation in the European road network. Therefore, it is easy to understand that this vertex is vital to the network, and its failure or destruction will seriously affect the robustness and structure of the network, which shows the efficiency of the Modified Zagreb index centrality again.
Then, we perform the same analysis on the U.S. Power Grid network, as shown in Figure 13. In Figure 12b, we show the local measures correlation in the U.S. Power Grid network. The numerical results are slightly different from those of the European road network, but overall, effective resistance centrality, betweenness centrality and Page Rank centrality are correlated with the Modified Zagreb index centrality. We visualize the Modified Zagreb Index centrality for the U.S. Power Grid network, as shown in Figure 13, with a global view on the left and a magnified view of some important vertices on the right.

4. Conclusions

Network robustness represents some research focusing on complex networks, and graph measures are quite useful for assessing the network robustness. In this paper, we the introduce Modified Zagreb index and Modified Zagreb index centrality as the new network robustness measures. Firstly, we theoretically study the relationship between the Modified Zagreb index and other graph measures. Then, we use Modified Zagreb index centrality to analyze the robustness of BA scale−free networks, Erdös−Rényi random networks and WS small−world networks under deliberate or random attacks. We also study the correlations between our new measure and some other existed measures. Finally, we use Modified Zagreb index centrality to study the real world networks.
In conclusion, all these results demonstrate the efficiency of Modified Zagreb index centrality for assessing the robustness of complex networks, which has the similar performance as the effective resistance centrality and can be calculated faster than the effective resistance centrality.

Author Contributions

Conceptualization, R.C., J.L. and W.H.; methodology, R.C.; software, R.C.; validation, R.C.; writing—original draft preparation, R.C.; writing—review and editing, J.L. and W.H.; funding acquisition, R.C., J.L. and W.H. All authors have read and agreed to the published version of the manuscript.

Funding

Supported by Guangdong Basic and Applied Basic Research Foundation (No.2021A1515012047) and Science and Technology Program of Guangzhou (No. 202002030401).

Data Availability Statement

Not applicable.

Conflicts of Interest

The authors declare no conflict of interest.

References

  1. Chakrabarti, D.; Wang, Y.; Wang, C.; Leskovec, J.; Faloutsos, C. Epidemic thresholds in real networks. ACM Trans. Inf. Syst. Secur. (TISSEC) 2008, 10, 1–26. [Google Scholar] [CrossRef]
  2. Zhang, X.M.; Han, Q.L.; Wang, Z.; Zhang, B.L. Neuronal state estimation for neural networks with two additive time-varying delay components. IEEE Trans. Cybern. 2017, 47, 3184–3194. [Google Scholar] [CrossRef] [PubMed]
  3. Le, L.T.; Eliassi-Rad, T.; Tong, H. MET: A fast algorithm for minimizing propagation in large graphs with small eigen-gaps. In Proceedings of the 2015 SIAM International Conference on Data Mining, Vancouver, BC, Canada, 30 April–2 May 2015; Society for Industrial and Applied Mathematics: Philadelphia, PA, USA, 2015; pp. 694–702. [Google Scholar]
  4. Tong, H.; Prakash, B.A.; Tsourakakis, C.; Eliassi-Rad, T.; Faloutsos, C.; Chau, D.H. On the vulnerability of large graphs. In Proceedings of the 2010 IEEE International Conference on Data Mining, Sydney, NSW, Australia, 13–17 December 2010; IEEE: Piscataway, NJ, USA, 2010; pp. 1091–1096. [Google Scholar]
  5. Fiedler, M. Algebraic connectivity of graphs. Czechoslov. Math. J. 1973, 23, 298–305. [Google Scholar] [CrossRef]
  6. Jamakovic, A.; Mieghem, P.V. On the robustness of complex networks by using the algebraic connectivity. In Proceedings of the International Conference on Research in Networking, Singapore, 5–9 May 2008; Springer: Berlin/Heidelberg, Germany, 2008; pp. 183–194. [Google Scholar]
  7. Bondy, J.A.; Murty, U.S.R. Graph Theory with Applications; Macmillan: London, UK, 1976. [Google Scholar]
  8. Li, X.; Zheng, J. A unified approach to the extremal trees for different indices. MATCH Commun. Math. Comput. Chem. 2005, 54, 195–208. [Google Scholar]
  9. Li, X.; Zhao, H. Trees with the first three smallest and largest generalized topological indices. MATCH Commun. Math. Comput. Chem. 2004, 50, 57–62. [Google Scholar]
  10. Milićevixcx, A.; Nikolixcx, S. On variable Zagreb indices. Croat. Chem. Acta 2004, 77, 97–101. [Google Scholar]
  11. Nikolić, S.; Miličević, A.; Trinajstić, N.; Jurić, A. On use of the variable Zagreb vM2 index in QSPR: Boiling points of benzenoid hydrocarbons. Molecules 2004, 9, 1208–1221. [Google Scholar] [CrossRef]
  12. Klein, D.J.; Randić, M. Resistance distance. J. Math. Chem. 1993, 12, 81–95. [Google Scholar] [CrossRef]
  13. Gutman, I.; Mohar, B. The quasi-Wiener and the Kirchhoff indices coincide. J. Chem. Inf. Comput. Sci. 1996, 36, 982–985. [Google Scholar] [CrossRef]
  14. Wang, H.; Hua, H.; Wang, D. Cacti with minimum, second-minimum, and third-minimum Kirchhoff indices. Math. Commun. 2010, 15, 347–358. [Google Scholar]
  15. Erdös, P.; Rényi, A.; Bollobás, B. Publicationes Mathematicae Debrecen. Random Graphs I 1959, 6, 290–297. [Google Scholar]
  16. Van Mieghem, P. Performance Analysis of Communications Networks and Systems; Cambridge University Press: Cambridge, UK, 2009. [Google Scholar]
  17. Adamic, L.A.; Huberman, B.A.; Barabási, A.L.; Albert, R.R.; Jeong, H.; Bianconi, G. Power-law distribution of the world wide web. Science 2000, 287, 2115. [Google Scholar] [CrossRef]
  18. Watts, D.J.; Strogatz, S.H. Nature 393 440 Watts DJ 1999 Small Worlds: The Dynamics of Networks between Order and Randomness; Princeton University: Princeton, NJ, USA, 1998. [Google Scholar]
  19. Bavelas, A. Communication patterns in task-oriented groups. J. Acoust. Soc. Am. 1950, 22, 725–730. [Google Scholar] [CrossRef]
  20. Barrat, A.; Barthelemy, M.; Pastor-Satorras, R.; Vespignani, A. The architecture of complex weighted networks. Proc. Natl. Acad. Sci. USA 2004, 101, 3747–3752. [Google Scholar] [CrossRef] [PubMed]
  21. Wang, X.; Pournaras, E.; Kooij, R.E.; Van Mieghem, P. Improving robustness of complex networks via the effective graph resistance. Eur. Phys. J. B 2014, 87, 1–12. [Google Scholar] [CrossRef]
  22. De Meo, P.; Messina, F.; Rosaci, D.; Sarné, G.M.; Vasilakos, A.V. Estimating graph robustness through the Randic index. IEEE Trans. Cybern. 2017, 48, 3232–3242. [Google Scholar] [CrossRef] [PubMed]
  23. Martínez-Martínez, C.T.; Mendez-Bermudez, J.A.; Rodríguez, J.M.; Sigarreta, J.M. Computational and analytical studies of the Randić index in Erdös–Rényi models. Appl. Math. Comput. 2020, 377, 125137. [Google Scholar] [CrossRef]
  24. Clemente, G.P.; Cornaro, A. A novel measure of edge and vertex centrality for assessing robustness in complex networks. Soft Comput. 2020, 24, 13687–13704. [Google Scholar] [CrossRef]
  25. Negre, C.F.A.; Morzan, U.N.; Hendrickson, H.P.; Pal, R.; Lisi, G.P.; Loria, J.P.; Rivalta, I.; Ho, J.; Batista, V.S. Eigenvector centrality for characterization of protein allosteric pathways. Proc. Natl. Acad. Sci. USA 2018, 115, E12201–E12208. [Google Scholar] [CrossRef]
  26. Gyongyi, Z.; Berkhin, P.; Garcia-Molina, H.; Pedersen, J. Link Spam Detection Based on Mass Estimation; Stanford University: Stanford, CA, USA, 2005. [Google Scholar]
  27. Chen, H.; Soni, U.; Lu, Y.; Huroyan, V.; Maciejewski, R.; Kobourov, S. Same stats, different graphs: Exploring the space of graphs in terms of graph properties. IEEE Trans. Vis. Comput. Graph. 2019, 27, 2056–2072. [Google Scholar] [CrossRef]
  28. Butler, S.K. Eigenvalues and Structures of Graphs. Ph.D. Thesis, University of California, San Diego, CA, USA, 2008. [Google Scholar]
  29. Chung, F.R.K.; Graham, F.C. Spectral Graph Theory; American Mathematical Society: Providence, RI, USA, 1997. [Google Scholar]
  30. Yu, G.; Ye, M.; Cai, G.; Cao, J. Signless Laplacian spectral conditions for Hamiltonicity of graphs. J. Appl. Math. 2014, 2014, 282053. [Google Scholar] [CrossRef] [PubMed]
  31. Cavers, M. The Normalized Laplacian Matrix and General Randic Index of Graphs. Ph.D. Thesis, University of Regina, Regina, SK, Canada, 2010. [Google Scholar]
  32. Hoory, S.; Linial, N.; Wigderson, A. Expander graphs and their applications. Bull. Am. Math. Soc. 2006, 43, 439–561. [Google Scholar] [CrossRef]
  33. Malliaros, F.D.; Megalooikonomou, V.; Faloutsos, C. Estimating robustness in large social graphs. Knowl. Inf. Syst. 2015, 45, 645–678. [Google Scholar] [CrossRef]
  34. Aguilar-Sánchez, R.; Herrera-González, I.F.; Méndez-Bermúdez, J.A.; Sigarreta, J.M. Computational properties of general indices on random networks. Symmetry 2020, 12, 1341. [Google Scholar] [CrossRef]
  35. Martínez-Pérez, Á.; Rodrxixguez, J.M. New lower bounds for the second variable Zagreb index. J. Comb. Optim. 2018, 36, 194–210. [Google Scholar] [CrossRef]
Figure 1. (a) Average Modified Zagreb index M Z ( G ) as a function of the probability p of Erdös−Rényi random graphs G P ( N ) of different order N [25, 1600]. (b) Average normalized modified Zagreb index M Z ¯ ( G ) as a function of the probability p. (c) p * as a function of n. (d) M Z ¯ ( G ) as a function of ξ = n p .
Axioms 11 00484 g001
Figure 2. (a,b) respectively show the calculation and analysis of the R K ( V , G ) and R S ( V , G ) on the simulated BA scale−free network. By selecting 20 high−degree vertices for deliberate attacks and 20 random vertices for random attacks, they are all calculated by generating a 2500-order BA scale−free network with m 0 = 5 and m = 4 for 10 2 times, and the results are displayed in the form of box plots.
Axioms 11 00484 g002
Figure 3. The figure shows the calculation and analysis of deliberate attacks and random attacks of R S ( V , G ) and R K ( V , G ) on the ER random network. They are all calculated by generating a 2500-order ER random network with p = 0.08 for 10 2 times, and the results are displayed in the form of box plots.
Axioms 11 00484 g003
Figure 4. Experimental results for both measures when the number of removed vertices on the ER network reaches 200. Both are normalized data. (a) Deliberate and random attacks under the use of R K measures. (b) Deliberate and random attacks under the use of R S measures.
Axioms 11 00484 g004
Figure 5. Experimental results of the two measures on the BA network and the ER network. For better presentation and observation of the data, the data here are averaged. (a) Deliberate and random attacks under the use of R K measures. (b) Deliberate and random attacks under the use of R S measures.
Axioms 11 00484 g005
Figure 6. The figure shows the calculation and analysis of deliberate attacks and random attacks of R S ( V , G ) and R K ( V , G ) on the WS small−world network. They are all calculated by generating a 2500-order WS small−world network with m 0 = 50 and p = 0.15 for 10 2 times, and the results are displayed in the form of box plots.
Axioms 11 00484 g006
Figure 7. (a) The correlation between the global graph measures for more than 10 3 graphs generated by the Erdös−Rényi model with 2500 vertices and p [ 0.5 , 0.001 ] . (b) The correlation between the local measures of each vertex of the graph generated by the Erdös−Rényi model with 2500 vertices and p = 0.08 .
Axioms 11 00484 g007
Figure 8. (a) The correlation between the global graph measures for more than 10 3 graphs generated by the Barabási−Albert scale−free model with V [ 1500 , 2500 ] , m 0 = 5 and m = 4 . (b) The correlation between the local measures of each vertex of the graph generated by the Barabási−Albert scale−free model with V = 2500 , m 0 = 5 and m = 4 .
Axioms 11 00484 g008
Figure 9. (a) The correlation between the global graph measures for more than 10 3 graphs generated by the Watts–Strogatz small–world model with V [ 1500 , 2500 ] , m 0 = 50 and p = 0.15 . (b) The correlation between the local measures of each vertex of the graph generated by the Watts–Strogatz small–world model with V = 2500 , m 0 = 50 and p = 0.15 .
Axioms 11 00484 g009
Figure 10. It shows how each vertex affects the robustness of the European road network, where these vertices are measured using Modified Zagreb Index Centrality and then colored depending on the values. One of the vertices evaluated as important is enlarged in the inset.
Axioms 11 00484 g010
Figure 11. (ad) respectively report the use of Effective Resistance Centrality, Closeness Centrality, Betweenness Centrality, and PageRank Centrality to measure the importance of each vertex of the European road network.
Axioms 11 00484 g011
Figure 12. Kendall Tau correlation between Modified zagreb index centrality, Effective resistance centrality, Closeness centrality, Betweenness centrality, Eigenvector centrality, Pagerank centrality, and Degree. (a) European Road Network. (b) U.S. Power Grid Network.
Axioms 11 00484 g012
Figure 13. It shows how each vertex affects the robustness of the U.S. Power Grid network, where these vertices are measured using Modified Zagreb Index Centrality and then colored.
Axioms 11 00484 g013
Table 1. All graph measures considered in this paper.
NameDefinitionAbbreviation
Effective Graph Resistance K f ( G ) = N i = 1 n 1 1 λ i , where λ i ( 1 i n 1 ) are all the non-zero Laplacian eigenvaluesKf
Modified Zagreb index M Z ( G ) = u v E ( d u d v ) 1 MZ
Global Clustering Coefficient G C C ( G ) = 3 × t r i a n g l e s c o n n e c t e d t r i p l e s GCC
Average Path Length A P L ( G ) = 1 n ( n 1 ) u , v V d i s t ( u , v ) , where d i s t ( u , v ) is the distance between u and vAPL
Diameter d i a m ( G ) = m a x d i s t ( v , w ) , v , w V diam
Algebraic Connectivity A C ( G ) = the second smallest eigenvalue of the Laplacian matrix
Density d e n ( G ) = 2 E V ( V 1 ) den
Spectral Radius ρ ( G ) = the largest eigenvalue of the adjacency matrix ρ
Closeness Centrality C C ( v ) = n 1 u v d i s t ( u , v ) Clos.
Betweenness Centrality C B ( v ) = s , t V σ ( s , t v ) σ ( s , t ) , where σ ( s , t ) is the total number of shortest paths between vertex s and t and σ ( s , t v ) is the number of shortest paths between s and t going through vBetw.
Eigenvector Centrality C e i ( v i ) = the i-th entry in the normalized eigenvector belonging to the largest eigenvalue of the adjacency matrixEig.Centr
PageRank Centrality P R ( v ) = 1 d + d u N ( v ) P R ( u ) d u , where P R ( v ) is the PageRank score of vertex v and d is a value between 0 and 1, which determines the damping factor and is usually set to 0.85 .PageR
Table 2. The most important vertices of European Road network are ordered in terms of Modified Zagreb Index Centrality.
MZCERCBetw.PageRClos.Eig.CentrDegree
121102411
2719631112256
38071204437960797
415243660337179
5379979891000311
659502671625
7139865262954
866239719925
932950902738180
1012275953746120
11244301432253
12772797497368
131675101358431617
1418664624610164
15302222569279356
We display only top 15 vertices. In each column, we show the ranking derived by using alternative local measures.
Publisher’s Note: MDPI stays neutral with regard to jurisdictional claims in published maps and institutional affiliations.

