Article

A Novel Algorithmic Forex Trade and Trend Analysis Framework Based on Deep Predictive Coding Network Optimized with Reptile Search Algorithm

1
Department of Information Technology, Veer Surendra Sai University of Technology Burla, Sambalpur 768018, Odisha, India
2
Department of Computer Science and Engineering, Siksha ‘O’ Anusandhan (Deemed to be) University, Bhubaneswar 751030, Odisha, India
3
School of Computer Engineering, Kalinga Institute of Industrial Technology (KIIIT), Deemed to be University, Bhubaneswar 751024, Odisha, India
4
School of Computing, DIT University, Dehradun 248009, Uttarakhand, India
5
Department of Computer Science, South Ural State University, 454080 Chelyabinsk, Russia
6
Big Data and Machine Learning Lab, South Ural State University, 454080 Chelyabinsk, Russia
*
Author to whom correspondence should be addressed.
Axioms 2022, 11(8), 396; https://doi.org/10.3390/axioms11080396
Submission received: 22 July 2022 / Revised: 7 August 2022 / Accepted: 10 August 2022 / Published: 11 August 2022
(This article belongs to the Special Issue Machine Learning: Theory, Algorithms and Applications)

Abstract

:
This paper proposed a short-term two-stage hybrid algorithmic framework for trade and trend analysis of the Forex market by augmenting the currency pair datasets with transformed attributes using a few technical indicators and statistical measures. In the first phase, an optimized deep predictive coding network (DPCN) based on a meta-heuristic reptile search algorithm (RSA) inspired by the intelligent hunting activities of the crocodiles is exploited to develop this RSA-DPCN predictive model. The proposed model has been compared with optimized versions of extreme learning machine (ELM) and functional link artificial neural network (FLANN) with genetic algorithm (GA), particle swarm optimization (PSO), and differential evolution (DE) along with the RSA optimizers. The performance of this model has been evaluated and validated through several statistical tests. In the second phase, the up and down trends are analyzed using the Higher Highs Higher Lows, and Lower Highs Lower Lows (HHs/HLs and LHs/LLs) trend analysis tool. Further, the observed trends are compared with the actual trends observed on the exchange price of real datasets. This study shows that the proposed RSA-DPCN model accurately predicts the exchange price. At the same time, it provides a well-structured platform to discern the directions of the market trends and thereby guides in finding the entry and exit points of the Forex market.

1. Introduction

The Forex market is an ally of many firms, organizations, and individuals who go through a contract process to either sell or buy the currencies of different countries to make a profit from their investments [1,2]. Fundamental and technical analysis is the backbones of profitability in the Forex market. The fundamental analysis helps to observe the patterns of market data to categorize the trends and forecast the prices. In contrast, the technical analysis monitors the trading volume, the number of investors, and market sentiments to predict the future price of the currency pairs, as well as to identify the trends of the market (up-trends or down-trends) to understand the pattern and thereby decide on to trade or not [3,4]. Quantitative tools like technical indicators (TIs), statistical measures (SMs), oscillators, and momentums are widely used for analysis in the Forex market. This technical market analysis can be performed in manual and automated systems to analyze the market trends and make buying or selling decisions [4]. Artificial intelligence (AI) [1,2,5], machine learning (ML) [5,6,7,8], and deep learning (DL) [9,10,11,12] based tools and algorithms are commonly known as algorithmic trading being very widely used lately by the researchers in this financial market.
The AI, ML, and DL have shown their potential to handle the large volume of historical and chaotic data using advanced mathematical and statistical strategies in financial market analysis. They are widely used to develop forecasting models that determine the optimal time to trade and observe the trends with less risk. The researchers have mainly focused primarily on artificial neural network (ANN) based tools [7,8], extreme learning machines (ELM) [1,2,3,4,5,9], support vector machines (SVMs) [6], and other pattern-based approaches. For example, forex charts, DL-based techniques (deep belief network (DBN) [10,11,12], gated recurrent unit (GRU) [13], recurrent neural network (RNN) [10,14], and long-short-term-memory network (LSTM) [13,15]) have been vastly used in recent years for developing predictive model considering their predictive capability. On the other hand, a deep predictive coding network (DPCN) has shown its ability in this predictive market by employing a biologically exciting network class. The DPCN mimics the brain’s ability as a predictive machine that uses prior knowledge of the world to infer hypotheses about the causes of incoming sensory information. This network infers from the typical connectivity patterns observed in the mammalian cortex, which is a layered hierarchy used to organize the experience of the world efficiently as much as possible in the form of past or historical data and is trained using local learning rules by approximating the back-propagation [16,17,18,19,20,21]. The higher DPCN brain areas (higher layers) attempt to give detailed information about the input from lower brain areas (lower layers) and then project these predictions down to lower areas or layers by eliminating the predicted sensory information from the input.
This paper proposed and developed an algorithmic trading and trend analysis model for Forex financial market prediction by employing DPCN. The function of the brain for generating and updating the mental model of the environment has motivated us to formulate a forecasting model based on time-series historical data to predict the future value with the expected precision as the brain does. Furthermore, nature-inspired meta-heuristics such as differential evolution (DE) [22,23], particle swarm optimization (PSO) [24], genetic algorithm (GA) [25,26], reptile search algorithm (RSA) [27,28,29], fair fly algorithm [30], cuckoo search [9,10,11,12], and grey wolf optimization [31,32] are now widely used by researchers to optimize the predictive ability of the models. In the proposed model, the decision variable (i.e., the combination of several filters in different layers) of feed-forward and feedback mechanism embodied in DPCN is optimized using RSA, being motivated by the hunting behavior of crocodiles proposed by Abualigah et al. [27]. The critical advantage of optimizing the DPCN with RSA is utilizing the gradient erudition problem’s capability to explore the search space and obtain the optimal solution with different initial population strategies, hybridization, and algorithm modification.
The organization of the remaining article is as follows: Section 2 discusses the literature review and Section 3 provides the details about materials and methods. Section 4 provides a detailed discussion of the Experiments and results. Finally, Section 5 concludes the paper with a brief discussion on the future scope.

2. Literature Survey

This section provides the literature survey on the Forex market prediction using ANNs and variants of ANNs and a few available trend analysis models. Das et al. [1] proposed an ELM-JAYA-based Forex market predictive model for USD/AUD, USD/GBP, and USD/INR currency pairs by augmenting the datasets with few TIs and SMs. This model, based on higher predictability compared with another model, shows a better predictive ability for the future movement of this market. The method has also been validated through various performance measures. Das et al. [2] also proposed another Forex market prediction model by utilizing one of the variants of ELM known as online sequential ELM optimization with a krill herd optimization algorithm. The key focus of this work was on the feature reduction approach of the currency pair datasets based on principal component analysis. This forecasting model used USD/INR, USD/EUR, YEN/INR, and SGD/INR, and the datasets are reframed using TIs and SMs, considering the 3, 5, 7, 12, and 15 as window sizes. A hybridized self-adaptive multi-population-based Forex market prediction model based on ELM has been proposed in [5] for USD/INR and USD/EUR currency pair datasets. This model has been framed with TIs and SMs, and prediction has been made from 1 day to 1 month.
Sarangi et al. [3] proposed an ANN-GA-based Forex trend analysis model for INR/USD currency pairs. Authors have experimented with a simple ANN and a hybrid model of ANN-GA by optimizing the weight matrix of ANN using GA, and the proposed model has been validated through RMSE. Galeshchuk [7] explored the ability of ANN for USD/EUR, JPN/USD, and USD/GBP currency pair datasets. The raw datasets are examined and optimized, and the best NN has been investigated based on forecasting ability and performance measures. The results are plotted, and this model has been compared with out-of-sample during the training process.
Ni and Yin [8] also proposed a hybrid NN Forex forecasting model based on trading indicators using various regressive NN models, such as temporal self-organizing maps and support vector regressions for GBP/USD currency pairs. However, the authors have used a few trading indicators, such as moving average convergence/divergence and relative strength index in this proposed predictive model. A case study on NN for the Forex market was conducted by Yao and Tan [33]. This model has experimented with USD/JPY, USD/D-mark, USD/GBP, USD/CHF, and USD/AUD. Furthermore, the model’s efficiency has been tested for out-of-sample data with simple TIs.
A multi-scale ensemble classification model has been proposed by Talebi et al. [34] for identifying up, down, and sideways trends in the Forex market. The authors have utilized the multi-scale feature extraction approach to train multiple classifiers for each observed trend. They have tried to identify the trends as up-trend when the foreign exchange rate increases by some amount, down-trend when the exchange rate decreases, and when fluctuations are observed in specified intervals, the market undergoes a sideways trend. Fiorucci et al. [35] proposed a trend analysis strategy based on the Reaction Trend System (RTS) to understand the sentiment of the financial market on whether to trend or not. The essential advantage of this TRS combines those two strategies to trend or not trend by automatically switching between the market movements.
A string theory and D2-branes-based trend analysis for the Forex market have been proposed by Bartoš et al. [36]. Authors have proposed to proceed from simple 1-endpoint and 2-endpoints strings to more complex objects, D2-branes. These D2-branes can smooth the movement of prices on the market and process the preserved market memory with better efficiency than in the case of the strings. Sadeghi et al. [37] presented a combined trading and trend analysis strategy based on ensemble multi-class SVM (EmcSVM) and a fuzzy NSGA-II classification model. In this strategy, first EmcSVM is used to forecast trends as up-trend, down-trend, and side-ways, and then NSGA-II is used to optimize the hypermeters of the proposed fuzzy system.

3. Materials and Methods

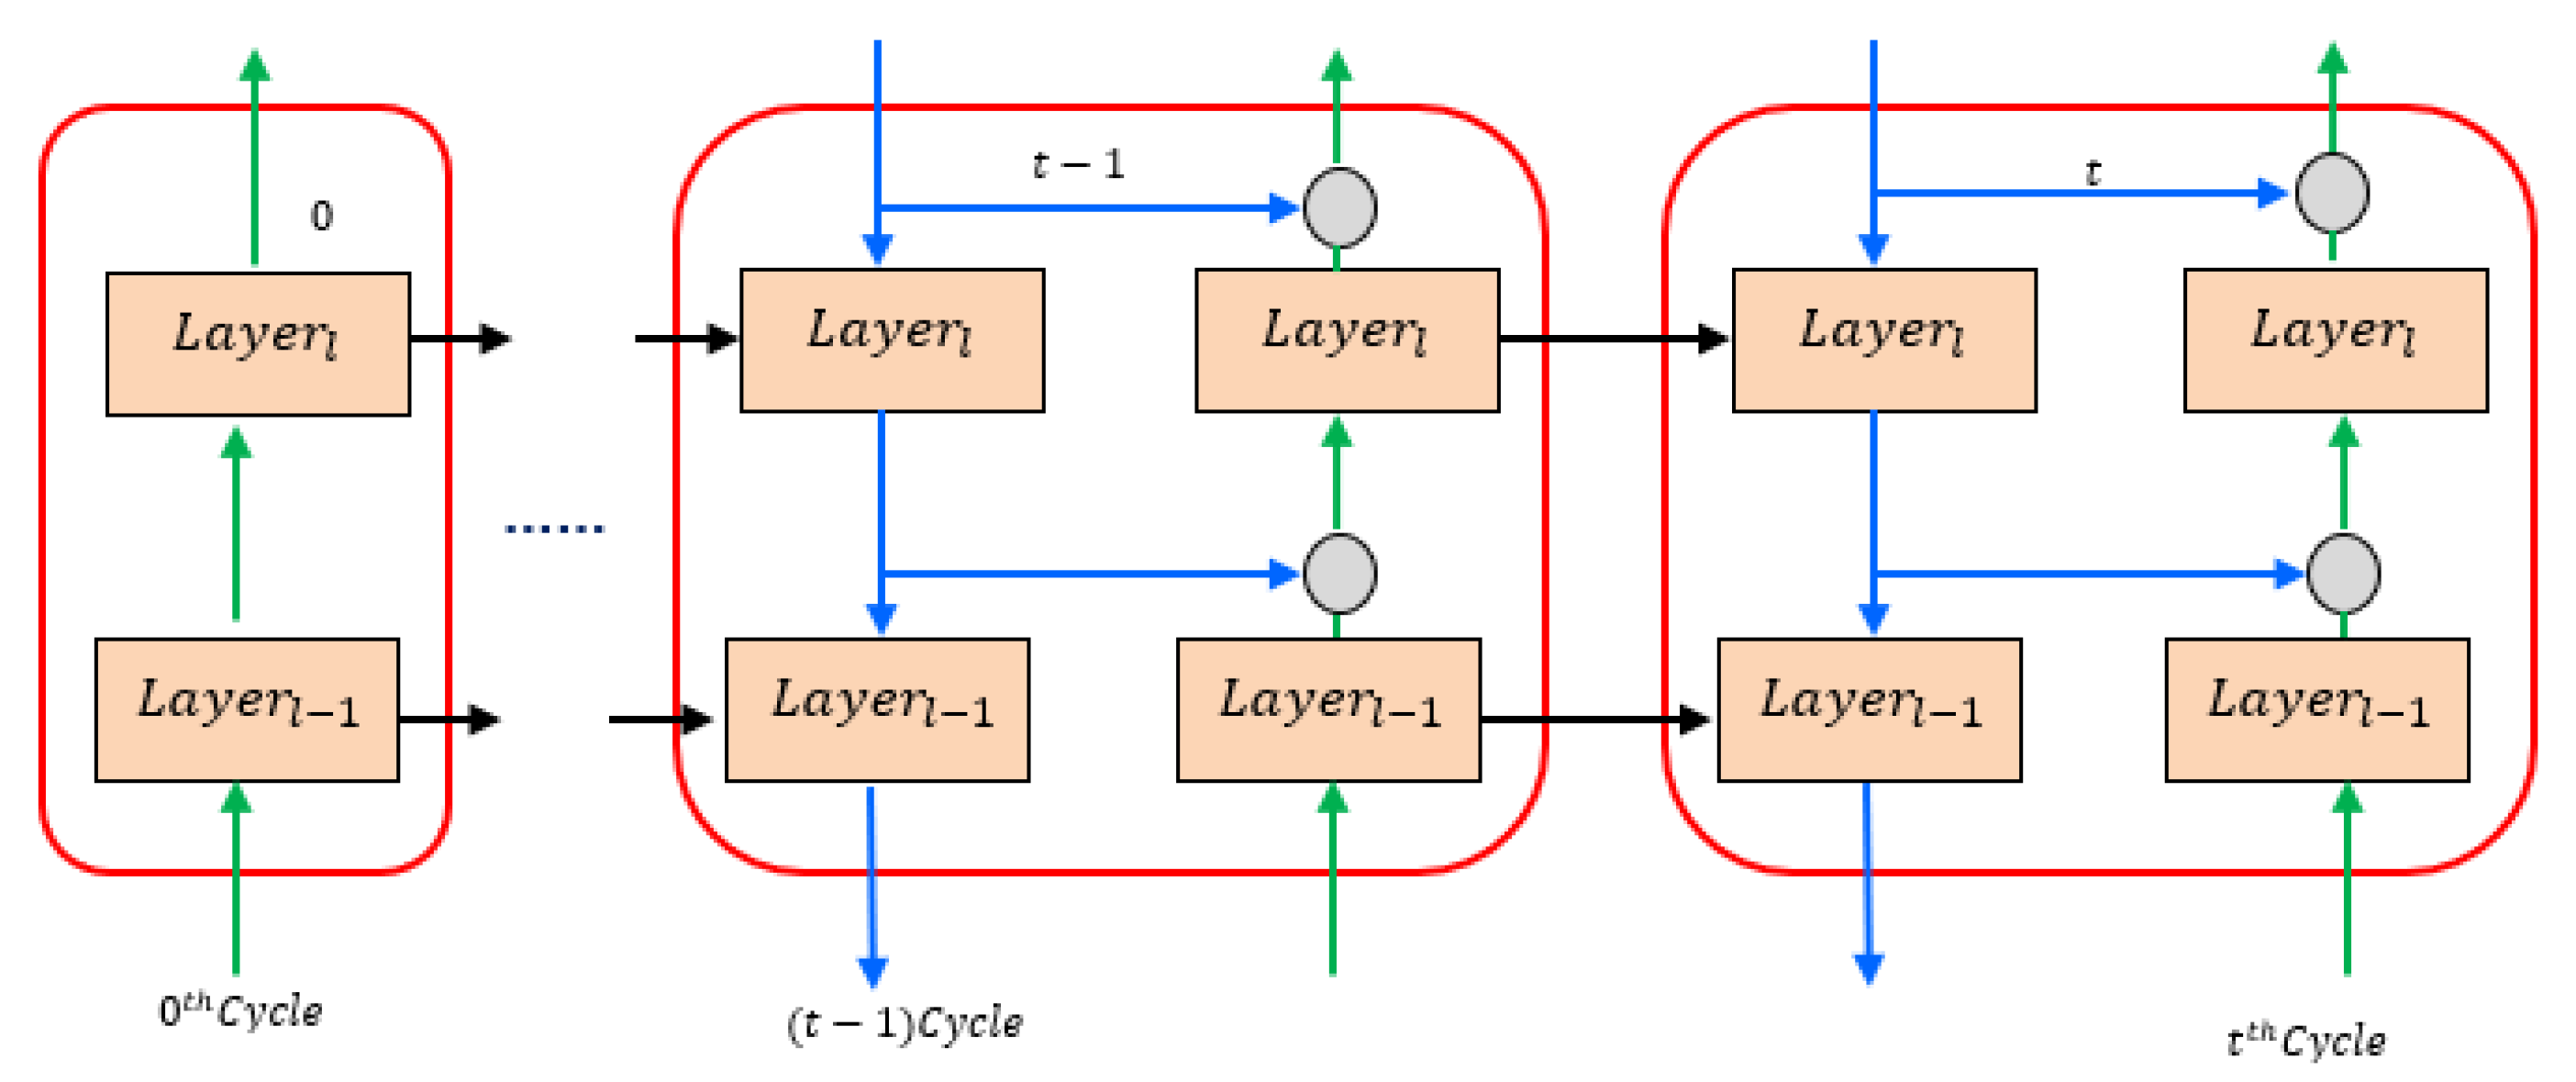
3.1. Architecture and Model Description of DPCN

This DPCN is a category of representational learning strategy of deep networks in which the key advantage is the depth of the network due to possible combinations of exponentially increasing features as more layers are added to the network [16,17,18,19,20,21]. Furthermore, empirically it has been observed that the higher abstraction in deep network representation is another advantage of using this DPCN, where the network learns to compose lower-level insights to generate higher-level representations invariant to local changes.
The DPCN (Figure 1) is modeled from the self-supervised learning mechanism of the brain and is an improved version of ANN. In DPCN, the feedback connections convey the contextual information about the higher layers down to the lower layers in the learning network hierarchy leading to the representation of inputs in a significant way. As a result, the brain or network progressively updates the representations to refine its perceptual and behavioral decisions. A DPCN model has been designed to explore this network with several convolutional layers stacked as a recurrent or predictive block, feed-forward, and feedback directions, as given in Figure 2.
The composition of the network is as follows; (a) two 3D convolution layers-32 as recurrent or predictive blocks, (b) two 3D convolution layers-64 as a feed-forward layer, and (c) two 3D convolution layers-128 as feedback layers. Previous studies have shown that the DPCN consistently outperforms the primary convolutional neural network (CNN) [10,11,12] with an improved accuracy over time given more cycles. In this work, an attempt has been made to optimize the DPCN concerning the decision variables (i.e., the combination of several filters)   n 1 , n 2 ,   and   n 3   ,   such as 32, 64, and 128, respectively, using an RSA optimizer. In DPCN [25,26,27,28,29], the higher-level layer L a y e r l ( t ) predicts the lower-level layer as P r e d i c t e d l 1 ( t ) through linear weighting L W l , l 1 mentioned in Equation (1). The prediction error P E l 1 ( t ) is the difference between P r e d i c t e d l 1 ( t ) and L a y e r l 1 ( t ) as given in Equation (2).
P r e d i c t e d l 1 ( t ) = ( L W l , l 1 ) T × L a y e r l ( t )
P E l 1 ( t ) = L a y e r l 1 ( t ) P r e d i c t e d l 1 ( t )
During the feed-forward process, the prediction error P E l 1 ( t ) at L a y e r l 1 is propagated to the upper L a y e r l to update the representations of L a y e r l ( t ) , therefore reducing the prediction errors by this updated internal representation of the network. To minimize the P E l 1 ( t ) , a sum of the squared errors normalized by the variance of the representations V R l 1 2 as given in Equation (3). The gradient of P E l 1 ( t ) with respect to L a y e r l ( t ) is given in Equation (4).
P E l 1 ( t ) = 1 V R l 1 2 P E l 1 ( t ) 2 2
P E l 1 ( t ) L a y e r l ( t ) = 2 V R l 1 2 × L W l , l 1 × P E l 1 ( t )
To minimize   P E l 1 ( t ) , the L a y e r l ( t ) is updated using gradient descent with an updating rate, such as φ l and is given in Equation (5).
L a y e r l ( t + 1 ) = L a y e r l ( t ) φ l × ( P E l 1 ( t ) L a y e r l ( t ) ) = L a y e r l ( t ) + 2 φ l V R l 1 2 × L W l , l 1 × P E l 1 ( t )
The weights of the feedback connections are transposed to those of feed forward connections by L W l , l 1 = ( L W l , l 1 ) T and the Equation (5) can be now be re-framed as given in Equation (6) as the feed forward operation, where the last term indicates the forwarding prediction error from L a y e r l 1 to L a y e r l to update the error representation with an updating rate of a l = 2 φ l V R l 1 2 .
L a y e r l ( t + 1 ) = L a y e r l ( t ) + a l × ( L W l , l 1 ) T × P E l 1 ( t )
Similarly, during the feedback stage, the top-down prediction is used to reduce the prediction error P E l 1 ( t ) by updating the representation of L a y e r l and L a y e r l ( t ) . Here, the error is also minimized by gradient descent of P E l ( t ) with respect to L a y e r l ( t ) in Equation (7) and this L a y e r l ( t ) is updated with an updating rate l as given in Equation (8). Let, b l = 2 l V R l 2 and can be re-written as given in Equation (9).
P E l ( t ) L a y e r l ( t ) = 2 V R l 2 × ( L a y e r l ( t ) P r e d i c t e d l ( t ) )
L a y e r l ( t + 1 ) = L a y e r l ( t ) l ( P E l ( t ) L a y e r l ( t ) ) = ( 1 2 l V R l 2 ) × L a y e r l ( t ) + 2 l V R l 2 × P r e d i c t e d l ( t )
L a y e r l ( t + 1 ) = ( 1 b l ) × L a y e r l ( t ) + b l × P r e d i c t e d l ( t )

3.2. RSA Optimization Strategy

The RSA is one of the advanced nature-inspired meta-heuristic optimization algorithms proposed by Abualigah et al. [27] in 2022. Authors have tried to simulate and mathematically model the encircling and hunting behavior of the crocodiles to obtain a population-based and gradient-free approach to address complicated optimization problems addressing a few constraints. The RSA has been presented to have two phases of operations: exploration or global search and exploitation or local search inspired by the crocodiles’ encircling, hunting, and social behavior. Keeping and maintaining the active cooperation between the cohesive groups of crocodiles by simulating their behavior is one of the leading advantages of using this algorithm to maximize its robustness. The core behaviors of crocodiles, such as night hunting, hunting, diet, mobility/locomotion, processing appreciation or mental power, trapping and hunting, intelligent teamwork, or alliance of crocodiles during the hunting process, are simulated in [27,28,29]. It has been studied that crocodiles are one of the most intelligent hunters. Their behaviors can be mathematically modeled to solve the optimization problems to obtain the best solution, which is the main inspiration behind this RSA optimizer. This RSA undergoes three significant phases of processing, such as:
1.
Initialization Phase: In this phase, the process starts with a set of candidate solutions ( S ) generated stochastically to obtain the nearly optimum best solution at each iteration and is represented in Equation (10).
S = [ s 1 , 1 s 1 , j           s 2 , 1 s 2 , j s C S 1 , 1 s C S , 1 s i , j s C S 1 , j s C S , j s 1 , d 1 s 1 , d s 2 , d s C S , d 1 s C S 1 , d s C S , d ]
where, S is a randomly generated set of candidate solutions, C S is the candidate solutions, d is dimension size of the given problem, s i , j   represents the j t h position of the i t h solution and can be computed using Equation (11), where r a n d   is a random value and B o u n d U p p e r , B o u n d L o w e r represents the lower and upper bound of the given problem.
s i , j = r a n d × ( B o u n d U p p e r B o u n d L o w e r ) + B o u n d L o w e r
2.
Encircling Phase: This phase deals with the exploratory behavior or encircling of RSA with two movements of crocodiles, such as high walking and belly walking, which do not allow them to approach the target prey, and the exploration search discovers a wide search area due to this movement behavior of the crocodiles. This exploration through high and belly walking is only used to support other phases of operation, such as hunting or exploration. The RSA makes a change between exploration and exploitation in search phases based on various behaviors in four conditions by dividing the number of iterations into four parts. The objective of exploration or encircling is to obtain a better solution based on the movement, and searching is done on two conditions such as (i) t T   4 for high walking and (ii) t 2 T   4 and t > T   4 for belly walking. The position updating is done using Equation (12) during the exploration phase.
s ( i , j ) ( C I + 1 ) = { B e s t j ( C I ) × H B ( i , j ) ( C I ) × δ R F ( i , j ) ( C I ) × r a n d ,                                           t T   4 B e s t j ( C I ) × s ( r 2 , j ) × E S ( C I ) × r a n d ,                                                   t 2 T   4   a n d   t > T / 4
where, B e s t j ( C I ) is j t h position of the best obtained solution so far, rand is a random number between 0 and 1, C I is the current iteration number, maximum number of iterations is T , H B ( i , j ) represents the hunting operation of the j t h position in the i t h solution and is computed using Equation (13). The sensitive parameter δ is used to control the exploration accuracy (high walking) for encircling phase over the course of iterations, which is fixed equal to 0.1, the R F is a reduced function used to reduce the search space and is calculated using Equation (14), r 2 is the random number between [1 and CS] and the random position of the i t h solution is denoted as s ( r , j ) . The evolutionary sense E S ( C I ) is a probability ratio considering values between [2 and −2] throughout the number of iterations and can be calculated using Equation (15).
H B i , j = B e s t j ( C I ) × P D ( i , j )
R F ( i , j ) = B e s t j ( C I ) × s ( r 2 , j ) B e s t j ( C I ) +
E S ( C I ) = 2 × r 3 × ( 1 1 T )
where,   is a small value, r 2 is a random number between [1 to CS], 2 is a correlation value which gives a value between [2 and 0], r 3 is another random number between [−1 to 1]. The percentage difference between j t h position of the best solution and j t h position of the current solution is represented as P D ( i , j ) and is calculated using Equation (16).
P D ( i j ) = γ + s ( i , j ) A v e r a g e P o s i t i o n ( s i ) B e s t j ( C I ) × ( B o u n d U p p e r   ( j ) B o u n d L o w e r ( j ) ) +
A v e r a g e P o s i t i o n ( s i ) = 1 d j = 1 d s ( i , j )
where, A v e r a g e P o s i t i o n ( s i ) denotes the average position of i t h solution calculated using Equation (17), B o u n d U p p e r   ( j ) B o u n d L o w e r ( j ) are the upper and lower bounds of j t h position, γ controls the exploration accuracy i.e., difference between the candidate solutions for hunting co-operation and is fixed to 0.1.
3.
Hunting Phase: This phase simulates crocodiles’ hunting strategy, such as coordination and cooperation, which allows them to target the prey quickly. These two phases obtain the near-optimal solution after several actions and establish the communication between them, and the RSA exploits those two main strategies based on Equation (18). The searching is based on hunting coordination conditioned on   t 3   T 4   a n d   t > 2 T 4 , otherwise the hunting coordination is done when   t T   a n d   t > 3 T 4 .
s ( i , j ) ( C I + 1 ) = { B e s t j ( C I ) × P D ( i , j ) ( C I ) × r a n d ,         t 3   T 4   a n d   t > 2 T 4 B e s t j ( C I ) H B ( i , j ) ( C I ) × R F ( i , j ) ( C I ) × r a n d ,       t T   a n d   t > 3 T 4
where, B e s t j ( C I ) is j t h position of the best obtained solution so far, R F ( i , j ) ,   P D ( i , j )   a n d   R F ( i , j ) are computed using Equation (13), Equation (16), and Equation (14), respectively, and is a very small value. The sensitive parameters β and α are chosen carefully to produce a stochastic value at each iteration and it handles the exploration for all the iterations and is advantageous to overcome the local optima, particularly in last iteration. The computational complexity of RSA algorithm can be given as   O ( R S A ) = O ( C S × ( T × D + 1 ) , where T , C S , and D represent the number of iterations, number of solutions, and solution size, respectively.

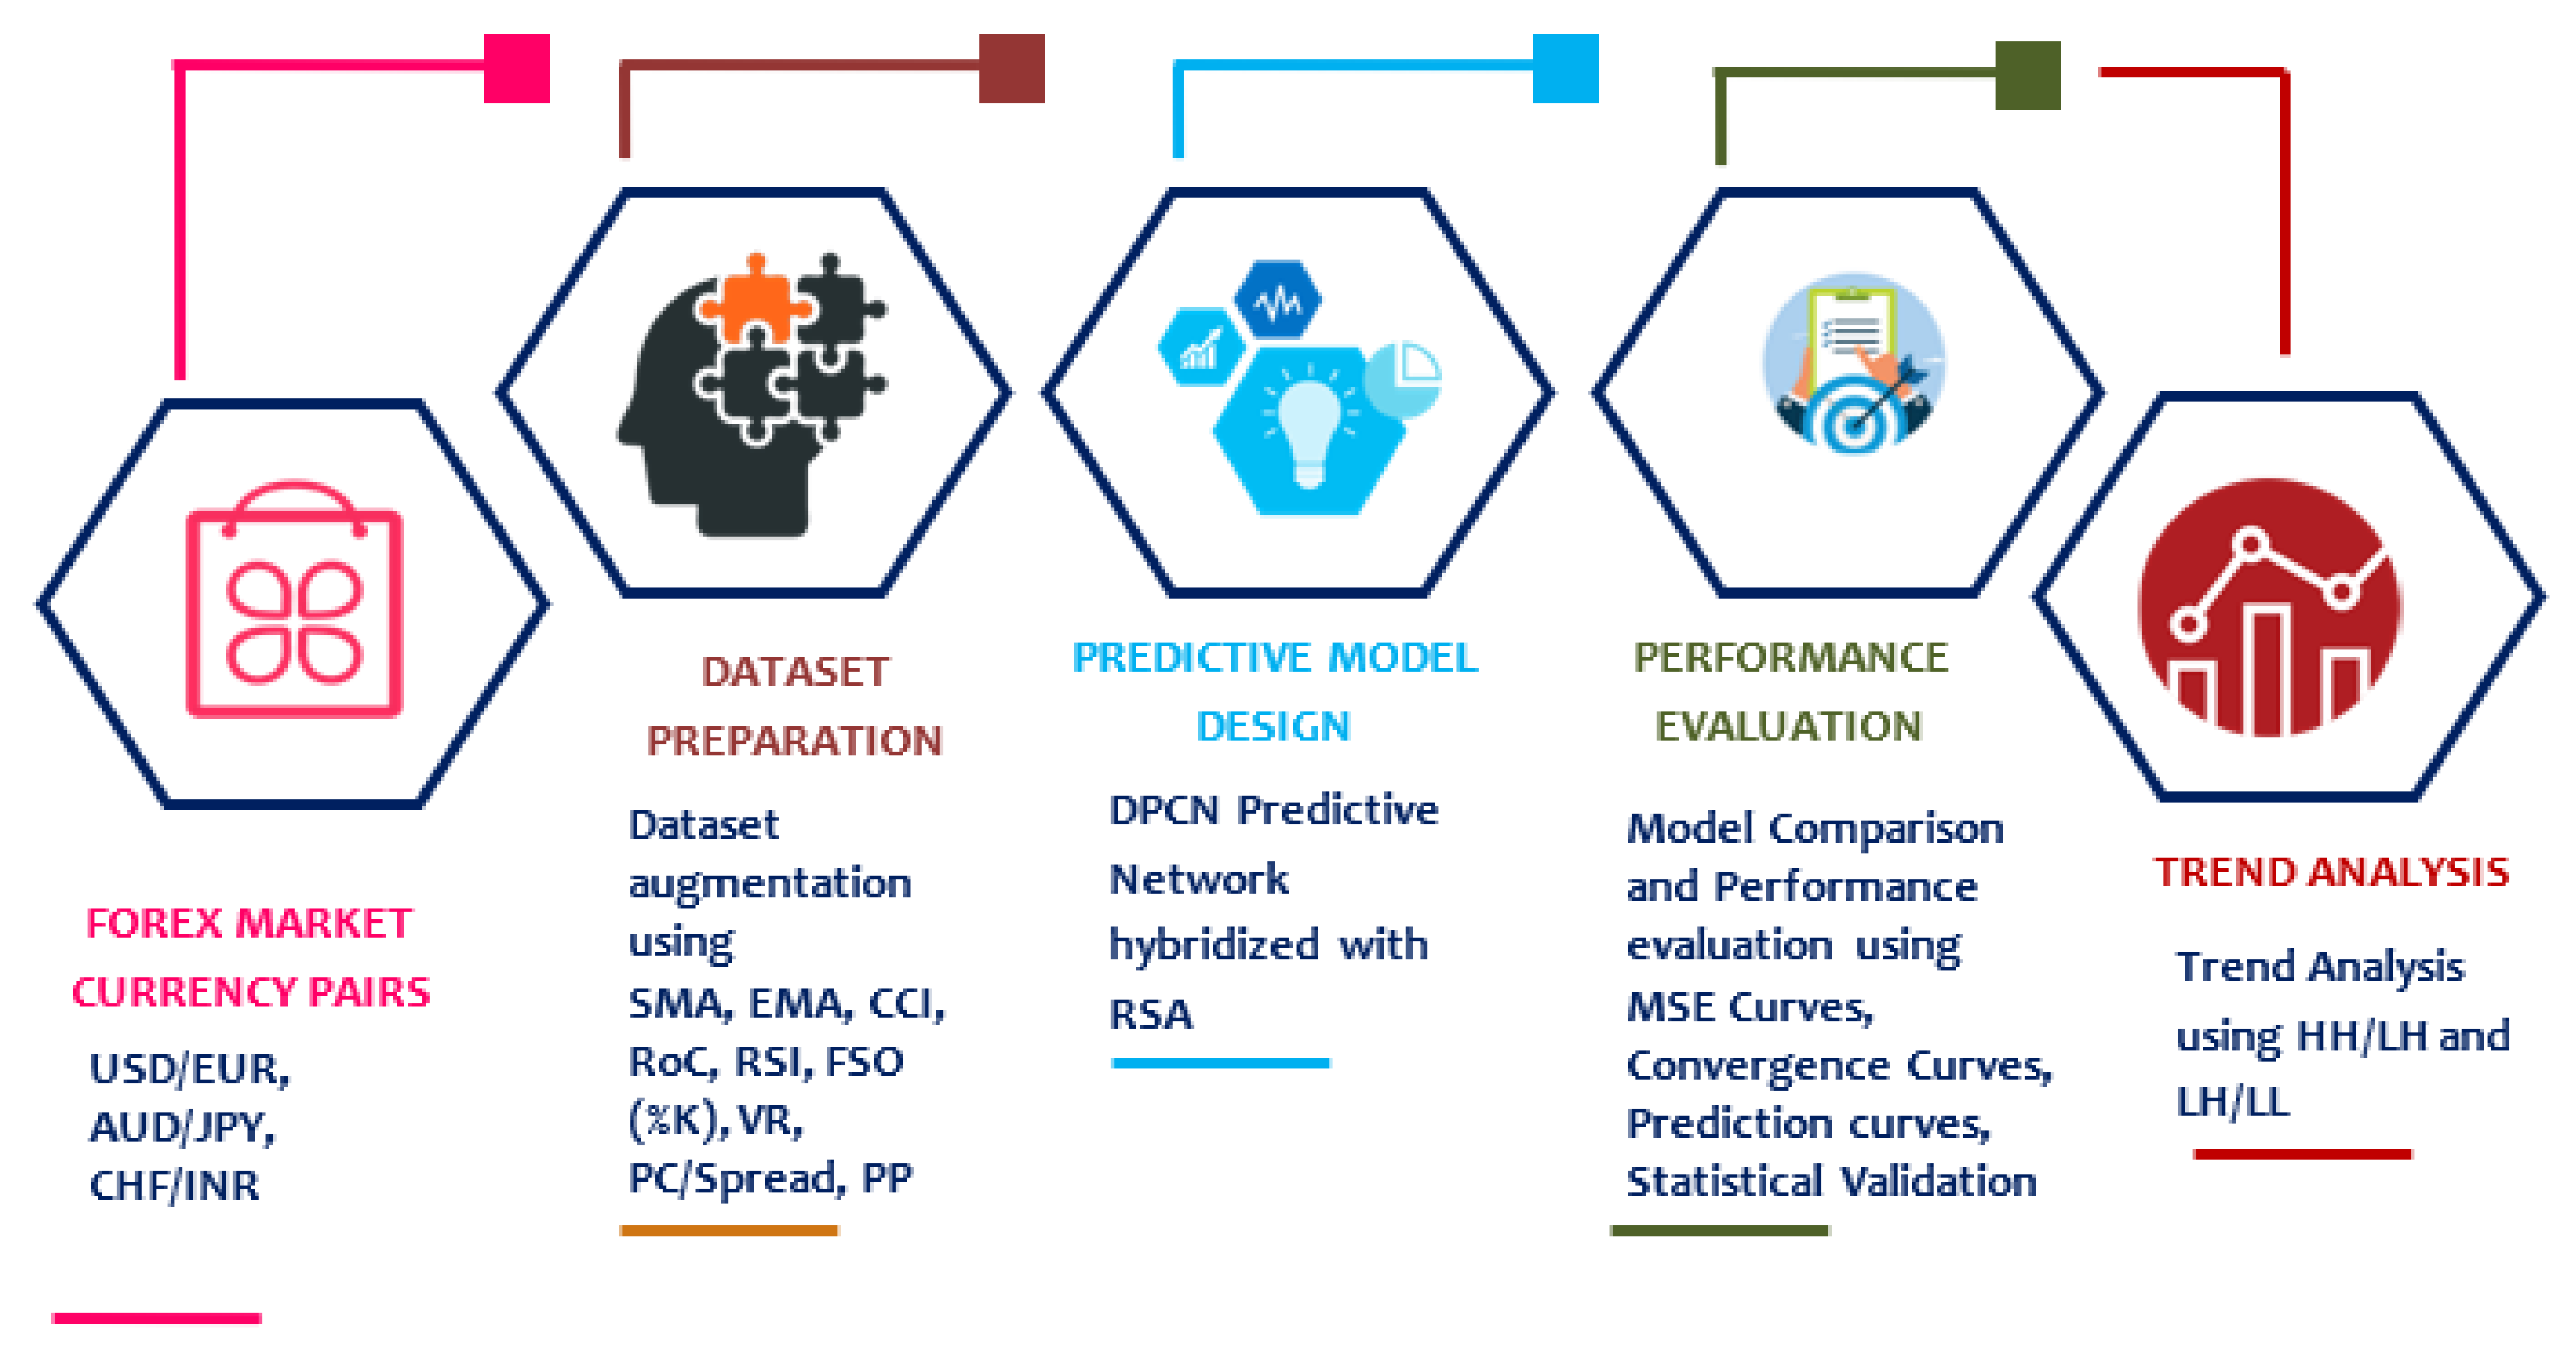
3.3. Dataset Preparation and Augmentation

The detailed description of Forex datasets [38] from US dollar (USD), European currency (EUR), Australian dollar (AUD), Japanese Yen (JPY), Swiss Franc (CHF), and Rupees of Indian currencies are considered for analysis are detailed in Table 1. Originally the datasets had four features, open price, high price, low price and close price; coined as OAs are augmented by computing the new features based on a few TIs and SMs, such as simple moving average (SMA), exponential moving average (EMA), commodity channel index (CCI), rate of change (RoC), relative strength index (RSI), fast stochastic oscillator FSO (%K), volatility ratio (VR), price comparison (PC/Spread), and pivot points (PP) [4,5,6,8,39,40] and those augmented [41] currency pair datasets are coined as AAs.

3.4. Parameters Used

This proposed approach keeps all the standard parameters constant for all experimental findings. The parameters and the associated values of respective predictive networks and optimization strategies are discussed in Table 2.

3.5. Model Description and Proposed RSA-DPCN Algorithm

The basic layout of this research work is depicted in Figure 3, which contains five stages of experimentation. First, the currency pairs USD/EUR, AUD/JPY and CHF/INR are collected from 1 January 2015 to 1 January 2021 for five years and then, the attributes of collected datasets are augmented using various TIs and SMs (as discussed in Section 3.3).
In the third phase of experimentation, the DPCN was experimented with to predict the future price of the currency pairs for short-term time frames, such as 3 days, 7 days, and 15 days ahead. In the fourth operation phase, the proposed RSA-DPCN forecasting model has been compared with ELM and FLANN by optimizing the network architecture with GA, PSO and DE, and RSA optimizers. Finally, the performance of the predictive models is measured based on mean square error (MSE) and the convergence curves, predictive curves for both OAs and AAs for all short-term predictive days for all the three currency pair datasets, and statistical validation and execution time is also recorded. In addition to this forecasting of closing price, the trend analysis is performed based on Higher Highs Higher Lows (HHs/HLs) and Lower Highs and Lower Lows (LHs/LLs) tool [42,43]. In the proposed algorithm of RSA-DPCN, the DPCN has utilized both feed forward and feedback connections for updating the predictive errors as decision variables, using the Conv2D [41] with kernel size 3. Additionally, up-sampling with PyTorch has been explored, considering various scaling factors for forecasting the closing price for both OAs and AAs currency pair datasets.
The stepwise representation of the proposed algorithm is discussed below in Algorithm 1.
Algorithm 1: RSA-DPCN forecasting model
Initialize the sensitive parameters γ , δ  
[Controls the exploration accuracy for hunting cooperation and high walking for encircling phases over the course of iterations respectively and both are set to 0.1]

Initialize decision variables
      Feed forward kernel size;
      Feedback kernel size;
      Up-sample scale factor;
While:   Meet termination condition
      Calculate MSE from DPCN model;
      Find minimum MSE
      for i = 1 : C S   ( A l l   P o p u l a t i o n ) [Number of candidate solutions]
           Update H B ,   R F ,   P D ;    [Hunting operator, Reduce function used to reduce the search space and Percentage Difference between the best obtained solution and current solution respectively]
      if ( t T 4 ) then
         High Walking;
      else if ( t 2   T 4   a n d   t > T 4 )
         Belly Walking;
      else if ( t 3   T 4   a n d   t > 2 T 4 )
         Hunting Co-ordination;
      else
         Hunting Co-operation;
      end if
      end for
end while

4. Experiments and Results

This section discusses the proposed two-stage trading and trending currency market forecasting methods. The first stage of experimentation discusses the Forex trading model based on DPCN optimized with RSA and the second part discusses the trend analysis based on the forecasting values obtained for this short-term predictive model based on HHs/HLs, known as up-trends and LHs/LLs known as down-trends. This proposed trend analysis model has been compared with the trends observed based on both HHs/HLs and LHs/LLs from the currency pair datasets based on AAs.

4.1. Phase #1: RSA-DPCN for FOREX Short-Term Trading

The MSE has been computed by considering errors and is being squared to remove the negative signs for the RSA-DPCN, RSA-FLANN, and RSA-ELM for both categories of currency pair datasets and convergence curves are plotted. Figure 4 illustrates the convergence curves for three currency pair datasets three days ahead of prediction, and from this figure, it can be seen that both RSA-DPCN for OAs and AAs are converging faster than the rest of the other models such as RSA-ELM and RSA-FLANN. Figure 4a illustrates that the RSA-DPCN converges approximately at the 42nd and 43rd iterations for AAs and OAs, respectively, for the USD/EUR currency pair. Similarly, for the AUD/JPY currency pair datasets, the RSA-DPCN is converging at 39th and 45th iterations for AAs and OAs in Figure 4b respectively. The currency pairs CHF/INR is converging at 45th iterations for both AAs and OAs as shown in Figure 4c. From this, it is evident that for three days ahead of prediction, for all the currency datasets, datasets with AAs are outperforming considering other forecasting models with respect to observed MSE.
The convergence curves for seven days ahead of prediction for RSA-DPCN, RSA-FLANN, and RSA-ELM are depicted in Figure 5. From those graphs, it can be seen that the RSA-DPCN for USD/EUR is converging around 43rd and 42nd iterations AAs and OAs, respectively, and are depicted in Figure 5a. From Figure 5b, it can be seen that, for AUD/JPY, the proposed model is converging at 42nd and 41st iterations respectively. Similarly, from Figure 5c, it is seen that, for CHF/INR, both AAs and OAs are converging around 42nd iterations respectively. From this, it is evident that the RSA-DPCN over RSA-FLANN and RSA-ELM are performing very well for augmented datasets.
Figure 6 depicts the convergence rate of the RSA-DPCN, RSA-FLANN, and RSA-ELM for 15 days ahead of prediction, and from this figure, it can be seen that, for all the four currency pair datasets, the RSA-DPCN is performing in the same way for both AAs and OAs. For USD/EUR, from Figure 6a, it can be seen that the network is converging around the 42nd and 41st iterations for AAs and OAs, respectively, for AUD/JPY and CHF/INR at the 42nd iterations for both AAs and OAs, as shown in Figure 6b and Figure 6c, respectively. From the above three figures, Figure 4, Figure 5 and Figure 6, it is evident that the proposed RSA-DPCN is performing very well concerning error convergence for all four augmented currency pair datasets for all four short-term predictive days.
A state forward comparison has been made based on MSE with the optimized DPCN network, such as GA-DPCN, PSO-DPCN, DE-DPCN, and RSA-DPCN, with AAs of three currency pairs for all three predictive days to observe the performance of the RSA-DPCN with other optimized DPCN networks for forecasting of the closing price which is shown in Figure 7. It can be seen that the proposed RSA-DPCN is converging around 41st iterations for 3 days and 15 days and 39th iterations for 7 days of prediction time frame for USD/EUR currency pair as shown in Figure 7a. Is can be seen that the RSA-DPCN is converging around 42nd–43rd iterations for both 3 days and 15 days ahead of prediction and for both AUD/JPY and CHF/INR currency pair which is observed from Figure 7b,c and it differs for 7 days of prediction with 42nd and 36th iterations for both the currency pairs for augmented datasets; and next to RSA-DPCN, it can be observed that DE-DPCN is showing better result for all four currency pair datasets for almost all the three predictive days for all currency pairs considered here but only GA-DPCN is coming next to RSA-DPCN for USD/EUR currency pair for 7 days ahead of prediction.
The forecasting ability of the proposed model based on actual data and datasets with two other forms, such as AAs and OAs, plotted to have a better insight into the predictive performance of all four-currency pair datasets and are depicted for 3 days, 7 days, and 15 days ahead of predictions in Figure 8a, Figure 8b, and Figure 8c, respectively.

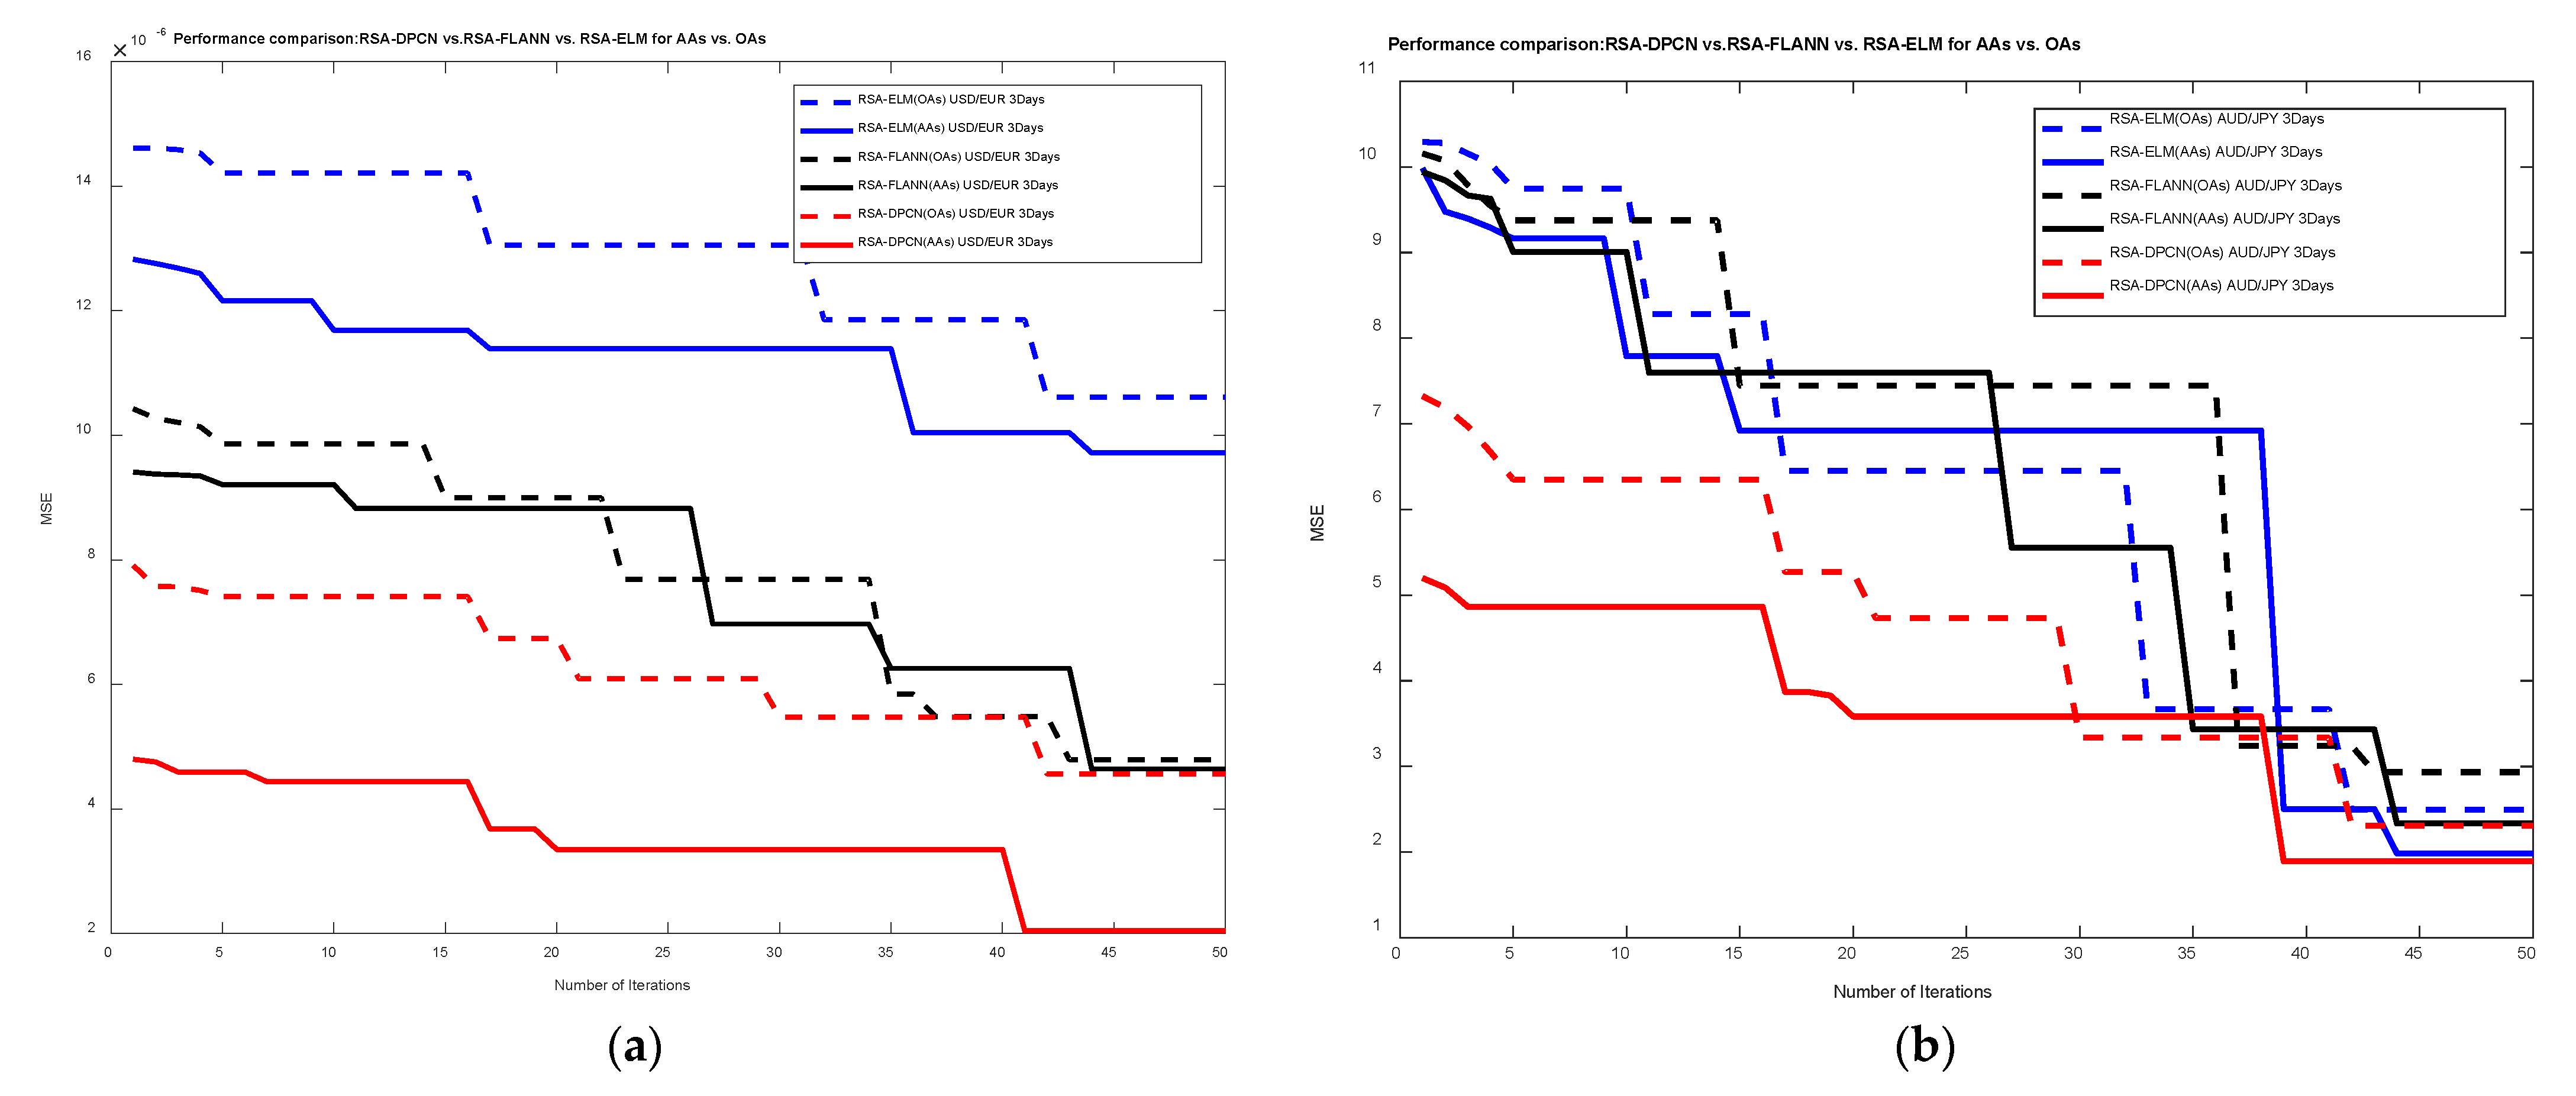
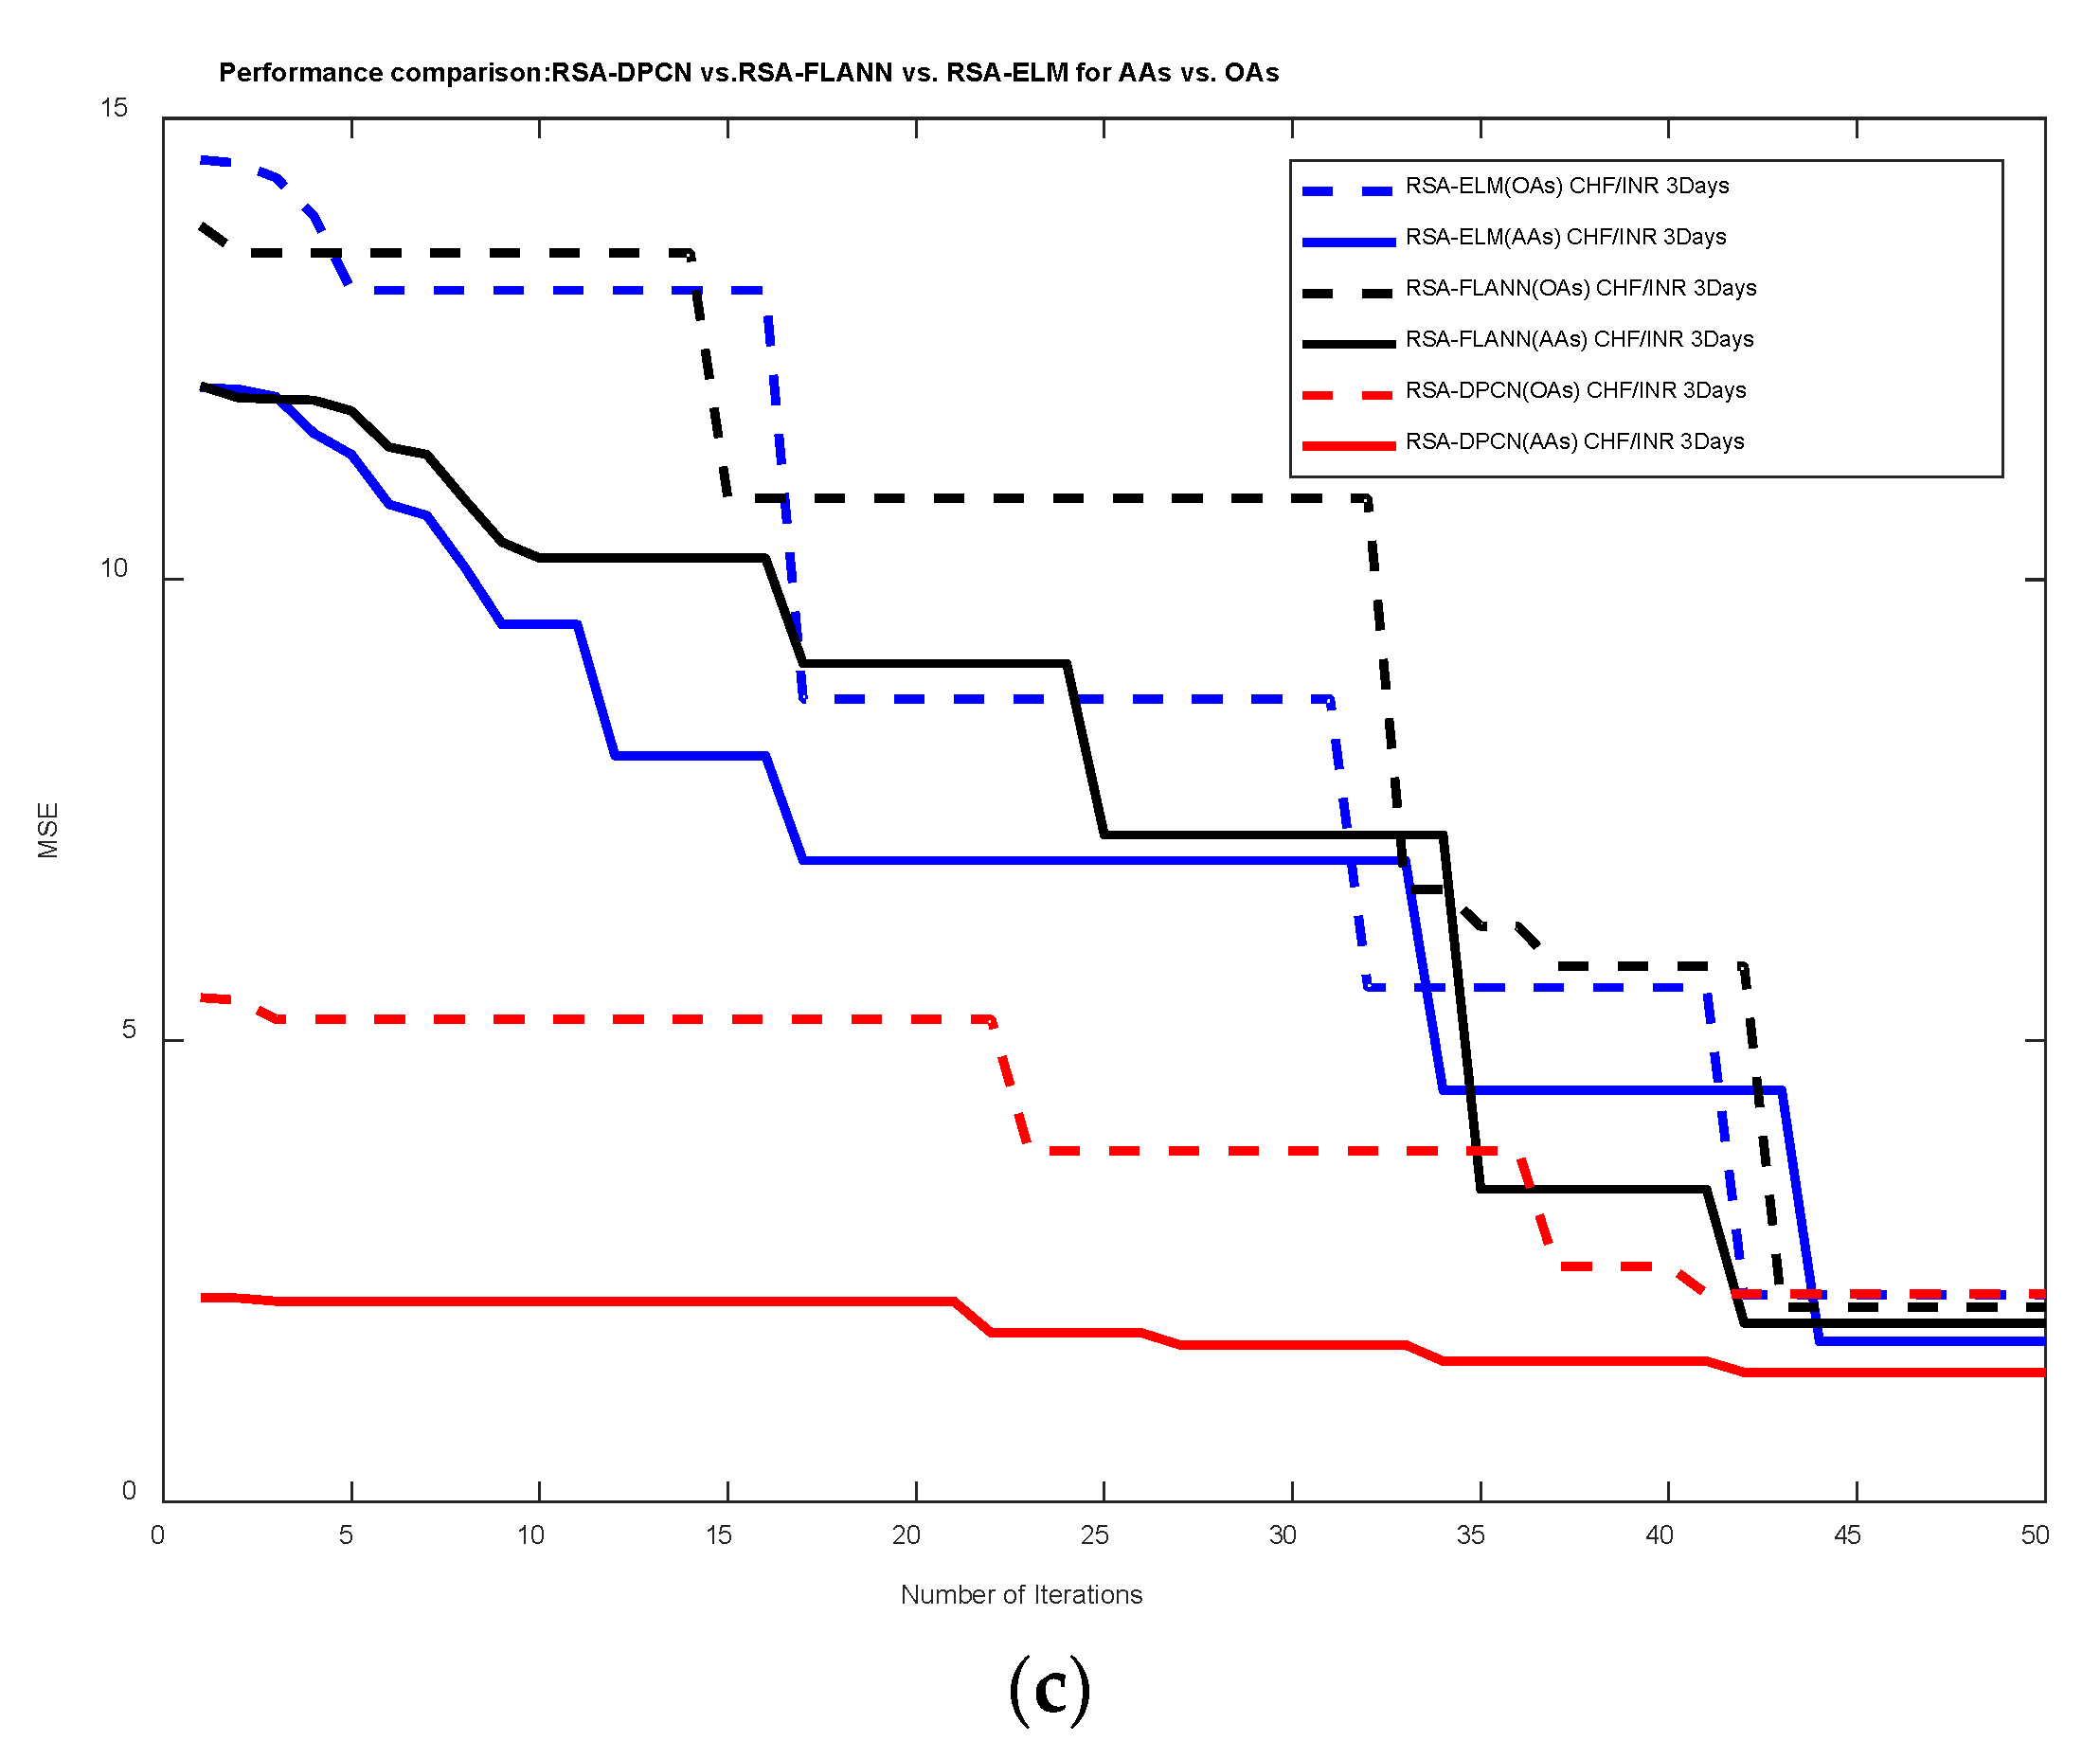
4.2. Performance Comparison and Validation of RSA-DPCN Forex Trading Model

The MSE is not sufficient in ML theory to validate the accuracy of the model because it is prone to outliers as it uses the concept of using the mean in computing the error value. Therefore, here, we tried to obtain the performance of the proposed RSA-DPCN with the GA-DPCN, PSO-DPCN, and DE-DPCN based on convergence curves, root mean square error (RMSE), mean absolute percentage error (MAPE), mean absolute error (MAE), mean absolute relative error (MARE), R-Squared (R2), Theils’U [44], etc. The RMSE is used to evaluate the quality of predictions made, and the lower RMSE value shows the better-fitted model, the MAPE is used to forecast the error, and it is good if there are no zeros in the data and the percentage errors are summed up to compute the value of MAPE, generally, MAPE < 10% and MAPE < 20% are considered excellent and good, respectively. MAE measures the accuracy of the continuous variables and gives the magnitude of the errors without considering the directions. It has been seen that MAE is less biased towards higher values, whereas MSE is more biased towards higher values, but RMSE is much better for observing the predictor’s performance. Similarly, the MARE is used to measure the average magnitude of the errors in a set of predicted values and is sensitive to extreme values such as outliers or zeros and the R2 is the fraction of variance of the actual value of the response variable. The higher the R2 value, the better the model fits our data; a value higher than 0.9 is generally considered to be good. Theil’sU compares the predicted output with forecasting output with minimal historical data and, generally, this measure squares the deviations to give more weight to significant errors and, in turn, helps eliminate those significant errors. In this phase of experimentation, it can be seen that the proposed RSA-DPCN is showing its better performance over all the measures used and explained above for all three currency pairs for short-term forecasting of the Forex market given in Table 3, Table 4 and Table 5 for 3 days, 7 days and 15 days of predictive time-frames, respectively.
In order to test the statistical significance of the proposed RSA-DPCN Forex forecasting model, the two-sample Kolmogorov–Smirnov test (K–S test) [45] based on RSA-DPCN with other three predictive models have been performed to observe the performance of the proposed RSA-DPCN over three compared predictive network used for experimentation in this work. The p and h values are obtained and recorded for three short-term predictive days for all three currency pair datasets. The p values in a predictive model present the coefficient estimate of a variable to assess the predictive ability of a forecasting model. The lower the p value, the greater the significance of the observed difference, and a p value < 0.05 or lower than this and h value of 0 is considered to be statistically significant and indicates that it is not possible to prove that the outputs of two compared models are statistically different from each other. Therefore, from Table 6, it can be stated that, in most of the cases, the K–S test presents adequate evidence of the forecasting ability of the proposed RSA-DPCN model compared to GA-DPCN, PSO-DPCN, and DE-DPCN models.
Additionally, the execution time (in seconds) of the proposed RSA-DPCN concerning other compared forecasting models has been recorded for all four currency pair datasets for all three short-term predictive days and is shown in Table 7.

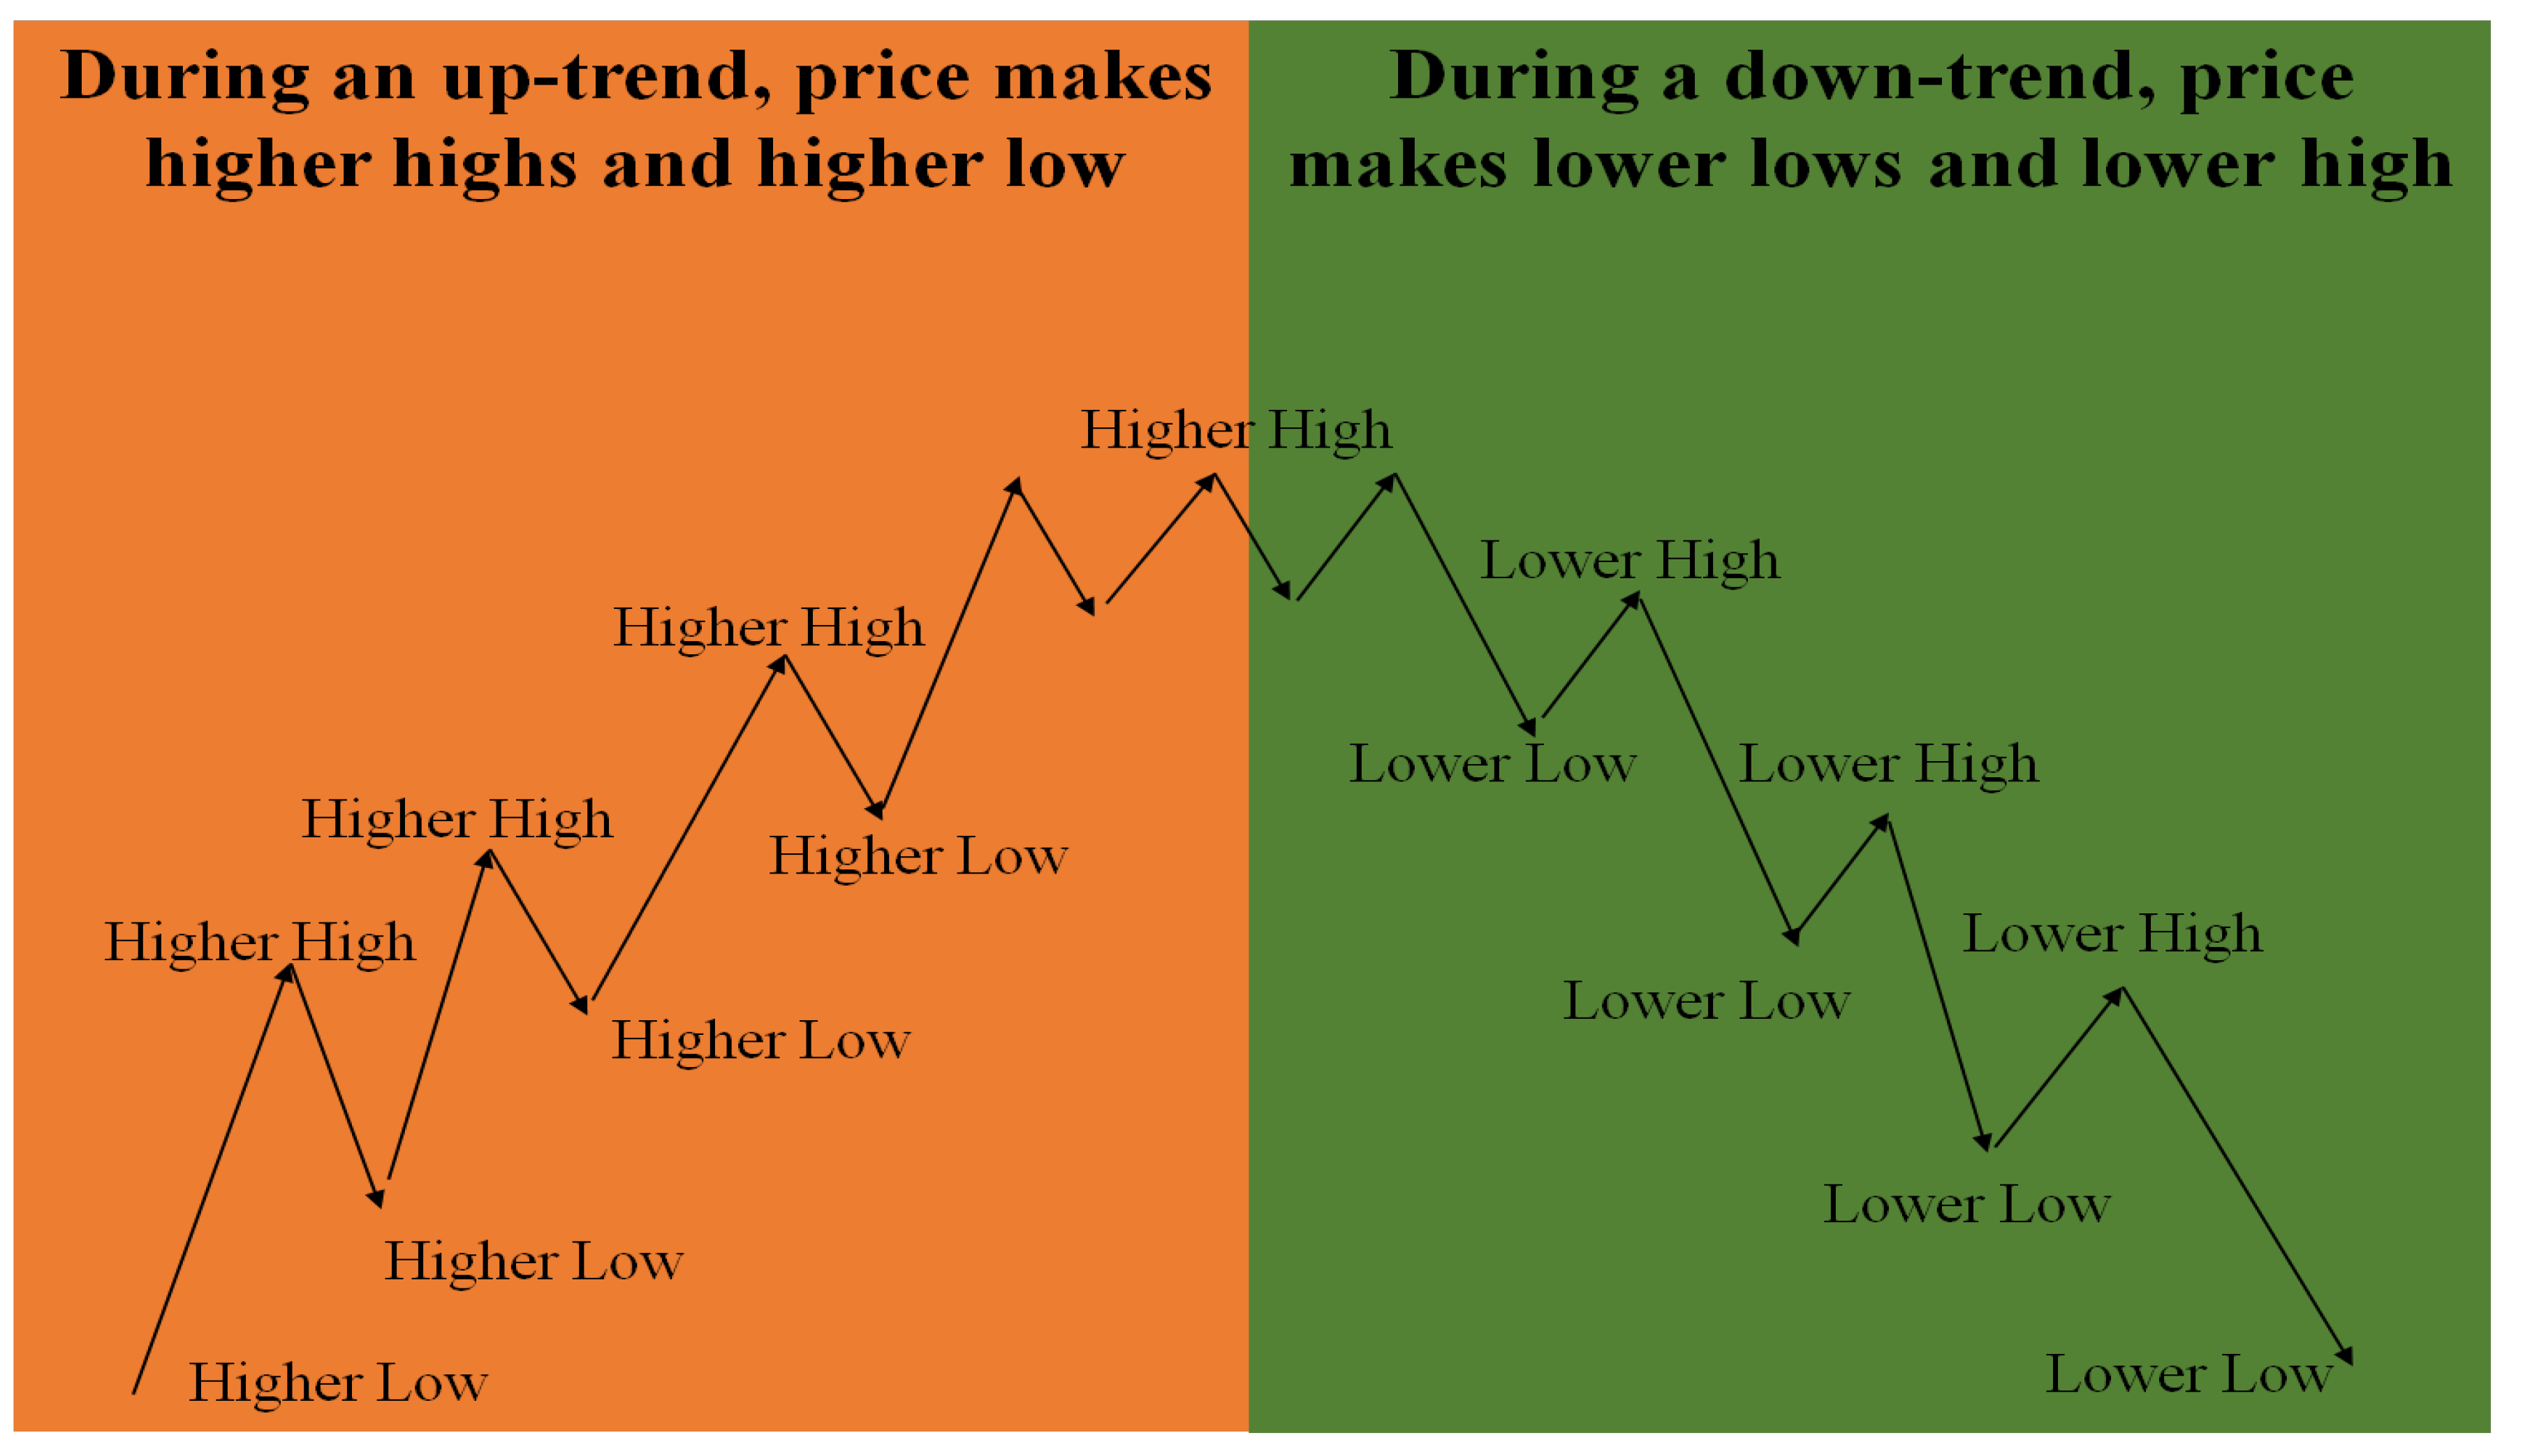
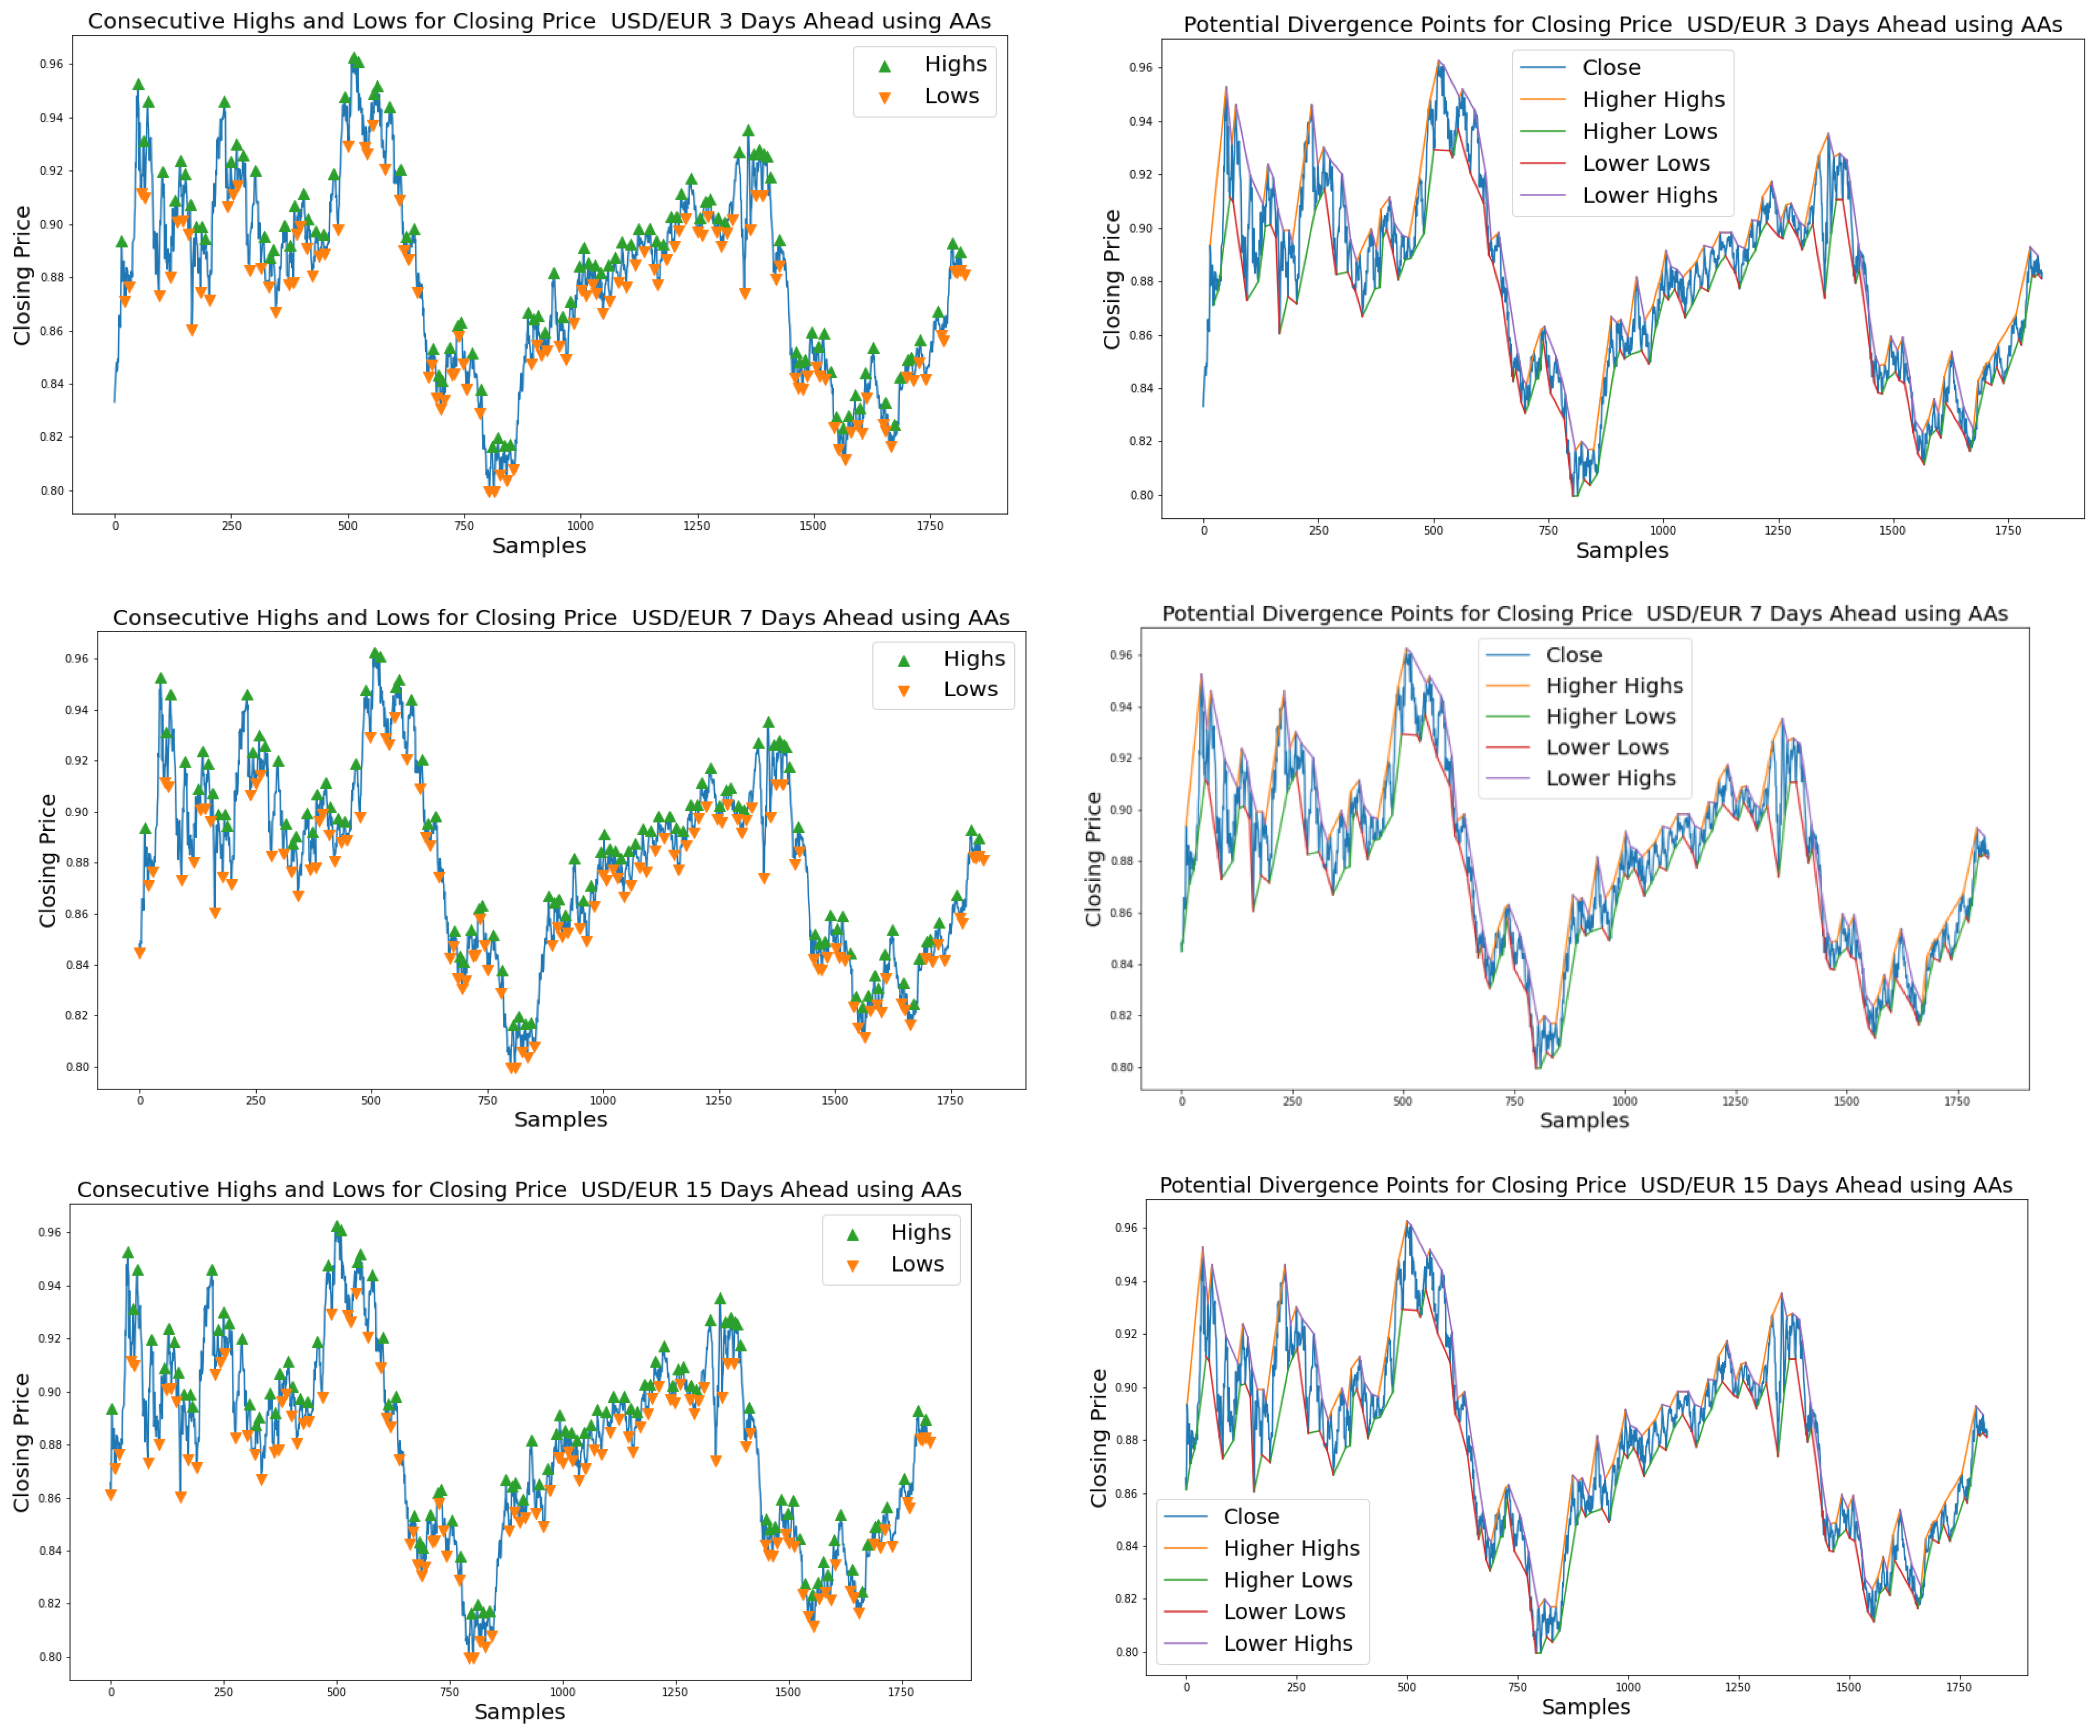
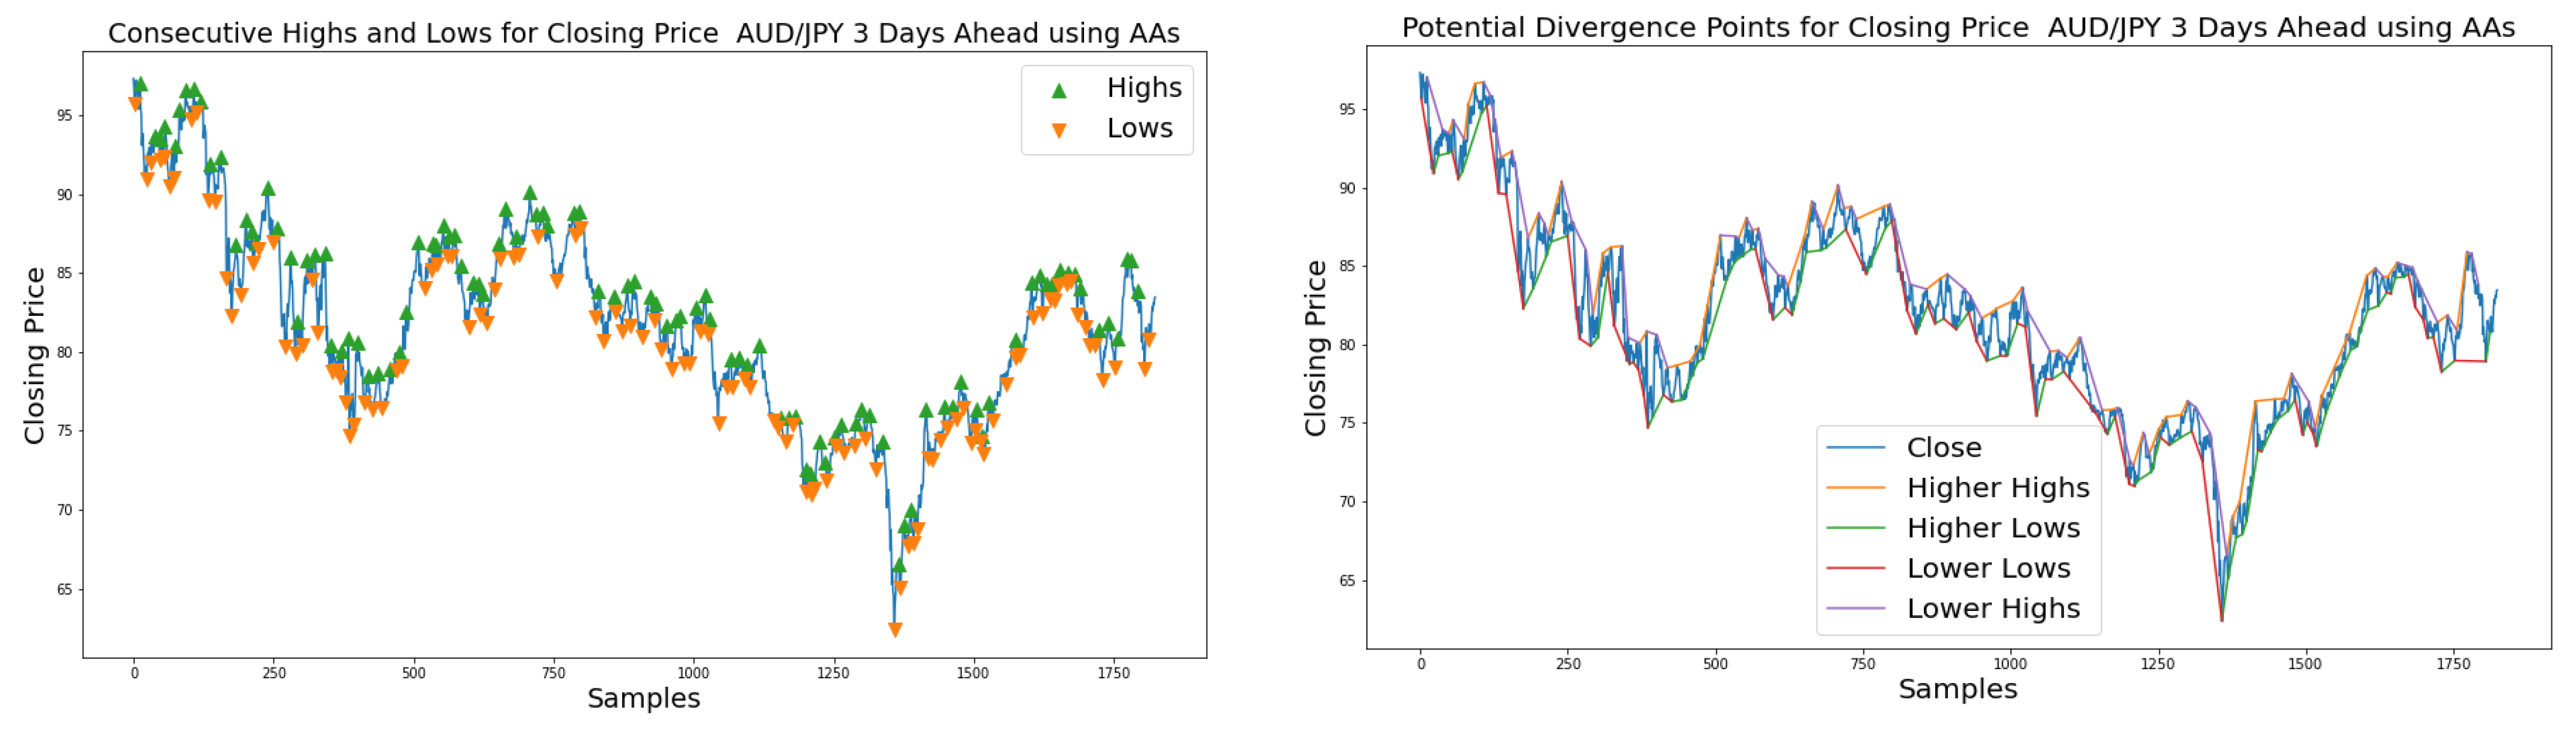
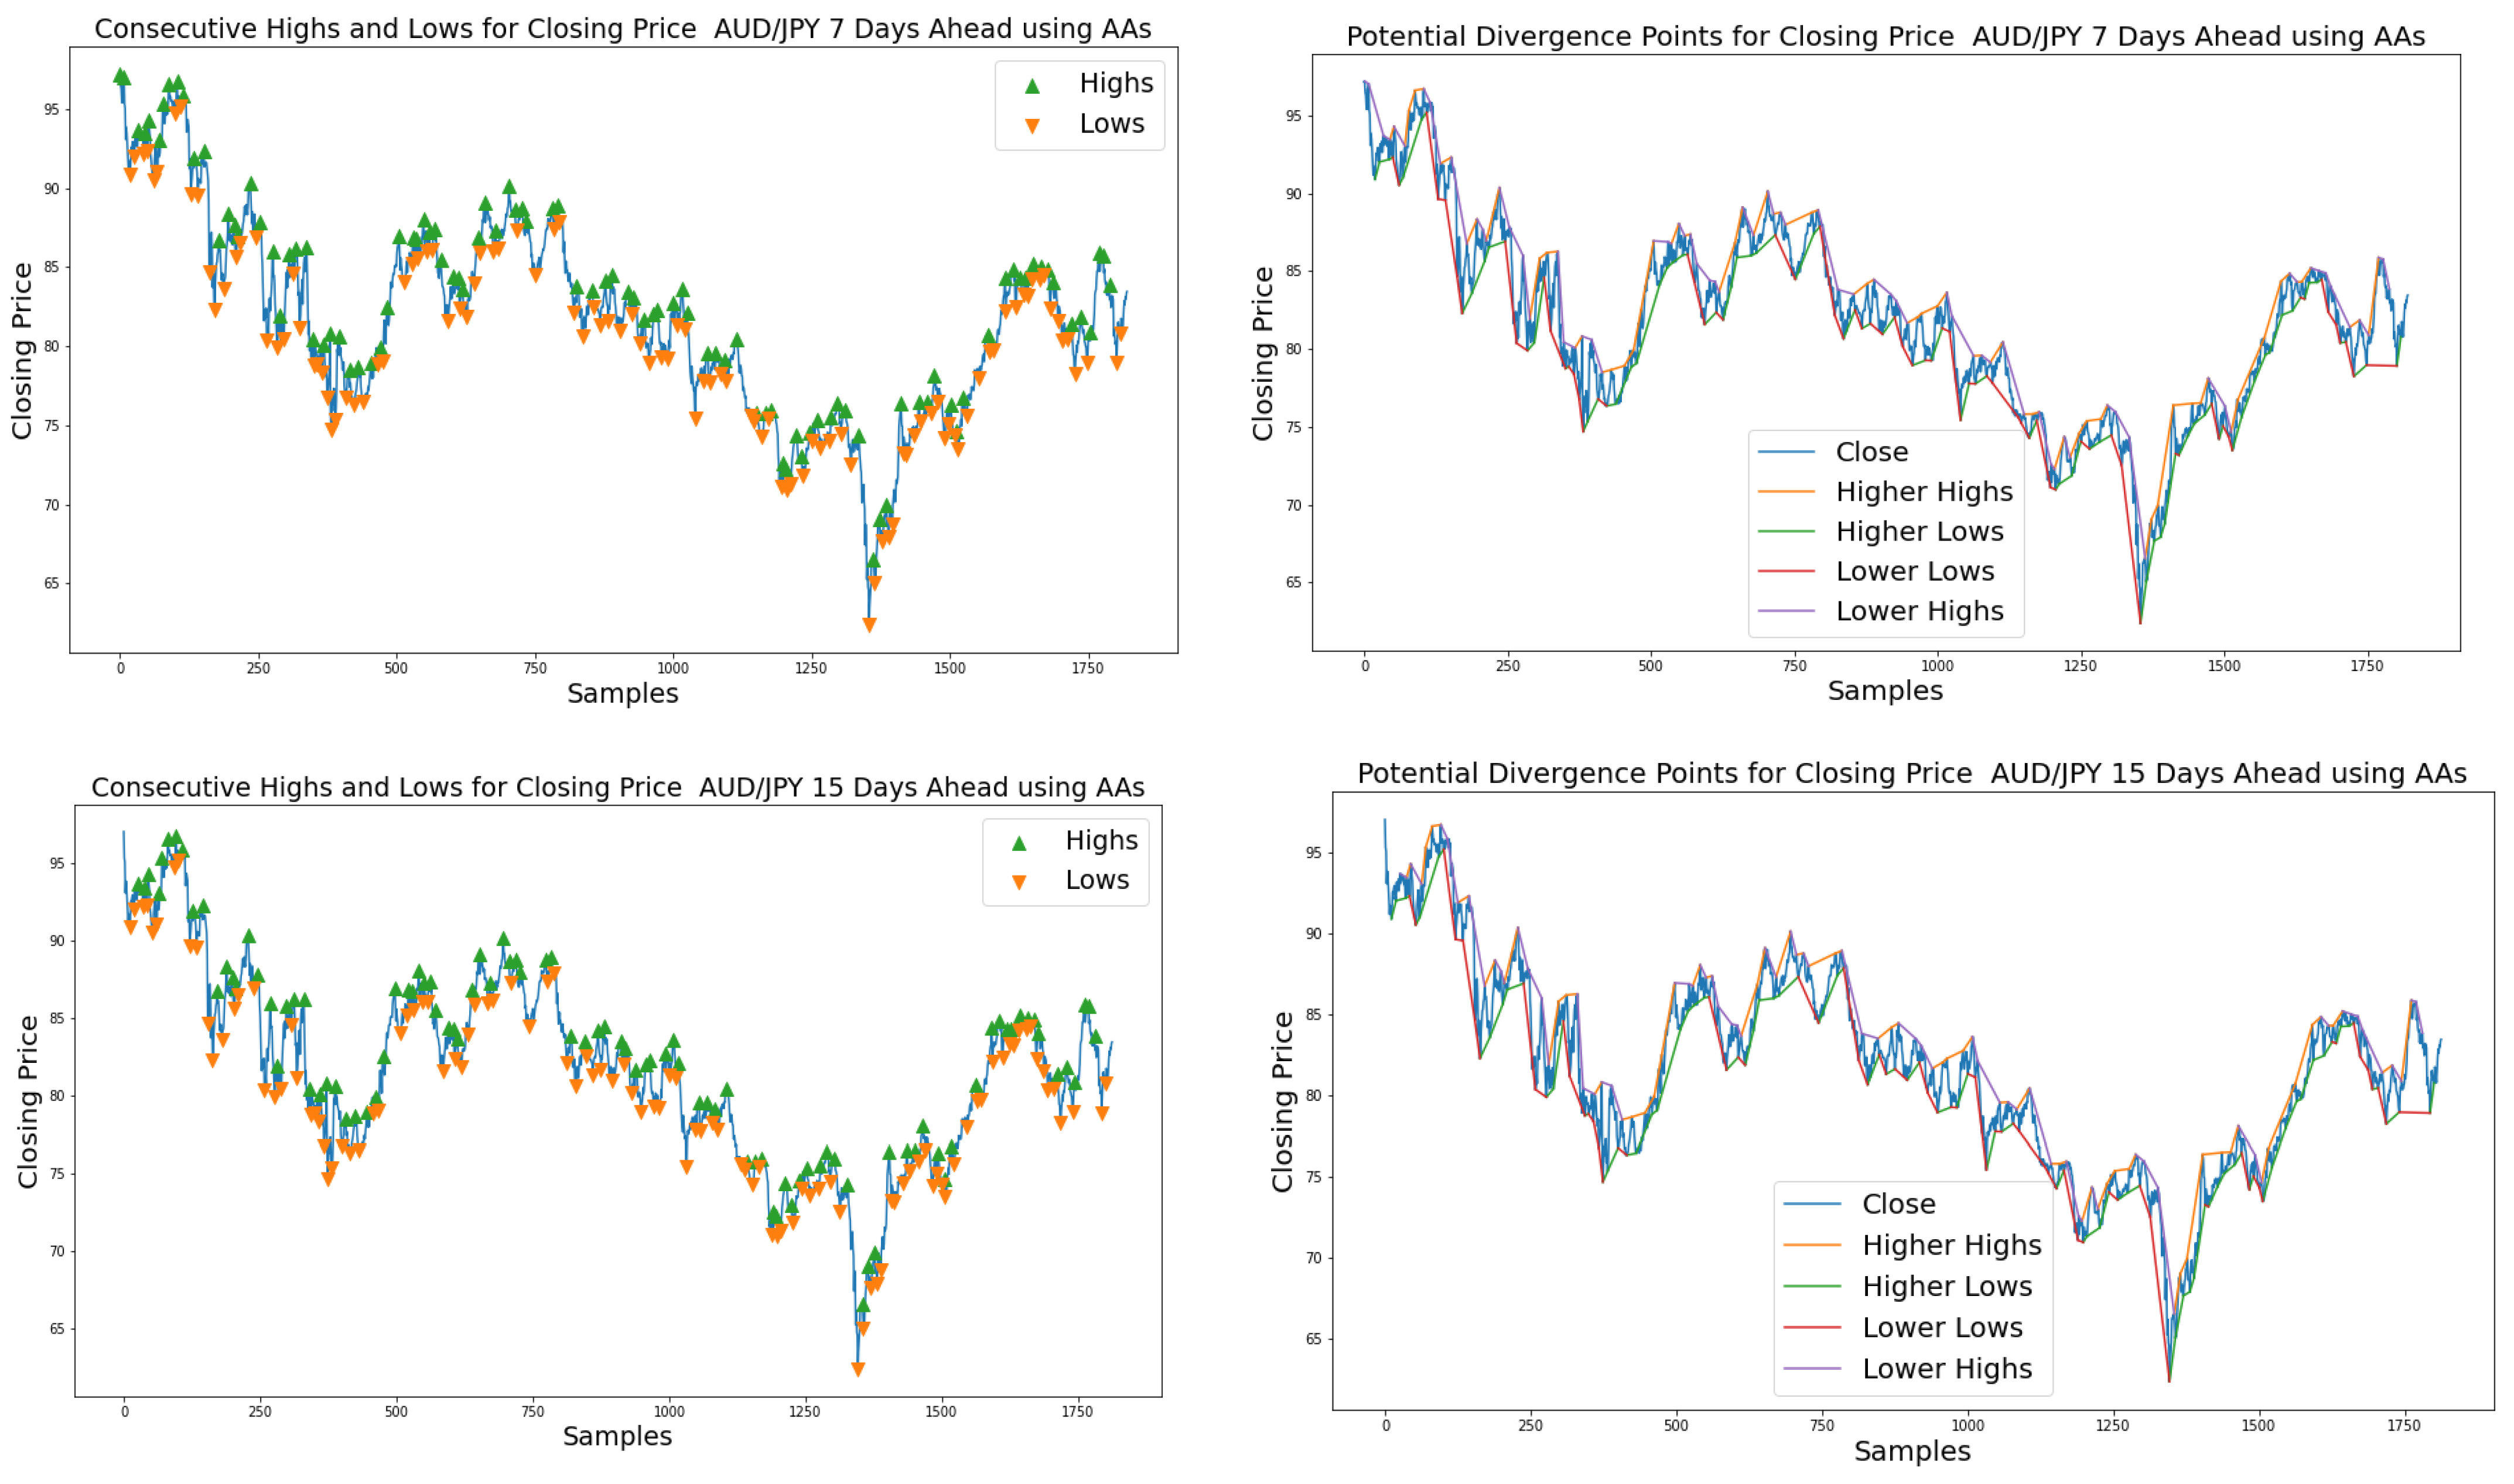
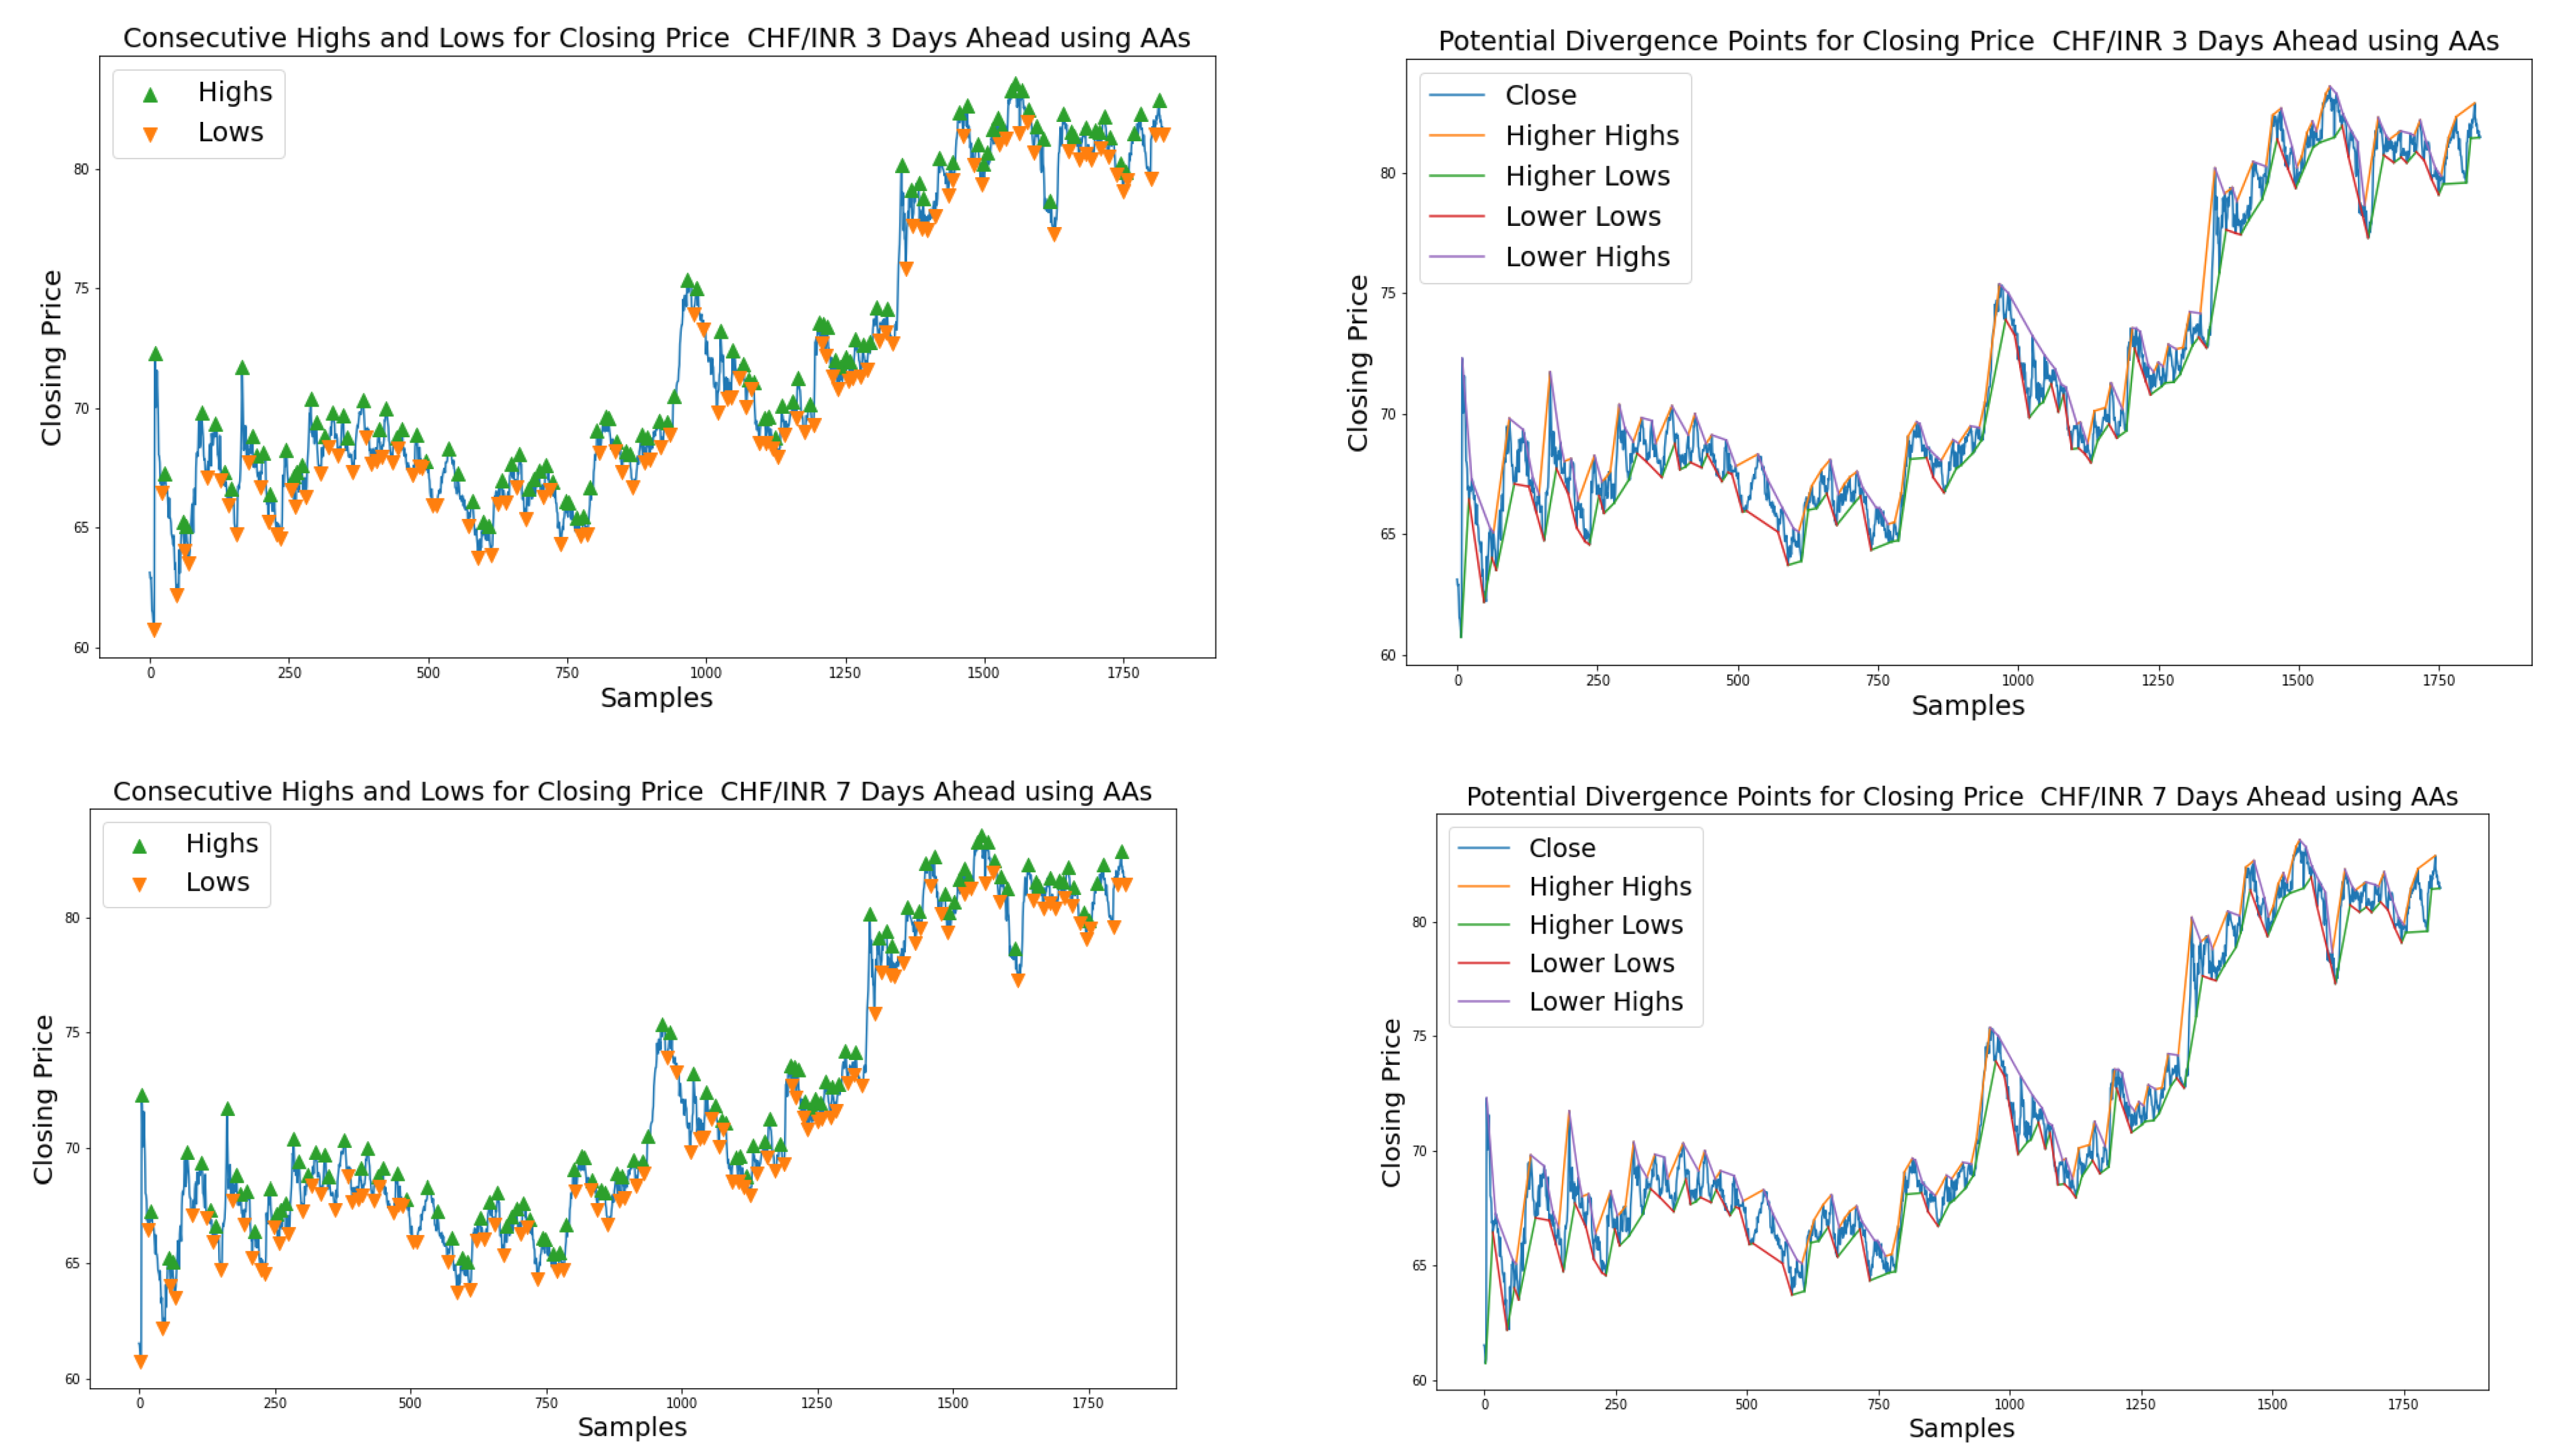
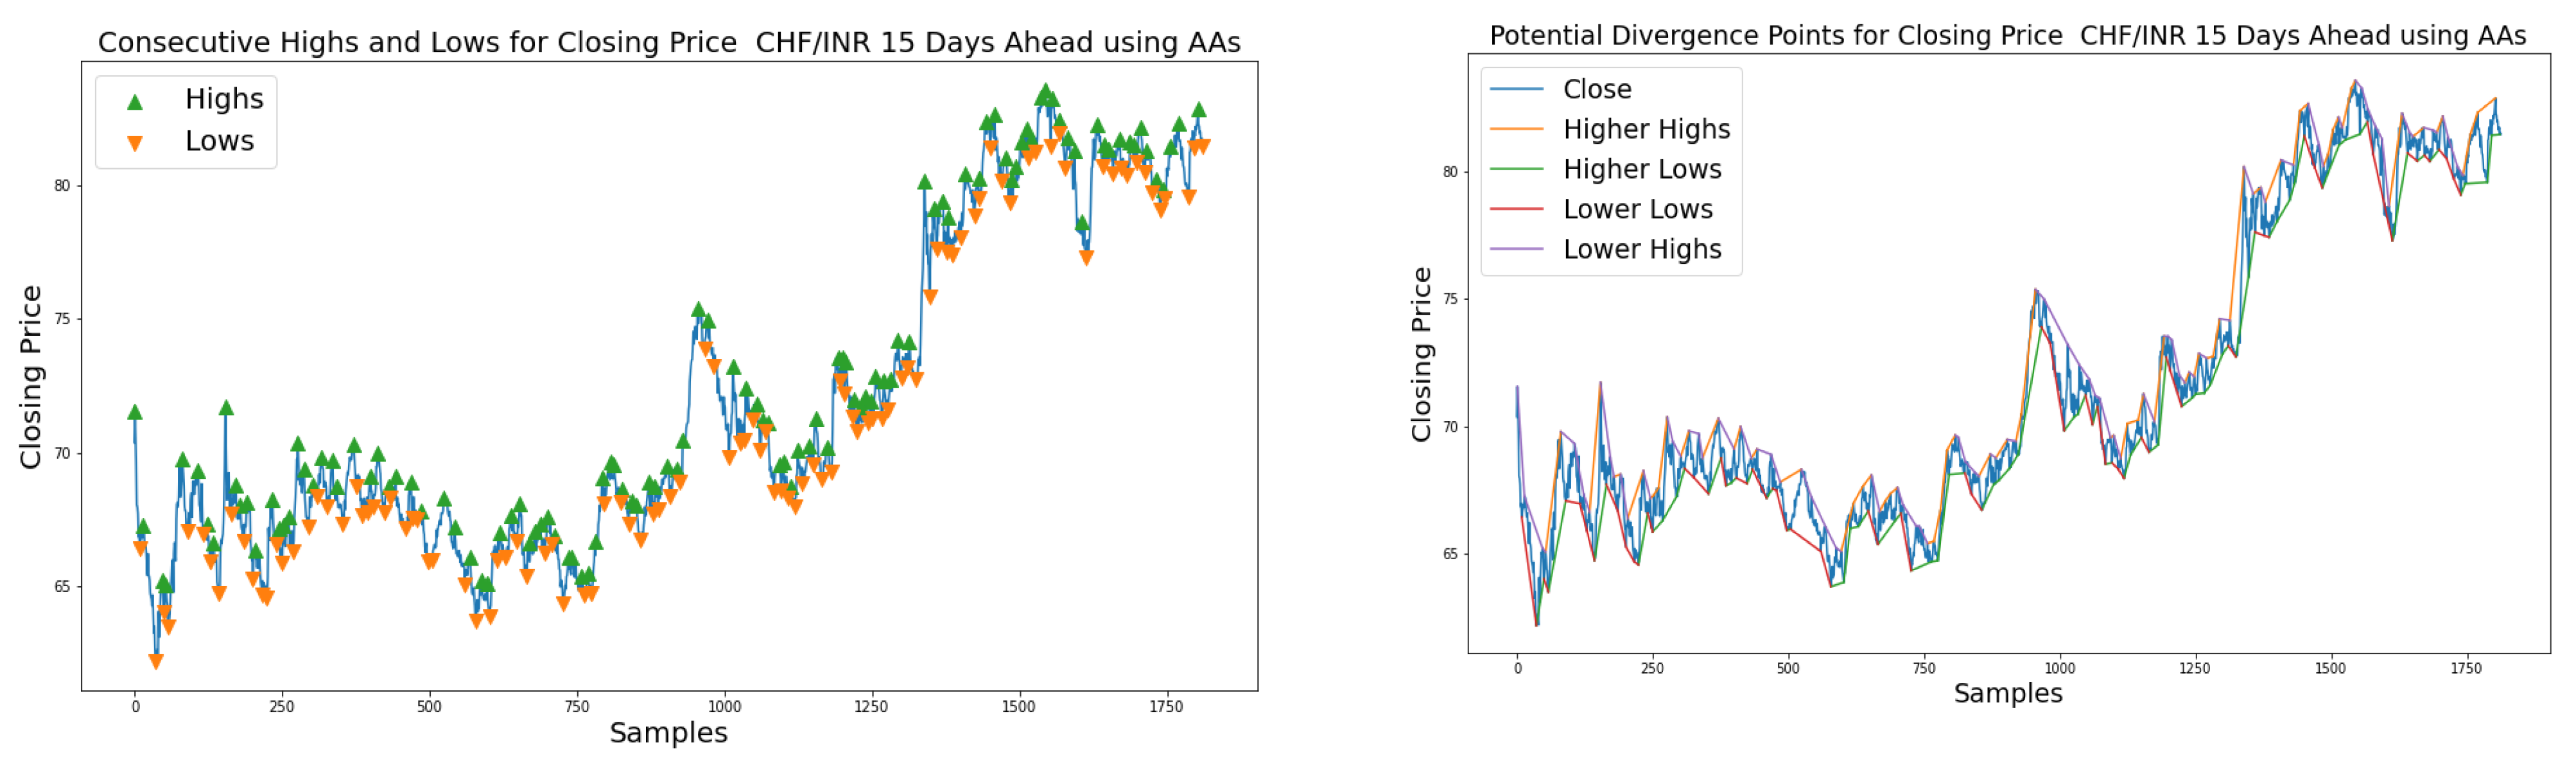
4.3. Phase #2: RSA-DPCN for FOREX Trend Analysis Using HHs/HLs and LHs/LLs

In this Forex market, technical analysis is used to study the historical price of the currencies to predict the profit from future prices. The traders get the benefits of identifying the trends, anticipating a trade change, confirming a trend reversal, and time of entry and exit. Therefore, in this second phase of experimentation, an attempt has been made to identify the Forex market trends for all four currency pairs. As we know, the prices in this Forex market do not move in a straight line. Instead, they move back and forth, forming peaks and troughs as the market oscillates in the form of up-trend or down-trend. The investors observe these trends through various charts and graphs following measures, such as HHs/HLs and LHs/LLs, trend lines, moving averages, parabolic stop and reverse, average directional index, Sharpe ratio, and the Ichimoku cloud.
In the Forex market, the highs and lows refer to the highest and lowest price of a currency that has been traded in a time-based format. These highs and lows are based on the security at the end of each trading day to the closing price. The traders mostly use these to analyze the patterns of trading strategy. When the higher highs, lower lows, lower highs, and higher lows are used in combination, it determines the market trends. If the closing price of the currency/asset closes at a higher price than the previous day, which was also high is known as higher-highs, and if the closing price of the currency/asset closes at a low price. However, that low is higher than the low at the previous day’s closing price, and it is referred to as a higher low. Similarly, if the closing price of the currency/asset closes at a lower price than the previous day’s closing price, which was low is called a lower low. In both scenarios, this indicates a bullish trend or up-trend especially combined altogether, thereby providing confidence that the currency/asset is likely to rise or in up-trend in the near future.
Furthermore, if the price closes at a high price but is lower than the high at the close price of the previous day, known as a lower high, in this case, when both are combined, it indicates a bearish trend or down-trend and signifies that the asset is likely to be in a downward direction.
This HHs/HLs and LHs/LLs strategy adds more weight to the decision-making trading models. Here, the HHs/HLs and LHs/LLs signify the up-trend and down-trends, respectively, which defines the formation of up-trends and down-trends, as shown in Figure 9. This figure shows that when the peaks and troughs are rising on a chart, it represents an up-trend in which the prices can be sought as higher highs and lower lows. During this up-trend, the prices from the previous period were observed as highs even higher than before. Here, the Highs are increasing, and the Lows from the previous duration are also increasing than earlier. This strategy signals the traders and investors that the prices of their assets are rising along with the overall price rise, and it is the best time to sell their assets and make some profit out of them before the down-trend occurs.
Similarly, the downward peaks and troughs in the charts show the lower highs and lower lows in the change of price of the assets representing the down-trends. During this trend, the prices were higher in value and decreased the following period showing the lower high concept, and here the lower prices change negatively and become even lower in the period on the market. From this observation, the traders and investors can foresee the decrease in assets and decide the right time to buy and enter the market just before the up-trend occurs to get a profit out of their investments. Figure 10, Figure 11 and Figure 12 show the observed trends of USD/INR, AUD/INR, EUR/INR, and JPY/INR based on the closing price of the datasets with AAs for 3 days, 7 days and 15 days of forecasting horizon, respectively. The higher highs and higher lows (named as Highs and Lows in charts) and the potential divergence points of the up-trends and down-trends are observed based on HHs/HLs and LHs/LLs vs. actual closing price or predicted closing price based on an RSA-DPCN forecasting model.
The overall inference about the up-trends and down-trends observed in Figure 10, Figure 11 and Figure 12 is based on the closing price of actual currency pairs for 3 days, 7 days, and 15 days ahead of prediction and the predicted closing price of RSA-DPCN using the HHs/HLs and LHs/LLs are depicted in Table 8. From this table, it can be seen that the overall predictive capability is somehow becoming the same as the actual trends observed by the OAs, and 3 days and 7 days ahead of prediction is much closer with minimal mismatches than 15 days of prediction. Overall, the up-trends and down-trends observed by the proposed model are more effective for AUD/JPY currency pairs for all three predictive days.
As per the observations in this financial market analysis, more focus is being given in this algorithmic framework on short-term predictive days, such as 1 day, 3 days, 7 days, and 15 days, but working for long-term predictive horizons, such as 45 days, 60 days, 120 days, 200 days, etc., are more prone to market risks as the future is inherently unpredictable may be with respect to with supply and demand, government, international transactions, speculation and expectation, occurring endemics, epidemics, pandemics, etc., and quantifying those parameters for obtaining a holistic forecasting model needs more insight into this risky and challenging market. Those two timeframes focus only on the predicative horizons, such as few days/weeks/months, and both have their own pros and cons. While, designing investment strategies for both short-term and long-term timeframes, we need to understand that the short-term investment allows us to achieve our financial goals within a short span, with a lower risk. On the other hand, if the investor has a greater risk appetite, wanting higher returns, they can select long term investment avenues. To interpret the results, the retail Forex traders analyses this market to determine the buy or sell decisions on currency pairs using few technical tools, charting tools, candle sticks etc. Basically, they try to understand the drivers, chart indexes, look for the consensus in other markets, time to trade or exit, etc. As a final note, the proposed research after forecasting the exchange rate of currency pairs and observing the up-trends and down-trends, the trading points can be inferred, and the investors can decide in a very straightforward manner and analyze the innate value of specific investments, which encompasses a detailed examination of the economic conditions that affect the valuation of a particular nation’s currency.

5. Conclusions and Future Scope

This paper examines the predictability of DPCN and the optimized version of DPCN network by utilizing the GA, PSO, DE, and RSA optimizers for Forex exchange rates of USD/EUR, AUD/JPY, and CHF/INR currency pairs for three short-term predictive days by augmenting the datasets with few TAs and SMs, such as SMA, EMA, CCI, RoC, RSI, %K, VR, PC/Spread, and PPs. The performance of the proposed RSA-DPCN forecasting model has been compared with FLANN and ELM; the accuracies are measured through RMSE, MAPE, MAE, MARE, R2, and Theils’U; and a two-sample K–S statistical test has been performed to assess the predictive ability of the RSA-DPCN forecasting model. Additionally, an attempt has also been made to monitor the market trends such as up-trends and down-trends by observing the highs, lows, higher highs, and lower lows in this Forex market using HHs/HLs and LHs/LLs, a widely used technical analysis tool. The significant outcome of this proposed algorithmic framework is, apart from the proposed forecasting of exchange prices or trade analysis; an attempt has been made to understand the behavior of this market through trends and trend reversals, and, in turn, this strategy will help the investors and traders to comprehend the entry and exit points of this financial market. This algorithmic framework only explored the short-term predictive horizons, whereas this experiment could have been expanded for long-term predictive days, and DL-based forecasting techniques could have been explored more, which will be extended in our future work. Additionally, this research can also be extended for not only observing the trends, but also measure or forecast the magnitude of trends with respect to average, maximum, and minimum number units up and/or down, and we believe this will surely help the investors and traders to comprehend the entry and exit points of this financial market.

Author Contributions

Conceptualization, S.D., P.K.S. and D.M..; methodology, P.K.S., D.M. and S.K.; software, B.S.; validation, S.D., P.K.M., M.Z. and B.S.; formal analysis, S.D and D.M.; resources, P.K.M. and M.Z.; data curation, S.D. and D.M.; writing—original draft preparation, S.D., D.M. and S.K.; writing—review and editing, D.M. and S.K.; supervision, P.K.S., D.M. and S.K. All authors have read and agreed to the published version of the manuscript.

Funding

The work is supported by the Ministry of Science and Higher Education of the Russian Federation (Government Order FENU-2020-0022).

Institutional Review Board Statement

Not applicable.

Informed Consent Statement

Not applicable.

Data Availability Statement

Data sharing not applicable to this article as no datasets were generated during the current study.

Conflicts of Interest

The authors declare that they have no conflict of interest. The manuscript was written through contributions of all authors. All authors have given approval to the final version of the manuscript.

References

  1. Das, S.R.; Mishra, D.; Rout, M. A hybridized ELM-Jaya forecasting model for currency exchange prediction. J. King Saud Univ.—Comput. Inf. Sci. 2020, 32, 345–366. [Google Scholar] [CrossRef]
  2. Das, S.R.; Mishra, D.; Rout, M. An optimized feature reduction based currency forecasting model exploring the online sequential extreme learning machine and krill herd strategies. Phys. A Stat. Mech. Appl. 2019, 513, 339–370. [Google Scholar] [CrossRef]
  3. Sarangi, P.K.; Chawla, M.; Ghosh, P.; Singh, S.; Singh, P.K. FOREX trend analysis using machine learning techniques: INR vs USD currency exchange rate using ANN-GA hybrid approach. Mater. Today Proc. 2022, 49, 3170–3176. [Google Scholar] [CrossRef]
  4. Farimani, S.A.; Jahan, M.V.; Fard, A.M.; Tabbakh, S.R. Investigating the informativeness of technical indicators and news sentiment in financial market price prediction. Knowl.-Based Syst. 2022, 247, 108742. [Google Scholar] [CrossRef]
  5. Das, S.R.; Mishra, D.; Rout, M. A hybridized ELM using self-adaptive multi-population-based Jaya algorithm for currency exchange prediction: An empirical assessment. Neural Comput. Appl. 2019, 31, 7071–7094. [Google Scholar] [CrossRef]
  6. Nayak, R.K.; Mishra, D.; Rath, A.K. An optimized SVM-k-NN currency exchange forecasting model for Indian currency market. Neural Comput. Appl. 2019, 31, 995–3021. [Google Scholar] [CrossRef]
  7. Galeshchuk, S. Neural networks performance in exchange rate prediction. Neurocomputing 2016, 172, 446–452. [Google Scholar] [CrossRef]
  8. Ni, H.; Yin, H. Exchange rate prediction using hybrid neural networks and trading indicators. Neurocomputing 2009, 72, 2815–2823. [Google Scholar] [CrossRef]
  9. PradeepKumar, D.; Ravi, V. Soft computing hybrids for FOREX rate prediction: A comprehensive review. Comput. Oper. Res. 2018, 99, 262–284. [Google Scholar] [CrossRef]
  10. Carapuço, J.; Neves, R.; Horta, N. Reinforcement learning applied to Forex trading. Appl. Soft Comput. 2018, 73, 783–794. [Google Scholar] [CrossRef]
  11. Panda, M.M.; Panda, S.N.; Pattnaik, P.K. Multi currency exchange rate prediction using convolutional neural network. Mater. Today Proc. 2021. ISSN 2214-7853. [Google Scholar] [CrossRef]
  12. Sezer, O.B.; Gudelek, M.U.; Ozbayoglu, A.M. Financial time series forecasting with deep learning: A systematic literature review: 2005–2019. Appl. Soft Comput. 2020, 90, 106181. [Google Scholar] [CrossRef]
  13. Islam, M.S.; Hossain, E. Foreign exchange currency rate prediction using a GRU-LSTM hybrid network. Soft Comput. Lett. 2021, 3, 100009. [Google Scholar] [CrossRef]
  14. Juszczuk, P.; Kruś, L. Soft multicriteria computing supporting decisions on the Forex market. Appl. Soft Comput. 2020, 96, 106654. [Google Scholar] [CrossRef]
  15. Ahmed, S.; Hassan, S.U.; Aljohani, N.R.; Nawaz, R. FLF-LSTM: A novel prediction system using Forex Loss Function. Appl. Soft Comput. 2020, 97, 106780. [Google Scholar] [CrossRef]
  16. Pang, Z.; O’May, C.B.; Choksi, B.; VanRullen, R. Predictive coding feedback results in perceived illusory contours in a recurrent neural network. Neural Netw. 2021, 144, 164–175. [Google Scholar] [CrossRef] [PubMed]
  17. Mohan, A.; Luckey, A.; Weisz, N.; Vanneste, S. Predisposition to domain-wide maladaptive changes in predictive coding in auditory phantom perception. NeuroImage 2022, 248, 118813. [Google Scholar] [CrossRef]
  18. Wen, H.; Han, K.; Shi, J.; Zhang, Y.; Culurciello, E.; Liu, Z. Deep Predictive Coding Network for Object Recognition. In Proceedings of the 35th International Conference on Machine Learning (ICML 2018), Stockholmsmässan, Stockholm, Sweden, 10–15 July 2018; Volume 80, pp. 5266–5275. [Google Scholar]
  19. Dora, S.; Pennartz, C.; Bohte, S. A Deep Predictive Coding Network for Inferring Hierarchical Causes Underlying Sensory Inputs. In Artificial Neural Networks and Machine Learning—ICANN 2018; Kůrková, V., Manolopoulos, Y., Hammer, B., Iliadis, L., Maglogiannis, I., Eds.; Lecture Notes in Computer Science; Springer: Cham, Switzerland, 2018; Volume 11141. [Google Scholar]
  20. Sledge, I.J.; Principe, J.C. Faster Convergence in Deep-Predictive-Coding Networks to Learn Deeper Representations. IEEE Trans. Neural Netw. Learn. Systems 2021, 1–15. [Google Scholar] [CrossRef]
  21. Lotter, W.; Kreiman, G.; Cox, D. Deep Predictive Coding Networks for Video Prediction and Unsupervised Learning. arXiv 2016, arXiv:1605.08104. [Google Scholar]
  22. Wang, L.; Zeng, Y.; Chen, T. Back propagation neural network with adaptive differential evolution algorithm for time series forecasting. Expert Syst. Appl. 2015, 42, 855–863. [Google Scholar] [CrossRef]
  23. Rout, M.; Majhi, B.; Majhi, R.; Panda, G. Forecasting of currency exchange rates using an adaptive ARMA model with differential evolution based training. J. King Saud Univ.—Comput. Inf. Sci. 2014, 26, 7–18. [Google Scholar] [CrossRef]
  24. Chouikhi, N.; Ammar, B.; Rokbani, N.; Alimi, A.M. PSO-based analysis of Echo State Network parameters for time series forecasting. Appl. Soft Comput. 2017, 55, 211–225. [Google Scholar] [CrossRef]
  25. de Almeida, B.J.; Neves, R.F.; Horta, N. Combining Support Vector Machine with Genetic Algorithms to optimize investments in Forex markets with high leverage. Appl. Soft Comput. 2018, 64, 596–613. [Google Scholar] [CrossRef]
  26. Evans, C.; Pappas, K.; Xhafa, F. Utilizing artificial neural networks and genetic algorithms to build an algo-trading model for intra-day foreign exchange speculation. Math. Comput. Model. 2013, 58, 1249–1266. [Google Scholar] [CrossRef]
  27. Abualigah, L.; Abd Elaziz, M.; Sumari, P.; Geem, Z.W.; Gandomi, A.H. Reptile Search Algorithm (RSA): A nature-inspired meta-heuristic optimizer. Expert Syst. Appl. 2022, 191, 116158. [Google Scholar] [CrossRef]
  28. Güntürkün, O.; Stacho, M.; Ströckens, F. Chapter 8—The Brains of Reptiles and Birds. In Evolutionary Neuroscience, 2nd ed.; Jon, H.K., Ed.; Academic Press: Cambridge, MA, USA, 2020; pp. 159–212. [Google Scholar]
  29. Gibbons, P.M.; Tell, L.A. Problem Solving in Reptile Practice. J. Exot. Pet Med. 2009, 18, 202–212. [Google Scholar] [CrossRef]
  30. Das, S.R.; Mishra, D.; Rout, M. Stock market prediction using Firefly algorithm with evolutionary framework optimized feature reduction for OSELM method. Expert Syst. Appl. X 2019, 4, 100016. [Google Scholar] [CrossRef]
  31. Das, A.K.; Mishra, D.; Das, K.; Mallick, P.K.; Kumar, S.; Zymbler, M.; El-Sayed, H. Prophesying the Short-Term Dynamics of the Crude Oil Future Price by Adopting the Survival of the Fittest Principle of Improved Grey Optimization and Extreme Learning Machine. Mathematics 2022, 10, 1121. [Google Scholar] [CrossRef]
  32. Liu, M.; Luo, K.; Zhang, J.; Chen, S. A stock selection algorithm hybridizing grey wolf optimizer and support vector regression. Expert Syst. Appl. 2021, 179, 115078. [Google Scholar] [CrossRef]
  33. Yao, J.; Tan, C.L. A case study on using neural networks to perform technical forecasting of forex. Neurocomputing 2000, 34, 79–98. [Google Scholar] [CrossRef]
  34. Talebi, H.; Hoang, W.; Gavrilova, M.L. Multi-scale Foreign Exchange Rates Ensemble for Classification of Trends in Forex Market. Procedia Comput. Sci. 2014, 29, 2065–2075. [Google Scholar] [CrossRef]
  35. Fiorucci, J.A.; Silva, G.N.; Barboza, F. Reaction trend system with GARCH quantiles as action points. Expert Syst. Appl. 2022, 198, 116750. [Google Scholar] [CrossRef]
  36. Bartoš, E.; Pinčák, R. Identification of market trends with string and D2-brane maps. Phys. A Stat. Mech. Appl. 2017, 479, 57–70. [Google Scholar] [CrossRef]
  37. Sadeghi, A.; Daneshvar, A.; Zaj, M.M. Combined ensemble multi-class SVM and fuzzy NSGA-II for trend forecasting and trading in Forex markets. Expert Syst. Appl. 2021, 185, 115566. [Google Scholar] [CrossRef]
  38. Available online: https://in.investing.com/currencies/ (accessed on 1 January 2022).
  39. Panopoulou, E.; Souropanis, I. The role of technical indicators in exchange rate forecasting. J. Empir. Financ. 2019, 53, 197–221. [Google Scholar] [CrossRef]
  40. Dai, Z.; Zhu, H.; Kang, J. New technical indicators and stock returns predictability. Int. Rev. Econ. Financ. 2021, 71, 127–142. [Google Scholar] [CrossRef]
  41. Lee, S.W.; Kim, H.Y. Stock market forecasting with super-high dimensional time-series data using ConvLSTM, trend sampling, and specialized data augmentation. Expert Syst. Appl. 2020, 161, 113704. [Google Scholar] [CrossRef]
  42. Available online: https://forexbee.co/trend-analysis/ (accessed on 11 January 2022).
  43. Available online: https://www.incrediblecharts.com/technical/dow_theory_trends.php (accessed on 11 January 2022).
  44. Korczak, J.; Hernes, M. Performance Evaluation of Trading Strategies in Multi-Agent Systems—Case of A-Trader. In Proceedings of the 2018 Federated Conference on Computer Science and Information Systems (FedCSIS), Poznan, Poland, 9–12 September 2018; pp. 839–844. [Google Scholar]
  45. Otsu, T.; Taniguchi, G. Kolmogorov–Smirnov type test for generated variables. Econ. Lett. 2020, 195, 109401. [Google Scholar] [CrossRef]
Figure 1. General block diagram of DPCN.
Axioms 11 00396 g001
Figure 2. Proposed two-layer structure of DPCN for Forex market forecasting in which the feedback is shown in blue arrows, feed-forward in green arrows, and recurrent in black arrows, and the connections presenting the top-down and bottom-up prediction of errors, the historical data.
Axioms 11 00396 g002
Figure 3. Schematic layout of the proposed Forex market forecasting approach.
Axioms 11 00396 g003
Figure 4. Convergence graphs of RSA-DPCN vs. RSA-FLANN and RSA-ELM for 3 predictive days ahead of closing price prediction for (a) USD/EUR, (b) AUD/JPY and (c) CHF/INR for both AAs and OAs.
Axioms 11 00396 g004aAxioms 11 00396 g004b
Figure 5. Convergence graphs of RSA-DPCN vs. RSA-FLANN and RSA-ELM for 7 predictive days ahead of closing price prediction for (a) USD/EUR, (b) AUD/JPY and (c) CHF/INR for both AAs and OAs.
Axioms 11 00396 g005aAxioms 11 00396 g005b
Figure 6. Convergence graphs of RSA-DPCN vs. RSA-FLANN and RSA-ELM for 15 predictive days ahead of closing price prediction for (a) USD/EUR, (b) AUD/JPY and (c) CHF/INR for both AAs and OAs.
Axioms 11 00396 g006aAxioms 11 00396 g006b
Figure 7. (a). Convergence curves of RSA-DPCN vs. DE-DPCN, PSO-FPCN, and GA-DPCN for all three currency datasets for 3 days ahead of closing price prediction for AAs. (b). Convergence curves of RSA-DPCN vs. DE-DPCN, PSO-FPCN, and GA-DPCN for all three currency datasets for 7 days ahead of closing price prediction for AAs. (c). Convergence curves of RSA-DPCN vs. DE-DPCN, PSO-FPCN, and GA-DPCN for all three currency datasets for 15 days ahead of closing price prediction for AAs.
Axioms 11 00396 g007aAxioms 11 00396 g007bAxioms 11 00396 g007c
Figure 8. (a). Predictive performance of RSA-DPCN for all three currency pairs for 03 days ahead of closing price prediction with OAs and AAs. (b). Predictive performance of RSA-DPCN for all three currency pairs for 7 days ahead of closing price prediction with OAs and AAs. (c). Predictive performance of RSA-DPCN for all three currency pairs for 15 days ahead of closing price prediction with OAs and AAs.
Axioms 11 00396 g008aAxioms 11 00396 g008b
Figure 9. Trend analysis through HH/HL and LH/LL [42,43].
Axioms 11 00396 g009
Figure 10. Up-trends and Down-trends observed using HHs/HLs and LHs/LLs and potential divergence/split points for USD/EUR currency pairs for 3 days, 7 days, and 15 days ahead of prediction for AAs based on closing price.
Axioms 11 00396 g010
Figure 11. Up-trends and Down-trends observed using HHs/HLs and LHs/LLs and potential divergence/split points for AUD/JPY currency pairs for 3 days, 7 days, and 15 days ahead of prediction for AAs based on closing price.
Axioms 11 00396 g011aAxioms 11 00396 g011b
Figure 12. Up-trends and Down-trends observed using HHs/HLs and LHs/LLs and potential divergence/split points for CHF/INR currency pairs for 3 days, 7 days, and 15 days ahead of prediction for AAs based on closing price.
Axioms 11 00396 g012aAxioms 11 00396 g012b
Table 1. Description of data samples and data range.
DatasetsTotal SamplesDate RangeData Range
USD/EUR18281 January 2015~1 January 20210.7969~0.9671
AUD/JPY182859~98
CHF/INR182860~83
Table 2. Associated parameter values for predictive networks and optimization techniques.
Networks and Optimization TechniquesParameters and Associated Values
FLANNalgorithm = ’autotuned’; target_precision = 0.7; build_weight = 0.01; memory_weight = 0;
ELMActivation Function: Multiquadtratic
DPCNFeebforward-Conv2D-Kernel Size-3; Feebback-Conv2D-Kernel Size-3
For prediction: Up sampling has been performed using PyTorch with various scaling factors.
GANumber of Decision Variables = 3; Maximum Number of Iterations = 50
Population size = 10; Selection method-Roulette wheel
PSONumber of Decision Variables = 3; Maximum Number of Iterations = 50
Number of Particles = 10; Inertia Weight = 1; Inertia Weight Damping Ratio = 0.99; Personal Learning Coefficient = 1.5; Global Learning Coefficient = 2.0
DENumber of Decision Variables = 3; Maximum Number of Iterations = 50
Crossover rate = 0.7; Mutation factor = 0.5; Number of Decision Variables = 3
RSAMaximum Number of Iterations = 50; Alpha = 0.1; Beta = 0.005
Table 3. Performance of RSA-DPCN model with other predictive models for 03 days.
ModelsCurrency PairsRMSEMAPEMAEMSEMARER2Theil’s U
GA-DPCNUSD/EUR0.00650.7402710.00654.22 × 1050.0074030.9649740.3958
PSO-DPCN0.003080.3507750.003089.49 × 10−60.0035080.9921360.1932
DE-DPCN0.0020.2277760.0024 × 10−60.0022780.9966840.1923
RSA-DPCN0.0010.1138880.0011 × 10−60.0011390.9991710.1919
GA-DPCNAUD/JPY1.18851.4620431.18851.4125320.014620.9617780.3215
PSO-DPCN1.17881.450111.17881.3895690.0145010.9623990.3158
DE-DPCN1.1671.4355941.1671.3618890.0143560.9631480.3115
RSA-DPCN1.1481.4122211.1481.3179040.0141220.9643380.2848
GA-DPCNCHF/INR0.58850.8264080.58850.3463320.0082640.9897190.4181
PSO-DPCN0.57880.8127870.57880.3350090.0081280.9900550.4142
DE-DPCN0.51670.7255820.51670.2669790.0072560.9920750.4156
RSA-DPCN0.51480.7229140.51480.2650190.0072290.9921330.3147
Table 4. Performance of RSA-DPCN model with other predictive models for 07 days.
ModelsCurrency PairsRMSEMAPEMAEMSEMARER2Theil’s U
GA-DPCNUSD/EUR0.006250.7117270.006253.91 × 10−50.0071170.9675910.3868
PSO-DPCN0.0030870.3515360.0030879.53 × 10−60.0035150.9920940.2911
DE-DPCN0.00270.3074660.00277.29 × 10−60.0030750.9939520.2593
RSA-DPCN0.00170.193590.00172.89 × 10−60.0019360.9976020.2124
GA-DPCNAUD/JPY1.419851.7472441.419852.0159740.0174720.9448550.3242
PSO-DPCN1.318881.6229921.318881.7394440.016230.9524190.3168
DE-DPCN1.26971.5624721.26971.6121380.0156250.9559010.3154
RSA-DPCN1.2581.5480741.2581.5825640.0154810.956710.2954
GA-DPCNCHF/INR1.958852.7499311.958853.8370930.0274990.8857660.4487
PSO-DPCN1.57882.2163981.57882.4926090.0221640.9257920.4444
DE-DPCN1.16671.6378721.16671.3611890.0163790.9594760.4251
RSA-DPCN1.11481.5650121.11481.2427790.015650.9630010.3242
Table 5. Performance of RSA-DPCN model with other predictive models for 15 days.
ModelsCurrency PairsRMSEMAPEMAEMSEMARER2Theil’s U
GA-DPCNUSD/EUR0.009251.0532170.009258.56 × 10−50.0105320.9291210.3879
PSO-DPCN0.0080870.9207960.0080876.54 × 10−50.0092080.9458230.2995
DE-DPCN0.00770.8767320.00775.93 × 10−50.0087670.9508840.2784
RSA-DPCN0.00670.762870.00674.49 × 10−50.0076290.9628130.2615
GA-DPCNAUD/JPY1.49851.8453081.49852.2455020.0184530.9372040.3249
PSO-DPCN1.38881.710221.38881.9287650.0171020.9460610.3287
DE-DPCN1.36971.6866991.36971.8760780.0168670.9475350.3241
RSA-DPCN1.2981.5984051.2981.6848040.0159840.9528840.2922
GA-DPCNCHF/INR2.018852.8328842.018854.0757550.0283290.8780810.4491
PSO-DPCN1.97882.7766851.97883.9156490.0277670.882870.4318
DE-DPCN1.9672.7601271.9673.8690890.0276010.8842630.4122
RSA-DPCN1.51482.1255931.51482.2946190.0212560.9313610.3142
Table 6. The p and h   values obtained based on K–S test.
DatasetsModel Pairs p   and   h Value 03 Days07 Days15 Days
USD/EURRSA-DPCN vs. GA-DPCN(p)1.8 × 10−67.85 × 10−50.027227
(h)111
RSA-DPCN vs. PSO-DPCN(p)0.0705960.2282120.229598
(h)000
RSA-DPCN vs. DE-DPCN(p)0.3846210.3849530.386367
(h)000
AUD/JPYRSA-DPCN vs. GA-DPCN(p)0.8405590.4194280.312933
(h)000
RSA-DPCN vs. PSO-DPCN(p)0.8784020.761340.647665
(h)000
RSA-DPCN vs. DE-DPCN(p)0.9248070.9534540.718191
(h)000
CHF/INRRSA-DPCN vs. GA-DPCN(p)0.7013951.15E-05(p)0.008726
(h)01(h)1
RSA-DPCN vs. PSO-DPCN(p)0.7391550.015780.015761
(h)011
RSA-DPCN vs. DE-DPCN(p)0.9921130.787070.01862
(h)001
Table 7. Execution Time (in seconds).
ModelsCurrency PairsOAsAAs
03 Days07 Days15 Days03 Days07 Days15 Days
GA-DPCNUSD/EUR96094391510141001986
PSO-DPCN955940917998986979
DE-DPCN9649429211021998981
RSA-DPCN9619479191002999985
GA-DPCNAUD/JPY9609419241012999986
PSO-DPCN954935916995979979
DE-DPCN9529429231026983979
RSA-DPCN9559459171008999982
GA-DPCNHF/INR92591490910171008976
PSO-DPCN931924917989981972
DE-DPCN9719469221015993969
RSA-DPCN9589479201011987981
Table 8. The trend analysis: Trends observed based on predicted closing price of RSA-DPCN based on HH/HL and LH/LL vs. Trends observed on closing price of actual datasets for OAs and AAs during 3 days, 7 days, and 15 days ahead of prediction.
Predictive DaysDatasets OAs/AAsUSD/EURAUD/JPYCHF/INR
No. of UP-TrendsNo. of Down-TrendsNo. of UP-TrendsNo. of Down-TrendsNo. of UP-TrendsNo. of Down-Trends
3 DaysOAs272732293429
AAs262732293528
No. of mismatches observed100011
7 DaysOAs272630293126
AAs262530293225
No. of mismatches observed110011
15 DaysOAs262426292821
AAs282626292922
No. of mismatches observed120011
Publisher’s Note: MDPI stays neutral with regard to jurisdictional claims in published maps and institutional affiliations.

