Article

Multi-Label Classification of E-Commerce Customer Reviews via Machine Learning

1
Computer Engineering Department, Hitit University, Corum 19030, Türkiye
2
Computer Engineering Department, University of Turkish Aeronautical Association, Ankara 06790, Türkiye
*
Author to whom correspondence should be addressed.
These authors contributed equally to this work.
Axioms 2022, 11(9), 436; https://doi.org/10.3390/axioms11090436
Submission received: 8 July 2022 / Revised: 22 August 2022 / Accepted: 23 August 2022 / Published: 26 August 2022
(This article belongs to the Special Issue Machine Learning: Theory, Algorithms and Applications)

Abstract

:
The multi-label customer reviews classification task aims to identify the different thoughts of customers about the product they are purchasing. Due to the impact of the COVID-19 pandemic, customers have become more prone to shopping online. As a consequence, the amount of text data on e-commerce is continuously increasing, which enables new studies to be carried out and important findings to be obtained with more detailed analysis. Nowadays, e-commerce customer reviews are analyzed by both researchers and sector experts, and are subject to many sentiment analysis studies. Herein, an analysis of customer reviews is carried out in order to obtain more in-depth thoughts about the product, rather than engaging in emotion-based analysis. Initially, we form a new customer reviews dataset made up of reviews by Turkish consumers in order to perform the proposed analysis. The created dataset contains more than 50,000 reviews in three different categories, and each review has multiple labels according to the comments made by the customers. Later, we applied machine learning methods employed for multi-label classification to the dataset. Finally, we compared and analyzed the results we obtained using a diverse set of statistical metrics. As a result of our experimental studies, we found the Micro Precision 0.9157, Micro Recall 0.8837, Micro F1 Score 0.8925, and Hamming Loss 0.0278 to be the most successful approaches.

1. Introduction

The recent breakthrough in Natural Language Processing (NLP) and text mining, along with advancements in information technologies, have led to the development of many new applications [1]. New methods in artificial intelligence and an increase in the amount and variety of textual data produced on a daily basis allow for a great deal of research to be carried out on real-life problems. Text classification is one of the most fundamental topics in NLP and text mining. The text classification problem can be defined as associating relevant text with pre-existing labels. The structure of datasets plays an important role in such labeling. Depending on the status of the problem, each text can be represented by one or more labels. This has led to variations in text classification practices. Text classification types resulting from this diversity of approaches are shown in Table 1.
Binary classification is a popular and relatively simple type of text classification based on structure. Each text is classified such that it is represented by only one of two labels. Fake news detection [2], spam e-mail detection [3], spam review detection [4], and authorship verification [5,6] are examples of binary text classification applications. Unlike binary classification, in multi-class text classification there are more than two labels. What multi-class text classification has in common with binary text classification is that in both models each text is represented by only one label. Sentiment analysis [7], topic modelling [8] and synonym extraction [9] are examples of multi-class text classification tasks.
Although both binary and multi-class text classification lead to successful results, they do not produce satisfactory outputs in situations where individuals’ opinions are needed, such as with respect to products and events, as the language we use and the expressions we produce contain more complex meanings in these contexts. Restricting textual expression to a single label often prevents the extraction of more detailed information from text, even though this is possible. For this reason, with the developments in information technologies, multi-label data are needed in order to meet the expectations of individuals. Multi-label text classification methods are employed to analyze multi-label data. In other words, in multi-label text classification, each text can have either a single label or more than one label.
Developments in information technologies have affected both artificial intelligence applications and human behaviors, lives, and expectations. In particular, in the so-called social digital life caused by digitalization, and in the circumstances of the COVID-19 pandemic, people have started to use the internet intensively in order to work, shop, have fun, and learn; in short, people have started to use it in their daily routines. This influence can best be witnessed in electronic commerce (E-Commerce). Recent statistics [10] indicate that 93.5 percent of internet users have purchased products online. In the US, 41 percent of customers receive one or two packages from Amazon per week, and that percentage rises to 50 for customers aged 18–25 and 57 for customers aged 26–35 [10]. It is estimated [11] that 95% of all purchases will be made through e-commerce by the year 2040. Product reviews have a high impact on customers’ online purchases; 55% of online customers tell friends and family when they are not satisfied with a product or company [10]. Moreover, 90% of customers read online reviews before making a purchase. As a result, the amount of data collected daily and its influence on customers have attracted the attention of researchers. Thus, many studies have been conducted on e-commerce customer reviews. Table 2 presents e-commerce customer review classification methods and possible labels.
As stated in [12], most studies performed in the literature are based on polarity analysis, and multi-label review analysis has not been performed. Unlike the traditional classification techniques shown in Table 2, the model we propose here aims to identify the various labels present in reviews. Multi-label examinations of these data are important because because with detailed analyses useful findings can be discovered for both people who buy products and for companies that want to improve their customer relationship management via customer reviews. For example, say a person is shopping for a product that they want to buy very urgently. In this process, their primary request about the product is for it to be shipped immediately by the seller. It is be an advantage for such a person to read reviews by classifying them in line with their priorities. For this reason, it is important to analyze customer reviews both sentimentally and qualitatively. For these reasons, and due to the absence of similar studies on this subject in the literature, we are motivated to classify e-commerce customer reviews through a multi-label approach.
Within the scope of this study, we address e-commerce customer review analysis for Turkish consumers, making three main contributions. First, customer reviews are analyzed in an aspect-based manner rather than a polarity-oriented manner in order to determine the detailed opinions of Turkish customers about products in three categories. Second, we create a new multi-label e-commerce customer review dataset for Turkish customers. This data set can allow researchers to compare customer habits across different cultures. Third, we carry out a multi-label customer review analysis with various algorithms and diverse measurement techniques. Different embedding methods, both frequency-based and prediction-based, and different classification methods are employed throughout our experiments. The embedding methods used in this paper consist of frequency-based Term Frequency-Inverse Document Frequency (TF-IDF) and prediction-based Word2Vec, Global Vectors for Word Representation (GloVe) and Bidirectional Encoder Representations from Transformers (BERT). During the process of extracting labels, the problem transformation approach was preferred and binary relevance was employed as the problem transformation method. Afterwards, Random Forest (RF), Support Vector Classification (SVC), Naive Bayes (NB), Multi-label k-Nearest Neighbor (Ml-kNN), One-versus-Rest Logistic Regression (OvsR-LR), One-versus-Rest Stochastic Gradient Descent (OvsR-SGD), One-versus-Rest eXtreme Gradient Boosting (OvsR-XGB), and One-versus-Rest Support Vector Classification (OvsR-SVC) were used as classification methods.
The rest of the paper is organized as follows: Section 2 reviews the literature and summarizes related studies in the literature; Section 3 describes the materials and methods used throughout the study; Section 4 explains and discusses our experimental results; and finally, Section 5 is devoted to our conclusions and future plans.

2. Related Works

Sentiment analysis or opinion mining is the systematic examination of people’s attitudes, views and feelings regarding a given entity [13]. Sentiment analysis of customer reviews has been performed in many studies. Almost all of these studies have focused on polarity analysis. Muslim [14] aimed to improve Support Vector Machine (SVM) accuracy for classifying e-commerce customer review datasets using grid search, with uni-gram used for feature extraction. They used datasets consisting of Amazon reviews and Lazada reviews labeled as positive or negative. Their experimental results showed that applying uni-gram and grid search on the support vector machine (SVM) algorithm could improve the accuracy of Amazon reviews by 26.4% to 80.8% and that of Lazada reviews by 4.26% to 90.13%. Xu et al. [15] presented a continuous naive Bayes learning framework for large-scale and multi-domain e-commerce platform product review sentiment classification. They used Amazon product and movie review sentiment datasets in their study. Their experimental results showed that their model could use the knowledge learned from past domains to guide learning in new domains; it had a better capacity for dealing with reviews that were continuously updated and came from different domains. Vanaja et al. [16] performed aspect-level sentiment analysis on Amazon customer review data. They analyzed whether the reviews were positive, negative, or neutral. They stated that they found 0.9023 accuracy using naive Bayes in their comparative analysis. Jabbar et al. [17] presented a real-time sentiment analysis of the product reviews of e-commerce applications. They used SVM to design a model for sentiment analysis of collected review data from Amazon. They labeled reviews as positive or negative. They obtained an F1 score of 0.9354 for the reviews’ sentiment analysis using SVM. Parven et al. [18] performed sentiment analysis on women’s e-commerce reviews using probabilistic latent dirichlet allocation. Tripathi et al. [19] examined the textual content of reviews on e-commerce websites with different helpfulness votes to further classify a new review by collecting reviews from e-commerce websites. They stated that the best accuracy was 0.945, obtained with a random forest classifier. Kumar et al. [20] concentrated on mining reviews from websites such as Amazon. They classified the sentiment of reviews as positive or negative using naive Bayes, logistic regression, and SentiWordNet. They found that naive Bayes proved to be the most efficient for text classification of opinion mining. Miyoshi et al. [21] proposed a method for estimating the semantic orientation of Japanese product reviews. They classified the reviews as positive or negative in their study of a data set containing 1400 reviews. Guan et al. [22] proposed a deep learning framework for review sentiment analysis. They collected reviews from Amazon and classified sentiment as positive or negative. Their deep learning framework achieved 0.877 accuracy on review sentiment analysis. Zhang et al. [12] proposed a directed weighted multi-classification model for e-commerce reviews. They used 10,000 reviews from Amazon Review Data. They used multi-label classification for review sentiment. Their directed weighted model achieved 0.8 average recall. Shoja et al. [23] proposed a deep neural network approach to incorporate customer reviews in developing recommendation systems. They used a dataset from Amazon Review Data containing 142.8 million reviews. Gu et al. [24] proposed a novel sentiment analysis model called MBGCV. In their study, they used 31,107 reviews labeled as positive or negative. Their proposed model achieved 0.94 accuracy on review sentiment analysis. Bilen et al. [25] performed LSTM network-based sentiment analysis on Turkish customer reviews. They used two different datasets for sentiment analysis. They collected a new corpus of approximately 7000 reviews for sentiment analysis of Turkish consumer preferences. They classified the data they collected as either positive or negative using an LSTM-based model, finding 0.905 accuracy for binary sentiment analysis. Vural et al. [26] presented a framework for unsupervised sentiment analysis in Turkish text documents. They applied their framework to the problem of classifying the polarity of movie reviews. Acikalin et al. [27] performed sentiment analysis on Turkish movie and hotel reviews with positive and negative labels using BERT. They stated that the best result they found in their study was 93.3%. Santur [28] performed sentiment analysis on Turkish e-commerce customer reviews using Gated Recurrent Unit, classified the reviews as positive, negative, or neutral, and stated their best result as 0.95 accuracy. Ozyurt et al. [29] performed aspect-based sentiment analysis on Turkish reviews using LDA. They collected 1292 user reviews about smartphones and defined nine aspects for smartphones. They found an F-score of 82.39% in their results.

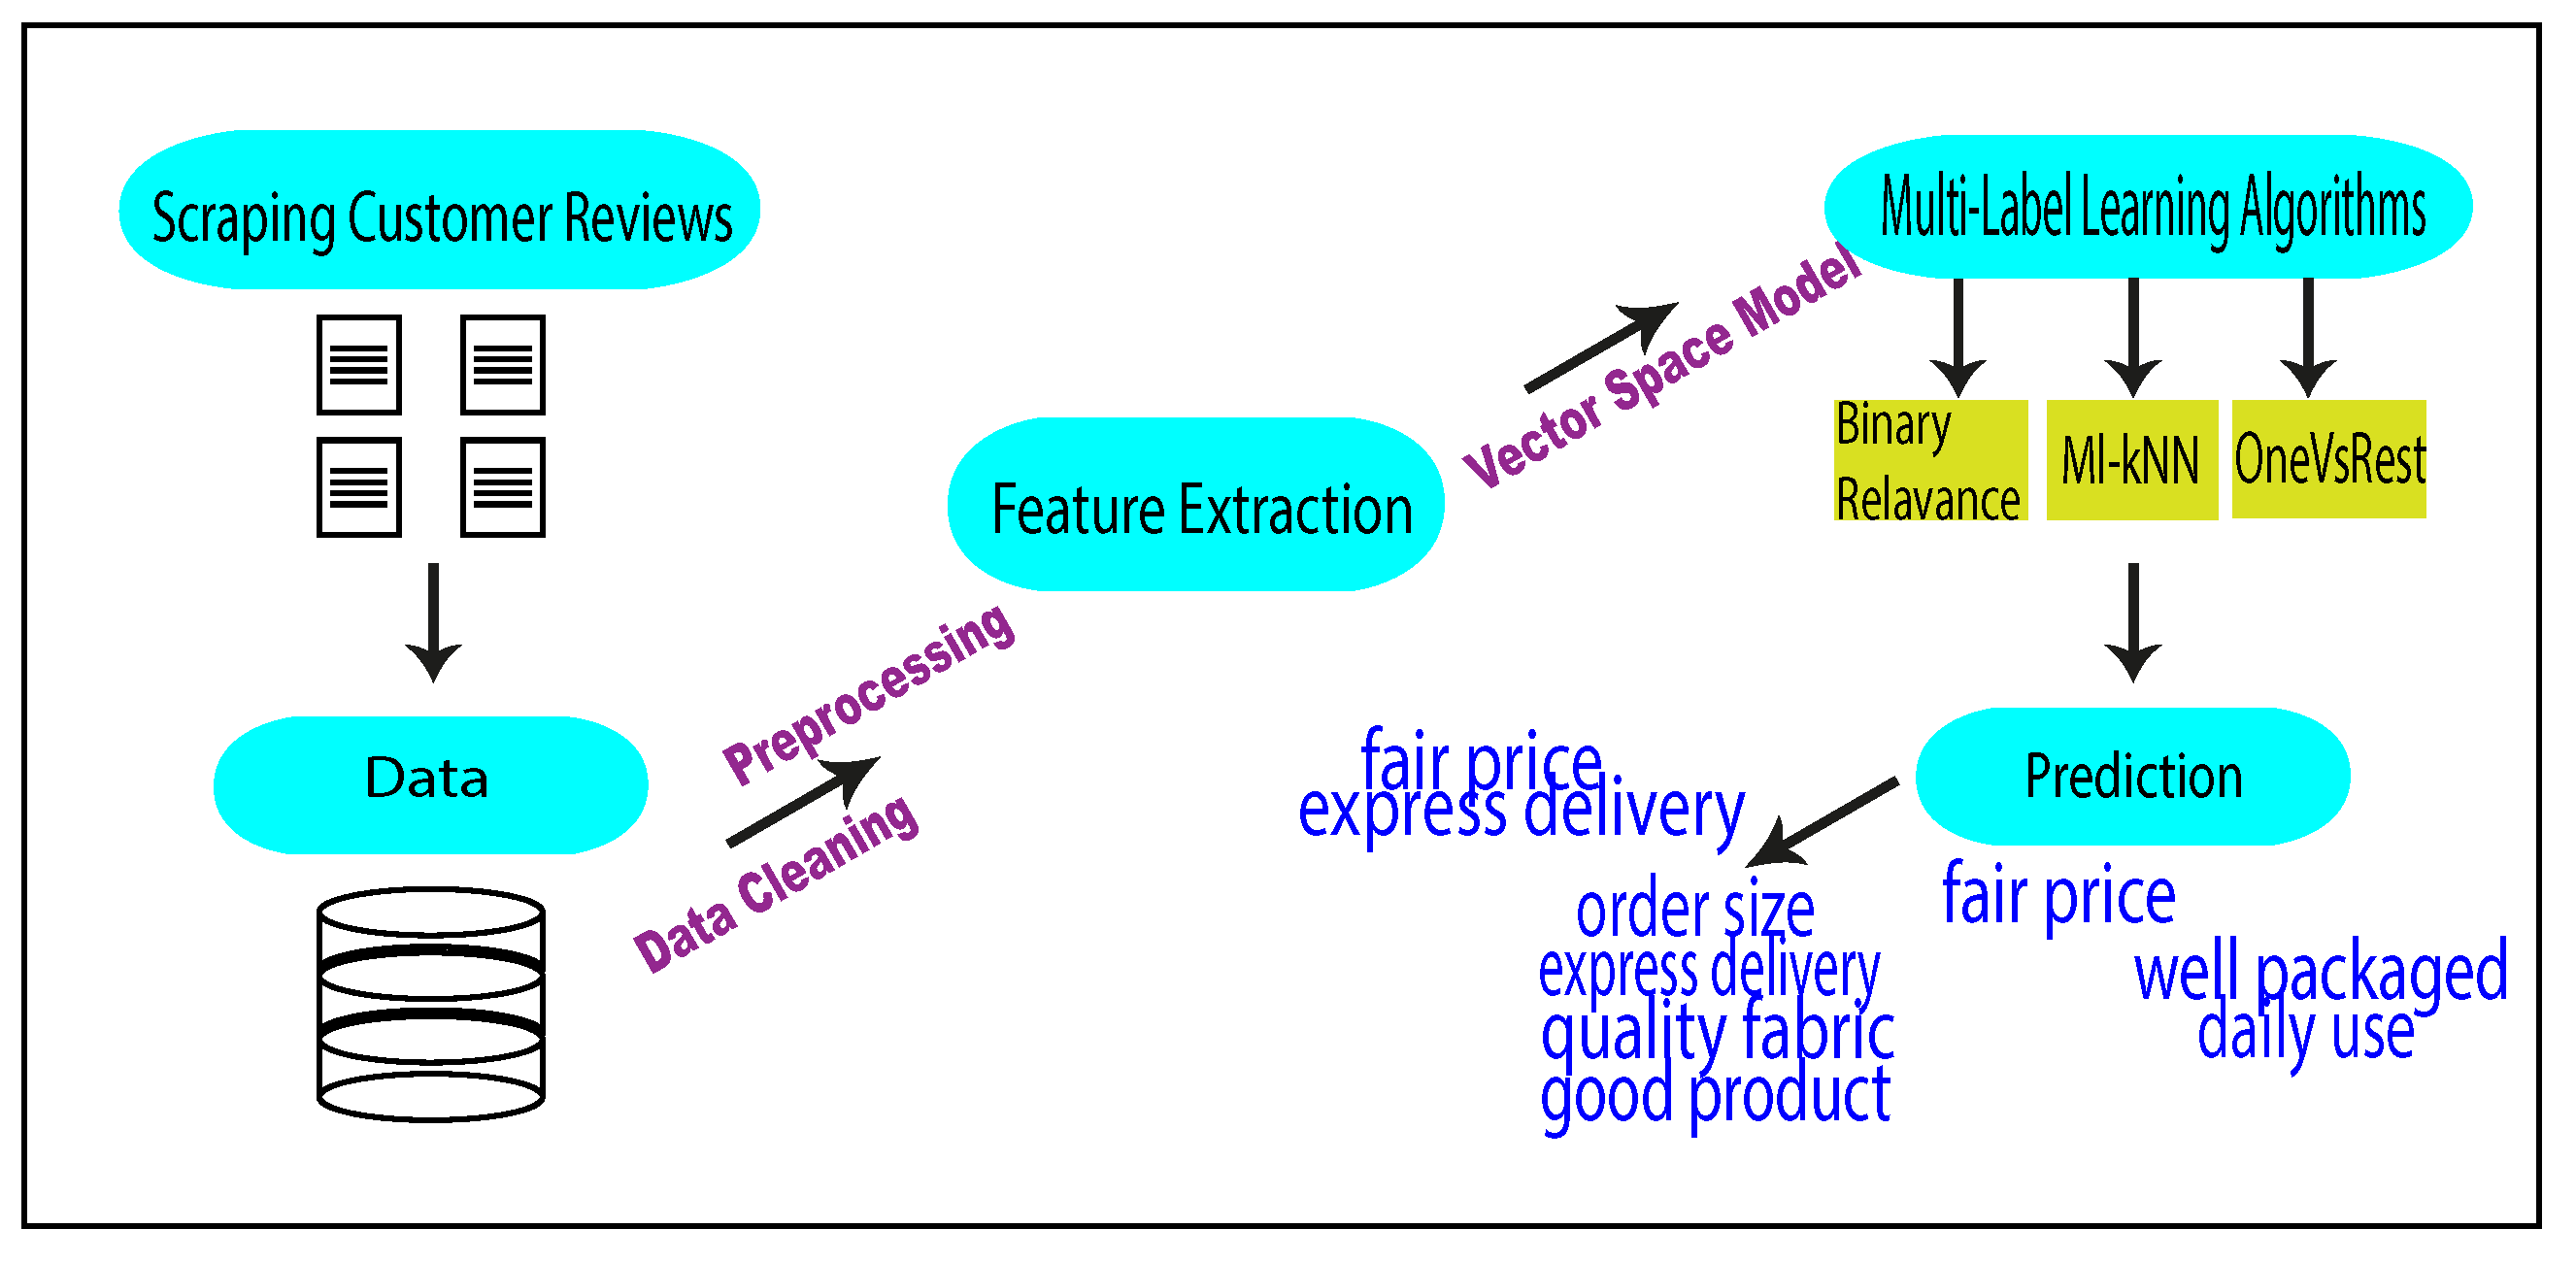
3. Materials and Methods
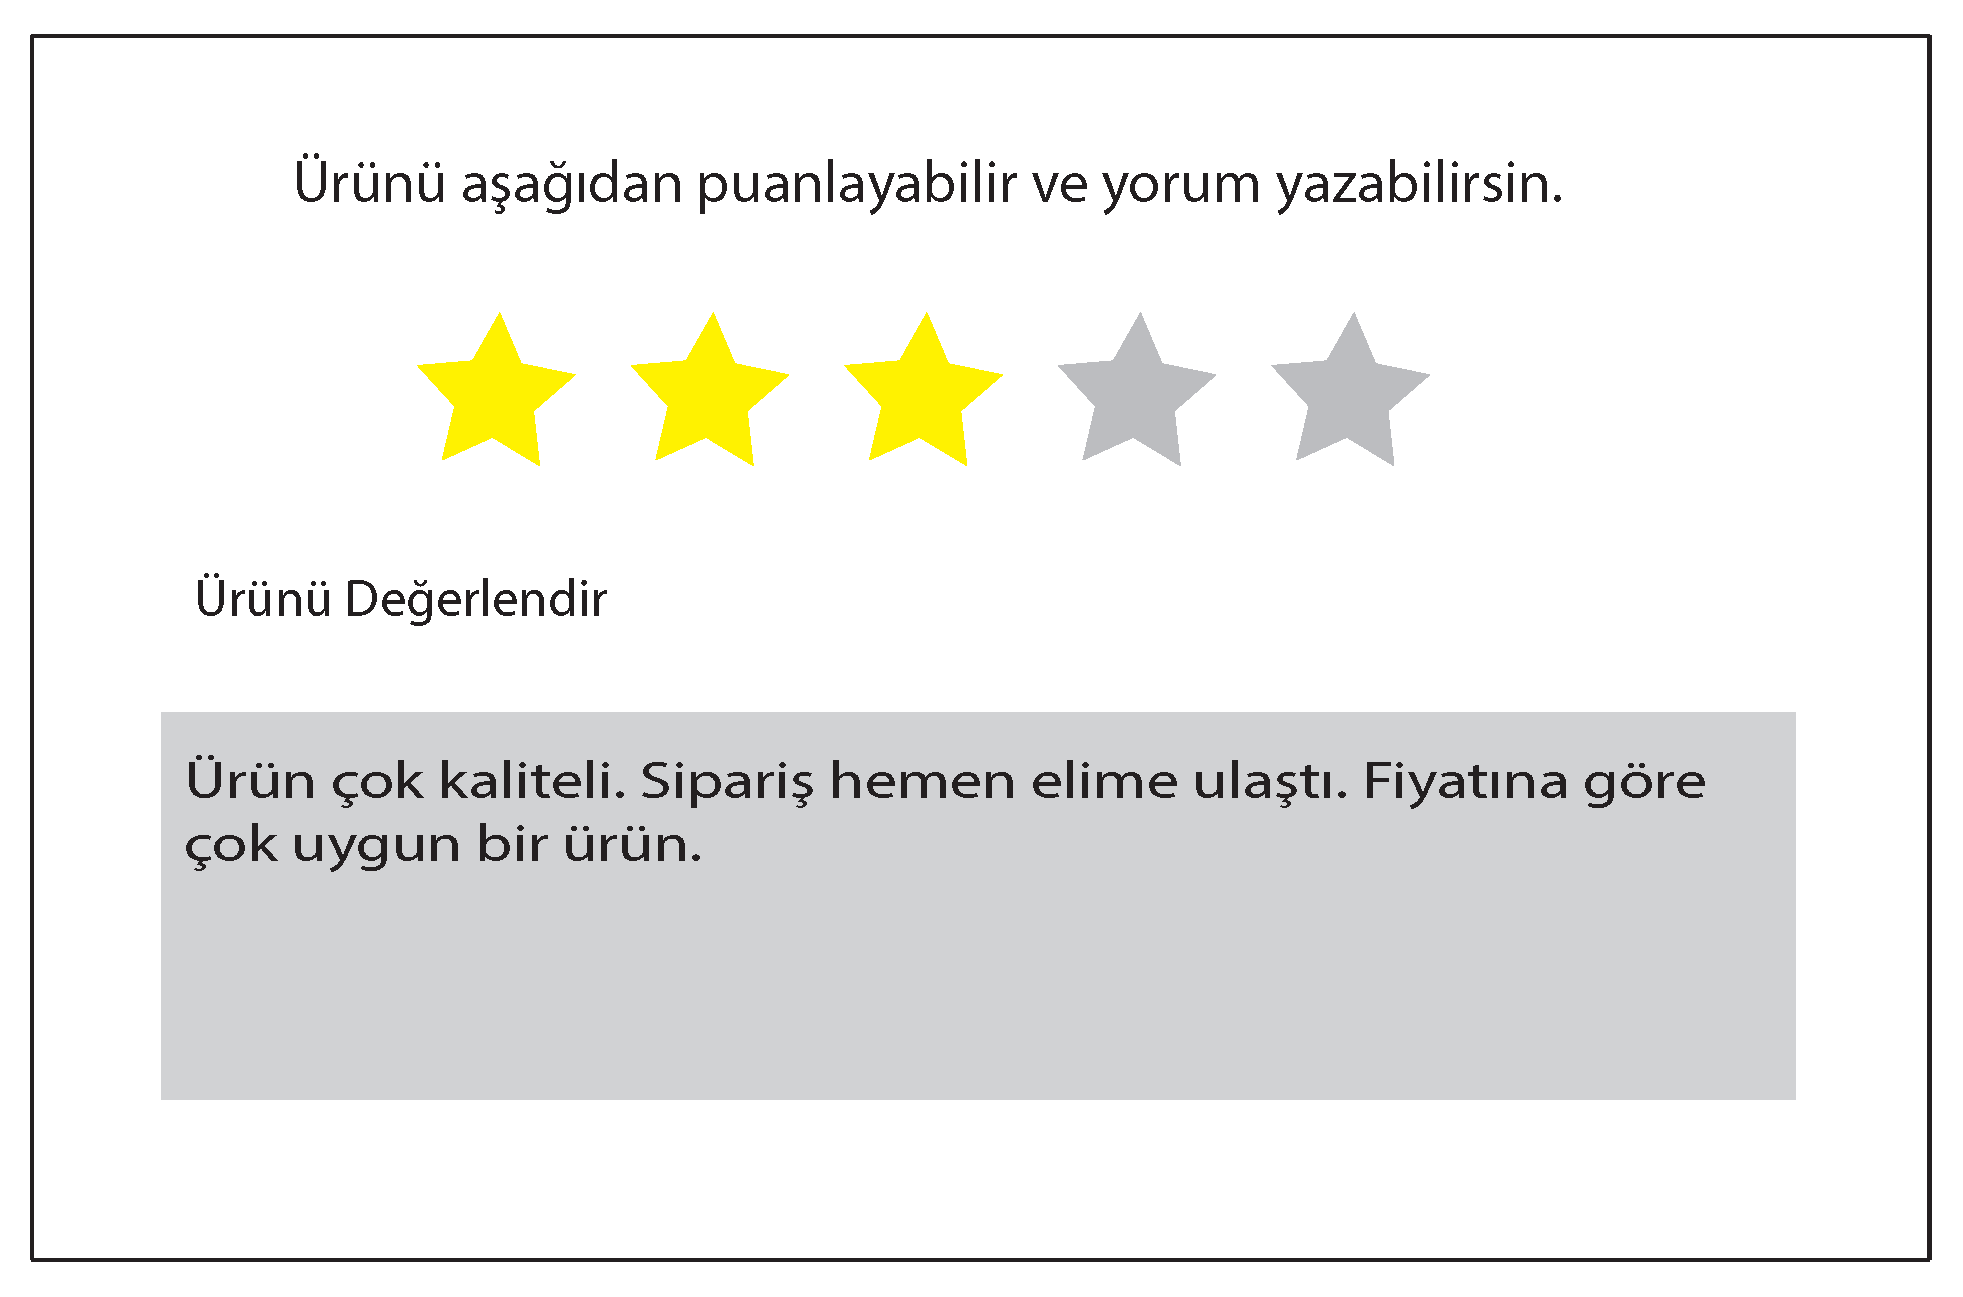
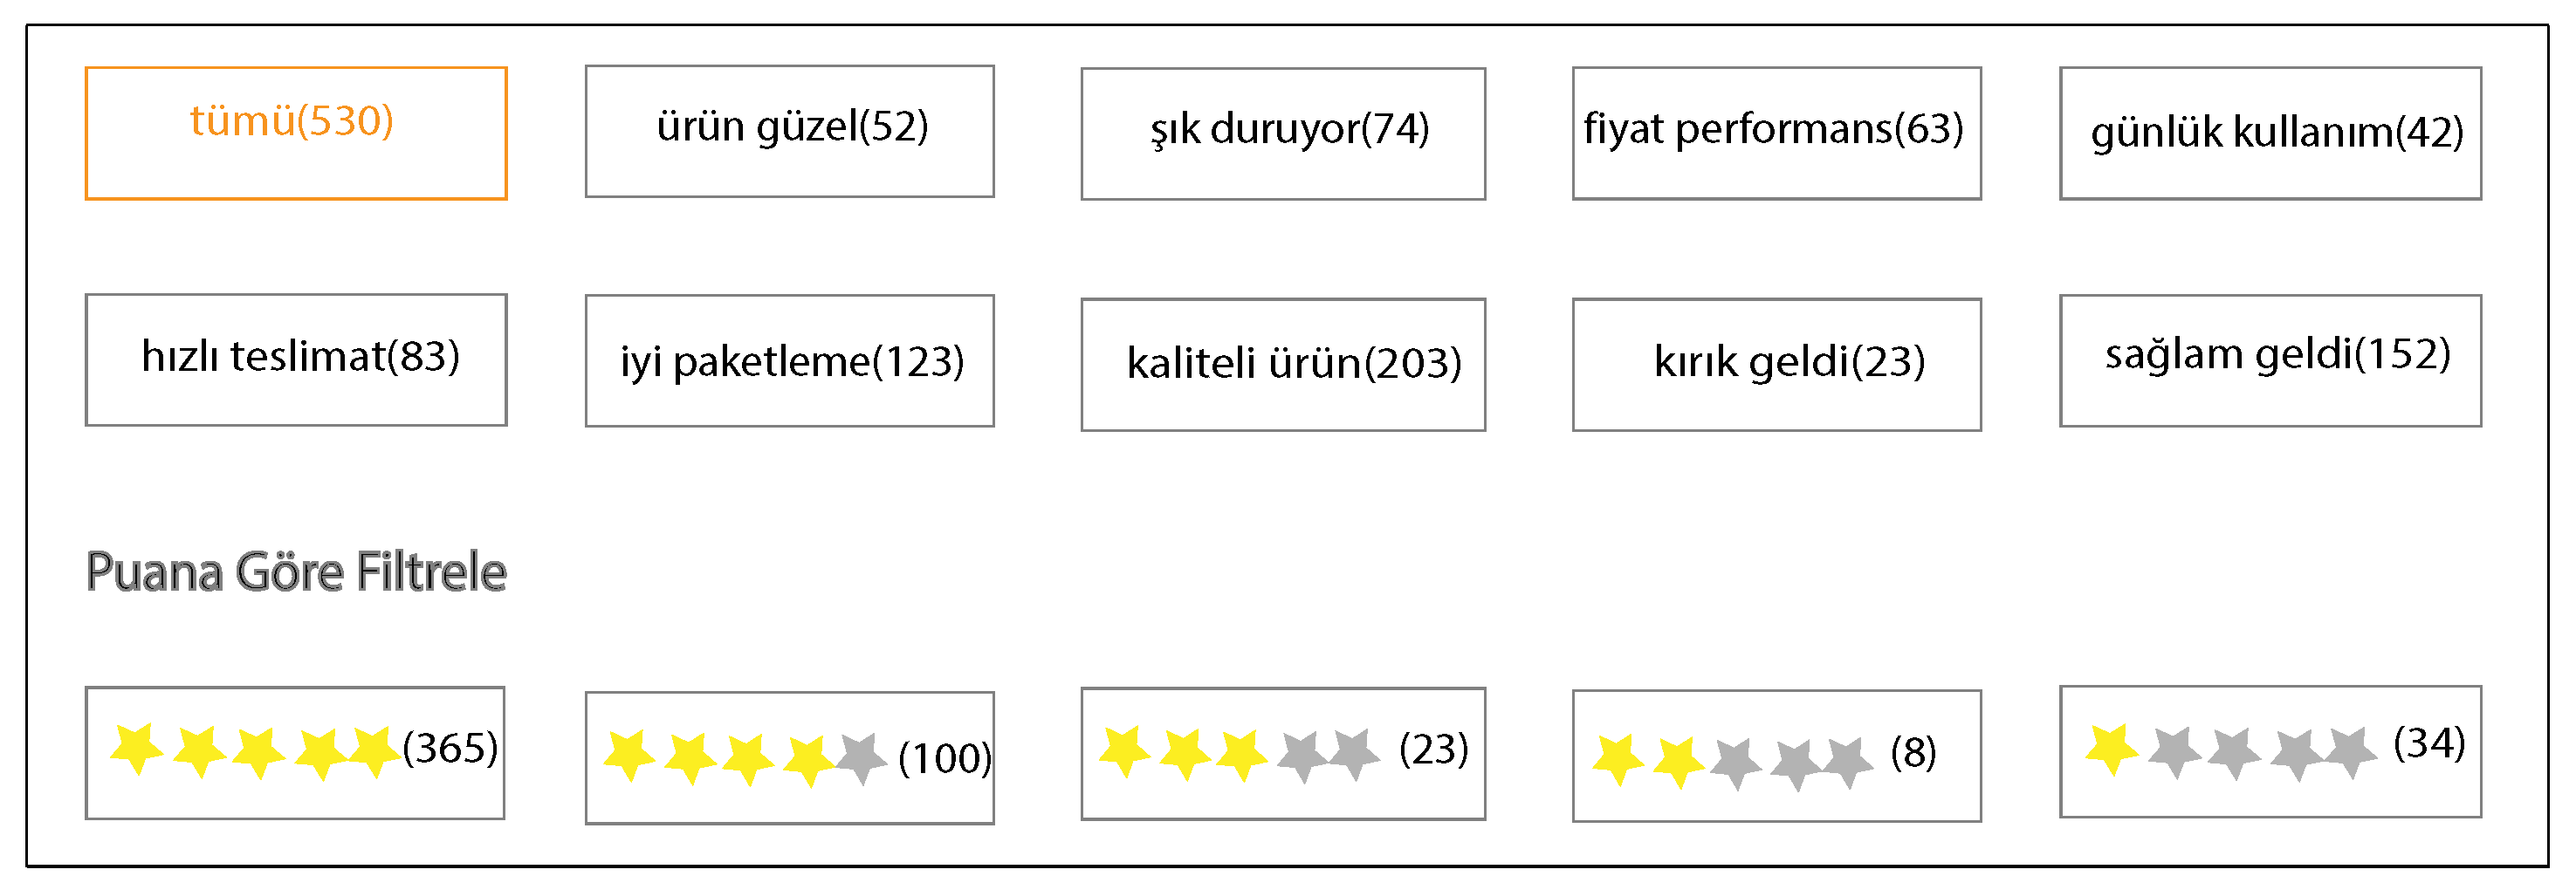
This section details the multi-label classification process for customer reviews. A graphical abstraction of the model we propose in this study is shown in Figure 1. Our proposed model includes data collection, data preprocessing, feature extraction, and testing. The whole procedure is explained in the following three subsections, namely, data, multi-label classifiers, and evaluation criteria.

3.1. Data

In this subsection, the dataset is described in detail. When we examined the available datasets for multi-label classification of e-commerce customer reviews, we found that they focused on sentiment analysis, particularly the polarity of texts. As this is not suitable for multi-label classification, we decided to create a dataset that could be used for multi-label classification. After examining different Turkish e-commerce sites, we decided to use reviews from an e-commerce site (https://www.trendyol.com/, accessed on 13 November 2021) with a review page, shown in Figure 2. The dataset can be accessed at a GitHub link (https://github.com/emredeniz18/data, accessed on 18 Auguest 2022).
We scraped customer reviews using Python’s Selenium (https://pypi.org/project/selenium/, accessed on 13 November 2021) library. As seen in Figure 2, reviewers can rate a product on a scale of one to five, and are able to enter comments. As a result, when customers are searching for a product, they see reviewers’ ratings and comments. In addition, they see labels generated by the site’s software; see Figure 3. When one of the labels is clicked, reviews related to that label are displayed on the page. With the automation we developed, we were able to collect all the reviews about the relevant products by clicking on all the labels one by one. During the data scraping phase, we determined the three categories with the most reviews, which were electronics, women’s wear, and home and life. The statistical values for the dataset are shown in Table 3. There were 51,394 customer reviews in total. The number of reviews and labels in each category varied, with the highest number of reviews belonging to the women’s wear category, with 24,274 and with five different labels. The category with the most labels was home and life.
On the other hand, Table 4, Table 5 and Table 6 present label names, their translations into English, and short descriptions of the electronics, women’s wear, and home and life categories.
Table 7 shows sample comments in the dataset, their translation into English, and corresponding labels generated by the software and then translated into English. Here, we should note that our model used comments listed under the Customer Reviews column and the labels listed under the Labels column.

3.2. Feature Extraction and Data Representation

Feature extraction is a crucial phase in text classification [30]. After raw text data has been cleaned and normalized, the text must be transformed into a feature set of numerical sequence data in order for it to be utilized in developing a text-based classification model. Several different text-based feature extraction techniques exist, including deterministic methods such as TF-IDF and nondeterministic methods such as Word2Vec, GloVe, and BERT.

3.2.1. Term Frequency-Inverse Document Frequency

TF-IDF is a frequency-based measure that evaluates how relevant a word is in a document related to a corpus of documents. TF-IDF takes into account both the occurrence of a word in a single document and its occurrence in the entire corpus. TF-IDF consists of two steps: computing the term frequency (TF), and computing the inverse document frequency (IDF). The TF-IDF formula for a term t of a document d in the corpus is provided by the equation
TF IDF ( t , d ) = TF ( t , d ) × IDF ( t ) .
TF-IDF does not have the ability to capture the contextual meaning of a word, and produces only lexical-level features.

3.2.2. Word2Vec

Frequency-based methods have limited capacity to capture any semantic relationships or context information that exists in a document. Word2Vec is a word representation method based on an artificial neural network that aims to capture the meanings of words; it was proposed by Thomas Mikolov in 2013 [31]. It is a prediction based pre-trained word embedding method. Words are represented by strings of numbers called vectors. It uses two models, Continuous Bag of Words (CBOW) and Skip-Gram. In the CBOW model, the words that are not in the window size center are taken as input and the words in the center are the target to be estimated as output. In the Skip Gram model, words that are in the window size center are taken as input, and words that are not in the center are the target to be estimated as output [31,32]. In this study, word vectors were created with the CBOW model. The size of the word vectors was taken as 256. Words with less than three parameter values were ignored, and the window size was set to 5.

3.2.3. Global Vectors for Word Representation

GloVe, an extension to the Word2Vec model, is an unsupervised learning prediction algorithm for obtaining vector representations of words [33]. It combines global statistics of words with their local context-based meaning derived from the word2vec model. GloVe is a pre-trained word embedding model. Training is performed on aggregated global word-word co-occurrence statistics from a corpus, which means that a word–context matrix is created first. The rows of this matrix represent words, while the columns represent contexts/documents. The size of the matrix is the number of words times the number of contexts. For each word, the value of the corresponding entry in the matrix represents how frequently the word occurs in some context. The word–context matrix is then factored to obtain the word feature matrix, in which each row holds a vector representation for a corresponding word.

3.2.4. Bidirectional Encoder Representations from Transformers

Transformers are contemporary models consisting of six encoders and six decoders with self-care and feed-forward network structures. The most important feature of transformers is their parallel computation [34]. BERT is a pre-trained model that, unlike transformers, evaluates the sentence both from left to right and from right to left for deep contextual understanding of all the words. BERT is trained with two techniques, Masked Language Modeling (MLM) and Next Sentence Prediction (NSP). In the MLM technique, the masked word is the target to be guessed from words that are fed in. In NSP, the goal is to estimate whether a second sentence is a continuation of the first sentence in a pair of sentences that are paired during the training phase [35]. One of the most important features of deep learning is that the learned features can be transferred to the solution of new problems by fine-tuning. The model was pre-trained on a dataset provided by Kemal Oflazer. The size of the last training corpus was 35 GB and had 4,404,976,662 tokens [36]. The configuration values of the model are provided in Table 8.

3.3. Multi-Label Classifiers

Multi-label classification can be thought of as an extension of traditional single-label classification in which labels are not mutually exclusive and each sample can have several labels simultaneously. In other words, each sample is associated with a set of appropriate labels. Numerous approaches have been suggested in the literature to solve multi-label learning problems. These can be collected into three categories: (1) problem transformation approaches, (2) problem adaptation algorithms, and (3) ensemble methods [37]. The methods in problem transformation approaches divide the multi-label problem into one or more traditional single-label classification problems. Then, solutions to these problems are merged to solve the initial multi-label learning problem. The methods in problem adaptation algorithms generalize single-label algorithms to cope with multi-labeled data directly. Finally, ensemble methods incorporate the benefits of both approaches.
On the other hand, there are three principal methods in problem transformation approaches: Binary relevance (one-against-all strategy) [38], label powerset, and label ranking. Binary relevance (BR) decomposes the multi-label classification problem into a number of independent binary classification problems. Table table:binaryrelevance shows the BR decomposition of our initial dataset. Table 9a represents the initial form of the dataset. Observe that BR treats each label as a separate single-label classification problem; thus, Table 9b–e are decomposed from the initial form of the dataset into single classes in order to split the multi-label learning task into a series of independent binary learning tasks, with each binary classification problem corresponding to one class label in the label space. Then, each single-label classification problem is solved using traditional methods and the solutions are merged to solve the initial multi-label learning problem. To explain this process mathematically, we denote the d-dimensional feature space as χ = d and the label space as γ = { λ 1 , λ 1 , , λ q } containing q class labels. In this case, for each multi-label training example x i , y i , x i χ is a d-dimensional feature vector and y i { 1 , + 1 } q is a q-bit binary vector, with y j i being an appropriate or unrelated label for x i . Equally, the set of related labels Y i γ for x i corresponds to Y i = { λ j | y j i = + 1 , 1 j q } . For an unknown instance x * χ , its related label set Y * is predicted as Y * = f ( x * ) γ .
We employed eight different methods in this study: BR-RF, BR-SVC, BR-NB, Ml-kNN, OvsR-LR, OvsR-SGD, OvsR-SVC, and OvsXGB.

3.4. Evaluation Metrics

Multi-label classification requires different metrics than the evaluation techniques used in traditional single-label classification [39]. In our study, we used the Hamming Loss (HL), Micro Averaged Precision (MicroP), Macro Averaged Precision (MacroP), Micro Averaged Recall (MicroR), Macro Averaged Recall (MacroR), Micro F1 Score (MicroF1), and Macro F1 Score (MacroF1) measurement metrics to analyze the test results.
H L = 1 | N | · | L | l = 1 L i = 1 N Y i , l X i , l .
Hamming loss refers to the fraction of incorrectly predicted labels in a classification model. As HL is a loss function, the optimal value is zero and the upper bound is one.
M i c r o P = c i C T P s ( c i ) c i C T P s ( c i ) + F P s ( c i ) ·
Micro-averaged precision measures the precision of the collective contributions of all classes. The MicroP is obtained by first calculating the sum of all true positives and false positives over all classes. Then, the precision can be calculated for the sums.
M a c r o R = c i C T P s ( c i ) c i C T P s ( c i ) + F N s ( c i ) ·
Macro-averaged recall measures the average recall per class. To calculate the MacroR, we first calculate the recall value of each class. Then, the MacroR value is calculated by taking the average of all the recall values found.
M a c r o P = c i C P ( D , c i ) | C | ·
Macro-averaged precision refers to the average precision per class. To find the macro-averaged precision, the precision of each class is first calculated. The MacroP value is then obtained by averaging all of the precisions.
M a c r o R = c i C R ( D , c i ) | C | ·
Macro-averaged recall refers to the average recall per class. To calculate MacroR, the recall of each class must first be calculated. The MacroR is then obtained by averaging all the recalls.
M i c r o F 1 = 2 · M i c r o P · M i c r o R M i c r o P + M i c r o R ·
Micro-averaged F1 score indicates the F1 score of the aggregated contributions of all classes. The micro-averaged F1-score is obtained by first calculating the sum of all true positives, false positives, and false negatives over all of the labels. Then, the MicroP and MicroR are computed from the sums. Finally, the harmonic mean is computed to obtain the Micro-F1 score.
M a c r o F 1 = 1 N i = 0 N F 1 ·
The macro-averaged F1 score shows the mean of the label-wise F1 scores. The macro-F1 score is obtained by first calculating the F1 score per label and then averaging them.

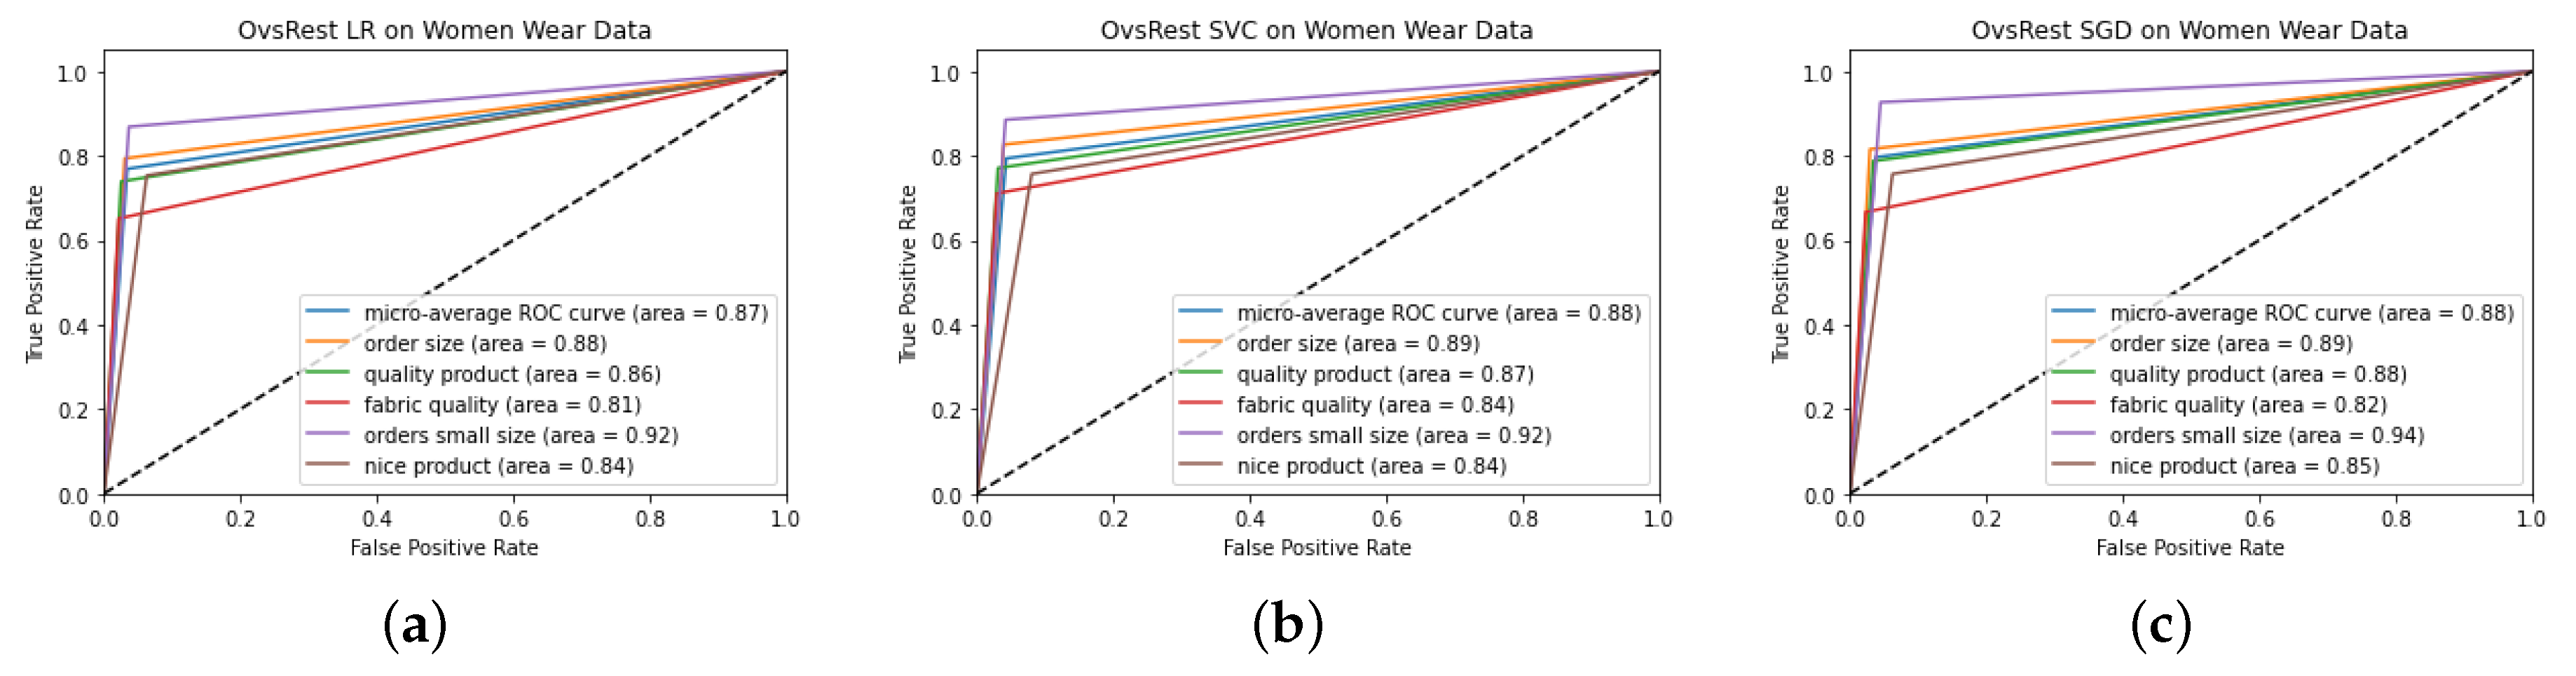
4. Experimental Results and Discussion

We classified customer reviews using Binary Relevance Classifier, OnevsRestClassifier, and ML-kNN. We analyzed the dataset we created with seven different algorithms in total. We used seven different measurement metrics for evaluation and three different feature extraction techniques. First, we applied TF-IDF, second, mean word embedding using Word2Vec and GloVe, and finally, sentence transformation using Turkish BERT on three datasets. For each dataset, we show the results obtained with TF-IDF in a separate table and the results with traditional word embeddings and transformers in another table. Table 10, Table 11, Table 12, Table 13, Table 14 and Table 15 show our results on e-commerce customer review data.
Table 10 shows the detailed results obtained for the electronics dataset. For this dataset, the minimum HL achieved was 0.0497 with OvsR-XGB. It can be seen that the best Micro-F1 score is obtained with OvsR-XGB as 0, and the best Micro-P value is achieved with BR-RF as 0.914. From these test results, it can be understood that the most unsuccessful methods are BR-NB and Ml-kNN. As can be seen in Table 11, the results obtained with embedding and sentence transformers achieved a lower success rate, unlike the results obtained with TF-IDF. It can be seen that the sentence transformers model created using BERT is more successful than the traditional word embedding methods. Furthermore, GloVe achieves better results than Word2Vec with traditional word embedding methods. In all feature extractions, it was determined that the best classification results were obtained with XGBoost.
Table 12 shows the detailed results obtained for the women’s wear dataset. For the women’s wear dataset, the minimum HL achieved was 0.0615 with OvsR-XGB. As with electronic data, it can be seen that the BR-RF algorithm had the most successful Micro-P value at 0.9042, and that BR-NB had high loss and low success on the women’s wear dataset. When examining the MLkNN results for this dataset, it can be seen that this algorithm is less successful on the women’s wear dataset compared to other datasets. We determined that the evaluation metrics of the quality fabric label belonging to the women’s wear dataset were obtained unsuccessfully with MLkNN. As can be seen in Table 13, the results obtained with embeddings and sentence transformers were less successful, as with the electronic data set, unlike the results obtained with TF-IDF.
Table 14 shows the detailed results obtained for the home and life dataset. For the home and life dataset, The minimum HL achieved was 0.0278 with OvsR-XGB. Unlike other datasets, the best micro P value for this dataset was 0.907 with OvsR-LR when using TF-IDF. It can be seen that BR-NB had high loss and low success on the home and life dataset. It is important that the lowest value of HL was obtained on this data set, because as we stated in Table 3, the dataset with the most labels is the home and life dataset. As can be seen in Table 15, the micro precision value obtained with BR-RF BERT was found to be 0.9157, which passed the classification performance with TF-IDF.
According to Table 11, Table 13 and Table 15, it can be seen that the use of TF-IDF is more appropriate than the average word embeddings and sentence transformers for this task. For traditional embedding methods, it can be seen that GloVe provides more successful results than Word2Vec. Again, obtaining the micro-P value on the most labeled dataset with BERT shows that the state of the art techniques leave the traditional methods behind as the complexity of the studied data increases.
Figure 4, Figure 5 and Figure 6 show the ROC curves of the results obtained during the experimentation process. At first glance, it can be seen that the best ROC result was obtained on the home and life dataset, at 0.92 with SGD in Figure 6c. It can be observed that the ROC curves obtained on the women’s wear dataset were lower than the other two datasets. When comparing the ROC curve results with the detailed test results in Table 10, Table 12 and Table 14, it can be seen that the most successful results were obtained on the home and life dataset. Considering the label numbers and evaluation numbers of the datasets in Table 2, it can be seen that the home and life dataset was successfully classified, as there are fewer reviews and more labels. As more comments bring more width and textual diversity to the dataset, there is a decrease in the success rate of our proposed model. On the other hand, it can be seen from the experimental analyses that our proposed model achieves successful results and low losses even when the number of labels increases.
In comparing our study with previous studies in the literature, it is notable that polarity analysis was performed in almost all of the existing studies. Customer review analysis was performed on Turkish datasets in [25,26,27,28,29]. Of these, only [29] performed multi-label analysis; all the others conducted polarity analysis. We can infer that the multi-label customer review datasets utilized in the studies listed in the literature are of a modest size. The datasets used in studies [12,29] where multi-label customer reviews analysis was performed contained 10,000 and 1,292 customer reviews, respectively. The dataset we created for our experiments consists of 51,394 reviews in total. For multi-label customer review analysis, the most successful stated results are 0.8 recall in [12] and 0.82 F1-score in [29]. In our tests, we obtained results of 0.9157 microP, 0.8837 microR, and 0.8925 micro-F1 as our most successful values.

5. Conclusions

In this study, we have realized a new perspective on e-commerce customer reviews, which are typically analyzed for emotion. Here, we have introduced feature-based multi-label classification for customer reviews. We turned the review analysis problem into a multi-class and labeled topic modeling problem, and created a new corpus in order to perform this analysis. The ideas and conclusions of our model are significant because they can facilitate e-commerce for consumers and businesses as well as point researchers in the right direction. Finally, this study, which we tested using fundamental machine learning algorithms, can be further developed with different deep learning algorithms and interpretability models in subsequent investigations, potentially leading to more fruitful outcomes.

Author Contributions

Conceptualization, H.E.; methodology, M.C.; software, E.D.; validation, H.E.; formal analysis, M.C.; investigation, E.D.; resources, M.C.; data curation, E.D.; writing—original draft preparation, E.D.; writing—review and editing, H.E.; visualization, M.C.; supervision, H.E. and M.C. All authors have read and agreed to the published version of the manuscript.

Funding

This research received no external funding.

Institutional Review Board Statement

Not applicable.

Informed Consent Statement

Not applicable.

Data Availability Statement

The dataset can be accessed via this link: https://github.com/emredeniz18/Data, accessed on 18 August 2022.

Conflicts of Interest

The authors declare no conflict of interest.

Abbreviations

The following abbreviations are used in this manuscript:
NLPNatural Language Processing
BRBinary Relevance
SVMSupport Vector Machine
RFRandom Forest
LRLinear Regression
SVCSupport Vector Classifier
SGDStochastic Gradient Descent
HLHamming Loss
Ml-kNNMulti-Label k Nearest Neighbours

References

  1. Kowsari, K.; Jafari Meimandi, K.; Heidarysafa, M.; Mendu, S.; Barnes, L.; Brown, D. Text classification algorithms: A survey. Information 2019, 10, 150. [Google Scholar] [CrossRef]
  2. Rusli, A.; Young, J.C.; Iswari, N.M.S. Identifying fake news in Indonesian via supervised binary text classification. In Proceedings of the 2020 IEEE International Conference on Industry 4.0, Artificial Intelligence, and Communications Technology (IAICT), Bali, Indonesia, 7–8 July 2020; IEEE: Piscataway, NJ, USA, 2020; pp. 86–90. [Google Scholar]
  3. Al-Rawashdeh, G.; Mamat, R.; Abd Rahim, N.H.B. Hybrid water cycle optimization algorithm with simulated annealing for spam e-mail detection. IEEE Access 2019, 7, 143721–143734. [Google Scholar] [CrossRef]
  4. Shehnepoor, S.; Salehi, M.; Farahbakhsh, R.; Crespi, N. NetSpam: A network-based spam detection framework for reviews in online social media. IEEE Trans. Inf. Forensics Secur. 2017, 12, 1585–1595. [Google Scholar] [CrossRef]
  5. Alterkavı, S.; Erbay, H. Novel authorship verification model for social media accounts compromised by a human. Multimed. Tools Appl. 2021, 80, 13575–13591. [Google Scholar] [CrossRef]
  6. Alterkavı, S.; Erbay, H. Design and Analysis of a Novel Authorship Verification Framework for Hijacked Social Media Accounts Compromised by a Human. Secur. Commun. Netw. 2021, 2021, 8869681. [Google Scholar] [CrossRef]
  7. Liu, S.; Cheng, X.; Li, F.; Li, F. TASC: Topic-adaptive sentiment classification on dynamic tweets. IEEE Trans. Knowl. Data Eng. 2014, 27, 1696–1709. [Google Scholar] [CrossRef]
  8. Esposito, F.; Corazza, A.; Cutugno, F. Topic Modelling with Word Embeddings. In Proceedings of the Third Italian Conference on Computational Linguistics (CLiC-it 2016) & Fifth Evaluation Campaign of Natural Language Processing and Speech Tools for Italian. Final Workshop (EVALITA 2016), Napoli, Italy, 5–7 December 2016. [Google Scholar]
  9. Leeuwenberg, A.; Vela, M.; Dehdari, J.; van Genabith, J. A minimally supervised approach for synonym extraction with word embeddings. Prague Bull. Math. Linguist. 2016, 105, 111. [Google Scholar] [CrossRef]
  10. WPForms. 68 Useful eCommerce Statistics You Must Know in 2022. Available online: https://wpforms.com/ecommerce-statistics/ (accessed on 4 August 2022).
  11. Nasdaq. UK Online Shopping and E-Commerce Statistics for 2017. Available online: https://www.nasdaq.com/articles/uk-online-shopping-and-e-commerce-statistics-2017-2017-03-14 (accessed on 4 August 2022).
  12. Zhang, S.; Zhang, D.; Zhong, H.; Wang, G. A multiclassification model of sentiment for E-commerce reviews. IEEE Access 2020, 8, 189513–189526. [Google Scholar] [CrossRef]
  13. Medhat, W.; Hassan, A.; Korashy, H. Sentiment analysis algorithms and applications: A survey. Ain Shams Eng. J. 2014, 5, 1093–1113. [Google Scholar] [CrossRef]
  14. Muslim, M.A. Support vector machine (svm) optimization using grid search and unigram to improve e-commerce review accuracy. J. Soft Comput. Explor. 2020, 1, 8–15. [Google Scholar]
  15. Xu, F.; Pan, Z.; Xia, R. E-commerce product review sentiment classification based on a naïve Bayes continuous learning framework. Inf. Process. Manag. 2020, 57, 102221. [Google Scholar] [CrossRef]
  16. Vanaja, S.; Belwal, M. Aspect-level sentiment analysis on e-commerce data. In Proceedings of the 2018 International Conference on Inventive Research in Computing Applications (ICIRCA), Coimbatore, India, 11 July 2018; IEEE: Piscataway, NJ, USA, 2018; pp. 1275–1279. [Google Scholar]
  17. Jabbar, J.; Urooj, I.; JunSheng, W.; Azeem, N. Real-time sentiment analysis on E-commerce application. In Proceedings of the 2019 IEEE 16th International Conference on Networking, Sensing and Control (ICNSC), Banff, AB, Canada, 9–11 May 2019; IEEE: Piscataway, NJ, USA, 2019; pp. 391–396. [Google Scholar]
  18. Parveen, N.; Santhi, M.; Burra, L.R.; Pellakuri, V.; Pellakuri, H. Women’s e-commerce clothing sentiment analysis by probabilistic model LDA using R-SPARK. Mater. Today Proc. 2021, in press. [CrossRef]
  19. Tripathi, P.; Singh, S.; Chhajer, P.; Trivedi, M.C.; Singh, V.K. Analysis and prediction of extent of helpfulness of reviews on E-commerce websites. Mater. Today Proc. 2020, 33, 4520–4525. [Google Scholar] [CrossRef]
  20. Kumar, K.S.; Desai, J.; Majumdar, J. Opinion mining and sentiment analysis on online customer review. In Proceedings of the 2016 IEEE International Conference on Computational Intelligence and Computing Research (ICCIC), Chennai, India, 15–17 December 2016; IEEE: Piscataway, NJ, USA, 2016; pp. 1–4. [Google Scholar]
  21. Miyoshi, T.; Nakagami, Y. Sentiment classification of customer reviews on electric products. In Proceedings of the 2007 IEEE International Conference on Systems, Man and Cybernetics, Banff, AB, Canada, 5–8 October 2017; IEEE: Piscataway, NJ, USA, 2007; pp. 2028–2033. [Google Scholar]
  22. Guan, Z.; Chen, L.; Zhao, W.; Zheng, Y.; Tan, S.; Cai, D. Weakly-Supervised Deep Learning for Customer Review Sentiment Classification. In Proceedings of the Twenty-Fifth International Joint Conference on Artificial Intelligence (IJCAI-16), New York, NY, USA, 9–15 July 2016; pp. 3719–3725. [Google Scholar]
  23. Shoja, B.M.; Tabrizi, N. Customer reviews analysis with deep neural networks for e-commerce recommender systems. IEEE Access 2019, 7, 119121–119130. [Google Scholar] [CrossRef]
  24. Gu, T.; Xu, G.; Luo, J. Sentiment analysis via deep multichannel neural networks with variational information bottleneck. IEEE Access 2020, 8, 121014–121021. [Google Scholar] [CrossRef]
  25. Bİlen, B.; Horasan, F. LSTM network based sentiment analysis for customer reviews. Politek. Derg. 2021. [Google Scholar] [CrossRef]
  26. Vural, A.G.; Cambazoglu, B.B.; Senkul, P.; Tokgoz, Z.O. A framework for sentiment analysis in turkish: Application to polarity detection of movie reviews in turkish. In Computer and Information Sciences III; Springer: Berlin/Heidelberg, Germany, 2013; pp. 437–445. [Google Scholar]
  27. Acikalin, U.U.; Bardak, B.; Kutlu, M. Turkish sentiment analysis using bert. In Proceedings of the 2020 28th Signal Processing and Communications Applications Conference (SIU), Gaziantep, Turkey, 5–7 October 2020; IEEE: Piscataway, NJ, USA, 2020; pp. 1–4. [Google Scholar]
  28. Santur, Y. Sentiment analysis based on gated recurrent unit. In Proceedings of the 2019 International Artificial Intelligence and Data Processing Symposium (IDAP), Malatya, Turkey, 21–22 September 2019; IEEE: Piscataway, NJ, USA, 2019; pp. 1–5. [Google Scholar]
  29. Ozyurt, B.; Akcayol, M.A. A new topic modeling based approach for aspect extraction in aspect based sentiment analysis: SS-LDA. Expert Syst. Appl. 2021, 168, 114231. [Google Scholar] [CrossRef]
  30. Kadhim, A.I. Term weighting for feature extraction on Twitter: A comparison between BM25 and TF-IDF. In Proceedings of the 2019 International Conference on Advanced Science and Engineering (ICOASE), Zakho, Iraq, 2–4 April 2019; IEEE: Piscataway, NJ, USA, 2019; pp. 124–128. [Google Scholar]
  31. Mikolov, T.; Chen, K.; Corrado, G.; Dean, J. Efficient estimation of word representations in vector space. arXiv 2013, arXiv:1301.3781. [Google Scholar]
  32. Mikolov, T.; Sutskever, I.; Chen, K.; Corrado, G.S.; Dean, J. Distributed representations of words and phrases and their compositionality. Adv. Neural Inf. Process. Syst. 2013, 26, 3111–3119. [Google Scholar]
  33. Pennington, J.; Socher, R.; Manning, C.D. GloVe: Global vectors for word representation. In Proceedings of the 2014 Conference on Empirical Methods in Natural Language Processing (EMNLP), Doha, Qatar, 25–29 October 2014; pp. 1532–1543. [Google Scholar]
  34. Vaswani, A.; Shazeer, N.; Parmar, N.; Uszkoreit, J.; Jones, L.; Gomez, A.N.; Kaiser, Ł.; Polosukhin, I. Attention is all you need. In Proceedings of the Advances in Neural Information Processing Systems 30, Long Beach, CA, USA, 4–9 December 2017. [Google Scholar]
  35. Devlin, J.; Chang, M.W.; Lee, K.; Toutanova, K. Bert: Pre-training of deep bidirectional transformers for language understanding. arXiv 2018, arXiv:1810.04805. [Google Scholar]
  36. Schweter, S. Berturk-Bert Models for Turkish. Zenodo 2020, 2020, 3770924. [Google Scholar] [CrossRef]
  37. Zhang, M.L.; Zhou, Z.H. A review on multi-label learning algorithms. IEEE Trans. Knowl. Data Eng. 2013, 26, 1819–1837. [Google Scholar] [CrossRef]
  38. Zhang, M.L.; Li, Y.K.; Liu, X.Y.; Geng, X. Binary relevance for multi-label learning: An overview. Front. Comput. Sci. 2018, 12, 191–202. [Google Scholar] [CrossRef]
  39. Tsoumakas, G.; Katakis, I. Multi-label classification: An overview. Int. J. Data Warehous. Min. (IJDWM) 2007, 3, 1–13. [Google Scholar] [CrossRef] [Green Version]
Figure 1. Proposed method for multi-label classification of e-commerce customer reviews using machine learning.
Axioms 11 00436 g001
Figure 2. E-commerce web site customer reviews page template.
Axioms 11 00436 g002
Figure 3. Snapshot from the e-commerce website showing ratings and labels.
Axioms 11 00436 g003
Figure 4. ROC curves obtained for women’s wear dataset: (a) linear regression; (b) support vector classifier; (c) stochastic gradient descent.
Axioms 11 00436 g004
Figure 5. ROC curves obtained for electronics dataset: (a) linear regression; (b) support vector classifier; (c) stochastic gradient descent.
Axioms 11 00436 g005
Figure 6. ROC curves obtained for home and life dataset: (a) linear regression; (b) support vector classifier; (c) stochastic gradient descent.
Axioms 11 00436 g006
Table 1. Text classification types in the literature.
Classification TypeTaskLabels
BinarySpam FilterHam, Spam
Multi-classSentiment AnalysisPositive, Neutral, Negative
Multi-labelToxic Comment DetectionThreat, Toxic, Obscene, Insult
Table 2. E-commerce customer review classification methods and possible labels.
Binary ClassificationMulti-Class ClassificationMulti-Label Classification
  • Spam Review
  • Normal Review
  • Positive Review
  • Neutral Review
  • Negative Review
  • Fabric quality
  • Order size
  • Order small size
  • Express delivery
  • Price performance
Table 3. Statistics for the collected datasets.
Data SetNumber of ReviewNumber of Labels
Electronics14,5576
Women’s Wear24,2745
Home and Life12,56310
Table 4. Label names of electronics data.
Label NameEnglish TranslationDescription
ürün güzelnice productReviews with this label indicate that the product is liked by the user and found to be nice.
fiyat/performansprice/performanceReviews with this label state the product as a price performance product.
hızlı teslimatexpress deliveryReviews with this label indicate that the product was delivered quickly.
iyi paketlemewell packagingReviews with this label indicate that the cargo packaging of the product is good.
kaliteli ürünquality productReviews with this label indicate the quality of the product.
uygun fiyatfair priceReviews with this label indicate that the price of the product is appropriate.
Table 5. Label names for women’s wear data.
Label NameEnglish TranslationDescription
ürün güzelnice productReviews with this label indicate that the product is liked by the user and found to be nice.
bedeninizi alınorder sizeReviews with this label advise other users to order the size they usually wear.
küçük alınabilirorder small sizeReviews with this label advise other users to order a size smaller than the size they usually wear.
kaliteli ürünquality productReviews with this label indicate the quality of the product.
kumaş kalitesifabric qualityReviews with this label provide information about the fabric quality of the product.
Table 6. Label names for home and life data.
Label NameEnglish TranslationDescription
ürün güzelnice productReviews with this label indicate that the product is liked by the user and found to be nice.
şık duruyorlooks stylishReviews with this label indicate that the product looks stylish.
fiyat/performansprice/performanceReviews with this label state the product as a price performance product.
günlük kullanımdaily useReviews with this label indicate whether the product is suitable for daily use.
hızlı teslimatexpress deliveryReviews with this label indicate that the product was delivered quickly.
iyi paketlemewell packagingReviews with this label indicate that the cargo packaging of the product is good.
kaliteli ürünquality productReviews with this label indicate the quality of the product.
kırık geldibrokenReviews with this label indicate that the product arrived broken.
sağlam geldisolidReviews with this label indicate that the product arrived solid.
uygun/fiyatfair priceReviews with this label indicate that the price of the product is appropriate.
Table 7. Our created dataset for multi-label customer reviews classification.
Orjinal DataTranslation to English
Customer ReviewsLabelsCustomer ReviewsLabels
Ürünü bizde yorumlar üzerine aldık gerçekten sorunsuz bir alışverişti paketlemesi kargo hızı gayet memnun kaldık ürünle yeni tanıştık umarım kullanım açısındanda memnun kalırız tşklergüzel ürün, hızlı teslimat, iyi paketlemeWe bought the product based on the comments, it was a really problem-free shopping, packaging, shipping speed, we were very satisfied, we just got the product, I hope we will be satisfied in terms of usage, thanksnice product, express delivery, well packaging
Ürün gerçekten çok güzel. Fiyatı da uygun. Gerçekten almak isteyen arkadaşlar için şunu söylemek istiyorum: Tek kelime ile mükemmel.güzel ürün, uygun fiyatThe product is really beautiful. The price is also appropriate. For those who really want to buy it, I want to say this: In one word, it’s perfect.nice product, fair price
Ürün hemen elime ulaştı, paketlenmesi de güzeldi en ufak bir çizik bile yok bardakların kalitesi de güzel ince değil kaliteli duruyor.iyi paketleme, kaliteli ürün, hızlı teslimatThe product arrived immediately, it was well packaged, there is not even the slightest scratch, the quality of the glasses is nice, not thin, but high quality.well packaging, quality product, express delivery
Ben 40 beden giyiyorum, kızım 38 giyiyor. Hem m hem L beden aldım ama L bana büyük oldu, tam sarmadı ve toparlamadı. M tam oldu. Bir beden küçük alınmalı kesinlikle. Oldukça kaliteli güzel bir tayt.güzel ürün, küçük alınabilir, kaliteli ürünI wear size 40, my daughter wears 38. I bought both M and L sizes, but L was too big for me, it didn’t fit well. Medium is a great fir. Definitely go one size smaller. Pretty good quality tights.nice product, order small size, quality product
Table 8. Configuration parameters.
ParameterValue
attention probs dropout prob0.1
hidden actgelu
hidden dropout prob0.1
hidden size768
initializer range0.02
intermediate size3072
layer norm eps 10 12
max position embeddings512
model typebert
num attention heads12
num hidden layers12
pad token id0
type vocab size2
vocab size128,000
Table 9. An adaption of binary relevance for multi-label classification.
(a) Initial dataset
FeaturesClass 1Class 2Class 3Class 4
F10101
F20011
F31011
F41100
(b) Class 1 Subdataset
FeaturesClass 1
F10
F20
F31
F41
(c) Class 2 Subdataset
FeaturesClass 2
F11
F20
F30
F41
(d) Class 3 Subdataset
FeaturesClass 3
F10
F21
F31
F40
(e) Class 4 Subdataset
FeaturesClass 4
F11
F21
F31
F40
Table 10. Evaluation results on electronics data using TF-IDF.
ClassifierHamming LossMicro F1Macro F1Micro PMacro PMicro RMacro R
BR-RF0.04970.87470.85320.9140.91020.83960.8093
BR-SVC0.050.87440.84630.90940.90660.84190.8022
BR-NB0.55390.37460.36310.24440.25340.80260.8021
MLkNN0.08410.78530.75960.83160.81960.74390.7124
OvsR-XGB0.0440.89250.87790.90140.8960.88370.8628
OvsR-LR0.0570.85330.81440.91180.89630.80180.7518
OvsR-SGD0.05290.86840.83720.89410.87720.84410.8056
OvsR-SVC0.0560.85980.83280.89030.87790.83140.7956
Table 11. Evaluation results on electronics data.
EmbeddingClassifierHamming LossMicro F1Macro F1Micro PMacro PMicro RMacro R
Word2VecBR-RF0.11440.65050.57490.86510.86750.52120.4546
Word2VecXGB0.10420.71190.66940.81760.81710.63040.5787
GloVeBR-RF0.10860.67340.61730.87250.89110.54830.4876
GloVeXGB0.09210.750.71990.84120.85140.67670.6329
BERTBR-RF0.11250.65550.55850.88370.91110.52090.4355
BERTXGB0.08210.78120.7480.86370.8830.71310.6657
Table 12. Evaluation results on women’s wear data using TF-IDF.
ClassifierHamming LossMicro F1Macro F1Micro PMacro PMicro RMacro R
BR-RF0.07110.83590.82810.90420.9050.77720.7691
BR-SVC0.06940.8460.84130.87690.87470.81710.8133
BR-NB0.41260.4410.4440.32230.33530.69810.7077
MLkNN0.14540.66040.65360.72490.72790.60650.5961
OvsR-XGB0.06150.86790.86570.86910.86660.86680.8651
OvsR-LR0.08040.81680.81010.87120.89630.76870.7608
OvsR-SGD0.07570.83270.82720.85880.8560.80810.8031
OvsR-SVC0.08130.81980.81640.8480.84640.79350.7898
Table 13. Evaluation results on women’s wear data.
EmbeddingClassifierHamming LossMicro F1Macro F1Micro PMacro PMicro RMacro R
Word2VecBR-RF0.15650.55930.51020.81010.79550.4270.4032
Word2VecXGB0.14060.65520.62030.76230.74420.57440.5496
GloVeBR-RF0.15160.57340.54720.83010.82720.4380.421
GloVeXGB0.12650.69910.67990.78270.77570.63160.614
BERTBR-RF0.14430.59650.57370.85030.84650.45940.4438
BERTXGB0.10570.75220.74180.82570.82510.69070.6786
Table 14. Evaluation results on home and life data using TF-IDF.
ClassifierHamming LossMicro F1Macro F1Micro PMacro PMicro RMacro R
BR-RF0.0320.86310.85150.90590.91280.82420.8033
BR-SVC0.0290.87770.86560.90630.90490.85090.8324
BR-NB0.62590.24630.2170.14440.13540.83690.798
MLkNN0.05750.74450.75990.81460.82330.68540.7088
OvsR-XGB0.02780.88620.88140.88580.88150.88670.8831
OvsR-LR0.03760.83370.80.9070.90840.77140.7195
OvsR-SGD0.0310.87020.85920.89110.88660.85020.8365
OvsR-SVC0.03360.85770.8470.88950.8850.82810.8141
Table 15. Evaluation results on home and life data.
EmbeddingClassifierHamming LossMicro F1Macro F1Micro PMacro PMicro RMacro R
Word2VecBR-RF0.08220.54530.50540.84980.8790.40150.3644
Word2VecXGB0.07170.65440.64820.80170.84820.55280.5347
GloVeBR-RF0.07570.58980.52490.88090.88350.44330.3804
GloVeXGB0.06060.71480.69990.84660.85070.61860.698
BERTBR-RF0.07880.55510.42010.91570.95250.3940.2882
BERTXGB0.05890.72420.6790.85050.85020.63060.5738
Publisher’s Note: MDPI stays neutral with regard to jurisdictional claims in published maps and institutional affiliations.

