Article

Low Temperature Synthesis of Aegirine NaFeSi2O6: Spectroscopy (57Fe Mössbauer, Raman) and Size/Strain Analysis from X-ray Powder Diffraction

1
Department Chemistry and Physics of Materials, Division of Materials Science and Mineralogy, University of Salzburg, Jakob-Haringerstr. 2A, 5020 Salzburg, Austria
2
Department Chemistry and Physics of Materials, Division of Physics, University of Salzburg, Jakob-Haringerstr. 2A, 5020 Salzburg, Austria
*
Author to whom correspondence should be addressed.
Minerals 2019, 9(7), 444; https://doi.org/10.3390/min9070444
Submission received: 2 July 2019 / Revised: 13 July 2019 / Accepted: 16 July 2019 / Published: 18 July 2019

Abstract

:
Using a low temperature synthesis protocol, it was possible to obtain phase-pure synthetic aegirine (NaFeSi2O6) at temperatures as low as 130 °C, albeit only with rather long synthesis times of ~200 h; at 155 °C, a nano-crystallite shaped phase-pure material is formed after 24 h. These are, to the best of our knowledge, the lowest temperatures reported so far for phase-pure aegirine synthesis. Powder X-ray diffraction (PXRD) was used to characterize phase purity, structural state and microstructural properties (size and strain) of the as-synthesized (130–230 °C) and heat treated (300–900 °C) samples, via Rietveld analysis of powder patterns. Melting was observed at 999 °C. With increasing synthesis temperature, crystallite size linearly increased from 10 nm to 30 nm at 230 °C, while unit cell parameters decreased. The microstrain was very small. Additional heat treatment of as synthesized samples showed that the crystallite size remained rather unaffected up to 700 °C. The lattice parameters, however, already changed at low temperatures and successively became smaller, indicating increasing ordering towards more regular arrangements of building units. This was confirmed by 57Fe Mössbauer spectroscopy, where a distinct decrease of the quadrupole splitting with increasing synthesis temperature was found. Finally, Raman spectroscopy showed that some weakly-developed pre-ordering effects were present in the samples, which appeared to be amorphous in PXRD, while well-resolved spectra appeared as soon as the long-range ordered crystalline state could be found with X-ray diffraction.

Graphical Abstract

1. Introduction

The mineral aegirine (NaFeSi2O6) is a prominent member of the rock-forming mineral group of pyroxenes. In nature, it crystallizes from alkaline magmas, and thus, is a common constituent of alkaline granites, syenites and their associated pegmatites and veins [1]. In these rock types, aegirine often appears in euhedral, large, dark brown-green colored prismatic crystals with sizes up to tenths of cm. All these crystallizations are associated with high temperatures. However, aegirine has also been found in sediments together with Na–Ca carbonates, and it was concluded that this aegirine may have formed at close to room temperature [2,3].
The crystal-chemical and physical properties of pyroxene solid-solutions have been studied intensively by geoscientists, e.g., its behavior within solid-solution series such as the hedenbergite CaFeSi2O6–aegirine series [4,5,6], diopside CaMgSi2O6-aegirine series [7,8,9]; the thermal and high pressure behavior [10,11] and the implications of the presence of the aegirine molecule for the behaviour of naturally occurring augitic pyroxenes.
In recent years, aegirine has also attracted the attention of numerous physicists due to the observation of multiferroic properties [12], resulting in several studies on its low temperature magnetic properties. In addition, the phase relations and magnetic properties within the (Na,Li)Fe(Si,Ge)2O6 system were investigated with special interest [13,14,15,16,17,18,19,20,21,22,23,24,25]. Aegirine itself shows complex magnetic ordering at low temperatures and discrepancies have been found in the magnetic ground states of naturally-occurring single crystals (with diopsidic and hedenbergitic component dilutions) and synthetic end-member compositions.
It was already noted by Ballet and co-workers [26] that phase-pure synthetic NaFeSi2O6 charges are hard to obtain, and that material, produced in ceramic sintering experiments at high temperatures around 900 °C, always contains up to 3–10 wt. % of hematite Fe2O3. A similar phenomenon was observed in [16,19,27]. Also, Zhou and co-workers [28] outlined that the synthesis of phase-pure aegirine is a challenge. Following Bowen and co-workers [29], aegirine melts incongruently above 990 °C; this is seen as the reason for the formation of hematite in the synthesis products. This can be overcome by synthesis at much lower temperatures using hydrothermal techniques [4,6,8]. In this way, it was possible to obtain (almost) phase-pure aegirine at temperatures as low as 300 °C and pressures of 2 kbar, albeit only in the ~100 mg scale due to the necessity of applying oxidizing solid-state buffer systems during the experiments [4]. Even lower temperatures of formation have been reported by [2] using gels prepared from dissolved SiO2·Na2O·5H2O and FeCl2·4H2O as starting materials. Here, it was possible to obtain aegirine in larger amounts at temperatures as low as 200 °C, albeit not in phase-pure form but mixed with poorly-crystallized 2:1 ferric phyllosilicate. For T < 200 °C, only 2:1 phyllosilicate was observed. The most promising protocol for the synthesis of phase-pure aegirine recently was given by [28], who used Teflon lined stainless steel autoclaves and synthesis temperatures between 160 °C and 220 °C for 14 h. They used NaOH, fumed silica and Fe(NO3)3·9H2O as starting materials; thus, a very basic milieu was chosen to produce nano-crystalline aegirine at or above 170 °C. Sintering of as prepared material yielded very well crystalized phase-pure material in larger amounts. In analyzing the 57Fe Mössbauer data of the as prepared and sintered NaFeSi2O6, it was found that the line widths were distinctly broadened in the low-temperature prepared sample. The effect was ascribed to the existence of additional Fe3+ environments which arise from hydroxide terminated surface material. Also, [4] reported on a variation (increase) of line width but also on changes in quadrupole splitting (as an indicator of the local distortion environment) with decreasing synthesis temperature and reflects the decreasing amount of crystallinity; they also found systematic variations in unit cell parameters with synthesis temperature. A more systematic study on the variation of crystallite size, microstrain, crystallinity, and unit cell dimensions with synthesis time and temperature has not been conducted so far.
In this study, we report on the hydrothermal synthesis of aegirine in order to check for even lower synthesis temperatures and evaluate the effect of synthesis time, which has so far remained neglected. One main aim is the detailed analysis of the size/strain properties of the as synthesized aegirine in comparison with the sintered material. By use of diffraction, spectroscopic and imaging methods, we present a multi-methodological approach to characterize the growth properties and the distortional state of low temperature synthesized aegirine, which may also be related to the growth properties of this pyroxene in the natural environment.

2. Materials and Methods

2.1. Synthesis

The synthesis of NaFeSi2O6 was done using a low temperature hydrothermal technique, following the protocol of [28]. For all experiments, 0.02 mol (0.79996 g) of NaOH as anhydrous pellets (≥97%, Merck, Kennborough, NJ, USA) were dissolved in 15 mL of deionized water with steadily stirring; After complete dissolving, 0.01 mol (0.6009 g) of SiO2 (99.9%, 1.5 micron, Alfa Aesar, Haverhill, MA, USA) was added, stirred for 5 min and finally 0.004 mol (1.61632 g) of Fe(NO3)3·9H2O (≥98, Sigma Aldrich) was added. This mixture was stirred for an additional 15 min, and then transferred to a 45 mL Teflon-lined stainless-steel autoclave (Parr 4744 General Purpose Acid Digestion Vessel), tightly sealed and kept in a Binder FD 115 drying chamber at temperatures between 130 °C and 230 °C for 24 h to 310 h. The solid residue was filtered and washed several times using deionized water before air-drying. For three samples, sintering experiments were also conducted: therefore, the samples were put in loose condition (without pelletizing) onto platinum dishes and heated at given temperatures for additional 24 h. This synthesis series was mainly performed to follow changes in crystallite size and crystallinity.

2.2. High-Resolution Transmission Electron Microscopy (HRTEM)

To characterize size, shape and orientation (growth direction) of the crystallites, transmission electron microscopic images were acquired with a JEOL JEM F200 TEM (Jeol Ltd., Tokyo, Japan) which is equipped with a cold field emission source, using a TVIPS F216 2k by 2k CMOS camera (TVIPS GmbH, Gauting, Germany). The accelerating voltage was set at 200 kV during the measurement.

2.3. X-ray Diffraction

Powder X-ray diffraction data were collected at room temperature in coupled Theta-Theta mode on a Bruker D8 Advance with DaVinci-Design diffractometer (Bruker AXS, Karlsruhe, Germany), having a goniometer radius of 280 mm and being equipped with a fast-solid state Lynxeye detector and an automatic sample changer. Data acquisition was done using Cu Kα1,2 radiation between 5° and 110° 2θ, with a step size of 0.015°, integration time of 1 sec, with the divergence slit and the anti-scatter-slits opened at 0.3° and 4° respectively; a primary and secondary side 2.5° Soller slit was used to minimize axial divergence, and the detector window opening angle was chosen as 2.93°. For data collection, all samples were prepared on single-crystal Silicon zero-background sample holders. Data handling was done with TOPASTM 4.2 (Version 4.2, Bruker AXS Inc., WI, USA) [30,31] using whole pattern refinement and a double-Voigt approach [32]. Indexing of peaks is based on the monoclinic C2/c symmetry, with lattice and structural parameters taken from [33]. The intrinsic peak shape of the Bragg peaks was modelled with the fundamental parameter approach [34,35]. The crystallite size broadening then was handled by allowing a Lorentzian type, while microstrain was handled by a Gaussian type component convolution. Note that crystallite size and microstrain convolutions vary in 2θ as a function of 1/cos(θ) and tan(θ), thus can be separated from each other if data are recorded to sufficient high 2θ angles. The microstrain as determined in the TOPASTM [31] software is defined as ε 0 = Δ d / d = β F W H M ( S t r ) / 4 tan θ , with d = the lattice spacing. For some samples, an estimation of a possible amorphous content was done by mixing a known amount of Diamond powder (1:1 by weight) to the sample as an internal standard (spike-method). The weight fractions of the crystalline phases (aegirine and diamond) are determined using the Rietveld method, the concentrations are corrected proportionately according to C o r r ( W α ) = W α S T D known S T D measured , where C o r r ( W α ) is the corrected weight percent amount of the phase, STDknown the weighted concentration of the standard and STDmeasured analyzed concentration. The amorphous material Wamorphous then calculates from W amorphous = 1 j = 1 n C o r r ( W j ) . The calculation is automatically done in the TOPAS software. The likely error in the estimation of the amorphous material is ~3–5%. The full set of determined data of lattice and structural parameters is available as an EXCEL file in the Supplementary S1.

2.4. Mössbauer Spectroscopy

Transmission 57Fe Mössbauer spectra were collected at room temperature using a Mössbauer apparatus (Halder Electronics, Starnberg, Germany) in horizontal arrangement (57Co/Rh single line thin source, constant acceleration mode, symmetric saw tooth velocity shape, multi-channel analyzer with 1024 channels, velocity scale calibrated to α-iron). For Mössbauer-absorber preparation, samples were carefully ground under ethanol, filled into Cu-rings (inner diameter 10 mm and covered with a high-purity Al-foil on one side), and mixed with epoxy resin to fix the sample. The folded spectra were analyzed using a classical full static Hamiltonian site analysis (using Lorentzian shaped doublets) and a Voigt-based hyperfine field distribution method as implemented in the program RECOIL (Version 1.05) [36,37].

2.5. Raman Spectroscopy

The Raman measurements were done using a Thermo DXRTM 2 Raman microscope (Thermo Fisher Scientific, MA, USA) equipped with a confocal microscope BX41 (Olympus Corp., Japan), the spectrometer running with the Thermo OMNICTM (Version 9, Thermo Fisher Scientific, Waltham, MA, USA) acquisition software. The diameter of the laser spot due to a 10× microscope objective (NA = 0.25) was approximately 2.5 μm, and the laser power on the samples 4 mW at a given excitation wavelength of 532 nm. The Raman data set was acquired using a high-resolution grating (50–1800 cm−1), and a 50 μm pinhole-like entrance slit to the spectrometer, resulting in an apparatus function with full width at half maximum in the range of 3.5 cm−1. All measurements were performed with an exposure time of 60 s and 5 accumulations. The exact position of Raman modes was determined by single peak fitting using pseudo-Voigt shaped lines using the Fullprof-suite and the peak fitting options included in WinPlotR. Thereby the mixing parameter X between Lorentzian and Gaussian component was between 0.92–0.95, i.e., the peak shape is dominantly Gaussian.

3. Results

3.1. Synthesis and Sample Morphology

As a first observation, the sample material obtained in the low temperature synthesis differs in color, depending on synthesis temperature and time. Figure 1 shows the residues of experiments, done at 130 °C and 150 °C and different holding times, and of an experiment done at 230 °C for 24 h; at the lowest temperature of 130 °C, the residue appears to be dark reddish brown at short synthesis times; it becomes light brown to yellow with prolonged heating periods, as can be seen from the residue of the experiment at 130 °C and 192 h, where the first distinct Bragg peaks of aegirine are present. After 310 h, a light-yellow green residue was obtained. Similar products are observed for a temperature of 150 °C; after 24 h synthesis time, the product is light brown (Figure 1b), while for a synthesis time of 48 h a light-yellow green color is observed (Figure 1c), while the color turns paler for the sample, obtained at 150 °C and 168 h (Figure 1d). For all other temperatures, 155 ≤ T ≤ 230 °C, the residue already appears in the typical light-yellow green colors after 24 h synthesis time. With increasing temperature, the color successively lightens at temperatures >210 °C, as can be seen in the pale yellow-white color of the product of the 230 °C synthesis (Figure 1g), compared, e.g., to the one in Figure 1d. Generally, the light yellow-green to pale-yellow color is an indication of very pure end-member NaFeSi2O6. Table A1 in the Appendix A compiles synthesis conditions and experimental results.
Material synthesized via ceramic sintering routes most generally has a pale brown to orange-reddish color [4,16,26,28] which is due to impurities of hematite Fe2O3 (even if not detectable with X-ray diffraction due to the low content). To illustrate this, NaFeSi2O6 sintered at 900 °C [4] is also compared with the samples of this study in Figure 1f. In this sintered sample (Figure 1f), 0.5 (2) wt. % Fe2O3 as the coloring agent were detected by X-ray diffraction. Also in hydrothermal synthesis experiments, [4] reported a pale brown/beige color for most of the aegirine syntheses experiments and small amounts (<1 wt. %) of hematite are found; only those experiments at high temperatures with highly oxidizing buffers (e.g., at 700 °C, and bixbyite/hausmannite Mn2O3/Mn3O4 solid state oxygen buffers) together with the addition of NaCl were white colored [4]. It should be noted that in flux growth experiments using Na2MoO4 as high temperature solvent [16], honey-brown, large tabular crystal aggregates are obtained. These observations show that by using this rather simple hydrothermal approach, very phase-pure aegirine can be obtained in large quantities, and that this occurs within rather short synthesis times (24 h).
Transmission electron microscopy (TEM) JEOL JEM F200 TEM (Jeol Ltd., Tokyo, Japan) was used to further characterize the morphology and size distribution of the synthesized material. In Figure 2a,b images from the sample synthesized at 160 °C (24 h run time) are shown. As is evident, even at the nano-scale, individual crystallites of aegirine crystalizes as tabular lath-like bundles, with average thicknesses of ~8 (2) nm and lengths of ~40 (5) nm. The size distribution is rather uniform. It was already pointed out by [28] that individual crystals grow from a common growth center. This is confirmed here. Increasing the synthesis temperature to 220 °C (Figure 2c,d) enhances crystal growth, the average thickness of the tabular like crystals is ~20 (3) nm, while the length increases distinctly to ~150–250 nm; due to overlap of individual crystals and the growth from the common growth center, it is somewhat hard to measure the actual lengths. Individual crystallites are terminated by well-developed faces. Such faces were already visible in the 160 °C sample, although they were not as well developed. In high resolution images, it is possible to resolve the fringes of the atomic lattice as depicted in Figure 2e. From the Fast Fourier Transformation (FFT) of the marked rectangle area it is possible to determine the distances for the fringes as 5.21 Å in needle direction, which corresponds very well with the interplanar spacings of the (001) planes; thus, the growth direction along the needle direction can be identified as the c-axis. The fringes perpendicular to c have a repeating distance of 6.45 Å, which corresponds to the interplanar spacings of the (110) planes. In the vast majority of crystallites, investigated by HRTEM JEOL JEM F200 TEM (Jeol Ltd., Tokyo, Japan), these two interplanar spacings can be observed, while for a few cases fringes with a 4.55 Å spacing are found. They may either correlate to the spacing of the (020) or the ( 1 1 ¯ 1 ¯ ) planes. In natural aegirines, the later are frequently found, terminating the tops of the crystals, so it is more probably that these correspond to the ( 1   1 ¯   1 ¯ ) . In the crystallites here, they come together with 6.45 Å spacings. In the early stage of crystal growth, aegirine seems to grow preferential along the c-axis and the [110] direction. The (110) faces often are only weakly developed in natural aegirine crystals, which may result from the fast growth of these faces in early crystallization stadiums, i.e., they grow “out of the crystal” and are not observed to the extent of the dominating (100) and (010) faces, which seem to develop more slowly and are not observed here.
It is interesting to note that the morphology and the habit of the crystallites in the low-temperature synthesized material is very similar to what can be found on the macro-scale in natural aegirines, and also to what was found in flux growth experiments to synthesize single crystalline NaFeSi2O6 [4]. In Figure 2f, a photograph of such aggregates of aegirine is shown for comparison. Note the very similar bundle-like aggregates, which also start to grow from a common crystallization point. Individual crystals are up to 0.3 mm in thickness and 4 mm in length.

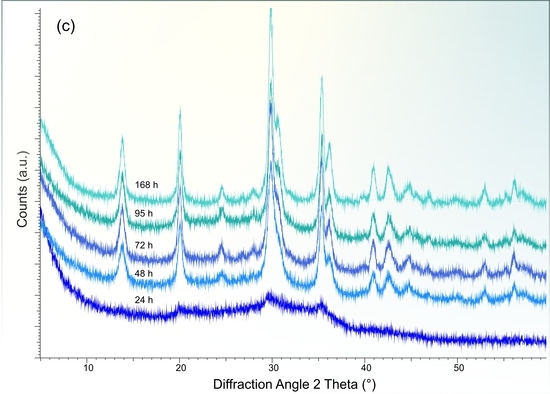
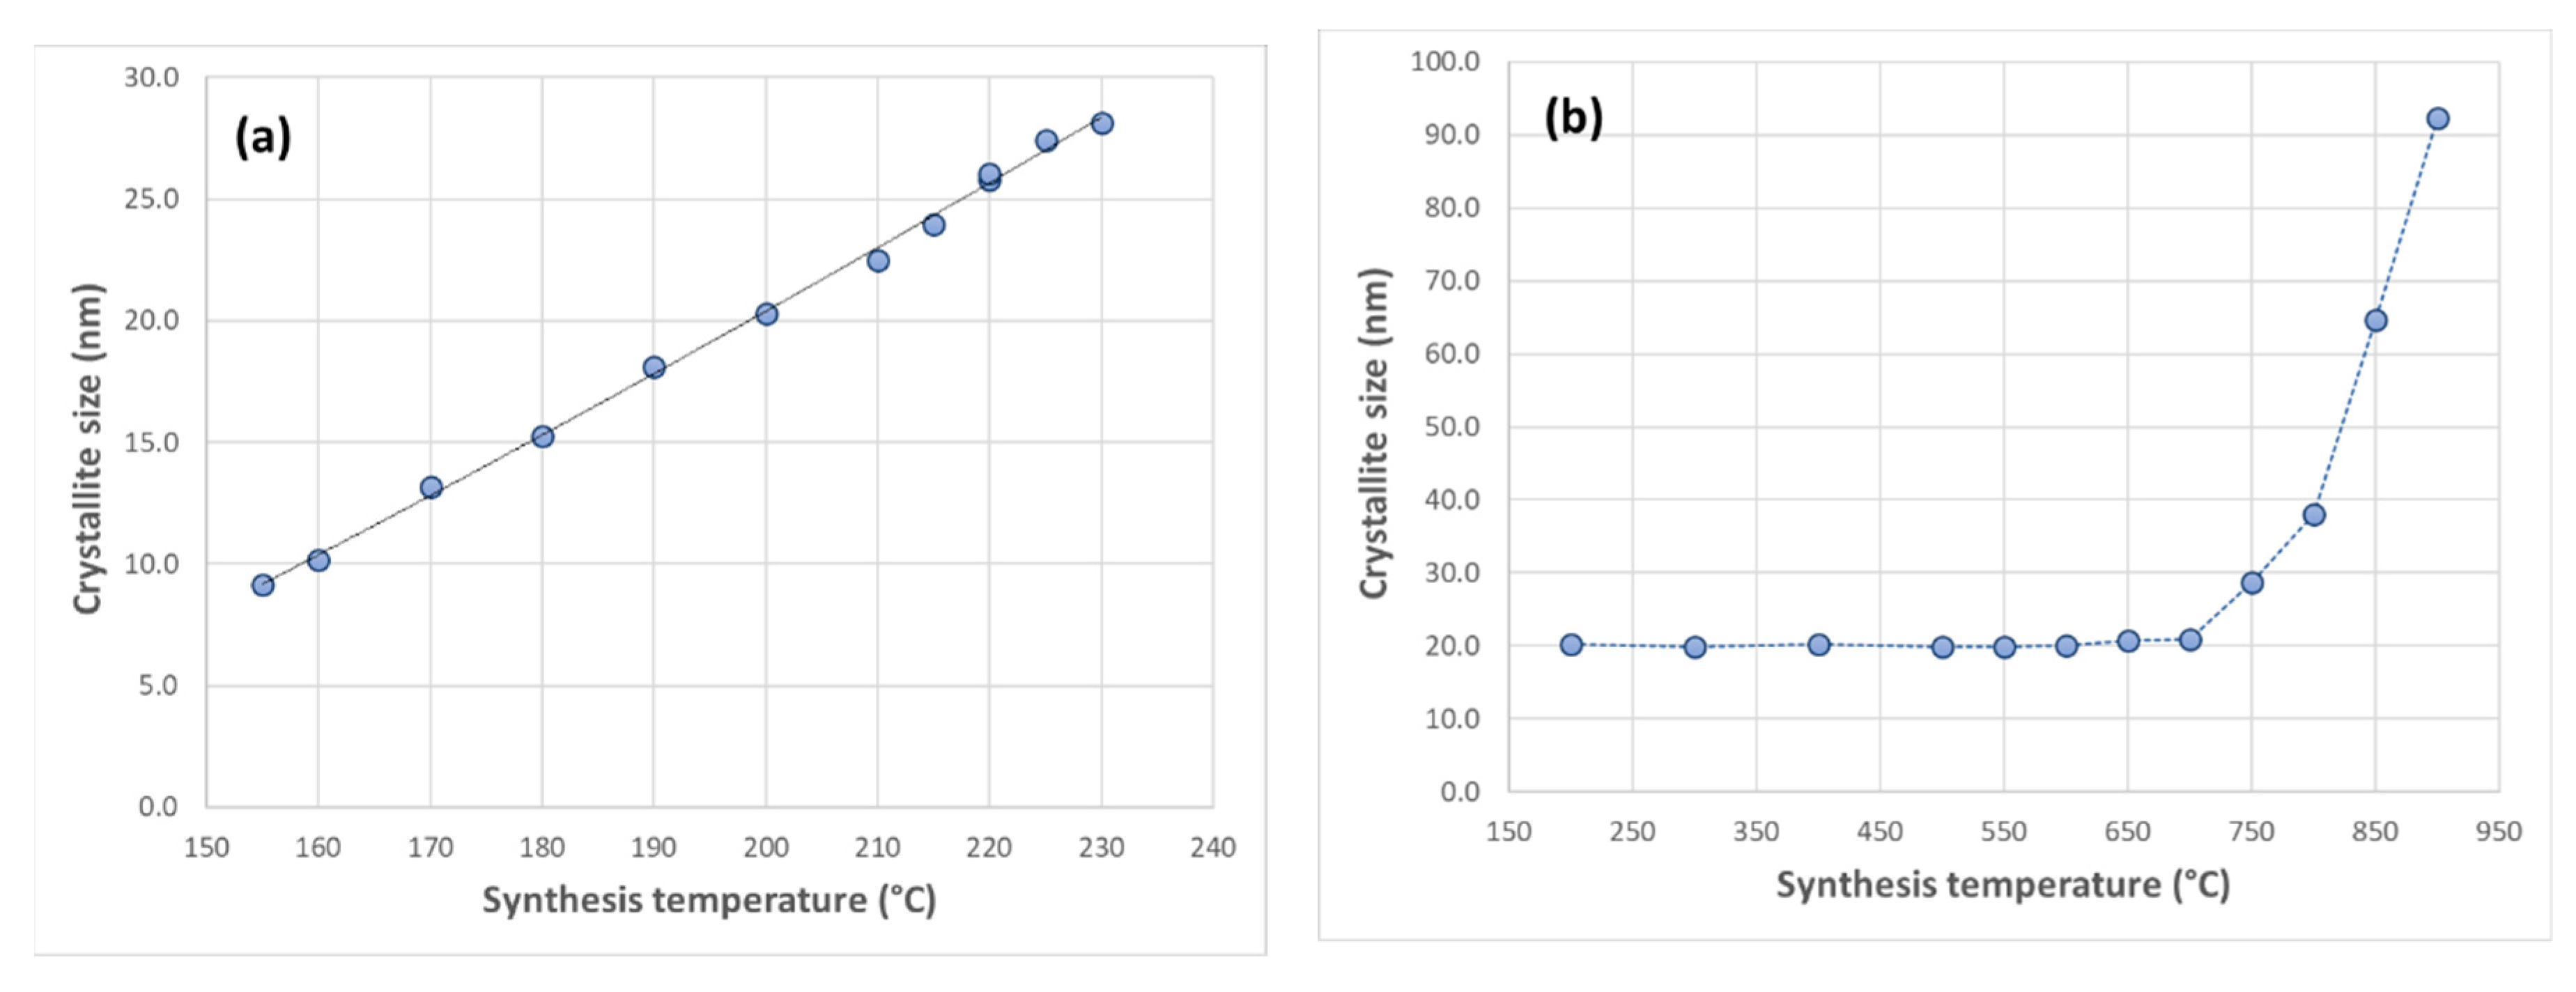
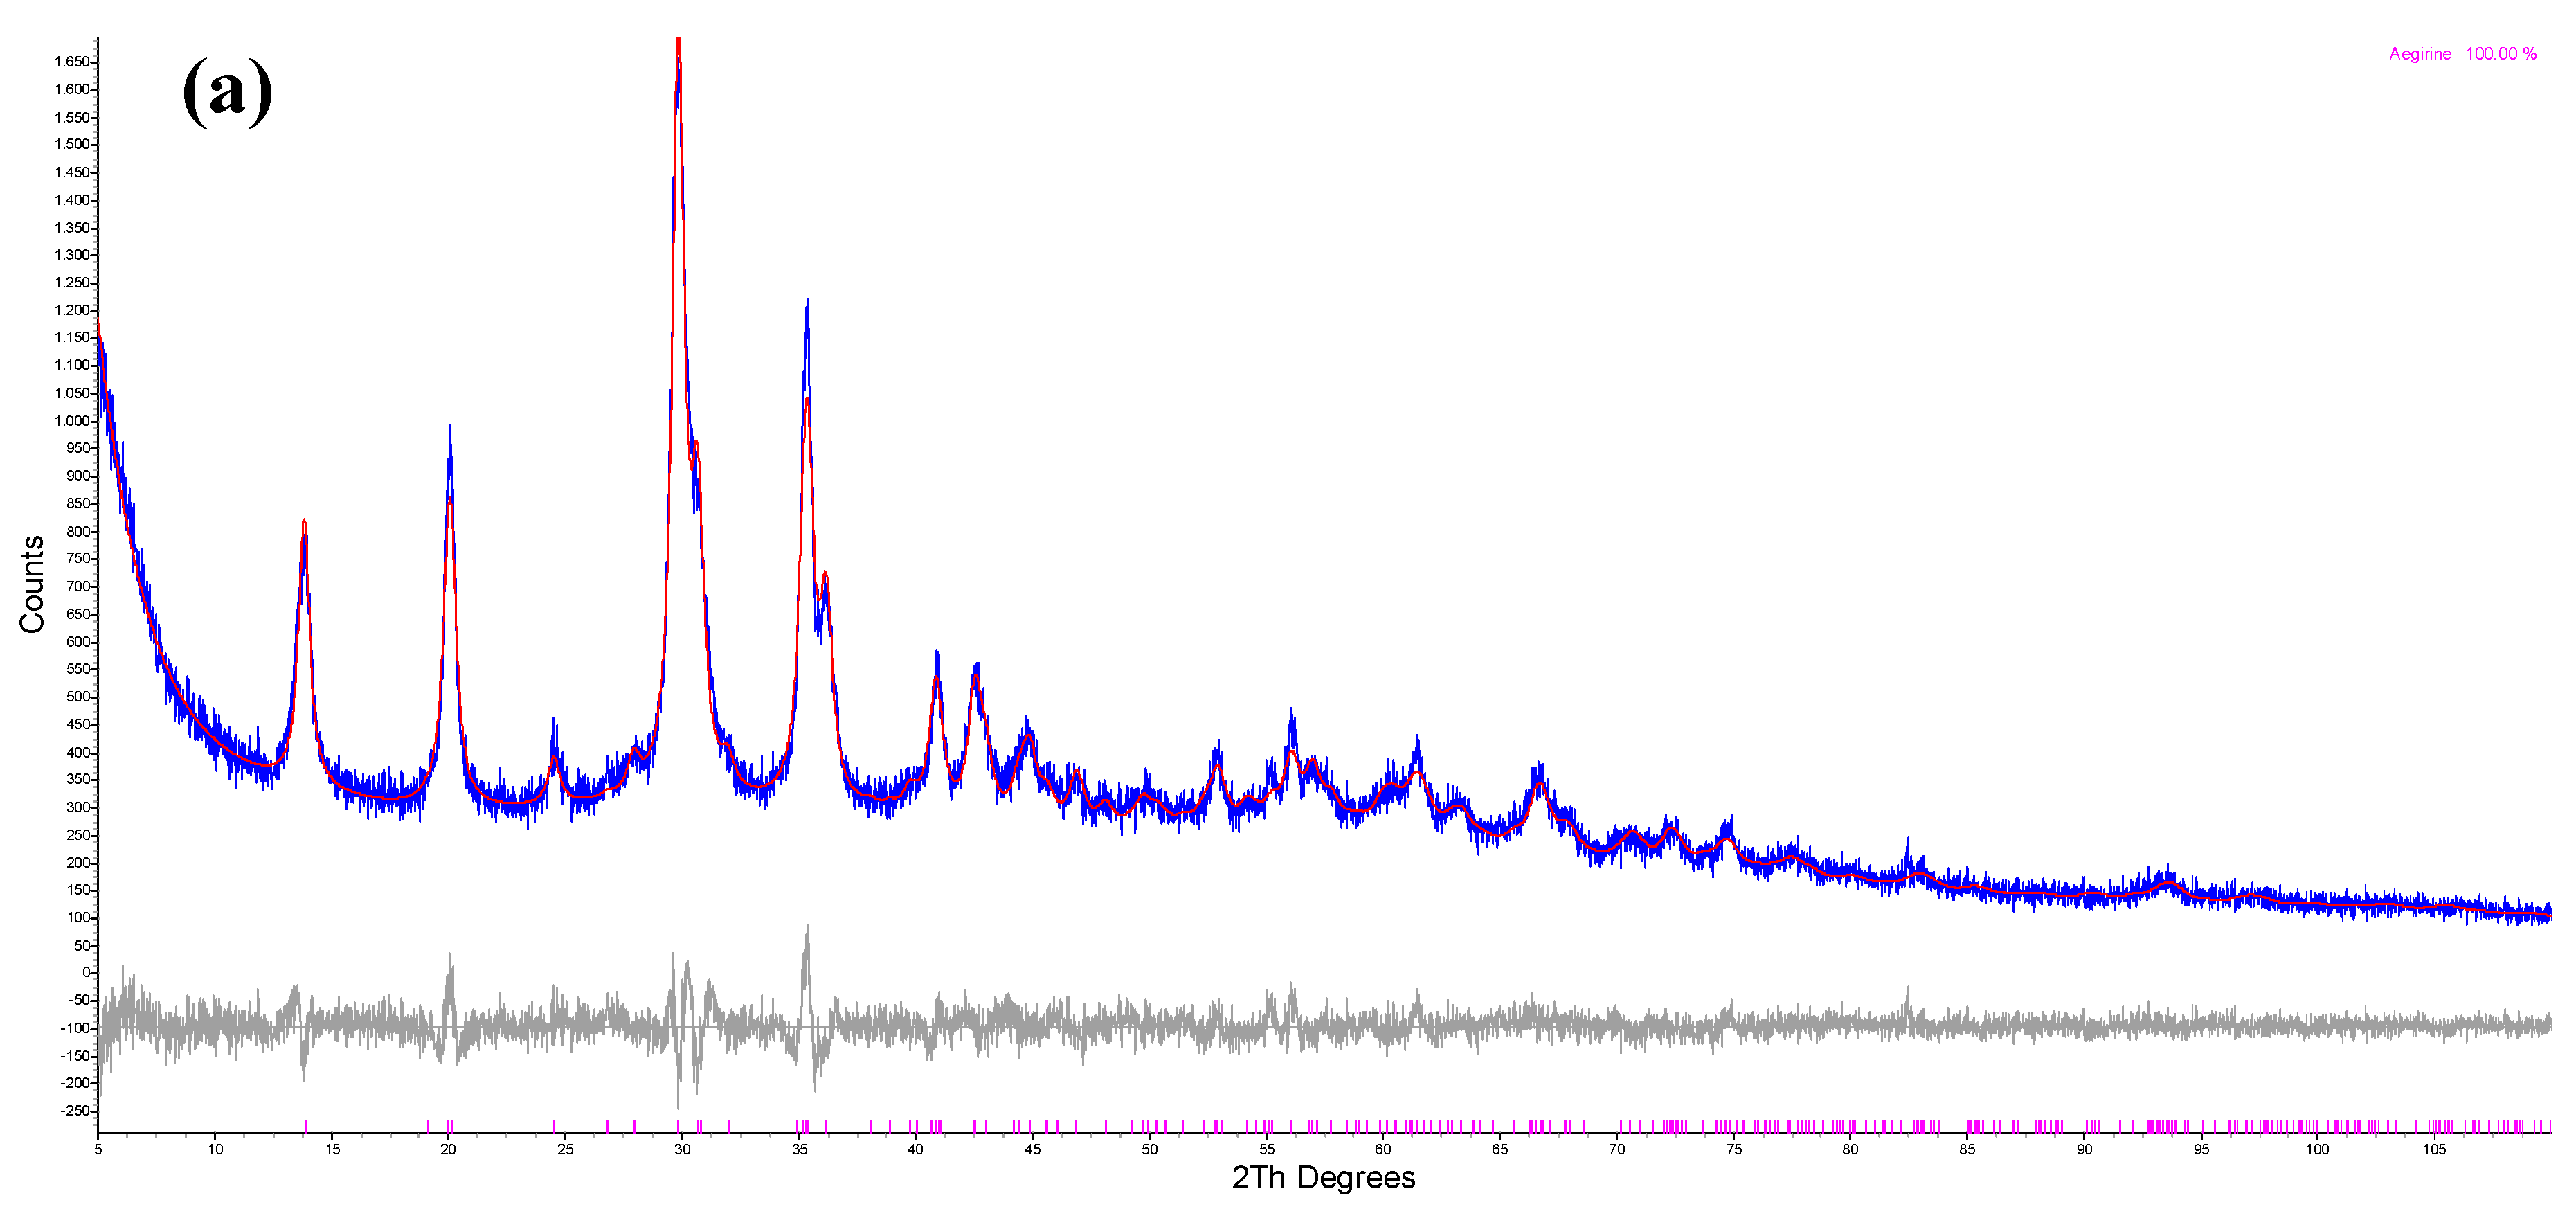
3.2. X-ray Diffraction Analysis

Four different series of aegirine synthesis and heat treatment experiments were performed, for which selected X-ray diffraction pattern are shown in Figure 3a–d. The first series (Figure 3a) shows the characteristics of the sample material depending on synthesis temperature at a fixed synthesis time of 24 h. The X-ray diffraction data evidence that the experiment at 130 °C yields amorphous material; at 150 °C large amounts of amorphous material are accompanied by first evidences of nano-crystallites of aegirine. At 155 °C, the powder diffraction pattern already shows the typical peaks of aegirine, although with large linewidth, indicative for the nano-crystalline state of the material. With increasing temperature, peaks become sharper and, e.g., the broad line at ~30° 2θ evolves to a well separated doublet. Additionally, a small shift of Bragg-peaks can be observed, which is indicative for some changes in unit cell parameters, as discussed below. Based on the spike method, described in Section 2.3., samples contain negligible amorphous material (within the precision of the method) at and above 155 °C.
When keeping the synthesis temperature at 130 °C and varying the synthesis time (Figure 3b), reddish brown residues are found up to 142 h, and the amorphous character is confirmed by X-ray diffraction. An experiment with 192 h also shows a (brownish) yellow color, however, revealed some 20 (5)% of amorphous material, as hinted by the spike method, while at 310 h a fairly well (nano)-crystallized sample material is obtained without any strong evidence for amorphous phases. Generally, it should be noted that at these low temperatures of 130 °C, NaFeSi2O6 was—to our best knowledge—never synthesized before. At 150 °C (3rd series of experiments) first evidence for aegirine formation could be found after 24 h (Figure 3c), while a further 24 h promotes the formation of nano-crystalline phase-pure aegirine. Prolonged synthesis times lead to a better resolution of Bragg peaks, indicative for increasing crystallite size, also some shifts of Bragg peaks are evident; similar to the temperature variation series.
In a fourth series, sample material of the 200 °C/24 h experiment was annealed as a loose powder at different temperatures between 300 °C and 900 °C for 24 h. It should be noted that aegirine melts at temperatures around 999 °C as determined by differential thermal analysis (see Appendix A, Figure A1). X-ray diffraction patterns show a small decrease in line-width up to 700 °C, while for temperatures of 850 °C and especially for 900 °C a drastic sharpening of Bragg peaks is evident (Figure 3d). From this observation, increasing crystallite size can be expected, i.e., at these temperatures, a significant materials transport (ionic diffusion) starts to takes place, enhancing crystallite growth. In addition to this series, also parts of the sample obtained at 130 °C/24 h and containing only amorphous material were annealed at 500 °C, 700°C and 900 °C, respectively. The sample kept its amorphous character after 24 h at 500 °C, while it transformed to very well crystallized aegirine at 700 °C, additionally poorly crystallized hematite Fe2O3, is present and responsible for the dark reddish-brown color. Sintering at 900 °C has similar effects, the major difference concerns hematite, which appears as a very well crystallized material with sharp lines. Compared to this sample, phase-pure aegirine, obtained at 130 °C over a period of 310 h, behaves somewhat different upon sintering; there is no significant change at 500 °C and 700 °C with respect to line width and crystallinity, but after 24 h at 900 °C, the XRD pattern also shows small line width, similar to that is observed within the annealing series for the 200 °C/24 h sample. From this it can be deduced that the very fine-grained precursor material, obtained at 130 °C and 24 h, yield no phase-pure material, however, it starts to form well crystallized aegirine at much lower temperatures.
After this qualitative analysis, all the data were investigated in more depth using a full-pattern Rietveld analysis [38] with respect to unit-cell dimension refinement, and extraction of structural and microstructural parameters. The starting structural parameters of aegirine for Rietveld refinement were taken from [33]. Typical Rietveld analyses are shown in Appendix A, Figure A2, the most important results are compiled in Table 1. With increasing synthesis temperature at constant holding time, two main features are evident: the crystallite size, extracted from the volume based integral breath of the Bragg peaks of the whole pattern, is positively correlated with the synthesis temperature and increases almost linearly between 155 °C and 230 °C. Crystallite sizes of 9.2 (2) nm are determined for the temperature of 155 °C which increase up to 28.1 (3) nm at 230 °C (Figure 4a). It is interesting to note that the crystallite size obtained from PXRD matches well the smallest dimension of the crystallites, i.e., the diameter of the laths/needles in TEM. Recall that in XRD an average crystallite size is determined, but not the particle size of an aggregate, which can consist of multiple crystallites. As is seen in the TEM images, the individual crystallites are highly acicular, thus the crystallite size reported here is only an approximation as generally is the case for crystallite sizes as determined by XRD for anisotropic habitus of crystallites. The anisotropic nature of the crystallites can also be seen in the PXRD pattern itself by slight evidence for an anisotropic line broadening. The microstrain in all samples is low and remains almost constant within the temperature series, with a small tendency to decrease with increasing crystallite size/synthesis temperature.
The second main observation concerns the lattice parameters. They are highly influenced by the synthesis temperature, and decrease with increasing synthesis temperature (Appendix A, Figure A3). This is most evident for the unit cell dimensions a and c, which decrease by ~0.24% and ~0.18% between 155 °C and 230 °C as synthesis temperature increases. Along b, there is only a small change (0.03%) that is almost within the estimated standard deviation. The monoclinic angle increases by 0.08%. These decreases are not linear but become successively smaller towards higher synthesis temperatures, which is most evident for the c-lattice parameter. Dominated by the variations in a and c, also the unit cell volume decreases. The data, obtained for the sample, synthesized at 150 °C and 48 h, fall on the general trend and shows the largest unit cell dimensions. Prolonged synthesis times at 150 °C also yield distinctly decreasing a- and c-lattice parameters, while b and the monoclinic angle change only insignificant between 48 h and 168 h run durations. Interestingly, the crystallite size increases from ~10 nm successively to 15 nm, the increase is not linear and it seems that at some certain run durations a saturation crystallite size will be reached (Table 1).
It was already noted in [4] that lattice parameters of end-member aegirine are inversely correlated with synthesis temperature but stabilize at some certain temperatures. In Figure 5, data of these different synthesis series are compared. Within the series of additional secondary heat treatment using the 200 °C/24 h sample, it also becomes evident that with increasing sintering temperature, the unit cell parameters change with very similar trends to the (newly recorded and evaluated) data on the hydrothermally synthesized samples of [4]. The two series follow a more general common trend, especially at temperatures above 600 °C, where they tend to stabilizes at some common values and become rather independent on synthesis or sintering temperature. At lower temperatures, the data for the sintering experiments on the low-temperature synthesis 200 °C sample are somewhat higher, which may be seen as an indication of a higher initial disorder. The clearest variation is shown by data of the a lattice parameter (Figure 5a) where the overall decrease between 155 °C and 900 °C is 0.45%, c decreases by 0.35% while the b-axis shrinks by only 0.06%.
Of special interest is the evolution of crystallite size with heat treatment temperature. As is already deducible from the optical inspection (Figure 4b), there is almost no change in crystallite size up to 700 °C, afterwards it increases distinctly. In the same temperature range, lattice parameters-however-decrease, so that two different trends can be deduced for the additional heat treatment: at temperatures below 700 °C the regularity of the crystal lattice (crystallinity) seems to be enhanced, indicated by the change in lattice parameters, while above ~700 °C, there is no large change within the structural state, but main changes concern crystallite growth through diffusion processes. The microstrain, even on a relative basis, generally decreases with synthesis temperature. However, this does not hold true for the samples sintered at different temperatures: here the microstrain remains constant, but significantly decreases above 750 °C. This is the temperature, where distinct crystallite growths start. This is a strong evidence that strain and crystallite size are negatively correlated, which indeed can be observed in the nano-crystalline data of this study (Appendix A, Figure A4a). The data for the aegirine samples of [4] have considerably larger needle-like shaped crystallite sizes for T > 500 °C and are out of the range, where crystallite size and microstrain can be obtained reliably on basis of line-broadening. It is generally adopted that this can be done for crystallites below ~150 nm [32,39]. At least for the samples of the present study, this holds true and a nice negative correlation between size and microstrain is clear (Appendix A, Figure A4b).
Figure 6 depicts a polyhedral drawing of the structure of aegirine, as refined from the well crystallized sample sintered at 900 °C for 24 h; the fractional atomic coordinates are given in Appendix A, Table A2, more details on the aegirine structure can be found in [5,7,10,16] and will not be repeated here. Data obtained here fit well with the data from literature, obtained from single crystals. Generally, the structure of the C2/c pyroxenes consists of 3 main building blocks: (i) the slightly kinked chains of tetrahedra, which are connected to each other via the O3 bridging oxygen atoms and run parallel to the crystallographic c-axis, (ii) the zig-zag chains of edge-sharing M1 octahedra, here Fe3+O6, which also run parallel c and (iii) the 8-fold coordinated M2 cations, which fill interstitial space between M1 and tetrahedral chains. The most distinct changes within the structure with synthesis temperature occur along the ac plane of the structure. Along a, tetrahedral chains, arranged in layers, are stacked with layers of M1 chains and M2 polyhedra, the shrinkage in c most probably is related to some changes in the kinking state of the chains. This is supported by taking a closer look onto the structural parameters, deducible from the Rietveld refinements. Even if affected by larger uncertainties, it is possible to extract some trends.
Within the SiO4 tetrahedron, small variations are observed for the Si–O1 and Si–O2 bond lengths, which link the tetrahedral to the octahedral chain along the a and b direction, respectively. For the Si–O2 bond lengths, there is a distinct decrease with increasing synthesis temperature in the 170 °C and 230 °C region (Figure 7a), the reversed trend—albeit not as prominent—is found for the Si–O1 bond lengths. Towards higher sintering temperatures, both distances increase slightly with temperature. For the Si–O3 bond lengths, which bridge the individual SiO4 tetrahedra in chain direction, no clear variations with temperature are observable, the average <Si–O> bond lengths slightly increase. The kinking state of the tetrahedral chain, which is defined by the O3–O3–O3 bond angle, changes with temperature. In samples, synthesized at very low temperatures, the chains are almost fully extended, with O3–O3–O3 angles close to 180°. With increasing synthesis temperature, the chains become kinked and approach values of ~174° (Figure 7b), which is the typical value, found in natural and perfectly crystallized synthetic aegirine [7]. Increasing the kinking, i.e. deviation from the extended chain, decreases the unit cell dimension along c, as is observed in Figure 5c, while along b, the “thickness” of the tetrahedral sheet increases; this balances the decrease of the Si–O2 bond lengths, thus only small changes are observed for the b-lattice parameter.
For the octahedral site, the Fe–O bond lengths remain constant or decrease with increasing synthesis temperature, most evident for the Fe–O1 bond (Figure 7c) and the larger Fe–O2 bonds, which all are in the equatorial plane of the octahedron, while the shorter Fe–O1 bonds, pointing along c remains rather constant. The average Fe–O bond length becomes shorter with increasing synthesis temperature, accompanied by this is a decrease in polyhedral volume and in the polyhedral distortion, most evident in the low temperature region. The bonds from the Na atoms to the O3 oxygen atoms also show some significant changes with synthesis and sample treatment temperature, which shows a similar behavior to the kinking state of the tetrahedral chain, to which they are related (Figure 7d). The heat treatment does not affect the material distinctly up to temperatures of ~700 °C, above, a decrease is observed and data approach the values of the material synthesized at the high temperatures.

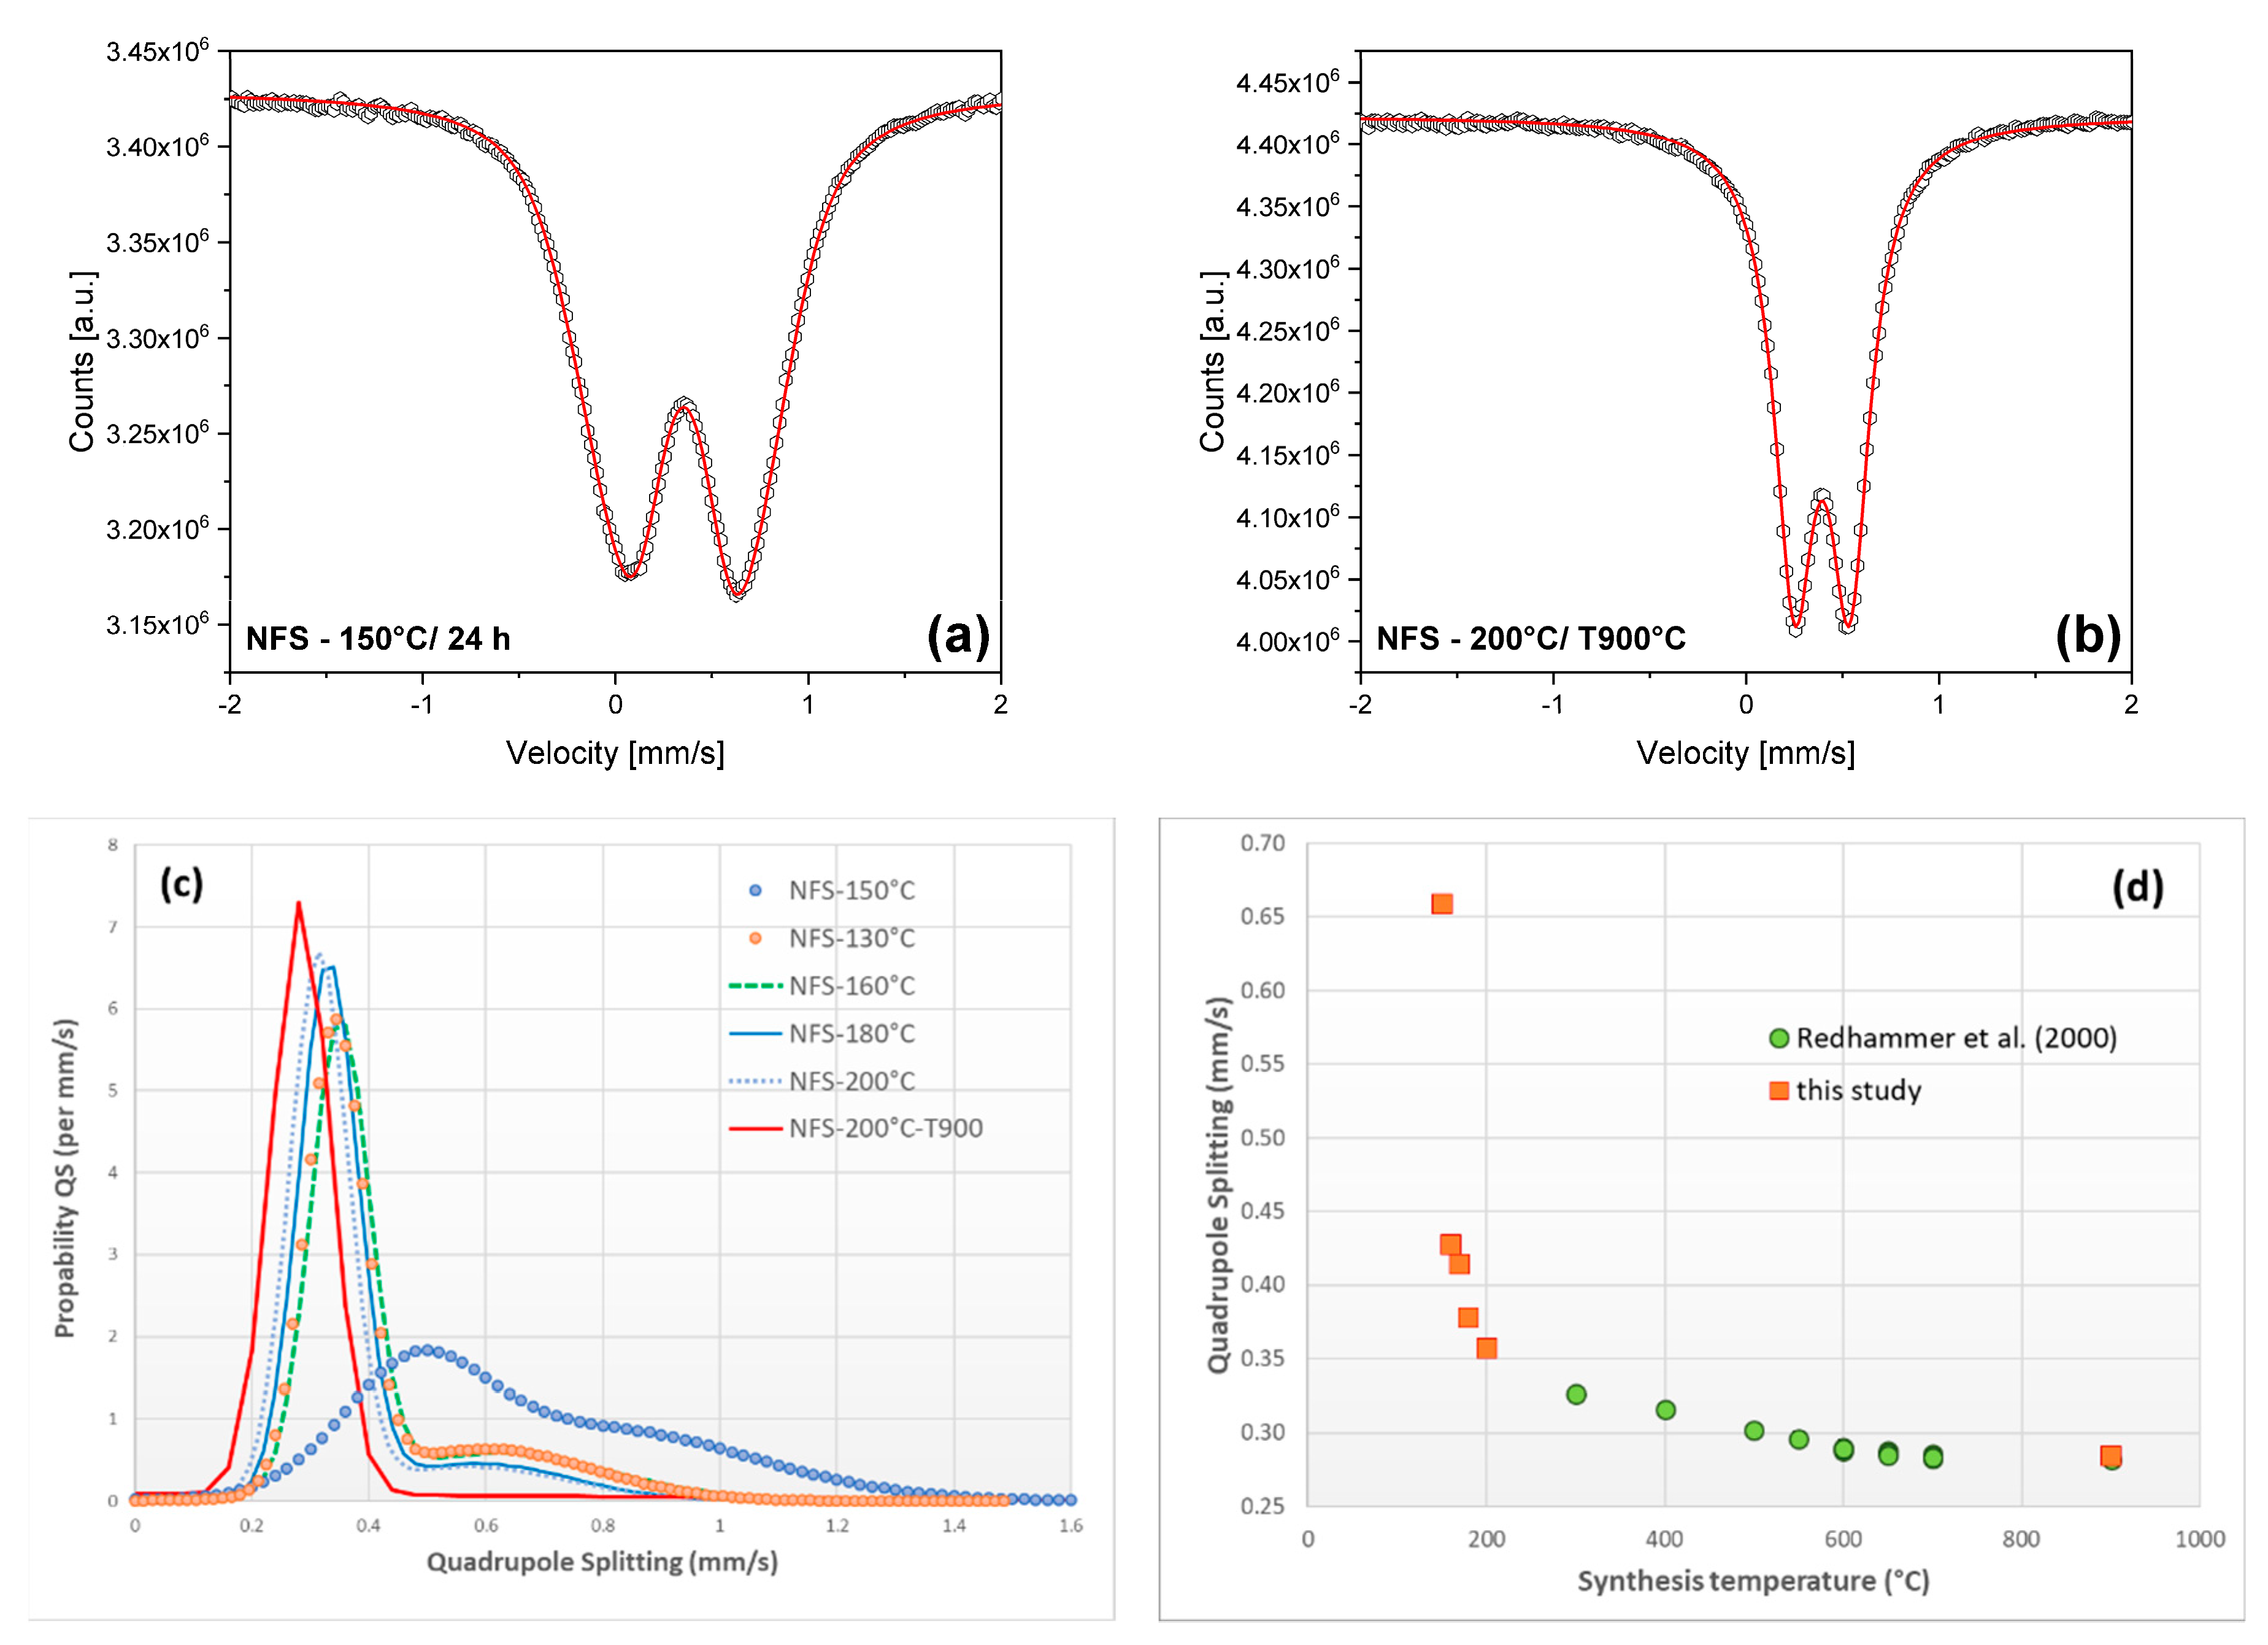
3.3. 57Fe Mössbauer Spectroscopy

57Fe—Mössbauer spectra were recorded on 6 exemplary samples corresponding to one poorly-crystalline, three intermediate and two well crystalline low-temperature synthesized samples. Data were collected in order to check the valence state of iron and to probe the local distortion environment around the Fe probe nucleus in aegirine. The sample, synthesized at 200 °C and afterwards annealed at 900 °C for 24 h (200 °C_T 900 °C in Table 2) was used as the reference spectrum (Figure 8b). It exhibits very sharp resonance absorption lines which can be evaluated by a single narrow split doublet, giving rise to an isomer shift δ = 0.393 (3) mm/s and a quadrupole splitting 0.284 (2) mm/s, which are 57Fe hyperfine parameters typical for high-spin ferric iron in a regular octahedral coordination. These data agree very well with the ones found by Redhammer and co-workers [4] for aegirines with high degree of crystallinity. No evidence is present for ferrous iron in any of the spectra. In contrast to this, the spectrum of the sample 150 °C-24 h, exhibits a broad character (Figure 8a) and can only be evaluated assuming a second component. Such an additional component was also observed by [28] and was assigned to an additional Fe3+-hydroxide species at the surface. In this paper, it is proposed that due to the low degree of crystallinity in the as prepared samples at very low temperatures, a broad range of local distortion environments exist around the Fe3+ probe nuclei, thus contributing to a broad range, a distribution, of quadrupole splitting values. Because of this, in data evaluation, a Voigt-based quadrupole splitting approach was used, and a weighted average quadrupole splitting is calculated and given in Table 2. The spectra of samples synthesized at higher temperature are characterized by two main features: the splitting of the lines becomes smaller, i.e. the quadrupole splitting decreases, and the distribution of quadrupole splitting generally becomes narrower as is evident in Figure 8c. The smaller distribution of local distortion environments is seen as a clear indication of increasing “perfection” of the atomic arrangement in aegirine, at least around the Fe3+ probe nuclei, and in total, the local distortion decreases, i.e., the Fe3+O6 octahedra become more regular. It should be recalled that in the case of high-spin Fe3+, local site distortion and quadrupole splitting are positive correlated.
The trend of decreasing quadrupole splitting of Fe3+ with increasing synthesis temperature is shown in Figure 8d. Data of [4] are included and perfectly meet the trend, seen in the data of this study. Towards lower temperature, the negative correlation is further enhanced. This is not surprising, as towards lower temperatures, the crystallinity and the distortion of the structure decreases.
In some of the spectra (160–180 °C), a low intensity shoulder is present in the spectra around −0.5 mm/s. Adding a doublet for an additional Fe3+ component yield hyperfine parameters, which are typical for Fe3+ in tetrahedral coordination. The area fraction is between 3–5% of total iron, which would correspond to ~0.05 out of two formula units Fe3+ on the tetrahedral site.

3.4. Raman Spectroscopy

Raman spectroscopy probes shorter ranges of order than X-ray diffraction; thus, it can also be applied for characterizing pro-ordering phenomena and glass-like structures. Thus Raman spectra were collected to check for a possible appearance of resolved Raman modes prior to the observation of a three-dimensionally ordered crystalline state in PXRD and to probe for any shifts in Raman peaks with synthesis temperature, which would indicate changes in the structural state and crystallinity of aegirine as a function of sintering and synthesis temperature. In monoclinic C2/c pyroxenes, 30 Raman active modes (14 Ag and 16 Bg) are to be expected from factor group analysis [40,41,42]. It is well established that most of the Raman-modes in pyroxenes are a combination of bending and stretching vibrations of all types of different atoms in the structure, thus mode assignment is definitely not straightforward. Only the combination of theoretical calculations, graphical vibration analysis and comparison with experimental data yields good evidence for mode assignment. For several orthorhombic and monoclinic pyroxenes, such studies are available e.g., for jadeite NaAlSi2O6 [42], NaTiSi2O6 [43], diopside CaMgSi2O6 [40] or ortho-enstatite Mg2Si2O6 [44]. However, for different pyroxene compositions to these given, it is still impossible to assign all individual bands to the corresponding vibrations without any theoretical calculations as a supporting aid. Nevertheless, a more general band assignment can be done, grouping band to regions and assigning them to functional units. Doing so, [45,46] divided the Raman spectra of the pyroxenes in 5 different regions: region R1 is between 1100–800 cm−1 and shows strong modes which can be ascribed to symmetric and asymmetric stretching modes of the Si–Onbr bonds, where Onbr is a non-bridging oxygen atoms (O1 and O2). Region 2 is between 800 cm−1 and 600 cm−1 and contains modes due to the stretching and bending of the Si–Obr–Si bonds, where Obr are the bridging O3 oxygen atoms between the tetrahedra in the tetrahedral chain parallel to the c-axis. Region R3 is between 600 cm−1 and 450 cm−1 and includes O–Si–O as well as O–M–O vibrations with M = octahedral cation, here Fe3+. Region 4 is between 450 cm−1 and 300 cm−1 and includes a series of strongly overlapping modes which arise from the motions of M1 and M2 cations of the pyroxene structure, correlated with a motion of the tetrahedral chain and tetrahedral tilting. Finally, region 5 of Wang [45] is below 300 cm−1 and mainly involves the motion of the M2 cations, together with M1 vibrations and tetrahedral tilt modes.
The general appearance of the Raman spectra of the synthetic end-member aegirine samples compare well with the spectra for natural species, which can be found in the RUFF-database, even if the literature data are distinctly less well resolved. Appendix A, Figure A5a gives a comparison with one of the spectra, deposited in the RUFF-project database, namely aegirine R040054 from Mont Saint-Hilaire, collected by Bob Downs (which is the best resolved data set reported). For the aegirine, synthesized at 200 °C and sintered at 900 °C, the Raman spectrum is shown in Figure 9a and it was used as the reference for data evaluation and peak fitting. For this sample, in total, 27 out of the 30 allowed Raman modes are clearly detectable and resolved. The division into subregions was slightly modified, mainly to facilitate data evaluation and discussion, the fitted peak positions are given in Table 3, together with the data obtained from the 180 °C and 225 °C sample. For comparison, the band positions for NaTi3+2O6 and a possible band assignment, mainly based on the one given by [43] is included. NaTi3+Si2O6 was chosen for comparison, as it also shows C2/c symmetry at room temperature [47,48] and structurally is closer to aegirine than e.g., jadeite NaAlSi2O6. Additionally, Fe3+ and Ti3+ have similar molar masses, so that the theoretical calculations available for NaTi3+Si2O6 may serve as a good model for band assignment [43].
In region 1, defined above 900 cm−1, five bands are resolved, which can be ascribed to stretching modes of the non-bridging Si–O1 and Si–O2 bonds. Most prominent in this sample is the strong and well resolved doublet at 948 cm−1 and 970 cm−1, with a small shoulder at 959 cm−1, fits to the different regions are shown in Appendix A, Figure A5b–f. For NaTiSi2O6, [48] calculate a triplet at 950, 958 and 986 cm−1, which is ascribed to the Si–Onbr stretching modes, in combination with Ti–O1, 2 motions. The well resolved band at 1041 cm−1 is ascribed to Si–Onbr stretching as in diopside or to a SiO4 breathing and out of phase vibration of the octahedra [48]. In region 2, which is defined between 900 cm−1 and 630 cm−1, three weak and one rather strong band at 864 cm−1 are resolved, all of them correspond to Si–O3 (bridging) stretching modes, the first two parallel x, the latter two parallel the yz direction [43]. The band at 675 cm−1 is also ascribed to a Si–Obr–Si stretch vibration [45] and a correlation with the Si–Si distance was found [49]. Region R3 is defined from 430 cm−1 to 630 cm−1 and consists of two resolved and three partly overlapping bands, the later one is developed as a doublet. Bands in this region are generally ascribed to a blend of bending motions of the octahedral and tetrahedral building blocks. Region R4 consists of 8 resolved bands, two of them at 339 cm−1 and 345 cm−1 are partly overlapped. At lower wavenumbers, first vibrations involving the M2 cations (Na) appear, while the remaining bands involve vibrations of ions at the octahedral and tetrahedral sites. Region 5 is well resolved and shows 5 bands, involving combined vibrations of Na and tetrahedral as well as octahedral sites. A tentative possible band assignment is included in Table 3 below.
Figure 9b depicts the Raman spectra of samples, synthesized at low temperatures. In the 130 °C/24 h sample some broad bumps are observed which are centered around 925 cm−1 and 685 cm−1. These are in the regions of Si–Onbr and Si–Obr stretching modes: their presence indicates that some SiO4 clusters/chain fragments may already exist, while PXRD showed no evidence for discrete diffraction peaks. These peaks in Raman spectra gain intensity and become more structured towards the 150 °C/24 h sample. Small broad peaks at 220 and 280 cm−1 probably correspond to hematite Fe2O3 as can be read off from Figure 9b. At a synthesis temperature of 160 °C, the Raman spectrum of aegirine already shows the main features, even if the linewidths are broad and peaks not well resolved, as is the case for the PXRD data. At 160 °C, fully developed Raman spectra can be observed.
In detailed inspection of the spectra, it was found that most of the modes shift towards higher wavenumbers with increasing synthesis/sintering temperature (Figure 9c). Generally, this shift with temperature is small, but highly non-linear, a typical example is shown for the band at 339 cm−1 in Figure 9d. Similar to structural parameters, the shift in band positions is large in the 170–225 °C region. The data obtained from the 200 °C sample, sintered at different temperatures show only small variations with increasing sintering temperature up to 600 °C, while for the ones, sintered at 800 °C and 900 °C data start to shift towards higher wavenumbers again (red-shift). Largest shifts of ~5 cm−1 are observed for the bands at 309 cm−1, 339 cm−1 (Figure 9d) and 366 cm−1, which involve tilting and bending vibrations of the tetrahedron and O–Fe–O bending vibrations. This correlates well the shortening of the Fe–O bond lengths, i.e., increasing bond strengths and consequently a shift towards larger wavenumbers. The bands at 529 cm−1 and 542 cm−1 remain rather constant, also involve O–Fe–O bending, which may be seen as a contradiction of the above statement. However, structural data suggest that the short Fe–O bond lengths remain almost constant at ~1.95 Å, independent of synthesis and sample treatment temperature, so these Raman vibrations may involve O2–Fe–O2.
Different to most of the modes, the 675 cm−1 band shows a linear shift towards higher wavenumbers with increasing temperature.

4. Summary and Conclusions

Aegirine NaFeSi2O6 was synthesized in phase-pure form at low temperatures down to 130 °C. To our best knowledge, this is the lowest temperature, where phase-pure NaFeSi2O6 has been reported in the literature. This low formation temperature might also have implications on the crystallization of aegirine in nature, which is far beyond classical hydrothermal conditions.
Already at the nanoscale the morphology of the crystals is well developed and tabular-needle like bundles grown from some common growth centers are found in TEM analysis. It is interesting to note that this is the very same habitus, which also is observed in macro-crystallites in flux growth experiments and is also very similar to the morphology of aegirine, found in nature, however, with the restriction that in natural aegirine, the (100) faces are prominently developed, while the low temperature crystallized samples are dominated by (110) faces.
Synthesis and sample treatments (sintering) temperature strongly affects the structural state. The SiO4 tetrahedra appear to be more distorted at low synthesis temperatures with elongated Si–O2 bonds towards the octahedral chain along b and shortened Si–O1 bonds towards the apex of the tetrahedron along the a-direction. With increasing synthesis temperature, these two bonds approach more similar values. The variation of the Si–O2 bonds at low synthesis temperatures does not affect the value of the b lattice parameter to large extent. This probably is due to the fact that the tetrahedral chains appear to be fully extended (O3–O3–O3 angle of 180°) at very low temperatures, but become somewhat kinked towards the typical values of 174°. This observation hints that first fragments of tetrahedral chains in aegirine formation may appear as fully extended. With increasing regularity of the individual polyhedra, the chain geometry is modified by changing the conformation state of the tetrahedra chains. The shortening in c is related to this increasing kinking. Generally, the structural building units (tetrahedral and octahedral sites) become more regular with increasing synthesis temperature, as indicated by the structural data from Rietveld refinement, but also as proved by the decreasing quadrupole splitting of Fe3+ for the case of the octahedral M1 site. Raman data already reveal some broad bumps in the region of SiO4 chain vibrations at 130 °C and 24 h synthesis time, which is indicative for some chain fragments which do not reveal a long-range periodicity, as no peaks are found in X-ray diffraction pattern. The shift in band positions towards higher wavenumbers is correlated with the decreasing bond-lengths, most evident for modes involving the octahedral site, which indeed show also the largest variations in structural parameters, supporting the general trend that the crystal structure becomes more ordered and less distorted. However, it has to be noted that band assignment in aegirine still is uncertain and tentative. As theoretical calculations are hindered due to the presence of paramagnetic Fe3+, more experimental work would be needed to fully understand the Raman spectra of NaFeSi2O6. Possible starting points are the performance of polarized single crystal studies of natural aegirine, in combination with study of the evolution of Raman bands along solid solution series, where band assignment is known, e.g., in diopside. Such studies are under way.

Supplementary Materials

The following are available online at https://www.mdpi.com/2075-163X/9/7/444/s1, Electronic Data S1: Full set of lattice and structural parameters as extracted from the XRD data analysis, Electronic data S2: VESTA—File for display of the aegirine crystal structure, based on the data obtained from the sample, synthesized at 200 °C and sintered at 900 °C for 24 h.

Author Contributions

Conceptualization, synthesis, X-ray diffraction, SEM, all data evaluation and interpretation, G.J.R.; synthesis, J.W.; X-ray diffraction and 57Fe Mössbauer data collection, G.T.; Raman spectra data collection, A.R.; TEM data collection, G.A.Z.

Funding

TEM measurements were carried out on an JEOL JEM F200 TEM which was funded by Interreg Österreich-Bayern 2014-2020 Project AB29-Synthese, Charakterisierung und technologische Fertigungsansätze für den Leichtbau “n2m“ (nano-to-macro). A.R. gratefully acknowledge financial support provided by the European Regional Development Fund and Interreg V-A Italy–Austria 2014–2020 through the Interreg Italy–Austria project ITAT 1023 InCIMA (http://www.elettra.eu/Prj/InCIMa/).

Acknowledgments

Open Access Funding by the University of Salzburg.

Conflicts of Interest

The authors declare no conflict of interest.

Appendix A

Table A1. Synthesis conditions of hydrothermal and additional heat treatment experiments and experimental results.
Temperature (°C)Duration (h)ColorPhase Content
13024dark reddish brownam (100)
13092dark reddish brownam (100)
130142reddish brownam (100)
130192Grey yellowae (80), am (20)
130310yellowae
15024Light yellow brownam (90), ae (10)
15048yellow-greenae
15072yellow-greenae
15096yellow-greenae
150120yellow-greenae
150168yellow-greenae
15524yellowae
16024yellowae
17024yellowae
18024yellowae
19024yellowae
20024yellowae
21024yellowae
22024pale yellowae
22524pale yellowae
23024pale yellowae
Annealing Experiment
130, 50024, 24intense red-brownam
130, 70024, 24red-brownae (85), he (15)
130, 90024, 24red- brownae (87), he (13)
200, 30024, 24yellowae
200, 40024, 24yellowae
200, 50024, 24yellowae
200, 55024, 24yellowae
200, 60024, 24yellowae
200, 65024, 24yellowae
200, 70024, 24yellowae
200, 75024, 24yellowae
200, 80024, 24pale yellowae
200, 85024, 24pale yellowae
200, 90024, 24pale yellowae
am = amorphous in powder X-ray diffraction, ae = aegirine NaFeSi2O6, he = hematite Fe2O3, numbers in parenthesis represent weight % values as determined by Rietveld refinement.
Table A2. Fractional atomic coordinates and isotropic atomic displacement parameters for aegirine, obtained at 200 °C and annealed at 900 °C for 24 h, as determined from Rietveld refinement of powder X-ray diffraction data (Rexp = 5.90%. Rwp = 6.5%, Rp = 5.02% Goodness of Fit = 1.10).
SiteoccxyzBiso
Na0.500.3010 (7)0.252.4 (4)
Fe0.500.8984 (3)0.252.0 (4)
Si1.00.2899 (3)0.0898 (4)0.2334 (7)2.0 (3)
O11.00.1140 (5)0.0830 (8)0.1386 (9)2.1 (4)
O21.00.3584 (5)0.2564 (7)0.3025 (9)1.4 (4)
O31.00.3523 (6)0.0068 (5)0.0127 (2)2.5 (4)
Figure A1. Part of the DTA run on a synthetic aegirine, synthesized at 230 °C and 24 h, the peak at 999 °C corresponds to the melting temperature; a small weight loss at the beginning of the heating (10°/min in synthetic air) is due to some adsorbed water.
Minerals 09 00444 g0a1
Figure A2. Typical Rietveld refinement plots as obtained from the final refinements of samples, synthesized at (a) 160 °C and (b) 230 °C for 24 h and (c) at 200 °C and annealed at 900 °C for additional 24 h.
Minerals 09 00444 g0a2aMinerals 09 00444 g0a2b
Figure A3. Variation of unit cell parameters (ae) for the aegirines, synthesized at different temperatures between 155 °C and 230 °C with a run duration of 24 h; (f) is the dimension-less microstrain.
Minerals 09 00444 g0a3aMinerals 09 00444 g0a3b
Figure A4. Correlation between crystallite size and microstrain for the aegirine samples of this study. (a) detailed view up to 100 nm crystallite size with the data of the low temperature synthesis (blue circles) and the 200 °C-24 h sample, annealed at different temperatures (green circles) (b) the same data as in (a) but the results for the hydrothermally synthesized samples of [4] are included.
Minerals 09 00444 g0a4
Figure A5. (a) Comparison of the Raman spectrum of the 900 °C sintered sample (blue) with the one of a natural aegirine sample as given in the RUFF data-base (red) and (bf) representative peak fittings in regions R1–R5 for the 900 °C sample.
Minerals 09 00444 g0a5

References

  1. Deer, W.A.; Howie, R.A.; Zussman, J. Single-Chain Silicates, 2nd ed.; Geological Soc.: London, UK, 2001; Volume 2A, p. VIII, 668 S. [Google Scholar]
  2. Decarreau, A.; Petit, S.; Vieillard, P.; Dabert, N. Hydrothermal synthesis of aegirine at 200 °C. Eur. J. Mineral. 2004, 16, 85–90. [Google Scholar] [CrossRef]
  3. Milton, C.; Eugster, H.P. Mineral assemblages of Green River formation. In Researches in Geochemistry; Abelson, H.P., Ed.; John Wiley & Sons: New York, NY, USA, 1959; pp. 118–150. [Google Scholar]
  4. Redhammer, G.J.; Amthauer, G.; Lottermoser, W.; Treutmann, W. Synthesis and structural properties of clinopyroxenes of the hedenbergite CaFe2+Si2O6-aegirine NaFe3+Si2O6 solid-solution series. Eur. J. Mineral. 2000, 12, 105–120. [Google Scholar] [CrossRef]
  5. Redhammer, G.J.; Amthauer, G.; Roth, G.; Tippelt, G.; Lottermoser, W. Single-crystal X-ray diffraction and temperature dependent 57Fe Mossbauer spectroscopy on the hedenbergite-aegirine (Ca,Na)(Fe2+,Fe3+)Si2O6 solid solution. Am. Mineral. 2006, 91, 1271–1292. [Google Scholar] [CrossRef]
  6. Dollase, W.A.; Gustafson, W.I. 57Fe Mossbauer spectral-analysis of the sodic clinopyroxenes. Am. Mineral. 1982, 67, 311–327. [Google Scholar]
  7. Redhammer, G.J.; Tippelt, G.; Amthauer, G.; Roth, G. Structural and 57Fe Mossbauer spectroscopic characterization of the synthetic NaFeSi2O6 (aegirine)-CaMgSi2O6 (diopside) solid solution series. Z. Fur Krist. 2012, 227, 396–410. [Google Scholar] [CrossRef]
  8. Nolan, J. Physical properties of synthetic and natural pyroxenes in the system diopside-hedenbergite-acmite. Mineral. Mag. 1969, 37, 216–229. [Google Scholar] [CrossRef]
  9. Yagi, K. System acmite-diopside and its bearing on stability relations of natural pyroxenes of acmite-hedenbergite-diopside series. Am. Mineral. 1966, 51, 976–1000. [Google Scholar]
  10. Redhammer, G.J.; Camara, F.; Alvaro, M.; Nestola, F.; Tippelt, G.; Prinz, S.; Simons, J.; Roth, G.; Amthauer, G. Thermal expansion and high-temperature P21/c-C2/c phase transition in clinopyroxene-type LiFeGe2O6 and comparison to NaFe(Si,Ge)2O6. Phys. Chem. Miner. 2010, 37, 685–704. [Google Scholar] [CrossRef]
  11. Secco, L.; Guastoni, A.; Nestola, F.; Redhammer, G.J.; Dal Negro, A. Crystal chemistry of aegirine as an indicator of P-T conditions. Mineral. Mag. 2007, 71, 321–326. [Google Scholar] [CrossRef]
  12. Jodlauk, S.; Becker, P.; Mydosh, J.A.; Khomskii, D.I.; Lorenz, T.; Streltsov, S.V.; Hezel, D.C.; Bohaty, L. Pyroxenes: A new class of multiferroics. J. Phys. Condens. Matter 2007, 19, 432201. [Google Scholar] [CrossRef]
  13. Redhammer, G.J.; Roth, G.; Paulus, W.; Andre, G.; Lottermoser, W.; Amthauer, G.; Treutmann, W.; Koppelhuber-Bitschnau, B. The crystal and magnetic structure of Li-aegirine LiFe3+Si2O6: a temperature-dependent study. Phys. Chem. Miner. 2001, 28, 337–346. [Google Scholar] [CrossRef]
  14. Redhammer, G.J.; Roth, G.; Treutmann, W.; Hoelzel, M.; Paulus, W.; Andre, G.; Pietzonka, C.; Amthauer, G. The magnetic structure of clinopyroxene-type LiFeGe2O6 and revised data on multiferroic LiFeSi2O6. J. Solid State Chem. 2009, 182, 2374–2384. [Google Scholar] [CrossRef]
  15. Redhammer, G.J.; Senyshyn, A.; Lebernegg, S.; Tippelt, G.; Dachs, E.; Roth, G. A neutron diffraction study of crystal and low-temperature magnetic structures within the (Na,Li) FeGe2O6 pyroxene-type solid solution series. Phys. Chem. Miner. 2017, 44, 669–684. [Google Scholar] [CrossRef]
  16. Redhammer, G.J.; Senyshyn, A.; Meven, M.; Roth, G.; Prinz, S.; Pachler, A.; Tippelt, G.; Pietzonka, C.; Treutmann, W.; Hoelzel, M. Nuclear and incommensurate magnetic structure of NaFeGe2O6 between 5 K and 298 K and new data on multiferroic NaFeSi2O6. Phys. Chem. Miner. 2011, 38, 139–157. [Google Scholar] [CrossRef]
  17. Redhammer, G.J.; Tippelt, G. The (Na,Li)FeGe2O6 clinopyroxene-type series: A temperature-dependent single-crystal X-ray diffraction and Fe-57 Mossbauer spectroscopic study. Phys. Chem. Miner. 2016, 43, 1–22. [Google Scholar] [CrossRef]
  18. Zhang, M.; Redhammer, G.J.; Salje, E.K.H.; Mookherjee, M. LiFeSi2O6 and NaFeSi2O6 at low temperatures: An infrared spectroscopic study. Phys. Chem. Miner. 2002, 29, 609–616. [Google Scholar] [CrossRef]
  19. Baum, M.; Komarek, A.C.; Holbein, S.; Fernández-Díaz, M.T.; André, G.; Hiess, A.; Sidis, Y.; Steffens, P.; Becker, P.; Bohatý, L.; et al. Magnetic structure and multiferroic coupling in pyroxene NaFeSi2O6. Phys. Rev. B 2015, 91, 214415. [Google Scholar] [CrossRef]
  20. Baum, M.; Schmalzl, K.; Steffens, P.; Hiess, A.; Regnault, L.P.; Meven, M.; Becker, P.; Bohatý, L.; Braden, M. Controlling toroidal moments by crossed electric and magnetic fields. Phys. Rev. B 2013, 88, 024414. [Google Scholar] [CrossRef]
  21. Drokina, T.V.; Bayukov, O.A.; Petrakovskii, G.A.; Velikanov, D.A.; Bovina, A.F.; Stepanov, G.N.; Ivanov, D.A. Synthesis and properties of NaFeGe2O6 polycrystals. Phys. Solid State 2008, 50, 2141–2144. [Google Scholar] [CrossRef]
  22. Drokina, T.V.; Petrakovskii, G.A.; Bayukov, O.A.; Bovina, A.F.; Shimchak, R.; Velikanov, D.A.; Kartashev, A.V.; Volkova, A.L.; Ivanov, D.A.; Stepanov, G.N. Properties of clinopyroxene LiFeGe2O6. Phys. Solid State 2010, 52, 2405–2408. [Google Scholar] [CrossRef]
  23. Drokina, T.V.; Petrakovskii, G.A.; Keller, L.; Schefer, J.; Balaev, A.D.; Kartashev, A.V.; Ivanov, D.A. Modulated magnetic structure in quasi-one-dimensional clinopyroxene NaFeGe2O6. J. Exp. Theor. Phys. 2011, 112, 121–126. [Google Scholar] [CrossRef]
  24. Drokina, T.V.; Petrakovskii, G.A.; Molokeev, M.S.; Bondarev, V.S.; Velikanov, D.A. Synthesis and study of structural, thermodynamic, and magnetic properties of NaxLi1-xFeGe2O6 (x = 0.1–0.9) compounds. Phys. Solid State 2016, 58, 1361–1370. [Google Scholar] [CrossRef]
  25. Drokina, T.V.; Petrakoyskii, G.A.; Molokeev, M.S.; Misyul, S.V.; Bondarev, V.S.; Velikanov, D.A.; Frontzek, M.; Schefer, J. Crystal and magnetic structures, phase transitions in quasi-one-dimensional pyroxenes Na0.5Li0.5FeGe2O6. J. Magn. Magn. Mater. 2015, 385, 243–249. [Google Scholar] [CrossRef]
  26. Ballet, O.; Coey, J.M.D.; Fillion, G.; Ghose, A.; Hewat, A.; Regnard, J.R. Magnetic order in acmite-NaFeSi2O6. Phys. Chem. Miner. 1989, 16, 672–677. [Google Scholar] [CrossRef]
  27. Baum, E.; Treutmann, W.; Behruzi, M.; Lottermoser, W.; Amthauer, G. Structural and magnetic properties of the clinopyroxenes NaFeSi2O6 and LiFeSi2O6. Z. Fur Krist. 1988, 183, 273–284. [Google Scholar] [CrossRef]
  28. Zhou, S.; Zeier, W.G.; Kemei, M.C.; Sougrati, M.T.; Mecklenburg, M.; Melot, B.C. Hydrothermal Preparation and Magnetic Properties of NaFeSi2O6: Nanowires vs Bulk Samples. Inorg. Chem. 2014, 53, 12396–12401. [Google Scholar] [CrossRef]
  29. Bowen, N.L.; Schairer, J.F.; Willems, H.W.V. The ternary system; Na2SiO3–Fe2O3–SiO2. Am. J. Sci. 1930, 20, 405–455. [Google Scholar] [CrossRef]
  30. Topas Version 4.1; Bruker AXS Inc.: Madison, WI, USA, 2012.
  31. Coelho, A. TOPAS and TOPAS-Academic: An optimization program integrating computer algebra and crystallographic objects written in C++. J. Appl. Crystallogr. 2018, 51, 210–218. [Google Scholar] [CrossRef]
  32. Balzar, D. Voigt-Function Model in Diffraction Line-Broadening Analysis. In Defect and Microstructure Analysis by Diffraction; Snyder, R.L., Fiala, J., Bunge, H.J., Eds.; Oxford University Press: Oxford, UK, 1999. [Google Scholar]
  33. Redhammer, G.J.; Roth, G. Structural variations in the aegirine solid-solution series (Na,Li)FeSi2O6 at 298 K and 80 K. Z. Fur Krist. 2002, 217, 63–72. [Google Scholar] [CrossRef]
  34. Cheary, R.W.; Coelho, A. A fundamental parameters approach to X-ray line-profile fitting. J. Appl. Crystallogr. 1992, 25, 109–121. [Google Scholar] [CrossRef]
  35. Cheary, R.W.; Coelho, A.A.; Cline, J.P. Fundamental parameters line profile fitting in laboratory diffractometers. J. Res. Natl. Inst. Stand. Technol. 2004, 109, 1–25. [Google Scholar] [CrossRef]
  36. Lagarec, K.; Rancourt, D.G. Extended Voigt-based analytic lineshape method for determining N-dimensional correlated hyperfine parameter distributions in Mossbauer spectroscopy. Nucl. Instrum. Methods Phys. Res. Sect. B-Beam Interact. Mater. At. 1997, 129, 266–280. [Google Scholar] [CrossRef]
  37. Rancourt, D.G.; Ping, J.Y. Voigt-based methods for arbitrary-shape static hyperfine parameter distributions in Mossbauer spectroscopy. Nucl. Instrum. Methods Phys. Res. Sect. B-Beam Interact. Mater. At. 1991, 58, 85–97. [Google Scholar] [CrossRef]
  38. Rietveld, H.M. A profile refinement method for nuclear and magnetic studies. J. Appl. Crystallogr. 1969, 2, 65–71. [Google Scholar] [CrossRef]
  39. Balzar, D.; Popa, N.C. Crystallite Size and Residual Strain/Stress Modeling in Rietveld Refinement. In Diffraction Analysis of the Microstructure of Materials; Mittemeijer, E.J., Scardi, P., Eds.; Springer: Berlin, Germany, 2004; pp. 125–145. [Google Scholar]
  40. Prencipe, M.; Mantovani, L.; Tribaudino, M.; Bersani, D.; Lottici, P.P. The Raman spectrum of diopside: A comparison between ab initio calculated and experimentally measured frequencies. Eur. J. Mineral. 2012, 24, 457–464. [Google Scholar] [CrossRef]
  41. Prencipe, M. Simulation of vibrational spectra of crystals by ab initio calculations: An invaluable aid in the assignment and interpretation of the Raman signals. The case of jadeite (NaAlSi2O6). J. Raman Spectrosc. 2012, 43, 1567–1569. [Google Scholar] [CrossRef]
  42. Prencipe, M.; Maschio, L.; Kirtman, B.; Salustro, S.; Erba, A.; Dovesi, R. Raman spectrum of NaAlSi2O6 jadeite. A quantum mechanical simulation. J. Raman Spectrosc. 2014, 45, 703–709. [Google Scholar] [CrossRef]
  43. Popovic, Z.V.; Konstantinovic, M.J.; Popov, V.N.; Cantarero, A.; Dohcevic-Mitrovic, Z.; Isobe, M.; Ueda, Y. Optical phonons in the NaTiSi2O6 oxide with S = 1/2 spin chains. Phys. Rev. B 2005, 71. [Google Scholar] [CrossRef]
  44. Stangarone, C.; Tribaudino, M.; Prencipe, M.; Lottici, P.P. Raman modes in Pbca enstatite (Mg2Si2O6): An assignment by quantum mechanical calculation to interpret experimental results. J. Raman Spectrosc. 2016, 47, 1247–1258. [Google Scholar] [CrossRef]
  45. Wang, A.; Jolliff, B.L.; Haskin, L.A.; Kuebler, K.E.; Viskupic, K.M. Characterization and comparison of structural and compositional features of planetary quadrilateral pyroxenes by Raman spectroscopy. Am. Mineral. 2001, 86, 790–806. [Google Scholar] [CrossRef]
  46. Lambruschi, E.; Aliatis, I.; Mantovani, L.; Tribaudino, M.; Bersani, D.; Redhammer, G.J.; Lottici, P.P. Raman spectroscopy of CaM2+Ge2O6 (M2+ = Mg, Mn, Fe, Co, Ni, Zn) clinopyroxenes. J. Raman Spectrosc. 2015, 46, 586–590. [Google Scholar] [CrossRef]
  47. Redhammer, G.J.; Ohashi, H.; Roth, G. Single-crystal structure refinement of NaTiSi2O6 clinopyroxene at low temperatures (298 <T <100 K). Acta Crystallogr. Sect. B 2003, 59, 730–746. [Google Scholar] [CrossRef]
  48. Popovic, Z.S.; Sljivancanin, Z.V.; Vukajlovic, F.R. Sodium pyroxene NaTiSi2O6: Possible haldane spin-1 chain system. Phys. Rev. Lett. 2004, 93, 036401. [Google Scholar] [CrossRef]
  49. Ohashi, H.; Sekita, M. Raman Spectroscopic Study of the Si–O–Si Stretching Vibration in Clinopyroxenes. J. Jpn. Assoc. Mineral. Petrol. Econ. Geol. 1982, 77, 455–459. [Google Scholar] [CrossRef]
Figure 1. Comparison of color in aegirine synthesis at different temperatures and synthesis times. (a) sample synthesized at 130 °C and 24 h; (b) sample synthesized at 150 °C and 24 h; (c) sample synthesized at 150 °C and 48 h; (d) sample synthesized at 150 °C and 168 h; (e) sample synthesized at 130 °C and 192 h; (f) sample synthesized by ceramic sintering at 900 °C; (g) sample synthesized at 230 °C and 24 h.
Minerals 09 00444 g001
Figure 2. Bright field Transmission electron microscopy images of aegirine NaFeSi2O6, grown at 160 °C (a,b) and 220 °C (ce) The crystallographic orientation of the crystallites was identified via Fast Fourier Transform (FFT) from the region marked with the red square in the High Resolution TEM image (HRTEM) (e) The image in (f) is an optical microscope photograph of an aegirine aggregate, synthesized as macro-crystals via flux growth, the grid size is 1 × 1 mm.
Minerals 09 00444 g002
Figure 3. X-ray powder diffraction pattern of aegirine NaFeSi2O6 for different series of synthesis and thermal treatment: (a) variation of synthesis temperature at fixed synthesis time of 24 h, (b) variation in synthesis time at 130 °C, (c) variation in synthesis time at 150 °C and (d) effect of additional heat treatment at different temperatures on the sample, obtained at 200 °C/24 h.
Minerals 09 00444 g003
Figure 4. Variation of crystallite size (based on the volume-based integral breath) for aegirine, obtained (a) from the 24 h experiments at different temperatures and (b) for the tempering series, done on the 200 °C sample at different temperatures between 300 °C and 900 °C.
Minerals 09 00444 g004
Figure 5. Variation of unit cell parameters (ae) for the aegirines, synthesized at different temperatures between 155 °C and 230 °C (blue circles), for the aegirine obtained at 200 °C and sintered at different temperatures (green circles) and aegirines obtained from hydrothermal synthesis by [4] and reevaluated in this study (orange triangles), (f) gives the variation of dimensionless strain. Polynomial functions of 2nd to 3rd order were fitted to the data and serves as a guide to the eye only.
Minerals 09 00444 g005aMinerals 09 00444 g005b
Figure 6. Polyhedral projection of the crystal structure of synthetic aegirine, as refined from the powder X-ray data of the sample, synthesized at 200 °C and sintered at 900 °C for 24 h: (a) viewed along the a-axis, (b) viewed along the b-axis. The data are available for display as Supplementary Material S2.
Minerals 09 00444 g006
Figure 7. Variations of selected structural parameters of aegirine, synthesized and treated at different temperatures, parameters determined from Rietveld analysis of X-ray powder diffraction data: (a) variation of the Si–O2 bond lengths with synthesis temperature, (b) variation of the tetrahedral bridging angle O3–O3–O3 with synthesis temperature, (c) variation of the Fe–O1 bond lengths with synthesis temperature and (d) variation of the Na–O3 bond lengths with synthesis temperature.
Minerals 09 00444 g007
Figure 8. Selected 57Fe Mössbauer spectra of NaFeSi2O6, synthesized at (a) 150 °C and 24 h, (b) at 200 °C, with an additional heat treatment at 900 °C for 24 h. (c) shows the extracted Fe3+ quadrupole splitting distribution and (d) gives the variation of weighted average Fe3+ quadrupole splitting as a function of synthesis conditions.
Minerals 09 00444 g008
Figure 9. Selected Raman spectra of aegirine, NaFeSi2O6, synthesized at (a) 200 °C and sintered at 900 °C, (b) at 130 °C, 150 °C and 160°C in comparison with the spectrum of hematite, (c) gives a detail of the region R3 as a function of increasing synthesis/thermal treatment temperature and in (d) the shifts with temperature of the Raman mode at 337 cm−1 is shown.
Minerals 09 00444 g009aMinerals 09 00444 g009b
Table 1. Unit cell dimensions, crystallite size and microstrain as determined from Rietveld analysis of powder X-ray diffraction data of aegirine NaFeSi2O6, synthesized at different temperatures T and holding times d, and for sample material of the 200 °C/24 h experiment, sintered at different temperatures for 24 h each. IB is the crystallite size, obtained from the integral breath of the peaks.
T (°C)d (h)a (Å)b (Å)c (Å)β (°)Vol.3)IB (nm) ε 0
1301969.739 (3)8.806 (3)5.3207 (15)107.34 (2)435.568.10 (15)0.09 (3)
1303109.717 (2)8.8034 (19)5.3121 (6)107.295 (12)433.8710.54 (16)0.13 (2)
150489.707 (2)8.804 (2)5.3135 (11)107.305 (15)433.549.66 (16)0.130 (18)
150729.7033 (18)8.8017 (19)5.3124 (9)107.303 (11)433.1811.9 (2)0.134 (12)
150969.7018 (18)8.8027 (18)5.3110 (9)107.309 (12)433.0412.3 (2)0.132 (13)
1501209.7004 (13)8.8026 (13)5.3105 (7)107.305 (8)432.9313.41 (17)0.129 (9)
1501689.6957 (13)8.7996 (13)5.3083 (6)107.322 (8)432.3515.0 (2)0.120 (9)
155249.701 (3)8.804 (2)5.3131 (11)107.287 (15)433.249.14 (14)0.127 (19)
160249.697 (2)8.8026 (19)5.3111 (10)107.293 (13)432.8610.16 (14)0.129 (15)
170249.6948 (16)8.8022 (15)5.3098 (7)107,313 (9)432.5913.2 (2)0.129 (9)
180249.6893 (12)8.8010 (12)5.3083 (6)107.328 (7)432.1215.24 (18)0.125 (8)
190249.6870 (10)8.7999 (10)5.3068 (5)107.345 (6)431.8118.1 (2)0.115 (6)
200249.6817 (9)8.8018 (9)5.3052 (4)107.356 (4)431.5120.3 (3)0.115 (7)
210249.6804 (9)8.8003 (9)5.3044 (5)107.362 (5)431.2922.5 (3)0.118 (5)
215249.6804 (8)8.8012 (8)5.3040 (4)107.367 (5)431.3024.0 (3)0.101 (5)
220249.6789 (9)8.8011 (9)5.3036 (4)107.371 (6)431.1825.8 (4)0.108 (5)
225249.6787 (7)8.8007 (7)5.3038 (3)107.372 (4)431.1727.4 (3)0.118 (4)
230249.6769 (7)8.8004 (7)5.3036 (3)107.377 (4)431.0428.1 (3)0.101 (4)
Sample from 200 °C/24 h annealed at:
300249.6729 (10)8.7988 (10)5.3025 (5)107.401 (6)430.6519.9 (3)0.112 (6)
400249.6663 (11)8.7978 (11)5.3007 (5)107.416 (7)430.1320.2 (3)0.116 (6)
500249.6623 (9)8.7981 (9)5.2980 (5)107.421 (6)429.7220.0 (2)0.115 (5)
550249.6608 (9)8.7981 (9)5.2971 (4)107.421 (5)429.5820.0 (3)0.115 (6)
600249.6576 (10)8.7966 (11)5.2963 (5)107.418 (7)429.3120.0 (3)0.121 (6)
650249.6563 (198.7978 (10)5.2964 (5)107.419 (6)429.3220.8 (3)0.120 (6)
700249.6570 (13)8.7975 (14)5.2956 (6)107.428 (8)429.2420.9 (4)0.121 (7)
750249.6571 (8)8.7979 (8)5.2955 (4)107.424 (6)429.2828.7 (4)0.115 (4)
800249.6569 (5)8.7977 (5)5.2961 (3)107.427 (3)429.2938.0 (4)0.083 (3)
850249.6573 (3)8.7974 (3)5.2952 (5)107.426 (2)429.2664.6 (7)0.044 (4)
900249.6566 (2)8.7977 (2)5,2947 (1)107.424 (15)429.1892 (1)0.015 (3)
Table 2. 57Fe Mössbauer parameter for the aegirines, synthesized in this study.
SampleIS (mm/s)QS (mm/s)FWHM (mm/s)Area (%)SiteRed. χ2
200 °C_T 900 °C0.393 (3)0.284 (2)0.227 (3)100[6]Fe3+1.372
200 °C-24 h0.395 (2)0.357 (2)0.262 (3)100[6]Fe3+1.102
180 °C-24 h0.3946 (19)0.378 (2)0.260 (4)97.9 (6)[6]Fe3+1.040
0.194 (8)1.055 (7)0.264 (6)2.1 (6)[4]Fe3+
170 °C-24 h0.396 (3)0.414 (2)0.271 (7)94.7 (8)[6]Fe3+1.551
0.181 (4)0.946 (6)0.273 (6)5.3 (8)[4]Fe3+
160 °C-24 h0.395 (2)0.428 (2)0.274 (4)94 (2)[6]Fe3+1.478
0.185 (4)1.000 (5)0.281 (5)6 (2)[4]Fe3+
150 °C-24 h0.356 (6)0.659 (8)0.36 (2)100[6]Fe3+0.953
IS = Isomer shift, QS = quadrupole splitting, FWHM = line width given as full width at half maximum, Area = relative proportion if the doublet on total iron. The area weighted average values of the quadrupole splitting distribution is given in the Table.
Table 3. Fitted band positions (given in cm−1) in synthetic aegirine, obtained at different temperatures, compared to the Raman band positions in C2/c NaTiSi2O6.
180 °C-24 h225 °C-24 h200 °C_T 900 °CNaTiSi2O6 §Possible Band Assignment &
calc.obs.Adopted from [43]
---111-Na-vibrations, SiO4 tilt, bend
130.4131.9132.9147150.8Na-vibrations, SiO4 tilt, bend
158.6159.0159.8165176.6Na-vibration //z
178.1178.5178.7184188.8Na-vibrations, SiO4 and FeO6 bend
190.0190.7191.6195208.6Obr–Si–Obr bending
210.5211.3212.0212220.8Na-vibrations, SiO4 and FeO6 bend
262.3262.7263.2250266.5Na-vibration, O–Fe–O bend
272.9273.9275.0272275.4Na-vibration, O–Si–O bend
290.8291.5292.2282304.4Na- and FeO6 vibration
305.9307.6309.1307-SiO4 tilt, bend, Fe vibration
336.4338.0339.2309329.3SiO4 tilt, O–Fe–O bend
345.0345.2345.4352-SiO4 tilt
364.4365.5366.6362388.0O–Fe–O bend
382.4382.9383.4452-O–Fe–O bend
460.8462.6462.7466468.2O–Fe–O bend
494.6495.3496.2487494.3O–Si–O bend
528.5528.7528.9537-O–Fe–O bend
541.4541.7541.9543553.6O–Fe–O, O–Si–O bend
558.5559.2560.1574-O–Si–O bending
---627624.2Si–Onbr, Ti–O stretching
675.0675.0676.7693673.3Si–Obr stretching // x; Si–Obr–Si bend
755.4756.5757.9748750.0Si–Obr stretching // x
804.1805.0804.9821837.6Si–Obr stretching // yz
864.4864.9865.3870-Si–Obr stretching // yz
---908-Si–Onbr stretching
947.1947.9948.7950947.6Si–Onbr stretching
959.6959.6959.7958-Si–Onbr stretching
970.9971.6971.6968693.7Si–Onbr stretching, asym.
972.8998.81014.210171023.6Si–O4, TiO4 breathing
1041.21042.01042.110471038Si–Onbr stretching, asym.
§ data from [43], & band position assignment following [43], calc. = caluclated, obs. = observed band-positions in [43].

