1. Introduction
For the past three decades, the seismic reflection method has shown promising results for the exploration of volcanogenic massive sulfide (VMS) deposits [
1,
2,
3]. This success is largely attributable to their ore composition of high-density sulfide minerals, including low-seismic velocity minerals, such as chalcopyrite, pyrrhotite, sphalerite, and high-velocity pyrite. The sulfide-dominant compositions of these deposits generally result in high impedance contrasts at contacts with their silicate-dominant volcanogenic host rocks [
1,
2]. Although the direct detection of sulfide ore will likely remain the primary objective of any 3D seismic exploration endeavor, seismic imaging of the more regional-scale hydrothermal alteration system associated with VMS deposits may provide important geological insight, widening the scope of seismic exploration from direct detection to indirect targeting in areas with favorable but yet undemonstrated potential. Indirect targeting is a viable option in cases where sulfide ore lenses have limited thickness and lateral extent due to primary ore forming conditions or subsequent tectonic dismemberment, rendering their seismic detection challenging. Alternatively, dependent on the design of the survey, tectonic processes may have steepened the ore zone, which may also hamper their seismic detection.
This paper reports the integrated modeling of seismic rock properties, lithogeochemistry, and estimates of mineral abundance from scanning electron microscopy-X-ray energy dispersive spectroscopy (SEM-EDS) to gain more insight into the largely unknown potential of detecting VMS-related hydrothermal alteration. The objective here is to widen the perspective from the seismic properties of the sulfide ore minerals to the silicate-dominant mineral assemblages of VMS-proximal hydrothermal conduits.
First, we analyze the relationships between seismic rock property logs, lithofacies logs, and drill core lithogeochemistry, providing insight into the effect of protolith composition and the intensity of hydrothermal alteration on seismic rock property variations. Secondly, we model the seismic properties of mineral mixtures by estimating their abundances from SEM-EDS images of thin sections cut from 11 drill core samples. When these estimates are combined with the appropriate mineral velocities and densities, the mixture-modeled P-wave velocity and density can be computed, which can then be compared with the seismic rock property measurements of these samples. Collectively, the estimated mineral percentages and modeled seismic rock properties allow the elucidation of which minerals play a dominant role in producing the observed effects of hydrothermal alteration on the P-wave velocity and density measurements. Thirdly, we compare the seismic response of synthetic models of VMS ore systems metamorphosed in the lower greenschist and amphibolite facies to assess the effects of metamorphic grade on the potential for detecting hydrothermal alteration zones in seismic data. Finally, on the basis of these results, we revisit previously reported interpretations of the 3D seismic cube acquired over the Lalor VMS deposit [
4,
5] to investigate if the response of hydrothermal alteration can actually be recognized in the seismic data.
2. Geological Setting
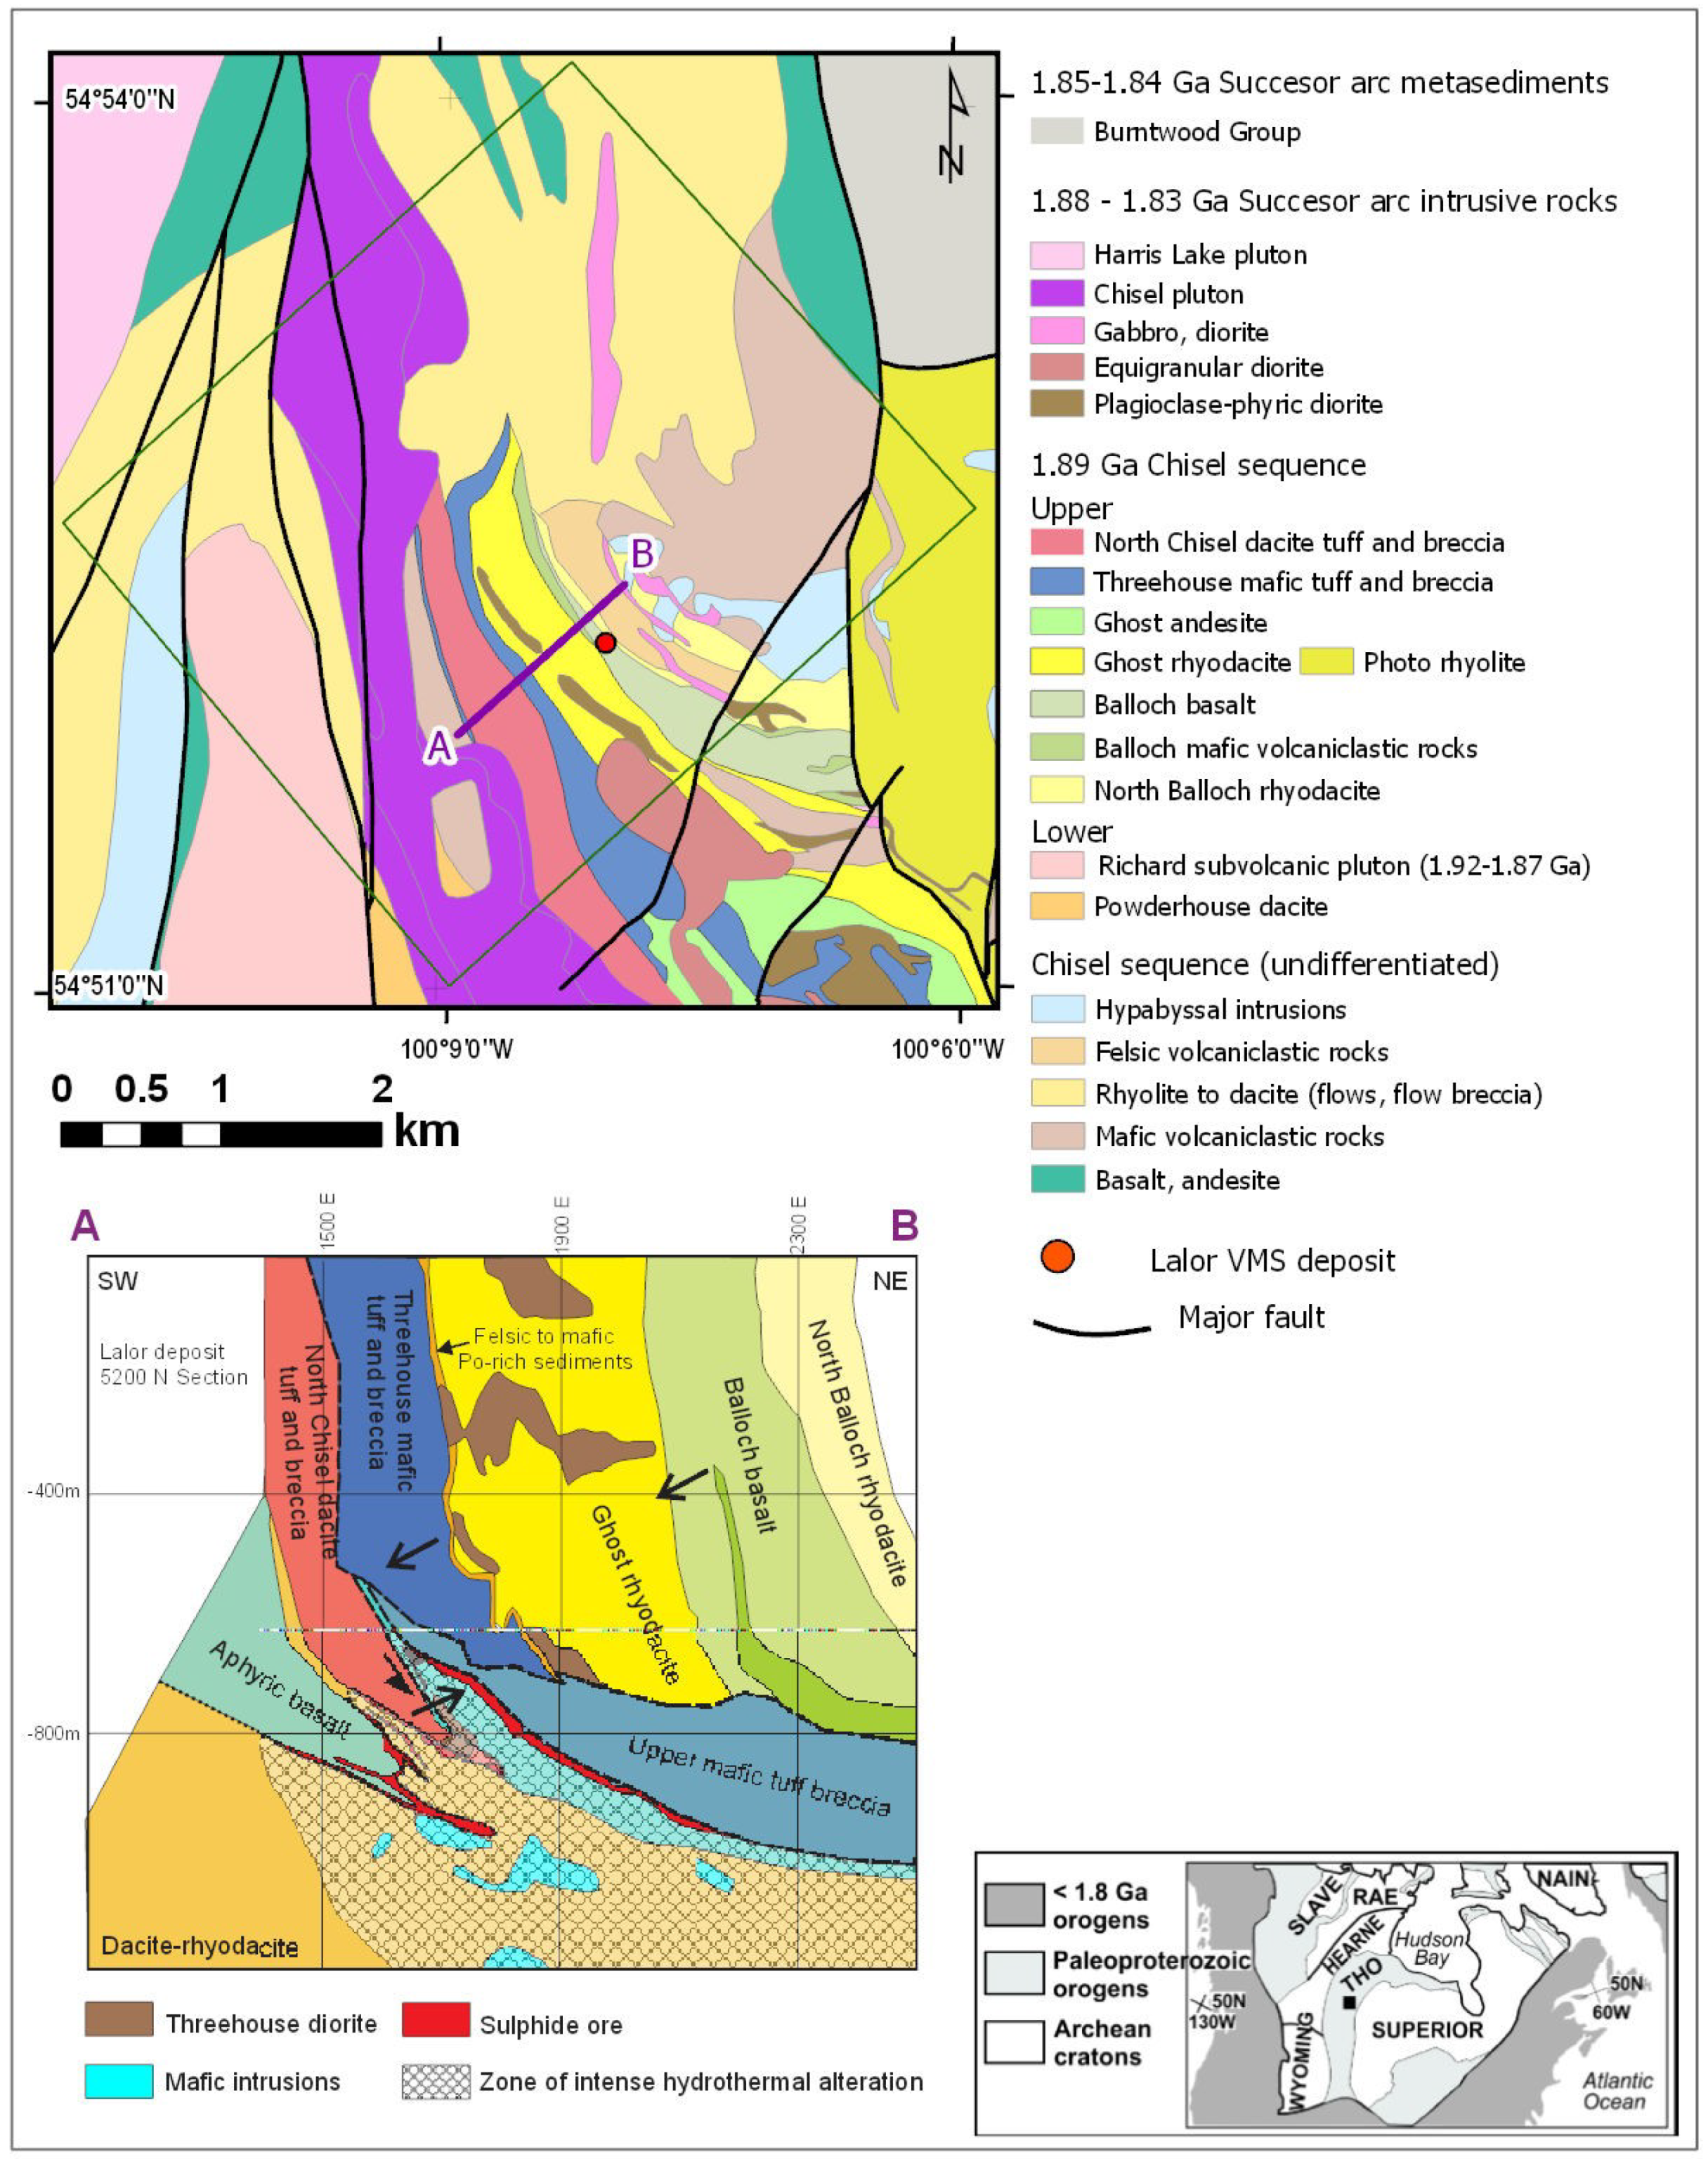
The Lalor volcanogenic massive sulfide (VMS) deposit is located near Snow Lake, Manitoba, Canada, about 700 km north of Winnipeg, and is hosted in the volcanic, volcaniclastic, and intrusive rocks of the Snow Lake arc assemblage of the Paleoproterozoic Flin Flon greenstone belt (
Figure 1).
The Snow Lake arc assemblage comprises a 6 km thick section of three volcanic successions, displaying a geodynamic evolution from a primitive arc (Anderson sequence to the south) to a mature arc (Chisel sequence) to an arc-rift (Snow Creek sequence to the northeast) setting [
6]. The 1.89 Ga volcanic sequences were intruded by 1.88–1.84 Ga successor-arc felsic and mafic plutons, deformed by isoclinal folds and thrusts, and subsequently interleaved with their 1.86–1.84 Ga successor arc sedimentary cover by continued fold-thrust style tectonics [
7,
8], during which the peak upper almandine-amphibolite facies metamorphic conditions were reached at approximately 1.82–1.81 Ga [
6].
VMS deposits in the Snow Lake arc sequence mainly occur within the Anderson and Chisel sequences. In contrast to the Cu-rich VMS-deposit hosted in the Anderson sequence, most VMS deposits in the Chisel sequence are Zn-rich and are dominantly hosted in mafic and intermediate to felsic volcanic and volcaniclastic rocks. The Chisel sequence has been subdivided into the lower and upper subsequences [
9], forming the footwall and hanging wall, respectively, of a structural contact 10–200 m above the massive sulfide ore lenses of the Zn-rich VMS deposits (Chisel, Chisel North, Ghost, Lost, and Lalor,
Figure 1). This contact has been tentatively interpreted as a thrust fault on the basis of the contrasting lithogeochemical trace element signatures of its hanging wall and footwall sequences, and an abrupt change in dip, which is associated with opposing facing directions [
6].
A large subconcordant hydrothermal alteration system, developed in the footwall of the Zn-rich VMS deposit, is closely associated in space and time to the magmatic evolution of the Richards subvolcanic intrusion [
10,
11] (
Figure 1). Disconformable alteration zones that can be traced to the Chisel, Chisel North, and Lalor deposits are rooted within it [
10,
11]. The footwall hydrothermal alteration in the Lower Chisel subsequence evolved in two stages. The first stage produced a semi-conformable zone of albitization, silicification, and epidotization, 1–2 km below the deposits that are spatially associated with synvolcanic dykes and intrusions. The second stage produced sub-concordant zones of intense hydrothermal alteration in the immediate footwall of the massive sulfide deposits marking their feeder conduits [
10,
11]. These hydrothermally-altered rocks were, after metamorphism in the amphibolite facies, transformed into schist and gneiss with aluminum-silicate porphyroblasts of garnet, staurolite, cordierite, kyanite and anthophyllite [
10,
11,
12]. Alteration in close proximity to the sulfide ore zones at Lalor also includes pervasive zones of finely disseminated sulfides (pyrite, pyrrhotite, sphalerite, chalcopyrite, and galena) associated with carbonate, tremolite, talc, and chlorite-rich rocks [
10,
12]. Four chemical associations can be distinguished in the zone of intense hydrothermal alteration in the footwall of the Lalor VMS deposit on the basis of metamorphic mineral assemblages (
Table 1). These mineral assemblages reflect lithogeochemical variations of different volcanic protoliths, as well as metasomatism during hydrothermal alteration and subsequent metamorphic crystallization [
12].
The Lalor deposit consists of 12 mineralized zones, starting at a vertical depth of 570 m and extending down to approximately 1160 m. The mineralization zones trend to the northwest and have dips between 10° and 30° to the NNE. They are generally thin (average thickness is less than 12 m) and vary in size and grade. The deposit comprises six zinc-rich and six gold-rich zones [
13]. The zinc-rich zones are the largest and shallowest zones of the deposit, and generally comprise near-massive to massive sulfide mineralization. Sulfides in the zinc-rich zones dominantly consist of pyrite crystals and sphalerite that is interstitial to the pyrite. The deposit also includes six gold-rich zones below the Zn-rich zones in the footwall rocks. The gold zones (including 8.8 Mt at 4.6 g/t Au: [
13,
14]) are disseminated with some stringers of sulfide mineralization. These zones contain a low amount of iron sulfide, typically less than 4–5%. The deepest gold zones are also associated with higher copper grades (average grade of 4.64% Cu), suggesting that these may represent feeder zones of the VMS ore system.
The ore lenses of the Lalor deposit, together with the host rocks, were affected by a polyphase deformation history of isoclinal folding and thrust faulting. The main foliation is a S2 penetrative mineral shape to gneissic fabric, with local evidence of the transposition of F1 isoclinal folds [
8,
15]. The F2 folds are also isoclinal, verging towards the south and involving the upper massive sulfide ore lenses. The F2 folds were refolded by open N–NE upright F3 folds, locally resulting in Type 1 [
16] fold interference patterns [
15]. The limbs of these fold structures are locally attenuated by shear zones, often displaying the boudinage of competent rock units and quartz-carbonate veins (see [
17] for the nomenclature used for labelling fold structures and associated foliations in rocks affected by multiple phases of deformation).
3. Integrated Analyses of Seismic Wireline Logs and Drill Core Lithogeochemistry
The wireline log data acquired in ten boreholes located close to or intersecting the deposit were used in previous interpretations to show that massive sulfide mineralization and felsic-mafic host rock contacts generate the dominant high-amplitude seismic reflections at Lalor [
4,
5] (see also
Section 6). Herein, we reanalyze the wireline logs to investigate the additional effects of hydrothermal alteration on acoustic impedance contrast. Since the majority of seismic surveys in hard rock exploration, including the Lalor seismic cube, focus on P-wave reflectivity, shear wave velocities were excluded from the analysis.
The results obtained from the wireline logs were in general supported with P-wave velocity and density measurements on core samples, although some differences were observed between the two types of measurements. The γ-γ density logs showed a strong correlation (
r = 0.85,
n = 23) with co-located density measurements of drill core samples [
18]. The sonic wireline logs, however, were not collocated with the core samples that were subjected to seismic velocity measurements. Nevertheless, a comparison of drill core P-wave velocity measurements with interpolated P-wave velocity values of a 3D grid model obtained by kriging the wireline log data yielded a root mean square error of 0.29 km/s (
n = 27) [
5]. All drill core samples subjected to the SEM-EDS analysis were previously subjected to seismic rock property measurements (
Table 2), which allowed the modeling of seismic rock properties from the mineral volume fractions (see
Section 4). For the procedures used in measuring these density and P-wave velocity measurements, refer to [
5].
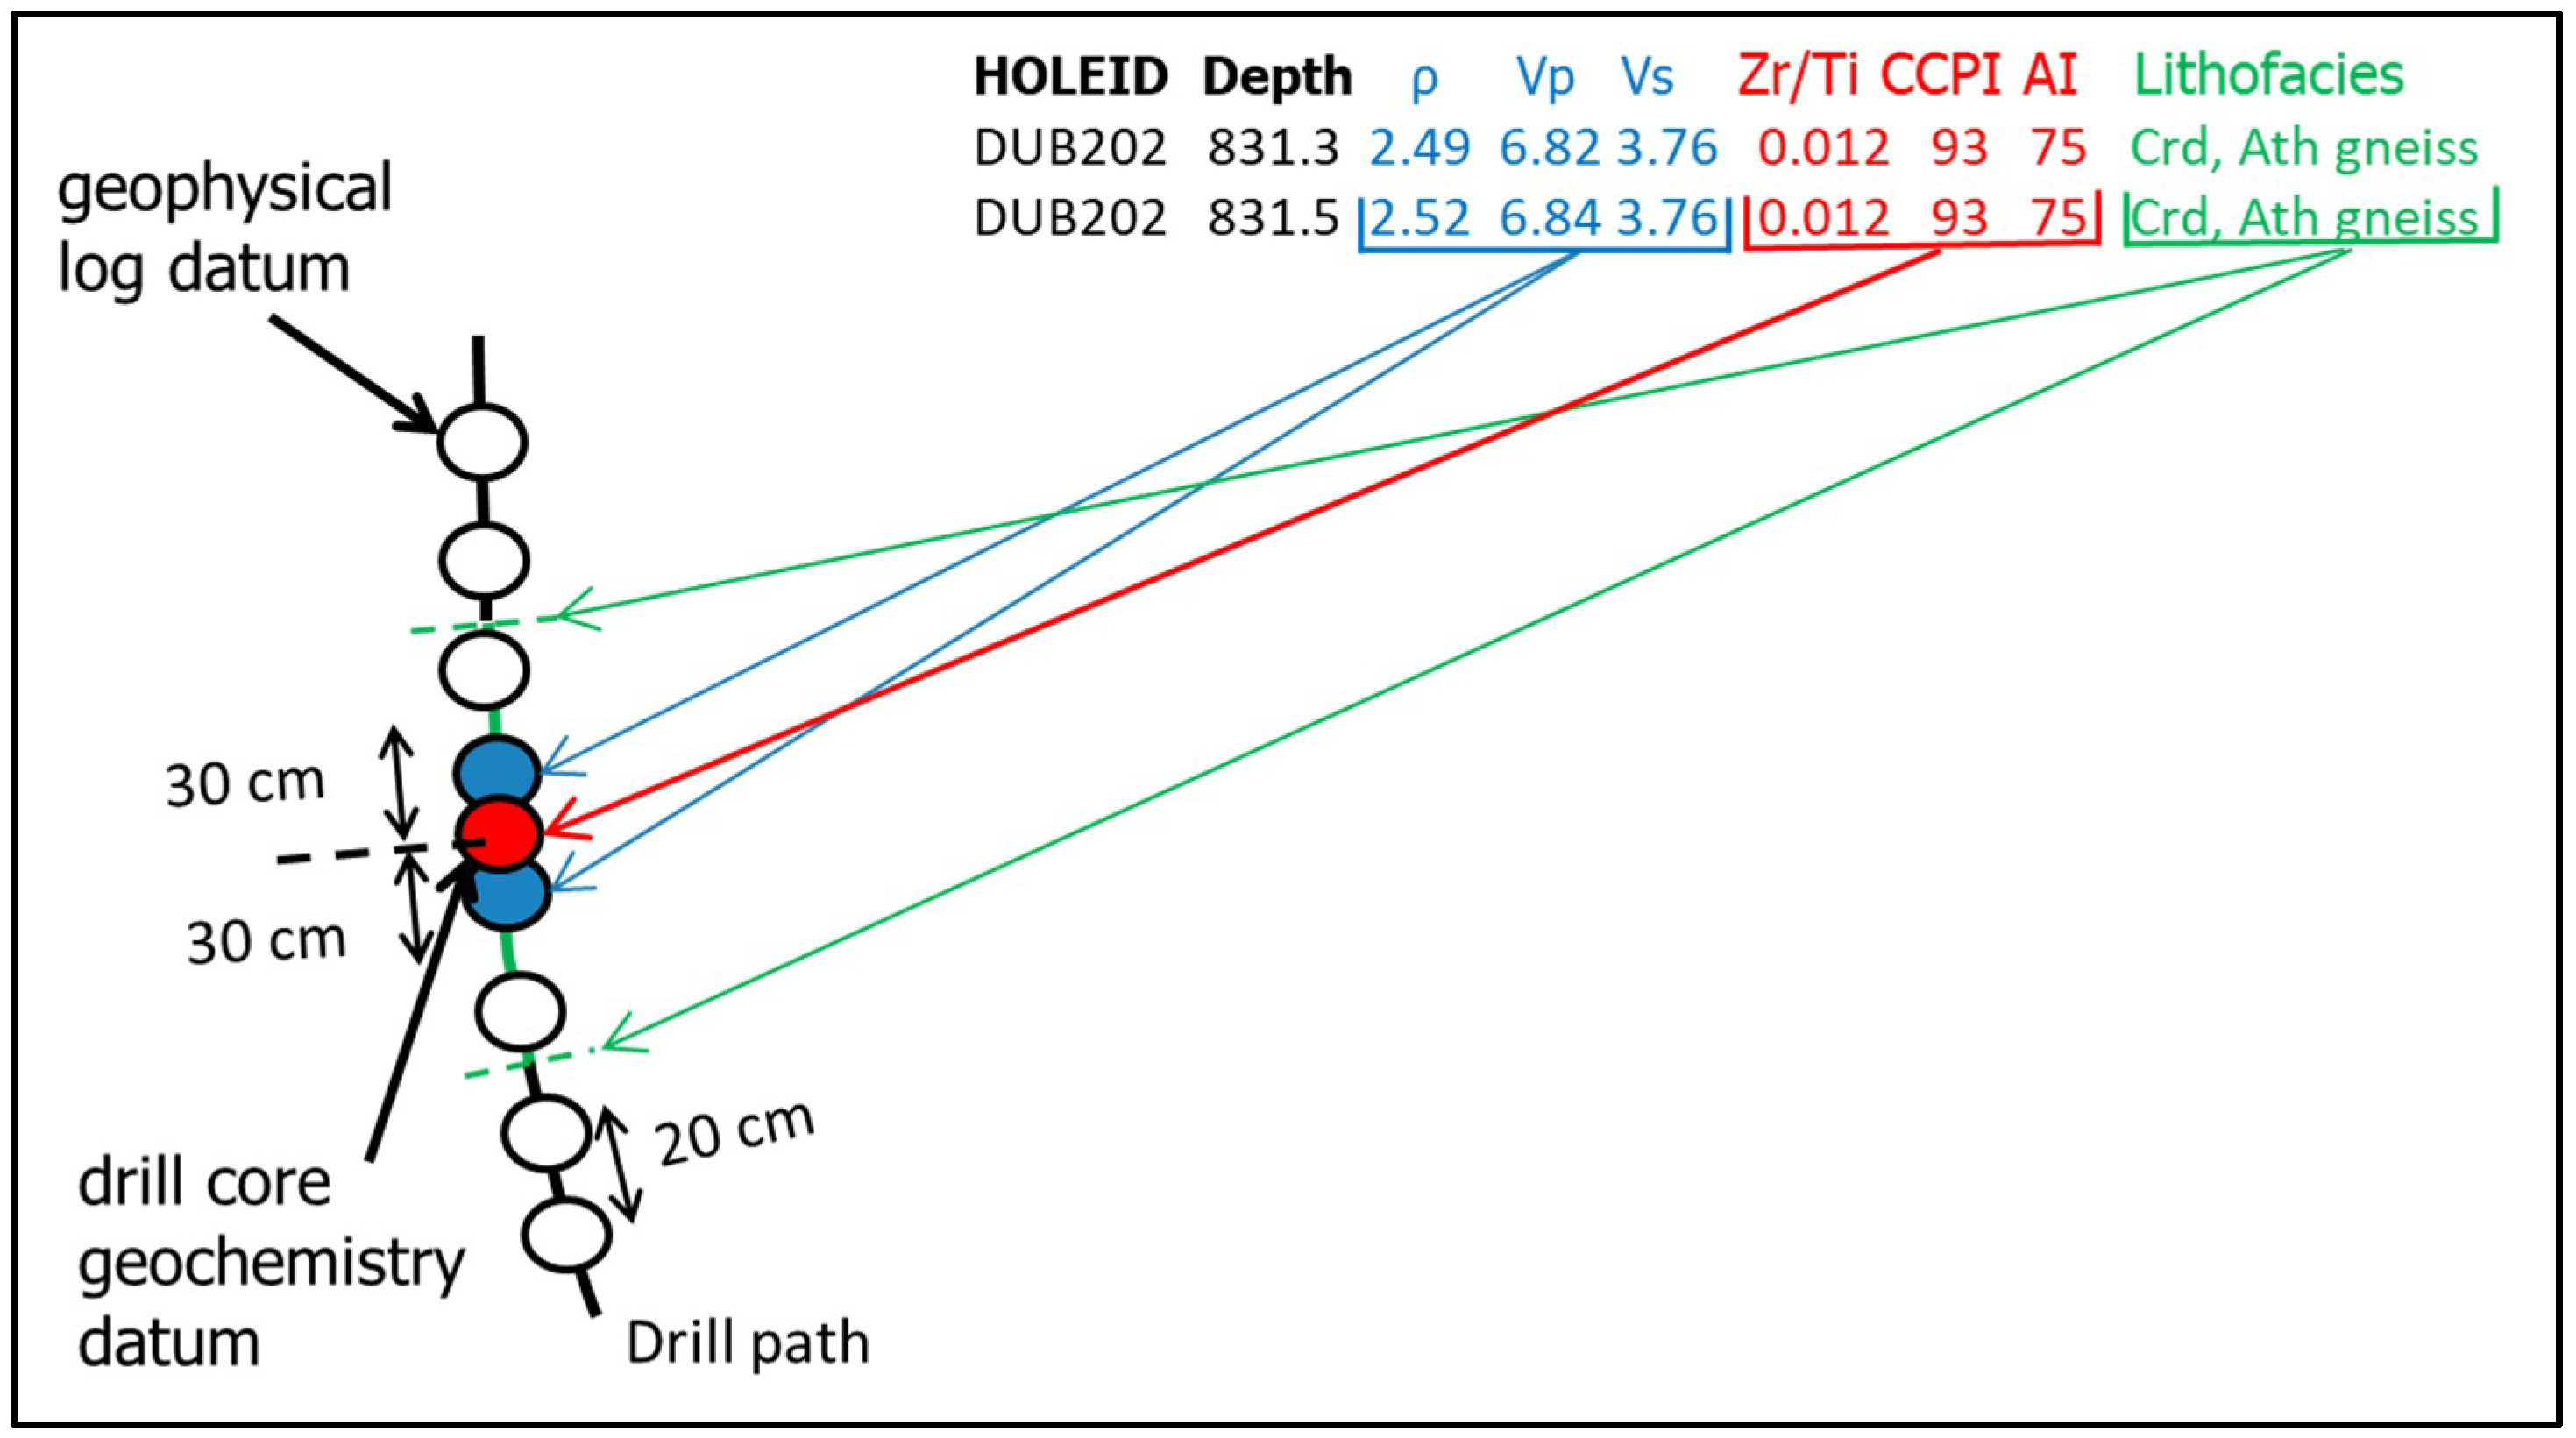
To investigate the additional effects of hydrothermal alteration on the acoustic impedance contrast, the samples of the ten wireline logs were co-registered with whole rock geochemical analyses from drill core samples and their corresponding lithofacies using a threshold distance of 30 cm (
Figure 2). These geochemistry and wireline log records were stored in a Microsoft Access® database compiled from the industry drill hole data. The co-registration was accomplished by matching records of the geochemistry drill core samples with records of the wireline logs on the distance along their corresponding drill paths (see
Appendix A for the query syntax of this matching operation).
In any assessment of the effects of hydrothermal alteration on seismic reflectivity, it is important to separate the effects of hydrothermal alteration (and subsequent metamorphism) on the acoustic impedance contrast from those caused by variations in protolith composition. Therefore, our subdivision into lithofacies (e.g., a rock body having a unique definable compositional, textural, or structural character of genetic significance [
19]) was based on the immobile element ratio of Zr/Ti, which allowed grouping the drill core samples into lithofacies with felsic, intermediate, and intermediate-mafic protolith compositions [
20]. Each of these three lithofacies were further subdivided into least-altered and altered groups, using the above-described diagnostic metamorphic mineral assemblages of aluminum silicates, yielding a total of six classes. The advantage of this lithofacies classification is that it can be universally applied, regardless of the intensity of hydrothermal alteration and metamorphic overprint. This is particularly relevant for the gneisses and schists of the footwall hydrothermal alteration zone, where hydrothermal alteration and metamorphic crystallization destroyed the diagnostic observables of their volcanic protoliths.
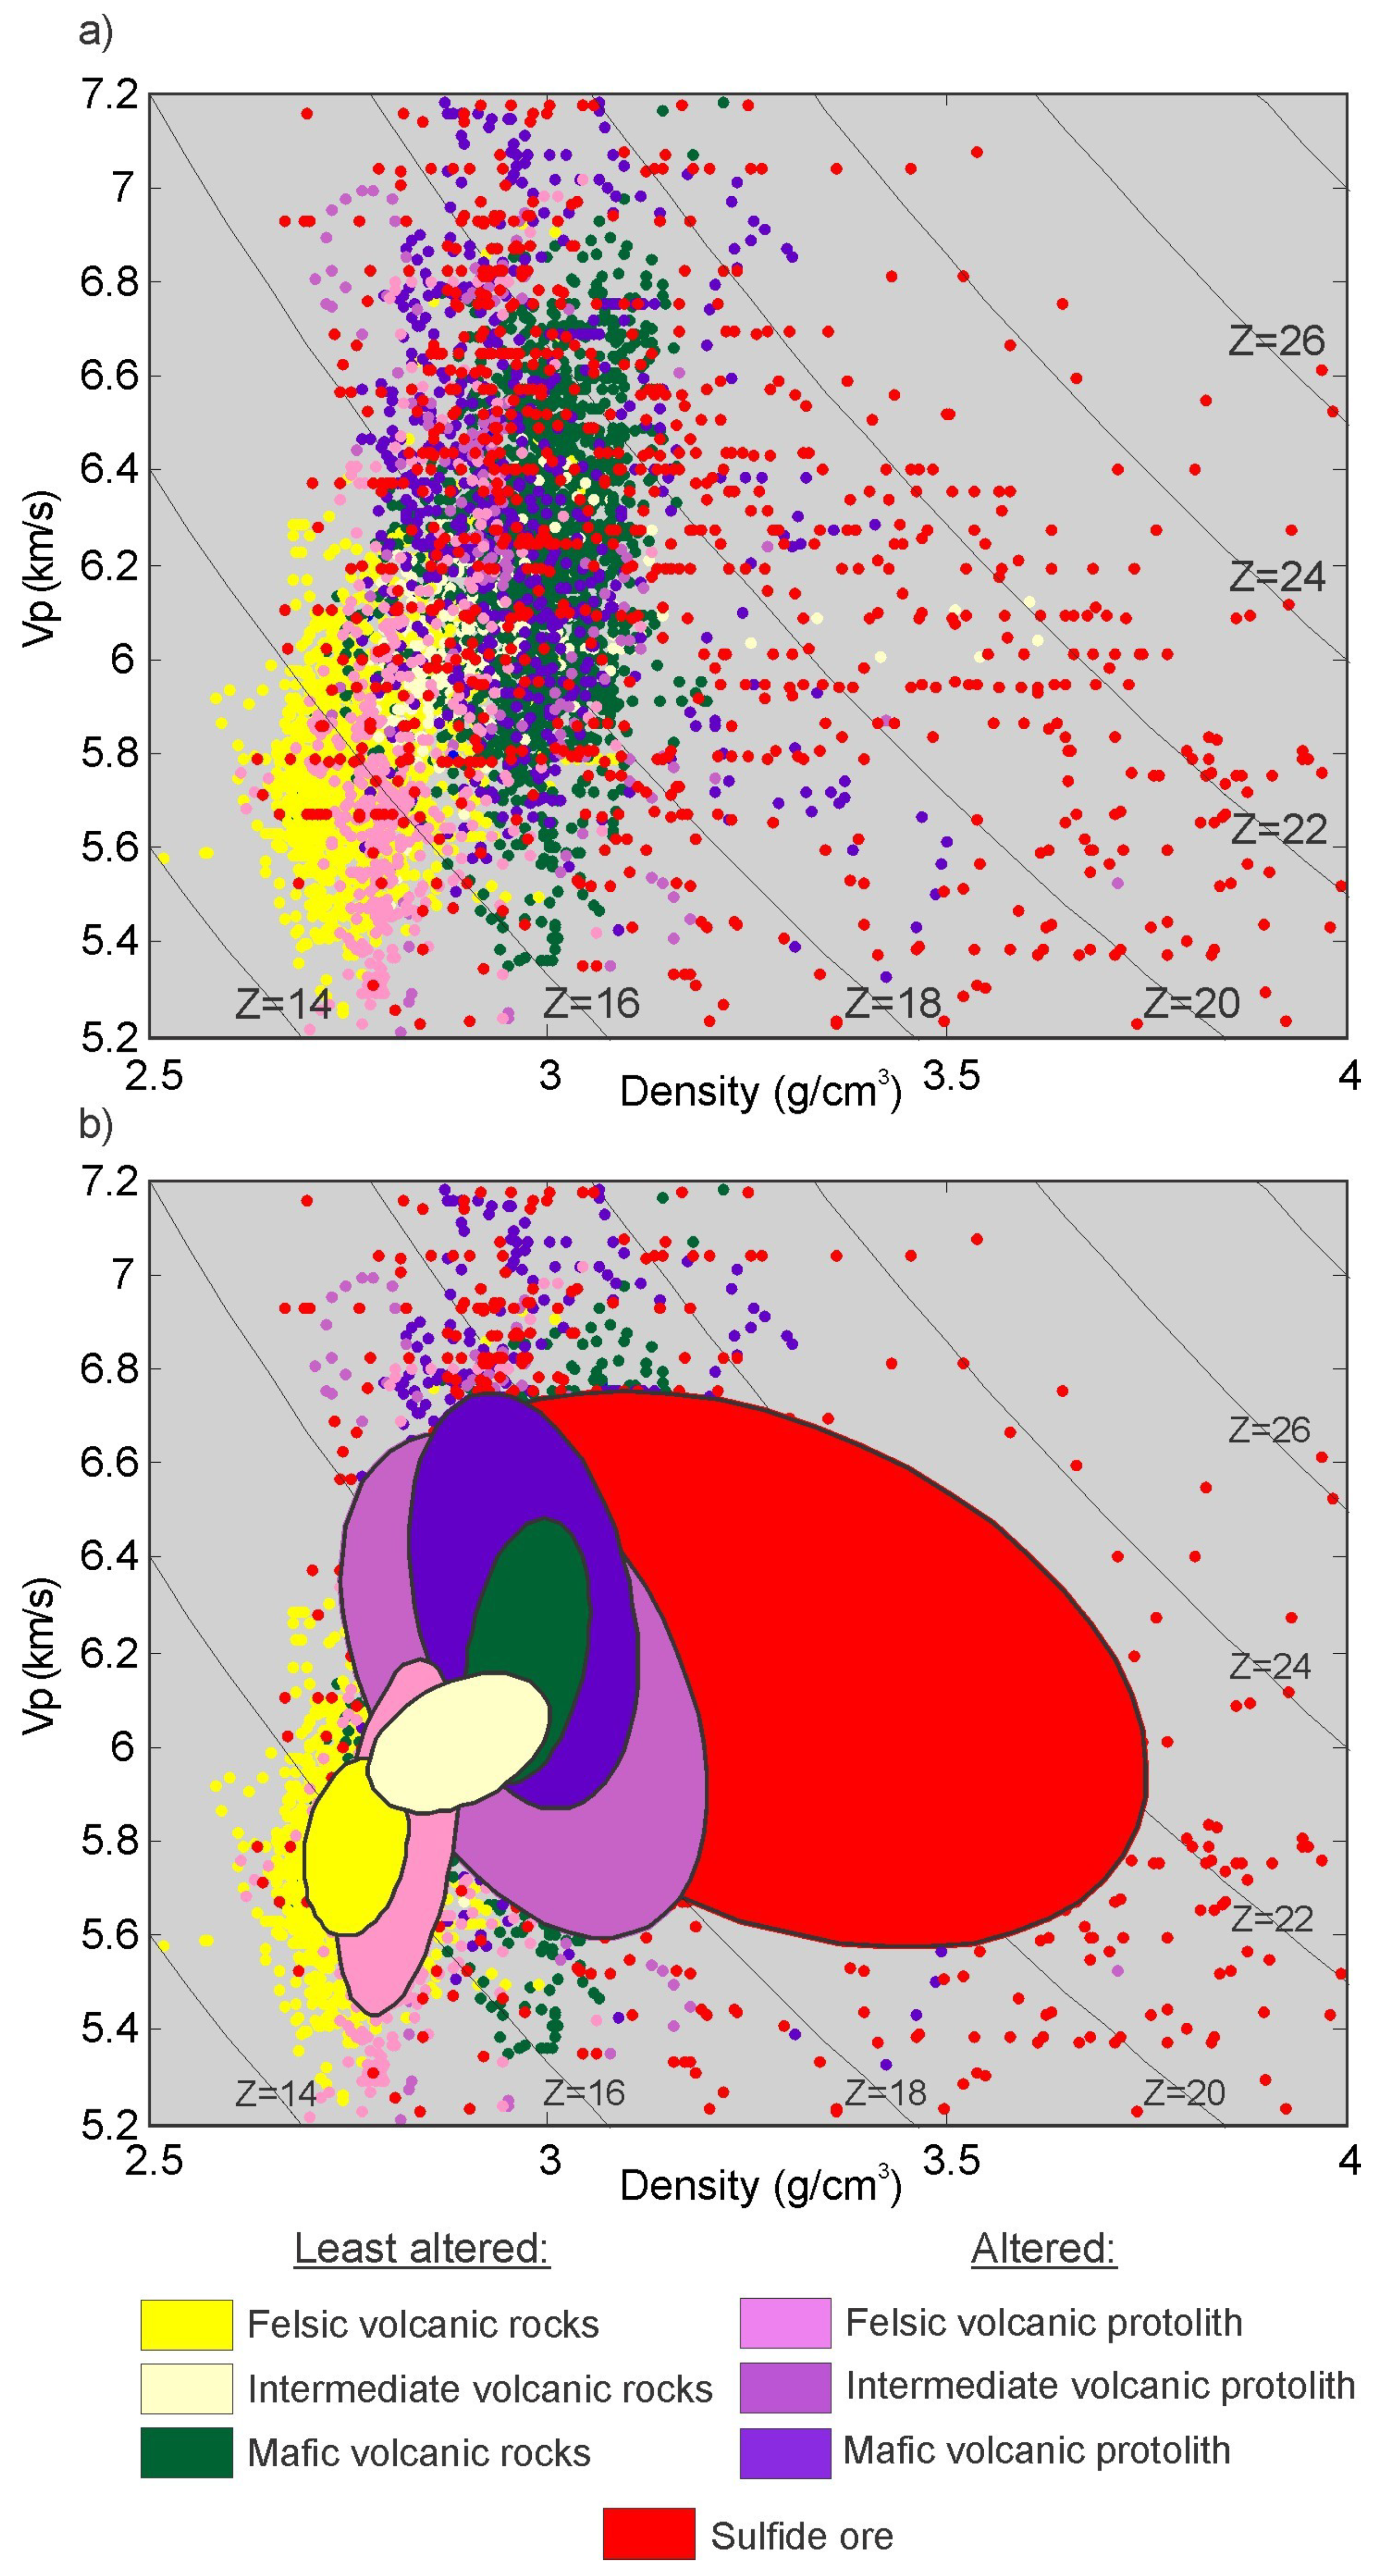
The P-wave velocity (
Vp) versus density (
ρ) plot of the altered and least-altered lithofacies is shown in
Figure 3. The overlay of the ellipses shown in
Figure 3b were determined from the principal component analysis of the P-wave velocity and density wireline log data of each of the lithofacies. The ellipses represent the mean and scaled eigenvectors of the covariance matrix, such that the major and minor axes of the ellipses represent one standard deviation (i.e., 68%) of the
Vp-
ρ distributions. The locations and dimensions of the ellipses of mafic and felsic lithofacies in
Vp-
ρ space show that protolith composition dominantly controls the acoustic impedance contrast for both the least-altered and altered lithofacies. This is consistent with high-amplitude reflections observed at the contacts between least-altered felsic and mafic lithofacies [
5] (
Section 6). The second-order effects of hydrothermal alteration can be inferred by comparing the dimensions of the ellipses between the least-altered and altered lithofacies. Note that all the ellipses of the altered lithofacies are significantly larger in comparison to their least-altered equivalents. In addition, the altered lithofacies with intermediate to mafic protolith composition are oriented on a steeply sloping but slightly negative trend.
In addition to the
Vp-
ρ lithofacies plot, the relationships between seismic rock property logs and alteration indices, computed from the co-registered whole rock geochemical analyses, were analyzed. These alteration indices included the Ishikawa index (
AI) and chlorite–carbonate–pyrite (CCPI) index. Both are commonly used as proxies for the intensity of hydrothermal alteration in VMS ore systems [
21]. The Ishikawa index is defined as:
This index measures the breakdown of plagioclase feldspar and volcanic glass and their replacement by sericite (Equation (2)), and the subsequent replacement of sericite by chlorite (Equation (3)) [
21]:
Because the AI index cannot differentiate between sericite and chlorite, a second alteration index, known as the chlorite-carbonate-pyrite index (CCPI) is usually computed:
The CCPI increases with the formation of chlorite, Mg-Fe carbonate and pyrite. In combination, these indices measure the depletion of Na, Ca, gains of Fe, Mg, K and, indirectly, the relative enrichment of Al [
21]. Because the Lalor VMS deposit was metamorphosed in the amphibolite facies, aluminum silicates of the K-Mg and Fe-Mg assemblages, such as cordierite, garnet, staurolite and biotite (
Table 1) replaced the chlorite-rich greenschist facies alteration assemblages [
20]. This prograde metamorphic replacement of chlorite has also been documented in footwall alteration zones of other VMS deposits in the Snow Lake region [
22,
23].
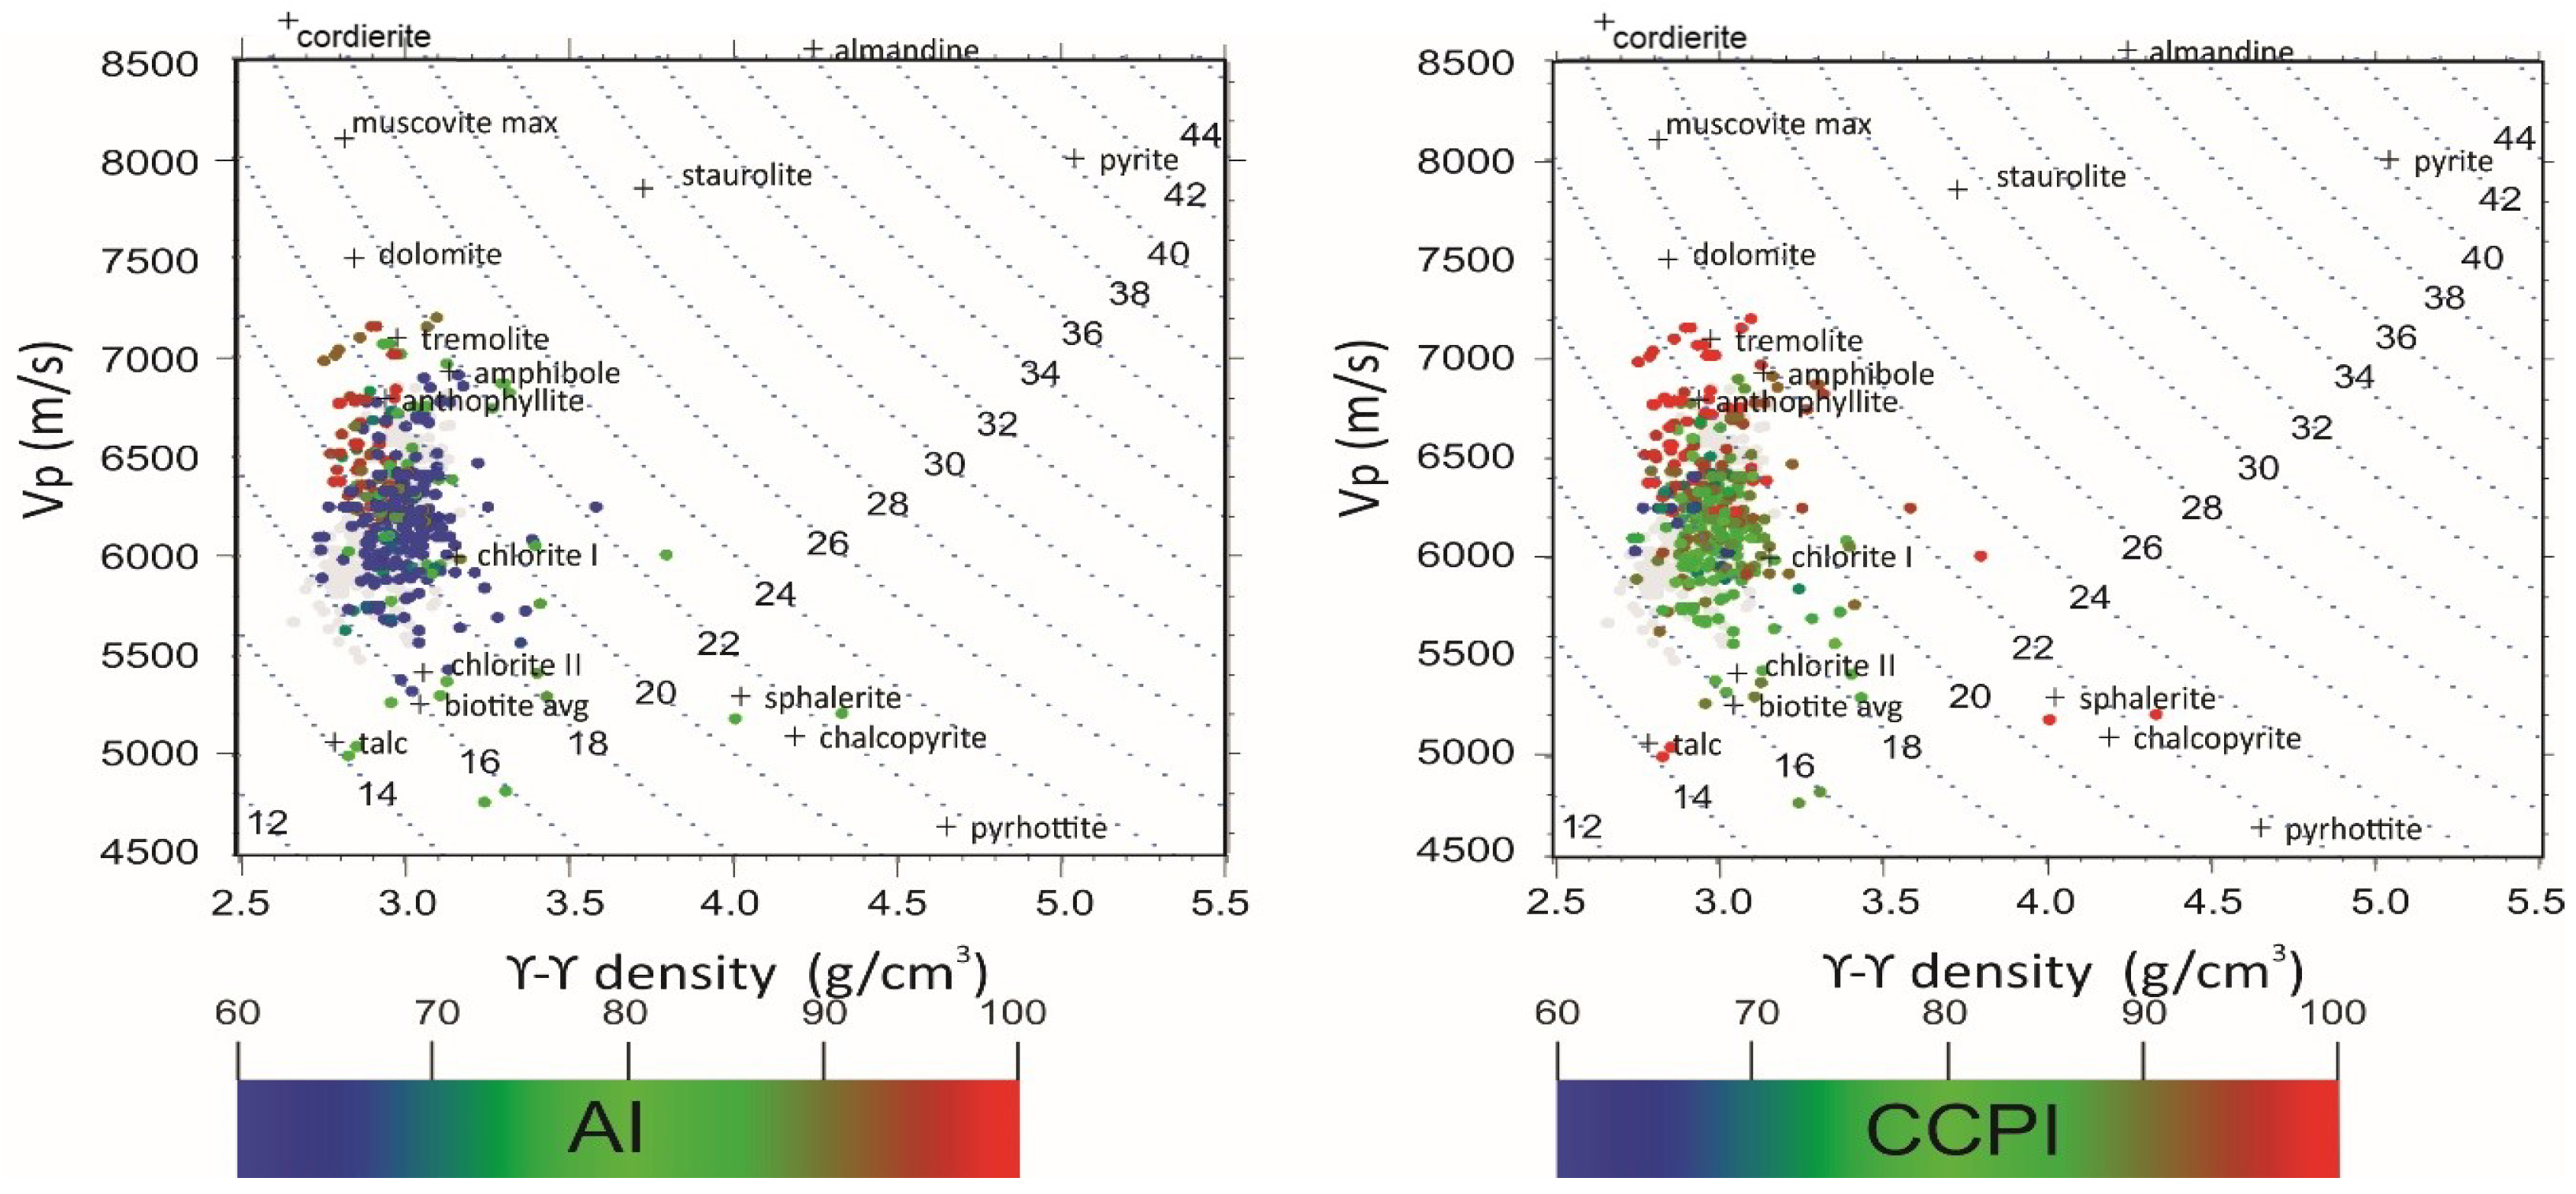
Figure 4 shows
Vp-
ρ plots of the AI and CCPI alteration indices computed from the drill core geochemical analyses of intermediate to mafic protoliths. Note the trends of higher AI and CCPI values with increasing velocity in these plots, which are consistent with the orientation of ellipses for altered lithofacies of intermediate to mafic composition (
Figure 3). Both plots support the interpretation that the increasing velocity, decreasing density trend is associated with an increasing intensity of hydrothermal alteration.
4. Mixture Modeling of Seismic Rock Properties Using SEM-EDS Analyses
Searching for the minerals responsible for the negative low density-high P-wave velocity trend, eleven polished thin sections of 4.5 × 2.5 cm were cut from drill core samples of the footwall of the Lalor VMS deposit for scanning electron microscopy-energy dispersive X-ray spectroscopy (SEM-EDS). In the last two decades, SEM-EDS has gained popularity for identifying minerals and the quantification of their abundances [
24]. The technique is based on mapping mineral grains by focusing an electron beam on a polished thin section and identifying the mineral species and chemical composition of each grain on the basis of peaks in the emitted X-ray energy spectra, each of them being unique to the atomic structure of the elements of which the mineral is composed. The reader is referred to [
24] for an introductory review on the methodology and its applications, and to [
25] for a discussion on the accuracy and caveats of SEM-EDS analysis.
The thin sections were cut normal to the foliation. Because no lineation was observed in the samples, it was assumed that the preferred mineral orientation, defining the foliation, interacted in an isotropic manner with these sections. This would justify equating the estimated mineral percentages from the thin sections with volumetric percentages, invoking the Delesse principle [
26] and an unbiased randomized sampling design.
The thin sections were analyzed using the TESCAN MIRA3 Oxford SEM-EDS system [
27]. This system includes the X-MAX 80 Silicon Drift Detector (Oxford Instruments, Oxford, UK), with AZtec Energy microanalysis software (Version 3.3, Oxford Instruments, High Wycombe, UK) [
27]. The specialized module “Feature” of AZtec, which is particularly suited to large samples and routine analysis, was used to classify minerals from the EDS data. The individual mineral grains were identified using grey level thresholding of the backscattered electron images. The morphology and chemistry was then recorded for each grain, and each spectrum was immediately quantified and classified according to a user generated classification scheme. As many fields are recorded at high magnification as necessary to make up a large area and then montaged. The adjoining mineral grains were then reconstructed across the whole area [
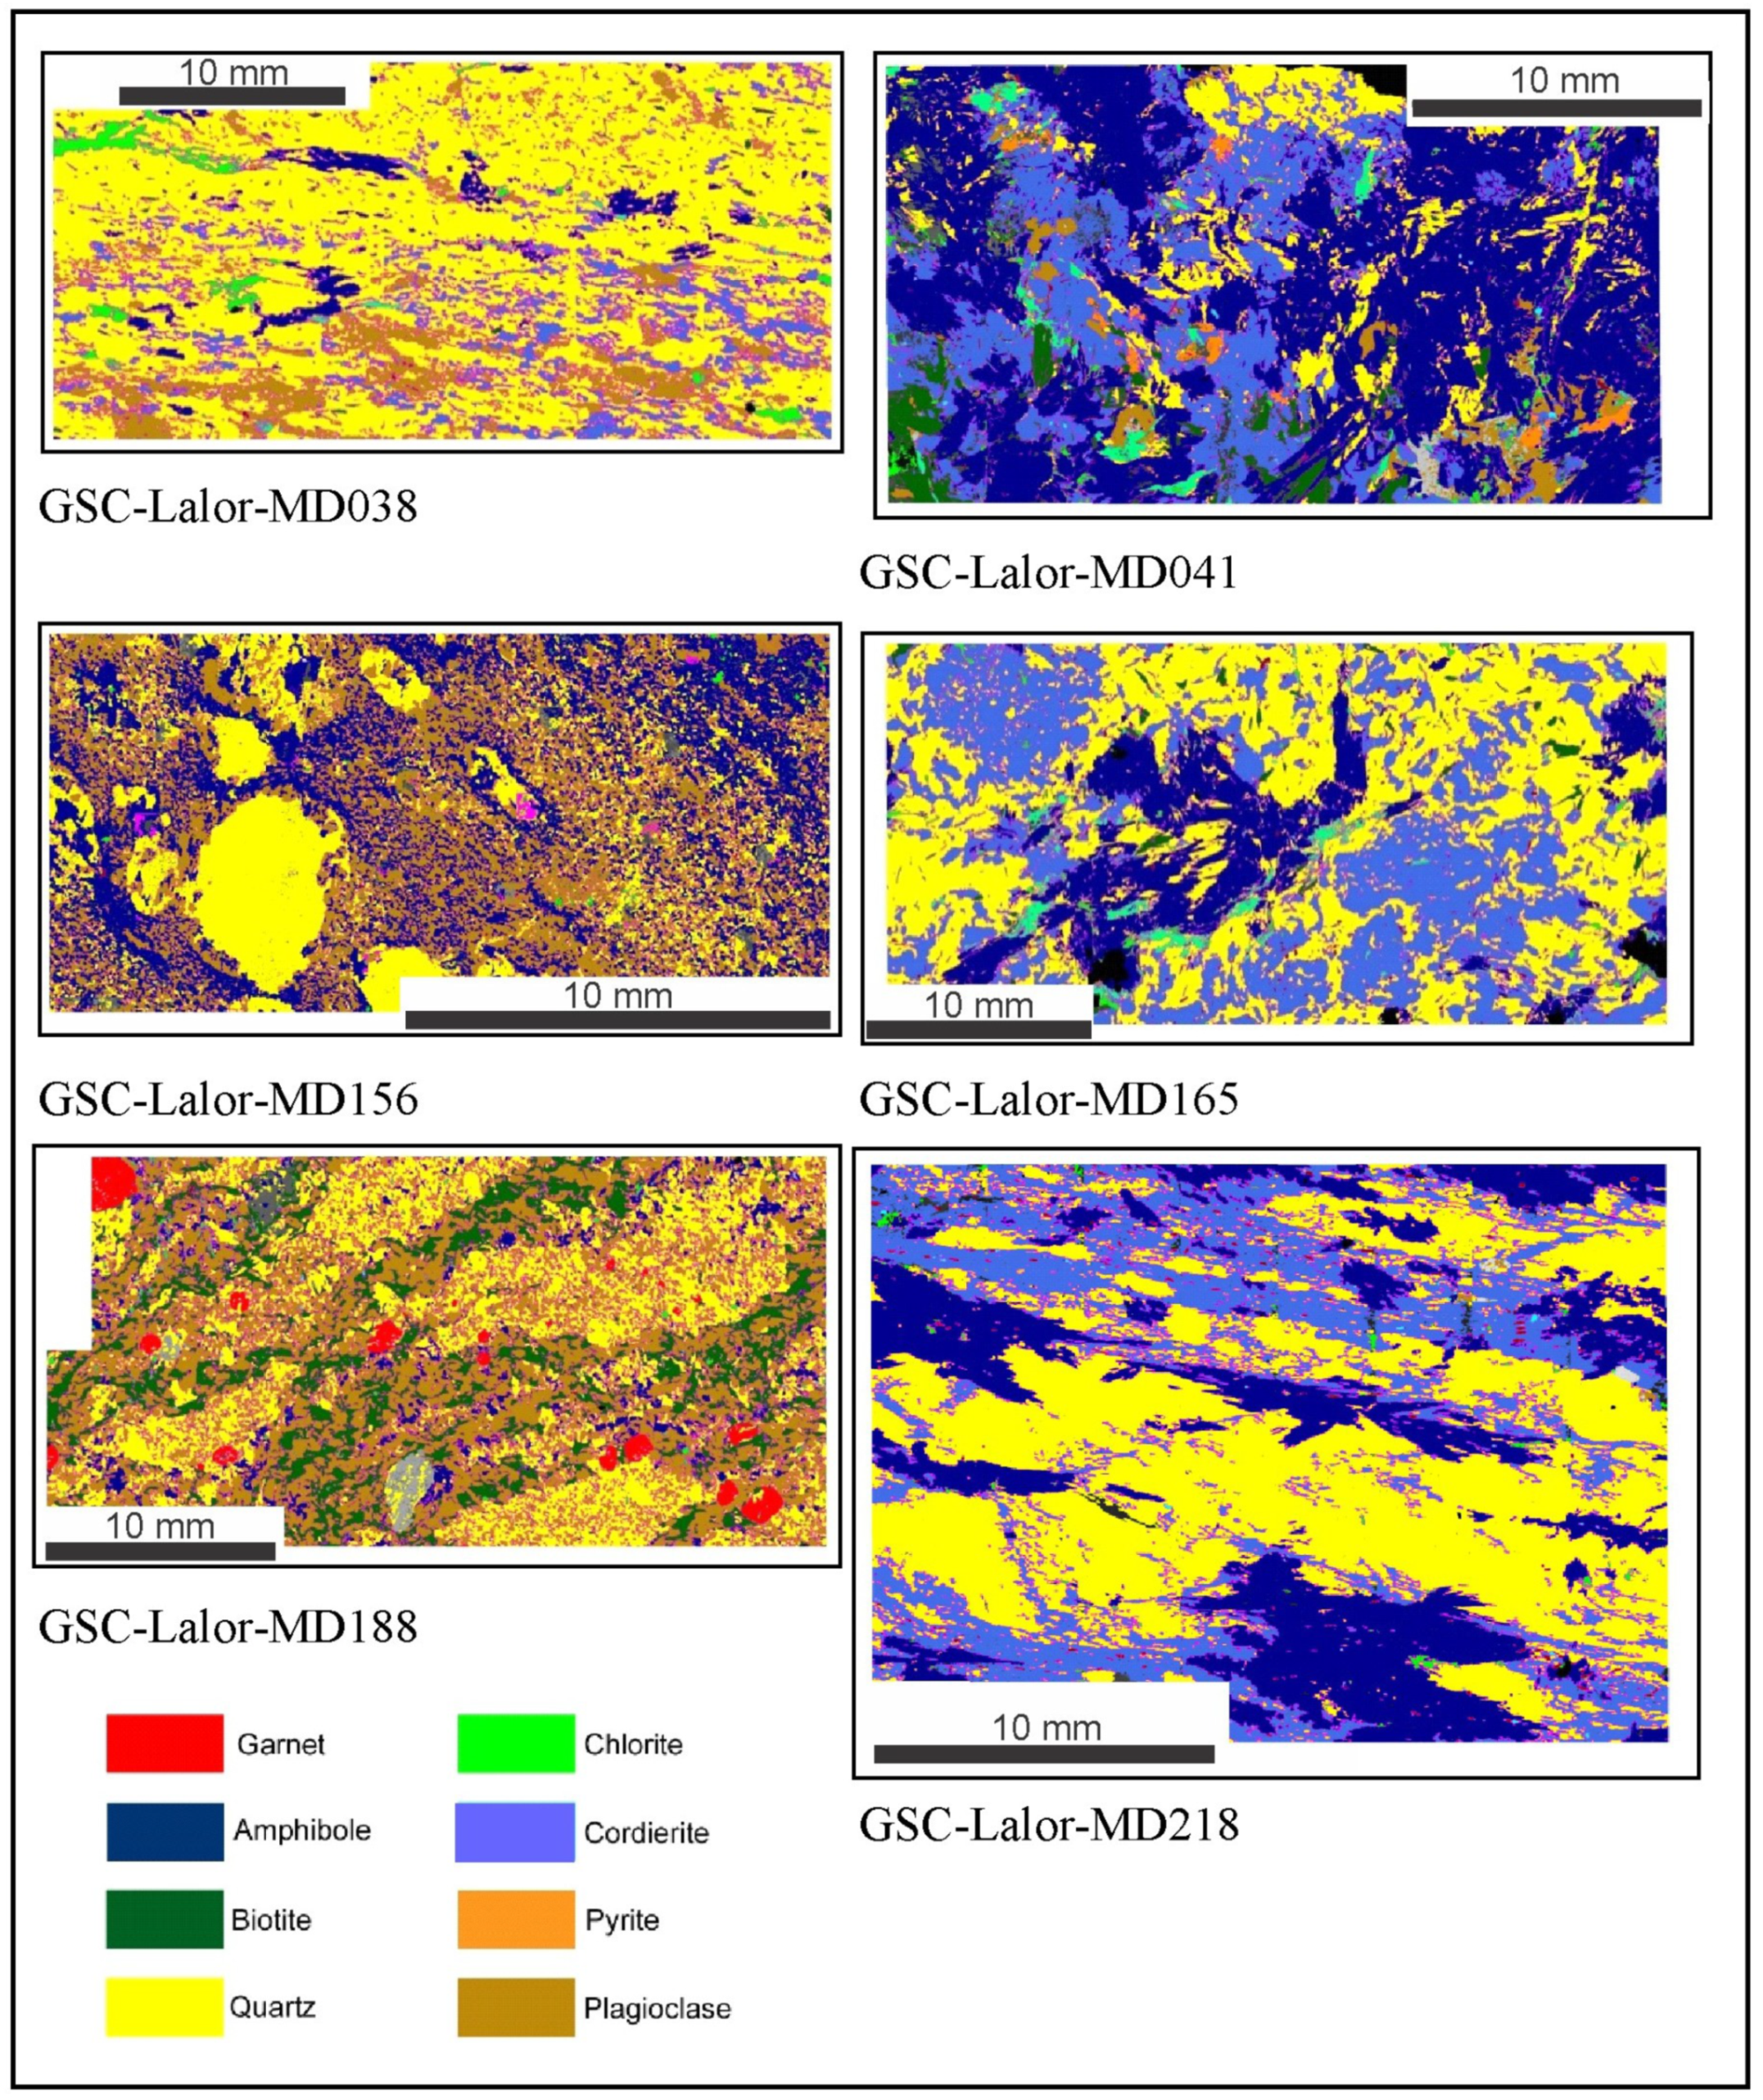
27]. With morphology and chemistry analyzed, the results enable a full calculation of the bulk mineralogy of the entire section, including the percentage of unclassified features (
Figure 5,
Table 3).
Given that the SEM-EDS analyses of the thin sections is limited to estimating mineral fractions, the modeling of seismic rock properties is bound by two limiting assumptions:
The seismic rock properties are completely defined by the seismic properties of the constituting mineral phases (i.e., the effects of porosity on seismic rock properties, including porosity due to microcracks, are negligible).
There is no preferential orientation of the mineral phases (i.e., the fabric of the rocks are homogeneous and quasi-isotropic).
Under these assumptions, the effects of mineral composition on seismic rock properties can be modeled by combining the bulk mineral fractions f
i (
Table 3) with their corresponding mineral P-wave velocities (
Vp
i) and densities (
ρi) (
Table 4) to obtain mixture-modeled bulk seismic rock properties. The mixture-modeled density is defined as:
where
fi is the
ith mineral fraction from the sum-normalized SEM-EDS analyses of n mineral components and
ρi is the density of the
ith mineral component.
Considering the lack of data for characterizing anisotropy, the best that can be done in modeling the P-wave velocity of the mineral mixture is to compute an average based on the theoretical lower and upper bounds of the mineral elastic moduli [
28] (see [
29] for a review of more advanced analysis, which includes statistics of mineral orientations to model the effects of anisotropy). Hence, the modeled P-wave velocity was computed from the mean bulk (
) and shear (
) moduli, known as the Hill averages of the Voigt and Reuss bounds [
28]:
with:
and:
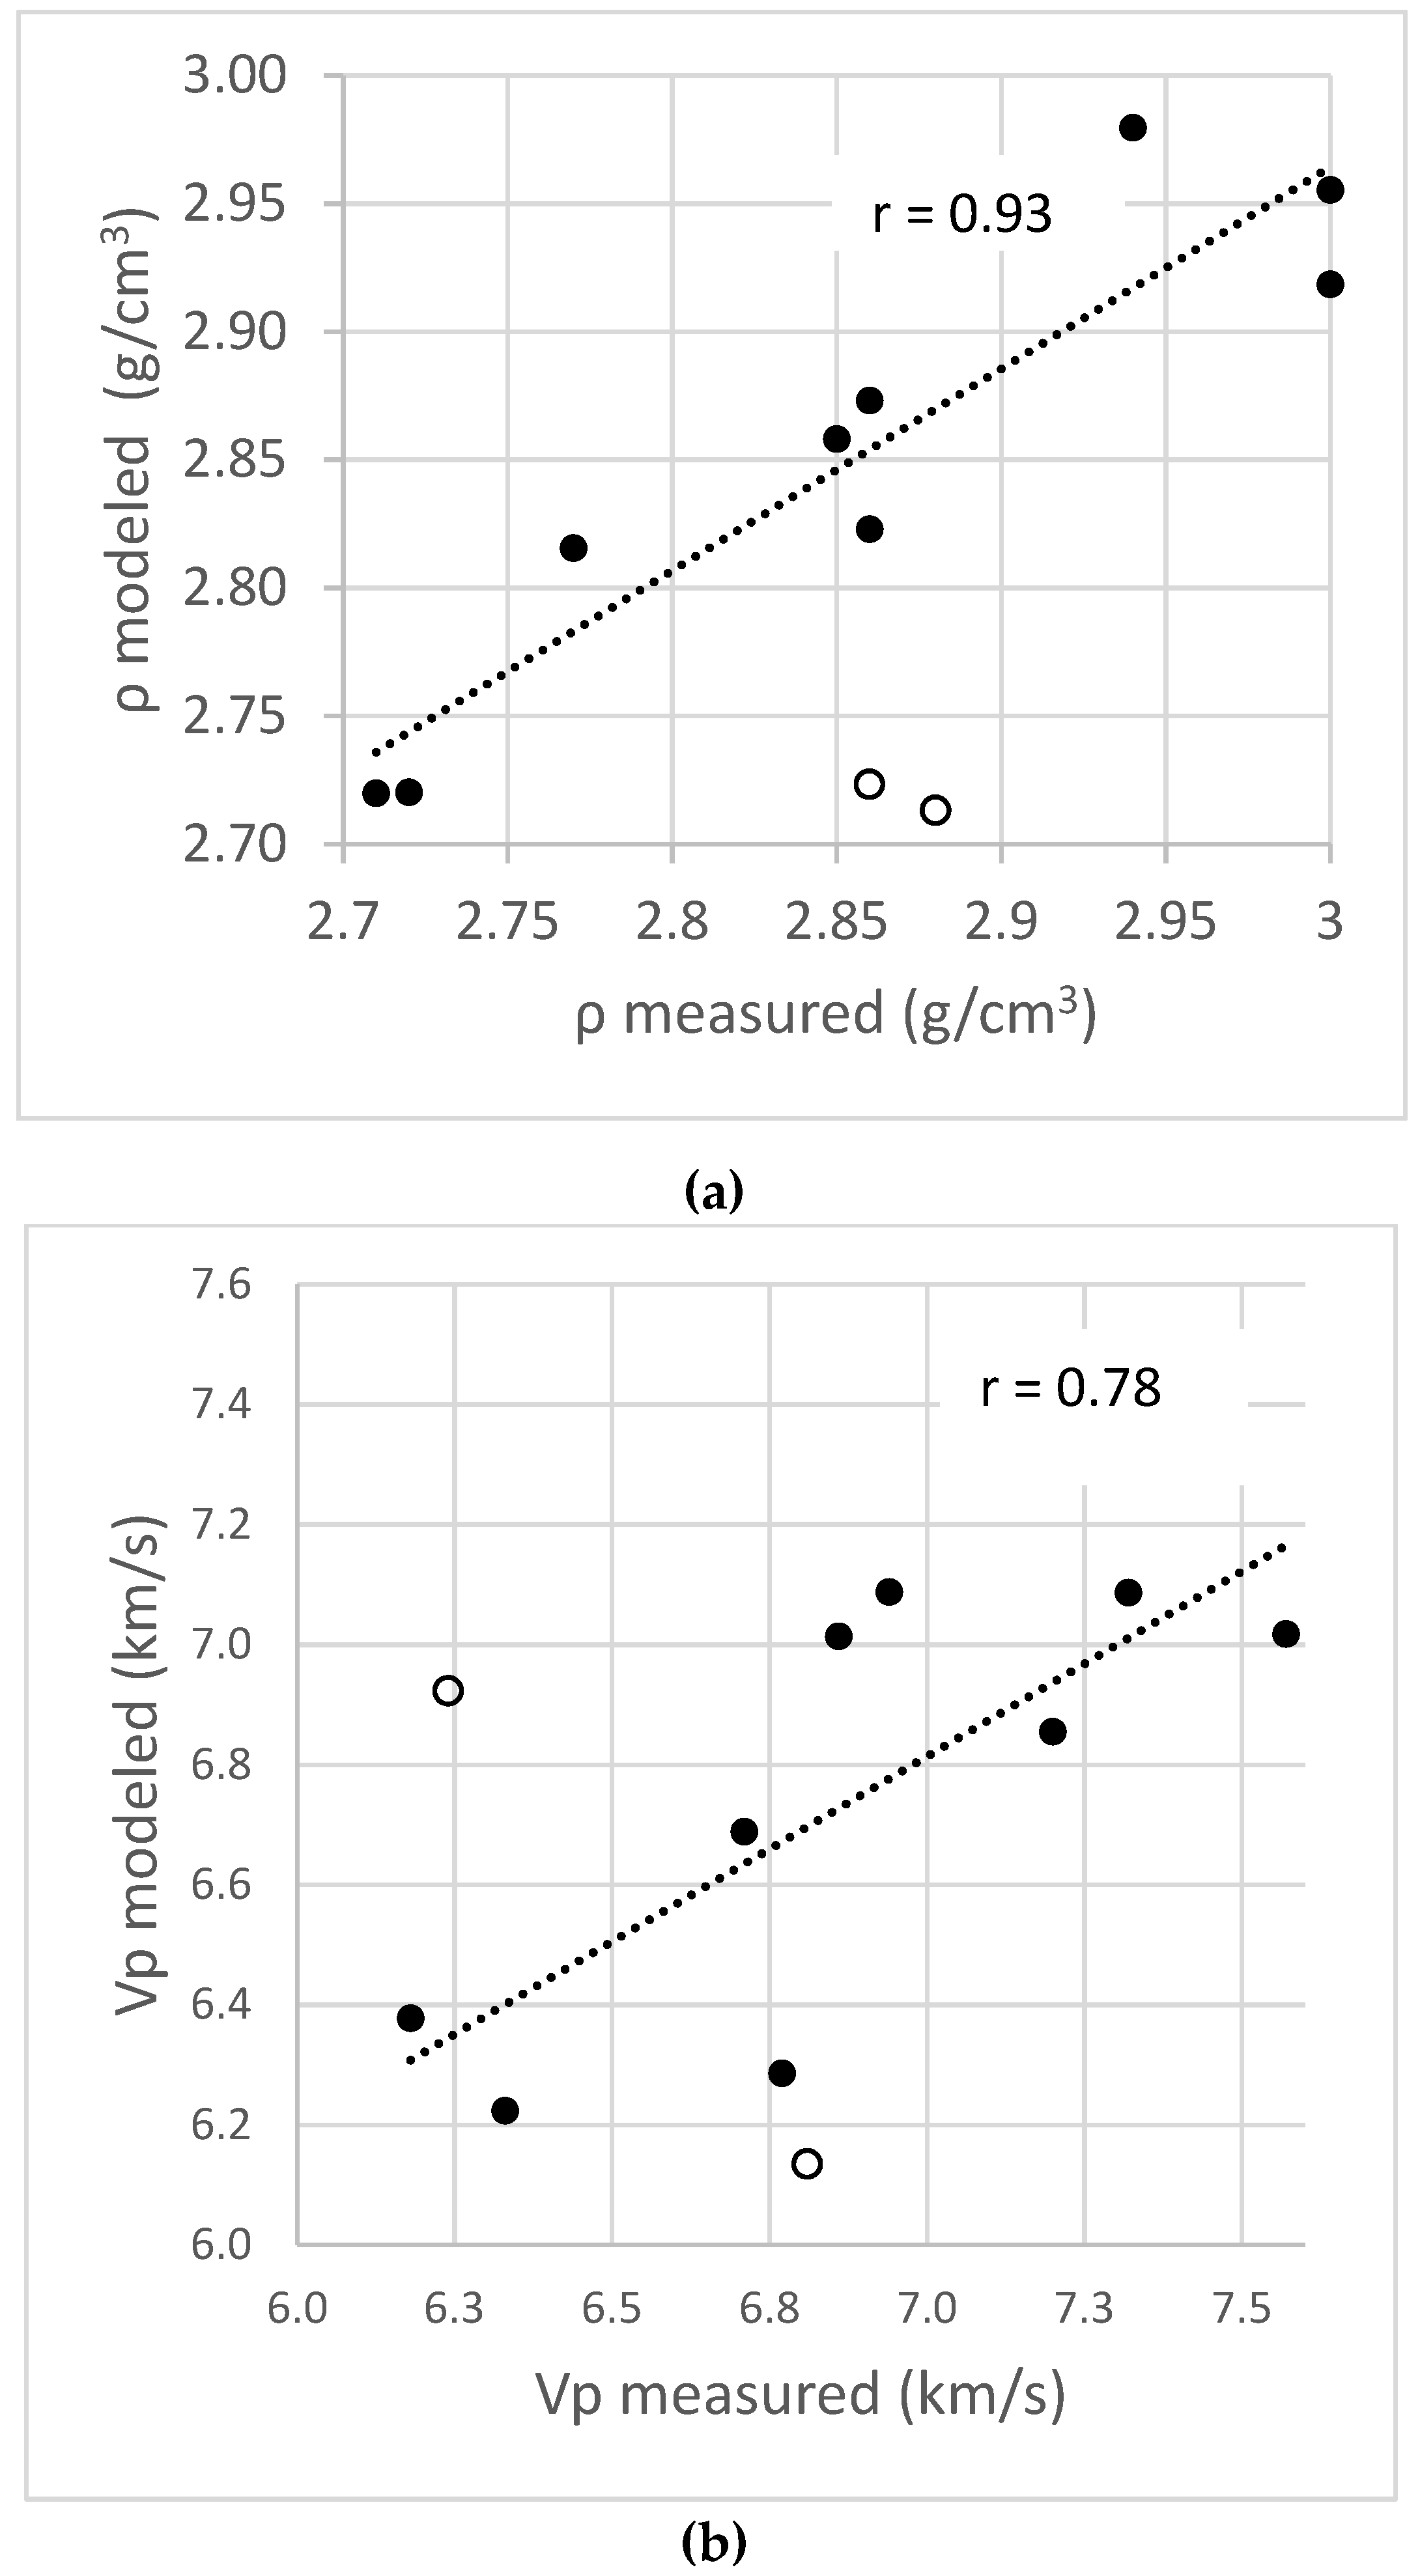
A comparison between the measured and mixture-modeled seismic rock properties shows, with the exception of two outliers, a good fit for density (
Figure 6a) and a reasonable fit for the P-wave velocity modeled as a linear mixture or the average of the Voigt and Reuss bounds (
Table 5,
Figure 6b,c). A
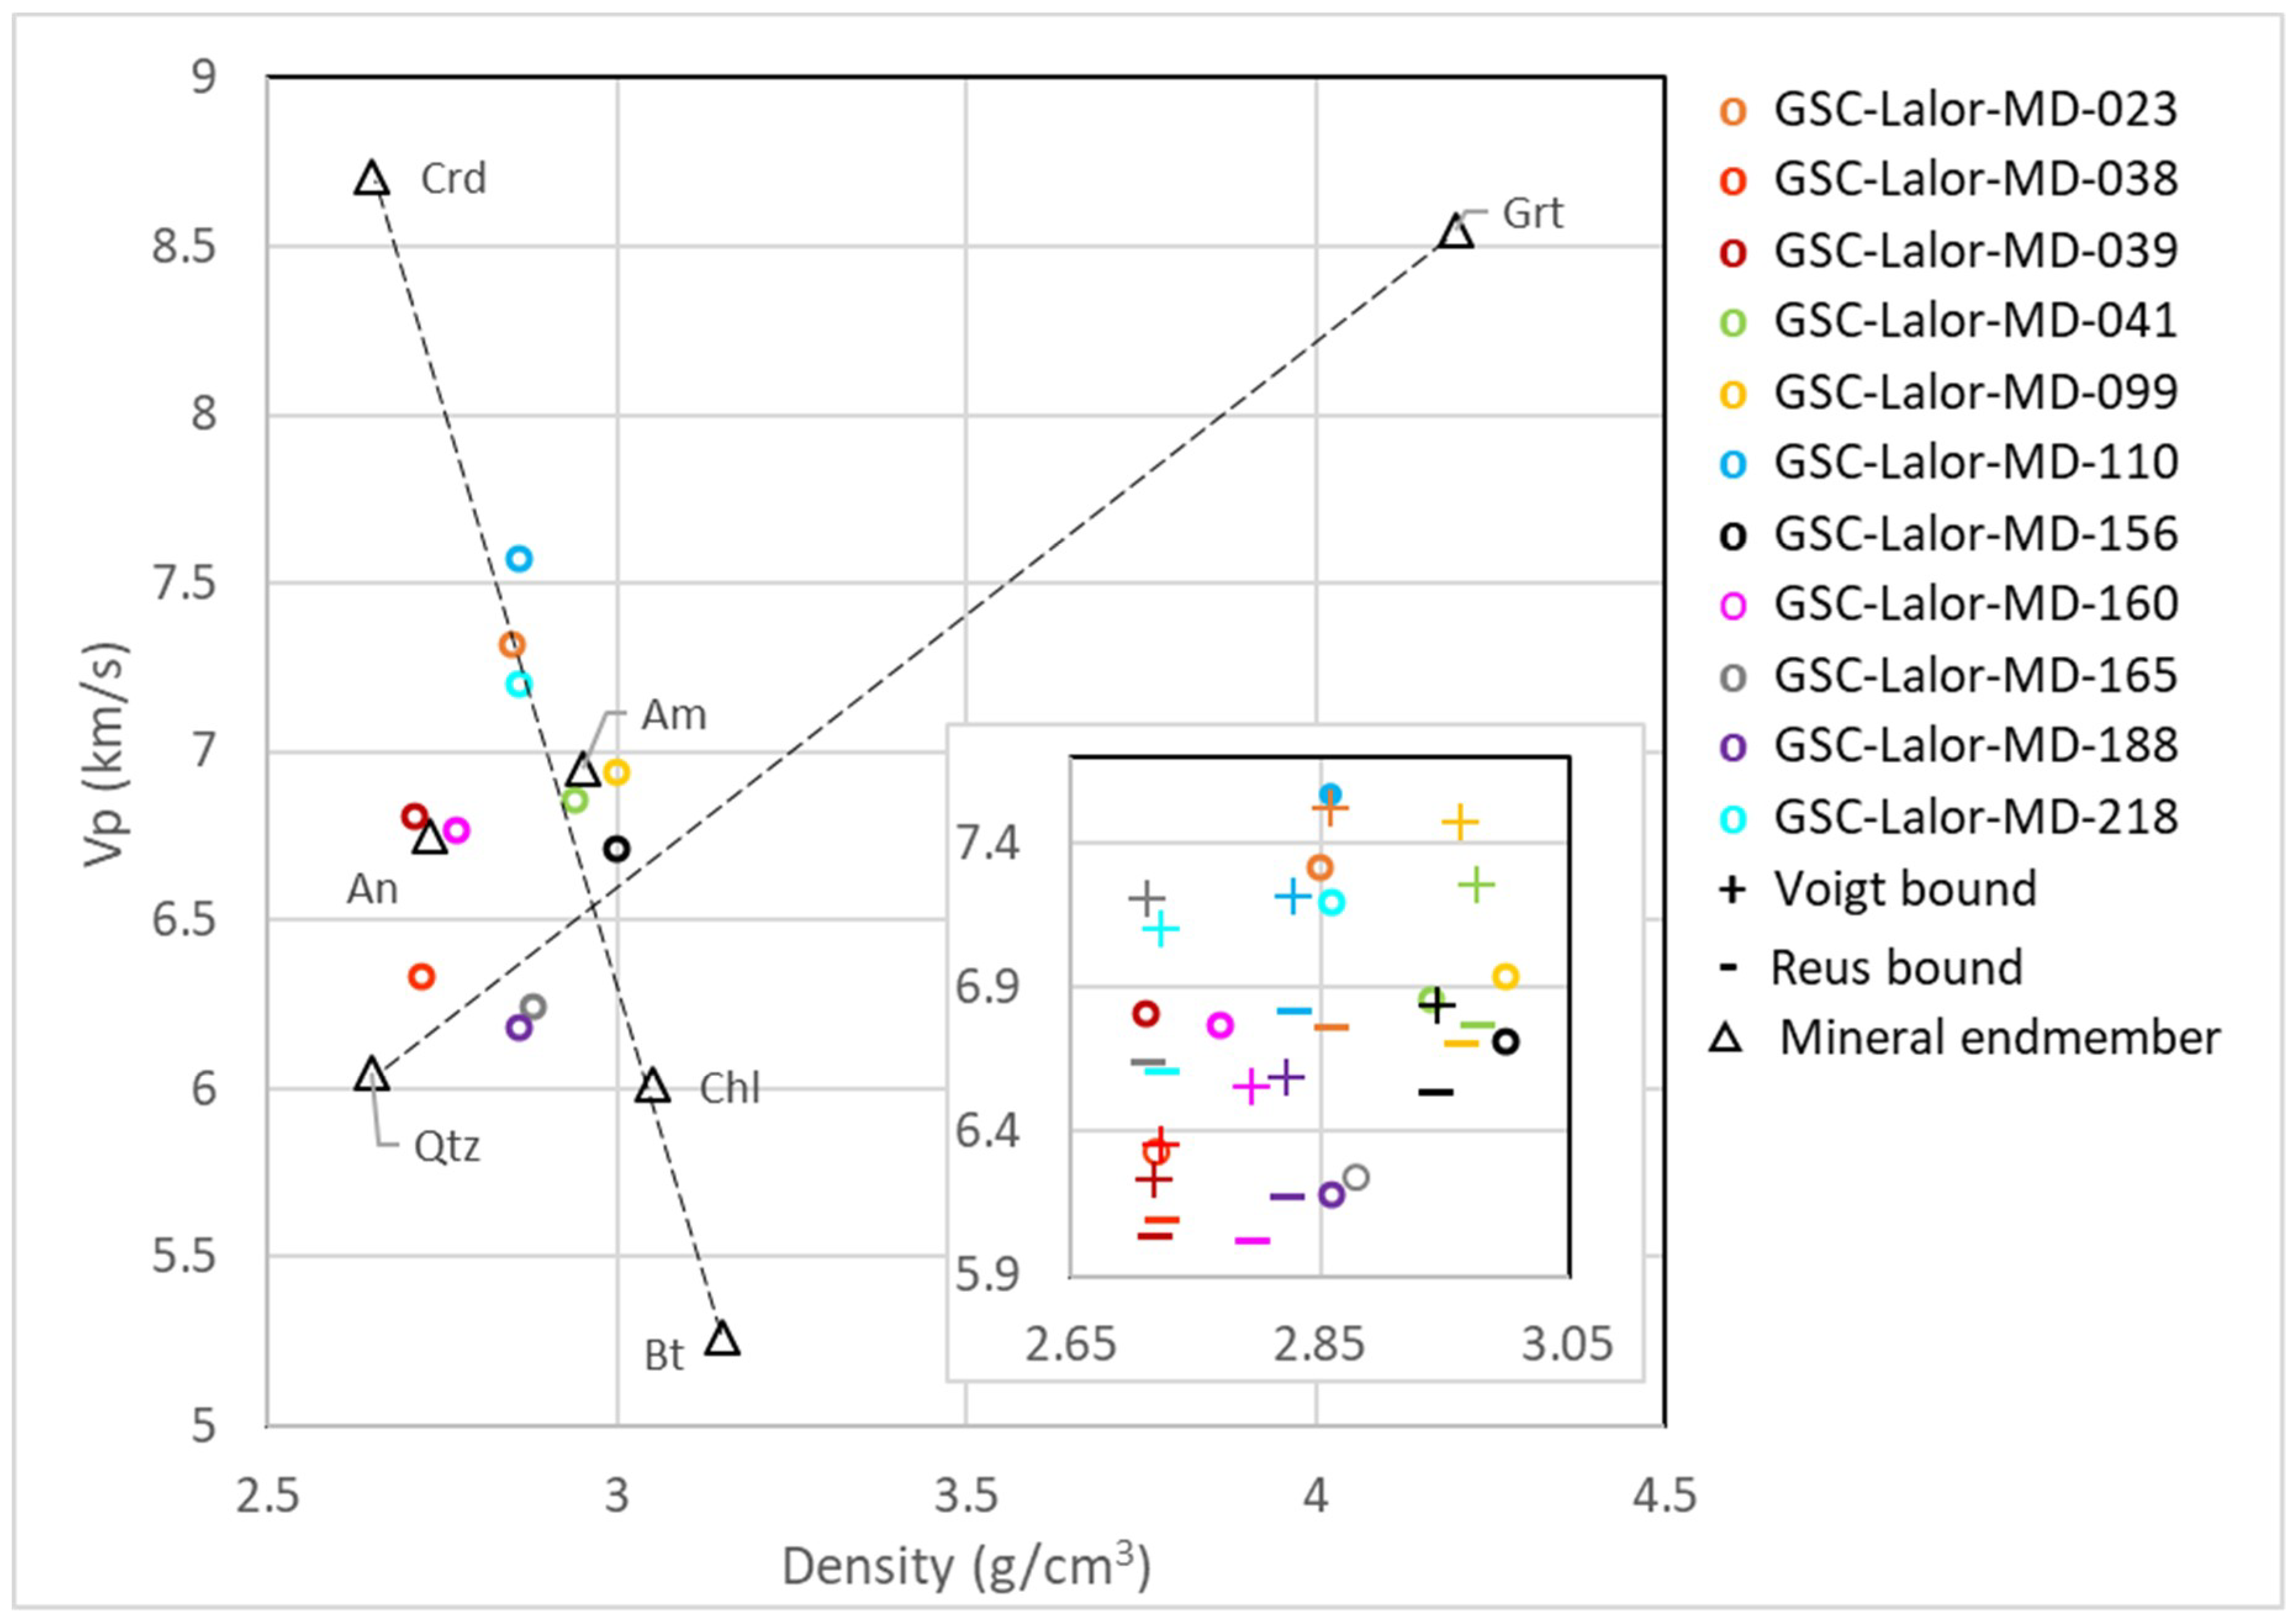
Vp-ρ plot of the measured rock and mineral seismic properties, suggests, in combination with the estimated fractions that the most abundant minerals positioned beyond the extremes of the measured
Vp-ρ distribution, along the approximately perpendicular biotite-cordierite and quartz-garnet bivariate mixture lines, dominantly control the seismic rock property variations (
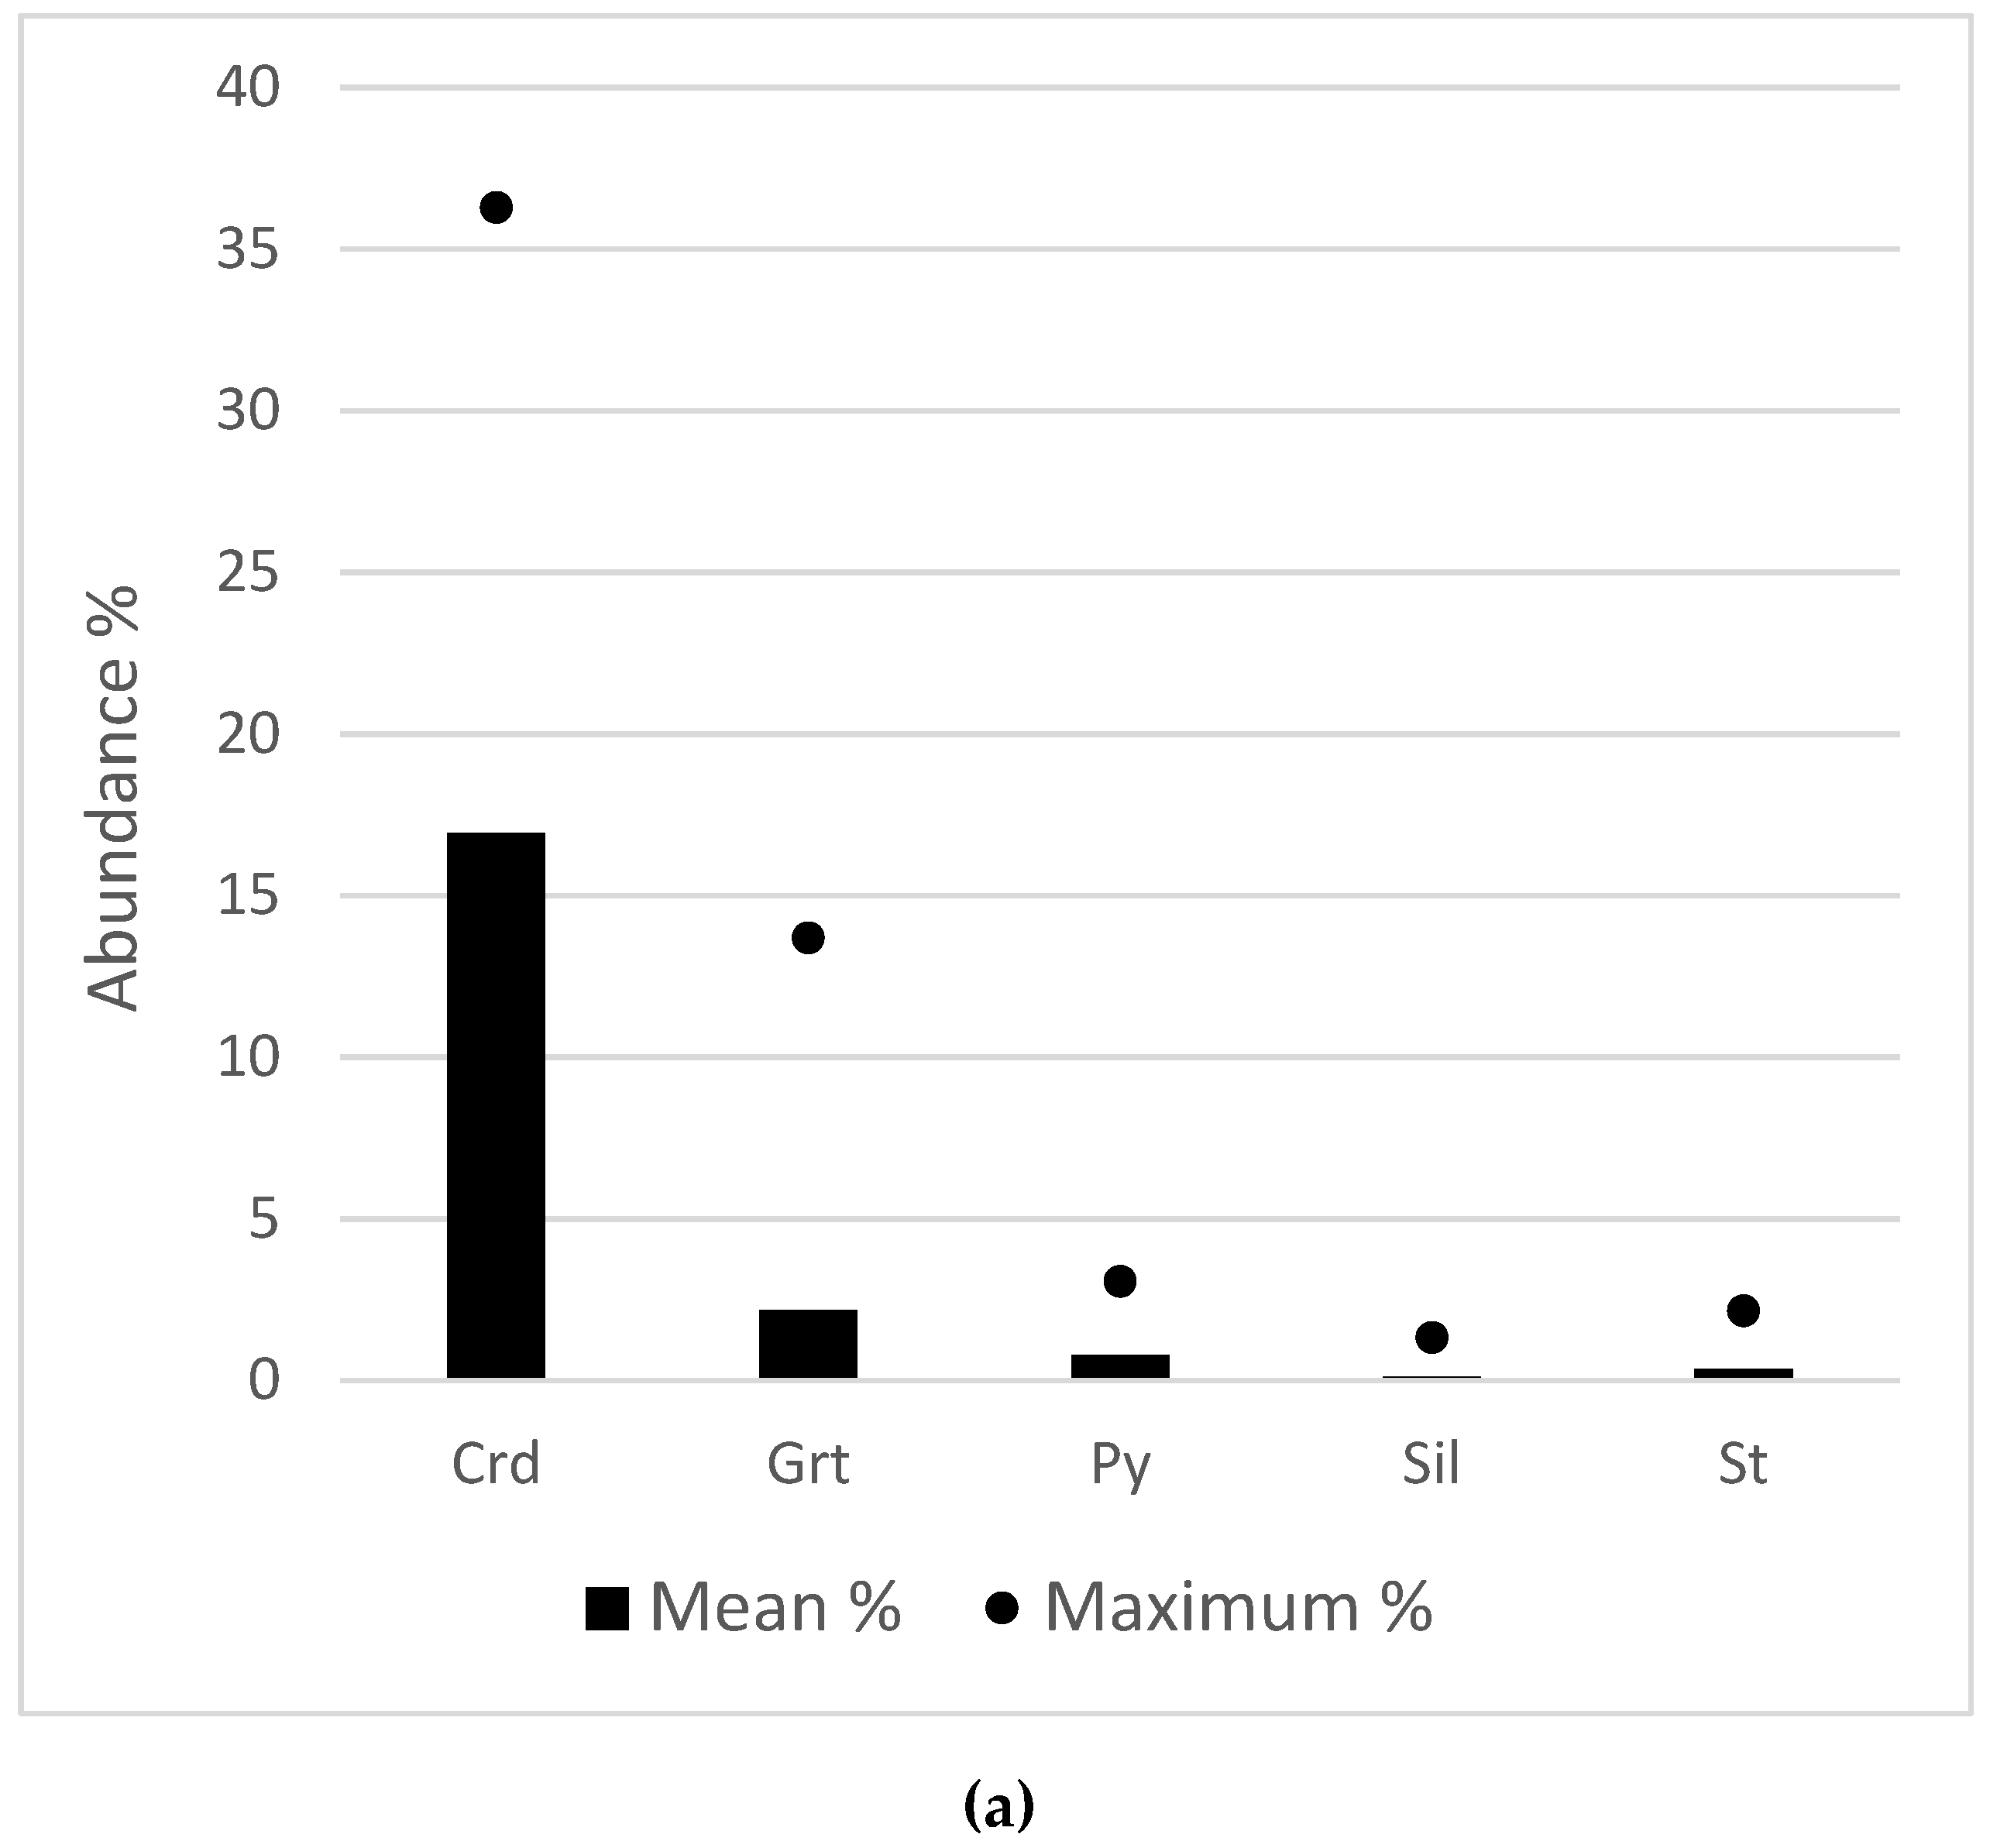
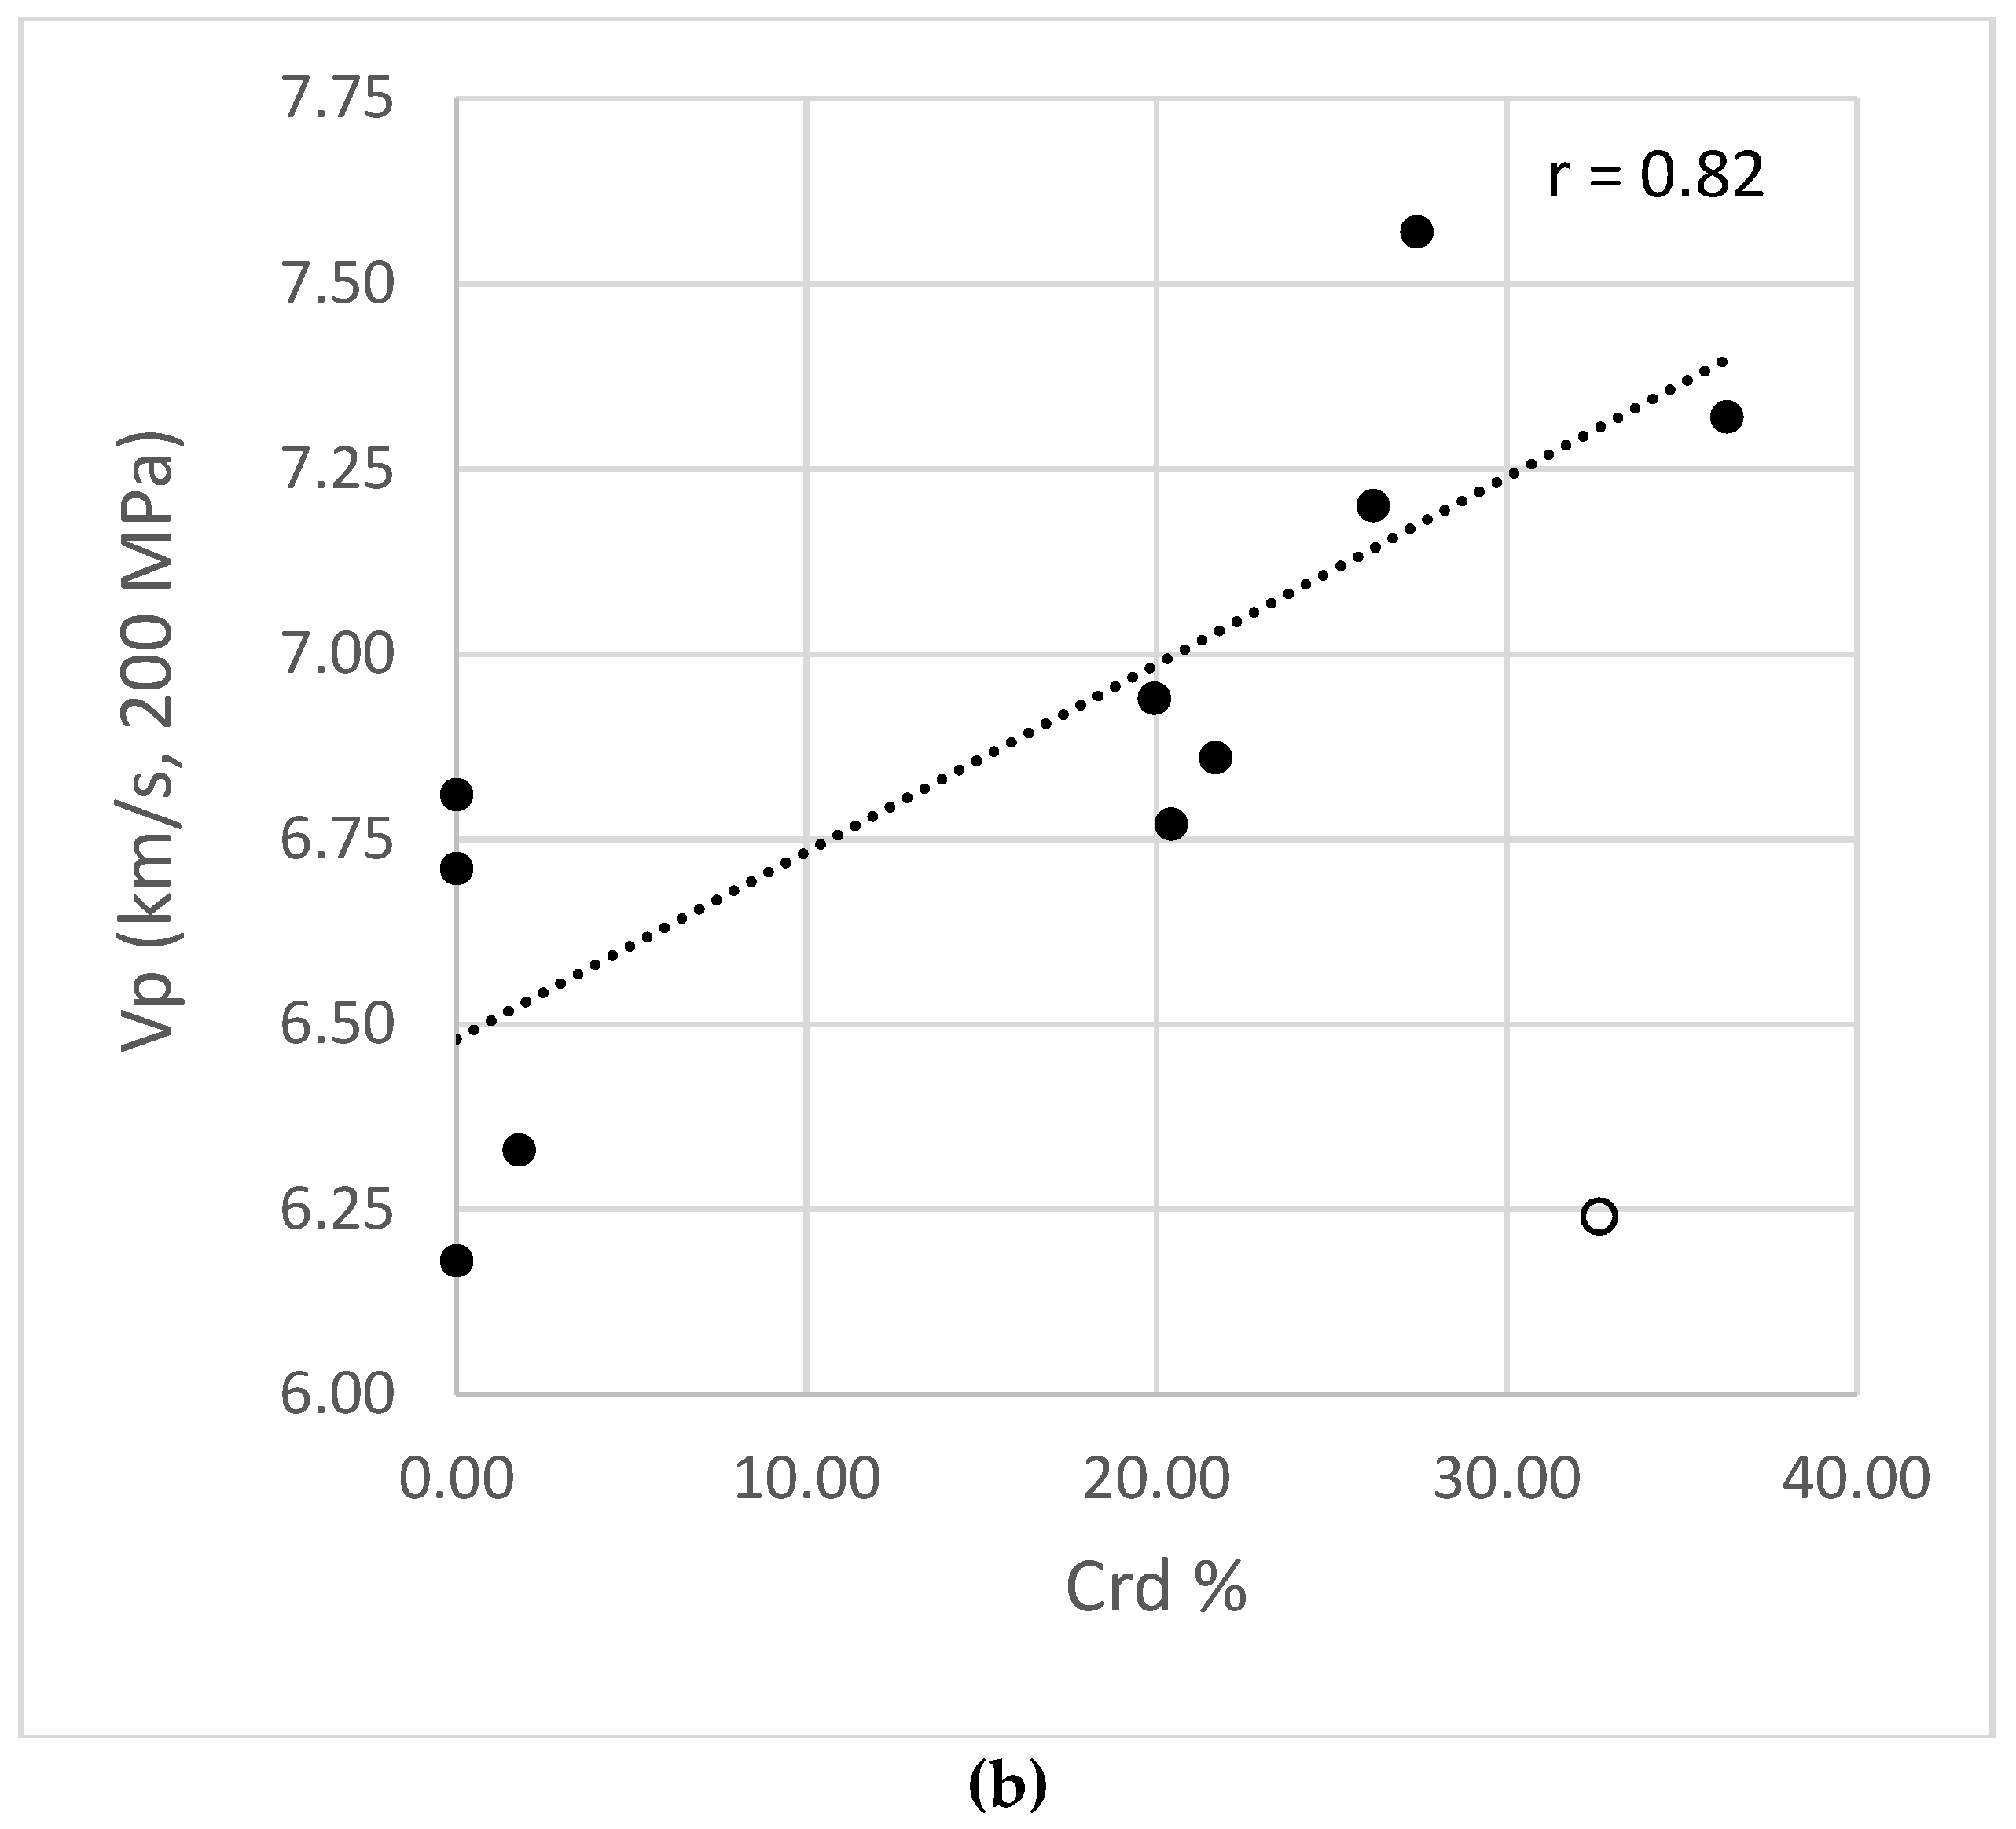
Figure 7). Although the SEM-EDS sample set is limited in size, the relatively large average abundance of low-density high-velocity cordierite (
Figure 8a), and its positive correlation with P-wave velocity (
Figure 8b), is consistent with the low-density trends of intensely-altered intermediate to mafic lithofacies (
Figure 3), as well as increasing alteration index values towards higher velocities (
Figure 4). Cordierite, among other aluminum silicates (such as garnet, kyanite, sillimanite, and staurolite), in volcanic protoliths is diagnostic for hydrothermally-altered rocks that have been metamorphosed in the middle to higher amphibolite facies [
20,
23]. Cordierite has a unique low density, high P-wave velocity signature in comparison to other silicate minerals, which explains the steep negative low density-high velocity trend (
Figure 3,
Figure 4 and
Figure 7). In general, the SEM-EDS results confirm that the seismic rock property variations in the host rocks of the Lalor VMS deposit are controlled by large variations in the abundance of silicates, whereas the sulfides have negligible effects (
Table 2 and
Table 3).
5. 2D Seismic Synthetics
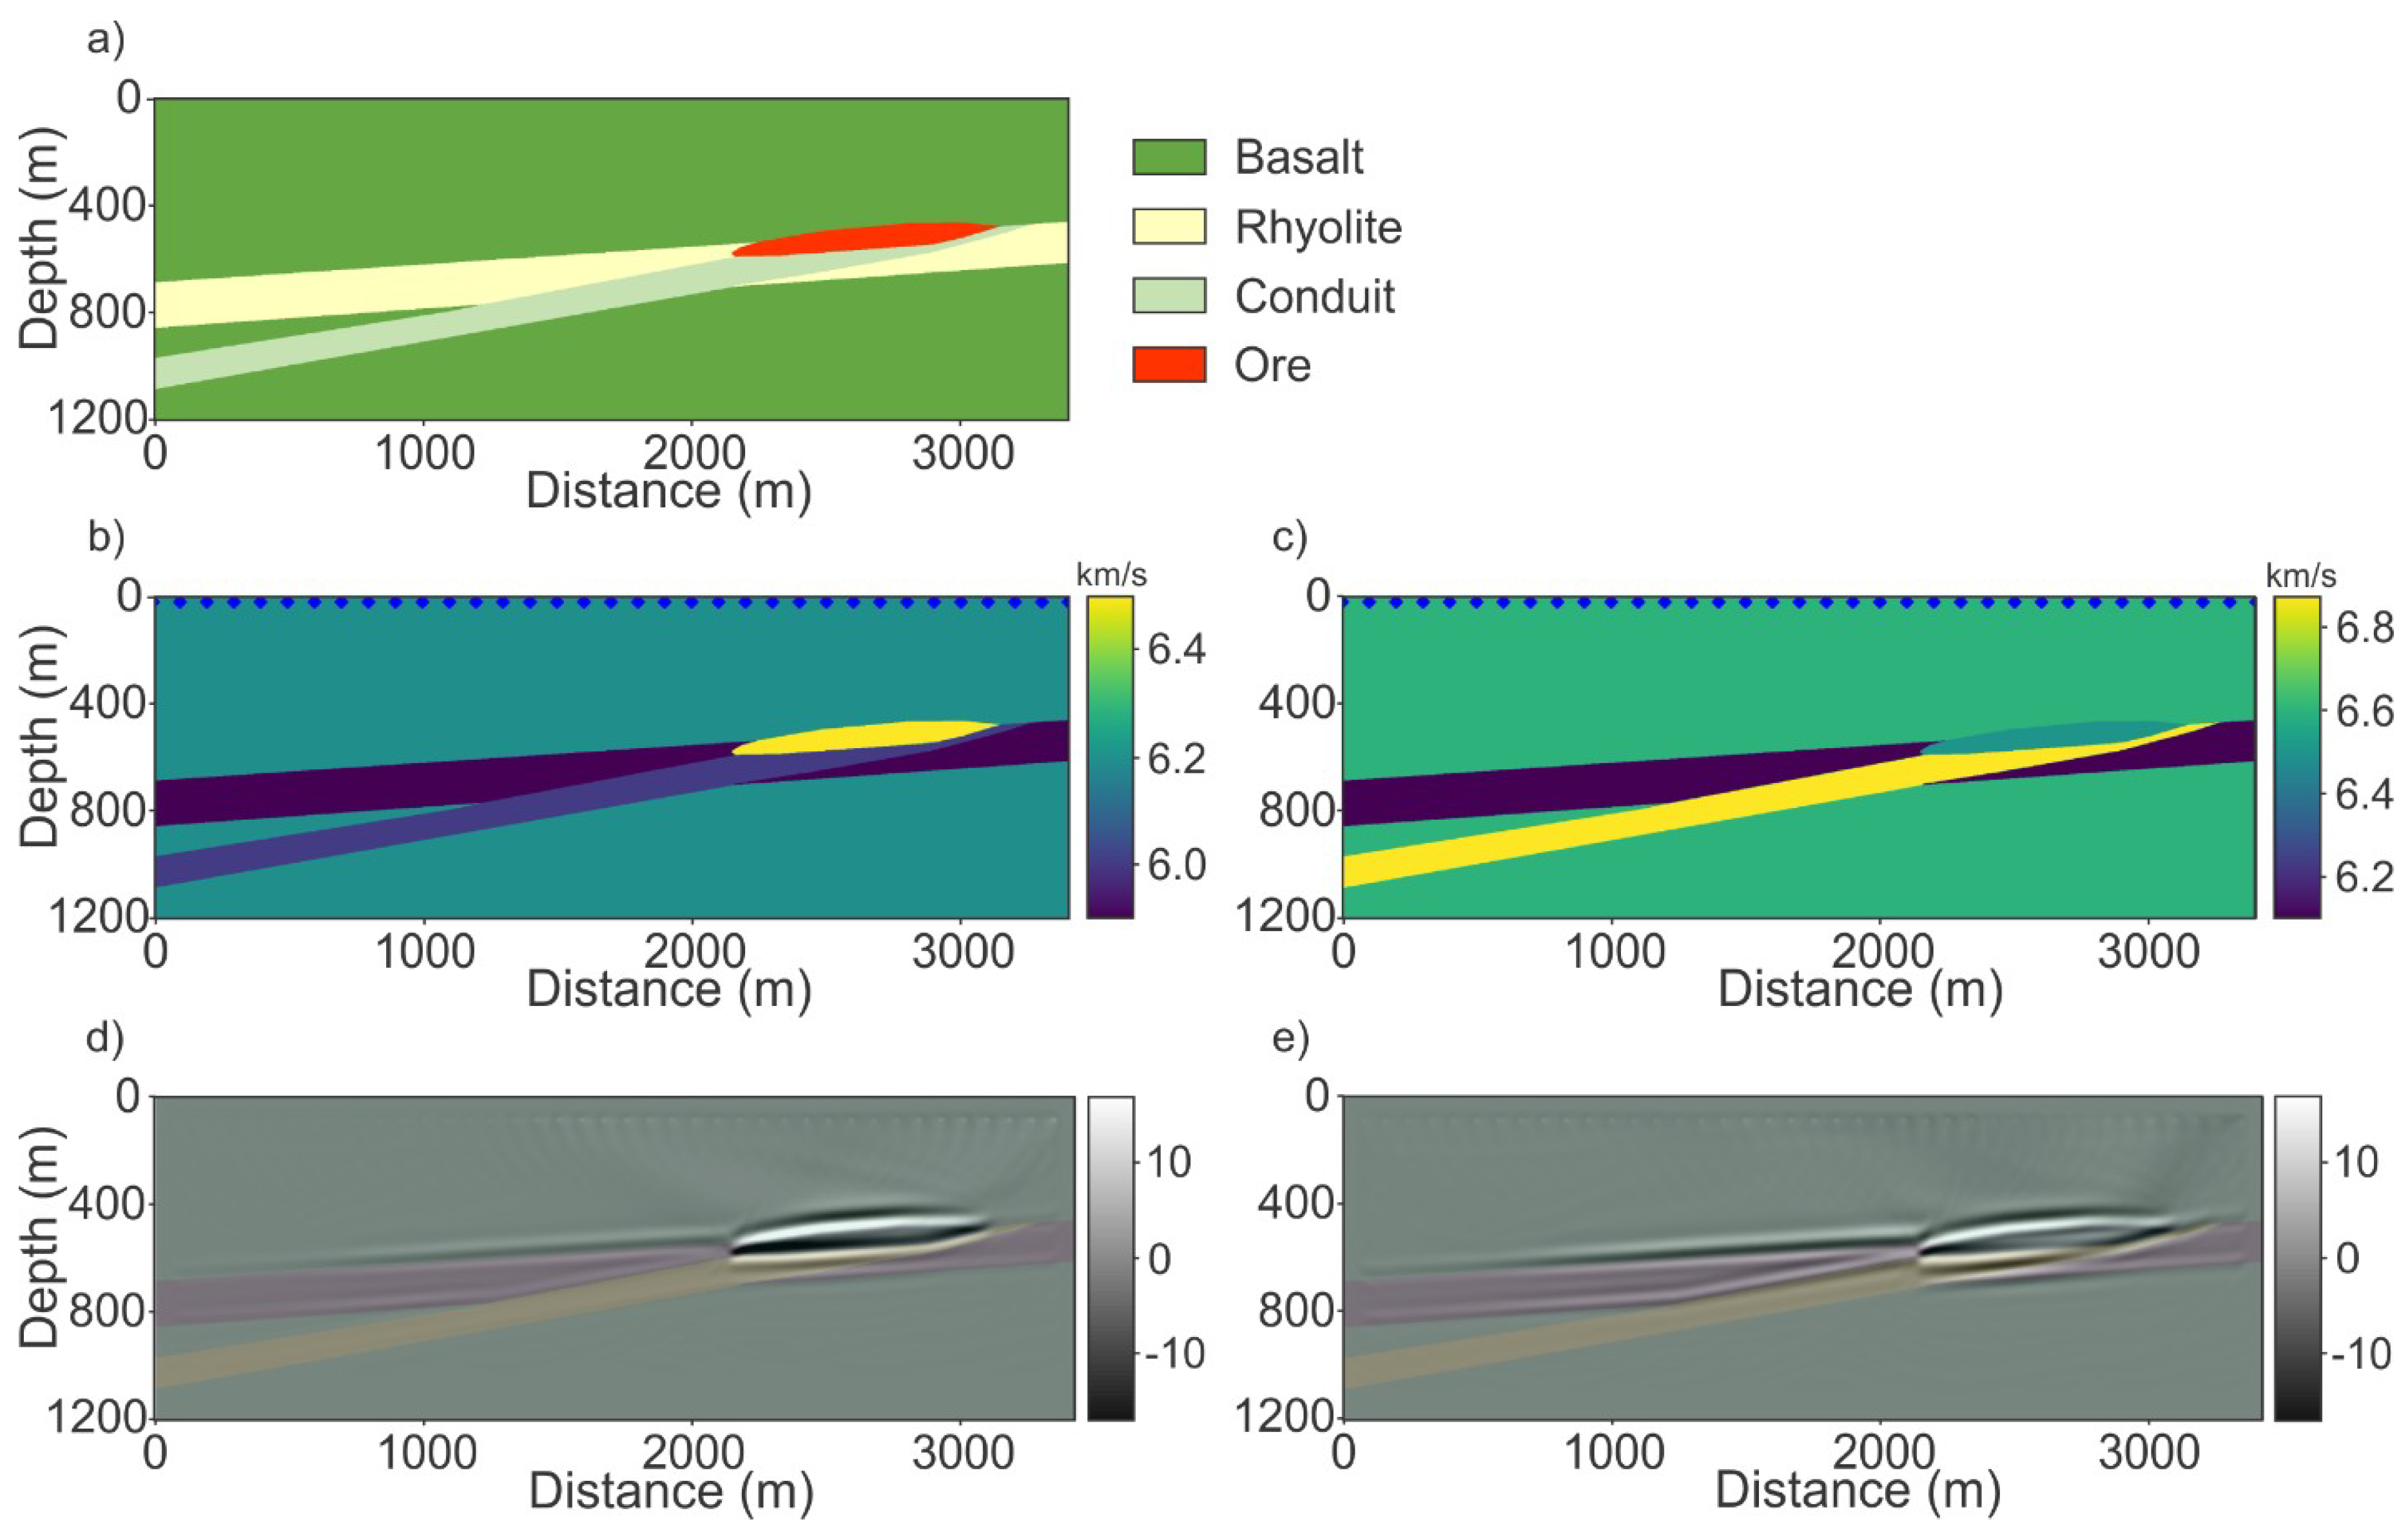
The impact of high-velocity aluminum silicates on reflectivity was further assessed by modeling the seismic response of a simple VMS deposit consisting of a bimodal volcanic host rock background of basalt and rhyolite, a massive sulfide ore lens, and a subconcordant hydrothermal conduit (
Figure 9). Two scenarios were tested: (1) A model in which the grade of the metamorphic overprint corresponds to peak metamorphic conditions inferred for the Lalor VMS deposit (600 °C, 6 kbar, [
20]); and (2) a low-grade greenschist facies (350 °C, 2.5 kbar), equivalent of the first model, representative of the majority of VMS deposits discovered in the Canadian Shield. The seismic properties of the first model were computed from the mineral fractions of seven samples from the zone of intense hydrothermal alteration using the mixing laws described above. The normative minerals computed from the major oxide analyses of the same samples using CONSONORM_LG (CONSOREM (Consortium de recherche en exploration minérale—Mineral Exploration Research Consortium, de l’Université, Chicoutimi, QC, Canada) [
35] (
Table 6) were used to compute the seismic properties of the conduit consisting of the lower greenschist facies mineral assemblage of the second scenario. Normative mineral computations essentially provide an estimate of the idealized mineral composition of a rock, based on assumptions about the order of mineral formation (as defined, for example, by the order of crystallization of mineral phases from a melt) and known equilibrium phase relationships [
36]. Normative mineral computations developed for metamorphic rocks (such as the CONSONORM_LG algorithm applied in this study) also honor metamorphic petrologic constraints, which limit mineral phases to those that can coexist in solid state under given pressure-temperature conditions [
35]. The estimated normative mineral composition may differ from the visually observed mineral composition of the rock sample, dependent on the extent to which the assumptions that define the rules of the normative mineral computation are violated. The normative mineral computation starts by converting the weight fractions of the major oxides to mole fractions by dividing each oxide by its molecular weight. The computation then proceeds in a number of steps of prescribed order, in which the mole fractions are distributed among a preselected set of normative minerals until they eventually exhaust to zero. This involves a total of 12 computational steps for the CONSONORM_LG algorithm, subsequently allotting the mole fractions to sulfides, carbonates, Fe-Ti oxides, Al–Ca–Fe–K–Mg–Na silicates, quartz, and volatiles [
35]. In the final step, the mole fractions of the normative minerals are multiplied by the appropriate formula weights and divided by the mineral densities to compute their volume fractions [
36]. The normative minerals thus obtained for the hydrothermal conduit of the greenschist facies synthetic model were generalized into fewer classes and then renormalized to unity (
Table 7). This involved the omission of all the fractions below 1%, the summation of Mg- and Fe-chlorite, as well as the summation of paragonite and sericite. Because neither the P-wave velocity measurements of pyrophyllite, nor the appropriate measurements of the elastic moduli required for computing it could be found in the literature, pyrophyllite was omitted from the analysis.
The properties of the least-altered host rocks (basalt and rhyolite) and ore for the greenschist facies modeling scenario were determined from wireline logs for the first scenario and were adjusted to reflect the appropriate pressure-temperature conditions for the second scenario using the average
Vp and
ρ of the least-altered basalt and rhyolite from the wireline logs acquired in the Flin Flon VMS camp [
37]. The seismic properties of all modeled units, for both scenarios, are summarized in
Table 8.
A total of 40 shot points equally distributed 20 m below the surface were modeled with an acoustic (P-wave velocity and density) finite-difference method based on a second-order approximation of the time derivatives, and a fourth-order approximation of the spatial derivatives was solved on a staggered grid. The seismic wavefield was sampled at 341 receivers also placed near the surface of the model every 10 m. The seismic source is a Ricker wavelet, with a center frequency of 70 Hz, which corresponds to the center frequency of the Lalor migrated volume [
4]. Synthetic shot gathers were then migrated in depth using a reverse-time algorithm. Both modeling and reverse-time migration were conducted with Devito [
38].
The strongest reflections are in both the greenschist and amphibolite facies scenarios, associated with the ore zone (
Figure 9,
Table 9). For the amphibolite scenario, the reflection beneath the ore zone includes constructive interference from the conduit-basalt contact. Note the enhanced reflectivity of the basalt-rhyolite contacts in the amphibolite facies scenario, due to the significant increase of P-wave velocity in basalt (a 40% increase in reflectivity in comparison with the greenschist scenario,
Table 9). The most significant difference in acoustic impedance contrast between the two scenarios is observed at the contacts between the conduit and felsic host rocks. For the amphibolite facies scenario, the reflectivity of the conduit-rhyolite contacts increases by 75% (
Table 9) with respect to the reflectivity of these contacts in the greenschist facies scenario, becoming as large as the impedance contrast across the basalt-rhyolite contacts (
Table 8). In contrast, in the greenschist facies scenario, the conduit is weakly reflective when juxtaposed against rhyolite (
Table 8). Seismic reflections at conduit-basalt contacts are probably not detectable in both scenarios, considering the 6% rule-of-thumb threshold for a strong amplitude-normal seismic reflection [
2].
6. Seismic Interpretation
In 2013, the Geological Survey of Canada acquired a 3D seismic survey to characterize the three-dimensional structure of the Lalor deposit and its host rock envelope. The 3D survey covers an area of approximately 16 km
2 (
Figure 1) and includes 908 shot points and 2685 receiver stations. The many shot points located northeast of the deposit provided sufficient ore zone illumination from the down-dip direction to produce a high-quality image of the deposit and alteration zone. Details on the acquisition, data processing, and initial interpretation of the 3D seismic data are found in [
4]. The seismic survey allowed the detection of the massive zinc-rich zones and identified strong reflectivity in the altered footwall rocks at contacts between metamorphosed rocks with felsic and mafic protoliths [
4].
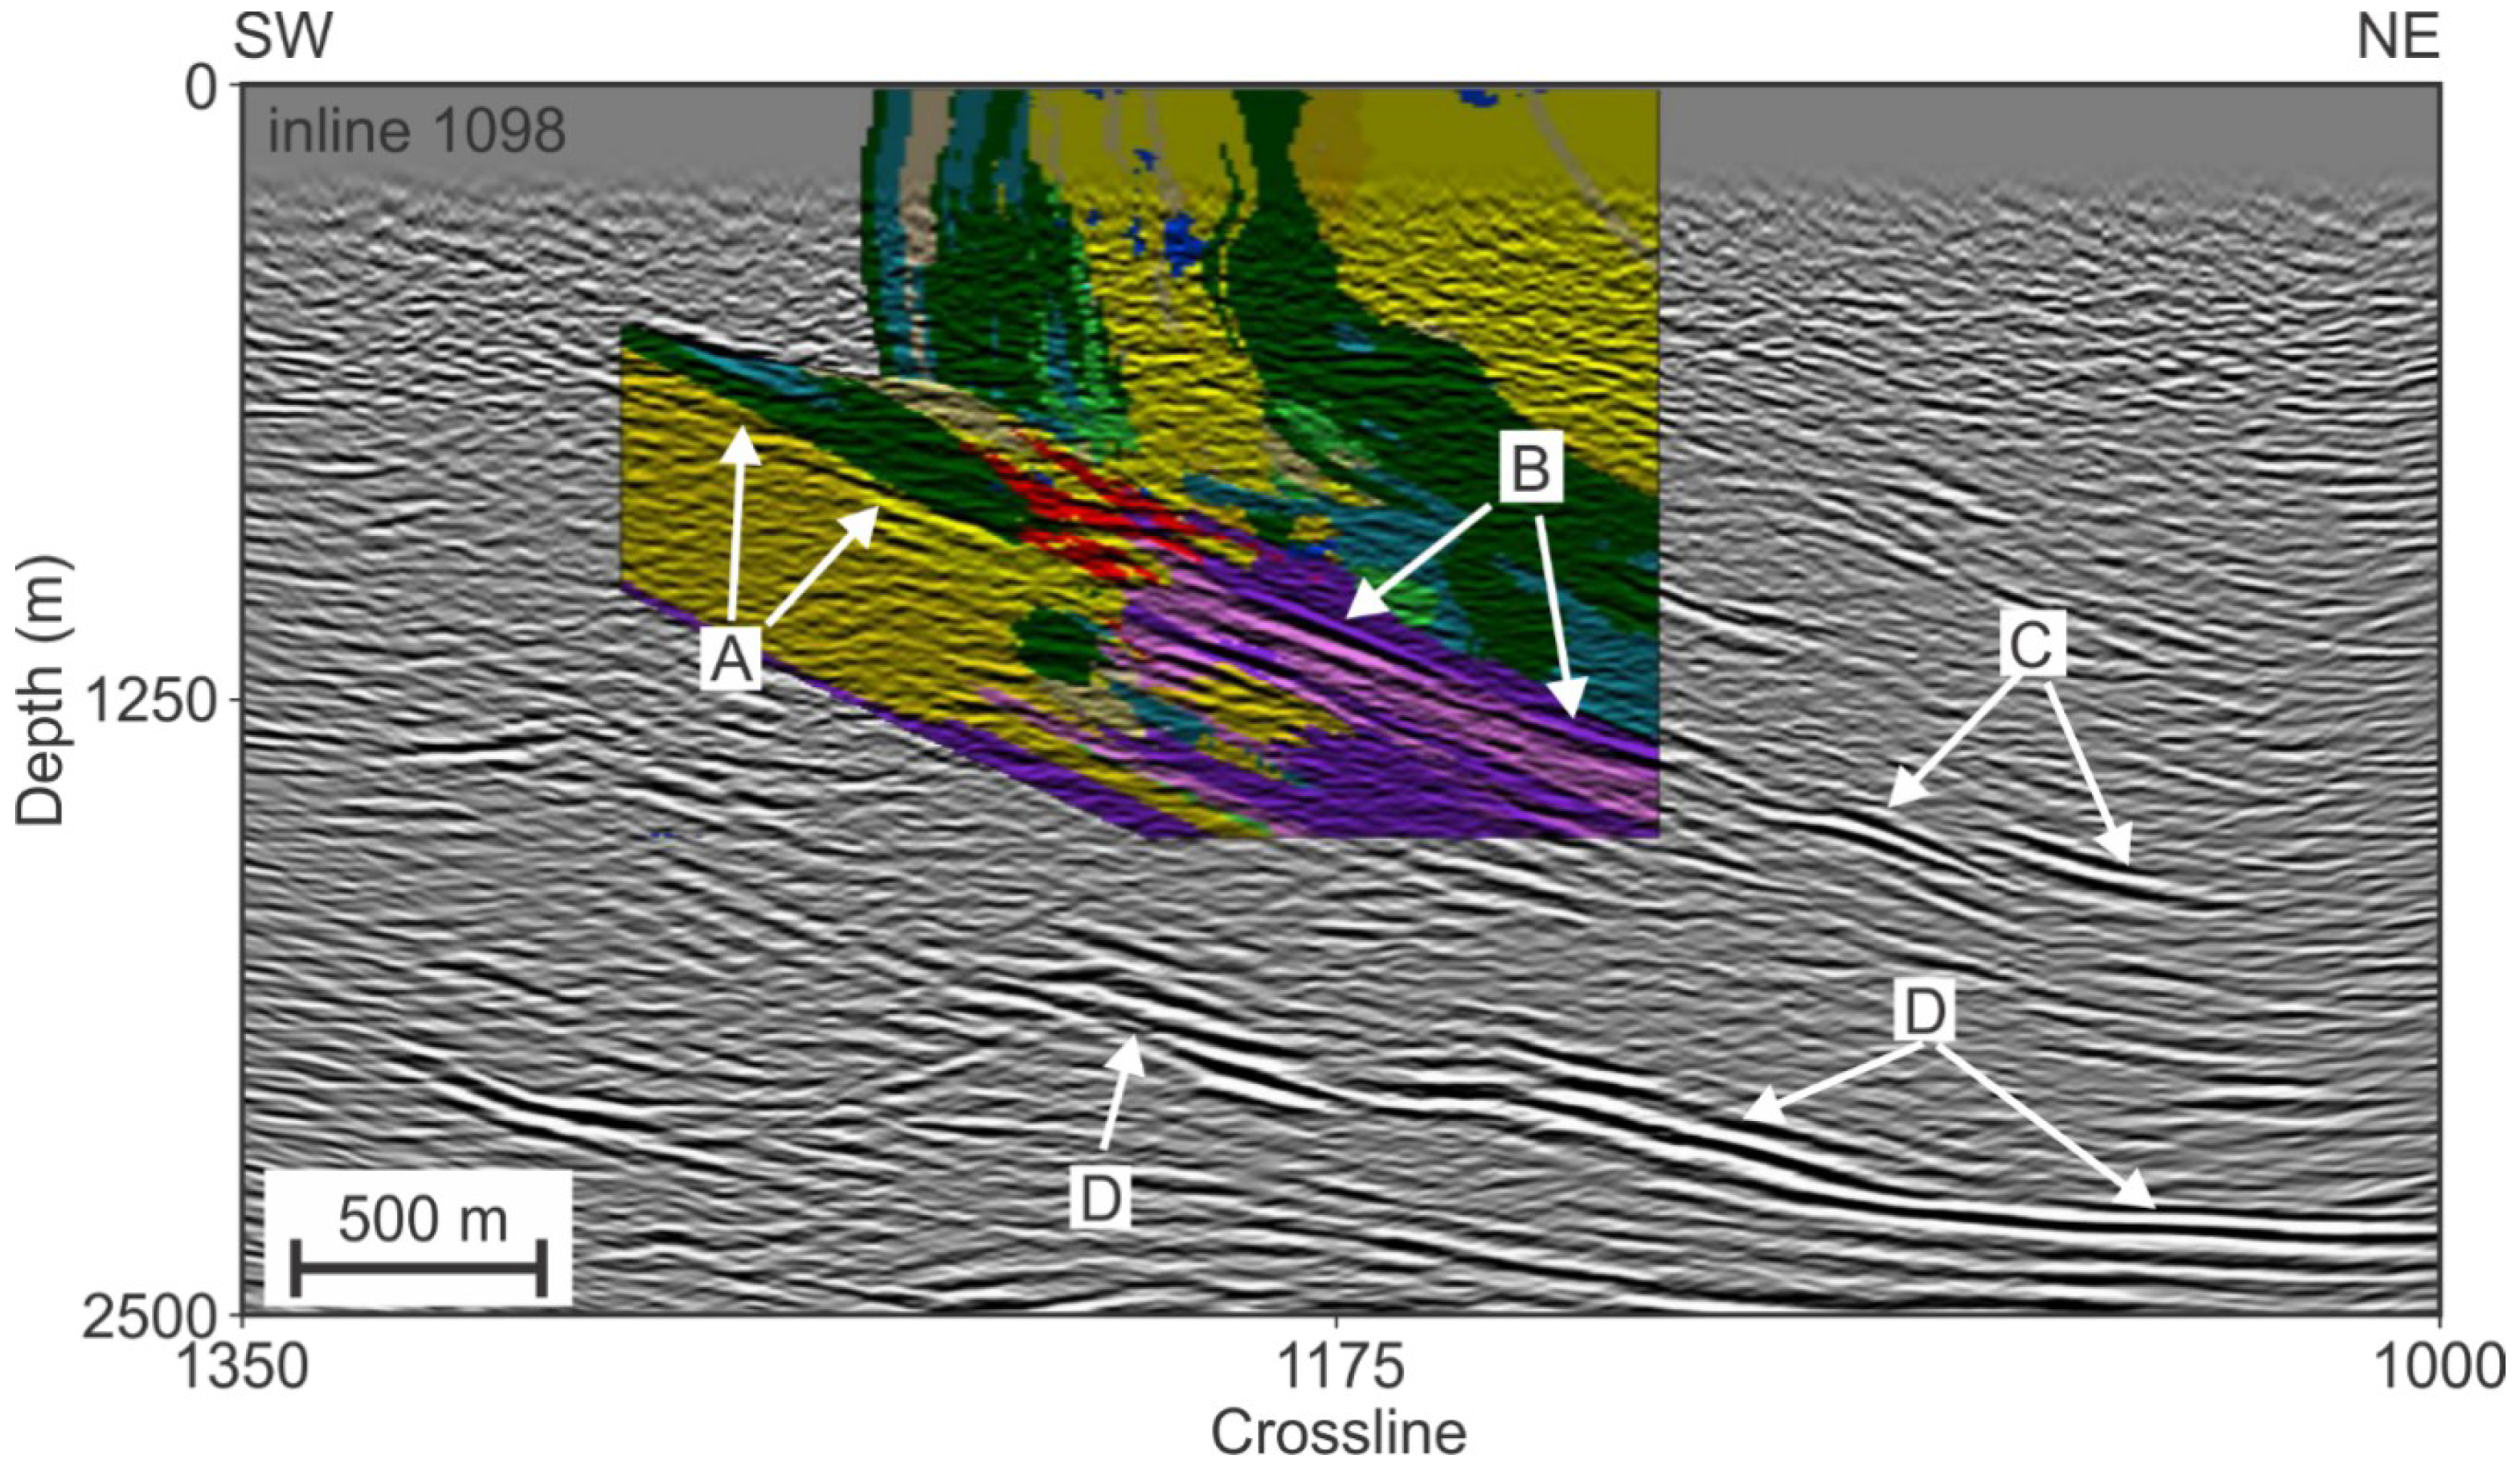
Figure 10 shows inline 1098 from the 3D seismic volume and a coincident section from a 3D geological model, representing lithofacies derived from the Zr/Ti immobile element ratio. Arrows A and B point to reflections occurring at contacts between felsic and mafic rocks/protoliths in the least and most altered footwall rocks. Reflection B has higher amplitudes and is more continuous than reflection A. Arrow C indicates a series of strong reflections downdip of the alteration zone in the geological model and represents a possible continuation of strong footwall alteration at depths. At even greater depth, the strong reflections indicated with label D could be related to a structural repeat of the same hydrothermal alteration conduit or a conduit-sulfide mount hosted in an underlying lithostratigraphic interval. The abrupt termination updip of reflections D, almost directly beneath the deposit, supports both interpretations. Alternatively, reflections D may result from lithological variations. Following our interpretation, the areas indicated with arrow C and possibly arrow D, are rocks characterized by intense hydrothermal alteration, with high economical potential. At Lalor, examples of such potential are the disseminated gold-rich zones that, contrary to the massive sulfide zones of this deposit, are not directly detected with seismic or other geophysical methods, because these relatively narrow zones with low percentages of sulfides do not experience a sufficient change in seismic rock properties to generate reflections. The disseminated zones are nevertheless found in metamorphosed and altered footwall rocks, characterized with an enhanced seismic reflectivity, originating from hydrothermally-altered rocks with a significant abundance of aluminum silicates with high
Vp (cordierite and garnet).
7. Discussion
Four distinct processes control the variation in seismic rock properties throughout the geological history of the Lalor VMS deposit, including (1) the protolith composition resulting from the extrusion and deposition of volcanic and volcaniclastic rocks of different composition on the paleo seafloor, (2) sulfide mineralization, (3) host rock alteration during the subsequent flow of hydrothermal fluids through the ocean floor, and (4) metamorphic recrystallization after the emplacement and subsequent tectonic burial of the VMS deposit within an orogenic belt. All four processes (in addition to weathering and unloading when the deposit is exhumed to the surface) will affect seismic rock properties, although the first two appear to be dominant, which explains why they are dominantly reported in the hard rock seismic exploration literature [
1,
2,
3]. The additional effects on seismic rock properties of the latter two processes are much more challenging to assess. Firstly, many more silicate species, many of which are also found in their unaltered equivalents, occur in association with VMS deposits, in comparison to the few sulfide species that define the ore zones. Secondly, many of the silicates involved have much stronger anisotropies in velocity and will likely react to other species as a result of subsequent metamorphic recrystallization. Nonetheless, the SEM-EDS analysis, although applied on a limited number of samples (
n = 11), was effective for interpreting the relationships between the mineral abundance and measured seismic rock properties of hydrothermally-altered rocks, allowing the corroboration of the empirical relationships inferred from the much larger wireline seismic property datasets.
SEM-EDS analysis outperforms traditional point counting under the microscope for a number of reasons: (1) Contrary to point counts, the entire thin section is scanned, leading to more robust abundance estimates; (2) the visual discrimination of certain minerals can be difficult or unpractical based on optical microscopic diagnostic criteria, such as the discrimination between cordierite and quartz, and between different feldspars and amphiboles; (3) SEM-EDS, in addition to mineral identification, also provides the chemical composition of the classified minerals, which potentially allows for a more precise assessment of the mineral seismic properties for mineral compositional series, such as feldspars and amphiboles. Given the long scanning times, exceeding on average 6 hours and an additional 1.5 h for classification per sample, the method is, however, time-consuming and therefore costly.
Alternative approaches based on analyzing the relationships between seismic rock property measurements and geochemical proxies for alteration, as previously attempted in [
39], are limited in scope, because, as shown in the forward modeling study, similar ranges in these proxies could (depending on the metamorphic grade) show large variations in mineral seismic properties. Therefore, estimates of mineral abundance are essential to progress the understanding of the seismic response of hydrothermal alteration. A solution that would bypass laborious mineralogical analysis is to obtain theoretical mineral abundance estimates though normative mineral computation, but these methods are fraught with modeling limitations themselves, as they either lead to non-unique solutions or, when additional constraints (such as pressure and temperature) are involved, yield mineral species that significantly deviate from those observed in practice. Future studies may explore upscaling approaches where the results of the SEM-EDS analyses are used to define the endmembers in user-defined normative mineral computations, such as proposed in [
40].
Several factors contribute to the uncertainty of the seismic property mixture models, including (1) the variability in the mineralogical composition between the mini-core and thin section slabs cut at different locations from a 20–30 cm piece of drill core; (2) errors in the SEM-EDS analyses, including violations of the isotropic assumption of random sampling design that justify the use of areal percentages in estimating volumetric percentages of foliated rocks; (3) errors in the seismic rock property measurements; (4) violation of the assumptions of homogeneous and isotropic mixtures used to compute the Voigt and Reuss bounds related to anisotropy in mineral seismic velocities; and (5) uncertainty in the mineral seismic properties, with respect to the specific chemical composition of the mineral analyzed in the sample. The good fit obtained for density suggests that the effects of factors 1 and 2 (and 3 for density) are relatively small, although the two outliers (
Figure 6) could be explained by these factors. Errors in the
Vp measurements are also not a dominant factor, as these measurements are generally considered accurate to 0.5–1% [
5]. The fact that a significant number of P-wave velocity measurements (4 out of 8, excluding outliers in density modeling, see inset
Figure 7) fall outside the theoretical Voigt and Reuss bounds suggests that factors 4 and 5 likely play a dominant role and violate the assumptions of homogeneous and isotropic mineral components. Indeed, many of the samples show preferred orientation of mineral constituents, such as amphibole and biotite, as they are aligned along the gneissosity, pointing to large anisotropies in the rock fabric (
Figure 5). These anisotropic effects on seismic rock properties have not been assessed in our study. They can be estimated by measuring seismic velocities in three mutually orthogonal directions (see [
41] for an example of the Anabel shear zone of the Flin Flon greenstone belt, about 100 km to the west of the Lalor VMS deposit). Variations in the concentrations of Fe and Mg in minerals such as cordierite, chlorite, garnet, and particularly amphibole, significantly impact their corresponding seismic properties. Hence, mineral seismic property measurements over a range of chemical compositions, which are currently not available in the literature, may help in reducing the uncertainty in seismic property models dominated by variations in silicate minerals.


