Article

Measurement of Process Conditions Present in Pilot Scale Iron Ore Sintering

1
PYROSEARCH, Pyrometallurgy Innovation Centre, School of Chemical Engineering, The University of Queensland, St Lucia, QLD 4072, Australia
2
Former University of Queensland, Now Centre for Advanced Microscopy, The Australian National University, Acton, ACT 2601, Australia
3
Baosteel Research Institute, Baoshan Iron & Steel Co., LTD., Shanghai 201900, China
*
Author to whom correspondence should be addressed.
Minerals 2019, 9(6), 374; https://doi.org/10.3390/min9060374
Submission received: 20 May 2019 / Revised: 18 June 2019 / Accepted: 18 June 2019 / Published: 22 June 2019
(This article belongs to the Special Issue Mineralogy of Iron Ore Sinters)

Abstract

:
An improved experimental technique has been developed to measure, concurrently, the oxygen partial pressures and temperatures within a pilot scale iron ore sinter pot as a function of time. The measurements and thermodynamic calculations have demonstrated that the oxygen partial pressure at peak bed temperature and during cooling can be oxidising or reducing relative to hematite. Examples of typical microstructures and phase assemblages observed in product sinters are presented. Potential mechanisms of hematite and magnetite formation at sub-liquidus and sub-solidus conditions are demonstrated. The relative impacts of changes to coke rate and draft pressure drop on the process conditions and proportions of the phases formed in the sinter have been measured. Increasing coke rate was shown to result in a faster sinter heating rates, higher peak bed temperatures and times at peak temperature. Higher draft pressures across the sinter bed resulted in faster sinter heating rates and shorter times at peak temperature.

1. Introduction

Iron ore sintering is undertaken at steelworks to produce coarse and competent feed for the iron blast furnace from iron ore fines and secondary iron oxide sources. In the sintering process, a blend of iron oxide fines (<6 mm) is mixed and agglomerated with the addition of fluxes, return sinter and coke breeze. The agglomerated material is loaded as a packed bed onto a continuous downdraft sinter strand and the surface of the bed is ignited using a secondary heat source. Air is continuously drawn down through the bed, resulting in the movement of a heat front down through the charge. At a critical temperature, the coke ignites, providing additional thermal energy and creating CO and CO2 gases in the bed. The gaseous combustion products pass through the bed, heating the solids, enabling further reactions to occur and the partial melting of the charge. On cooling, solidification of the melt occurs, resulting in the formation of strong sinter lumps. The sintering conditions and the microstructures formed influence the final sinter properties and performance in the iron blast furnace.
The general thermal history of sinter, namely rapid heating, peak bed temperature and cooling, has been well established through measurement of temperature profiles in the bed [1]. From the temperature profiles and the analysis of the phases present within a sinter bed at different stages of sintering, a number discrete regions or reaction zones have been identified in the sinter bed, as illustrated by Figure 1. These are, in the order in which they occur, from the bottom of the sinter bed to the top, the wet zone, dry zone, calcination and dehydration zone, combustion zone, sinter and cooling zone [2,3]. In the wet zone, green sinter agglomerates are heated by moist air, with water condensing from the air. Further heating of the wet sinter with the hot and dry air, removes all the physically entrained water in the sinter, creating the dry zone. The dry sinter is rapidly heated in the dehydration and calcination zone, with the dehydroxylation of hydrates and decarbonation of carbonates occurring in this zone. After dehydration and calcination on further heating, the coke breeze is ignited and is combusted, rapidly heating the gas stream and sinter to the peak bed temperature. After achievement of the peak bed temperature, the sinter is cooled by the air drawn down through the sinter bed.
Despite the widespread industrial use of this process, relatively few measurements of the oxygen partial pressure (pO2) within the sinter bed during sintering have been carried out [4,5]. The pO2 measurements by Sugiwara et al. [5] indicated that the lowest oxygen pressure, pO2 of ~10−8 atm, occurred at the peak bed temperature of approximately 1673 K. The position and method of introducing the probe into the sinter bed was not described in the paper. During heating, the pO2 was reported to be lower than 0.21 atm.; on cooling, the measured oxygen partial pressure was close to 0.21 atm. Research by van den Berg et al. [4] indicated that the most reducing conditions, a pO2 of ~10−2 atm, occurred prior to the peak bed temperature. To perform the pO2 and temperature measurements, an oxygen probe and a thermocouple were inserted from the top of the sinter bed, into the centre of the sinter pot. On heating, the pO2 was between 10−1.5 and 10−1 atm at 1025 K; this decreased to 10−2 to 10−1.5 atm at approximately 1225 K and subsequently increased to approximately 10−1 atm at the peak bed temperature of approximately 1525 K. On cooling, oxygen partial pressures between 10−1 and 0.21 atm were recorded.
Mathematical models of the sintering process [6,7,8,9] have been used to predict the temperature profiles within a sinter pot and the associated offgas composition with reasonable agreement to those measured in sinter pot tests. The models replicate the rapid heating, attainment of the peak bed temperature and the sinter cooling measured in these down draught sinter processes. The sinter offgas compositions have been simulated and in agreement with gas composition measurements on sinter pots, both CO and CO2 was observed. However, the pO2 within the sinter bed and its relationship to the temperature profile was not determined [8].
A number of process parameters can be used to influence the sinter microstructures and resulting properties. The temperature and thermal history of sinter can be controlled with the addition of coke breeze and adjustment of the sinter draft pressure [1]. Previous modelling and sinter pot tests have demonstrated that with an increase in coke rate there is an increase in the sinter peak bed temperature and time at temperature [10], and with an increase in the draft pressure there is a decrease in the sinter peak bed temperature and time at temperature.
The focus of the present study is on the measurement of the temperature profiles and pO2 in sintering. In addition, the effects of coke rate and sinter draft on the temperature profiles and the phases formed during sintering are determined.

2. Methodology

2.1. Pilot Scale Sinter Pot Tests

Previous studies of the iron ore sinter process have established that the process conditions, temperature and gas composition vary with time and position in the bed [3]. The thermal profile changes as it moves down through the bed [7]. A single probe inserted in the bed measures the sum of multiple local sub processes taking place within the bed. There are uncertainties associated with the heterogeneity of the system and the measurement techniques used to characterise this system;
  • Local differences in phase and particle distribution. These are directly related to the materials used in the feed, particle size distribution and methods of granulation. The differences in local chemical composition and phase assemblage result in differences in enthalpy of reaction and enthalpy of fusion. The combustion of coke provides a local heat source.
  • Partial Melting. Whilst the initial sinter charge resembles a randomly packed bed of solids during sintering, partial melting of the bed takes place resulting in channelling of the gas and changes to bed porosity. These changes result in changes to the local rates of heat transfer from gas to condensed phases.
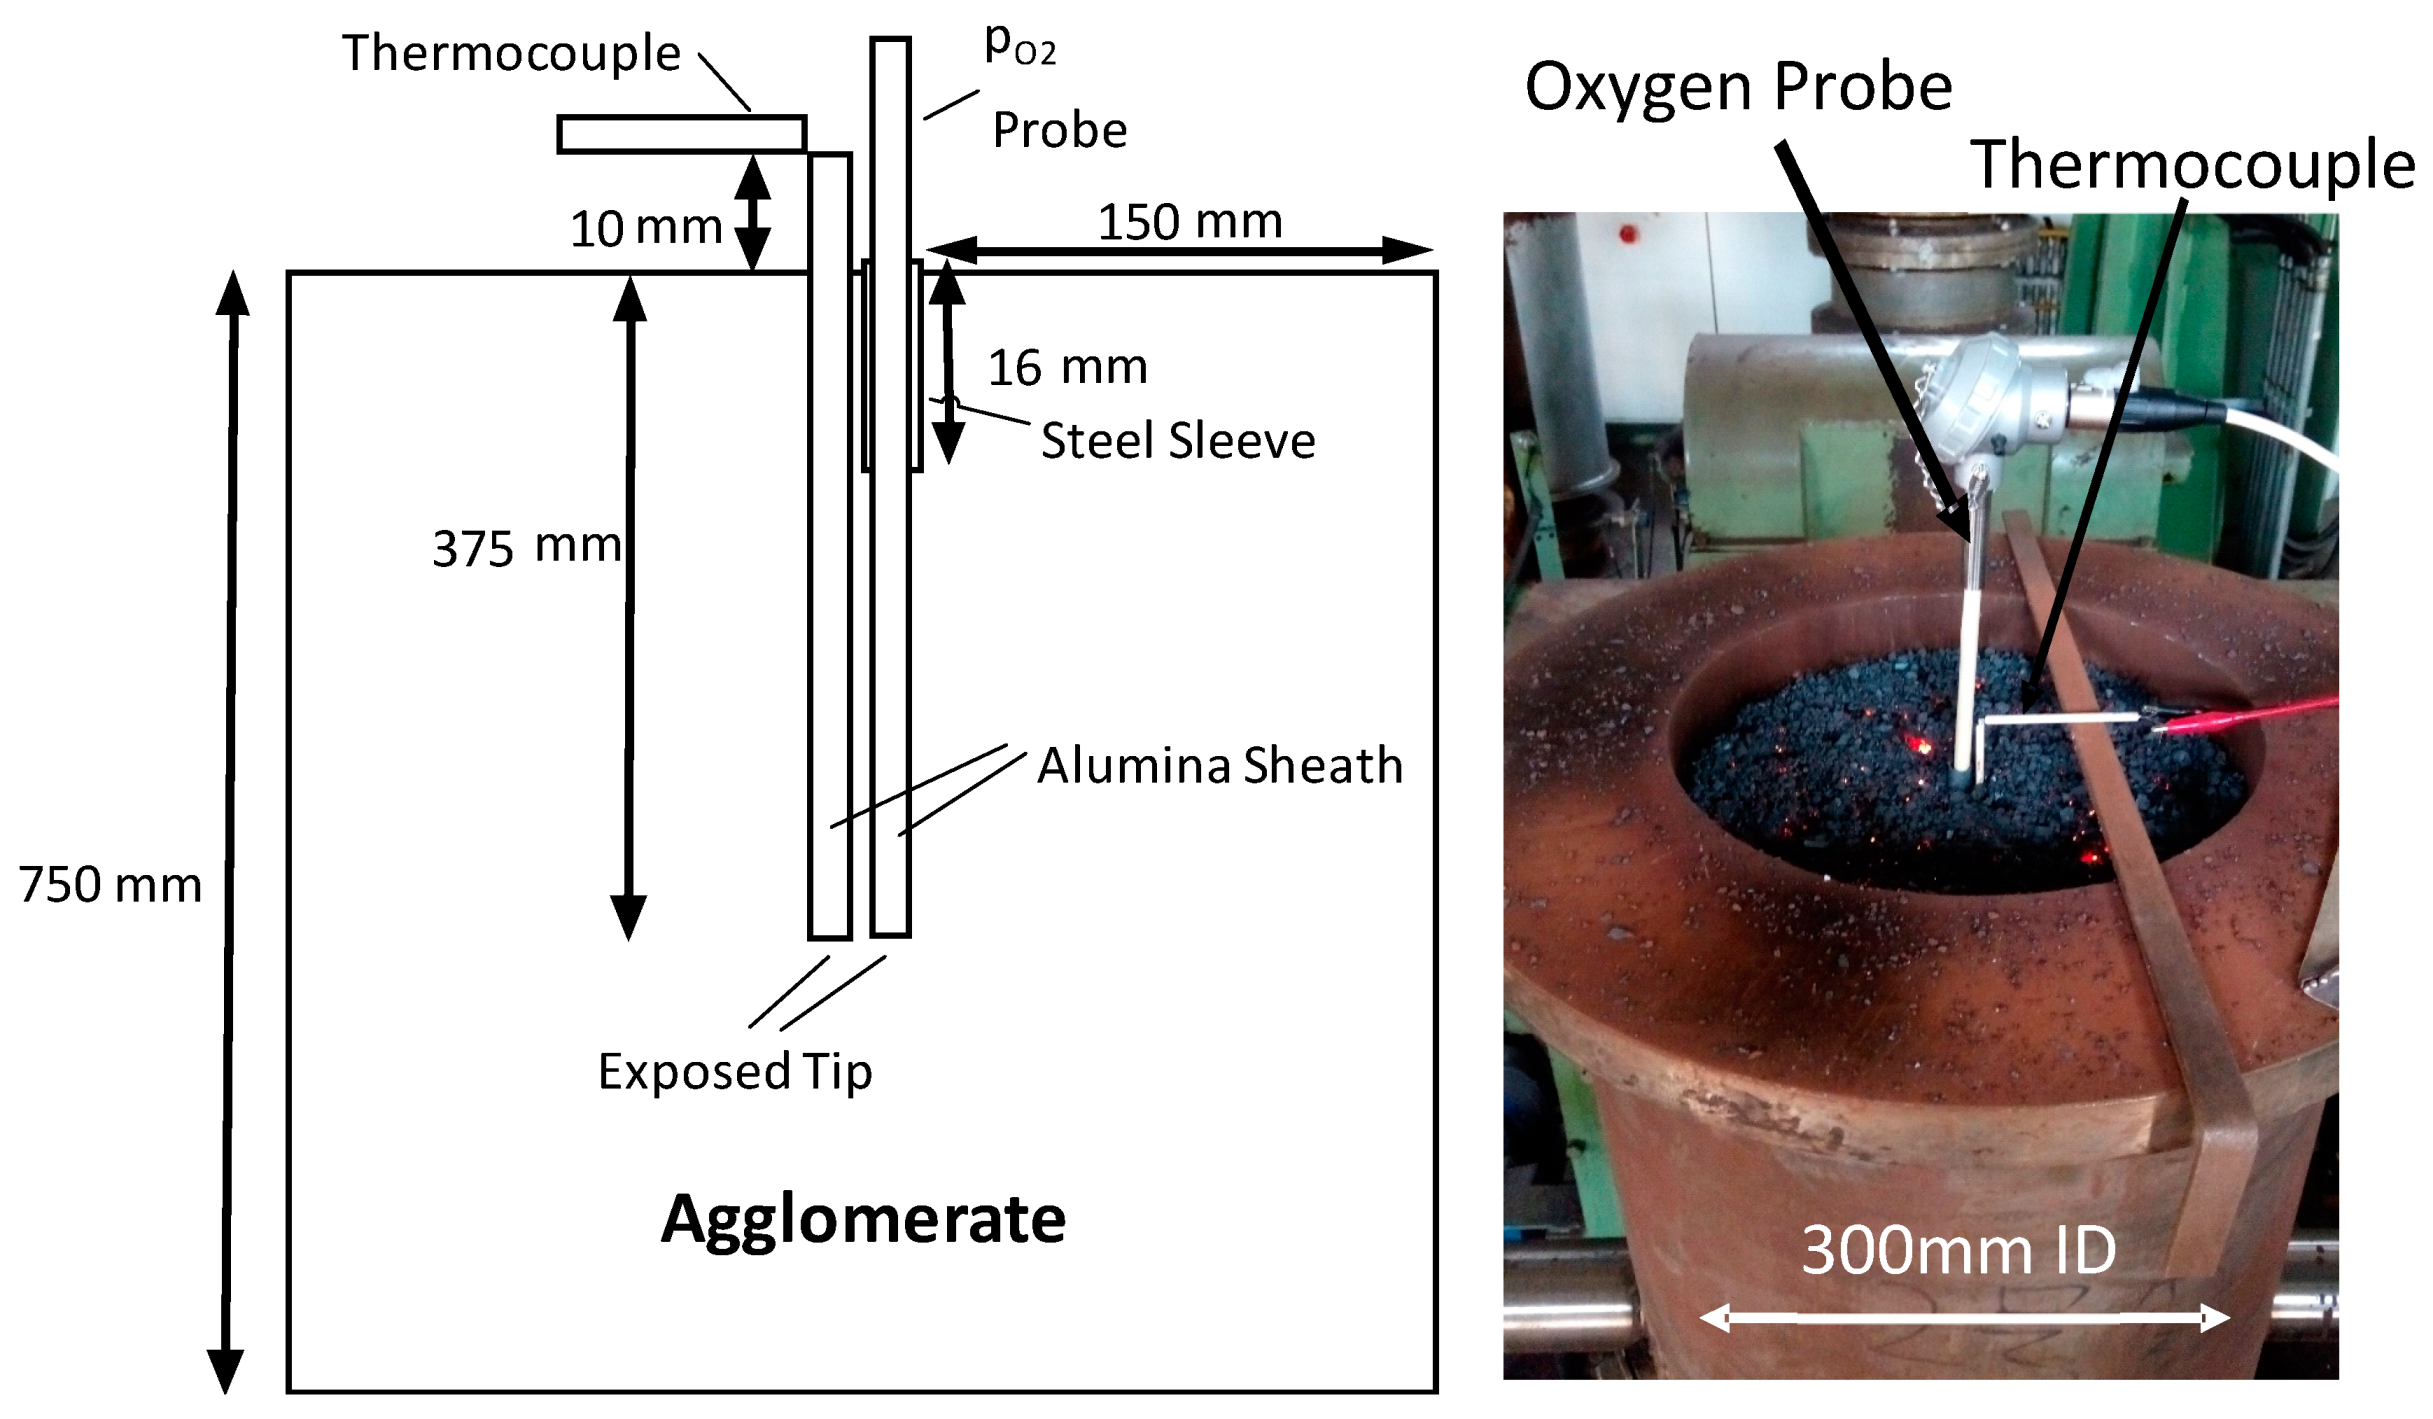
  • Bed shrinkage. The partial melting of the burden leads to an increase in bulk density and shrinkage of the bed. The interaction of the sinter bed and the probes during sintering can lead to the creation of voids and changes to the local voidage around the probe. This can be minimised by inserting the measuring devices from the top of the bed rather than from the side, enabling the probe to move with the bed and reduce the hold-up of the bed by the probe. However, it is recognised that the bed has moved relative to the thermocouple during the measurement. The extent of the movement depends on the initial position of the thermocouple and the overall change in bed height during sintering, typically 13–15 vol. %.
  • Thermocouple type. To protect the metal thermocouples, prevent the thermocouple wires from breaking during bed shrinkage, provide stiffness for insertion into the bed and prevent a junction forming from crossed thermocouple wires, the thermocouple wires are inserted into an aluminium oxide sheath. The material and mass of the oxide sheath has the potential to influence the local thermal profile and response time, particularly if the thermocouple tip is enclosed by the sheath.
  • Probe type. A range of materials and designs can be used in solid state oxygen probes. The materials and dimensions of the sensor tip can influence the response time and sensitivity of the probe to changes in temperature and oxygen potential in the gas phase with time. To determine the oxygen partial pressure, separate or combined measurement of temperature and electromotive force (EMF), ∆E across a solid electrolyte may be undertaken. The calculated oxygen partial pressure, (∆E = 2.303 RT/nF. ln(pO2, unknown./pO2, reference.)) is a function of both the measured temperature (T) and the measured electrical potential difference (∆E). As such, the difference, if any, between the measured temperature and that at the tip of the solid electrolyte is required in order to accurately determine the actual pO2.
  • The rate of response of the oxygen probe to changes in oxygen pressure is dependent on temperature. At high temperatures the response times are rapid and the EMF measurements provide accurate measurement of the pO2. At low temperatures in rapidly changing systems, the EMF measured is limited by the rates of ionic transfer in the solid state probes, and measurements should be treated with caution as these may not accurately reflect the pO2 at the time of measurement.
  • The rate of response to changes in the oxygen partial pressure of the system is dependent on mass transfer from the system to the outer surface of the probe. The mass transfer is fastest when the oxygen probe is in contact with the gas phase. If, during the sinter process, the sensor tip is partially or fully covered with liquid and/or solids, again the EMF recorded may not accurately reflect the gas partial pressure at the time of measurement.
In the present study, pilot scale sinter pot tests were performed at Baosteel Shanghai using the existing equipment onsite. The feed materials for the tests were collected from the sinter plant iron ore blend. The materials used included; iron ore fines (2.5 mm), limestone (1.1 mm), dolomite (1.2 mm), coke breeze (1.5–1.8 mm) and sinter returns (2.8 mm). The feed materials were blended such that there was 1.2 wt % MgO and 1.5 wt % Al2O3 in the sinter product, and the bulk CaO/SiO2 ratio was approximately 1.7 wt/wt. Coke was blended into the feed, with a base case of 36 kg/t of feed, and 33 kg/t and 39 kg/t of feed for the low and high coke addition tests, respectively. The mean compositions of the sinters, as measured by X-ray fluorescence (XRF) after sintering, and the sintering conditions investigated are summarised in Table 1.
The feed material to be sintered, including coke breeze, was initially blended and mixed in an agglomeration drum. Both a dry and wet stage of agglomeration was performed, providing homogenisation and agglomeration of the charge. The product from agglomeration, green pellets with a diameter of approximately 2.6 mm, was loaded into the sinter pot. The sinter pot used was 300 mm ID and 750 mm high, holding approximately 53 L of material. The offgas composition and temperature was recorded directly below the sinter bed, used to determine the time at which the flame front left the sinter. The offgas composition reported in Table 1 represents the average offgas composition during sintering.
Oxygen probes and thermocouples were used to measure the pO2 and temperature during sintering. The oxygen probes, CP-500-0-NS C700, were supplied by Australian Oxytrol Systems (California Gully, Australia). These probes utilised a SIRO2 C700 sensor, with a zirconia based solid electrolyte located at the tip of the alumina tube. The oxygen probe specifications indicate the dynamic operating range of the instrument is from pure oxygen to a pO2 of 10−24 atm and temperatures from 500 °C to 1700 °C. Above 600 °C, the sensitivity is better than 2 mV; below 600 °C, the response may be slower and the error may increase to 3 mV. Separate B-type thermocouples (70%Pt/30%Rh–94%Pt/6%Rh) were used to measure the temperature within the sinter pots. The thermocouple tips were exposed directly to the sinter, with the wires shielded by an alumina sheath. These thermocouples are suited to temperatures up to 1800 °C.
A schematic of the sinter pot and the positions of these probes in the sinter bed prior to sintering are shown in Figure 2. The oxygen probes and thermocou/ples were inserted from the top of and along the central axis of the sinter bed, with the tips of the sensors located in the middle of the sinter pot (375 mm depth). The tips were positioned such that the two probes were measuring the conditions at the same point in the sinter bed. A computer was used to log the temperatures and voltages measured by the thermocouple and oxygen probe, respectively.
The surface of the sinter bed was ignited with a flame at 880 °C for 120 s, with a draft pressure drop of 8.8 kPa across the bed. After ignition, sintering was commenced by drawing air down through the packed bed, moving the combustion front from the top to the bottom of the sinter pot. To achieve this, during sintering, draft pressure drops of 14.7 kPa (base case), 16.7 kPa (high draft) or 12.7 kPa (low draft) across the bed were applied. After the flame front had passed through the sinter bed, the sinter was cooled using a draft pressure drop of 7.8 kPa across the bed. Once cooled, the resulting sinter was crushed and separated into fine (−2 mm) and coarse (+2 mm) sizes, designated as the sinter returns and sinter product, respectively.
The proportions of the phases present in the sinter product and fines were determined by semi-quantitative X-Ray Diffraction (XRD). The sinter product and fines were separately ground in a ring mill. The resulting powders were analysed with powder XRD (Bruker D8, Bruker, Billerica, MA, USA), with a copper Kα radiation source at a voltage of 40 kV and a current of 40 mA. Semi-quantitative phase analysis was performed with DriffracEVA by Bruker, with the proportion of each phase determined by the relative peak intensity between that measured and the XRD patterns from the International Centre for Diffraction Data Powder Diffraction Files.

2.2. Laboratory Scale Tests

In the controlled cooling experiments, oxide pellets (0.1 g) were heated and cooled in air in an electrically heated vertical tube furnace (alumina reaction tube, 38mm OD 30mm ID). The oxide samples, supported on Pt wire, were vertically suspended by a 70/30 Pt-Rh wire within the reaction tube in the furnace, with the wire held by an alumina rod. The vertical position of the alumina rod, and in turn the sample, was controlled with a positioning motor affixed to the top of the furnace. The samples were raised into the hot zone of the furnace and held at the target temperature for homogenisation for 480 s. After homogenisation, the samples were lowered using a computer controlled motor drive to achieve a constant cooling rate. On reaching the target temperature, the samples were released and fell under gravity into water, the quenching medium. Further details of the experimental apparatus are provided elsewhere [11].
Reheating experiments were performed to examine magnetite formation and oxidation, with samples with 94.33 wt % Fe2O3 and a CaO/SiO2 ratio of 5.32 wt/wt. Samples were held in air at 1400 °C for four minutes, prior to quenching in water. The quenched samples were dried, rapidly heated and held for four minutes at 1200 °C, 1100 °C and 1000 °C in air, followed by quenching in water. In addition, using the composition investigated in reheating experiments, separate samples were prepared by controlled cooling in air from 1400 °C to 800 °C at 2 K/s.
The samples were characterised initially using optical microscopy for phase and microstructure identification using a reflected light microscope (Olympus Provis AX70TRF, Olympus, Shinjuku, Tokyo, Japan). The compositions of the phases were measured using an electron probe X-ray microanalysis (EPMA) technique with wavelength dispersive spectroscopy (WDS) (JEOL 8200L EPMA; Japan Electron Optics Ltd., Tokyo, Japan) at a voltage of 15 keV and current of 20 nA. Three standards were used for calibration, pure CaSiO3, Fe2O3 and Al2O3 (all standards from the Charles M. Taylor Co., Stanford, CA, USA). Iron concentrations in phases were recalculated to Fe2O3 for presentation purposes.

3. Results

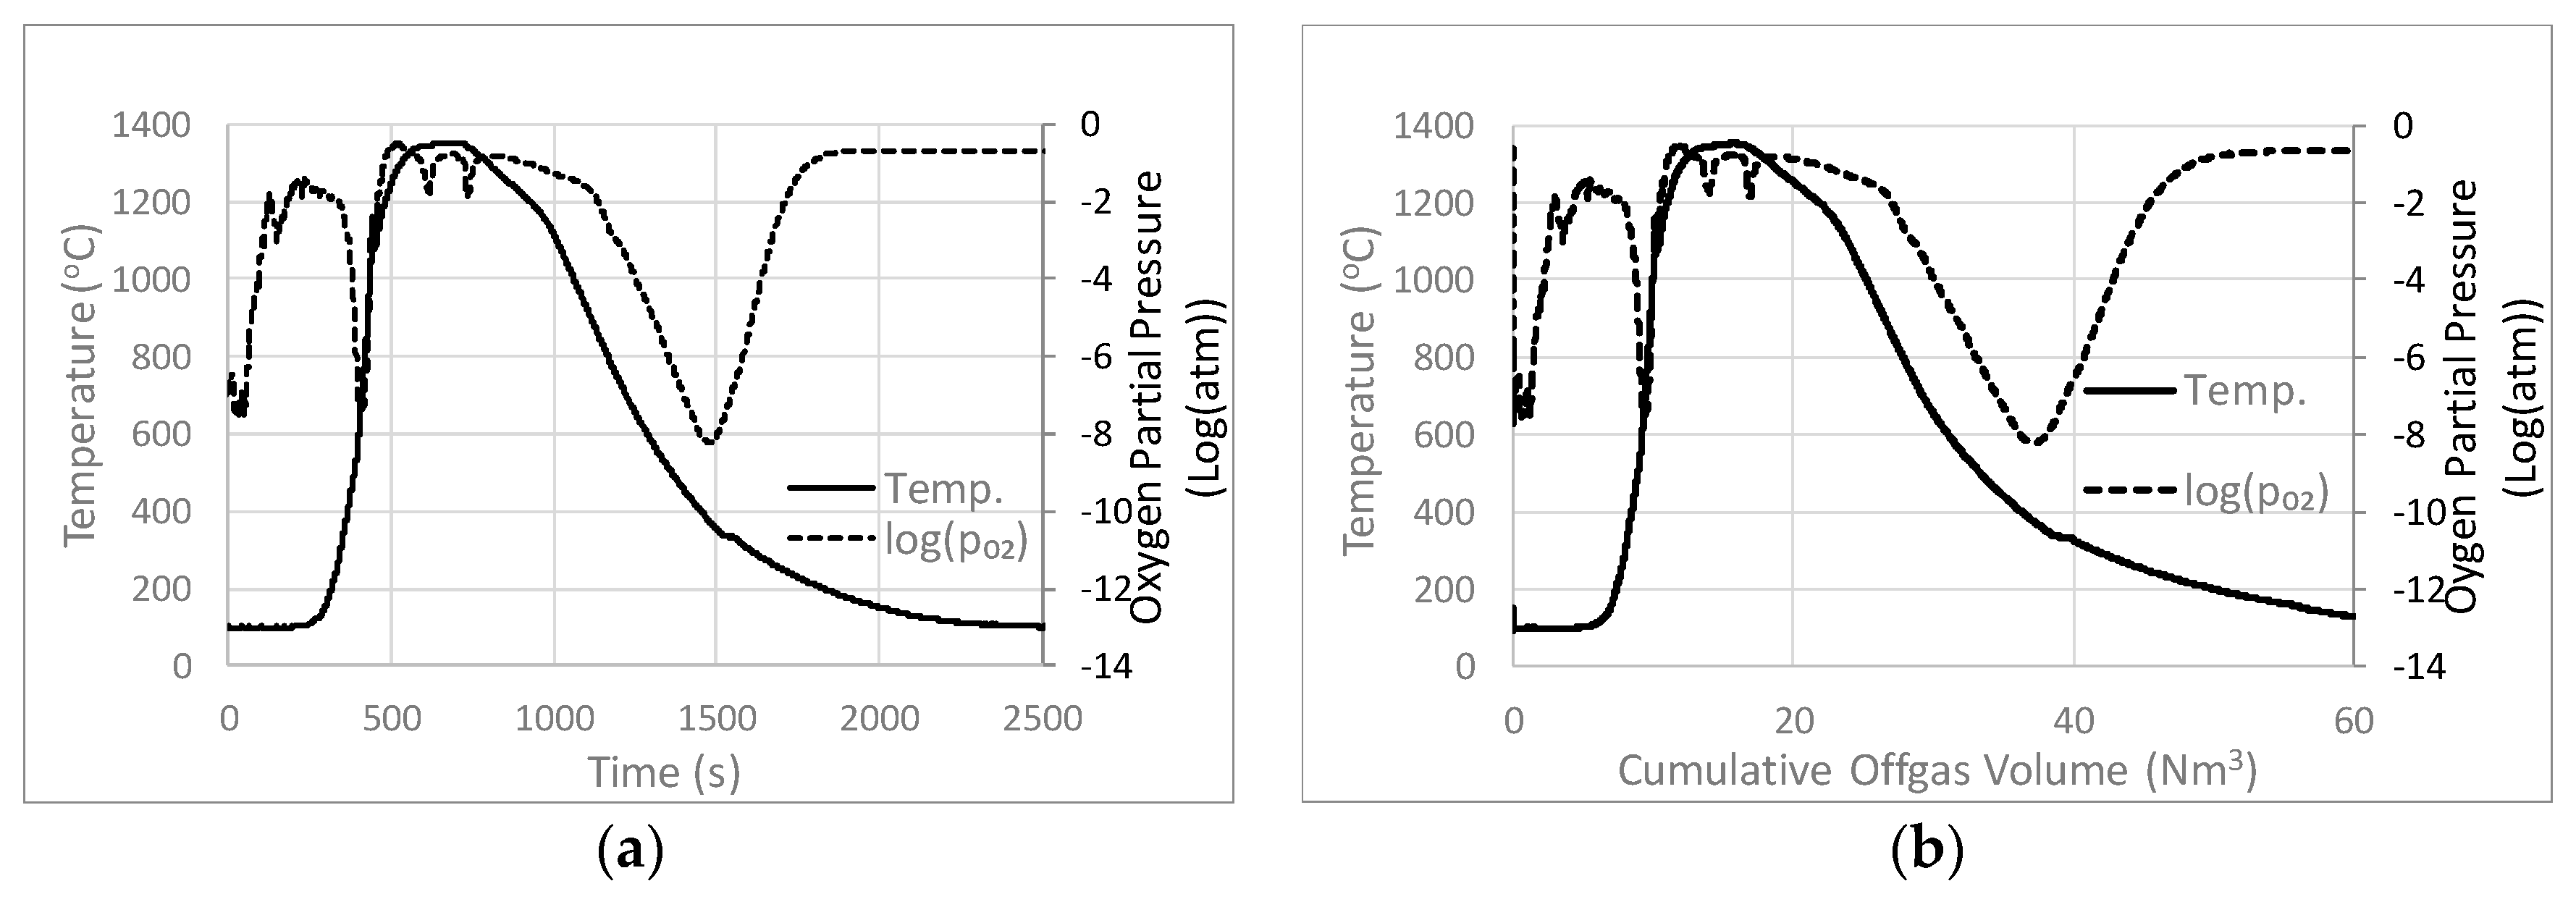
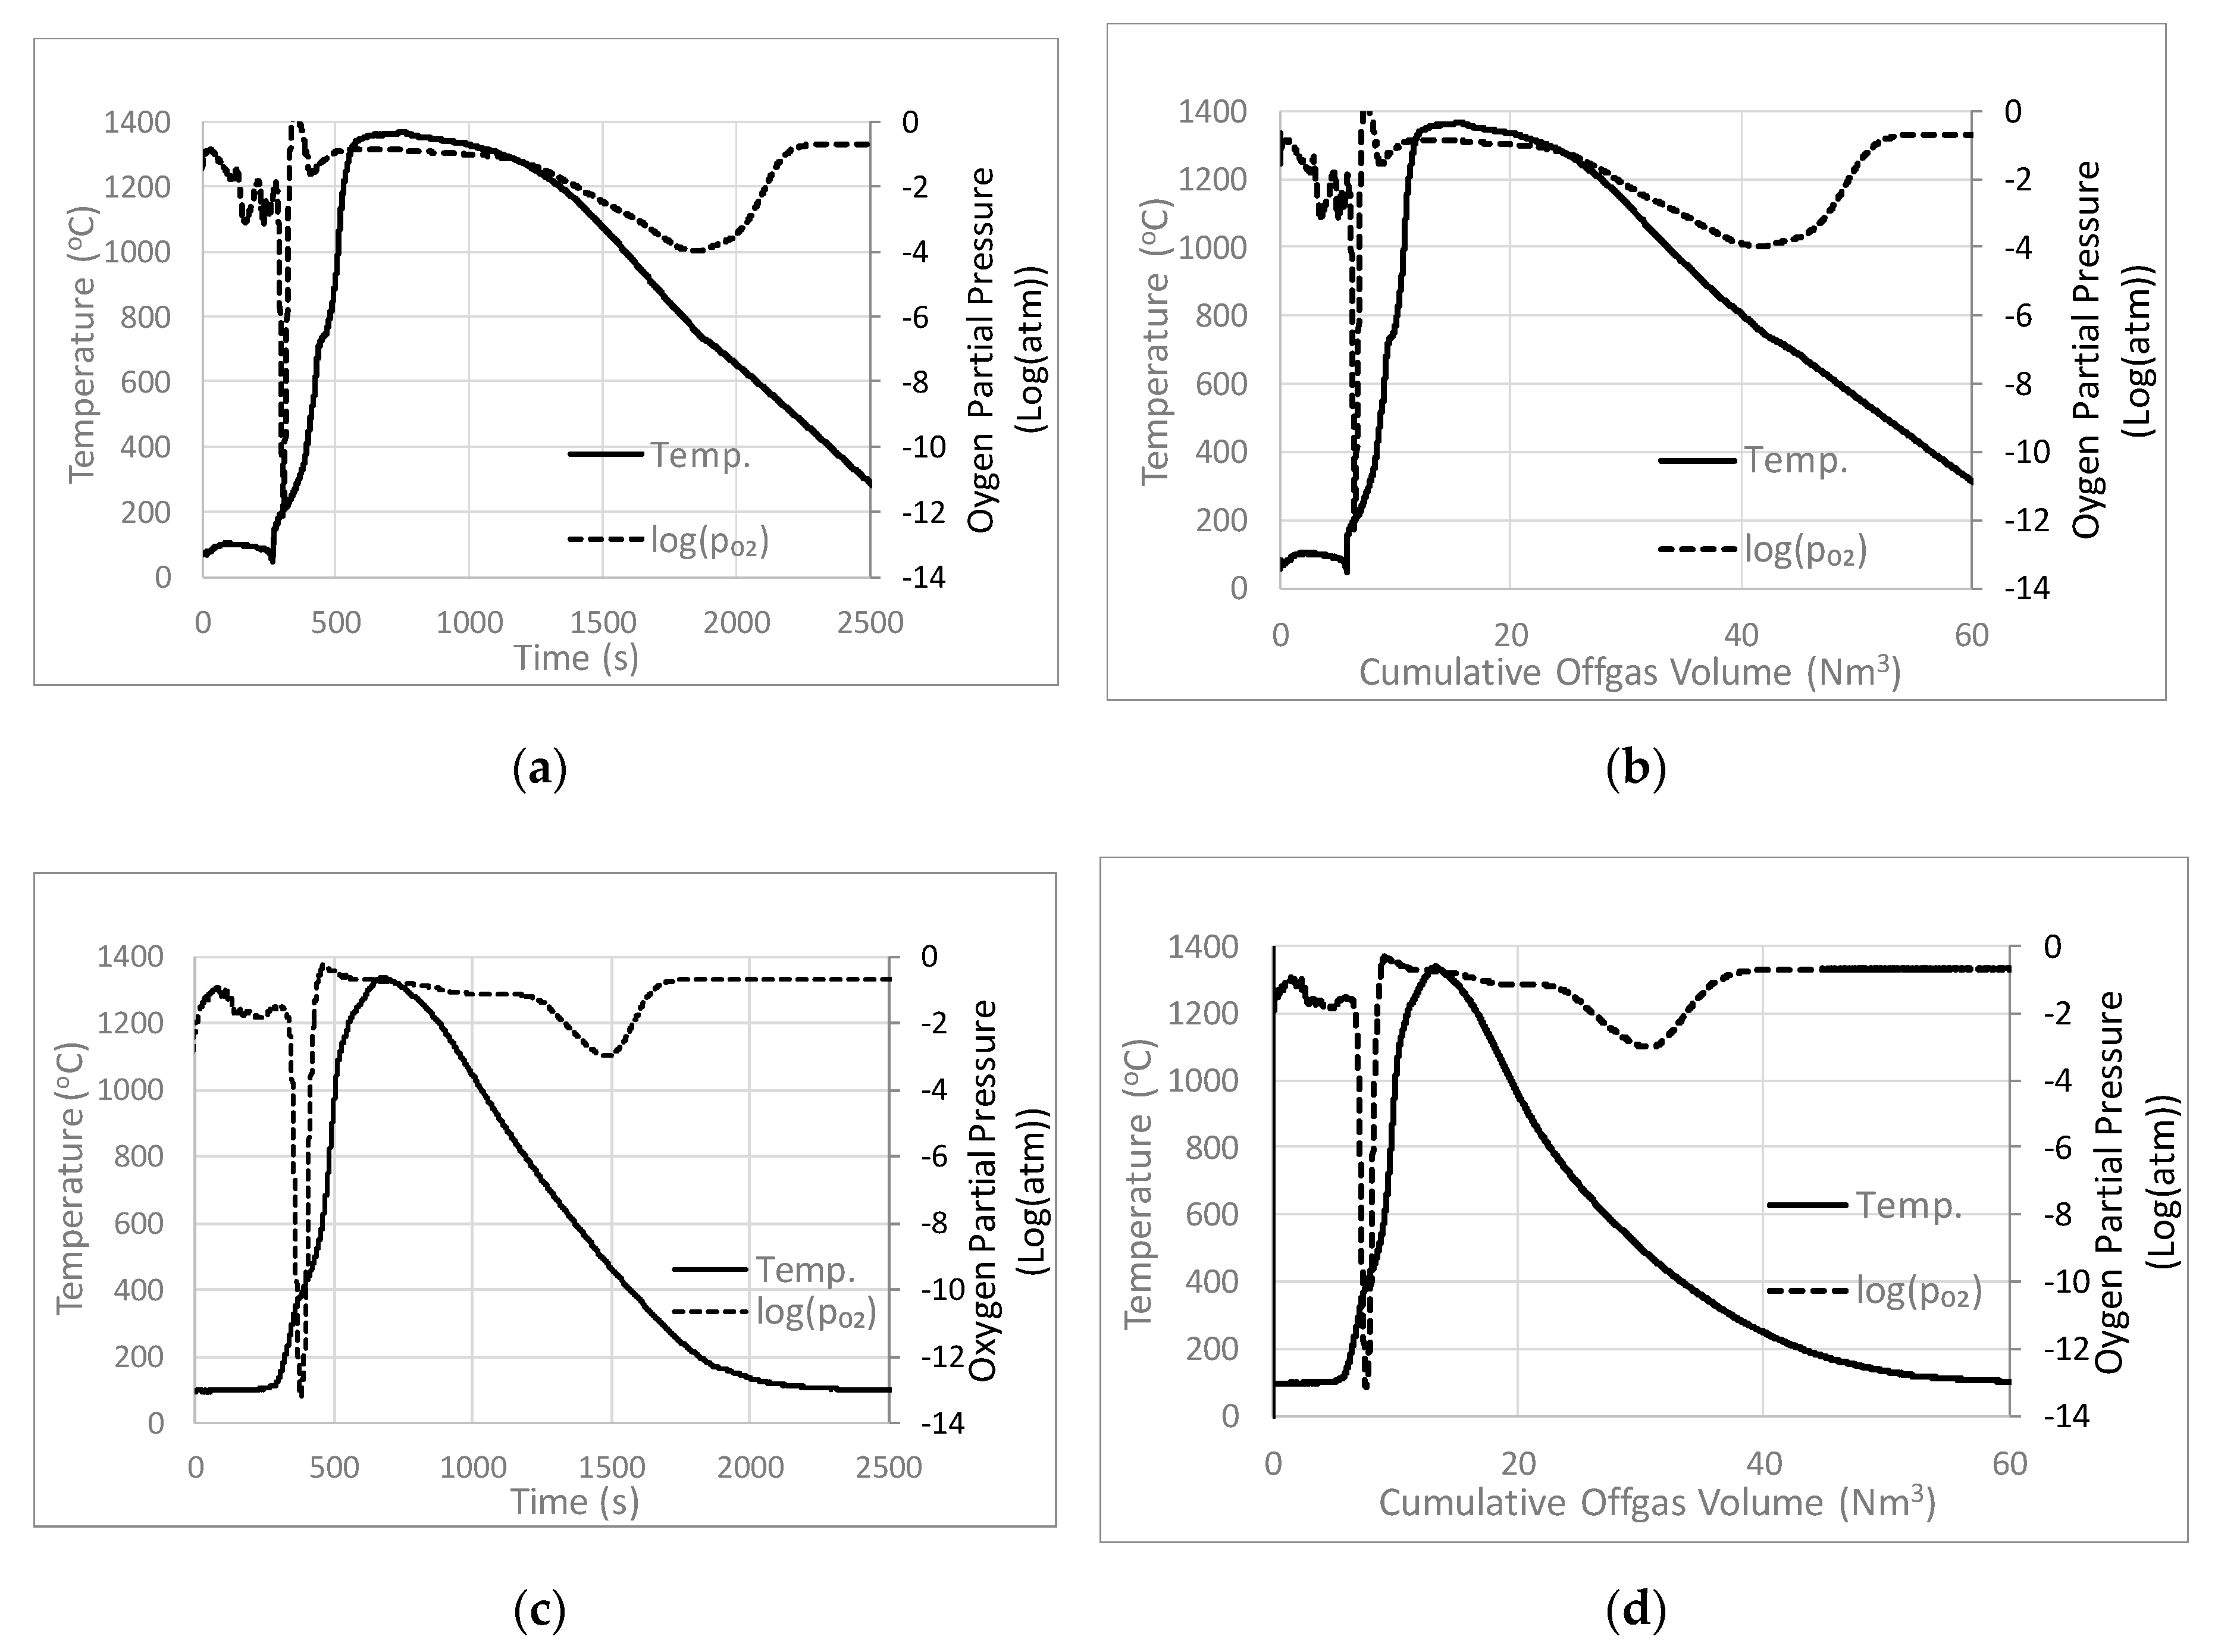
3.1. Base Case Temperature and pO2

The base case sinter pot test was performed using 14.7 kPa draft pressure drop and 36 kgcoke/tfeed. The apparent pO2 and temperature measurements as a function of time are shown in Figure 3. The term apparent oxygen pressure is used as the calculated pO2 assumes that the tip temperature of the probe and the external thermocouple are identical.
The changes in temperature of the sample can be described in terms of three stages, heating, peak temperature and cooling. During heating, the temperature was initially relatively constant at approximately 110 °C to 120 °C, followed by rapid heating to the peak temperature of approximately 1350 °C. The average heating rate between 200 °C and 1250 °C was 5.6 °C/s. The heating rate was a maximum of 15 °C/s at 860 °C. The total time for which the temperature exceeded 1200 °C, which is approximately the solidus temperature in the iron ore sinter [12], was 450 s. During sinter cooling, between 1280 °C and 1200 °C, the cooling rate was relatively constant, with an average cooling rate of 0.7 °C/s. The maximum of 2 °C/s was at 900 °C. The cooling rate in this critical period is observed to be significantly slower than the heating rate.
The measured pO2 during heating was observed to have a single low pO2 peak of 10−7.52 atm occurring at approximately 780 °C. Above 1200 °C, two small reducing peaks were observed, both occurring at 1340 °C one with a pO2 of 10−1.64 atm and the other with a pO2 of 10−1.85 atm. A single reducing pO2 peak was observed on cooling from 1200 °C to 200 °C, occurring at approximately 370 °C with a pO2 of 10−8.2 atm.

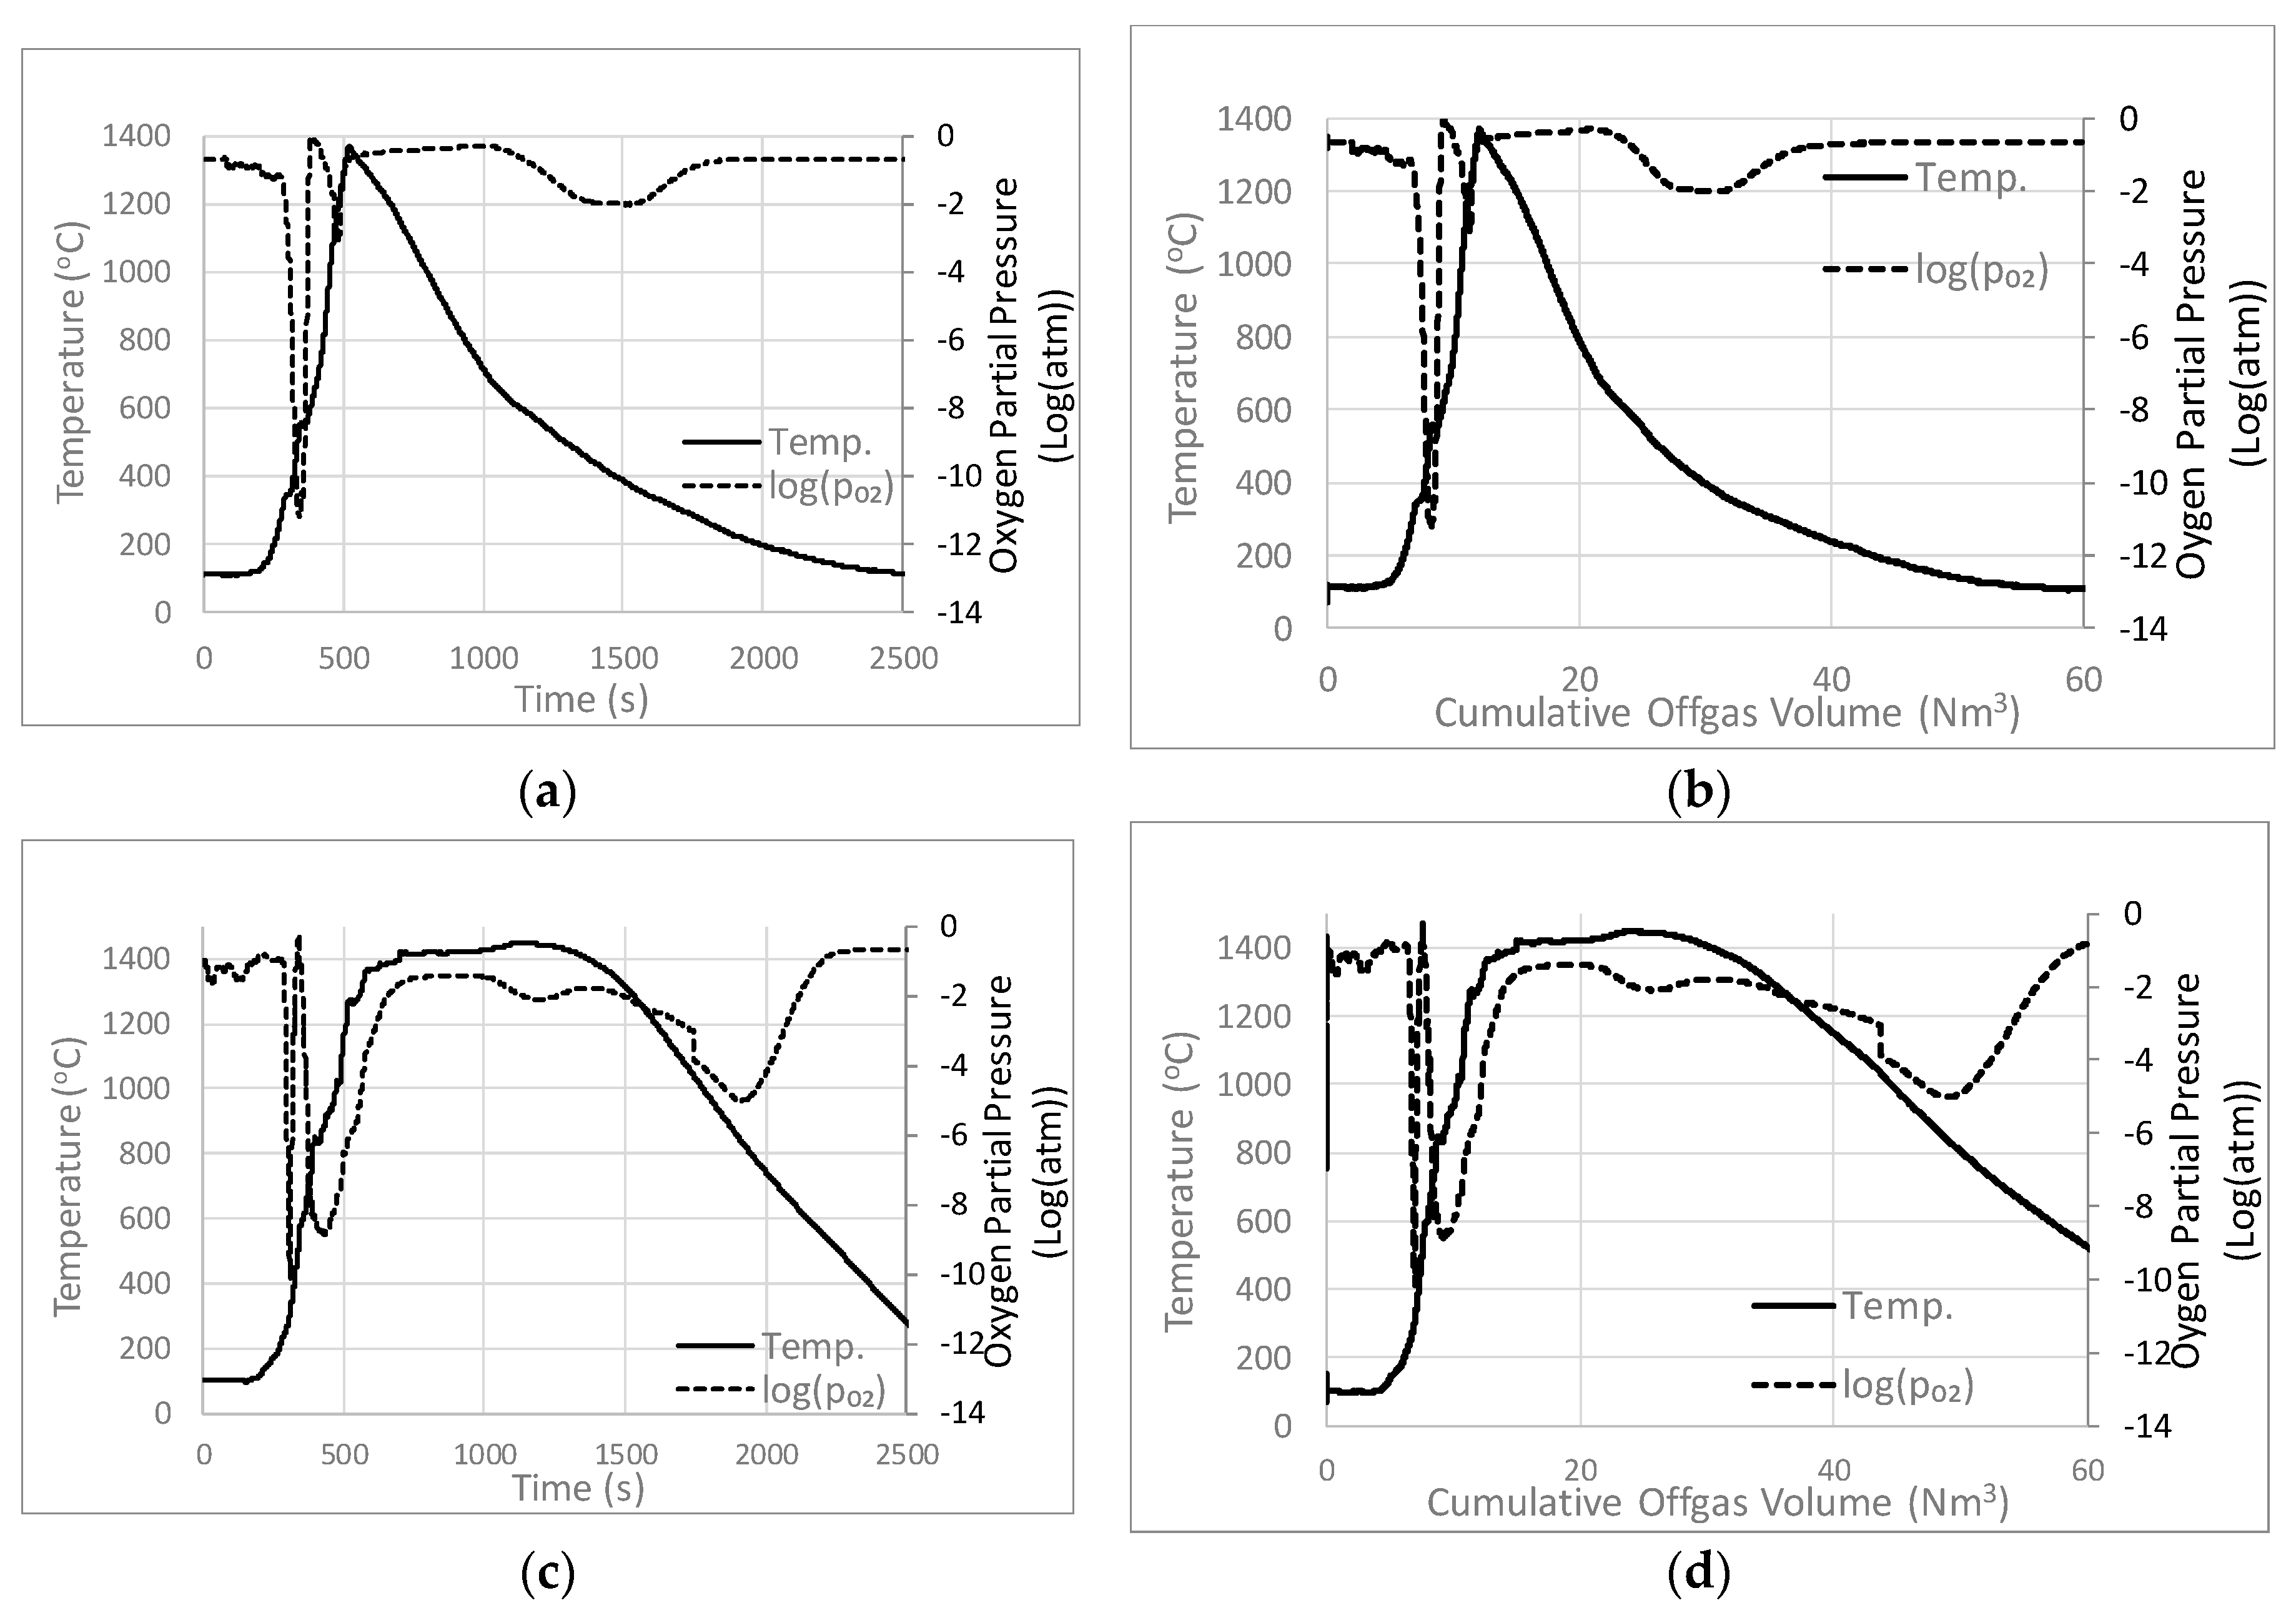
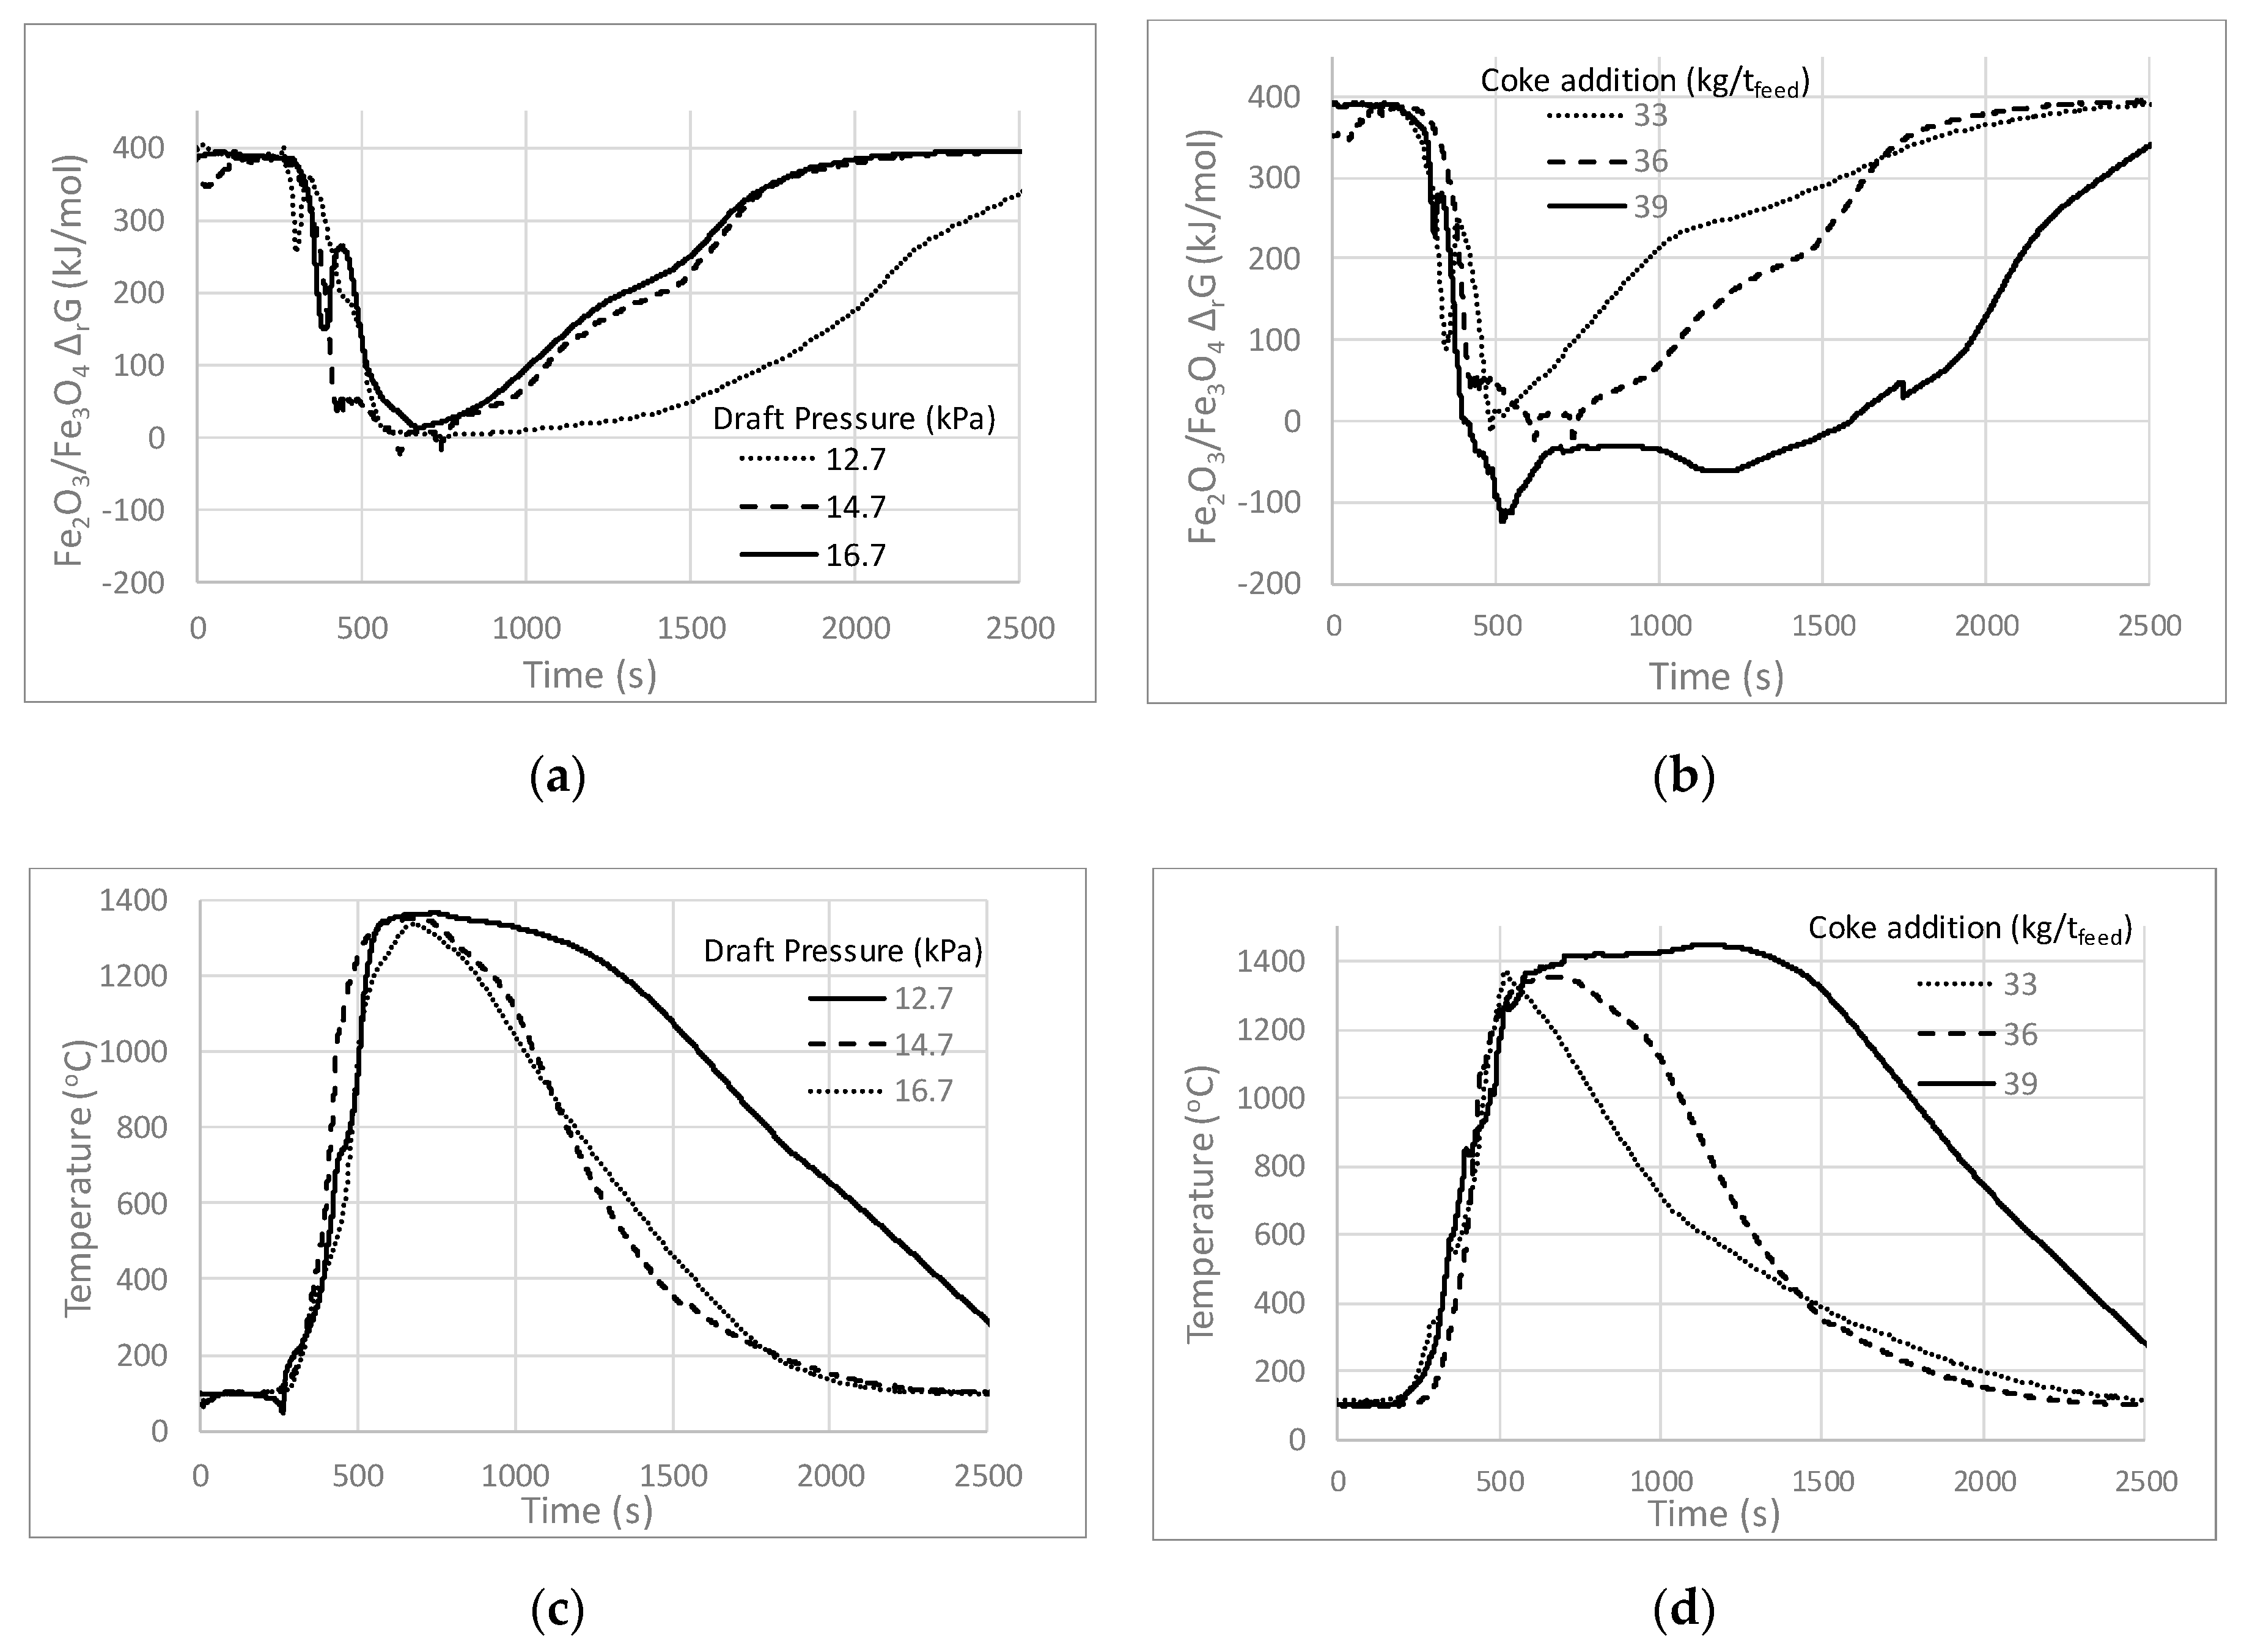
3.2. Effects of Coke Addition on Temperature and pO2

To determine the effect of coke addition on the temperature and pO2 in sintering, two additional sinter pot tests, at high coke addition (3.9 kg/tfeed) and low coke addition (3.3 kg/tfeed) were undertaken. The pO2 and temperature measurements for the two tests are shown in Figure 4.
With a variation in the coke addition, both the temperature and pO2 profiles were observed to change. On heating, in both the low (33 kg/tfeed) coke and high (39 kg/tfeed) coke tests relatively rapid heating took place, with a peak heating rates of 10.8 °C/s at 940 °C and 21.0 °C/s at 890 °C respectively. The average heating rate between 200 °C and 1250 °C was 4.3 °C/s at both a low coke addition rate and a high coke addition rate. The peak bed temperatures increased from 1370 °C to 1450 °C with an increase in coke addition from 33 kg/tfeed and 39 kg/tfeed. The time at which the bed temperature was greater than 1200 °C increased from 190 s to 1100 s on increasing the coke rate from 33 kg/tfeed to 39 kg/tfeed. On cooling, a maximum cooling rate of 1.64 °C/s at 1200 °C and 1.25 °C/s at 1000 °C was observed for low and high coke addition rates, respectively. At a low coke addition, the cooling rate increased from 1.1 °C/s to 1.3 °C/s from 1280 °C and 1200 °C. At a high coke addition, the cooling rate was relatively constant at 1.1 °C/s from 1280 °C to 1200 °C.
For both coke additions, two reducing peaks were observed on heating. For 33 kg/tfeed, a minimum oxygen partial pressure of 10−11.21 atm was observed at 845 °C and 10−3.15 atm at 980 °C. For 39 kg/tfeed, a minimum oxygen pressure of 10−10.13 atm was observed at 310 °C and 10−8.85 atm at 915 °C. At 39 kg/tfeed above 1200 °C, the oxygen partial pressure was measured to be between 10−1 atm and 10−2 atm. During cooling, a single reducing peak was observed for both coke additions investigated. For 33 kg/tfeed, a pO2 of 10−2.02 atm was observed at 380 °C and for 39 kg/tfeed a pO2 of 10−5.02 atm was observed at 840 °C.

3.3. Effects of Draft Pressure on Temperature and pO2

To determine the impact of sinter draft pressure on the temperature and pO2 in sintering, two additional sinter pot tests were undertaken at 12.7 kPa and 16.7 kPa draft pressure, respectively. The pO2 and temperature measurements for the two tests are shown in Figure 5.
With a variation in the draft pressure, both the temperature and pO2 profiles were observed to change. On heating, a peak heating rate of 12.4 °C/s at 810 °C was observed at 12.7 kPa, and 10.9 °C/s at 1025 °C at 16.7 kPa. The average heating rates between 200 °C and 1250 °C for both conditions were approximately 4.0 to 4.3 °C/s. With an increase in draft pressure, the peak bed temperature decreased from 1370 °C to 1340 °C. The time at which the bed temperature was greater than 1200 °C decreased from 671 s to 260 s with an increase in draft pressure from 12.7 kPa to 16.7 kPa. On cooling, maximum cooling rates were between 1.0 to 1.3 °C/s at approximately 980 °C for both low and high draft pressures.
For both draft pressures, a single low oxygen pressure peak was observed on heating and a single reducing peak was observed on cooling. At 12.7 kPa, an oxygen pressure of 10−12.28 atm was observed at 200 °C and 16.7 kPa, an oxygen pressure of 10−13.18 atm was observed at 380 °C. Above 1200 °C, unlike the base case, no pO2 peaks were observed and the pO2 was relatively constant at an oxygen pressure of 10-1 atm. On cooling, at 12.7 kPa, oxygen pressure of 10−3.98 atm was observed at 760 °C and at 16.7 kPa oxygen pressure of 10−3.01 atm was observed at 480 °C.

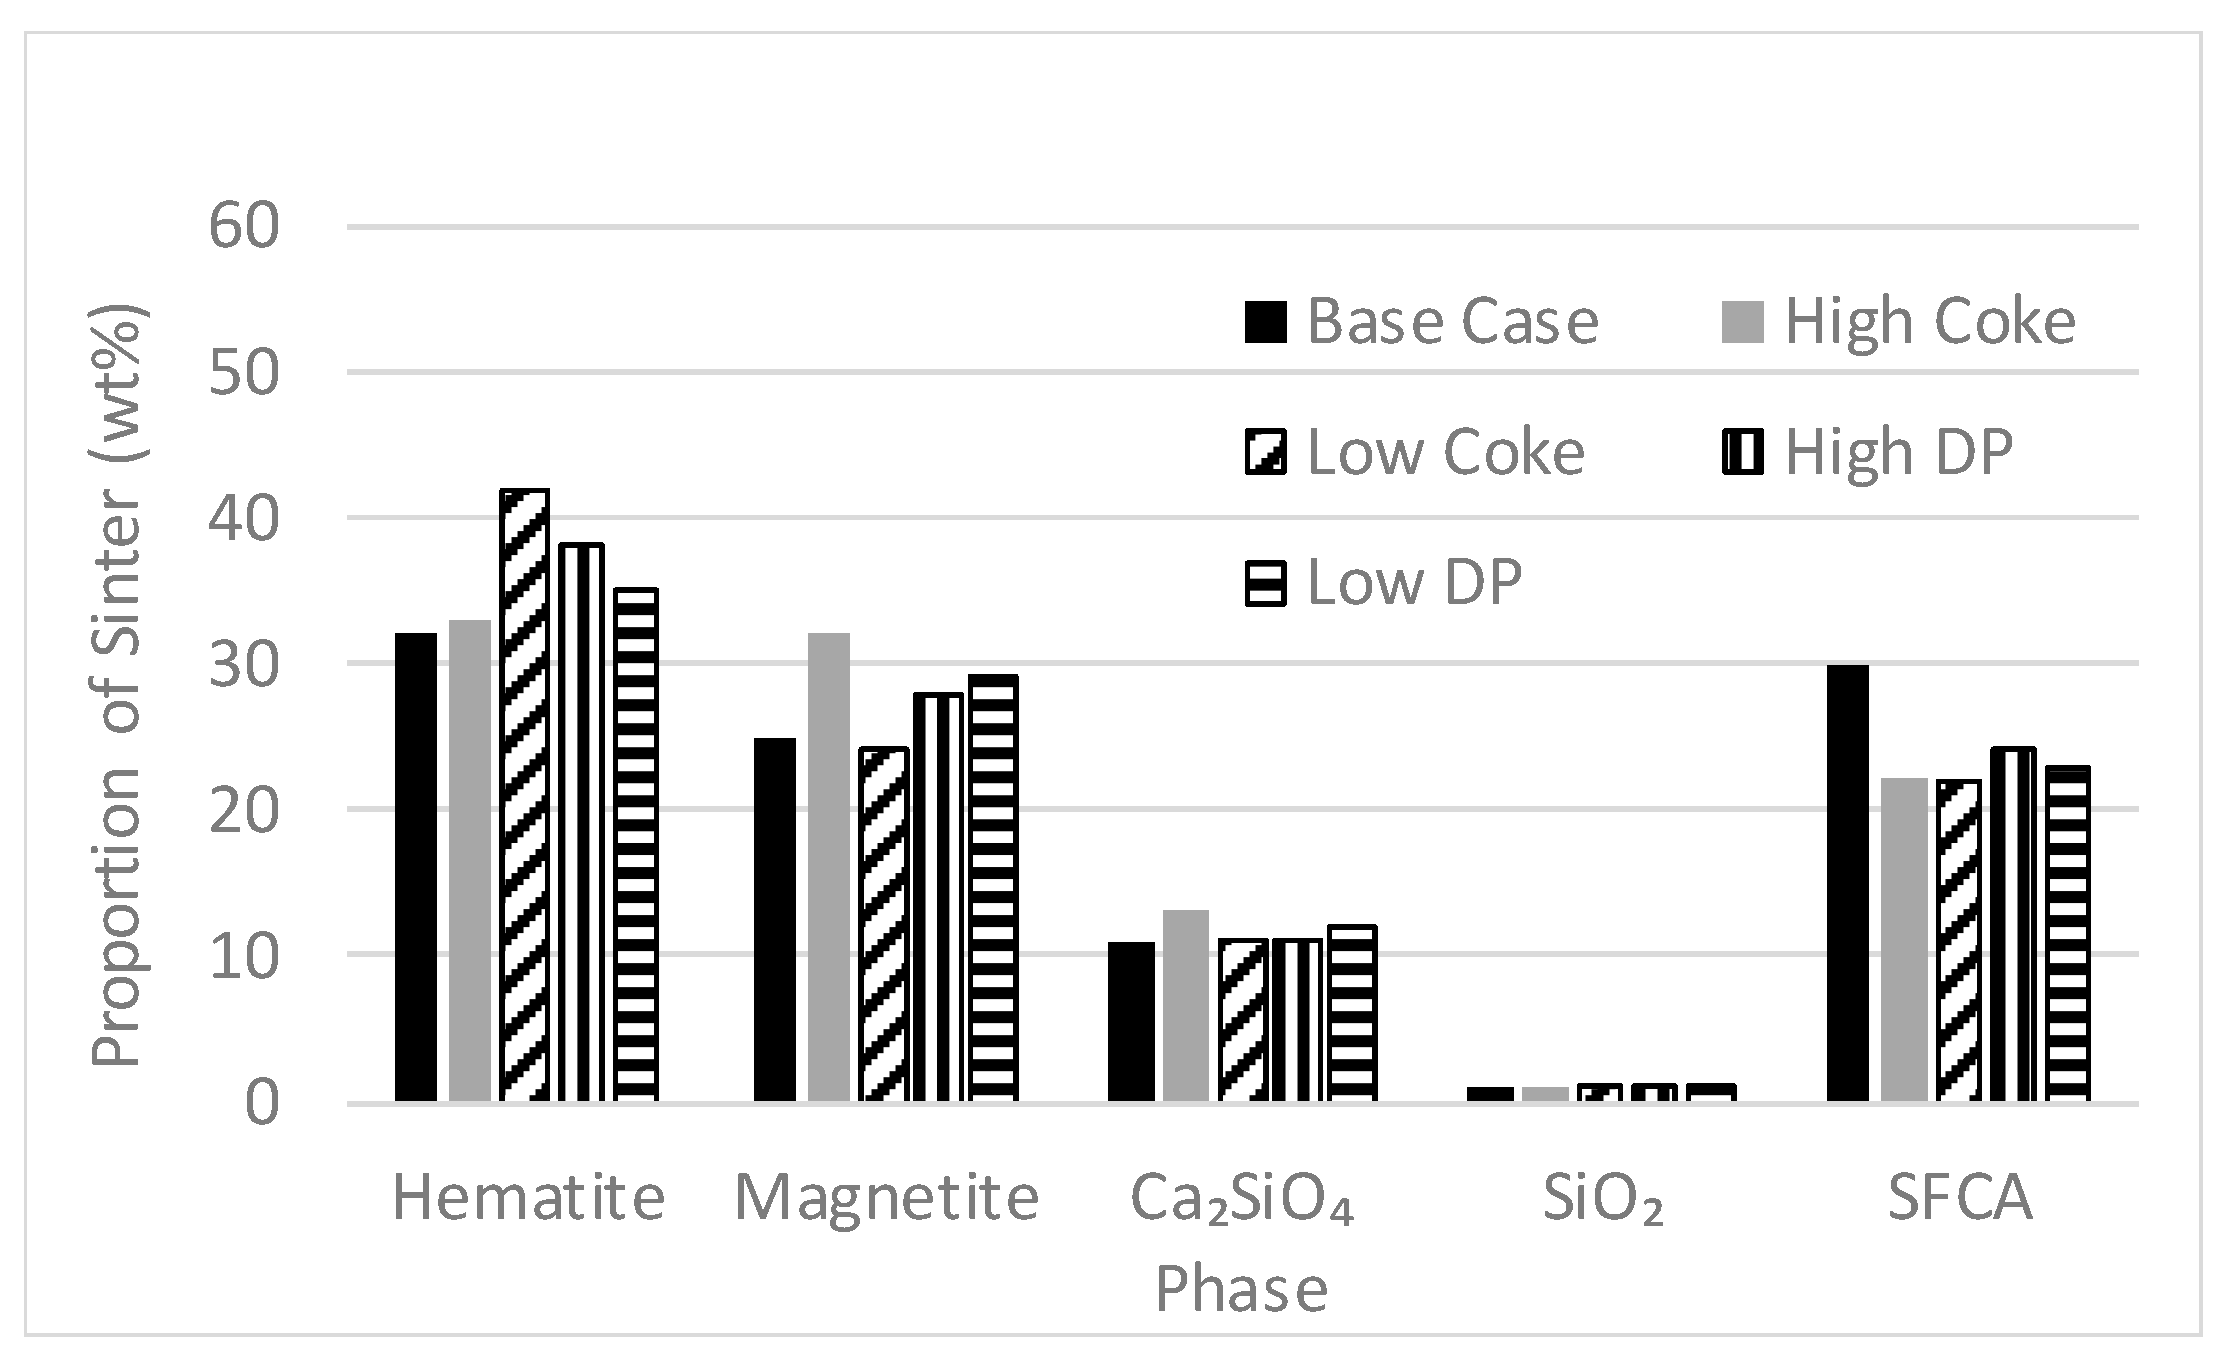
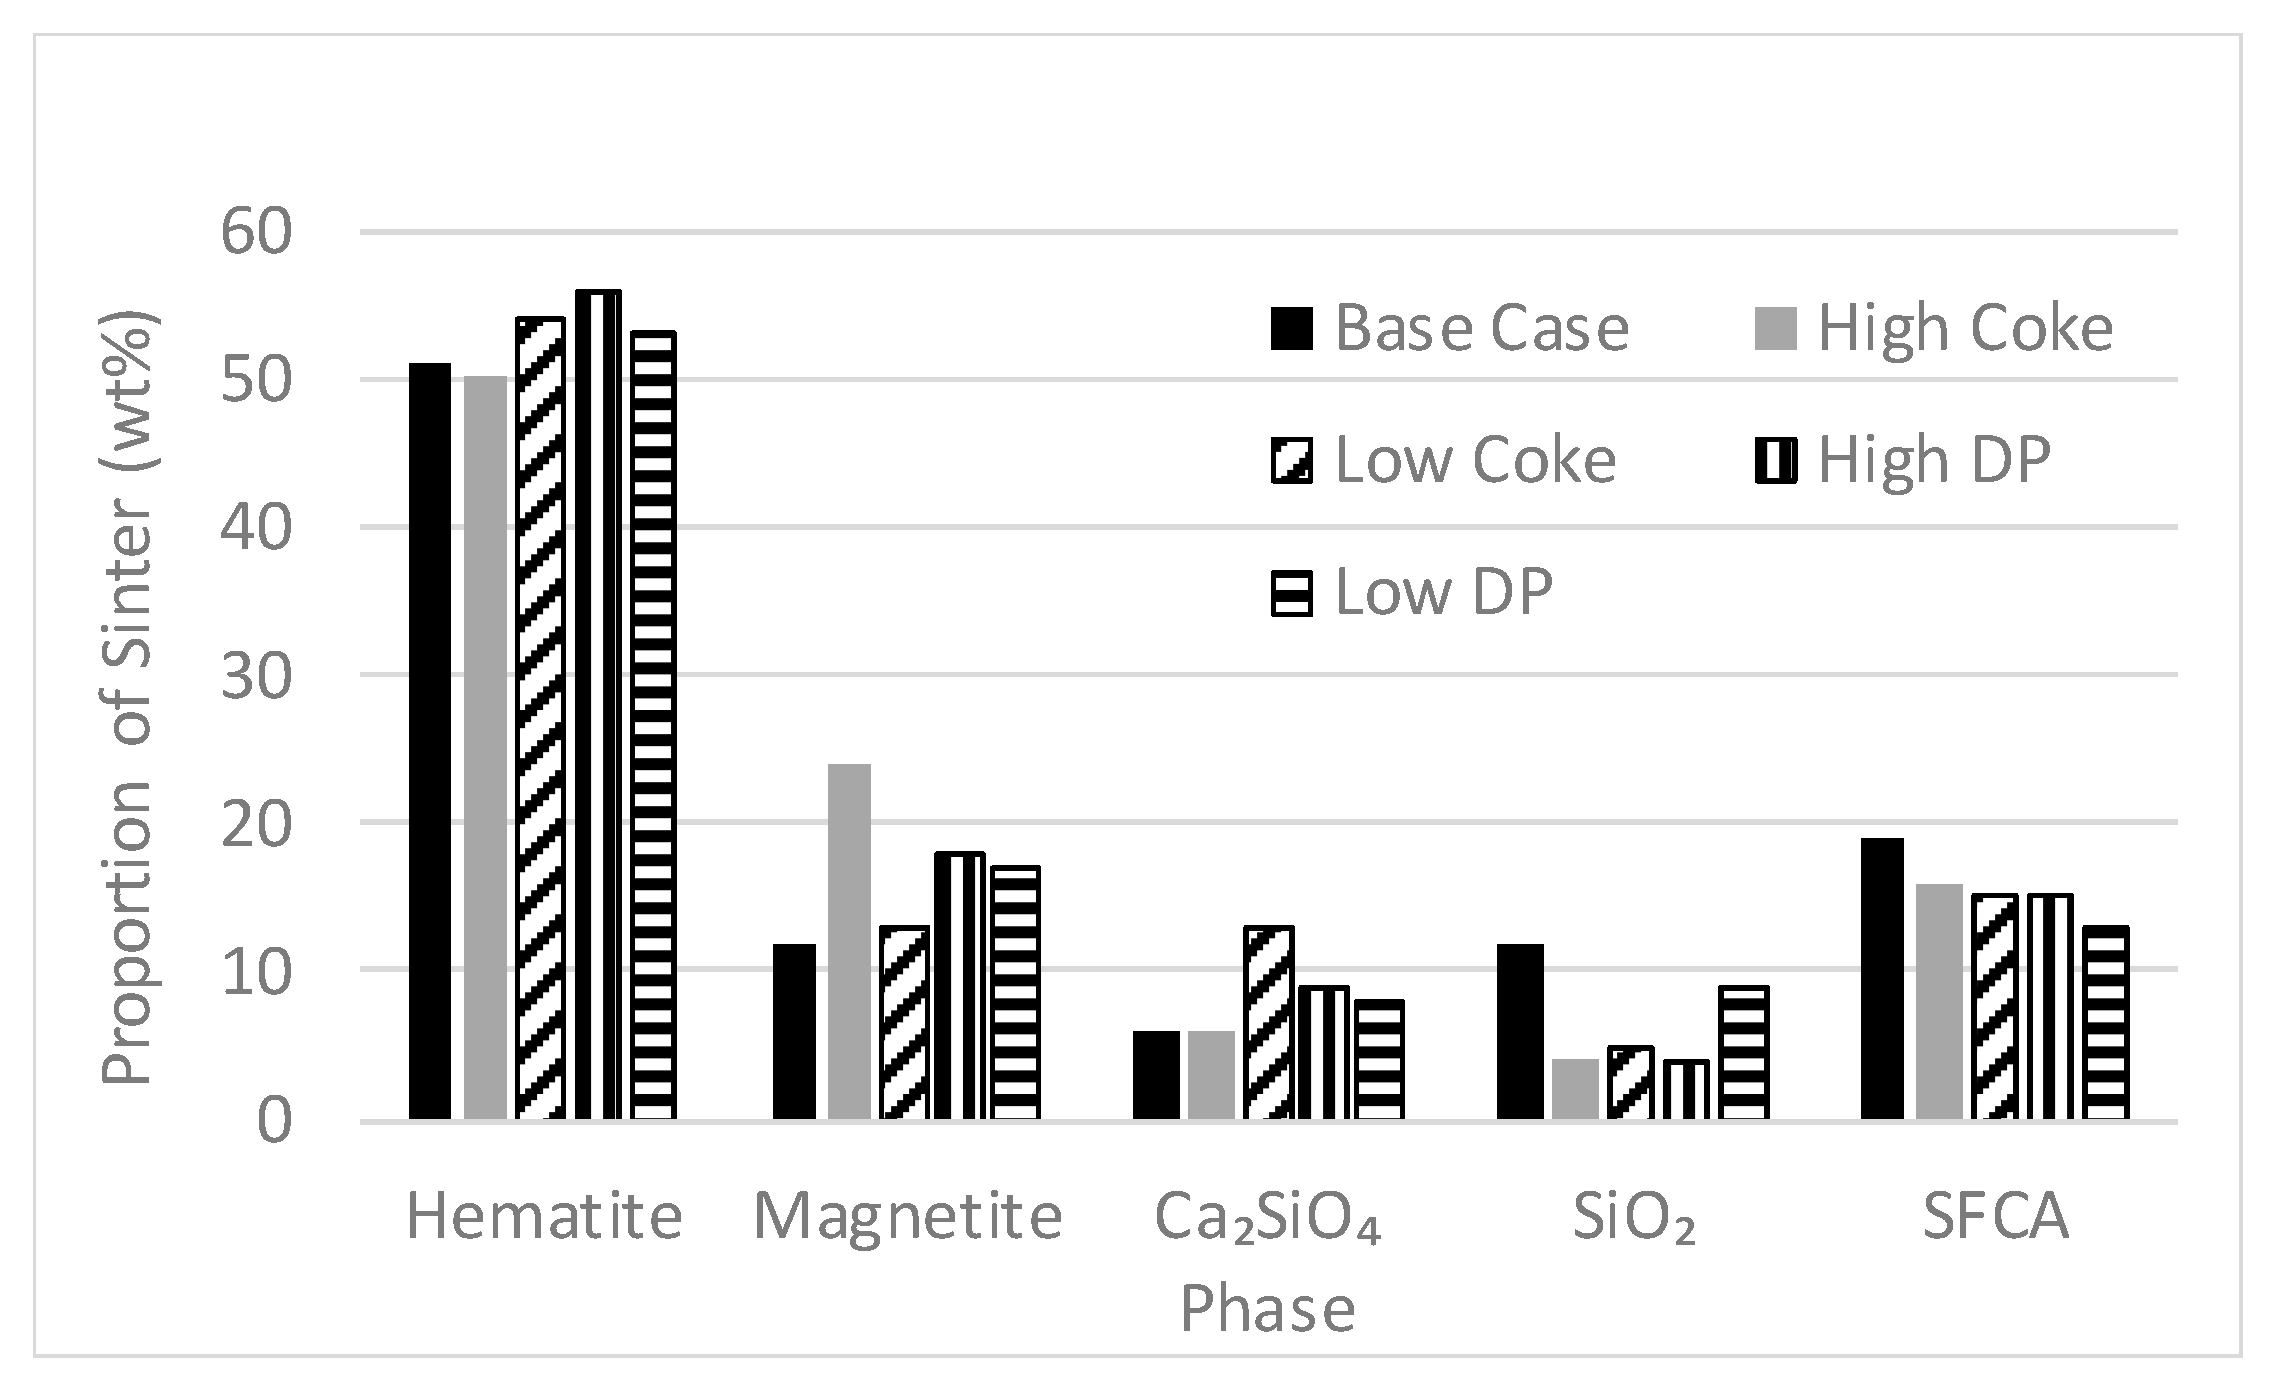
3.4. Proportions of Phases in Sinter Products and Fines

The proportions of the major sinter phases in the product material obtained from the present sinter pot tests, excluding amorphous material, were determined by semi-quantitative XRD. The proportions of the phases, calculated for the sinter product are shown in Figure 6 and the sinter fines are shown in Figure 7. Some minor variations in the proportions of the phases were observed in all tests. The variations were attributed to uncertainties in sampling and measurement technique; these are estimated to be in the order of ±20% of the measured values.
The sinter product was observed to consist of predominantly hematite (Fe2O3) (~30 wt %), magnetite (Fe3O4) (~25 wt %) and silico ferrite of calcium and aluminium (SFCA) (~20 wt %), and minor quantities of dicalcium silicate (Ca2SiO4, C2S) (~10%). The sinter fines was observed to contain a significant quantity of hematite (~50%), and minor quantities of the other components. In addition, the sinter fines were observed to contain significantly larger quantities of silica and less SFCA than the sinter product. Both the product and fines contained larger proportions of magnetite than present in the sinter feed.
The increase in coke rate to sintering was observed to increase the proportion of magnetite in both the sinter product and fines. The variation in sinter draft pressure did not significantly influence the proportions of the phases formed in either the sinter fines or product.

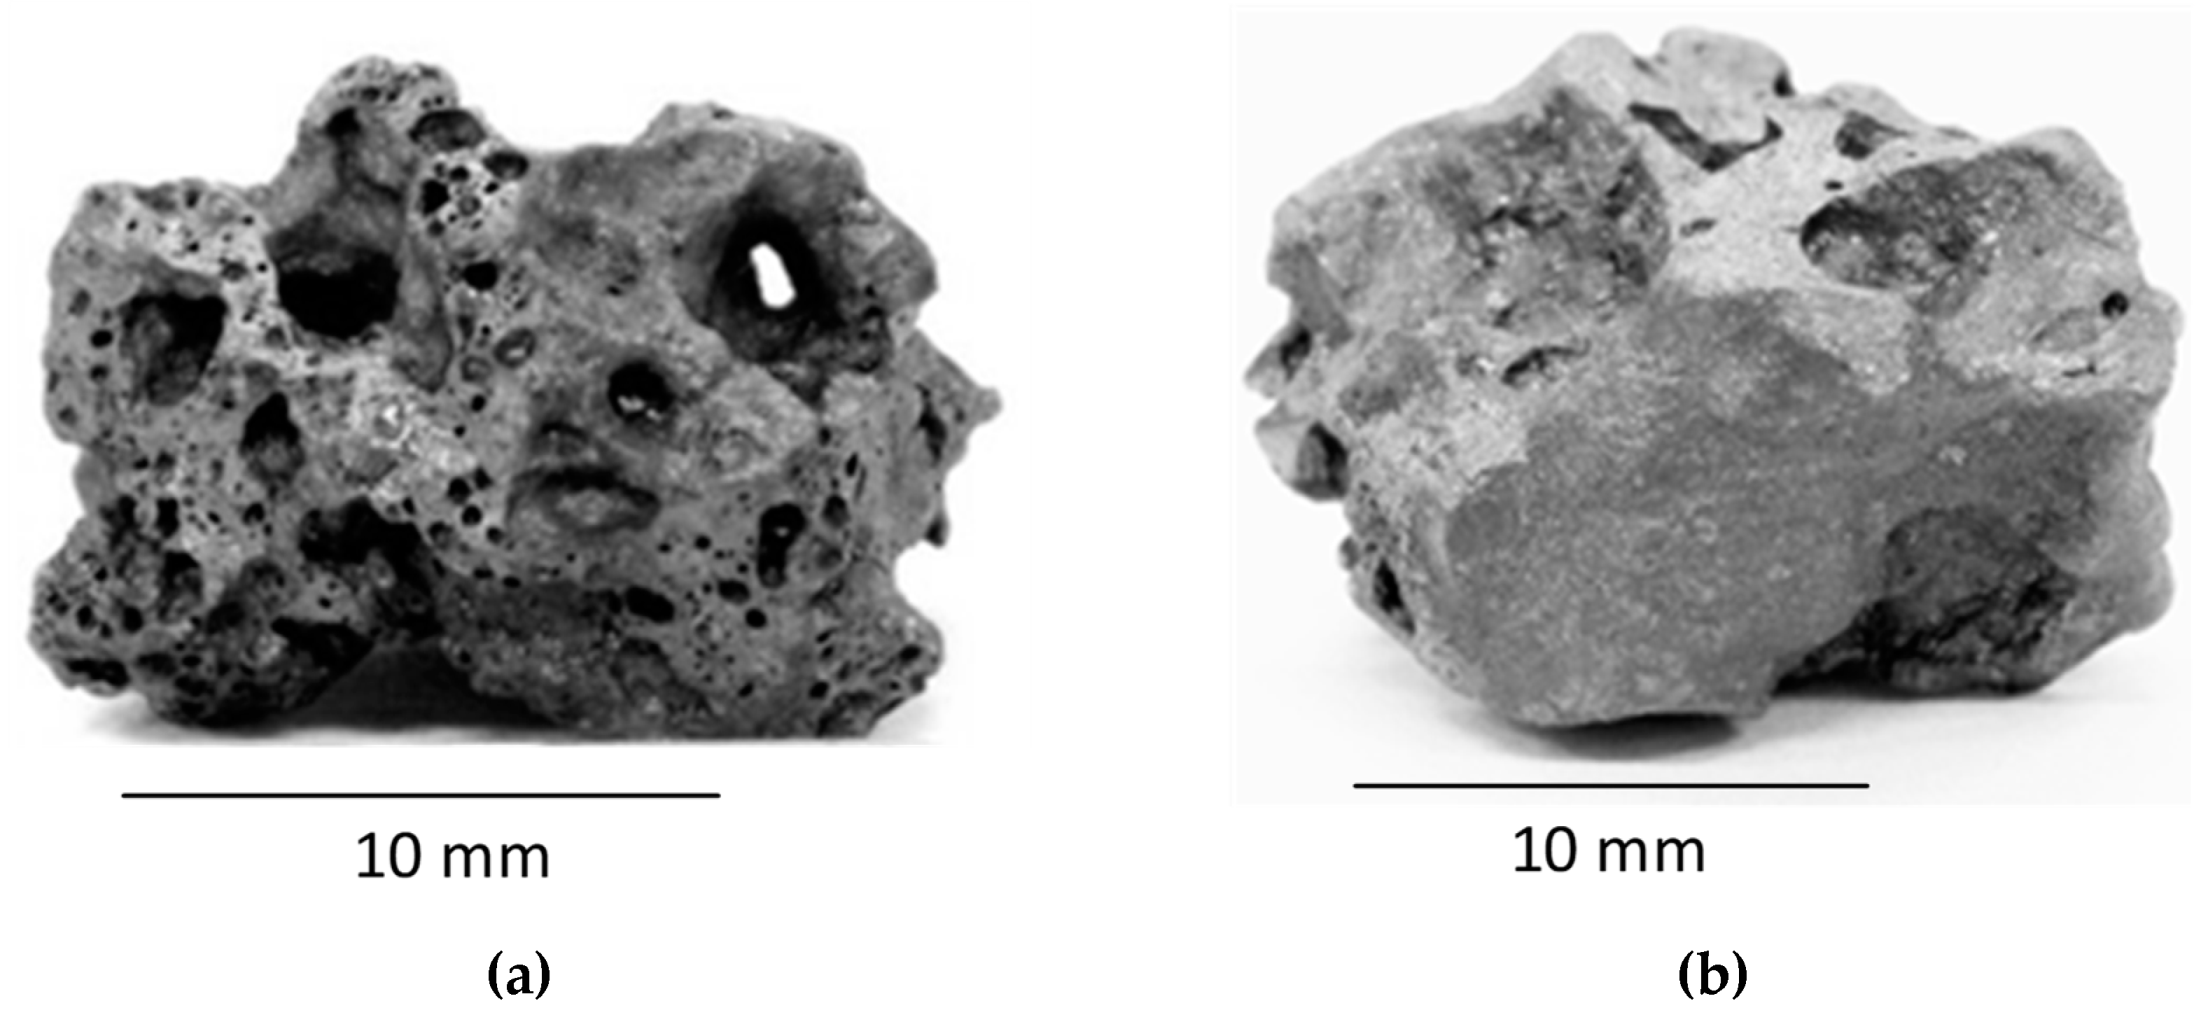
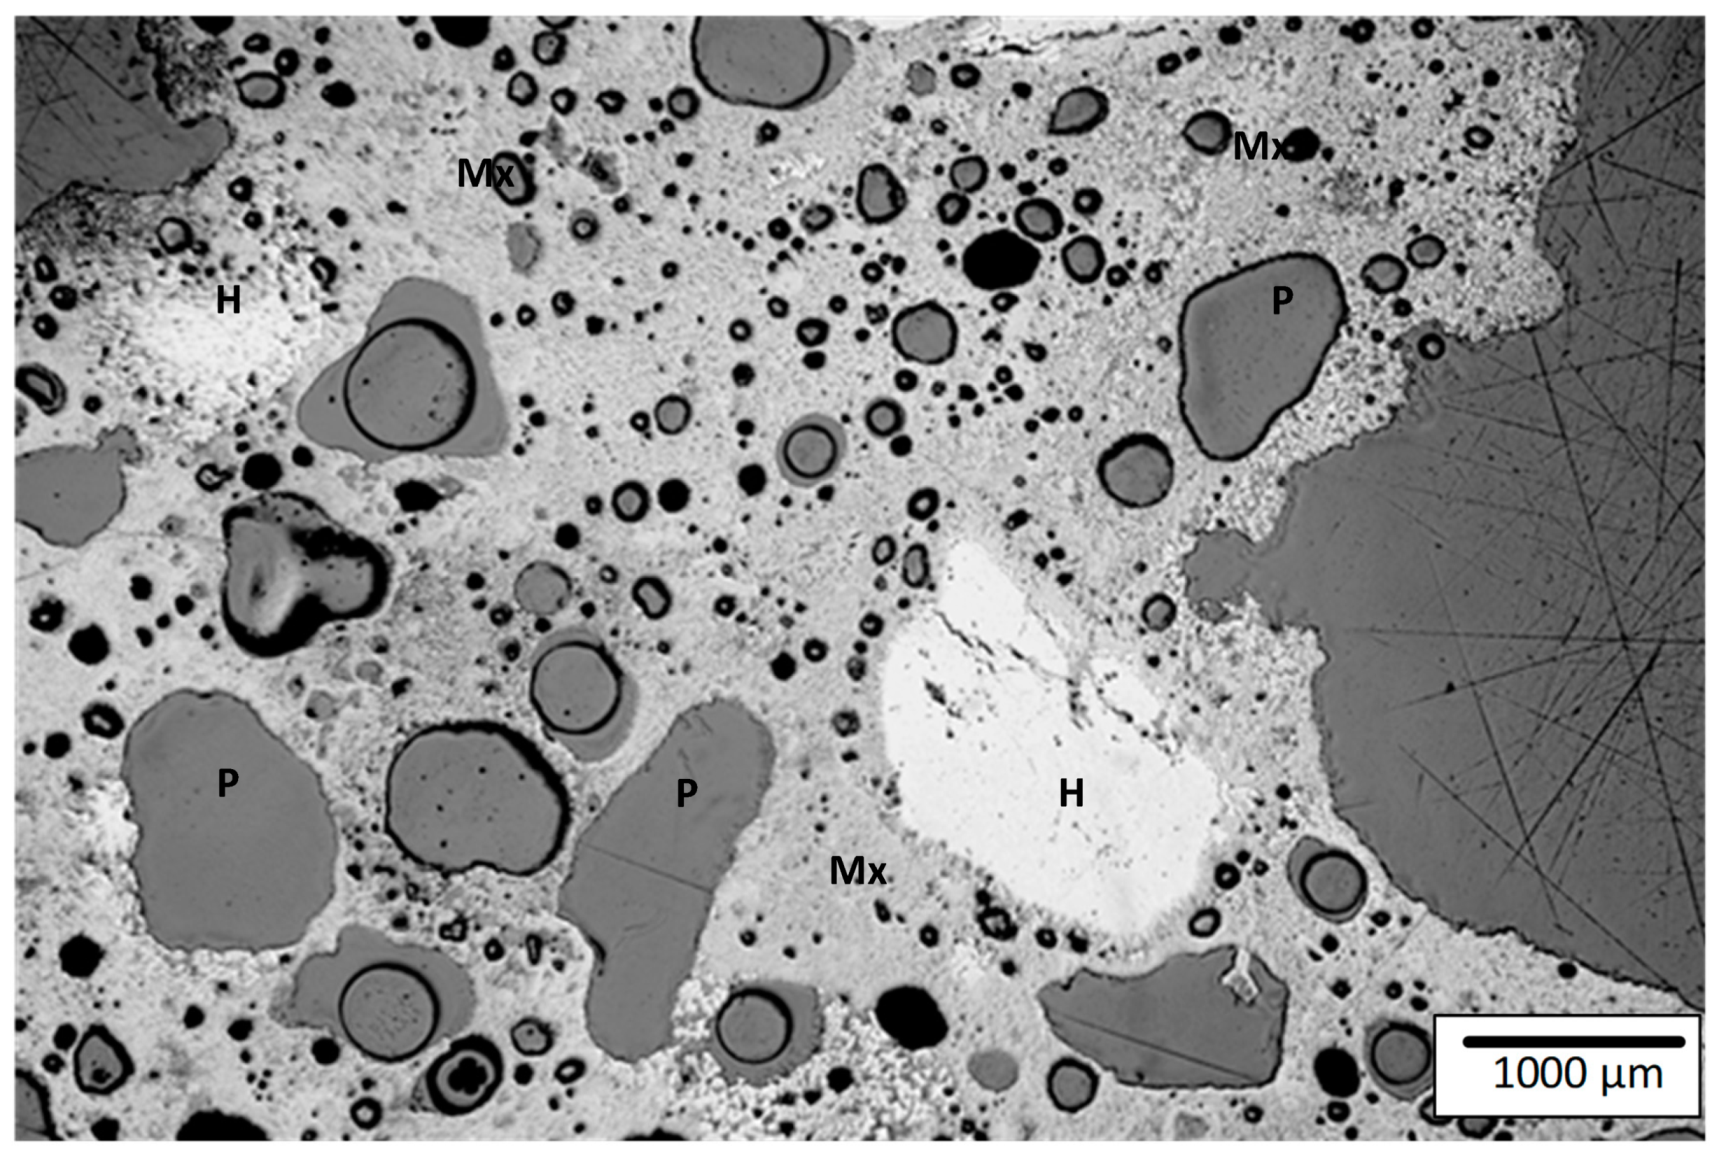
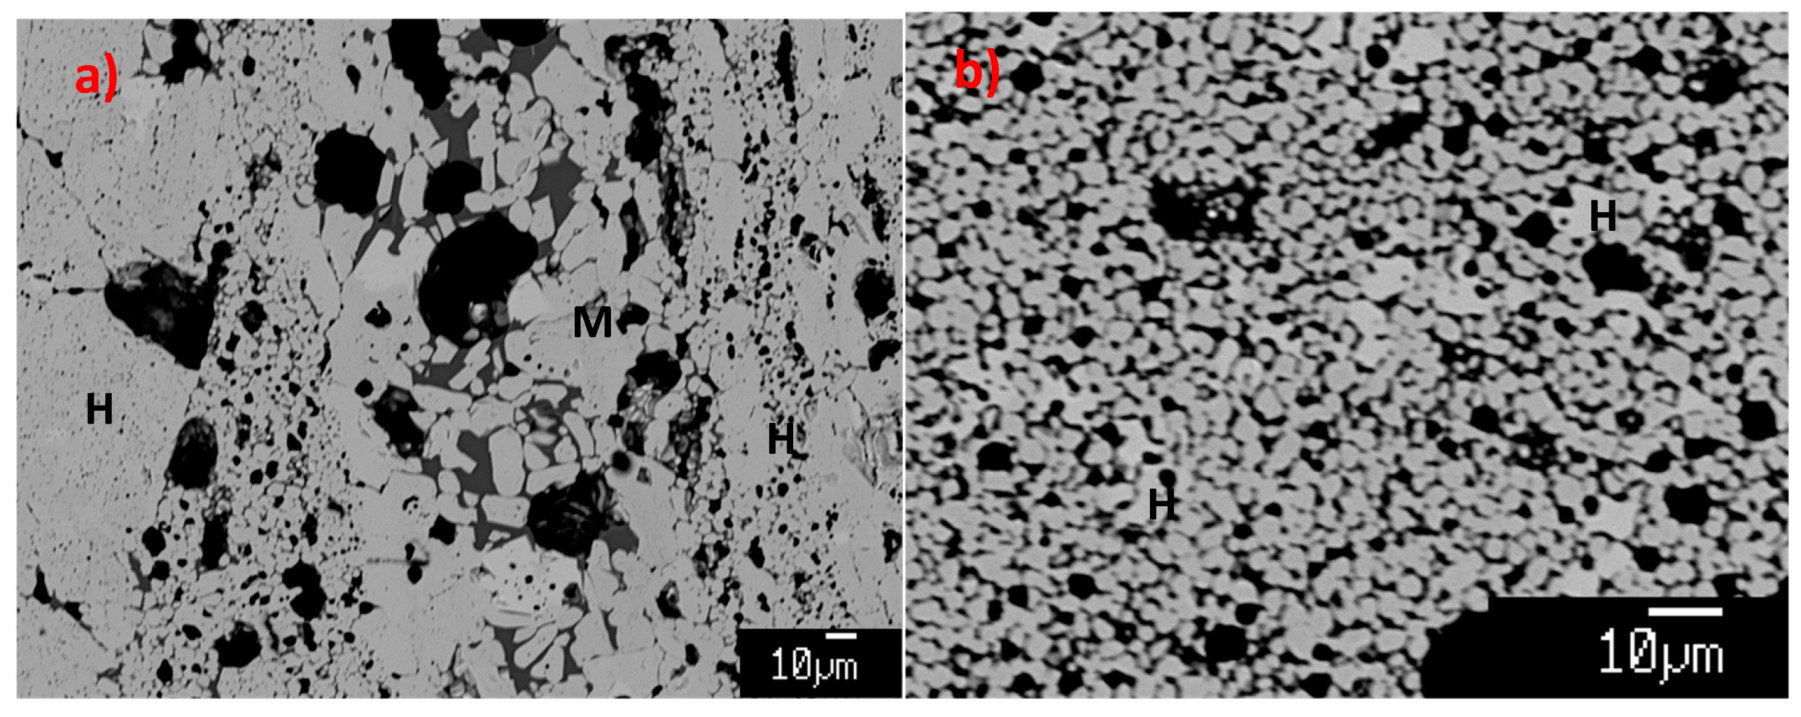
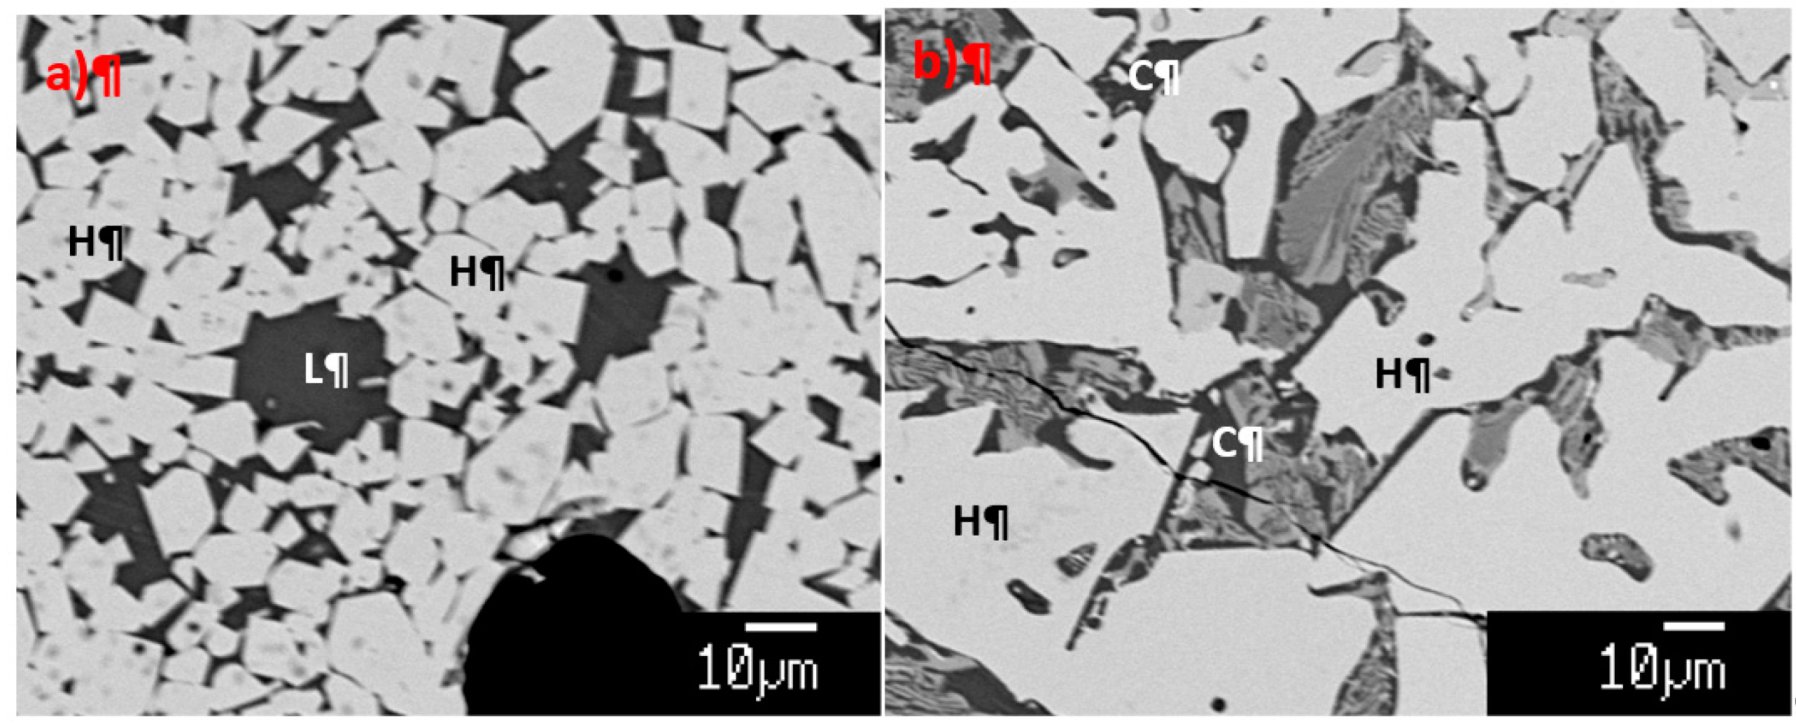
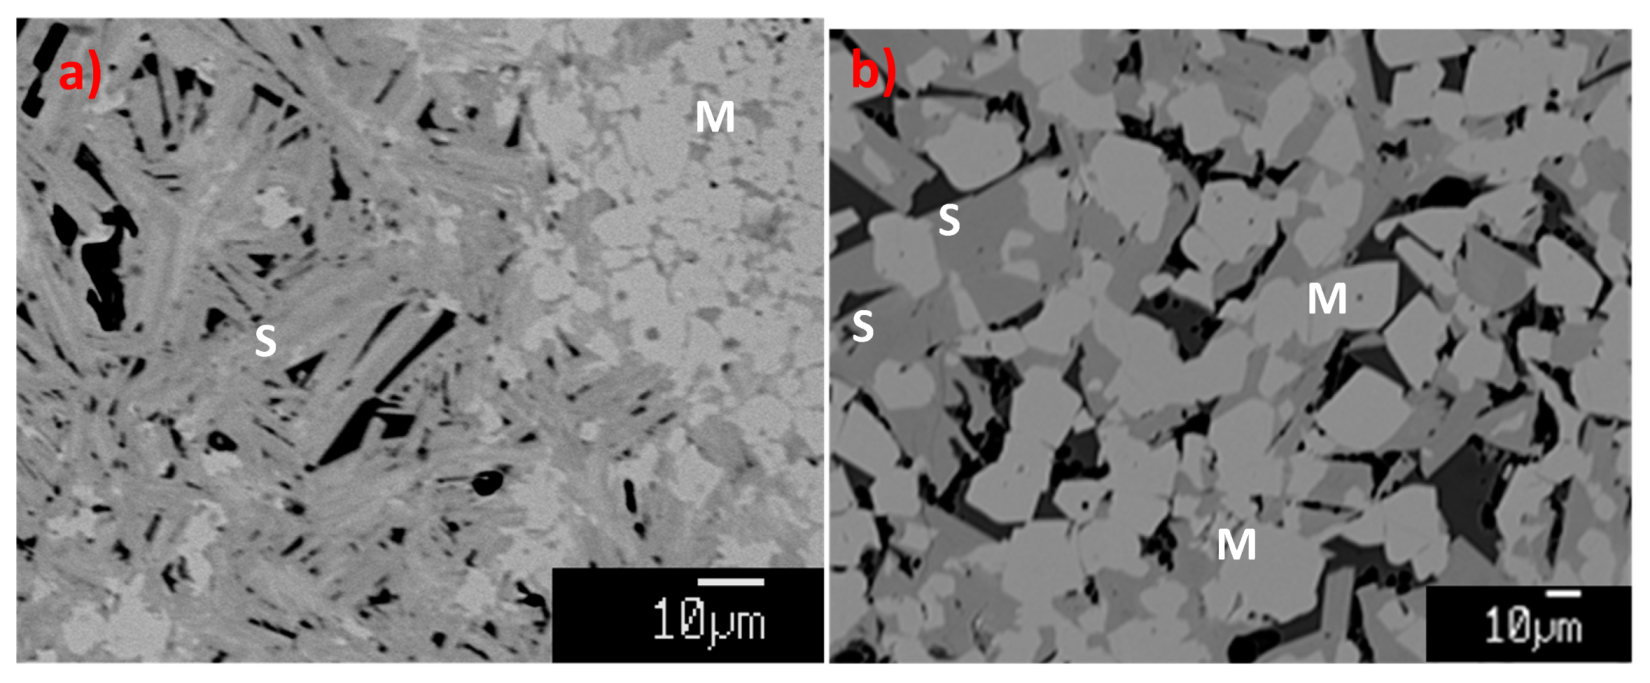
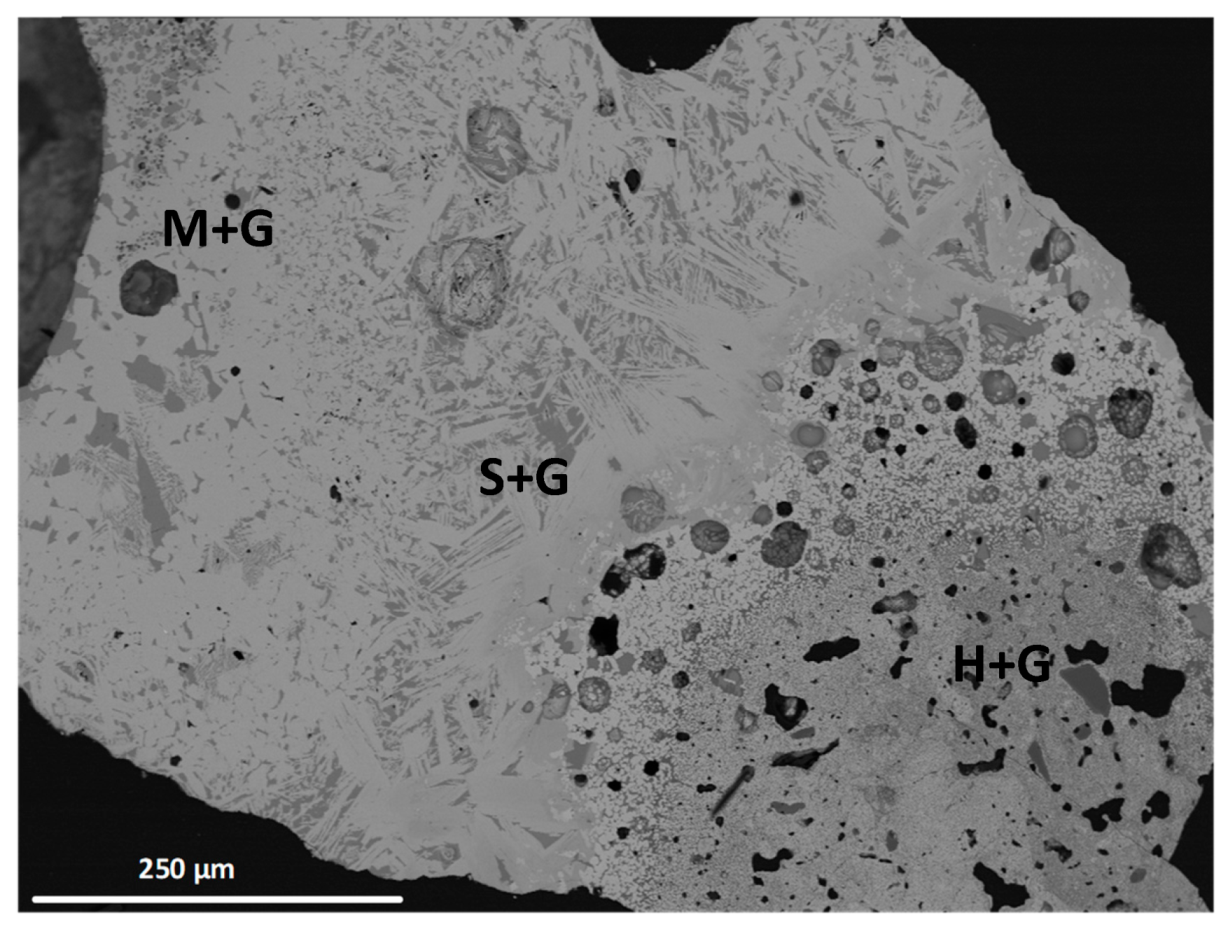
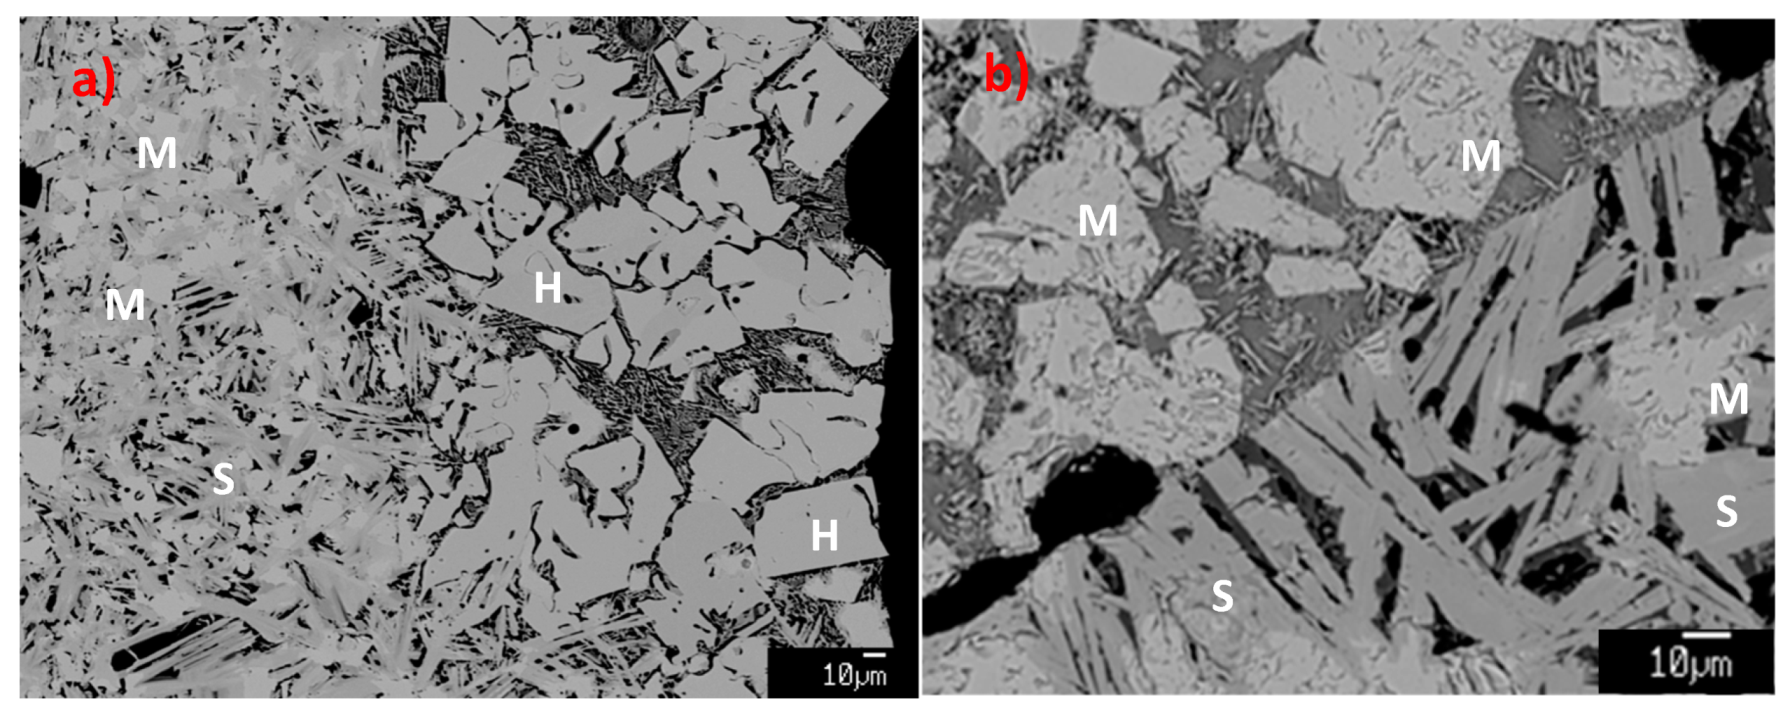
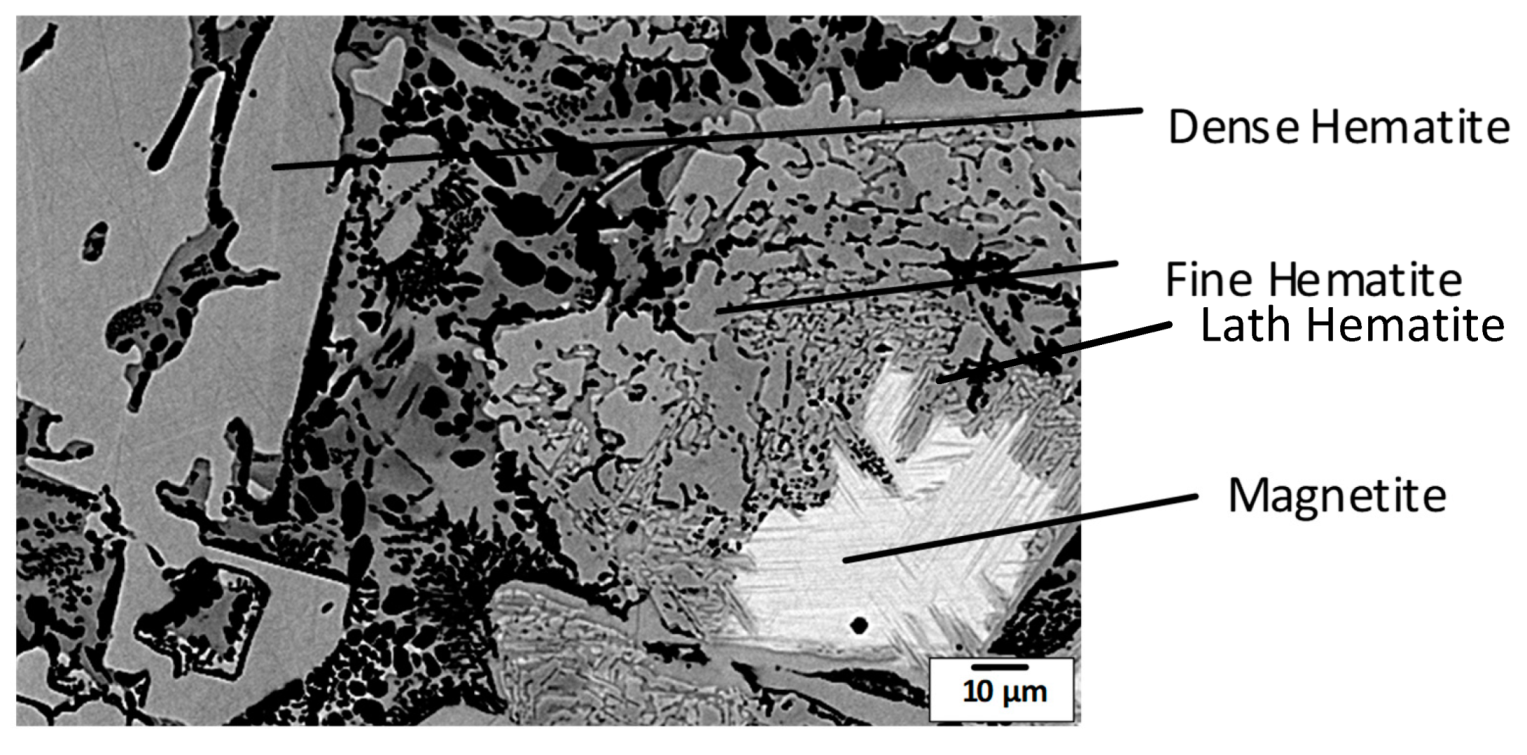
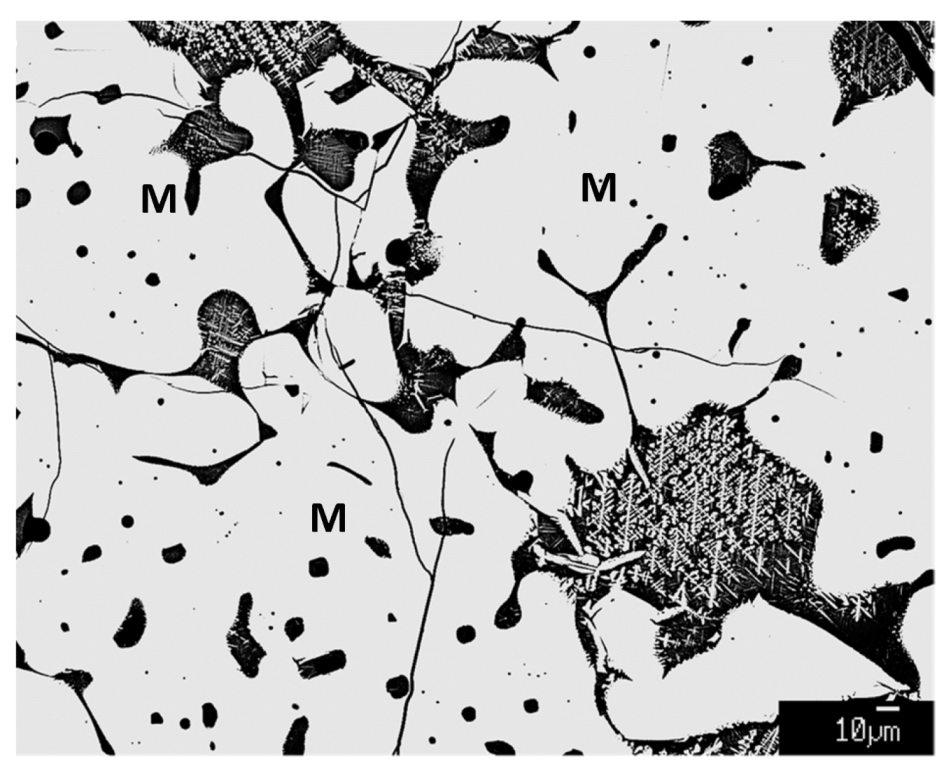
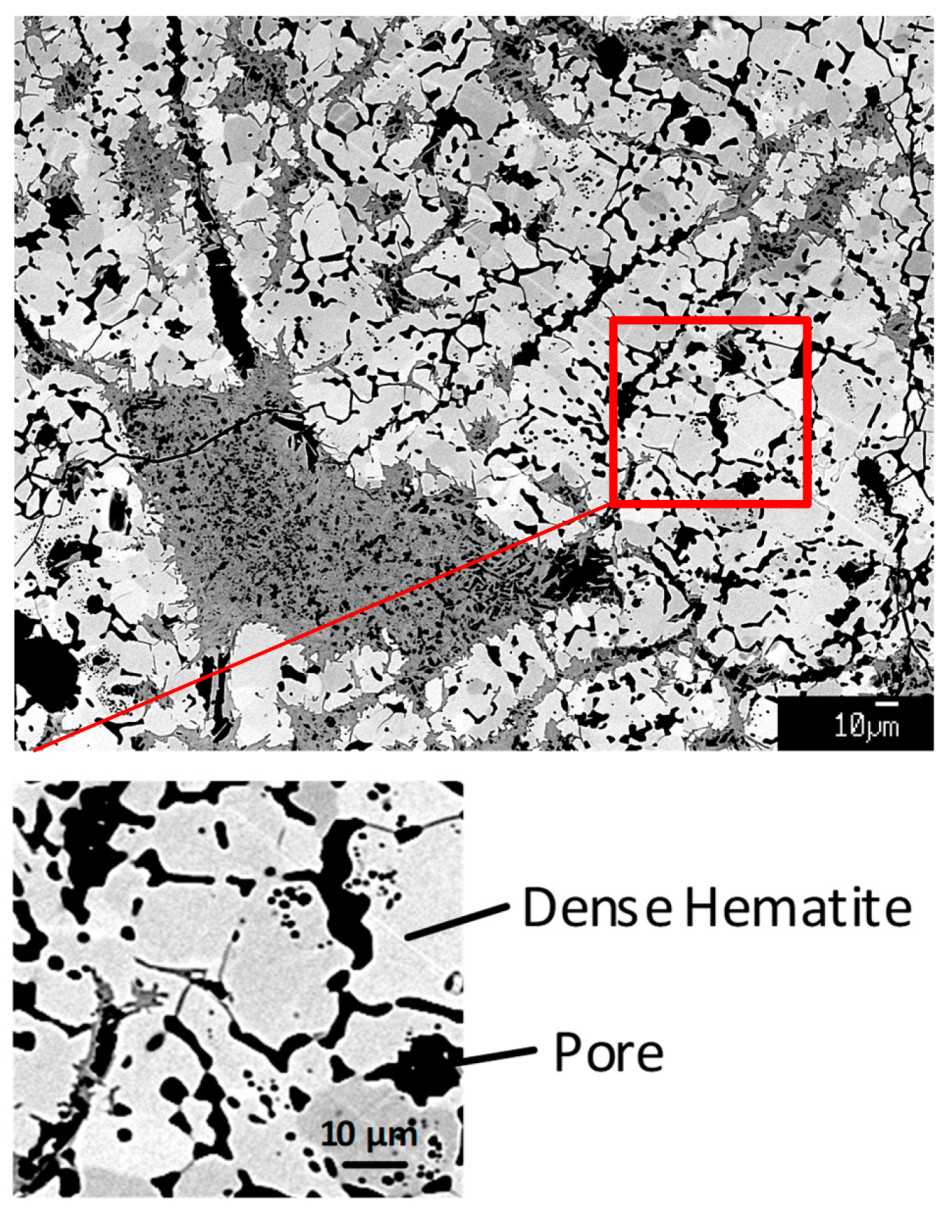
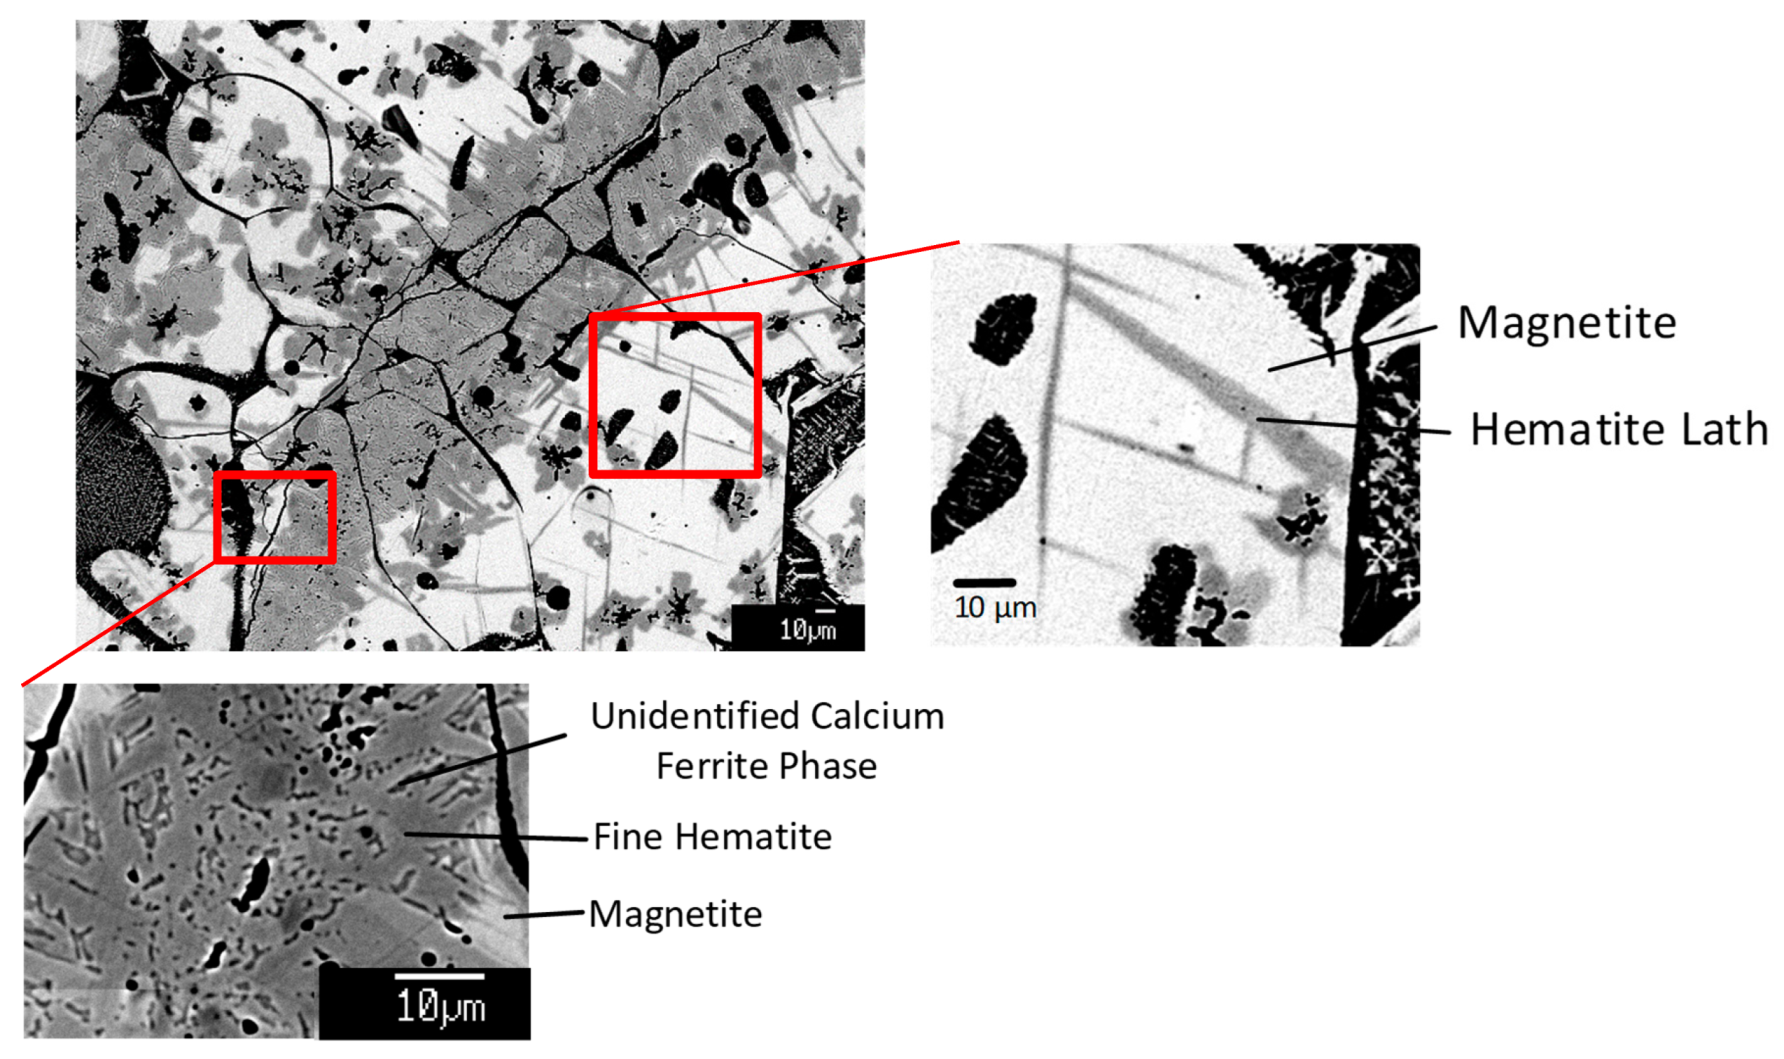
3.5. Microstructures formed in Sinter Products

Samples of iron ore sinter product were taken from the Baosteel Shanghai Sinter Plant no. 3 for microstructural analysis. Examples of porous and dense sinter lump are shown in Figure 8a,b, respectively. The sinter samples exhibit an irregular shape and porous structure with pore diameters ranging from 0.1 to 5mm.
The examples given in Figure 8 are provided to illustrate the extremes of microstructures that can be obtained in sinter. In practice a range of porosities are observed. Figure 9 through 14 provide examples of the different microstructures observed in industrial sinters. A separate systematic study is required to establish direct correlations between the microstructures and macrostructures, and the sinter properties.
Polished cross sections of the sinter product were examined by optical microscopy, scanning electron microscopy (SEM) and electron probe micro X-ray analysis (EPMA) to determine the phases and microstructures present, and the phase compositions. Figure 9 shows the overall scale of the microstructures within the sinter, illustrating the presence of undissolved hematite ore in a matrix of fine crystals and gas pores.
The hematite and magnetite are present in different forms and microstructures, as can be seen in Figure 10, Figure 11 and Figure 12. In Figure 10, a fine grained porous hematite (detail shown in Figure 10b) is present with larger grained dense magnetite. The porous hematite is believed to result from the decomposition of goethite. The rounded magnetite grains (details shown in Figure 10a) appear to have formed following reaction with the surrounding liquid phase at temperature. Hematite has also been observed to form equiaxed hematite and large angular dendrites. The equiaxed hematite crystals were observed to be present in a glassy high silica matrix (liquid at temperature), shown in Figure 11a. Hematite in the form of large angular dendrites surrounded by a partially crystallised matrix is shown in Figure 11b.
Plate-like (Figure 12a) and blocky (Figure 12b) SFCA phase was typically found to be associated with magnetite crystals. There are subtle differences in the magnetite structure between these two cases, for platy SFCA, the magnetite/SFCA interface is irregular (Figure 12a), whilst for the blocky SFCA, the magnetite/SFCA interface is smooth and the crystals have a more equiaxed appearance (Figure 12b).
A single sinter lump typically consists of multiple microstructures. The boundaries between these regions vary from well-defined to diffuse. An example of a diffuse boundary between regions containing SFCA and magnetite and primary hematite is shown in Figure 13. EPMA analysis of the continuous liquid phase present in this transition structure demonstrates a variation in the chemical composition, indicating the penetration of high calcia liquid into the matrix surrounding the primary hematite structures. Examples of well-defined transitions are shown in Figure 14a,b. In Figure 14a, there is a well-defined transition between the platy SFCA and magnetite structure present in the bulk of the sinter sample, and the dendritic hematite and liquid phase assemblage present adjacent to the gas pore. This type of transition structure is observed to be typically present as a layer several hundred micros thick where clearly open or connected pores were present in the sinter macrostructure. In Figure 14b magnetite is present in both structures but in the one case associated with platy SFCA, in the other a partially crystallised liquid matrix. This is indicative of materials with very different thermal histories. In this case potentially SFCA present in return sinter is in contact with liquid and newly produced equiaxed magnetite that has formed in the melt.
The compositions of the phases present in the sinter were measured by EPMA, with a random selection of the measurements made summarised in Table 2. It was found that the hematite contained between 0.0 to 0.7 wt % CaO and 0.5 to 2 wt % Al2O3. Magnetite was found to contain between 0.9 to 2.8 wt % CaO, 2.0 to 6.5 wt % MgO and 0.7 to 2.0 wt % Al2O3. The liquid was found to contain appreciable concentrations of silica (35.7 to 39.9 wt % SiO2), lime (37.4 to 44.3 wt % CaO) and iron (16.0 to 18.7 wt % “Fe2O3”). The composition of the SFCA phase was variable, however, once normalised to the ternary “Fe2O3”–CaO–SiO2 system with the Mg2+ → Ca2+ and Al3+ → Fe3+ cation exchange reactions, as illustrated in Figure 15, the compositional changes are consistent with the CF3-C4S3 solid solution [13].

4. Discussion

4.1. Hematite and Magnetite in Sinter

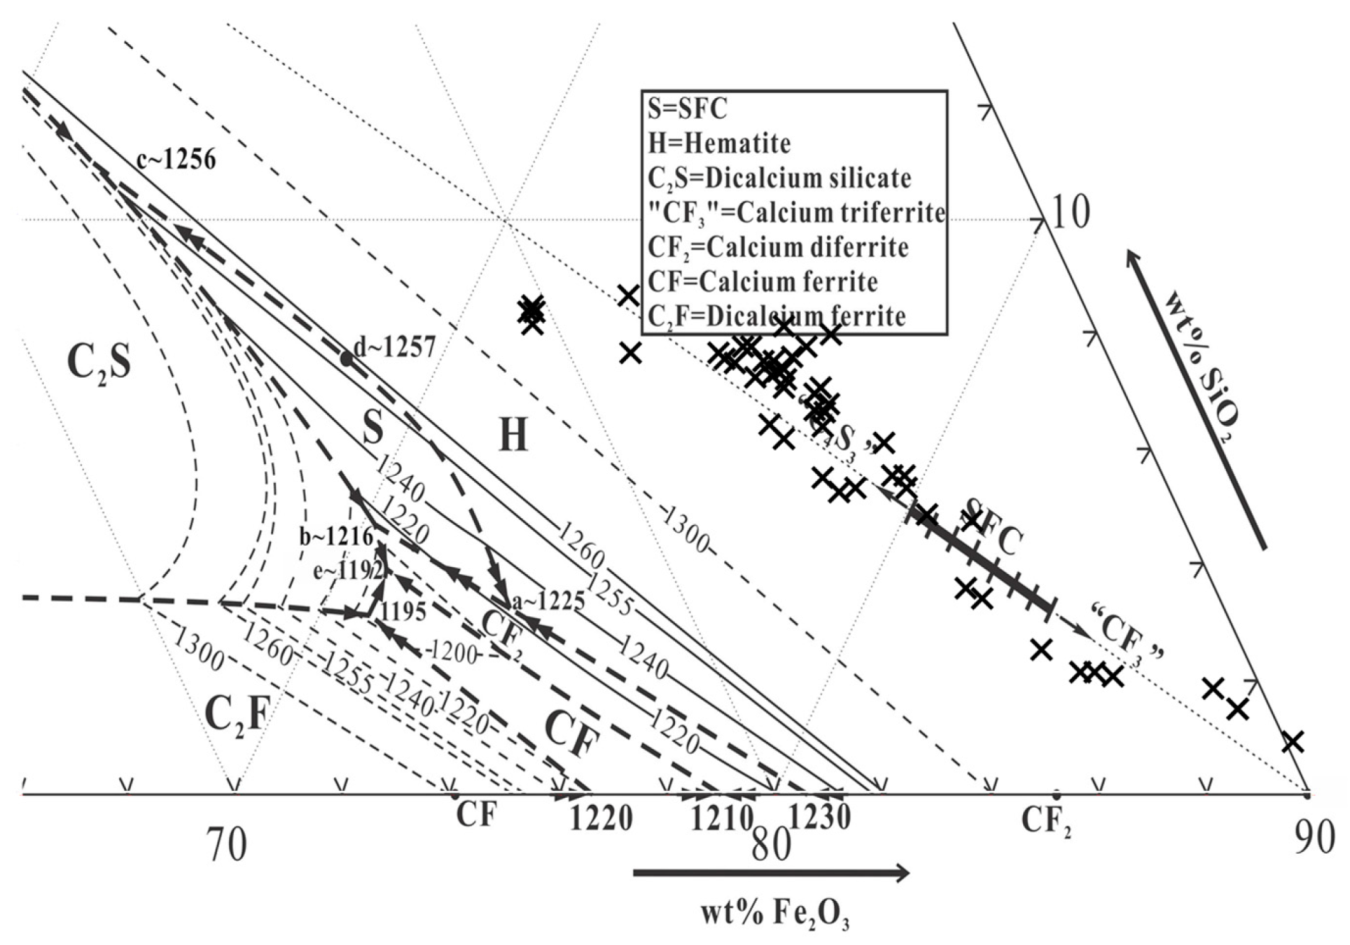
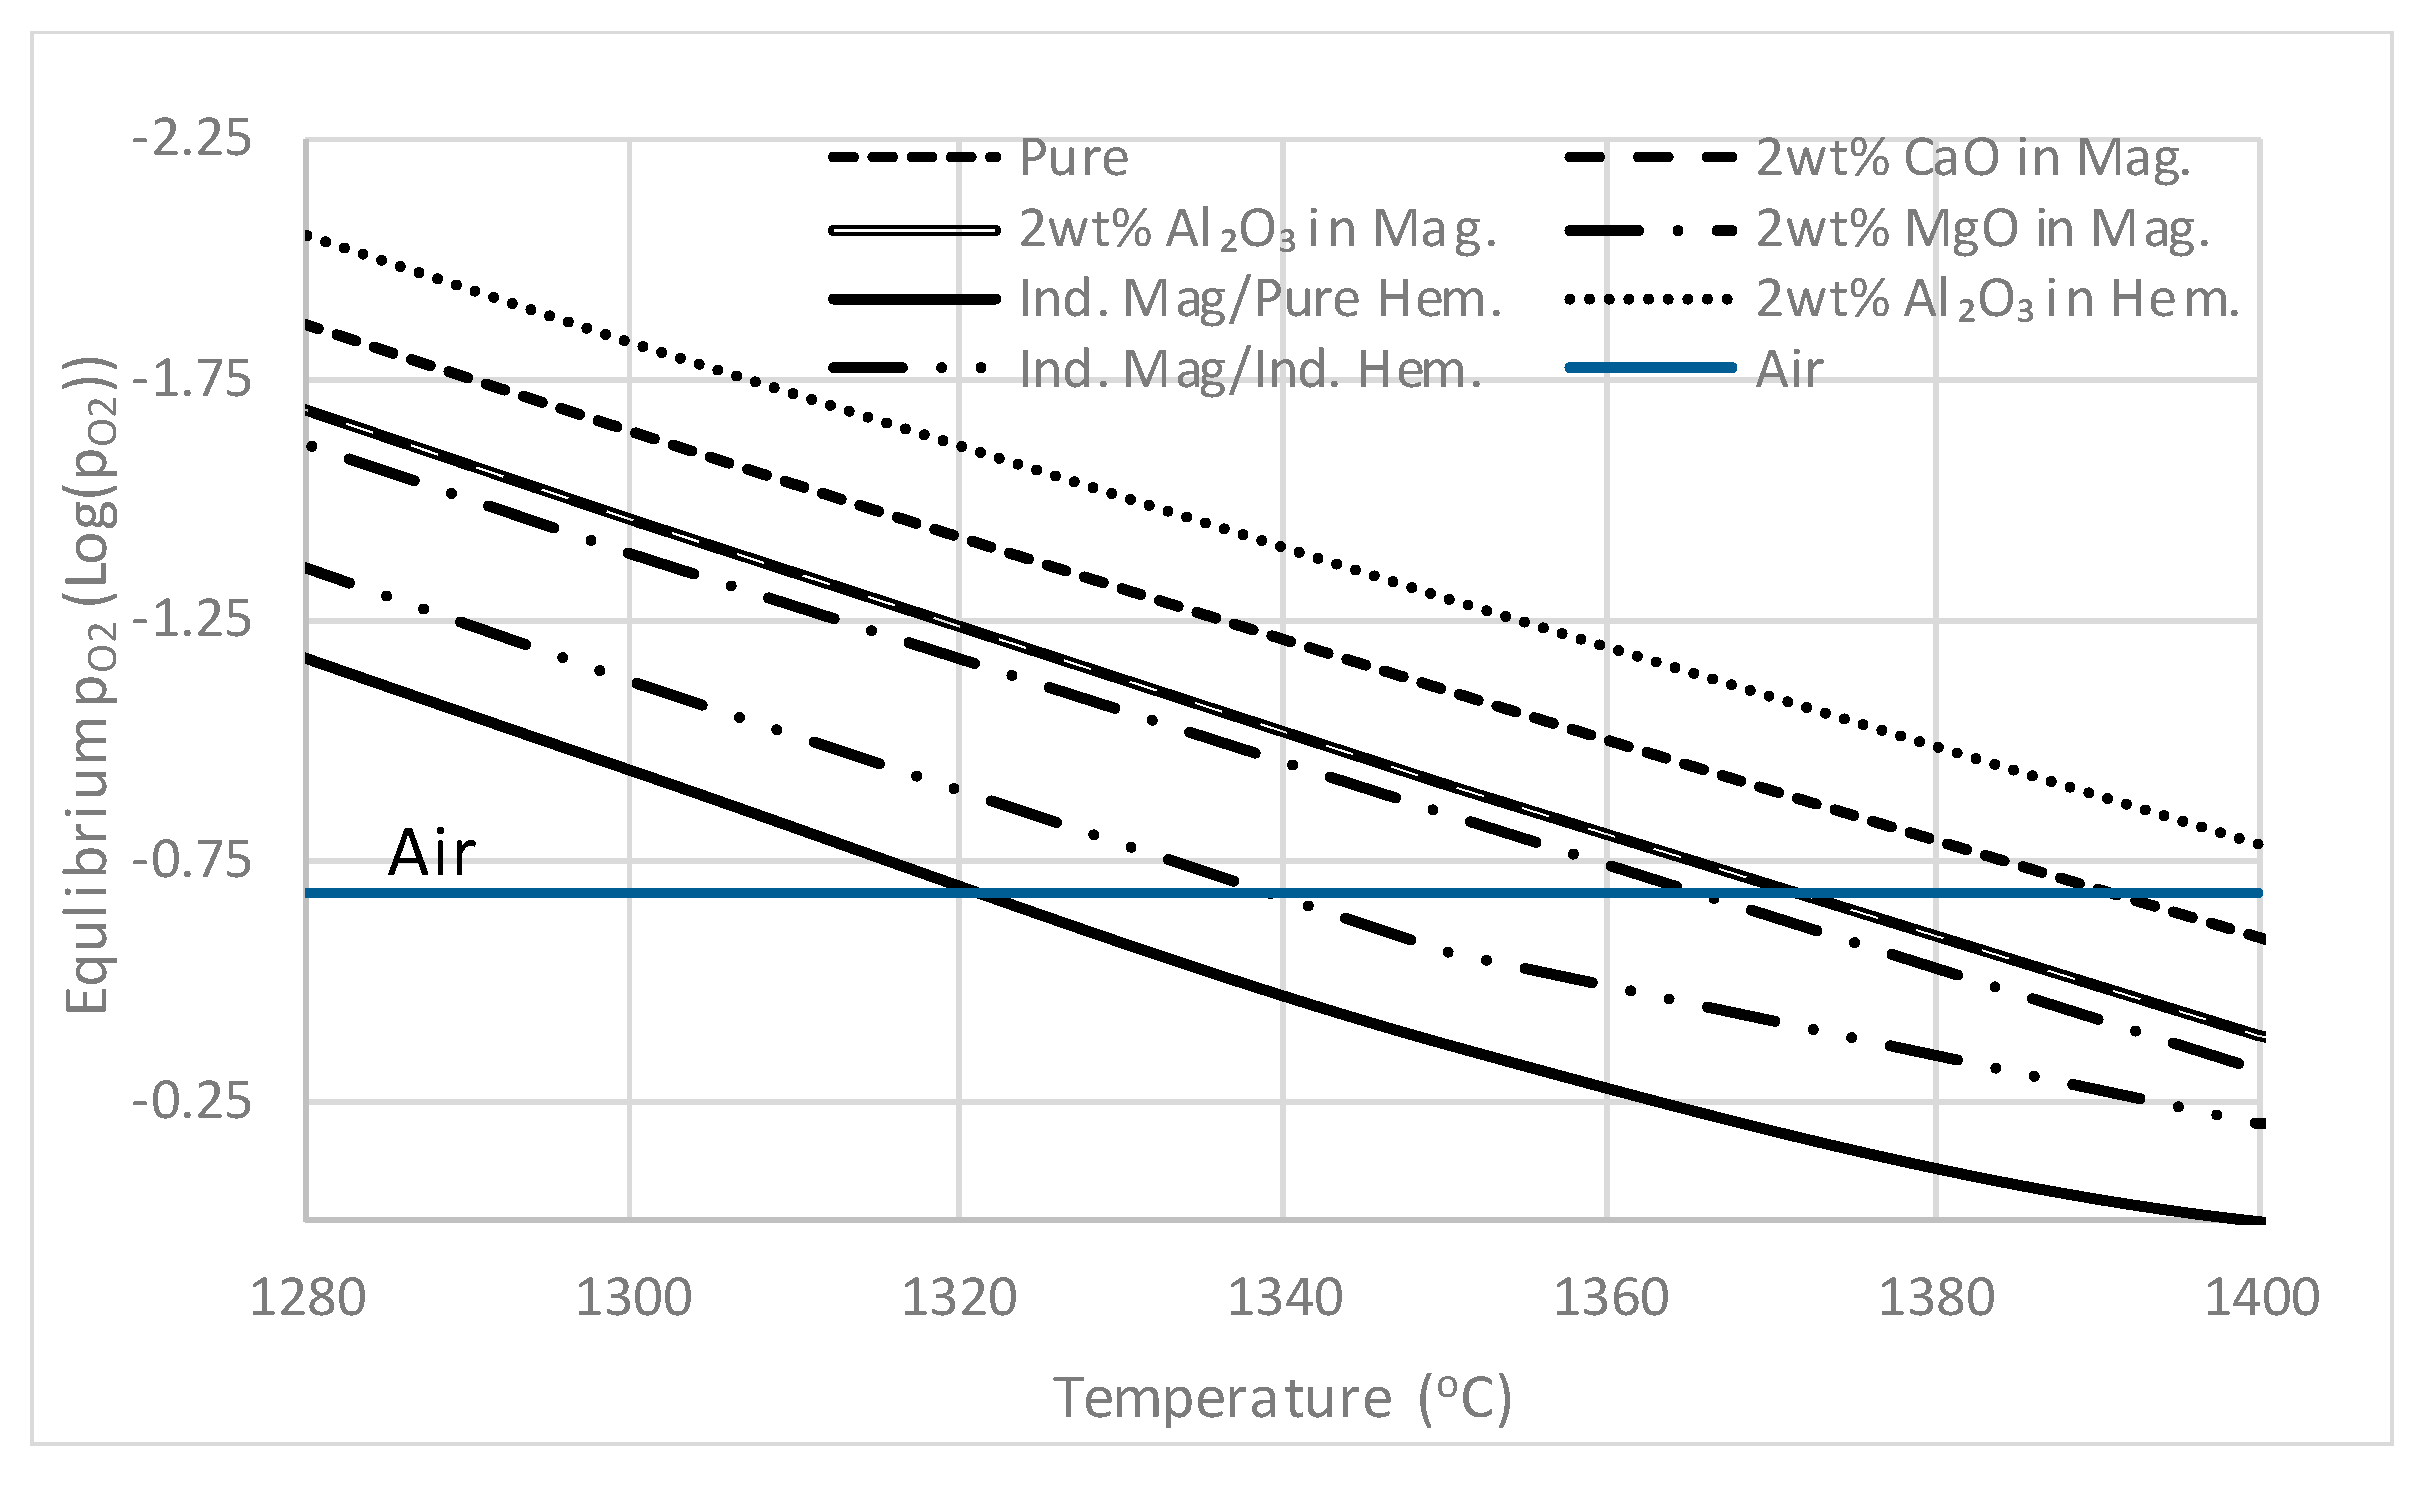
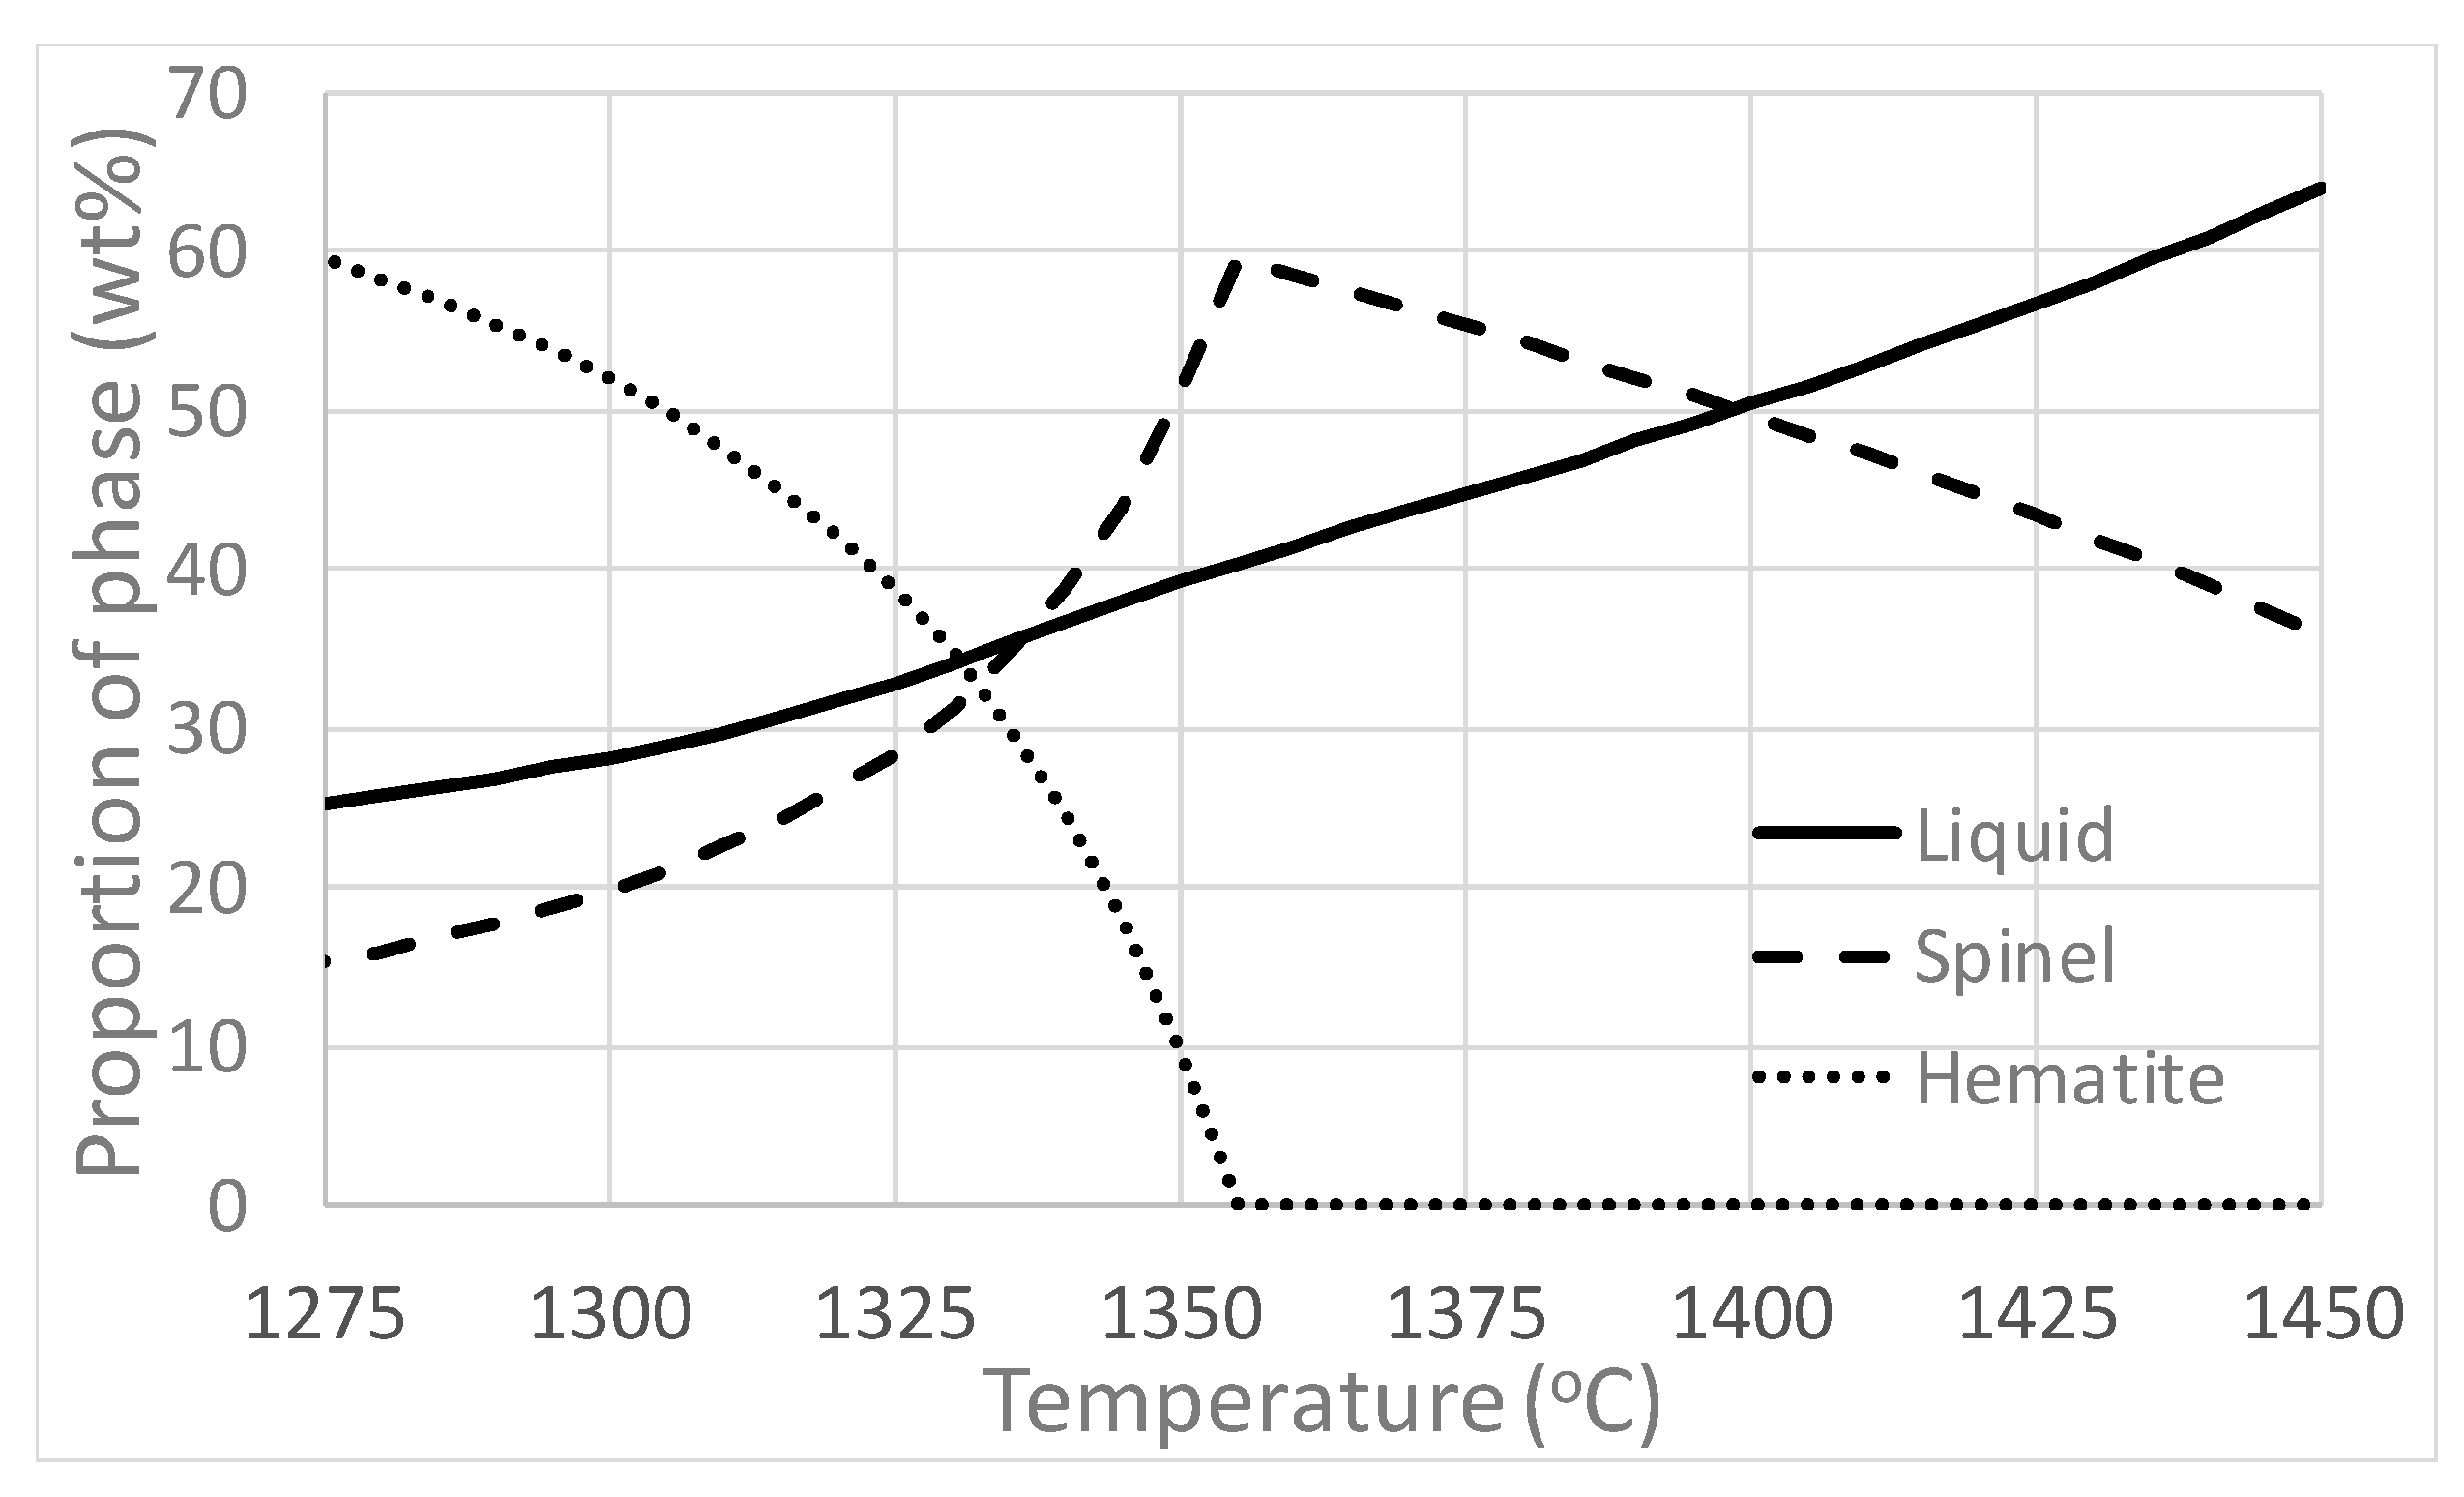
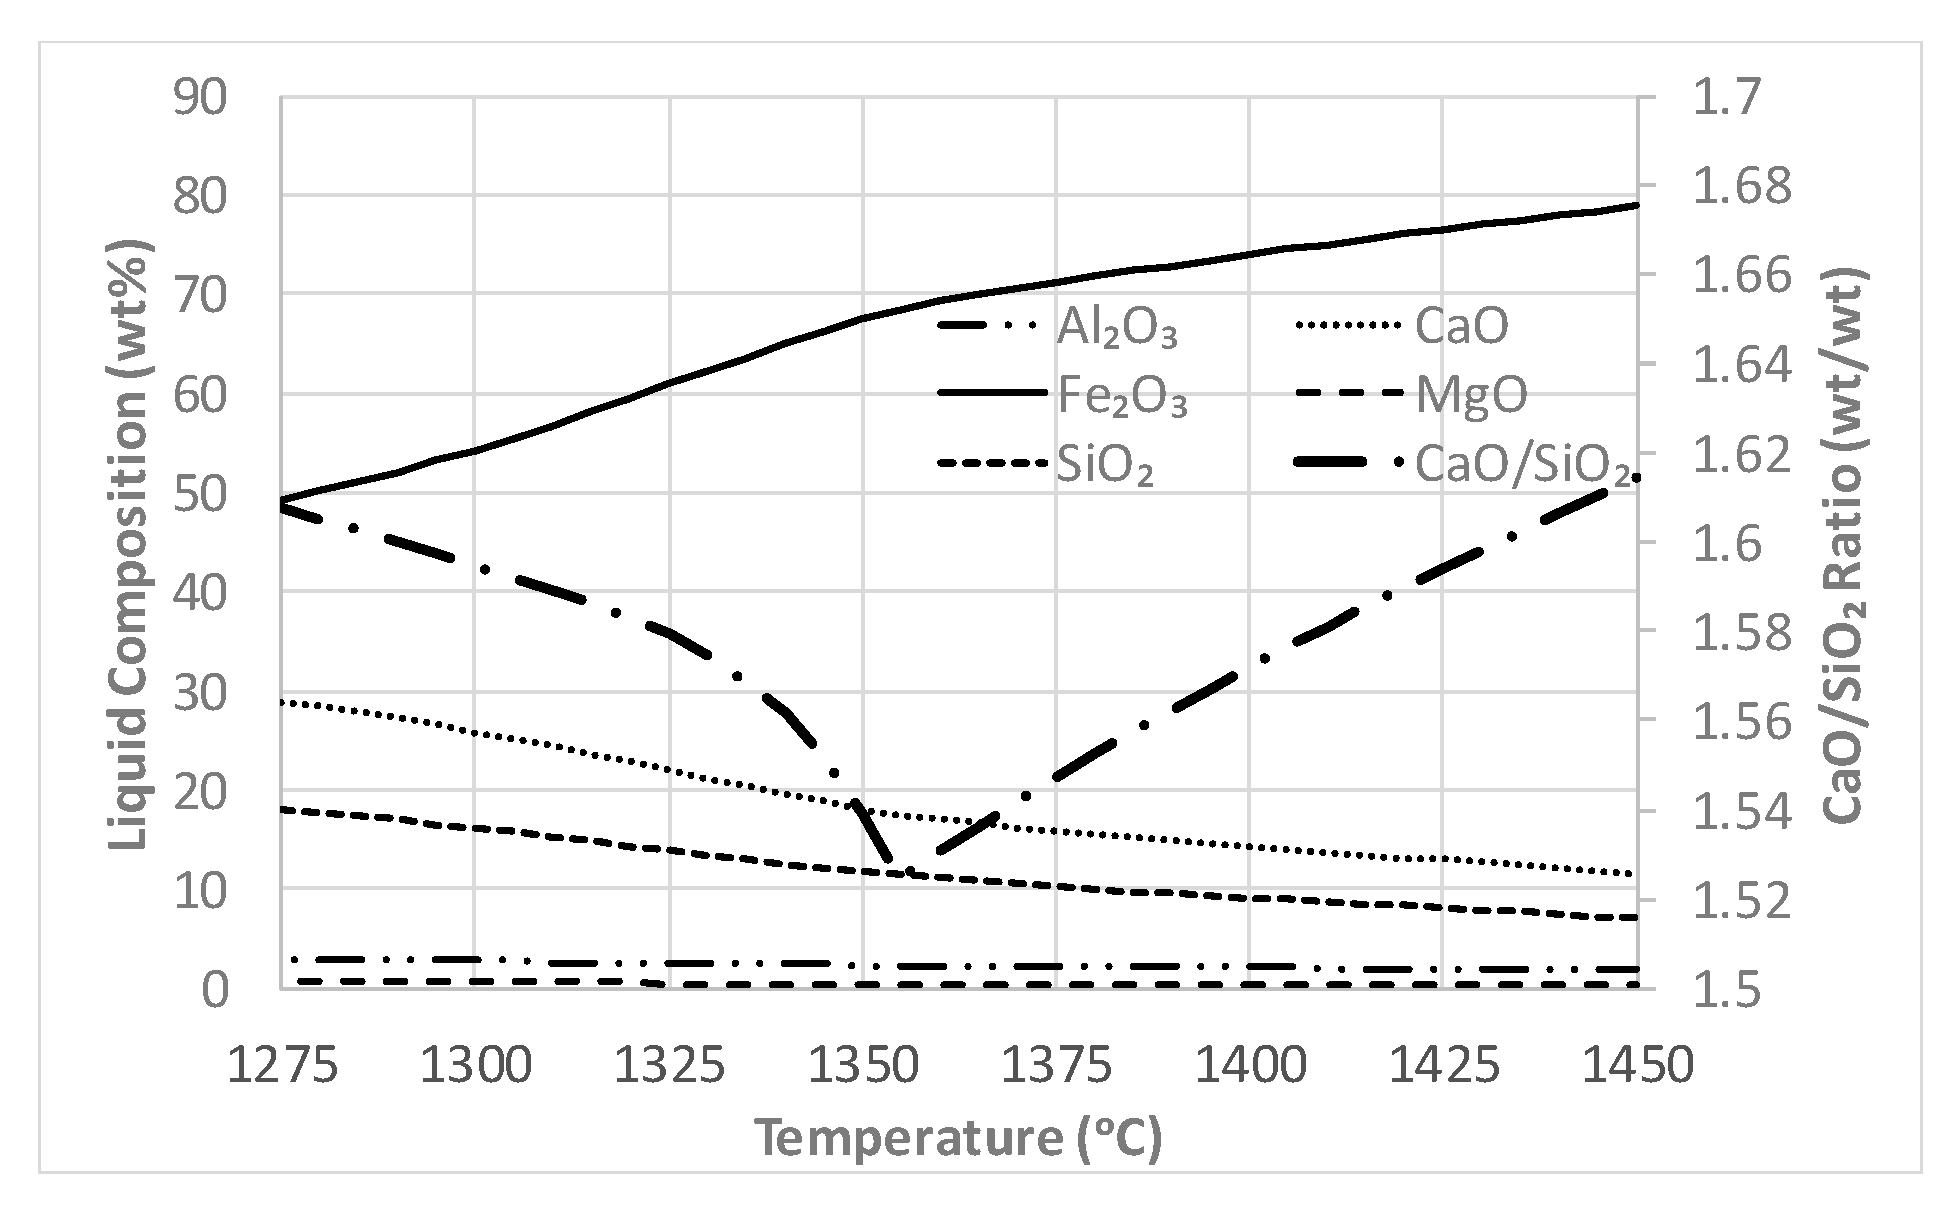
4.1.1. Hematite and Magnetite Stability

Both hematite and magnetite are observed to be present in industrial iron ore sinters. The two phases are able to achieve equilibrium with oxygen gas, as represented by the reversible reaction:
3Fe2O3(s) ↔ 2Fe3O4(s) + 0.5O2(g)
The pO2 at which hematite, magnetite and oxygen are at equilibrium varies with temperature and the composition of hematite and magnetite. With increasing temperature, the equilibrium pO2 increases. In air (0.21 atm O2), pure magnetite is able to form from pure hematite if the temperature is at or above 1380 °C [14].
Based on the measured pO2 and temperature within the sinter pots, the calculated Gibbs free energy of reaction for the reduction of pure hematite to pure magnetite is shown in Figure 16. At a high coke rate, the reduction of hematite to magnetite in air (0.21 atm O2) is observed to be spontaneous at the peak bed temperature. At all other conditions investigated, the reaction was not observed to be spontaneous for any significant period of time, but closely approached conditions at which the reduction of pure hematite to pure magnetite is spontaneous.
On heating, reducing pO2 peaks were observed to occur; however, the predictions indicate that the reduction of pure hematite to form pure magnetite at the measured temperature and pO2 is not favoured.
The impact of the composition of hematite and magnetite on the spontaneity of the hematite reduction at temperature can be predicted knowing the thermodynamic data for the phases. The pO2 for hematite and magnetite equilibrium was calculated between 1300 °C and 1400 °C using FactSage and an internal thermodynamic database, summarised in Figure 17. As observed in industrial sinters (Table 2), hematite typically contains Al2O3 and magnetite contains Al2O3, MgO and CaO. The industrial hematite and magnetite compositions used in the calculations represent the average compositions in the industrial sinter (see Table 2). It can be seen that the presence of Al2O3, MgO and CaO in solid solution in magnetite decreased the temperature at which hematite is reduced to magnetite in air. The presence of Al2O3 in hematite was observed to increase the temperature at which the hematite is reduced to magnetite in air.
Based on the measured composition of the hematite and magnetite, it is estimated that the reduction of hematite to form magnetite is spontaneous in air (0.21 atm O2) at approximately 1330 °C. The peak bed temperature at all conditions investigated in the present study exceeded 1330 °C, indicating that the reduction of hematite to magnetite is spontaneous at the peak bed temperature in all sinter pot tests.
The proportions of phases present in the sinter at the peak bed temperature were also calculated using FactSage and a private database, assuming equilibrium is achieved at an oxygen partial pressure of 0.21 atm. The results of the calculations are summarised in Figure 18. The proportion of liquid present is shown to be significant and sensitive to the peak bed temperature. An increase in peak bed temperature from 1300 °C to 1400 °C increases the proportion of liquid present from 28 wt % to 50 wt %. As a result of the solid solutions both hematite and magnetite are predicted to co-exist below 1380 °C. The composition of the liquid is summarised in Figure 19. The CaO/SiO2 ratio is observed to decrease with reduction of hematite to magnetite, due to the inclusion of CaO in the spinel crystal structure. On melting of the magnetite, the CaO/SiO2 ratio of the melt is observed to increase.
If during the sintering processing the bed material is not heated above the liquidus, some of the primary iron ore will not be dissolved. It is well recognised that this primary iron ore contains inclusions of silica. If the iron oxides are not dissolved then the associated silica is not released into the liquid phase and the CaO/SiO2 in the liquid is increased relative to that of the bulk

4.1.2. Targeted Laboratory Scale Experiments

The measurements of oxygen partial pressures during the sintering process show that the gas atmosphere favours the formation of magnetite only at the peak bed temperature, with hematite favoured at all other conditions during sintering. However, in the sinter pot products, both magnetite and hematite are present. This indicates the sinter charge does not attain chemical equilibrium on cooling. In the present study targeted laboratory experiments were undertaken to examine the mechanisms by which magnetite is oxidised to form hematite during sintering. To simulate industrial sintering, and to ensure that magnetite is present at the peak temperature, samples with a bulk composition of 88.0 wt % Fe2O3 and a CaO/SiO2 ratio of 3.46 wt/wt were cooled from 1400 °C to 800 °C in air at 2 K/s. The resulting microstructure was found to contain both hematite and magnetite, three individual hematite microstructures, namely, dense, fine and lath hematite, and a dense magnetite microstructure. Examples of these microstructures are shown in Figure 20.
The oxygen required for the oxidation of magnetite to hematite can be transferred directly by reaction with the gas phase or through a solid or liquid carrier phase. To assist in identifying the oxidation processes taking place, experiments were performed by first heating samples in air for 240s at 1400 °C to form magnetite, followed by quenching in water and reheating for 240 s at 1200 °C, 1100 °C and 1000 °C in air and requenched in water. The magnetite structure formed by heating at 1400 °C is shown in Figure 21. The magnetite was observed to be anhedral and irregular in shape, with grains formed in the order of 50–100 μm. The magnetite analysed using EPMA and found to contain approximately 2.50 wt % CaO.
Reheating of this magnetite in air at 1200 °C resulted in the complete oxidation of the magnetite to form dense hematite, as shown in Figure 22. The composition of the hematite formed was measured by EPMA and found to contain 0.01 wt % CaO. The dense hematite was approximately 20 μm in size, smaller than the magnetite present at 1400 °C. With the oxidation of magnetite to hematite, an increased porosity of the sample was observed. The dense hematite appears to be surrounded by a matrix of high CaO-containing material. The phase diagram for the CaO–Fe2O3–SiO2 system in air [12] indicates that liquid can form at this temperature.
On reheating of the magnetite for 240 s at a temperature of 1100 °C and 1000 °C, both magnetite and hematite phases were observed. A micrograph illustrating these microstructures is shown in Figure 23. The hematite was observed to be present in two forms, i) as a fine grained (<1 μm) two phase structure with an unidentified phase, and ii) as laths (~ 2 μm in width) within the magnetite grains. The hematite is observed to form on the exterior surfaces of the magnetite crystals, and in association with cracks and porosity. The cracks and porosity can provide pathways for the transfer of oxygen from the gas into the sample.
The unknown phase present in the fine grained two phase structure appears to have formed as a result of the compositional difference between the magnetite (2.50 wt % CaO) at 1400 °C and the hematite (0.01 wt % CaO). Due to the small size of the unknown calcium ferrite crystals, the phase could not be positively identified by EPMA but are assumed to be calcium ferrite crystals. Based on the composition difference between the hematite and magnetite, calcium is rejected to a second phase, with potential candidates including SFC, SFC-I, CF2, CF and Ca7.2Fe2+0.8Fe3+30O57 [15].

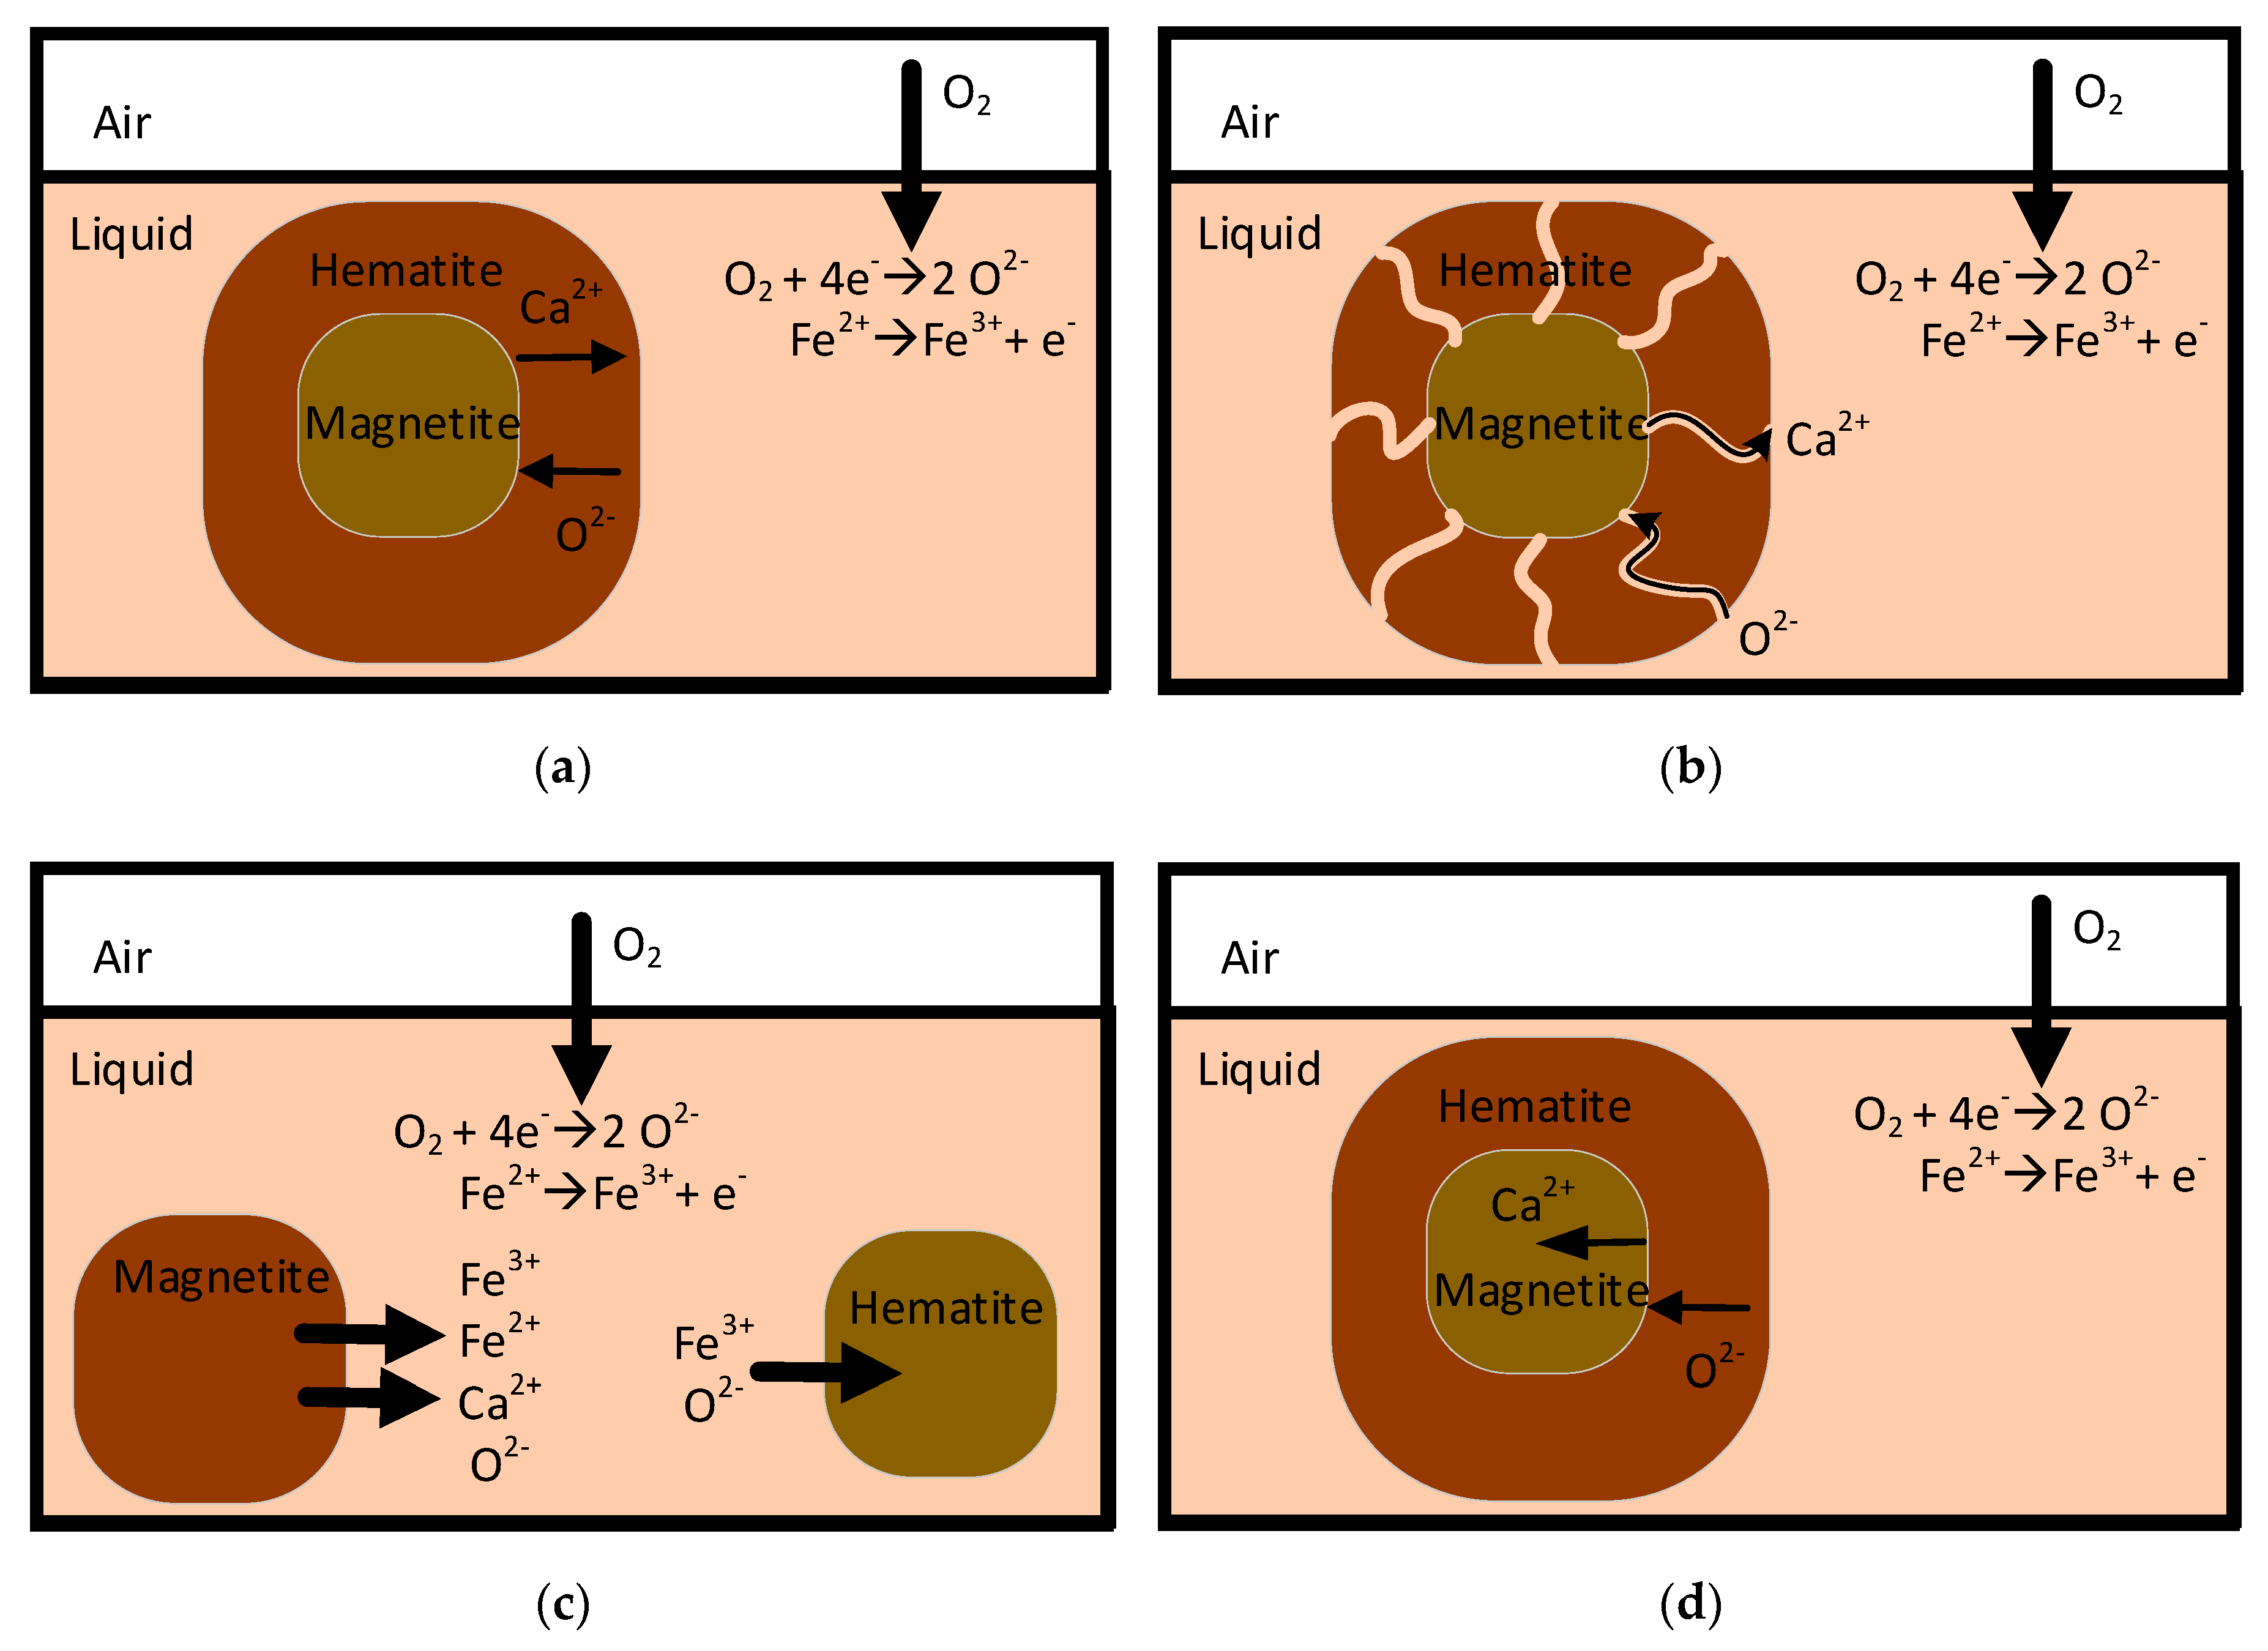
4.1.3. Mechanisms of Formation of Hematite and Magnetite

When simulating magnetite oxidation occurring on the cooling of sinter, three distinct hematite morphologies were observed to form, dense hematite, hematite laths and fine hematite. These two phases were observed to form as a result of magnetite oxidation. The magnetite formed at the peak temperature contained approximately 2.5 wt % CaO, while both dense and fine hematite was found to contain minimal CaO. The oxidation of magnetite must be accompanied by the transfer of the CaO into a second phase.
Dense hematite was observed to form at high temperatures in the presence of a liquid. In systems in which the iron is present in the melt, oxygen is transferred from the gas/melt interface to the liquid in the ionic state via a redox reaction. In these iron oxide containing systems the electrons are provided by the Fe3+/Fe2+ ions, which are oxidised from the Fe2+ to the Fe3+ state. The transfer of ferric ions through the melt takes place through an electron hopping mechanism rather than by ionic diffusion.
To form the dense hematite in the presence of a liquid, the hematite would have either originated as homogenous nuclei or formed on the surface of the magnetite. This suggests that there are four potential mechanisms for hematite formation, (i) as a dense product layer on the magnetite with the diffusion of Ca2+ ions from the magnetite /hematite interface into the melt via solid state diffusion in hematite, (ii) as a porous product layer on the magnetite with the diffusion of the Ca2+ from the magnetite/hematite interface to the bulk melt via the liquid filled pores, iii) by the formation of separate hematite and magnetite phases with the melt facilitating the mass transfer of the chemical components or iv) as a dense product layer on magnetite with the diffusion of Ca2+ ions from the hematite/magnetite interface into the magnetite phase. These reaction mechanisms are illustrated schematically in Figure 24.
With the rejection of the Ca2+ into the magnetite phase during oxidation, the calcium accumulates in the magnetite, leading to the potential formation of calcium ferrite phases in the centre of the hematite. In Figure 22 the dense hematite appeared to be free of inclusions, suggesting that the CaO in the magnetite is rejected into the surrounding liquid rather than a second solid phase. The mechanisms by which calcium is rejected from the magnetite into the surrounding liquid require further investigation.
Fine hematite was observed to form in the absence of a liquid, i.e., at temperatures below the solidus. The fine hematite was observed to form on the surface of the magnetite with the morphology of the original magnetite retained. The unknown calcium ferrite appears to form throughout the secondary hematite. These observations indicate that the magnetite oxidation occurred through a gas-solid reaction process. The volume of the calcium ferrite formed is a smaller than the hematite. The phases formed either through i) a coupled growth mechanism or ii) the rejection of Ca2+ into the magnetite phase and ultimately the formation of the calcium ferrite at the centre of the secondary hematite. These two mechanisms are illustrated in Figure 25.
The third form of hematite observed was in narrow (approximately 2 μm in width) laths in the magnetite. This microstructure, formed at sub solidus temperatures, is consistent with that observed in earlier studies involving the high temperature oxidation of magnetite crystals [16]. In this study, it was demonstrated that these lath structures form by a military transformation propagated through the magnetite along the close packed oxygen planes common to both hematite and magnetite. The hematite phase does not support the presence of Ca2+ ions, and as such, in order for the growth of the hematite phase to occur the calcium in the magnetite must be rejected into the surrounding magnetite matrix or a second calcium rich phase, preventing the further formation of laths.
Based on the observed oxidation mechanisms of magnetite, it is demonstrated here that the forensic EPMA measurement of the minor element concentrations present in the feed and product phases provides a method of determining the origin of the phases. If the feed material does not react with the liquid, the concentrations of elements present in solid solution are expected be the same as in the original material. In contrast, if the same phase is present in the sinter product but formed from a secondary reaction, this material would be expected to be of a different chemical composition.

4.2. Analysis of Process Conditions

The present study has provided detailed information on the process conditions within the sinter bed. Before using these data, the following comments and observations on the precision and accuracy of the measurements obtained are provided
The response rate of the oxygen probe at low temperatures, below 500 °C, is slow since this is directly related to the rate of solid state diffusion through the partially stabilised zirconia at these conditions. This factor should be taken into consideration when interpreting data during the rapid initial heating at these low temperatures.
The measured temperatures and oxygen partial pressures can be influenced by the properties of the sinter. If the sinter is porous, as shown in Figure 8a, the high porosity and thin sections of solid material enables rapid heat transfer between the gas and solid such that the thermocouple reading closely reflects the local temperature of the gas. If there is a dense sinter structure, resembling that shown in Figure 8b, there is limited gas/solid contact and the temperature measured may more closely reflect that of the condensed phases than the gas phase. A large thermal mass of the sinter surrounding the thermocouple and the relatively low heat transfer rate will result in significant temperature differences between the inner and the outer surfaces of the particles. The measured cooling rate is then dependent on the position of the thermocouple within the condensed phase, the local geometry of the condensed phase and the gas temperature. In this case, there will be a difference in the thermal history of the solid/liquid mixture between the interior and exterior of the fused section.
On heating, the oxygen probe is in contact with gas passing down through the bed. In practice, the oxygen probe is measuring the pO2 of the material above the probe tip, rather than that at the tip. In addition, it has been assumed that the local temperature at the oxygen probe tip is the same as that measured by the thermocouple. The position of the thermocouple junction relative to the oxygen probe tip and the temperature difference arising from this difference should be taken into account.

Relationship between Process Conditions and Microstructure

Variations in the measured oxygen pressures at the peak bed temperature provide clear evidence of heterogeneity in the local process conditions. The combustion of coke particles will lead to local variation in temperature and oxygen partial pressure within the sinter. The magnitudes of these variations will depend on the initial particle size, and dispersion of both coke and the oxides in the sinter granules.
The anomalous pO2 on cooling, the oxidation of magnetite, appears to take place when the probe covered with solidified material. The bulk gas at this stage, which has a composition close to air, has a higher pO2 (~0.21 atm) than that measured. In this event, as demonstrated in Section 3.2, due to the reactions taking place at the probe tip, the effective pO2 approaches the Fe2O3/Fe3O4 equilibrium at these lower temperatures.
Examples of sinter microstructure observed in product and return sinter have been given in Figure 10, Figure 11, Figure 12, Figure 13 and Figure 14. Caution should be taken when making direct correlations between microstructure and probe results, since the samples in the industrial sized sinter process may be subjected to different process conditions to those in the sinter pot tests.
In the present study the position of the thermocouple and probe are approximately half way down the bed at the start of the sinter process. As demonstrated previously [7], the thermal history at this position will differ to other regions within the sinter bed. The variation in thermal history will be reflected in a variation in product microstructures. A potential solution to this would be to in future studies examine sinter samples from the regions surrounding the probe tips, rather than sampling the bulk sinter.
The origin and thermal history of different phases can potentially be determined from their composition, morphology and associated phases. The determination of the minor element compositions of hematite/magnetite crystals by EPMA microanalysis can help to determine whether the crystals originate from primary or secondary hematite/magnetite.

Comparison with Previous Studies

The present study has shown that accurate and repeatable measurements of temperature and oxygen partial pressure in the sinter bed can be obtained as a function of time. In the present study, the main reduction peak was observed, in all cases, to occur on heating. Small, short term variations in pO2 were observed during heating and at peak bed temperature. At the peak bed temperature, oxidising conditions were observed, with the pO2 measured to be greater than 0.01 atm.
The pO2 measured during sintering, and the corresponding temperature, differed significantly from that previously measured [4,5]. Multiple reducing peaks were observed, both before and after the peak bed temperature, while only a single peak was previously observed either before [4] or at the peak bed temperature [5]. The pO2 peaks were more reducing than that previously observed [4,5], with a variation in the peaks observed between sinter pot tests.
To establish the effects of changing ore types and the proportions of iron oxides on the peak bed temperature and oxygen partial pressure within the sinter bed, it is recommended that a detailed study is performed to measure the pO2 and temperature within the sinter bed during sintering. The impact of the iron oxides present and the ore type can be determined by comparing the measured pO2 and temperature with a detailed thermodynamic analysis.
The effect of variation in the coke additions and the draft pressures on the temperature profile in the sinter bed is in agreement with prior sinter modelling research [8]. Specifically, the peak bed temperature and time at temperature were observed to increase with increasing coke addition and the time at peak bed temperature was observed to increase with decreasing draft pressure.

4.3. Processes Taking Place during Sintering

4.3.1. Heating: Calcination, Dehydration and Combustion

Rapid heating of the charge takes place between approximately 100 °C and 1200 °C. For all the conditions investigated, low oxygen partial pressures, pO2 between 10−3.15 and 10−13.18 atm were observed on heating between approximately 200 °C and 1000 °C. The heating rates are observed to increase with increase in high draft pressure and coke addition rates. A higher coke addition increases the heat generation per unit mass of sinter. A higher draft results in a higher gas flow, increased the convective heat transfer between the gas and condensed phases.
No thermal arrests were observed at the goethite dehydroxylation (290 °C to 330 °C) and the calcite decarbonation temperatures (895 °C) [17]. The temperatures at which these processes occur vary with the composition and the degree of crystallinity of these phases [17]. A thermal arrest associated with the dehdyroxylation and decarbonation of these minerals is unobservable with the current technique. The generation of H2O(g) and CO2(g) as a result of dehydroxylation and decarbonation will dilute the oxygen in the gas phase, decreasing the pO2.
The coke ignition temperature has been shown to depend on coke composition, gas composition and coke size [18] and occurs at temperatures below 525 °C [19]. Therefore, coke combustion occurs well before the attainment of the peak bed temperature. The combustion of coke particles results in the localised generation of CO(g) and CO2(g), and the formation hot spots and low oxygen partial pressure locations within the sinter. Due to the formation of individual channels, the coke is combusts as individual particles, as opposed to simultaneous combustion. The localised CO(g), once generated, is diluted and reacts as it is drawn down through the sinter bed by the draft pressure. As the CO(g) passes down through the bed, it reacts with the excess oxygen; however, on cooling the final gas mixture is not at thermodynamic equilibrium.
From the observed temperature and pO2 profiles, it is apparent that there are two stages to the sinter heating process. The first occurs with the transfer of heat from the gas to the condensed material. At the conclusion of the first stage, the coke reaches conditions at which it is able to ignite and combust. After the rapid combustion of the coke, the materials in contact with and close to the combustion are heated to temperatures higher than the surrounding material. The second stage of heating occurs with the transfer of heat from these hot reducing spots to the surrounding cooler material.

4.3.2. Peak Bed Temperature

In the present study, the oxygen partial pressures measured at peak bed temperatures and within 100 °C of the peak temperatures were all greater than 0.01 atm, in contrast to ~10−8 atm previously reported by [5].
It is suggested that the gas and condensed phases do not reach equilibrium in sintering, with the average pO2 in the condensed phases lower than the gas phase. In addition, due to the heterogeneous heating, it is further suggested that the pO2 within the sinter is variable with distance from the coke combustion.
The proportion of magnetite in the sinter fines was lower than that observed in the sinter product and marginally greater than in the sinter feed. The formation of magnetite occurs under reducing conditions at high temperatures. In addition, the proportion of silica phases in the sinter fines is shown to be greater than in the product. Both observations suggest that the sinter fines originate predominantly from regions that experienced lower peak bed temperatures.
In agreement with previous research [20], the length of time at the peak bed temperature was observed to increase with decreasing draft pressure. However, in contrast to those previously reported [20], the peak bed temperatures did not appear to be greatly influenced by changes in draft pressure.
Increasing the coke addition rate was observed to increase the peak bed temperature and time at temperature, consistent with past observations [10]. The increase in coke rate results in increases in the heat generated. For an identical rate of heat loss to the gas, this results in increased bed temperature and increased liquid fraction in the charge, which results in an increased agglomeration of the ore. The increased agglomeration means that the rate of heat loss to the gas passing through the bed is also reduced and the solid/liquid mixture is maintained at the peak bed temperature for longer periods of time.
With increased temperatures and increased time at temperature, a larger proportion of hematite will be reduced to magnetite, as observed by the semi-quantitative XRD.

4.3.3. Cooling

The cooling rates of the sinter were observed to be largely independent of the draft and coke addition rate. The cooling rate was observed to vary from approximately 1 °C/s to 2 °C/s. Due to the heterogeneity of the coke combustion and the generation of a heterogeneous temperature profile with respect to horizontal position, it is proposed that a relationship between these variable is present but unable to be measured with the techniques used. The cooling rate within the sinter is influenced by extent of agglomeration. With a more extensive agglomeration, associated with greater sinter melting, the rate of heat transfer from the solids to the gas decreases, decreasing the rate of sinter cooling.
At all conditions investigated, the oxygen probe registered low oxygen pressures on cooling in the temperature range of 1000 °C to 300 °C, despite the fact that the bulk gas passing through the bed contains a high pO2, approaching that of air. This indicates the low oxygen pressure measurements are related to reactions taking place adjacent to the probe sensor. As observed in laboratory scale experiments (see Section 4.1.2 and Section 4.1.3), the oxidation of magnetite in this temperature range can occur through gas-solid reactions. As the gas-solid oxidation of magnetite is able to occur slowly in the temperature range at which the peak was observed, this reaction is proposed to be the cause for this peak. As the peak varies in width, pO2 and occurrence temperature, the oxidation is likely to be caused by the formation of cracks within the sinter. The formation of these cracks, as a result of phase changes or differences in thermal expansion, would expose the previously enclosed magnetite to air, enabling oxidation to occur. During the oxidation of the magnetite, the average pO2 in the condensed material increases and the pO2 of the gas phase decreases.

4.4. Stages of Sintering

The stages of sintering identified in previous studies (Figure 1) have focussed on particular reaction steps that occur during the process. However, these stages do little to define the process conditions that are present during the sinter process and their potential impact on sinter microstructure, which ultimately determine the properties of the sinter product. It has been shown in the present and previous studies [4,5] that temperature and oxygen partial pressure are key process variables. Analysis of the results obtained in the present study show that both equilibrium and non-equilibrium phases can be formed depending on these conditions and the thermal history. To more clearly understand the reasons for the formation of these phases the heating, peak bed and cooling stages of the process are more clearly defined, as follows:
1a.
Heating solids under high/low oxygen pressures
1b.
Heating solid/liquid mixtures under high/low oxygen pressures
2.
Peak bed temperature under high/low oxygen pressures with solid/liquid mixtures
3.
Cooling in solid/liquid mixtures under high oxygen pressures
4.
Cooling solid mixtures under high oxygen pressures
In stage 1a, the granular sinter is heated up in high oxygen pressure conditions, with the dehydroxylation and decarbonation of minerals occurring as the temperature is rapidly increased. The extent of reactions between solid components is limited due to the limited point contact between solids and the relatively low rates of mass transfer in the solid state.
In stage 1b, ignition and combustion of the coke results in the generation of locally reducing conditions. This leads to two extremes of process conditions within the sinter, high oxygen pressures approaching that in the gas that is being drawn through the bed; low oxygen partial pressures associated with coke combustion and high CO/CO2 ratios. At this stage, liquid can appear in selected regions of the charge dependent on temperature and oxygen pressure; the liquid phase facilitates rapid reaction between the phases. The proportion of liquid present increases with increasing temperature.
In stage 2, at the local peak bed temperatures encountered in iron ore sintering, liquid/solid mixtures are present, and the mixtures move towards isothermal chemical equilibrium in these sub-liquidus conditions. The local process conditions may be oxidising or reducing with respect to magnetite and are sensitive to peak bed temperature and chemical composition of the charge materials.
In stage 3, as the mixture is cooled, precipitation of selected chemical components from the liquid onto existing solids takes place, and new phases and microstructures are formed. The solidification occurs under conditions that are oxidising relative to the magnetite phase.
In stage 4 all the metal oxides are in the solid state. During cooling the air drawn down through the sinter ensures that the gas phase maintained oxidising conditions relative to magnetite and secondary hematite is formed.

5. Summary

Instrumented pilot scale iron ore sinter tests have been undertaken to determine the temperatures and oxygen partial pressures present in the charge during sintering, and the impact of coke rate and draft pressure on the process conditions and sinter products. Repeatable trends and relationships between the pO2 and temperature profile during sintering were obtained using this experimental design and procedure. The increase in the coke addition led to an increased heating rate, a higher peak bed temperature and longer time at peak temperature. An increase in the draft pressure was observed to result in increased heating rate and shorter times at peak temperature. The sintering stages have been classified in terms of the process conditions present during sintering to enable the influence of these variables on the resulting microstructure to be more clearly identified.
Thermodynamic and microstructural analysis have provided further information on the processes taking place during sintering, and the relationships between key process variables and product structures.

Author Contributions

Conceptualization, J.C., P.C.H., S.N.; Formal analysis, S.N.; Investigation, S.N., J.C., W.Q., X.M. and P.C.H.; Methodology, S.N., J.C., W.Q. and X.M.; Supervision, P.C.H.; Writing—original draft, S.N.; Writing—review & editing, S.N., E.J. and P.C.H.

Funding

The authors would like to thank Baosteel Australia Joint Centre (BAJC) for financial support to enable this research to be carried out. The research was also supported by an Education Endowment Fund (EEF) scholarship from the Australasian Institute of Mining and Metallurgy (AusIMM) and an Australian Government Research Training Program (RTP) Scholarship.

Conflicts of Interest

The authors declare no conflict of interest.

References

  1. Ball, D. Agglomeration of Iron Ores; Heinemann Educational: London, UK, 1973. [Google Scholar]
  2. McBriar, E.; Johnson, W.; Andrews, K.W.; Davies, W. Nature of Ironstone Sinter. JISI 1954, 177, 316–323. [Google Scholar]
  3. Burlingame, R.; Bitsianes, G.; Joseph, T. Reaction Zones in the Iron Ore Sintering Process. JOM 1956, 8, 853–861. [Google Scholar] [CrossRef]
  4. Van den Berg, T.; de Villiers, J.; Cromarty, R. Variation of the redox conditions and the resultant phase assemblages during iron ore sintering. Int. J. Miner. Process. 2016, 150, 47–53. [Google Scholar] [CrossRef] [Green Version]
  5. The 94th Lecture Meeting of the Japan Iron and Steel Institute Lecture, Ironmaking/Environment. 1977. Available online: https://www.jstage.jst.go.jp/article/tetsutohagane1955/63/11/63_11_S512/_pdf/-char/ (accessed on 20 June 2019).
  6. Muller, J.; De Vries, T.; Dippenaar, B.; Vreugdenburg, J. A finite difference model of the iron ore sinter process. J. S. Afr. Inst. Min. Metall. 2015, 115, 409–417. [Google Scholar] [CrossRef]
  7. Yang, W.; Ryu, C.; Choi, S.; Choi, E.; Lee, D.; Huh, W. Modeling of Combustion and Heat Transfer in an Iron Ore Sintering Bed with Considerations of Multiple Solid Phases. ISIJ Int. 2004, 44, 492–499. [Google Scholar] [CrossRef]
  8. Zhou, H.; Zhao, J.P.; Loo, C.E.; Ellis, B.G.; Cen, K.F. Model Predictions of Important Bed and Gas Properties during Iron Ore Sintering. ISIJ Int. 2012, 52, 12–2168. [Google Scholar] [CrossRef]
  9. Zhou, H.; Zhao, J.P.; Loo, C.E.; Ellis, B.G.; Cen, K.F. Numerical Modeling of the Iron Ore Sintering Process. ISIJ Int. 2012, 52, 9–1550. [Google Scholar] [CrossRef]
  10. Zhao, J.; Loo, C. Dependence of flame front speed on iron ore sintering conditions. Miner. Process. Extr. Metall. Rev. 2016, 126, 3–165. [Google Scholar] [CrossRef]
  11. Nicol, S.; Jak, E.; Hayes, P. Microstructure evolution during controlled solidification of “Fe2O3”-CaO-SiO2 liquids in air. Metall. Mater. Trans. B 2019, in press. [Google Scholar]
  12. Chen, J.; Shevchenko, M.; Hayes, P.C.; Jak, E. A phase equilibrium study of the iron-rich corner of the CaO-FeO–Fe2O3–SiO2 systems in air and the determination of the SFC primary phase field. ISIJ Int. 2019, 59, 795–804. [Google Scholar] [CrossRef]
  13. Pownceby, M.; Clout, J.; Fisher-White, M. Phase equilibria for the Fe2O3-rich part of the system Fe2O3–CaO–SiO2 in air at 1240–1300 °C. Trans. Inst. Min. Metall. Sect. C 1998, 107, C1–C10. [Google Scholar]
  14. Muan, A.; Osborn, E. Phase Equilibria among Oxides in Steelmaking; Reading Mass: Addison-Wesley Pub. Co.: Reading, MA, USA, 1965. [Google Scholar]
  15. Nicol, S.; Jak, E.; Hayes, P. Controlled solidification of liquids within the SFC primary phase field of the “Fe2O3”-CaO-SiO2 system in air. Metall. Mater. Trans. B 2019, in press. [Google Scholar]
  16. Simmonds, T.; Hayes, P. Isothermal Oxidation of Magnetite to Hematite in Air and Cyclic Reduction/Oxidation Under Carbon Looping Combustion Conditions. Metall. Mater. Trans. E 2017, 4, 2–114. [Google Scholar] [CrossRef]
  17. Földvári, M. Handbook of Thermogravimetric System of Minerals and Its Use in Geological Practice; Geological Institute of Hungary: Budapest, Hungary, 2011; Volume 213. [Google Scholar]
  18. Wall, T.; Gururajan, V.; Lucas, J.; Gupta, R.; Dong-Ke, Z.; Smith, I.; Young, B.; Wall, T. The ignition, burning rate and reactivity of petroleum coke. Symp. (Int.) Combust. 1991, 23, 1177–1184. [Google Scholar] [CrossRef]
  19. Sebastian, J.; Mayers, M. Coke Reactivity Determination by a Modified Ignition Point Method. Ind. Eng. Chem. 1937, 29, 10–1118. [Google Scholar] [CrossRef]
  20. Umadevi, T.; Brahmacharyulu, A.; Sah, R.; Mahapatra, P.C. Influence of sinter grate suction pressure (flame front speed) on microstructure, productivity and quality of iron ore sinter. Ironmak. Steelmak. 2014, 41, 6–410. [Google Scholar] [CrossRef]
Figure 1. Zones within a downdraught sinter bed during sintering [2,3].
Minerals 09 00374 g001
Figure 2. Schematic of the sinter pot and a schematic image showing the initial position of the thermocouple and pO2 probe within the bed.
Minerals 09 00374 g002
Figure 3. Temperature and pO2 profile measured for the base case sinter pot test (14.7 kPa draft pressure, 36 kgcoke/tfeed) as a function of (a) time and (b) cumulative offgas volume.
Minerals 09 00374 g003
Figure 4. Temperature and pO2 profiles measured for (a,b) low coke (14.7 kPa draft pressure, 33 kgcoke/tfeed) and (c,d) high coke (14.7 kPa draft pressure, 39 kgcoke/tfeed) additions.
Minerals 09 00374 g004
Figure 5. Temperature and pO2 profile measured for (a,b) low draft pressure (12.7 kPa draft pressure, 36 kgcoke/tfeed) and (c,d) high draft pressure (16.7 kPa draft pressure, 36 kgcoke/tfeed).
Minerals 09 00374 g005
Figure 6. Proportions of phases in the sinter product as determined by semi-quantitative X-Ray Diffraction (XRD).
Minerals 09 00374 g006
Figure 7. Proportions of phases in the sinter fines as determined by semi-quantitative XRD.
Minerals 09 00374 g007
Figure 8. Optical photographs of "as received" iron ore sinters, (a) porous sinter lump, (b) dense sinter lump.
Minerals 09 00374 g008
Figure 9. Polished cross section of an industrial sinter (Light Optical Microscope) (H—Hematite, P—Pores, Mx—Fine Multi-phase matrix material).
Minerals 09 00374 g009
Figure 10. Examples of iron oxide structures in industrial sinter lumps, (a) a mixed hematite-magnetite microstructure, (b) fine grained hematite. (H—Hematite, M—Magnetite) (Back scattered electron images (BSE)).
Minerals 09 00374 g010
Figure 11. Microstructures of the hematite phase associations, (a) equiaxed hematite in a glassy low Ca/SiO matrix, (b) angular hematite dendrites surrounded by a partially crystallised matrix (BSE) (H—Hematite, L—Liquid, C—C2S).
Minerals 09 00374 g011
Figure 12. Microstructures of the silico ferrite of calcium and aluminium (SFCA) and magnetite phase associations, (a) plate-like SFCA, (b) blocky SFCA. (BSE)(S—SFCA, M—Magnetite).
Minerals 09 00374 g012
Figure 13. Examples of the heterogeneous structure of the sinter materials showing diffuse transition between macrostructures (G—Glass, H—Hematite, M—Magnetite, S—SFCA) (BSE image).
Minerals 09 00374 g013
Figure 14. Examples of the heterogeneous structure of the sinter materials, (a) hematite present close to the pore or surface, and (b) interface between regions containing (SFCAM + magnetite+liquid) and (magnetite + liquid) (S—SFCA, M—Magnetite, H—Hematite) (BSE images).
Minerals 09 00374 g014
Figure 15. SFCA composition, as measured by EPMA, projected onto the “Fe2O3”–CaO–SiO2 ternary system [12] assuming the Al2O3 → Fe2O3 and MgO → CaO exchange consistent with the formation of CF3-C4S3 solid solution (X-SFCA composition).
Minerals 09 00374 g015
Figure 16. (a,b) The Gibbs free energy change for the reduction of hematite to magnetite based on the measured temperature and pressure within the sinterpot. (c,d) The temperature as a function of time measured at the midpoint within the sinterpot.
Minerals 09 00374 g016
Figure 17. The calculated oxygen pressures for equilibrium between hematite to magnetite phases of selected compositions.
Minerals 09 00374 g017
Figure 18. Variation in the proportion of phases present in the base case with temperature.
Minerals 09 00374 g018
Figure 19. Variation in liquid composition with temperature for the base case assuming chemical equilibrium is achieved.
Minerals 09 00374 g019
Figure 20. Magnetite and hematite microstructures formed when magnetite is cooled in air from 1673 K to 1073 K at 2 K/s in air (88 wt % Fe2O3 and a CaO/SiO2 ratio of 3.46 wt/wt).
Minerals 09 00374 g020
Figure 21. Magnetite and associated microstructures observed from magnetite formed at 1400 °C in air (94.33 wt % Fe2O3 and a CaO/SiO2 ratio of 5.32 wt/wt) (M—Magnetite) (BSE Micrograph).
Minerals 09 00374 g021
Figure 22. Example of dense hematite and associated microstructures observed from magnetite formed at 1400 °C and reheated in air at 1200 °C for 4 min (94.33 wt % Fe2O3 and a CaO/SiO2 ratio of 5.32 wt/wt) (BSE Micrograph).
Minerals 09 00374 g022
Figure 23. Examples of fine hematite and lath structures observed from magnetite reheated in air at 1100 °C for 4 minutes (94.33 wt % Fe2O3 and a CaO/SiO2 ratio of 5.32 wt/wt) (BSE Micrograph).
Minerals 09 00374 g023
Figure 24. Schematic of liquid-facilitated magnetite oxidation (a) dense hematite on magnetite with calcium rejection into the melt, (b) porous hematite on magnetite, (c) isolated hematite and magnetite and (d) dense hematite on magnetite with calcium rejection into the magnetite.
Minerals 09 00374 g024
Figure 25. Schematic of solid state oxidation, (a) coupled growth of hematite and a calcium ferrite and (b) rejection of Ca2+ into the centre of the secondary hematite leading to the formation of a calcium ferrite.
Minerals 09 00374 g025
Table 1. Compositions of sinters (wt %) and process conditions tested.
Sintering ParameterBase CaseLow CokeHigh CokeLow DraftHigh Draft
Draft Pressure drop (kPa)14.714.714.712.716.7
Coke (kg/t feed)3633393633
Coke breeze size (mm)1.5–1.81.5–1.81.5–1.81.5–1.81.5–1.8
Sinter Returns (wt %)18.018.018.018.018.0
Moisture (wt %)7.27.27.27.17.2
Sinter Feed Size (mm)2.62.62.82.72.6
Goethite in feed (wt %)2020202020
Hematite in feed (wt %)4040404040
Magnetite in feed (wt %)6–86–86–86–86–8
Flame Front Speed (mm/min)23.918.522.819.724.2
Sinter Yield (wt %)80.178.382.480.180.2
Mean Sinter Lump Size (mm)24.226.124.626.523.5
Sinter Composition
SiO2 (wt %)4.64.64.84.74.5
Al2O3 (wt %)1.71.71.81.61.6
CaO (wt %)7.77.97.98.27.9
MgO (wt %)1.21.31.31.31.3
FeO (wt %)9.08.110.39.69.2
Total Fe (wt %)59.859.659.659.559.9
CaO/SiO2 (wt/wt)1.661.701.651.751.75
Gas composition
O2 (vol. %)13.5411.5111.5513.7013.28
CO (vol. %)0.250.510.590.350.30
CO2 (vol. %)2.424.514.503.592.47
H2O (vol. %)19.7320.0020.0017.1320.00
CO/CO2 (vol./vol.)0.100.110.130.100.12
Table 2. Measured phase compositions (electron probe X-ray microanalysis; EPMA).
PhaseComposition (wt %)
“Fe2O3SiO2CaOAl2O3MgOMnO
Hematite197.80.00.21.90.10.0
298.60.20.70.50.00.0
398.80.00.01.10.10.0
498.90.00.20.80.00.1
598.90.00.01.10.00.0
699.00.00.10.90.00.0
Average98.70.00.21.10.00.0
Magnetite190.60.00.81.76.50.4
292.20.01.11.05.10.6
392.30.01.31.14.80.5
492.40.02.81.52.90.4
593.00.01.62.03.10.3
693.00.01.41.04.40.2
793.60.02.31.02.90.2
894.10.01.91.12.60.3
994.10.01.80.83.00.3
1094.80.02.00.92.00.3
1195.70.00.90.62.50.3
Average93.30.01.61.23.60.3
SFCA165.58.814.67.83.00.2
265.69.014.97.62.80.1
366.68.214.38.32.40.1
466.98.416.58.10.00.0
567.08.315.78.90.00.0
667.28.116.18.60.10.0
767.38.914.46.03.00.4
867.59.114.75.82.80.1
967.59.114.66.62.00.2
1070.97.915.44.61.00.2
1171.47.314.46.10.80.0
1271.67.715.24.31.00.2
1371.97.515.34.60.60.1
1472.07.815.03.91.10.2
1572.28.014.54.11.10.1
1672.38.014.44.01.20.1
1772.87.316.23.20.40.1
1873.07.415.23.80.60.1
1973.17.815.03.60.50.1
2073.27.715.43.10.60.0
2173.36.814.74.40.70.1
2273.37.214.63.90.90.1
2373.66.915.53.80.20.1
2473.67.415.13.00.70.2
2573.67.515.03.10.60.1
2673.86.516.03.10.50.1
2773.97.615.02.80.70.1
2874.26.715.23.30.40.1
2974.37.114.53.30.70.1
3074.36.415.23.40.50.1
3175.26.314.72.81.00.0
3275.36.214.13.90.50.0
3375.45.415.53.40.30.1
3475.75.614.33.31.00.1
3576.25.614.03.70.50.0
3676.75.613.53.20.80.1
3777.45.412.83.21.00.2
3877.85.412.42.61.70.1
3978.24.913.22.80.80.1
4079.33.712.43.51.10.1
4179.34.812.12.90.90.0
4280.63.511.33.01.50.3
4383.02.510.42.41.60.1
4483.12.29.83.01.60.3
4583.72.29.82.71.50.2
Average73.66.714.34.31.00.1
Liquid116.036.044.33.60.10.1
216.935.741.55.30.60.1
317.437.642.22.50.30.0
418.139.937.44.20.30.0
518.635.043.71.90.80.0
618.736.939.74.60.10.0
Average17.636.841.53.70.40.0

