Zircon at the Nanoscale Records Metasomatic Processes Leading to Large Magmatic–Hydrothermal Ore Systems

 , , , ,
Abstract
:1. Introduction
2. Background and Rationale
2.1. Zircon Chemistry and Structure
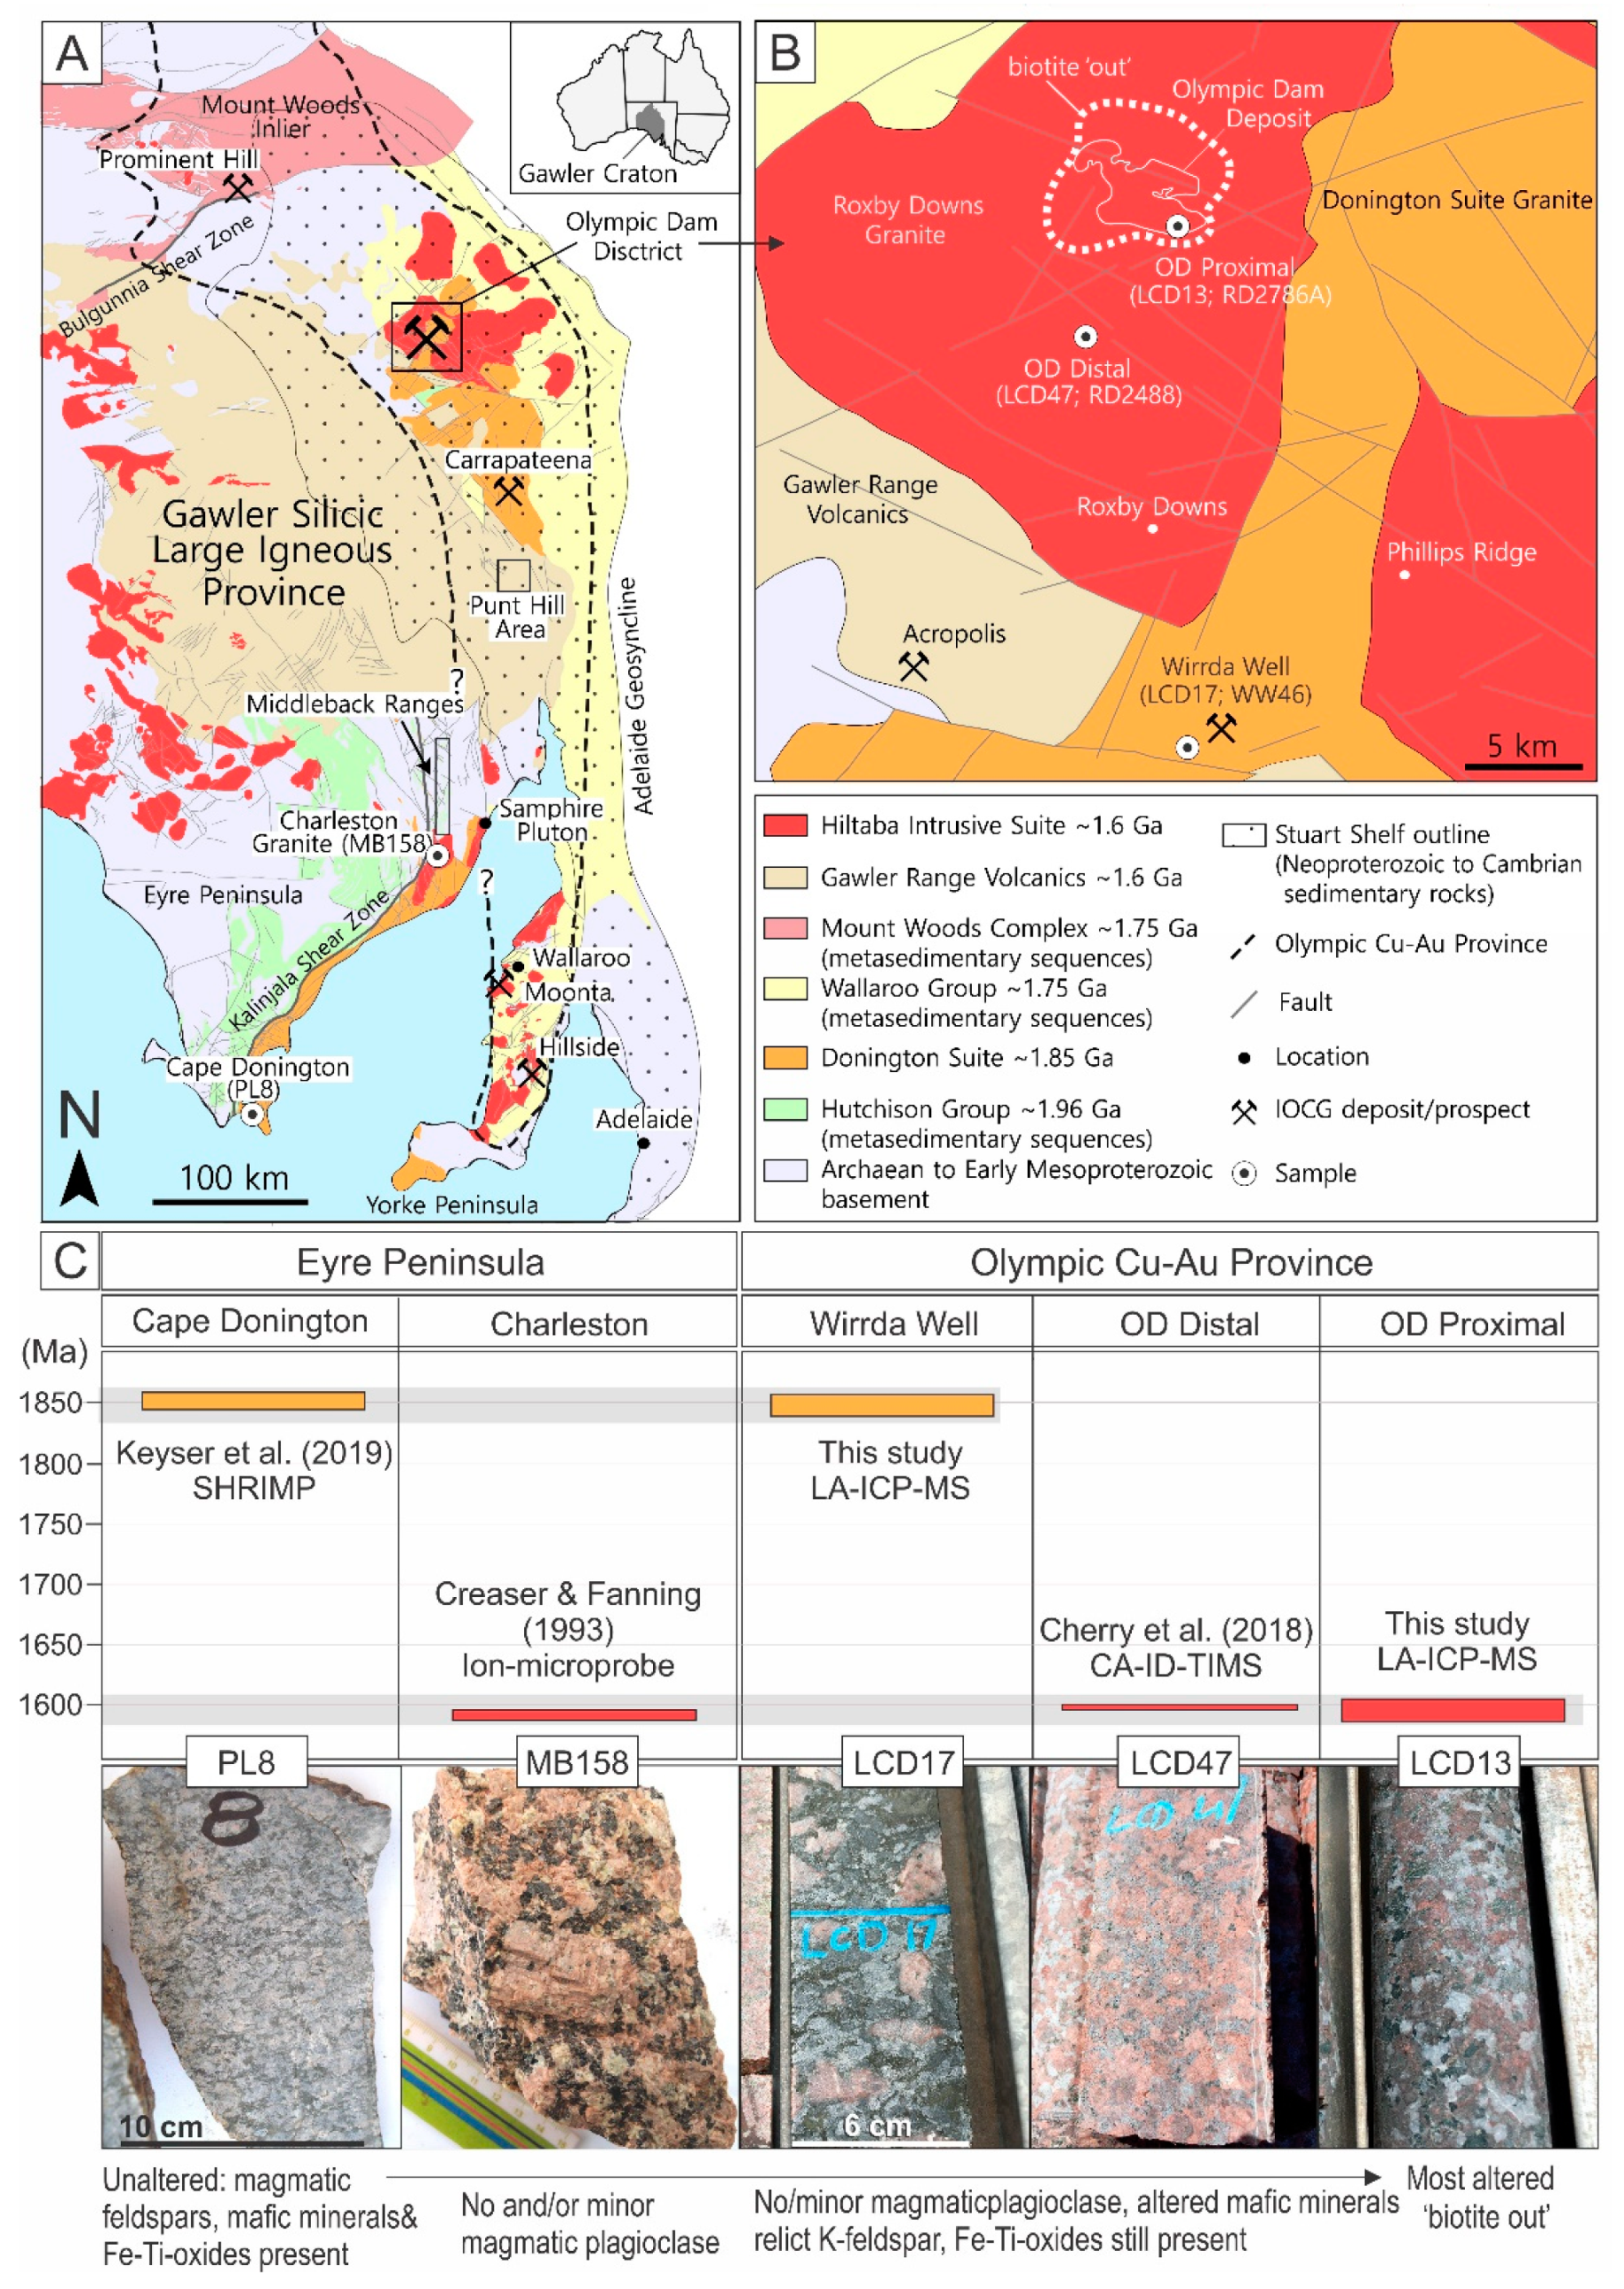
2.2. The Olympic Cu–Au Province
3. Sample Suite
4. Methodology
5. Results
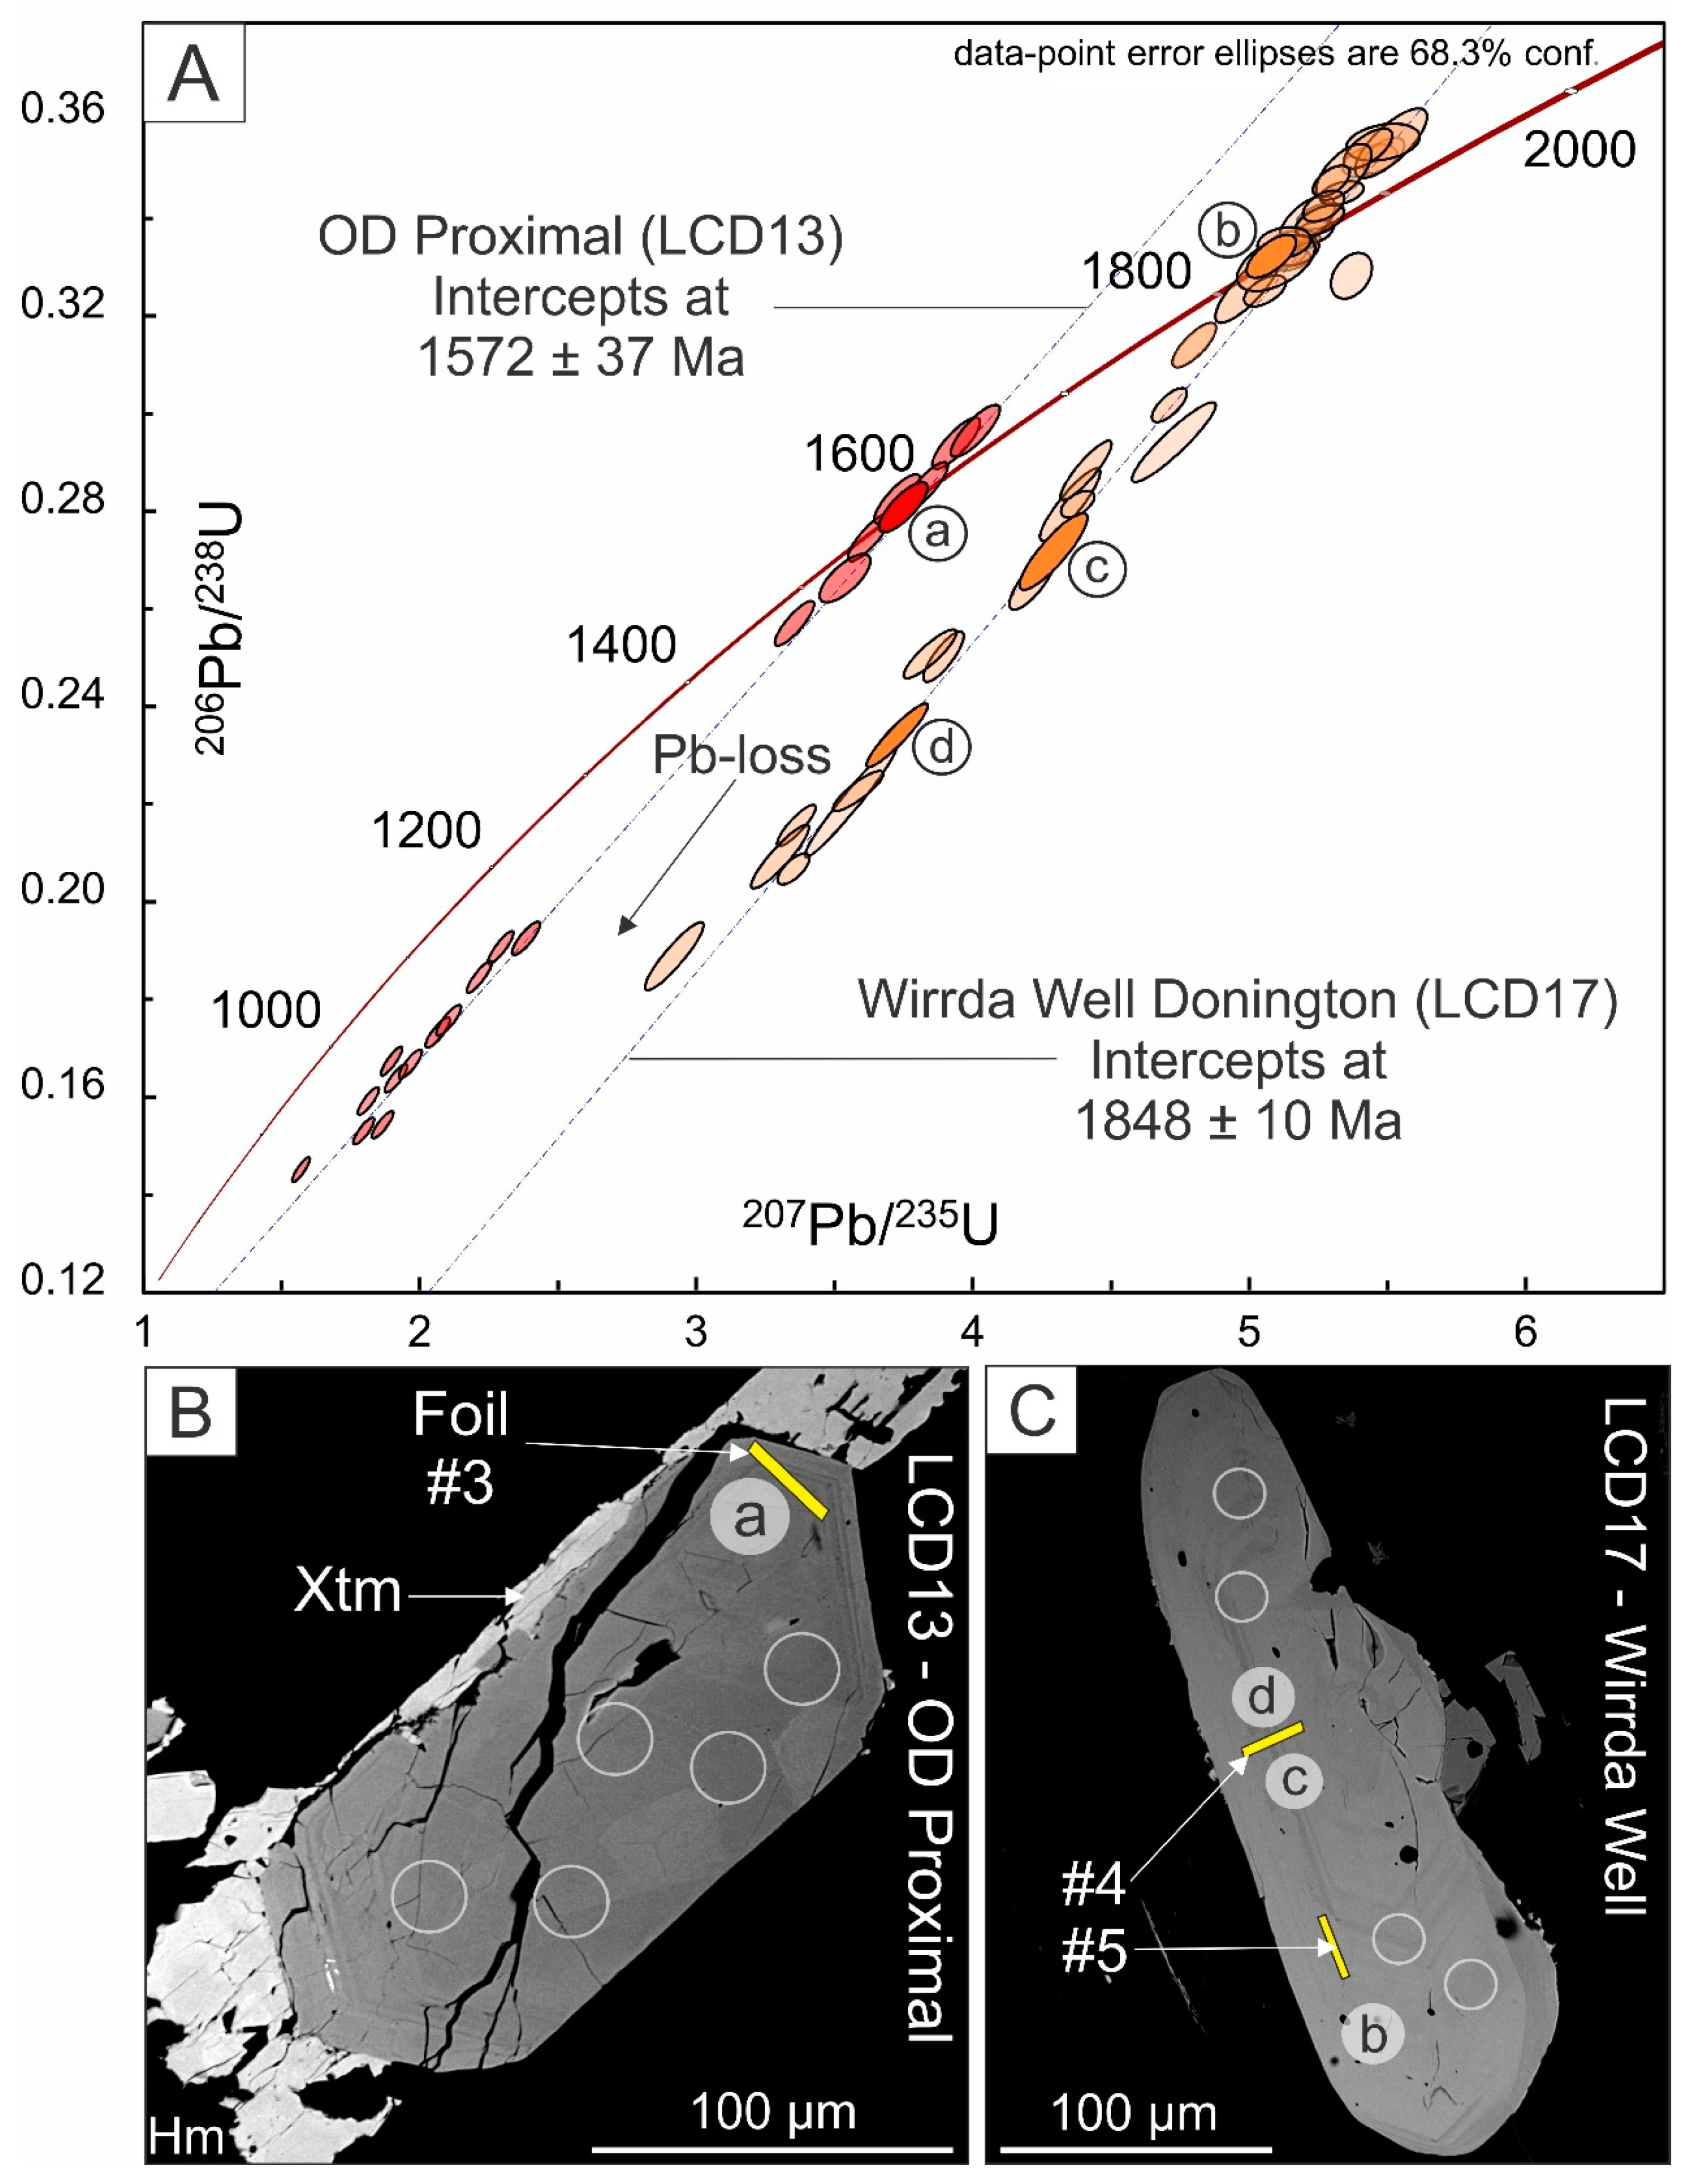
5.1. Zircon Petrography, U–Pb Dating, and Selection of Grains for Nanoscale Study
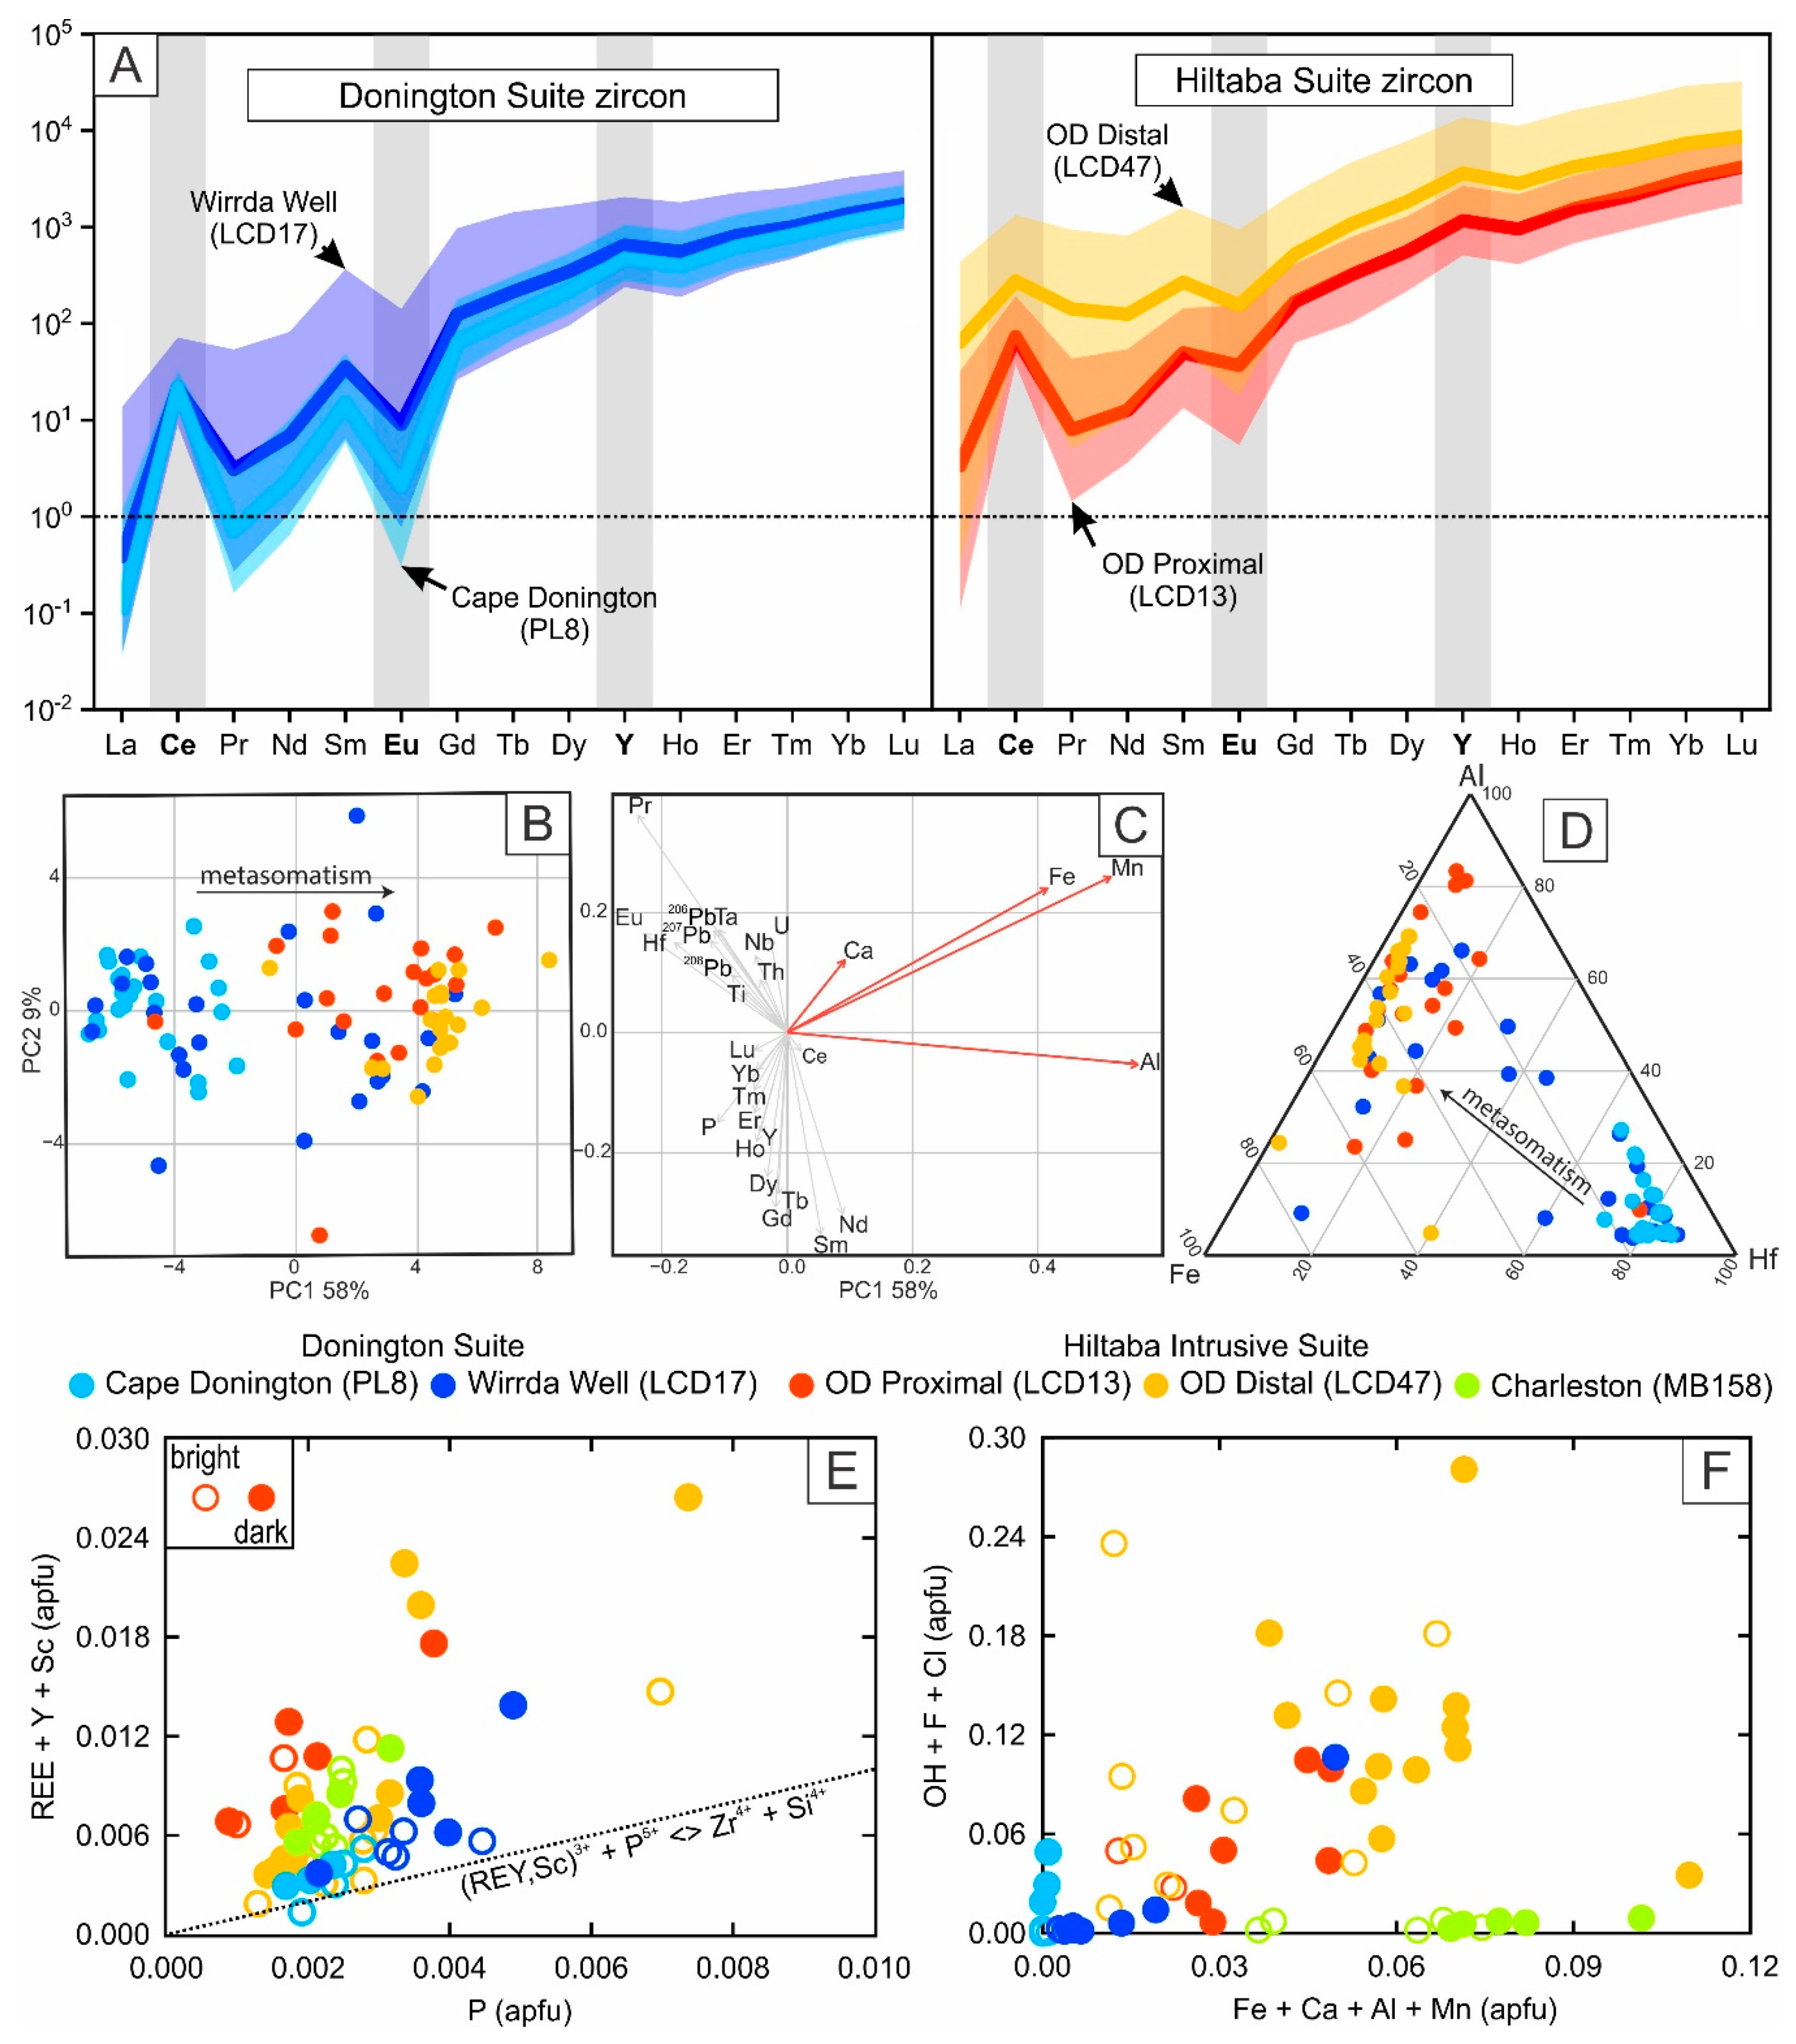
5.2. Trace and Minor Element Concentrations
5.3. Assessment of Zircon Stoichiometry and Substitution Model
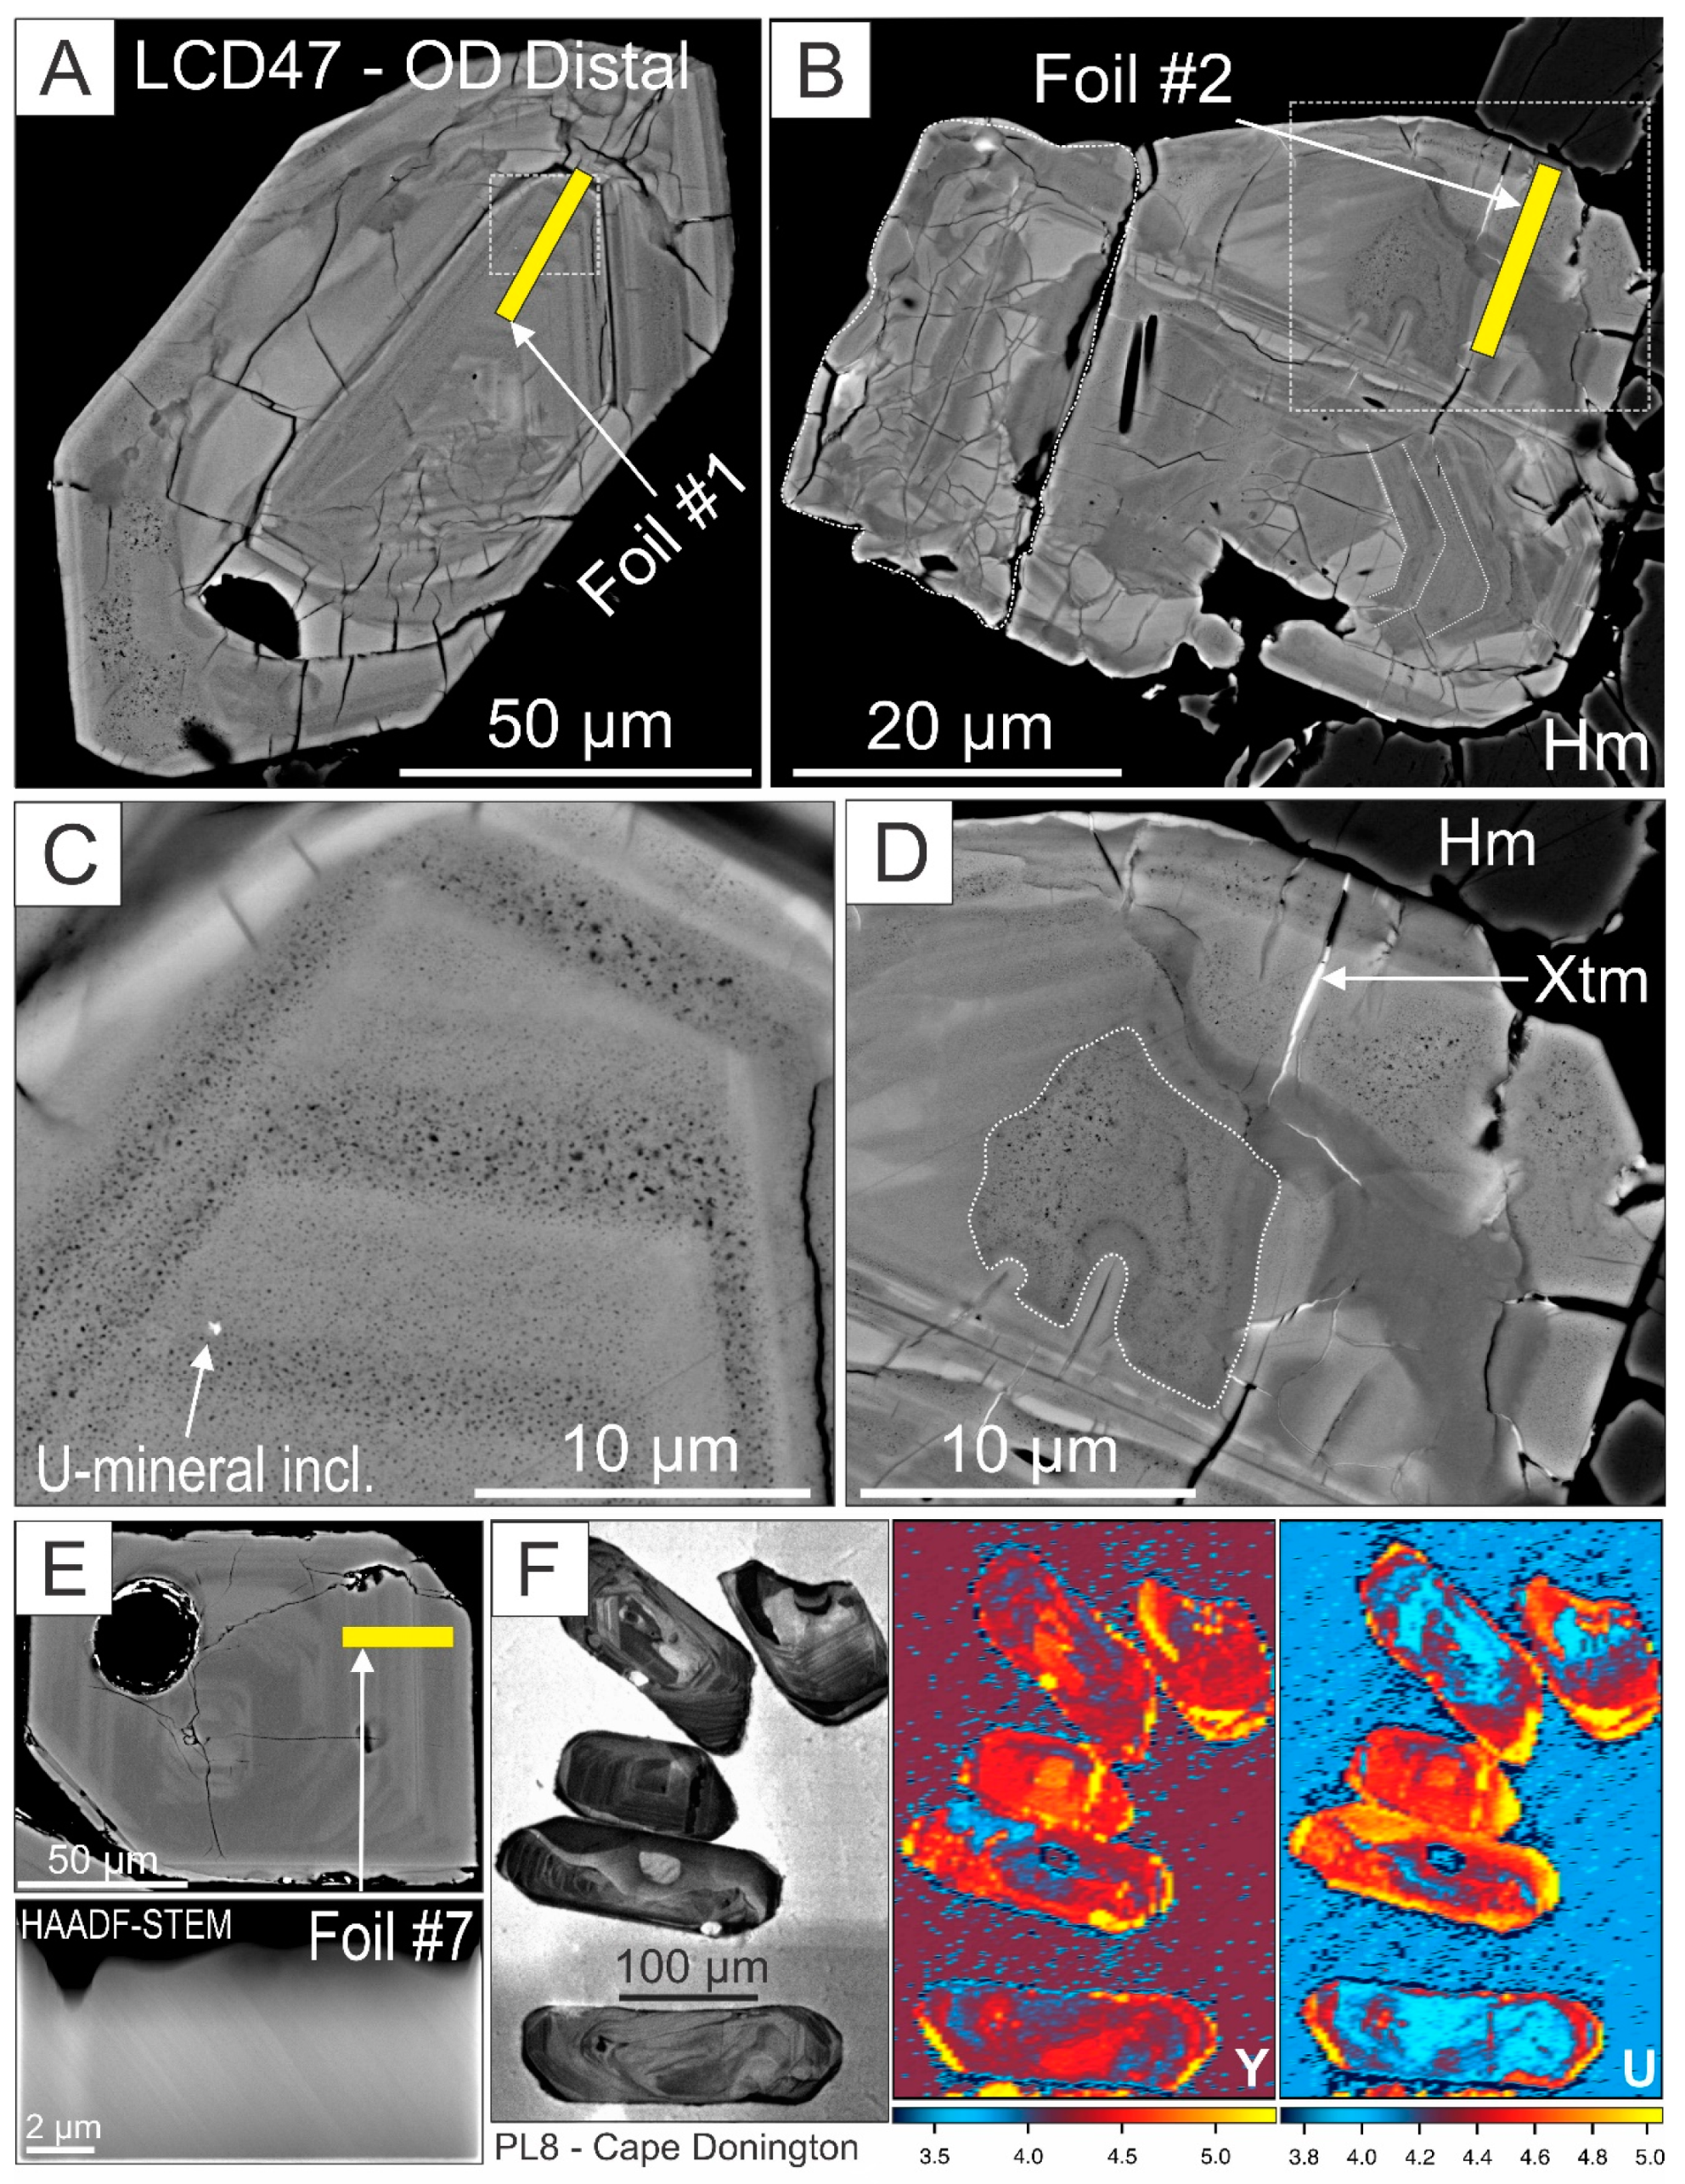
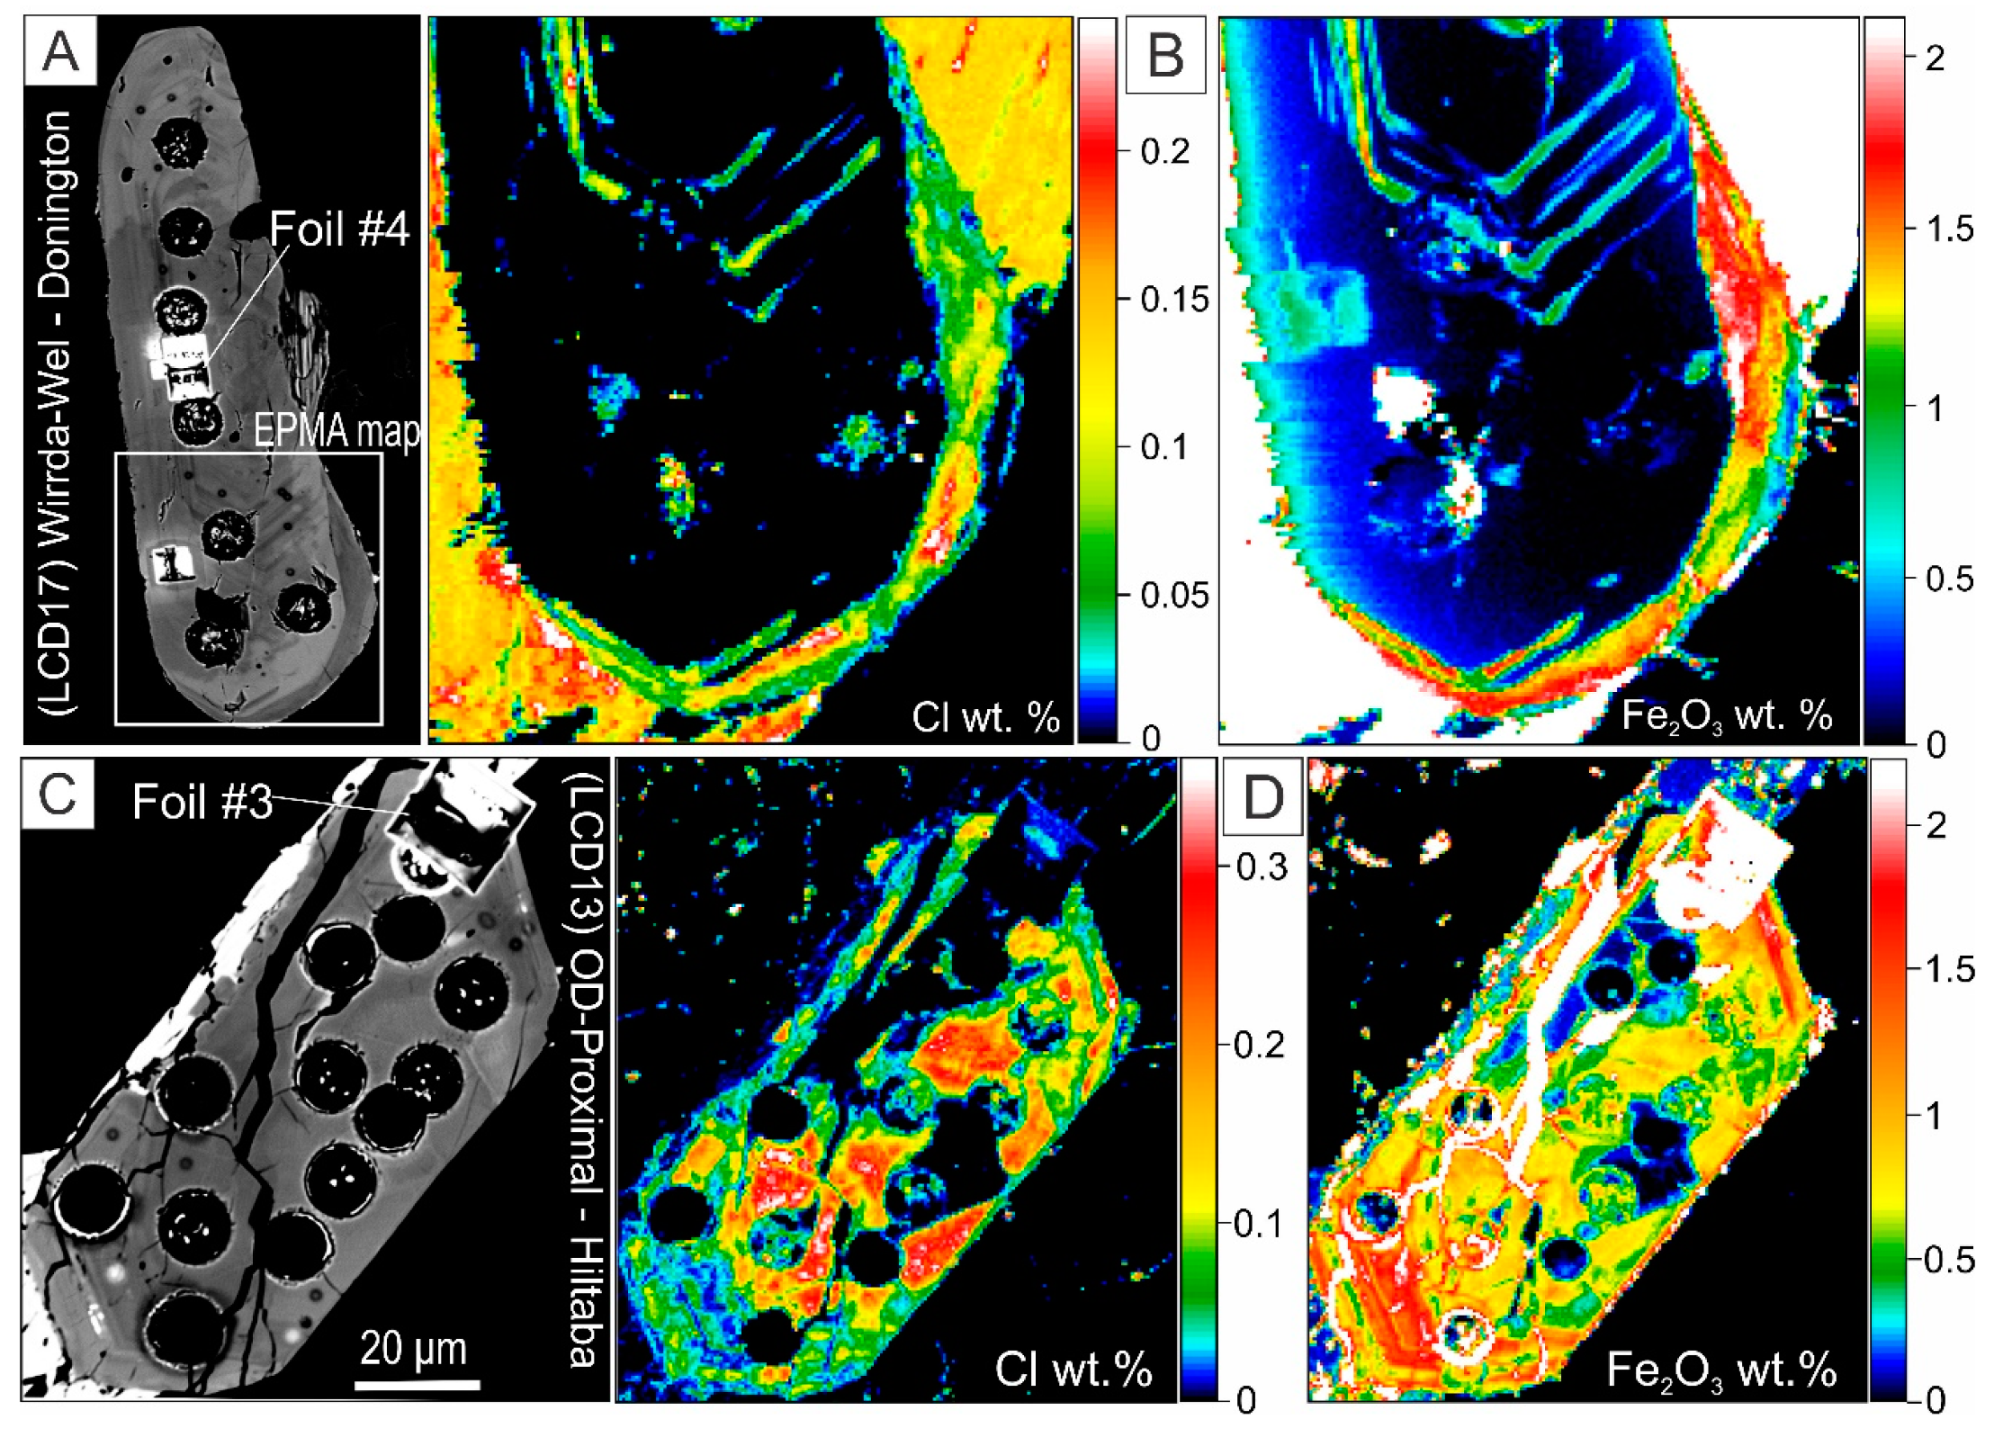
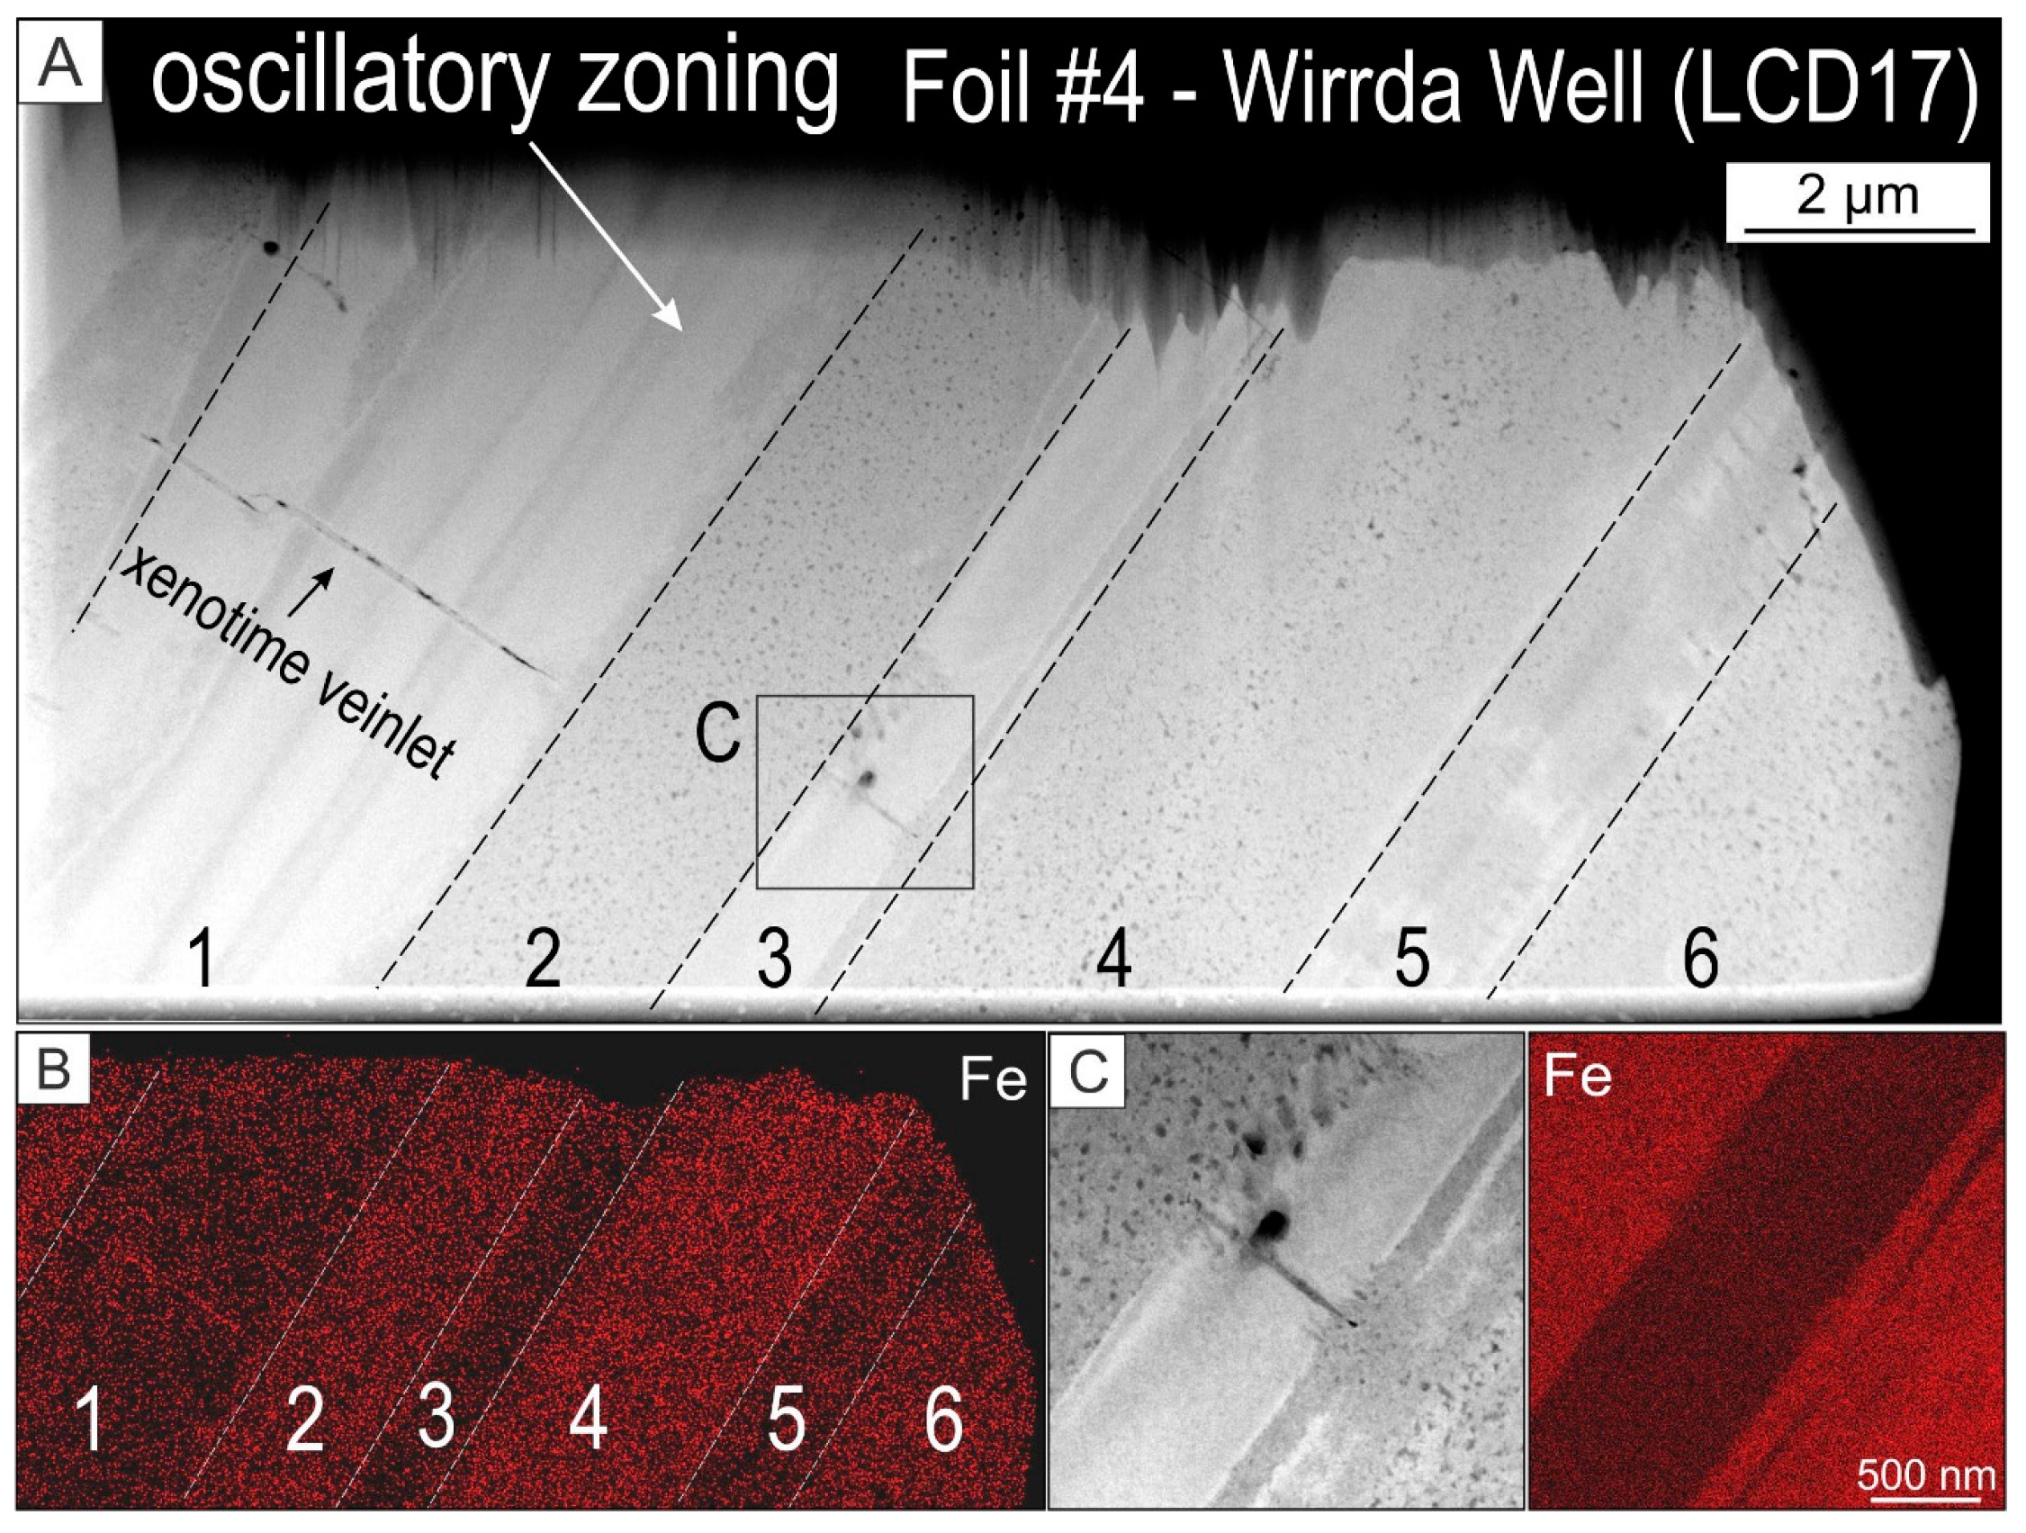
5.4. Distribution of Minor Elements: Micron- to Nanoscale Patterns
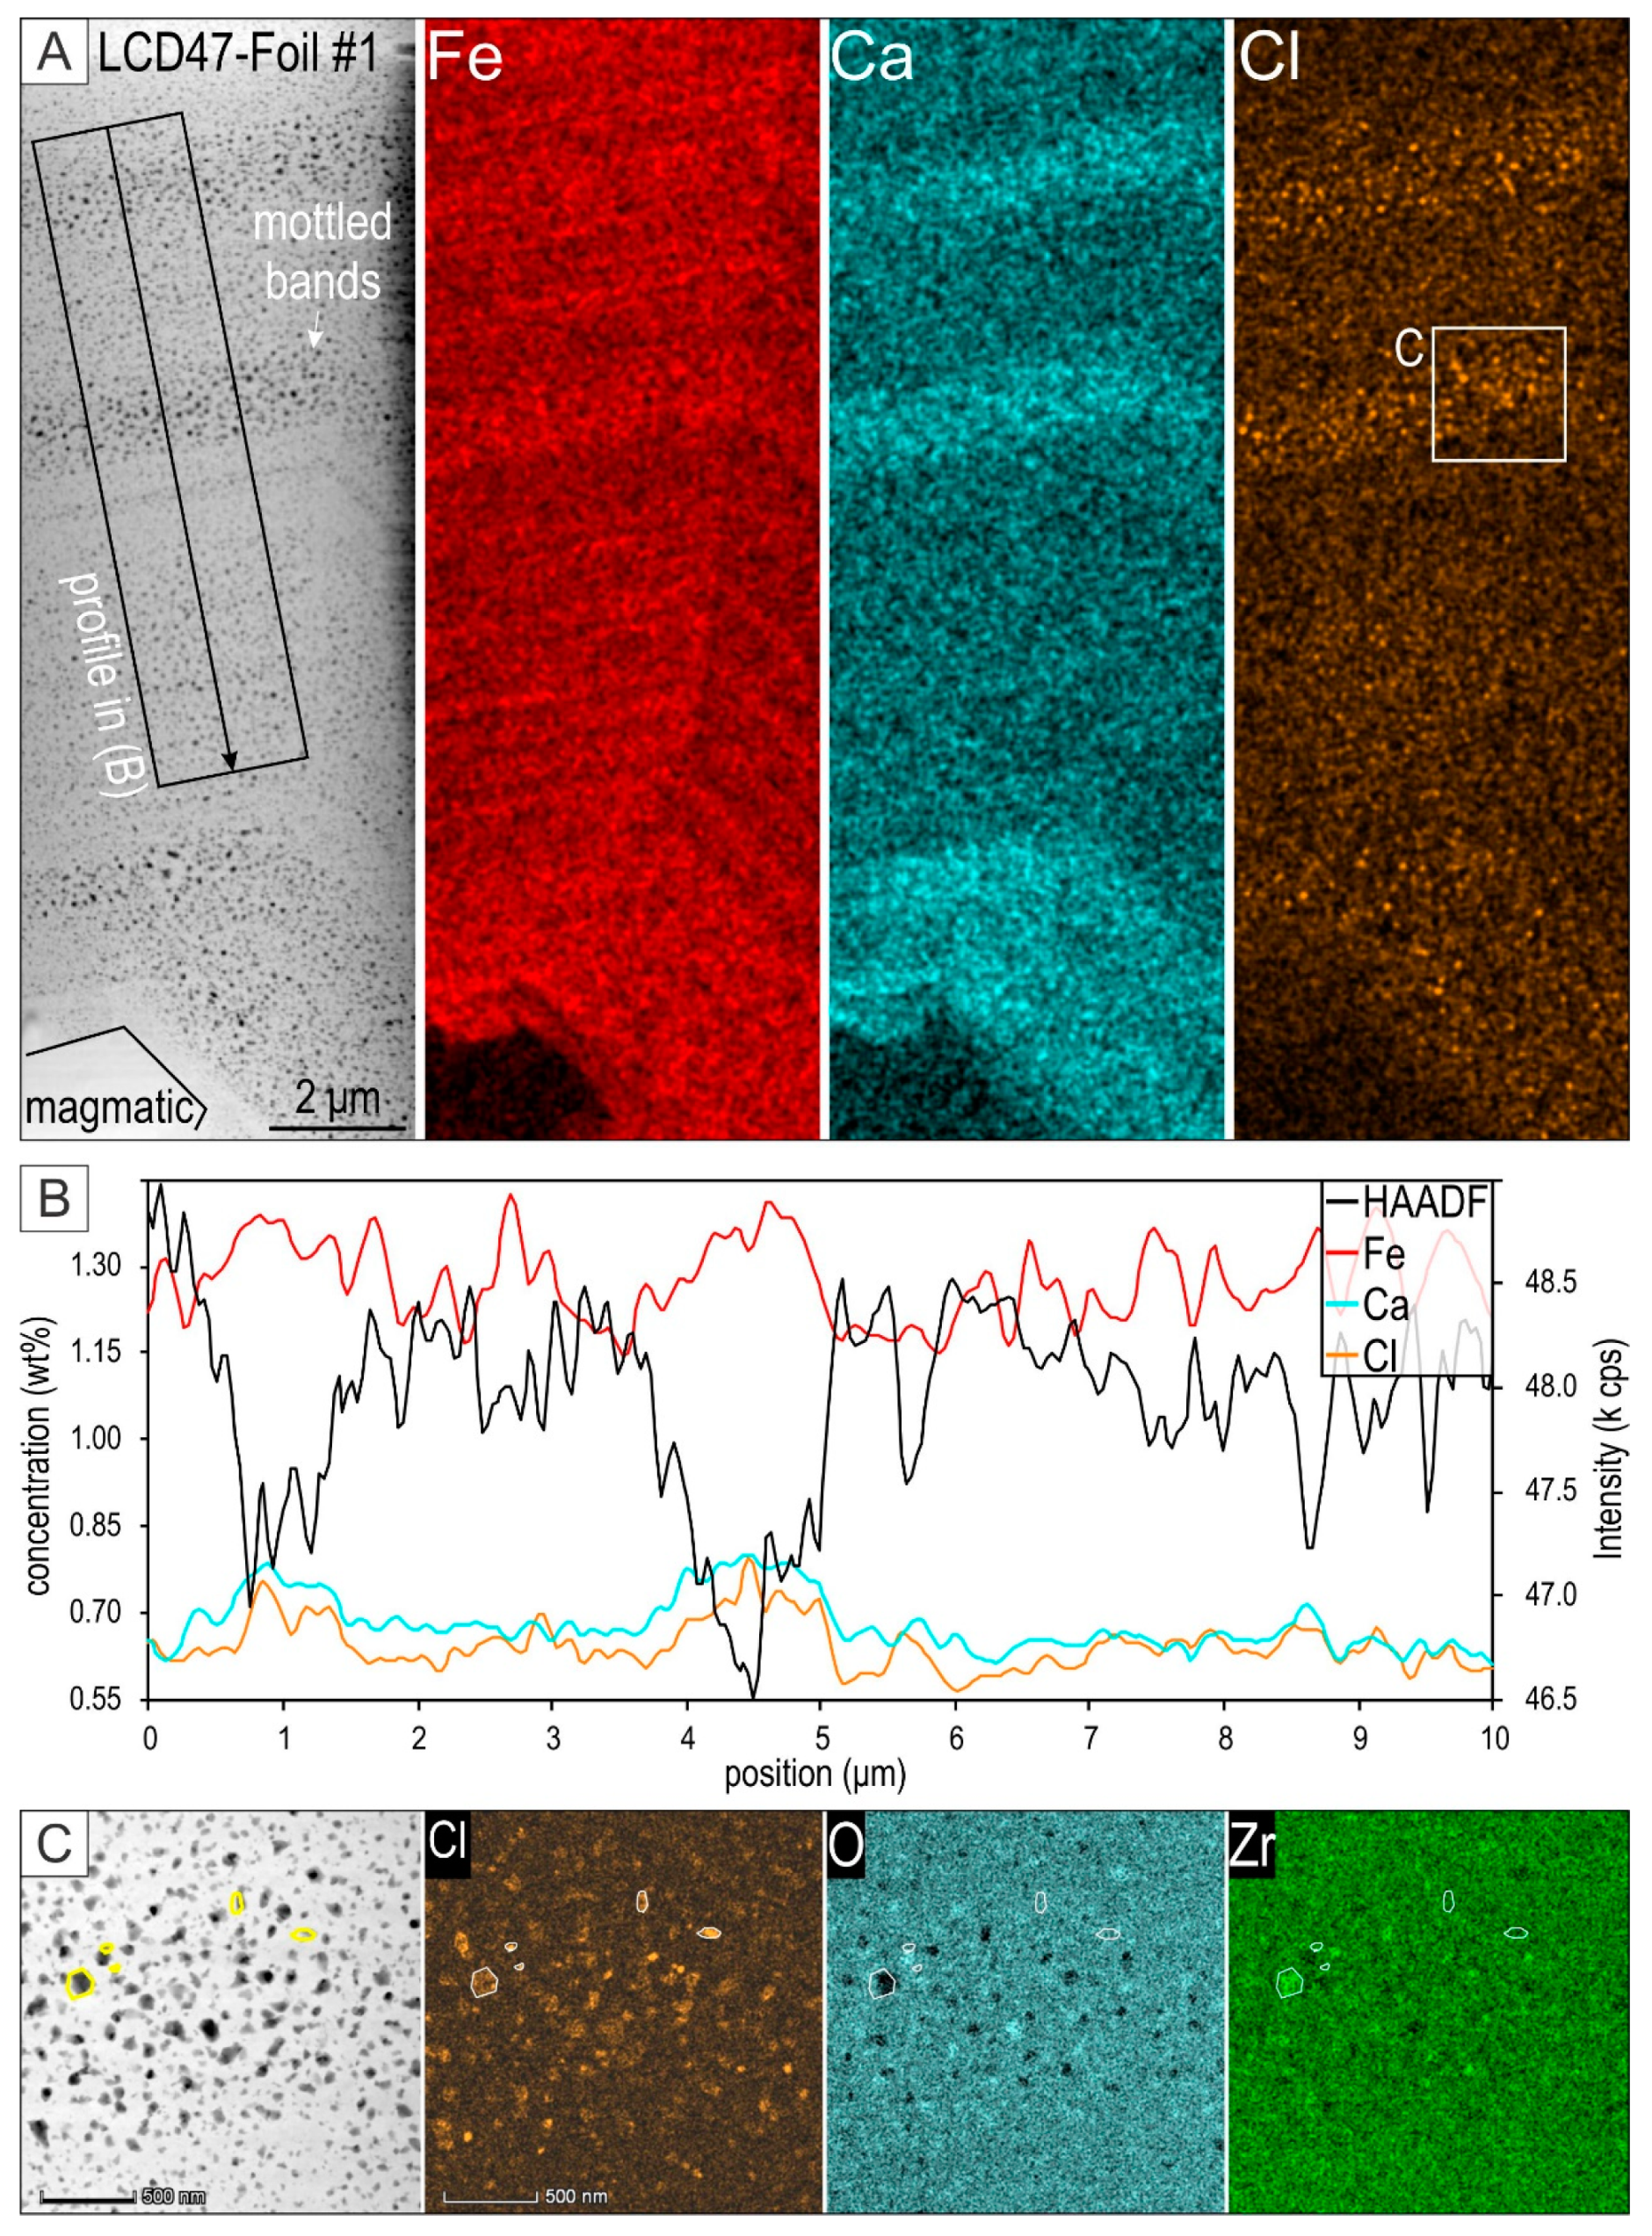
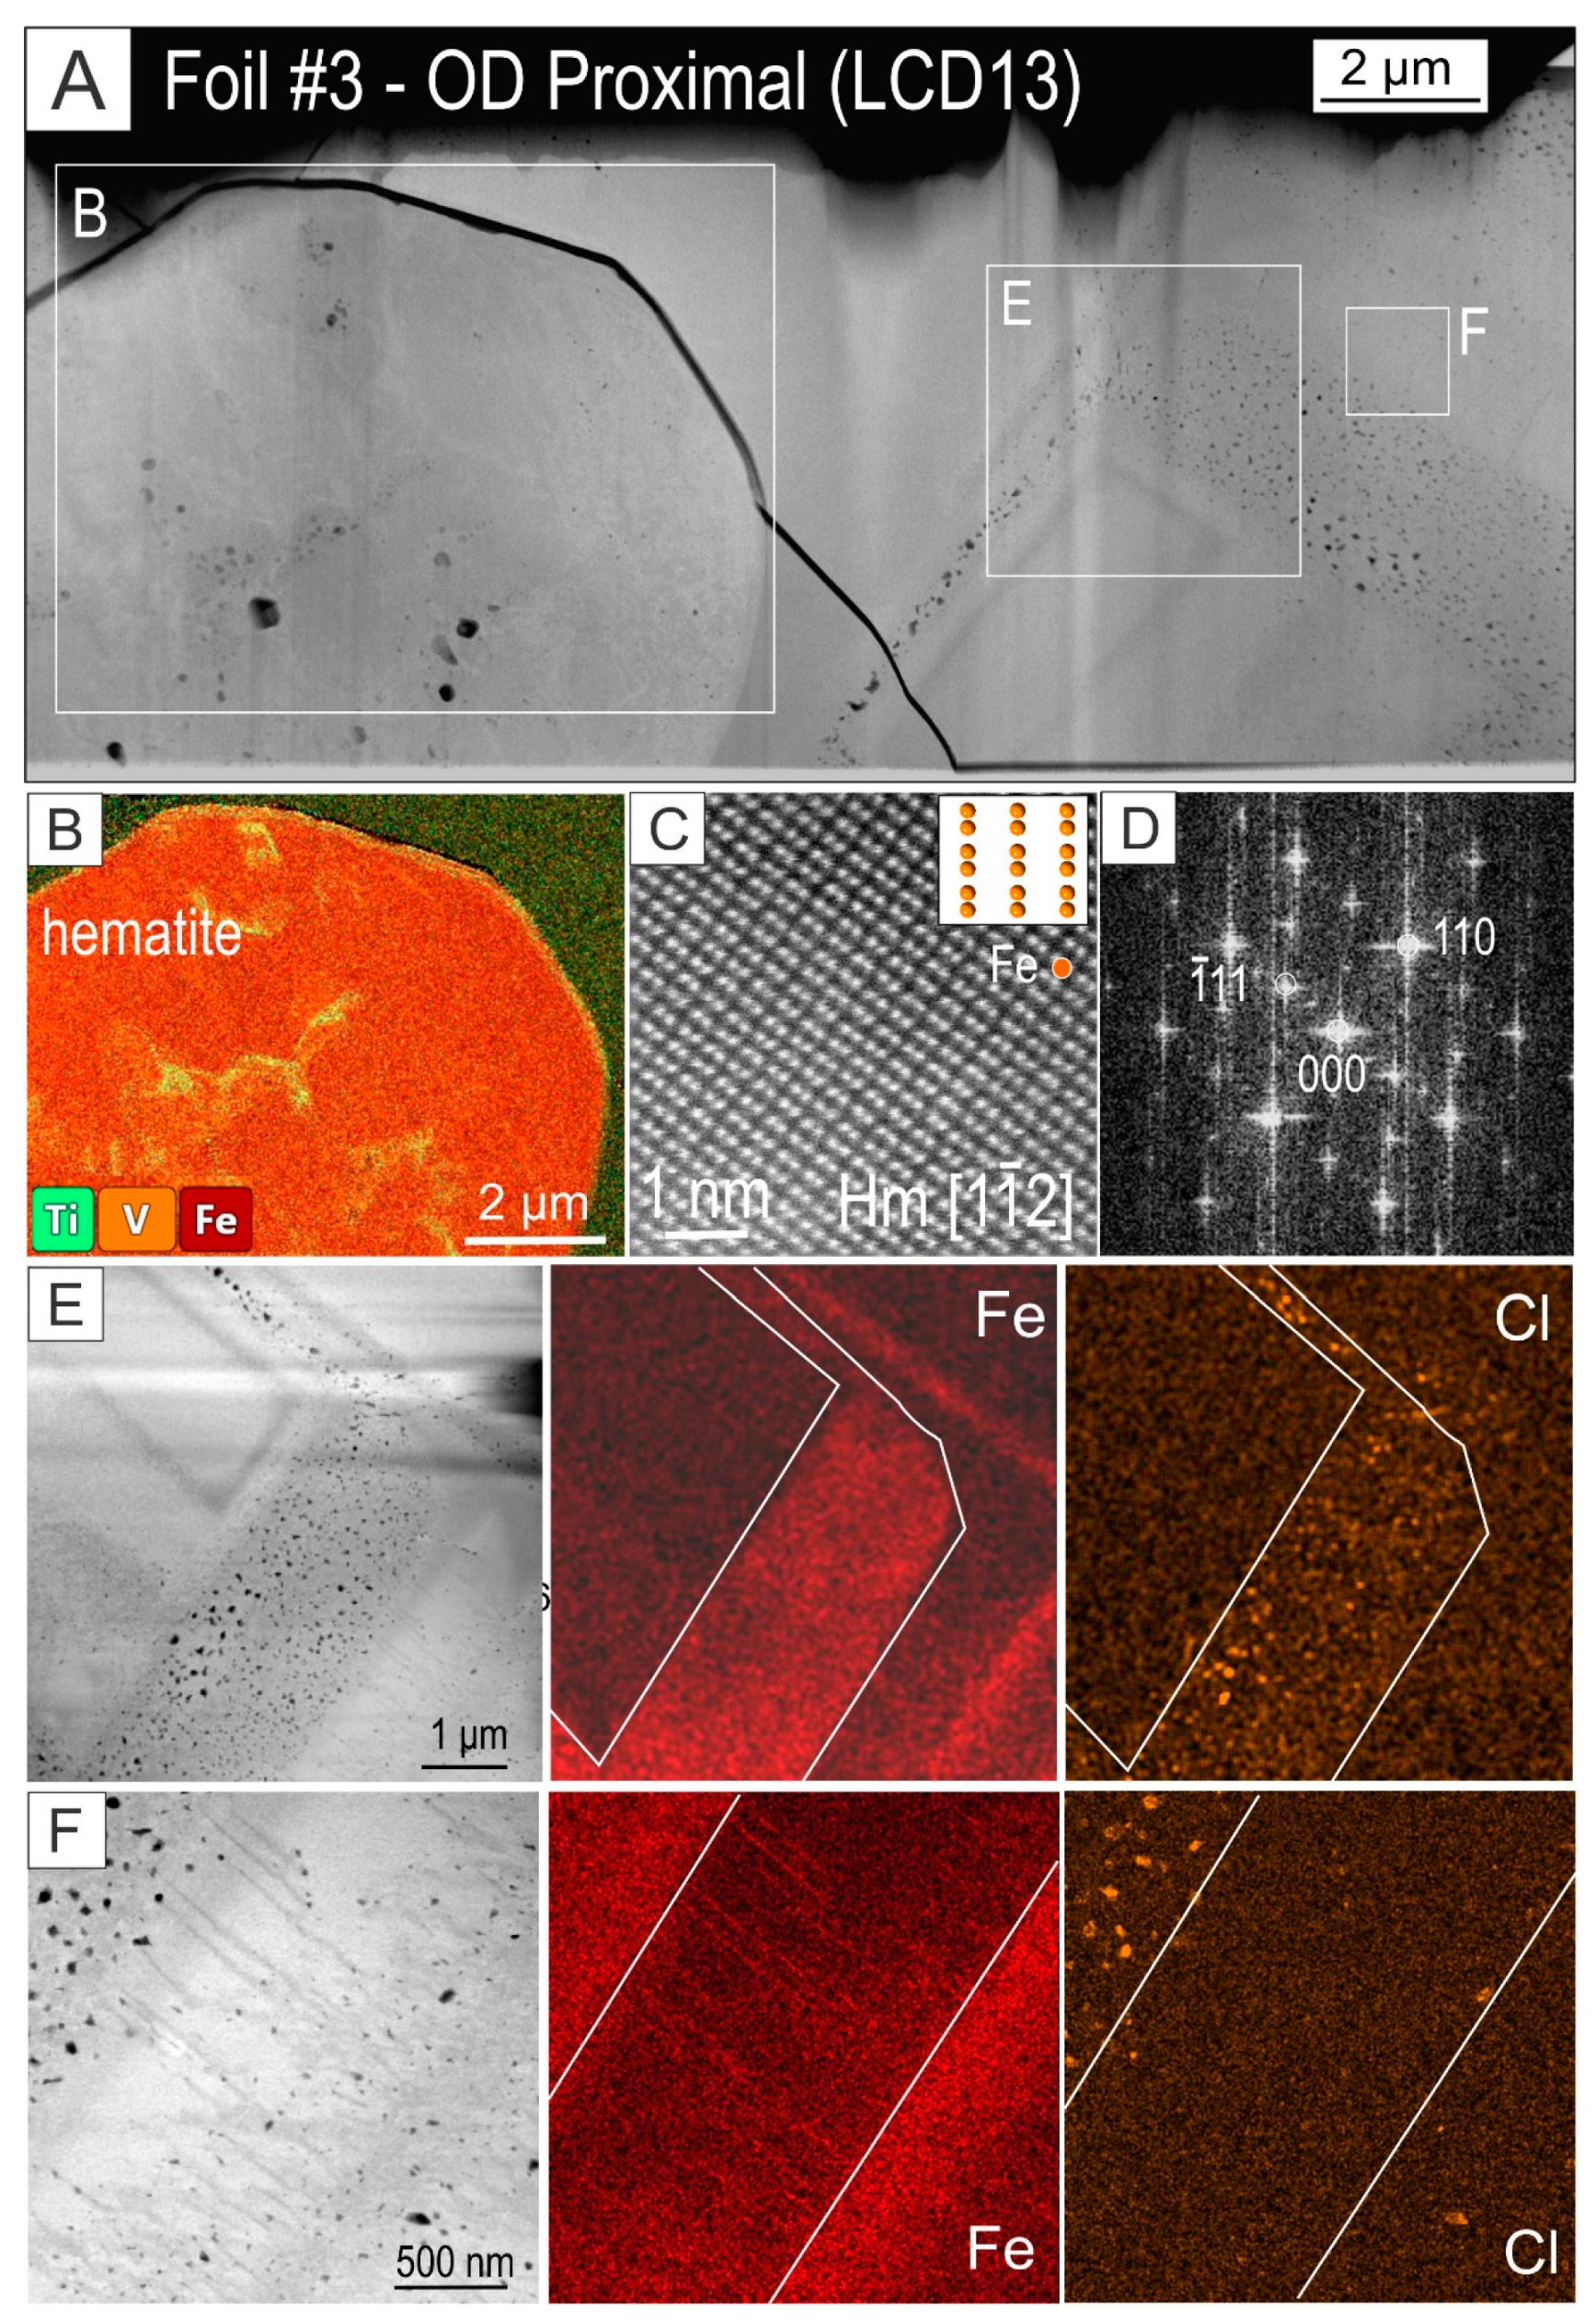
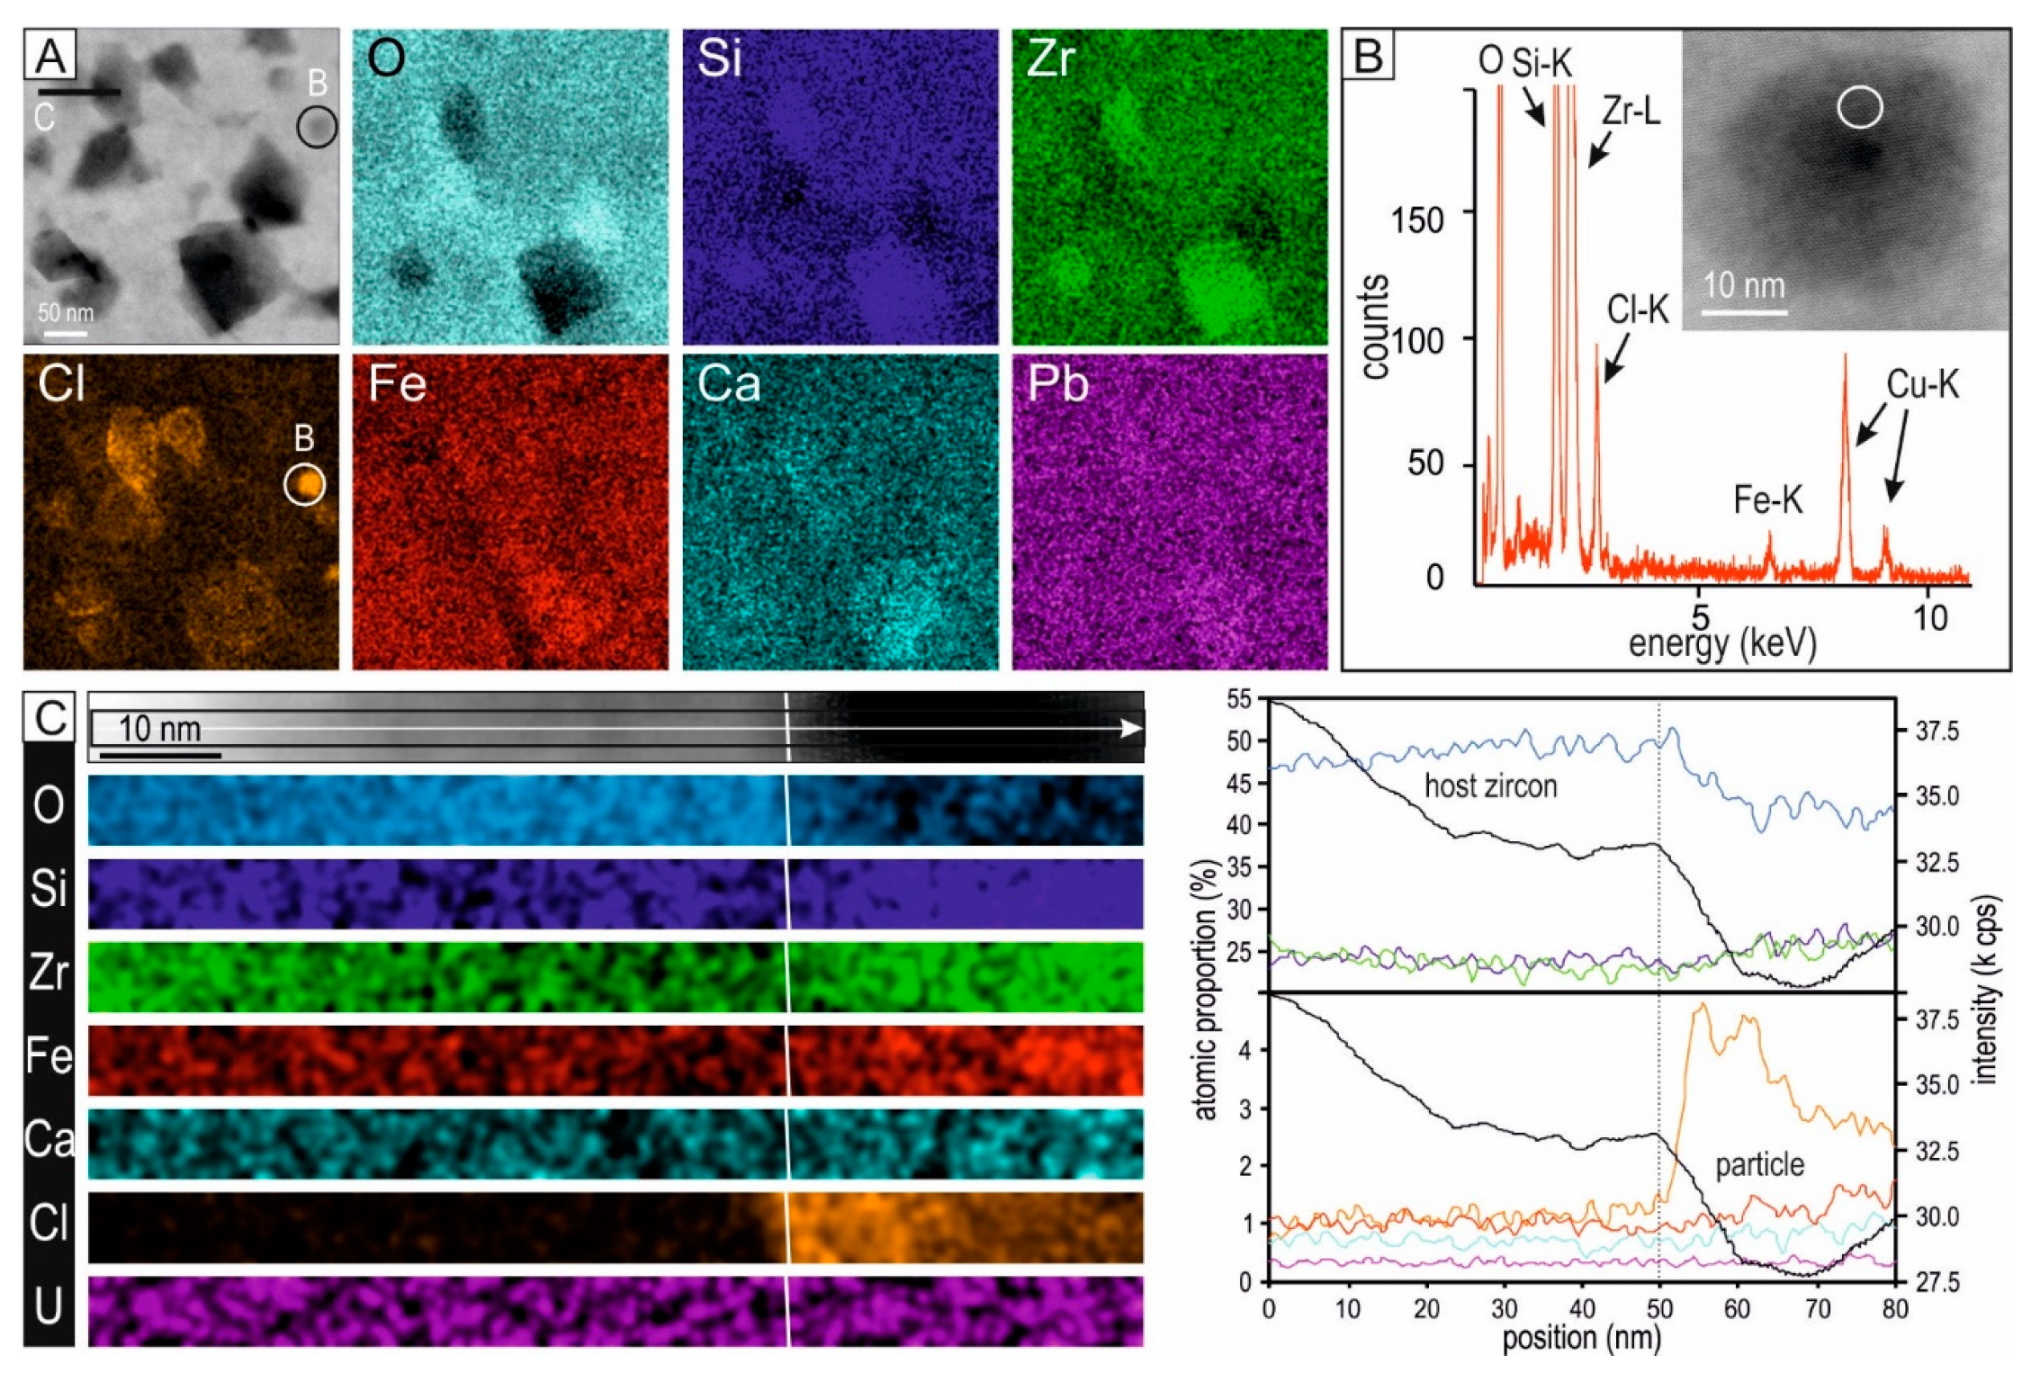
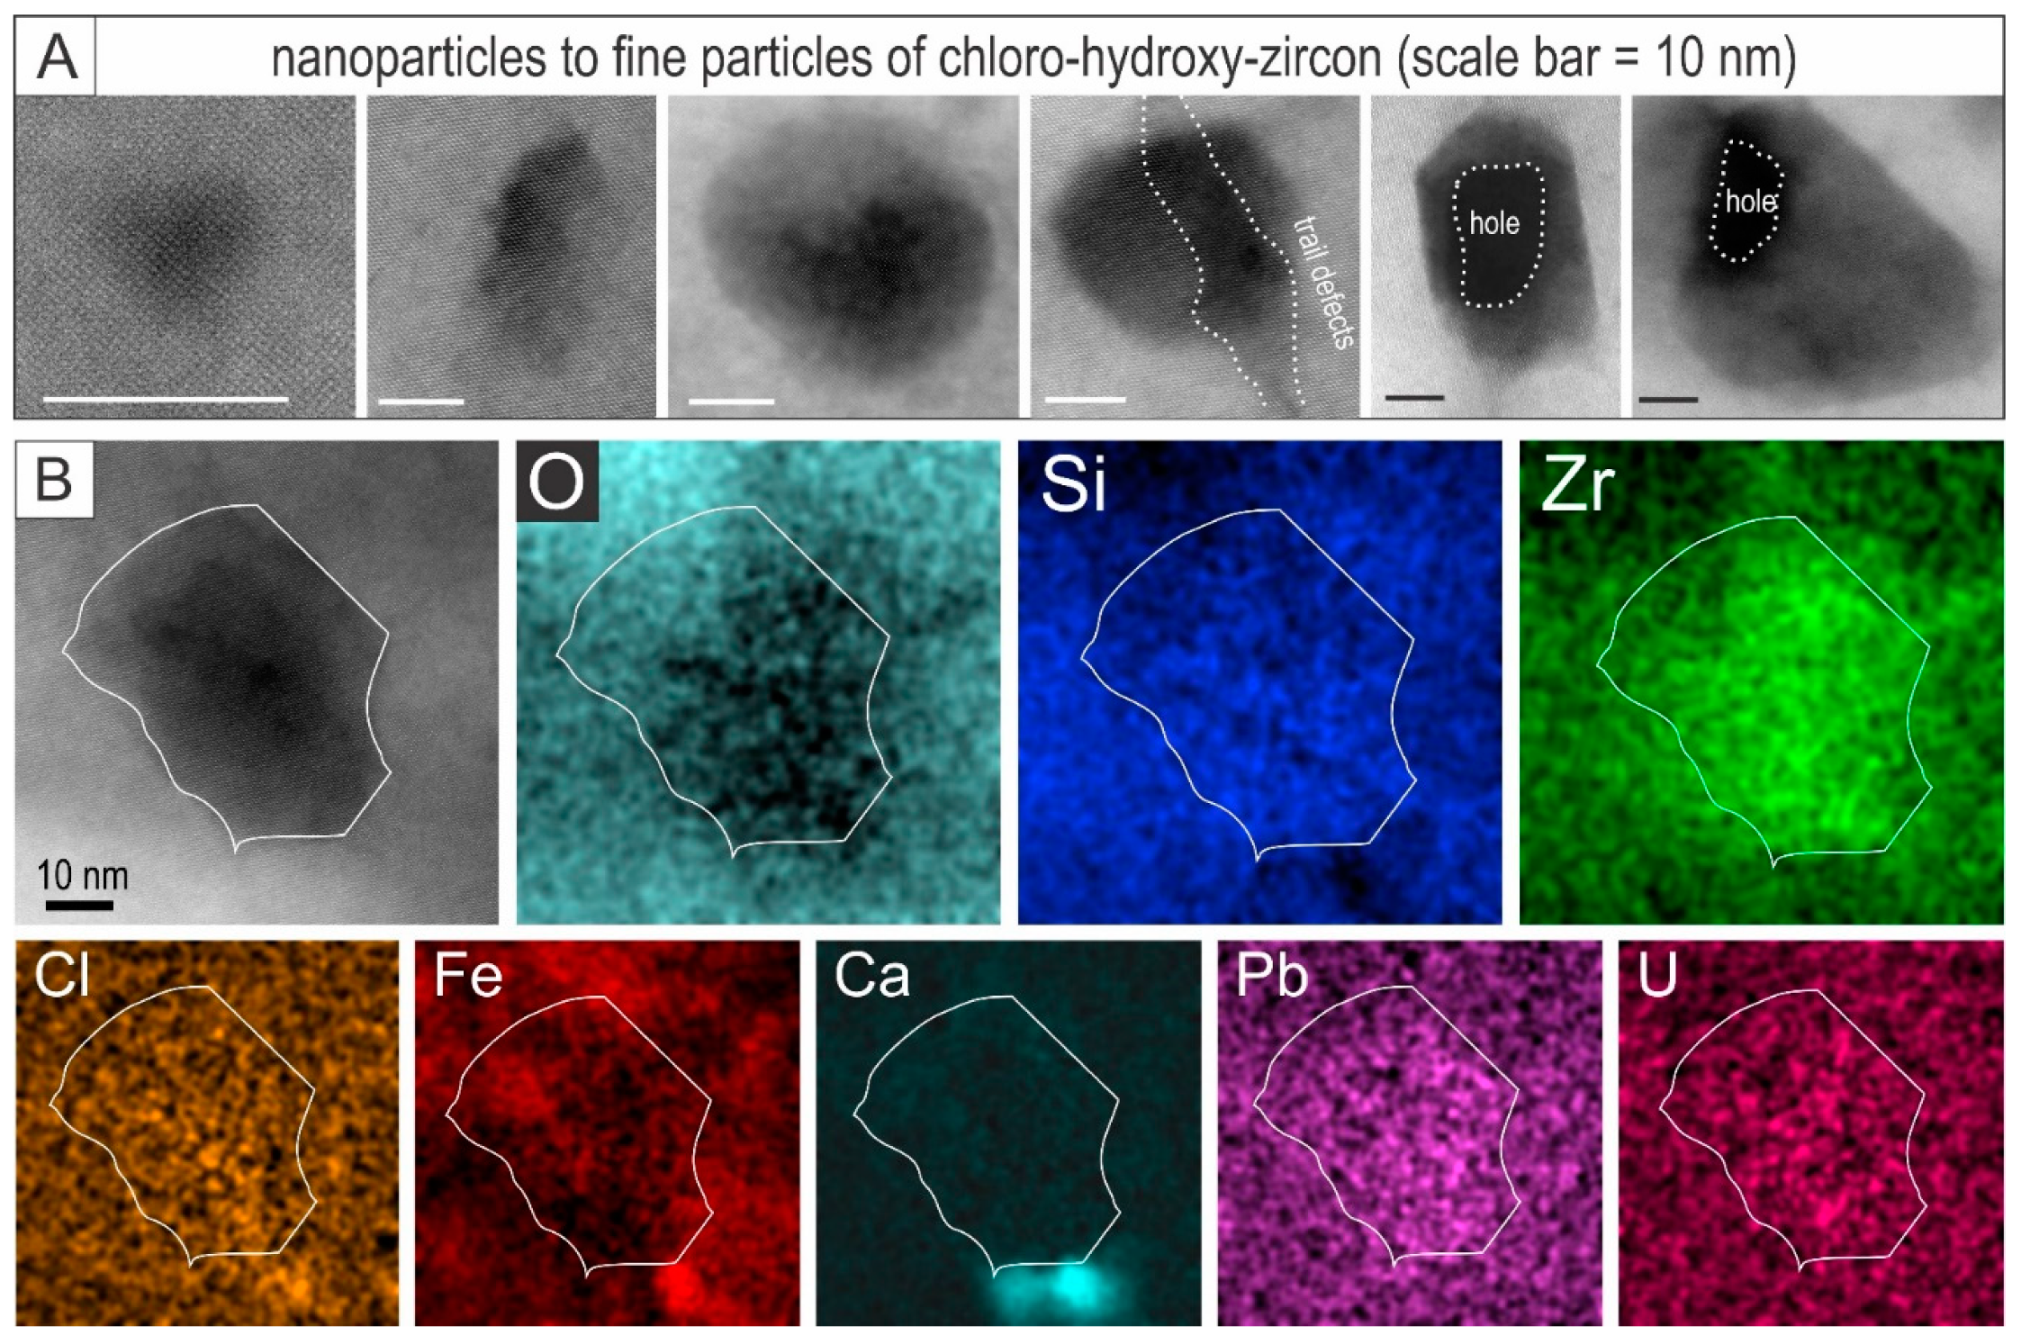
5.5. Mottled Areas: Nanoparticles to Fine Particles of Chloro–Hydroxy–Zircon
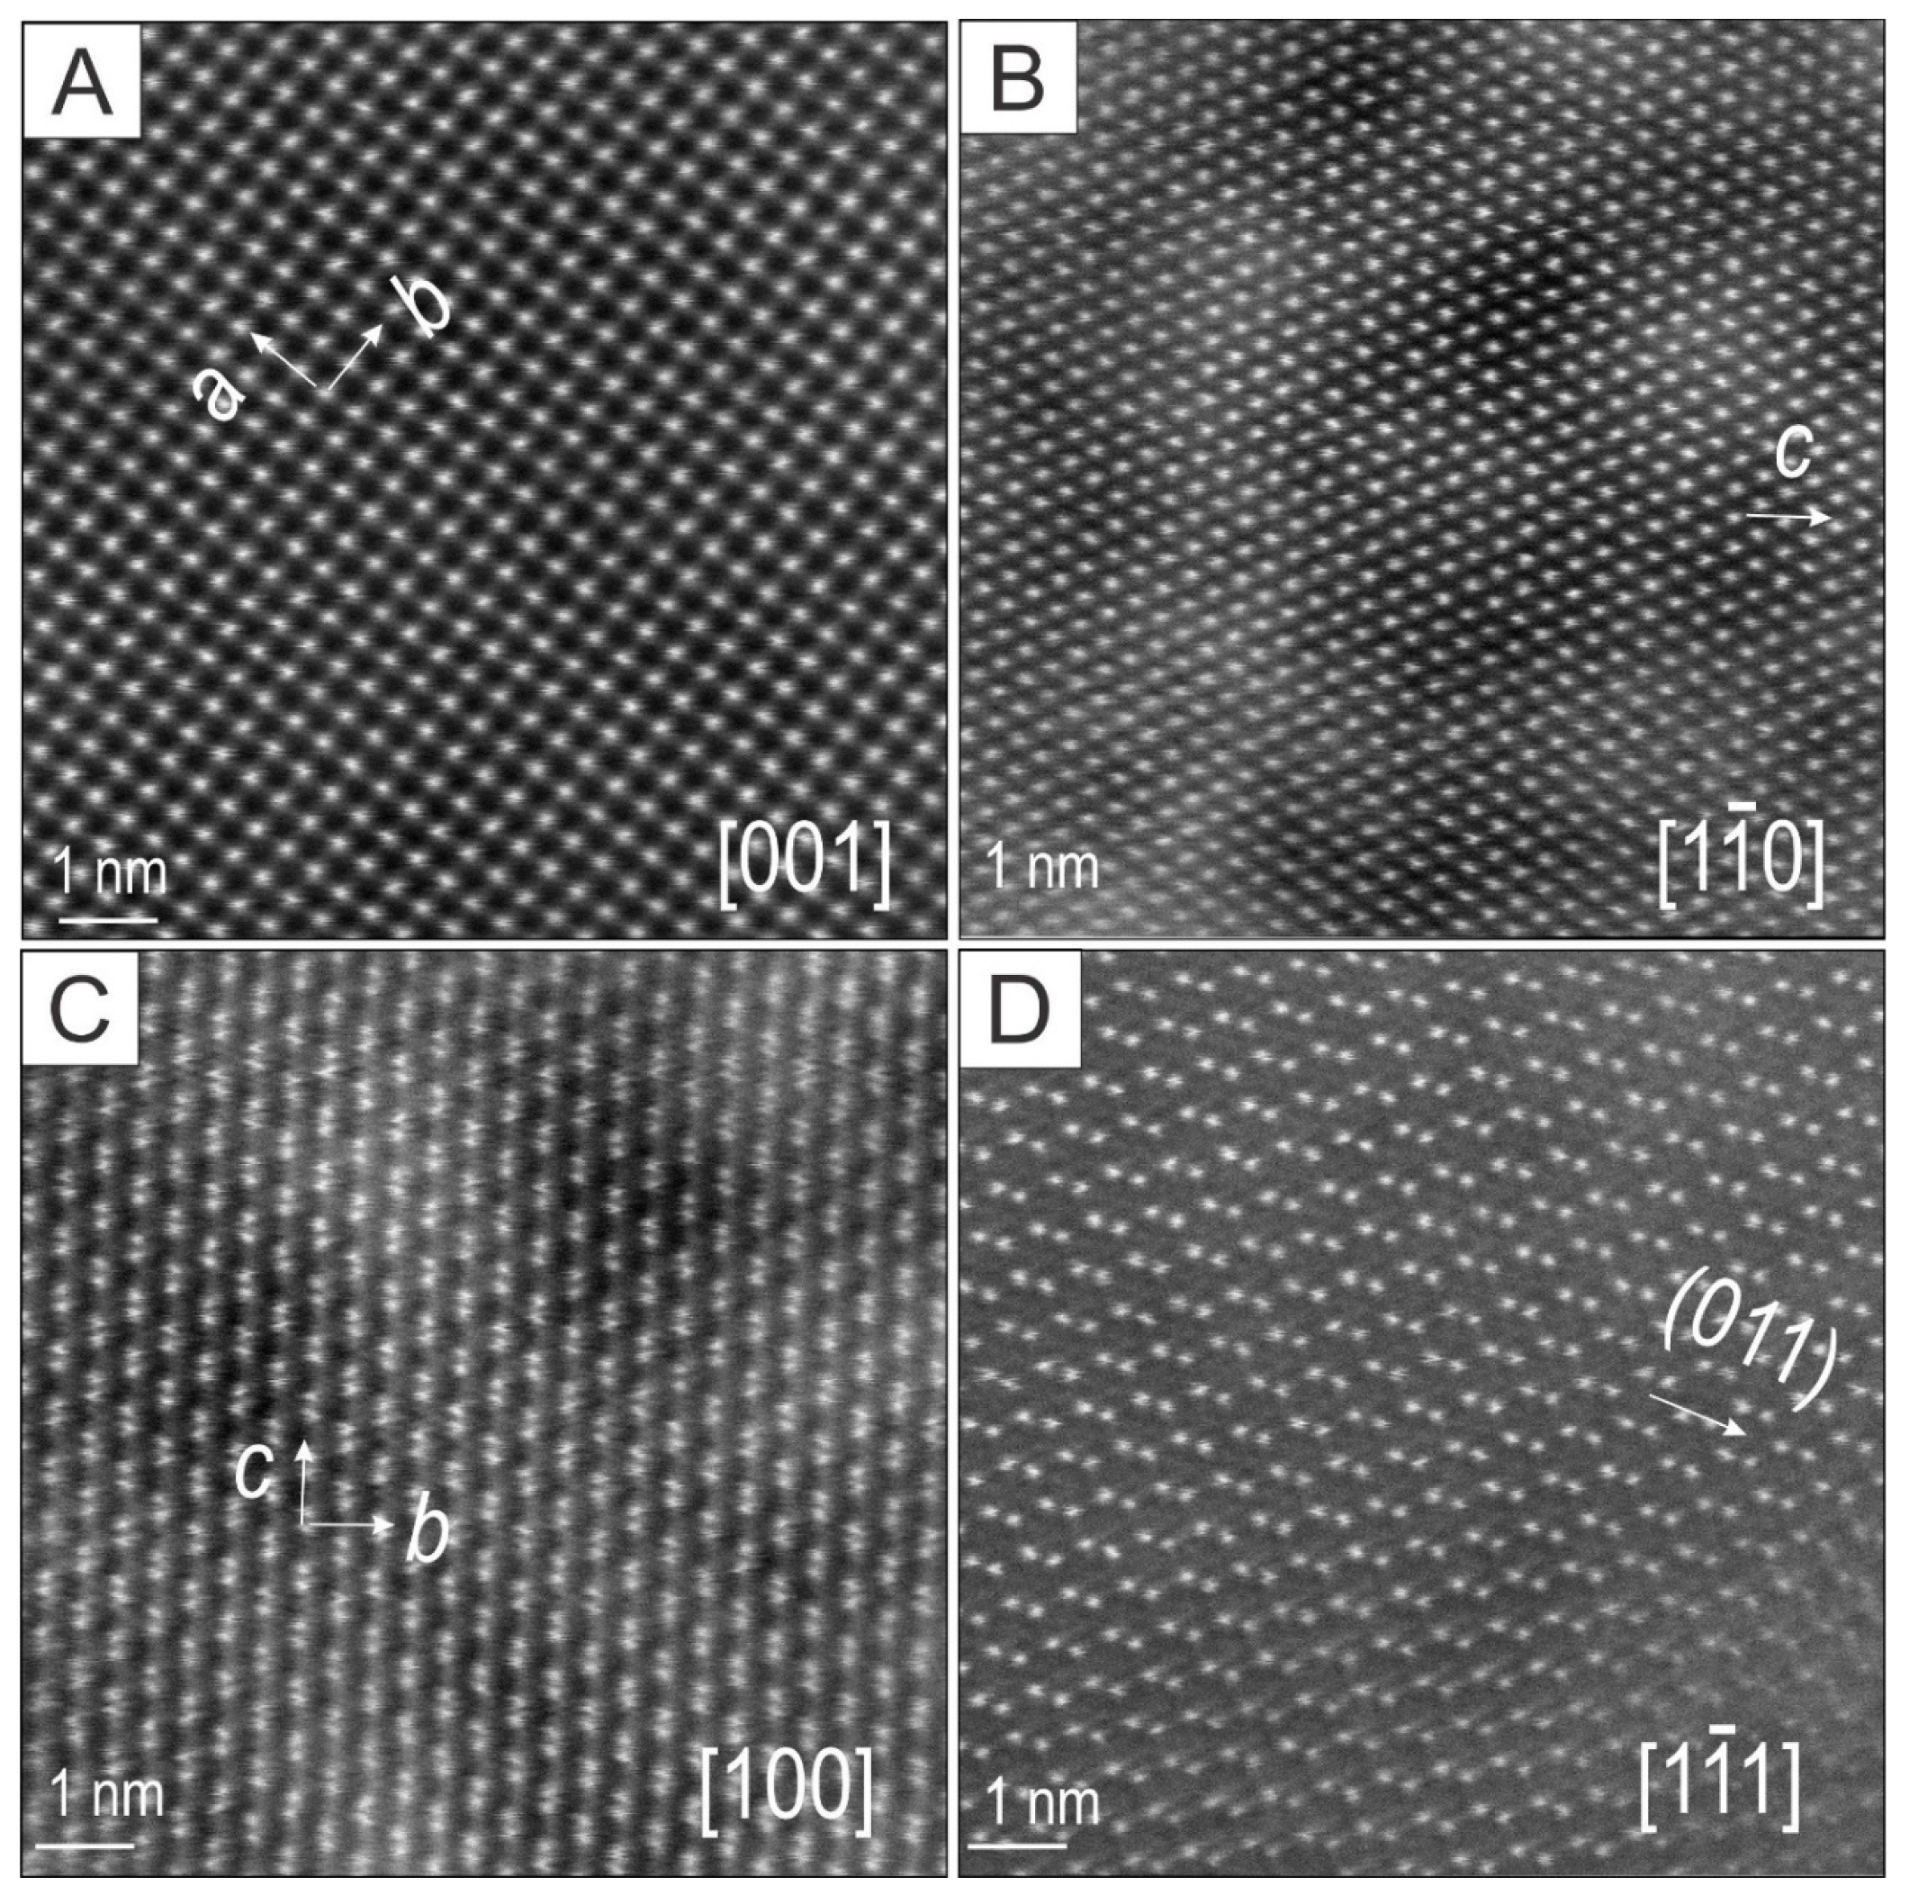
5.6. Atomic-Scale HAADF STEM Imaging—Zircon Crystallinity and Lattice-Scale Defects
6. Discussion
6.1. Zircon Metasomatism Down to the Nanoscale: Are Iron and Chlorine of Magmatic or Hydrothermal Origin?
6.2. Timing of Zircon Alteration: Is Metasomatism Pre- or Post-Metamictization?
6.3. Zircon Alteration Model and Magma “Fertility”
7. Conclusions and Implications
Supplementary Materials
Author Contributions
Funding
Acknowledgments
Conflicts of Interest
References
- Groves, D.I.; Bierlein, F.P.; Meinert, L.D.; Hitzman, M.W. Iron oxide copper-gold (IOCG) deposits through Earth history: Implications for origin, lithospheric setting, and distinction from other epigenetic iron oxide deposits. Econ. Geol. 2010, 105, 641–654. [Google Scholar] [CrossRef]
- Barton, M.D. Iron oxide (-Cu-Au-REE-P-Ag-U-Co) systems. In Treatise on Geochemistry, 2nd ed.; Elsevier: Amsterdam, The Netherlands, 2014; Volume 13, pp. 515–541. [Google Scholar]
- Krneta, S.; Ciobanu, C.L.; Cook, N.J.; Ehrig, K.; Kontonikas-Charos, A. Apatite at Olympic Dam, South Australia: A petrogenetic tool. Lithos 2016, 262, 470–485. [Google Scholar] [CrossRef]
- Krneta, S.; Ciobanu, C.L.; Cook, N.J.; Ehrig, K.J. Numerical modeling of REE fractionation patterns in fluorapatite from the Olympic Dam deposit (South Australia). Minerals 2018, 8, 342. [Google Scholar] [CrossRef]
- Condon, D.J.; Schmitz, M.D. One hundred years of geochronology. Elements 2013, 9, 3–80. [Google Scholar] [CrossRef]
- Harley, S.L.; Kelly, N.M. Zircon Tiny but Timely. Elements 2007, 3, 13–18. [Google Scholar] [CrossRef]
- Rubatto, D.; Hermann, J. Zircon behaviour in deeply subducted rocks. Elements 2007, 3, 31–35. [Google Scholar] [CrossRef]
- Scherer, E.E.; Whitehouse, M.J.; Munker, C. Zircon as a Monitor of Crustal Growth. Elements 2007, 3, 19–24. [Google Scholar] [CrossRef]
- Hoskin, P.W.O.; Schaltegger, U. The composition of zircon and igneous and metamorphic petrogenesis. Rev. Mineral. Geochem. 2003, 53, 27–62. [Google Scholar] [CrossRef]
- Ewing, R.C.; Meldrum, A.; Wang, L.M.; Weber, W.J.; Corrales, L.R. Radiation damage in zircon. Rev. Mineral. Geochem. 2003, 53, 387–425. [Google Scholar] [CrossRef]
- Skirrow, R.G.; Bastrakov, E.N.; Barovich, K.; Fraser, G.L.; Creaser, R.A.; Fanning, C.M. Timing of iron oxide Cu-Au-(U) hydrothermal activity and Nd isotope constraints on metal sources in the Gawler craton, South Australia. Econ Geol. 2007, 102, 1441–1470. [Google Scholar] [CrossRef]
- Ehrig, K.; McPhie, J.; Kamenetsky, V. Geology and Mineralogical Zonation of the Olympic Dam Iron Oxide Cu-U-Au-Ag Deposit, South Australia. In Geology and Genesis of Major Copper Deposits and Districts of the World: A Tribute to Richard H. Sillitoe; Hedenquist, J.W., Harris, M., Camus, F., Eds.; Society of Economic Geologists Special Publication 16; Society of Economic Geologists: Littleton, CO, USA, 2012; pp. 237–267. [Google Scholar]
- Courtney-Davies, L.; Tapster, S.; Ciobanu, C.; Cook, N.J.; Verdugo-Ihl, M.R.; Ehrig, K.J.; Kennedy, A.K.; Gilbert, S.E.; Condon, D.J.; Wade, B.P. A multi-technique evaluation of hydrothermal hematite U-Pb isotope systematics: Implications for ore deposit geochronology. Chem. Geol. 2019, 513, 54–72. [Google Scholar] [CrossRef]
- Cherry, A.R.; Ehrig, K.; Kamenetsky, V.S.; McPhie, J.; Crowley, J.L.; Kamenetsky, M.B. Precise geochronological constraints on the origin, setting and incorporation of ca. 1.59 Ga surficial facies into the Olympic Dam Breccia Complex, South Australia. Precambr. Res. 2018, 315, 162–178. [Google Scholar] [CrossRef]
- Ewing, R.C.; Lutze, W.; Weber, W.J. Zircon—A Host-Phase for the Disposal of Weapons Plutonium. J. Mater. Res. 1995, 10, 243–246. [Google Scholar] [CrossRef]
- Holland, H.D.; Gottfried, D. The effect of nuclear radiation on the structure of zircon. Acta Cryst. 1955, 8, 291–300. [Google Scholar] [CrossRef]
- Mattinson, J. Zircon U–Pb chemical abrasion (“CA-TIMS”) method: Combined annealing and multi-step partial dissolution analysis for improved precision and accuracy of zircon ages. Chem. Geol. 2005, 220, 47–66. [Google Scholar] [CrossRef]
- Geisler, T.; Schaltegger, U.; Tomaschek, F. Re-equilibration of zircon in aqueous fluids and melts. Elements 2007, 3, 43–50. [Google Scholar] [CrossRef]
- Geisler, T.; Rashwan, A.A.; Rahn, M.K.W.; Poller, U.; Zwingmann, H.; Pidgeon, R.T.; Schleicher, H.; Tomaschek, F. Low temperature hydrothermal alteration of natural metamict zircons from the Eastern Desert, Egypt. Mineral. Mag. 2003, 67, 485–508. [Google Scholar] [CrossRef]
- Tang, F.; Taylor, J.M.; Einsle, J.F.; Borlina, C.S.; Fu, R.R.; Weiss, B.P.; Williams, H.M.; Williams, W.; Nagy, L.; Midgley, P.; et al. Secondary magnetite in ancient zircon precludes analysis of a Hadean geodynamo. Proc. Natl. Acad. Sci. USA 2019, 116, 407–412. [Google Scholar] [CrossRef]
- Lu, Y.J.; Loucks, R.R.; Fiorentini, M.L.; McCuaig, T.C.; Evans, N.J.; Yang, Z.M.; Hou, Z.Q.; Kirkland, C.L.; Parra-Avila, L.A.; Kobussen, A. Zircon compositions as a pathfinder for porphyry Cu ± Mo ± Au deposits. Econ. Geol. 2016, 19, 329–347. [Google Scholar]
- Belousova, E.A.; Griffin, W.L.; O’Reilly, S.Y.; Fisher, N.I. Igneous zircon: Trace element composition as an indicator of source rock type. Contrib. Mineral. Petrol. 2002, 143, 602–622. [Google Scholar] [CrossRef]
- Utsunomiya, S.; Ewing, R.C. Application of high-angle annular dark field scanning transmission electron microscopy—Energy dispersive X-ray spectrometry, and energy-filtered transmission electron microscopy to the characterization of nanoparticles in the environment. Environ. Sci. Technol. 2003, 37, 786–791. [Google Scholar] [CrossRef]
- Utsunomiya, S.; Palenik, C.S.; Valley, J.W.; Cavosie, A.J.; Wilde, S.A.; Ewing, R.C. Nanoscale occurrence of Pb in an Archean zircon. Geochim. Cosmochim. Acta 2004, 68, 4679–4686. [Google Scholar] [CrossRef]
- Utsunomiya, S.; Valley, J.W.; Cavosie, A.J.; Wilde, S.A.; Ewing, R.C. Radiation damage and alteration of zircon from a 3.3 Ga porphyritic granite from the Jack Hills, Western Australia. Chem. Geol. 2007, 236, 92–111. [Google Scholar] [CrossRef]
- Seydoux-Guillaume, A.M.; Bingen, B.; Paquette, J.L.; Bosse, V. Nanoscale evidence for uranium mobility in zircon and the discordance of U-Pb chronometers. Earth Plan. Sci. Lett. 2015, 409, 43–48. [Google Scholar] [CrossRef]
- Kusiak, M.A.; Dunkley, D.J.; Wirth, R.; Whitehouse, M.J.; Wilde, S.A.; Marquardtd, K. Metallic lead nanospheres discovered in ancient zircons. Proc. Natl. Acad. Sci. USA 2015, 112, 4958–4963. [Google Scholar] [CrossRef] [Green Version]
- Ciobanu, C.L.; Cook, N.J.; Maunders, C.; Wade, B.P.; Ehrig, K. Focused Ion Beam and Advanced Electron Microscopy for Minerals: Insights and Outlook from Bismuth Sulphosalts. Minerals 2016, 6, 112. [Google Scholar] [CrossRef]
- Cook, N.J.; Ciobanu, C.L.; Ehrig, K.; Slattery, A.; Verdugo-Ihl, M.R.; Courtney-Davies, L.; Gao, W. Advances and opportunities in ore mineralogy. Minerals 2017, 7, 233. [Google Scholar] [CrossRef]
- Goldfarb, R.J.; Bradley, D.; Leach, D.L. Secular variation in economic geology. Econ. Geol. 2010, 105, 459–465. [Google Scholar] [CrossRef]
- Allen, S.R.; McPhie, J.; Ferris, G.; Simpson, C. Evolution and architecture of a large felsic igneous province in western Laurentia: The 1.6 Ga Gawler Range Volcanics, South Australia. J. Volcanol. Geotherm. Res. 2008, 172, 132–147. [Google Scholar] [CrossRef]
- Keyser, W.M.; Ciobanu, C.L.; Cook, N.J.; Johnson, G.; Feltus, F.; Johnson, S.; Dmitrijeva, M.; Ehrig, K.; Nguyen, P. Petrography and trace element signatures of iron-oxides in deposits from the Middleback Ranges, South Australia: From banded iron formation to ore. Ore Geol. Rev. 2018, 93, 337–360. [Google Scholar] [CrossRef]
- Domnick, U.; Cook, N.J.; Bluck, R.; Brown, C.; Ciobanu, C.L. Petrography of granitoids from the Samphire Pluton, South Australia: Implications for uranium mineralization in overlying sediments. Lithos 2018, 300–301, 1–19. [Google Scholar] [CrossRef]
- Keyser, W.; Ciobanu, C.L.; Cook, N.J.; Dmitrijeva, M.; Courtney-Davies, L.; Feltus, H.; Gilbert, S.; Johnson, G.; Ehrig, K. Iron-oxides constrain BIF evolution in terranes with protracted geological histories: The Iron Count prospect, Middleback Ranges, South Australia. Lithos 2019, 324, 20–38. [Google Scholar] [CrossRef]
- Dmitrijeva, M.; Metcalfe, A.V.; Ciobanu, C.L.; Cook, N.J.; Frenzel, M.; Keyser, W.M.; Johnson, G.; Ehrig, K. Discrimination and variance structure of trace element signatures in hematite: A case study of BIF-mineralization from the Middleback Ranges, South Australia. Math. Geosci. 2018, 50, 381–415. [Google Scholar] [CrossRef]
- Creaser, R.A.; Fanning, C.M. A U-Pb zircon study of the Mesoproterozoic Charleston Granite, Gawler Craton, South Australia. Aust. J. Earth Sci. 1993, 40, 519–526. [Google Scholar] [CrossRef]
- Skirrow, R.G.; van der Wielen, S.E.; Champion, D.C.; Czarnota, K.; Thiel, S. Lithospheric architecture and mantle metasomatism linked to iron oxide Cu-Au ore formation: Multidisciplinary evidence from the Olympic Dam Region, South Australia. Geochem. Geophys. Geosyst. 2018, 19, 2673–2705. [Google Scholar] [CrossRef]
- Wade, C.E.; Payne, J.L.; Barovich, K.M.; Reid, A.J. Heterogeneity of the sub-continental lithospheric mantle and ‘non-juvenile’ mantle additions to a Proterozoic silicic large igneous province. Lithos 2019, 340–341, 87–107. [Google Scholar] [CrossRef]
- Ovalle, J.T.; La Cruz, N.L.; Reich, M.; Barra, F.; Simon, A.C.; Konecke, B.A.; Rodriguez-Mustafa, M.A.; Deditius, A.P.; Childress, T.M.; Morata, D. Formation of massive iron deposits linked to explosive volcanic eruptions. Sci. Rep. 2018, 8, 14855. [Google Scholar] [CrossRef]
- Kontonikas-Charos, A.; Ciobanu, C.L.; Cook, N.J.; Ehrig, K.; Krneta, S.; Kamenetsky, V.S. Feldspar evolution in the Roxby Downs Granite, host to Fe-oxide Cu-Au-(U) mineralisation at Olympic Dam, South Australia. Ore Geol. Rev. 2017, 80, 838–859. [Google Scholar] [CrossRef]
- Krneta, S.; Cook, N.J.; Ciobanu, C.L.; Ehrig, K.; Kontonikas-Charos, A. The Wirrda Well and Acropolis prospects Gawler Craton, South Australia: Insights into evolving fluid conditions through apatite chemistry. J. Geochem. Explor. 2017, 181, 276–291. [Google Scholar] [CrossRef]
- Kontonikas-Charos, A.; Ciobanu, C.L.; Cook, N.J.; Ehrig, K.; Krneta, S.; Kamenetsky, V.S. Rare earth element geochemistry of feldspars: Examples from Fe-oxide Cu-Au systems in the Olympic Cu-Au Province, South Australia. Mineral. Petrol. 2018, 112, 145–172. [Google Scholar] [CrossRef]
- Jagodzinski, E.A. Compilation of SHRIMP U-Pb geochronological data Olympic Domain, Gawler Craton, South Australia, 2001–2003. Geosci. Aust. Rec. 2005, 20, 2005. [Google Scholar]
- Keyser, W.; Ciobanu, C.L.; Cook, N.J.; Courtney-Davies, L.; Kennedy, A.; Wade, B.P.; Ehrig, K.; Dmitrijeva, M.; Kontonikas-Charos, A.; Feltus, H.; et al. Petrographic and geochronological constraints on the granitic basement to the Middleback Ranges, South Australia. Precambr. Res. 2019, 324, 170–193. [Google Scholar] [CrossRef]
- Pérez-Soba, C.; Villaseca, C.; Gonzáles del Tánago, J.; Nasdala, L. The composition of zircon in the peraluminous Hercynian granites of the Spanish Central System batholith. Can. Mineral. 2007, 45, 509–527. [Google Scholar] [CrossRef]
- Verdugo-Ihl, M.R.; Ciobanu, C.L.; Cook, N.J.; Ehrig, K.; Courtney-Davies, L.; Gilbert, S. Textures and U-W-Sn-Mo signatures in hematite from the Cu-U-Au-Ag orebody at Olympic Dam, South Australia: Defining the archetype for IOCG deposits. Ore Geol. Rev. 2017, 91, 173–195. [Google Scholar] [CrossRef]
- Kontonikas-Charos, A.; Ciobanu, C.L.; Cook, N.J.; Ehrig, K.; Ismail, R.; Krneta, S.; Basak, A. Feldspar mineralogy and rare earth element (re)mobilization in iron-oxide copper gold systems from South Australia: A nanoscale study. Mineral. Mag. 2018, 82, S173–S197. [Google Scholar] [CrossRef]
- Salje, E.K.H.; Chrosch, J.; Ewing, R.C. Is “metamictization” of zircon a phase transition? Am. Mineral. 1999, 84, 1107–1116. [Google Scholar] [CrossRef]
- Ríos, S.; Malcherek, T.; Salje, E.K.H.; Domeneghetti, C. Localized defects in radiation-damaged zircon. Acta Cryst. 2000, 56, 947–952. [Google Scholar] [CrossRef]
- Nasdala, L.; Kronz, A.; Wirth, R.; Váczi, T.; Pérez-Soba, C.; Willner, A.; Kennedy, A.K. Alteration of radiation-damaged zircon and the related phenomenon of deficient electron microprobe totals. Geochim. Cosmochim. Acta 2009, 73, 1637–1650. [Google Scholar] [CrossRef]
- Wingate, M.T.D.; Campbell, I.H.; Compston, W.; Gibson, G.M. Ion microprobe U–Pb ages for Neoproterozoic basaltic magmatism in south-central Australia and implications for the breakup of Rodinia. Precambr. Res. 1998, 87, 135–159. [Google Scholar] [CrossRef]
- Verdugo-Ihl, M.R.; Ciobanu, C.L.; Cook, N.J.; Ehrig, K.; Courtney-Davies, L. Defining early stages of IOCG systems: Evidence from iron-oxides in the outer shell of the Olympic Dam deposit, South Australia. Mineral. Depos. 2019. [Google Scholar] [CrossRef]
- Xu, H.; Shen, Z.; Konishi, H. Si-magnetite nano-precipitates in silician magnetite from banded iron formation: Z-contrast imaging and ab initio study. Am. Mineral. 2014, 99, 2196–2202. [Google Scholar] [CrossRef]
- Ciobanu, C.L.; Verdugo-Ihl, M.R.; Slattery, A.; Cook, N.J.; Ehrig, K.; Courtney-Davies, L.; Wade, B.P. Silician magnetite: Si-Fe-nanoprecipitates and other mineral inclusions in magnetite from the Olympic Dam deposit, South Australia. Minerals 2019, 9, 311. [Google Scholar] [CrossRef]
- Tooth, B.; Ciobanu, C.L.; Green, L.; O’Neill, B.; Brugger, J. Bi-melt formation and gold scavenging from hydrothermal fluids: An experimental study. Geochim. Cosmochim. Acta 2011, 75, 5423–5443. [Google Scholar] [CrossRef]
- Verdugo-Ihl, M.R.; Ciobanu, C.L.; Cook, N.J.; Slattery, A.; Ehrig, K. Copper nanoparticles along fluid inclusion trails in hematite. In Proceedings of the Goldschmidt 2018, Boston, MA, USA, 12–17 August 2018. [Google Scholar]
- Owen, N.D.; Ciobanu, C.L.; Cook, N.J.; Slattery, A.; Basak, A. Nanoscale study of clausthalite-bearing symplectites in Cu-Au-(U) ores: Implications for ore genesis. Minerals 2018, 8, 67. [Google Scholar] [CrossRef]
- Meldrum, A.; Boatner, L.A.; Weber, W.J.; Ewing, R.C. Radiation damage in zircon and monazite. Geochim. Cosmochim. Acta 1988, 62, 2509–2520. [Google Scholar] [CrossRef]


| Region | Sample ID | Granite Petrography and Age(s), References | Locality (Drill Hole) | Micron-scale Analysis | Nanoscale Analysis: HAADF STEM Imaging and EDS Spot/Mapping | Figures Showing Zircon Images and Maps | |||||||
|---|---|---|---|---|---|---|---|---|---|---|---|---|---|
| Analytical Methods | Foil No. (#) | Key Zircon Features | Main Zone Axes Imaged (See Figures 12 and 13) | ||||||||||
| LA-ICP-MS | EPMA Map | NF Element Zoning (STEM Maps) | Mottling/ CHZ-Nano-precipitates | Others | |||||||||
| U–Pb Dating | Spot Analysis | Map | |||||||||||
| Olympic Cu–Au Province | LCD47 | HS-Roxby Downs granite [14,40,42], this study | Distal from OD (RD2488) | x | #1 | Fe, Ca, Cl | X | screw dislocation | Figures 2, 8, 10, 11, 14, 15, Supplementary C, Figures S1 and S3 | ||||
| #2 * | Fe, Ca, Al, <Cl, Y | x | Xtm veinlet, pores | Figure 2, Supplementary Figure S3 | |||||||||
| LCD13 | Proximal to OD (RD2786A) | x | x | Fe, Cl | #3 | Fe, Cl, <Ca | x | Hm inclusions | Figures 3, 5, 9, Supplementary Figure S3 | ||||
| LCD17 | DS granite [42,43], this study | Wirrda Well (WW46) | x | x | Fe, Cl | #4 | Fe, Ca | x | Xtm veinlet, screw dislocation | Figures 3, 5, 6, 15, Supplementary Figure S3 | |||
| #5 ** | Not mapped | x | Fe detected from spot analysis | Figures 3 and 5 | |||||||||
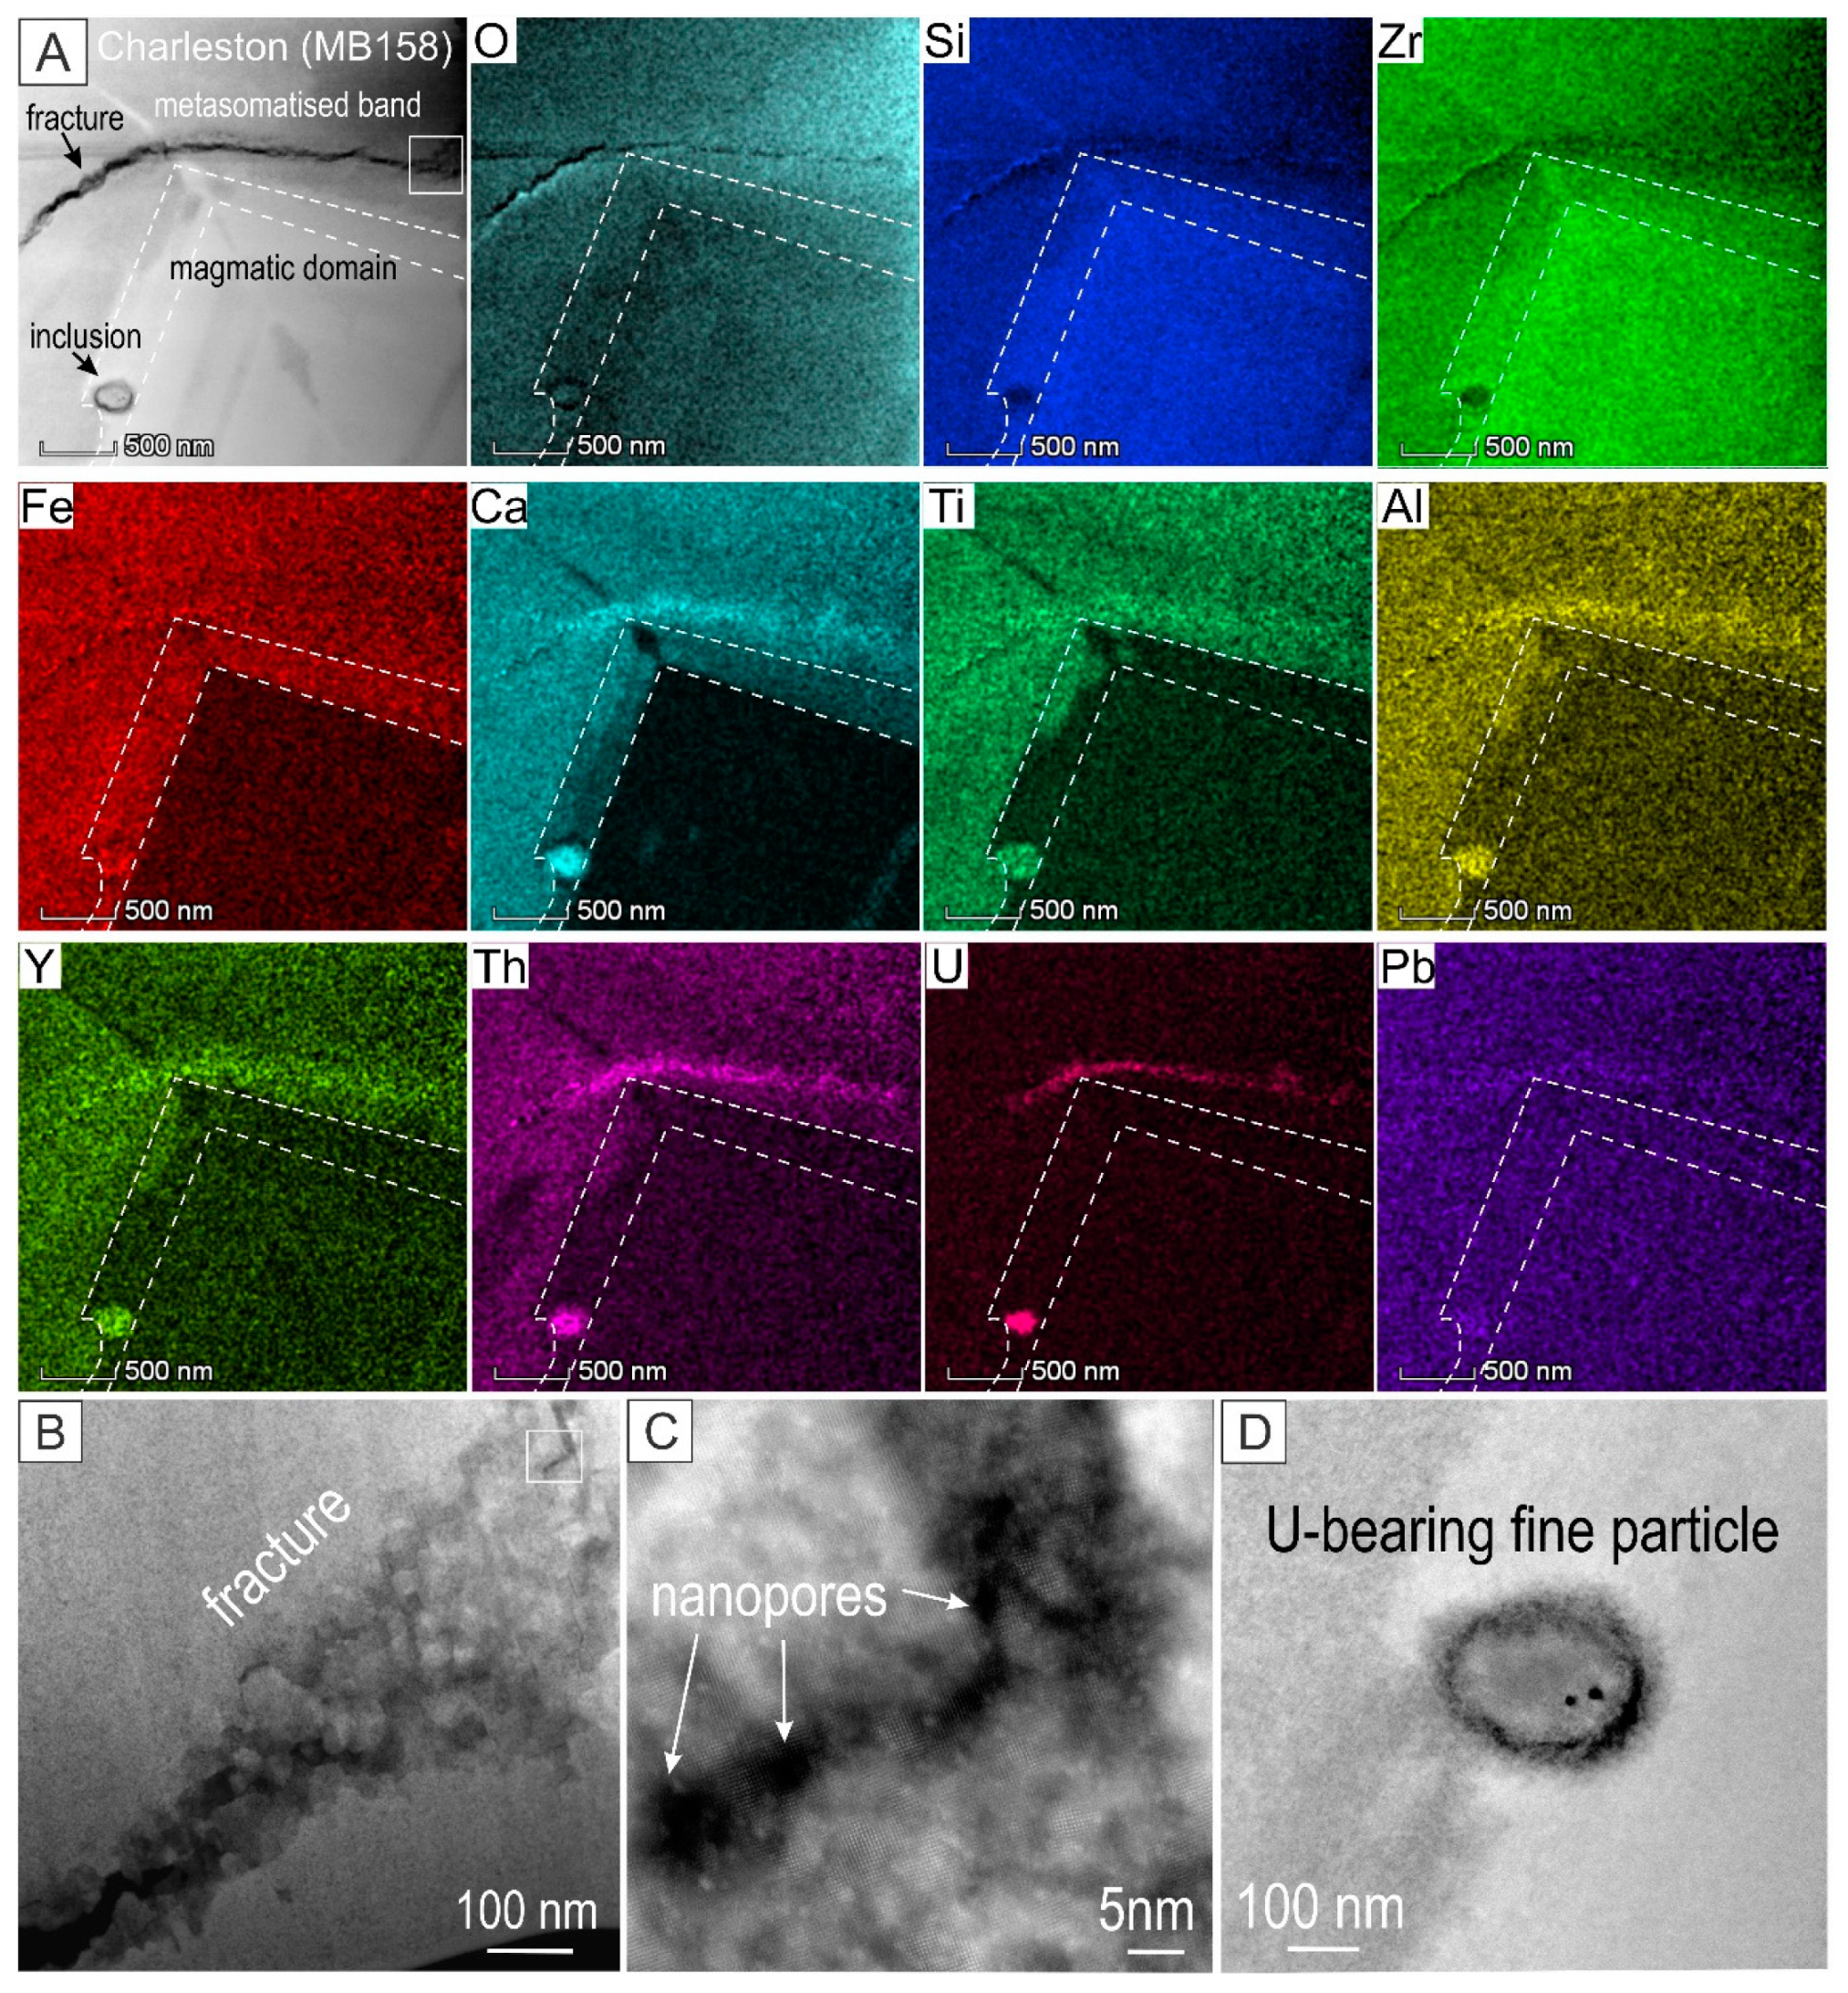
| Eyre Peninsula | MB158 | HS-Charleston granite [36,44] | South of Middleback Ranges | #6 | Fe, Ca, Ti, Al, Y, Th | 2-D screw dislocation, fracture U-NP | Figures 7, 15, Supplementary Figure S1 | ||||||
| PL8 | DS granite [44] | Cape Donington | x | x | #7 | None—primary magmatic | stretching defects | Figures 2, 15, Supplementary Figure S2 | |||||
| LCD13 (OD Proximal) | Na2O | MgO | Al2O3 | SiO2 | P2O5 | K2O | CaO | TiO2 | MnO | Fe2O3 | Y2O3 | ZrO2 | HfO2 | PbO | ThO2 | UO2 | Cl | Sum | H2O * | Sum * | |
| Bright | 0.046 | 0.016 | <mdl | 32.57 | 0.039 | 0.011 | 0.076 | 0.01 | 0.035 | 0.822 | 0.023 | 63.834 | 2.355 | 0.036 | <mdl | 0.163 | 0.116 | 100.60 | 0.11 | 100.69 | |
| Bright | 0.03 | 0.011 | <mdl | 32.165 | 0.064 | <mdl | 0.042 | 0.01 | 0.037 | 0.46 | 0.145 | 64.104 | 1.454 | 0.089 | 0.08 | 0.332 | 0.048 | 99.640 | 0.23 | 99.86 | |
| Mean | n = 2 | 0.038 | 0.014 | <mdl | 32.368 | 0.052 | <mdl | 0.059 | 0.01 | 0.036 | 0.641 | 0.084 | 63.969 | 1.905 | 0.063 | <mdl | 0.248 | 0.082 | 100.12 | 0.17 | 100.275 |
| Dark | 0.083 | 0.047 | 0.011 | 32.291 | 0.063 | 0.011 | 0.153 | 0.015 | 0.029 | 0.972 | 0.085 | 62.507 | 1.532 | 0.032 | 0.078 | 0.178 | 0.119 | 98.599 | 0.002 | 98.574 | |
| Dark | 0.123 | 0.028 | 0.41 | 31.637 | 0.565 | 0.031 | 0.138 | 0.036 | 0.117 | 1.152 | 1.051 | 60.714 | 2.818 | 0.083 | 0.09 | 0.888 | 0.075 | 101.254 | 0.197 | 101.434 | |
| Dark | 0.197 | 0.019 | 0.186 | 31.056 | 0.39 | 0.017 | 0.211 | 0.024 | 0.11 | 1.386 | 0.868 | 59.613 | 2.485 | 0.097 | 0.073 | 0.827 | 0.066 | 98.842 | 0.465 | 99.292 | |
| Dark | 0.058 | 0.022 | 0.008 | 32.46 | 0.145 | 0.007 | 0.123 | 0.012 | 0.049 | 0.9 | 0.484 | 62.749 | 1.148 | 0.048 | 0.196 | 0.25 | 0.156 | 99.547 | 0.049 | 99.561 | |
| Dark | <mdl | 0.021 | 0.021 | 32.218 | 0.082 | 0.011 | 0.185 | 0.008 | 0.071 | 0.956 | 0.12 | 63.205 | 1.385 | 0.048 | 0.122 | 0.21 | 0.379 | 99.705 | 0.149 | 99.769 | |
| Dark | 0.067 | 0.013 | 0.007 | 31.601 | 0.034 | 0.016 | 0.085 | 0.008 | 0.068 | 0.912 | 0.029 | 62.204 | 2.855 | 0.048 | <mdl | 0.203 | 0.163 | 98.780 | 0.353 | 99.096 | |
| Dark | 0.064 | 0.021 | 0.056 | 31.239 | 0.066 | 0.01 | 0.381 | 0.007 | 0.114 | 1.161 | 0.166 | 60.557 | 2.049 | 0.07 | 0.092 | 0.742 | 0.086 | 97.675 | 0.438 | 98.052 | |
| Mean | n = 7 | 0.099 | 0.024 | 0.1 | 31.786 | 0.192 | 0.015 | 0.182 | 0.016 | 0.08 | 1.063 | 0.4 | 61.65 | 2.039 | 0.061 | 0.109 | 0.471 | 0.149 | 99.20 | 0.236 | 99.397 |
| LCD47 (OD Distal) | Na2O | MgO | Al2O3 | SiO2 | P2O5 | K2O | CaO | TiO2 | MnO | Fe2O3 | Y2O3 | ZrO2 | HfO2 | PbO | ThO2 | UO2 | Cl | Sum | H2O * | Sum * | |
| Bright (Gr2) | <mdl | 0.017 | 0.132 | 31.645 | 0.113 | 0.006 | 0.032 | 0.043 | 0.059 | 0.227 | 0.317 | 67.091 | 1.379 | 0.03 | 0.103 | 0.145 | 0.008 | 101.963 | 1.194 | 103.156 | |
| Bright (Gr2) | 0.074 | 0.023 | 0.122 | 31.294 | 0.072 | 0.008 | 0.535 | 0.024 | 0.153 | 1.807 | 0.211 | 61.755 | 1.399 | 0.042 | 0.117 | 0.219 | 0.076 | 98.399 | 0.877 | 99.259 | |
| Mean | n = 2 | <mdl | 0.02 | 0.127 | 31.47 | 0.093 | 0.007 | 0.284 | 0.034 | 0.106 | 1.017 | 0.264 | 64.423 | 1.389 | 0.036 | 0.11 | 0.182 | 0.042 | 100.181 | 1.036 | 101.208 |
| Dark (Gr2) | 0.036 | 0.027 | 0.18 | 30.965 | 0.115 | 0.006 | 0.427 | 0.009 | 0.143 | 1.44 | 0.167 | 61.61 | 1.402 | 0.03 | 0.051 | 0.111 | 0.147 | 97.233 | 0.651 | 97.851 | |
| Dark (Gr2) | 0.046 | 0.03 | 0.196 | 31.273 | 0.054 | 0.006 | 0.435 | 0.038 | 0.174 | 1.333 | 0.043 | 61.692 | 1.736 | 0.037 | 0.023 | 0.12 | 0.089 | 97.565 | 0.467 | 98.012 | |
| Dark (Gr2) | 0.059 | 0.033 | 0.838 | 30.827 | 0.136 | 0.012 | 0.792 | 0.018 | 0.262 | 1.948 | 0.553 | 58.456 | 1.225 | <mdl | 0.089 | 0.125 | 0.111 | 96.520 | 0.086 | 96.532 | |
| Mean | n = 3 | 0.047 | 0.03 | 0.405 | 31.022 | 0.102 | 0.008 | 0.551 | 0.022 | 0.193 | 1.574 | 0.254 | 60.586 | 1.454 | 0.034 | 0.054 | 0.119 | 0.116 | 97.106 | 0.401 | 97.465 |
| Bright (Gr1) | <mdl | 0.011 | 0.009 | 33.017 | 0.11 | <mdl | 0.01 | 0.011 | <mdl | 0.91 | 0.116 | 65.951 | 1.263 | 0.036 | 0.036 | 0.048 | 0.008 | 101.641 | 0.143 | 101.783 | |
| Bright (Gr1) | 0.053 | 0.023 | 0.09 | 30.846 | 0.073 | 0.006 | 0.47 | <mdl | 0.138 | 1.177 | 0.113 | 61.442 | 1.618 | 0.04 | 0.058 | 0.188 | 0.099 | 96.740 | 0.645 | 97.335 | |
| Bright (Gr1) | 0.111 | 0.032 | 0.143 | 31.561 | 0.266 | 0.011 | 0.329 | 0.007 | 0.202 | 1.348 | 0.486 | 60.903 | 1.602 | 0.042 | 0.042 | 0.286 | 0.066 | 98.095 | 0.149 | 98.193 | |
| Bright (Gr1) | <mdl | 0.016 | 0.034 | 31.791 | 0.05 | 0.006 | 0.015 | 0.037 | 0.012 | 0.496 | 0.017 | 65.21 | 1.247 | 0.03 | 0.017 | 0.051 | <mdl | 99.214 | 0.465 | 99.679 | |
| Bright (Gr1) | <mdl | 0.012 | 0.035 | 32.376 | 0.086 | <mdl | 0.024 | 0.007 | 0.019 | 0.381 | 0.057 | 65.094 | 1.416 | 0.025 | 0.024 | 0.037 | 0.009 | 99.780 | 0.072 | 99.850 | |
| Bright (Gr1) | <mdl | 0.4 | 0.447 | 32.714 | 0.118 | 0.006 | 0.03 | 0.035 | 0.03 | 0.69 | 0.165 | 65.902 | 1.477 | 0.041 | 0.027 | 0.061 | 0.012 | 102.467 | 0.375 | 102.839 | |
| Bright (Gr1) | <mdl | 0.02 | 0.1 | 32.199 | 0.108 | <mdl | 0.033 | 0.017 | 0.06 | 0.4 | 0.15 | 65.179 | 1.394 | 0.029 | 0.041 | 0.052 | 0.012 | 100.099 | 0.253 | 100.349 | |
| Mean | n = 5 | <mdl | 0.073 | 0.123 | 32.072 | 0.116 | 0.007 | 0.13 | 0.019 | 0.077 | 0.772 | 0.158 | 64.24 | 1.431 | 0.035 | 0.035 | 0.103 | 0.034 | 99.719 | 0.3 | 100.004 |
| Dark (Gr1) | 0.034 | 0.029 | 0.467 | 30.897 | 0.129 | 0.014 | 0.429 | 0.013 | 0.214 | 1.45 | 0.764 | 60.699 | 1.358 | 0.037 | 0.074 | 0.147 | 0.09 | 97.673 | 0.648 | 98.301 | |
| Dark (Gr1) | 0.038 | 0.019 | 0.027 | 31.119 | 0.071 | 0.007 | 0.244 | 0.021 | 0.132 | 1.239 | 0.06 | 62.206 | 1.414 | 0.023 | 0.035 | 0.082 | 0.098 | 97.233 | 0.613 | 97.823 | |
| Dark (Gr1) | 0.023 | 0.027 | 0.214 | 31.359 | 0.072 | 0.006 | 0.455 | 0.048 | 0.163 | 1.175 | 0.159 | 61.716 | 1.448 | 0.029 | 0.053 | 0.116 | 0.122 | 97.660 | 0.386 | 98.018 | |
| Dark (Gr1) | 0.028 | 0.02 | 0.228 | 31.43 | 0.067 | 0.008 | 0.434 | 0.01 | 0.145 | 1.909 | 0.138 | 61.736 | 1.232 | 0.019 | 0.055 | 0.094 | 0.125 | 98.030 | 0.58 | 98.582 | |
| Dark (Gr1) | 0.032 | 0.03 | 0.216 | 31.454 | 0.064 | 0.008 | 0.374 | 0.077 | 0.186 | 1.666 | 0.081 | 61.894 | 1.405 | 0.017 | 0.035 | 0.105 | 0.085 | 98.014 | 0.462 | 98.457 | |
| Dark (Gr1) | 0.067 | 0.021 | 0.159 | 31.781 | 0.069 | <mdl | 0.442 | 0.006 | 0.171 | 1.413 | 0.087 | 62.024 | 1.258 | 0.025 | 0.042 | 0.085 | 0.065 | 98.042 | 0.232 | 98.233 | |
| Dark (Gr1) | 0.098 | 0.028 | 0.262 | 31.635 | 0.288 | 0.014 | 0.512 | 0.029 | 0.189 | 1.74 | 0.937 | 60.734 | 1.349 | 0.032 | 0.101 | 0.276 | 0.067 | 99.357 | 0.468 | 99.748 | |
| Dark (Gr1) | 0.06 | 0.039 | 0.335 | 30.747 | 0.061 | 0.009 | 0.478 | 0.083 | 0.191 | 1.774 | 0.094 | 63.446 | 1.476 | 0.038 | 0.03 | 0.134 | 0.069 | 99.311 | 1.397 | 100.692 | |
| Dark (Gr1) | 0.094 | 0.023 | 0.073 | 30.481 | 0.12 | <mdl | 0.28 | 0.008 | 0.143 | 0.968 | 0.252 | 62.081 | 1.27 | 0.035 | 0.059 | 0.082 | 0.124 | 96.452 | 0.843 | 97.267 | |
| Mean | n = 9 | 0.053 | 0.026 | 0.22 | 31.211 | 0.105 | 0.009 | 0.405 | 0.033 | 0.17 | 1.482 | 0.286 | 61.837 | 1.357 | 0.028 | 0.054 | 0.125 | 0.094 | 97.975 | 0.625 | 98.569 |
| MB158 (Charleston) | Na2O | MgO | Al2O3 | SiO2 | P2O5 | K2O | CaO | TiO2 | MnO | Fe2O3 | Y2O3 | ZrO2 | HfO2 | PbO | ThO2 | UO2 | Cl | Sum | H2O | Sum * | |
| Bright | <mdl | <mdl | 0.036 | 33.001 | 0.099 | 0.008 | 0.175 | 0.04 | 0.129 | 1.292 | 0.224 | 65.185 | 1.353 | 0.051 | 0.148 | 0.13 | 0.016 | 102.381 | 0.032 | 102.41 | |
| Bright | 0.032 | 0.016 | <mdl | 31.708 | 0.092 | <mdl | 0.674 | 0.052 | 0.188 | 2.082 | 0.147 | 63.283 | 1.32 | 0.049 | 0.081 | 0.12 | 0.046 | 100.153 | 0.005 | 100.147 | |
| Bright | 0.058 | 0.007 | 0.02 | 31.93 | 0.087 | 0.007 | 0.66 | 0.06 | 0.087 | 1.704 | 0.108 | 63.229 | 1.393 | 0.046 | 0.042 | 0.107 | 0.034 | 99.980 | 0 | 99.973 | |
| Bright | 0.048 | 0.053 | 0.164 | 32.152 | 0.096 | 0.005 | 0.933 | 0.031 | 0.144 | 1.224 | 0.273 | 62.378 | 1.536 | 0.038 | 0.038 | 0.154 | 0.063 | 99.842 | 0.022 | 99.85 | |
| Bright | 0.033 | 0.012 | 0.013 | 32.399 | 0.083 | 0.007 | 0.253 | 0.027 | 0.175 | 1.02 | 0.114 | 64.156 | 1.524 | 0.036 | 0.038 | 0.148 | 0.016 | 100.366 | 0.005 | 100.368 | |
| Mean | n = 5 | 0.043 | 0.022 | 0.058 | 32.238 | 0.091 | 0.007 | 0.539 | 0.042 | 0.145 | 1.464 | 0.173 | 63.646 | 1.425 | 0.044 | 0.069 | 0.132 | 0.035 | 100.544 | 0.013 | 100.55 |
| Dark | 0.044 | 0.019 | 0.035 | 31.646 | 0.095 | 0.007 | 1.115 | 0.029 | 0.133 | 1.784 | 0.206 | 62.498 | 1.21 | 0.057 | 0.124 | 0.143 | 0.06 | 99.657 | 0.016 | 99.659 | |
| Dark | 0.04 | 0.016 | 0.073 | 32.077 | 0.124 | <mdl | 1.399 | 0.055 | 0.153 | 2.203 | 0.355 | 61.528 | 1.16 | 0.045 | 0.232 | 0.147 | 0.064 | 100.175 | 0.029 | 100.189 | |
| Dark | <mdl | 0.016 | 0.013 | 31.92 | 0.082 | <mdl | 0.677 | 0.064 | 0.176 | 2.211 | 0.19 | 62.89 | 1.375 | 0.032 | 0.121 | 0.16 | 0.047 | 100.293 | 0.024 | 100.306 | |
| Dark | 0.062 | 0.012 | 0.01 | 31.372 | 0.07 | <mdl | 0.981 | 0.014 | 0.219 | 1.306 | 0.102 | 61.879 | 1.397 | 0.036 | 0.046 | 0.15 | 0.052 | 98.0480 | 0 | 98.037 | |
| Dark | 0.033 | 0.017 | 0.083 | 31.403 | 0.081 | 0.007 | 1.033 | 0.014 | 0.163 | 1.281 | 0.113 | 61.841 | 1.523 | <mdl | 0.084 | 0.154 | 0.049 | 98.317 | 0.014 | 98.32 | |
| Mean | n = 5 | 0.045 | 0.016 | 0.043 | 31.684 | 0.09 | <mdl | 1.041 | 0.035 | 0.169 | 1.757 | 0.193 | 62.127 | 1.333 | 0.043 | 0.121 | 0.151 | 0.054 | 99.298 | 0.017 | 99.302 |
| PL8 (Cape. Don) | Na2O | MgO | Al2O3 | SiO2 | P2O5 | K2O | CaO | TiO2 | MnO | Fe2O3 | Y2O3 | ZrO2 | HfO2 | PbO | ThO2 | UO2 | Cl | Sum | H2O * | Sum * | |
| Bright | <mdl | 0.008 | <mdl | 32.518 | 0.107 | <mdl | <mdl | 0.005 | <mdl | <mdl | 0.15 | 65.716 | 1.233 | 0.023 | 0.027 | 0.035 | <mdl | 100.06 | 0.012 | 100.071 | |
| Bright | <mdl | 0.01 | 0.008 | 32.801 | 0.092 | <mdl | <mdl | 0.007 | 0.012 | 0.026 | 0.039 | 65.94 | 1.392 | 0.019 | 0.015 | 0.021 | <mdl | 100.589 | 0.003 | 100.592 | |
| Bright | <mdl | <mdl | <mdl | 32.646 | 0.097 | <mdl | 0.01 | <mdl | <mdl | <mdl | 0.075 | 65.891 | 1.275 | 0.038 | 0.03 | 0.064 | <mdl | 100.396 | 0.009 | 100.405 | |
| Bright | <mdl | <mdl | <mdl | 32.759 | 0.074 | <mdl | <mdl | 0.012 | <mdl | <mdl | 0.034 | 65.863 | 1.334 | 0.026 | 0.02 | 0.045 | <mdl | 100.249 | 0 | 100.249 | |
| Mean | n = 4 | <mdl | <mdl | <mdl | 32.681 | 0.093 | <mdl | <mdl | 0.008 | <mdl | <mdl | 0.075 | 65.853 | 1.309 | 0.027 | 0.023 | 0.041 | <mdl | 100.324 | 0.006 | 100.329 |
| Dark | <mdl | 0.009 | <mdl | 31.997 | 0.077 | <mdl | <mdl | 0.01 | <mdl | 0.032 | 0.028 | 65.14 | 1.326 | 0.03 | <mdl | 0.012 | <mdl | 98.907 | 0.142 | 99.049 | |
| Dark | <mdl | 0.008 | <mdl | 32.423 | 0.09 | <mdl | <mdl | 0.006 | <mdl | <mdl | 0.038 | 65.806 | 1.41 | <mdl | <mdl | 0.016 | <mdl | 100.114 | 0.092 | 100.206 | |
| Dark | <mdl | <mdl | <mdl | 32.005 | 0.065 | <mdl | <mdl | 0.008 | <mdl | 0.041 | 0.025 | 65.502 | 1.326 | 0.023 | <mdl | 0.015 | <mdl | 99.233 | 0.239 | 99.472 | |
| Mean | n = 3 | <mdl | 0.009 | <mdl | 32.142 | 0.077 | <mdl | <mdl | 0.008 | <mdl | 0.037 | 0.03 | 65.483 | 1.354 | 0.027 | <mdl | 0.014 | <mdl | 99.418 | 0.158 | 99.576 |
| LCD17 (Wirrda Well) | Na2O | MgO | Al2O3 | SiO2 | P2O5 | K2O | CaO | TiO2 | MnO | Fe2O3 | Y2O3 | ZrO2 | HfO2 | PbO | ThO2 | UO2 | Cl | Sum | H2O * | Sum * | |
| Bright | <mdl | 0.011 | <mdl | 32.758 | 0.104 | <mdl | 0.018 | 0.006 | <mdl | 0.197 | 0.093 | 64.529 | 1.288 | 0.031 | 0.026 | 0.051 | <mdl | 99.548 | 0.021 | 99.568 | |
| Bright | <mdl | 0.013 | <mdl | 32.77 | 0.172 | <mdl | <mdl | 0.009 | <mdl | 0.161 | 0.108 | 64.598 | 1.265 | 0.028 | 0.027 | 0.048 | <mdl | 99.515 | 0.006 | 99.521 | |
| Bright | <mdl | 0.012 | <mdl | 32.874 | 0.125 | <mdl | <mdl | 0.008 | <mdl | 0.128 | 0.092 | 65.057 | 1.343 | 0.034 | 0.027 | 0.045 | 0.009 | 99.970 | 0.007 | 99.975 | |
| Bright | <mdl | <mdl | <mdl | 32.789 | 0.121 | <mdl | <mdl | 0.01 | <mdl | 0.236 | 0.083 | 65.159 | 1.389 | 0.034 | 0.025 | 0.047 | <mdl | 100.179 | 0.009 | 100.188 | |
| Bright | <mdl | 0.015 | <mdl | 32.735 | 0.129 | 0.007 | 0.012 | 0.006 | <mdl | 0.105 | 0.089 | 65.159 | 1.31 | 0.019 | 0.031 | 0.059 | <mdl | 100.028 | 0.013 | 100.041 | |
| Mean | n = 5 | <mdl | 0.013 | <mdl | 32.785 | 0.13 | <mdl | <mdl | 0.008 | <mdl | 0.165 | 0.093 | 64.9 | 1.319 | 0.029 | 0.027 | 0.05 | <mdl | 99.848 | 0.011 | 99.859 |
| Dark | 0.027 | 0.031 | 0.22 | 31.317 | 0.188 | 0.008 | 0.26 | 0.014 | 0.085 | 1.338 | 0.368 | 62.109 | 1.282 | 0.038 | 0.066 | 0.108 | 0.081 | 98.193 | 0.498 | 98.673 | |
| Dark | 0.036 | 0.017 | <mdl | 32.724 | 0.138 | 0.006 | 0.046 | 0.006 | 0.038 | 0.471 | 0.202 | 63.7 | 1.383 | <mdl | 0.05 | 0.077 | 0.052 | 99.383 | 0.016 | 99.388 | |
| Dark | 0.035 | 0.013 | <mdl | 32.421 | 0.139 | 0.007 | 0.029 | 0.008 | 0.042 | 0.743 | 0.112 | 64.242 | 1.334 | 0.03 | 0.033 | 0.081 | 0.027 | 99.775 | 0.062 | 99.831 | |
| Dark | <mdl | 0.010 | <mdl | 33.089 | 0.084 | 0.007 | 0.01 | 0.009 | <mdl | 0.272 | 0.053 | 65.846 | 1.245 | 0.026 | <mdl | 0.037 | <mdl | 100.893 | 0.006 | 100.9 | |
| Dark | <mdl | 0.008 | <mdl | 32.259 | 0.152 | <mdl | 0.011 | 0.006 | 0.012 | 0.162 | 0.116 | 64.684 | 1.204 | 0.034 | 0.016 | 0.054 | <mdl | 99.062 | 0.011 | 99.072 | |
| Mean | n = 5 | 0.033 | 0.016 | <mdl | 32.362 | 0.140 | 0.007 | 0.071 | 0.009 | 0.044 | 0.597 | 0.17 | 64.116 | 1.29 | 0.032 | 0.041 | 0.071 | 0.053 | 99.461 | 0.119 | 99.573 |
| average mdl | 0.023 | 0.007 | 0.006 | 0.021 | 0.010 | 0.005 | 0.009 | 0.004 | 0.011 | 0.024 | 0.008 | 0.049 | 0.101 | 0.014 | 0.010 | 0.011 | 0.007 | ||||
| Lithology and Location | Sample ID | Zircon Composition |
|---|---|---|
| Cape Donington, Donington Suite | PL8 | Bright: (Zr*0.994REE*0.001)∑=0.995(Si1.002P0.002O4); |
| Dark: (Zr*0.996Fe0.001REE*0.003)∑=1(Si0.986P0.002O3.95)(OH)0.049. | ||
| Wirrda Well, Donington Suite | LCD17 | Bright: Zr*0.979Fe0.004REE*0.006NF0.001)∑=0.989(Si1.006P0.005O3.966)(OH)0.001; |
| Dark: i0.002(Zr*0.943Fe0.031REE*0.014NF0.013)∑=1(Si0.962Al0.008P0.005O3.862)(OH,Cl)0.106. | ||
| OD-distal Hiltaba Suite | LCD47 | Bright: (Zr*0.986Fe0.009REE*0.003NF0.002)∑=1(Si0.993Al0.001P0.002O3.978)(OH,Cl)0.015; |
| Dark: i0.004(Zr*0.934Fe0.04REE*0.004NF0.022)∑=1(Si0.915Al0.012P0.002Ti0.002O3.672)(OH,Cl)0.281. | ||
| OD-proximal Hiltaba Suite | LCD13 | Bright: i0.003(Zr*0.97Fe0.019REE*0.007NF0.004)∑=1(Si0.993P0.001O3.959)(OH,Cl)0.028; |
| Dark: i0.004(Zr*0.942Fe0.027REE*0.013NF0.018)∑=1(Si0.972Al0.002P0.002O3.864)(OH,F,Cl)0.105. | ||
| Charleston Granite, Hiltaba Suite | MB158 | Bright:(Zr*0.962Fe0.019REE*0.009NF0.009)∑=0.999(Si0.985Al0.001P0.003Ti0.001Fe0.01O3.969)(OH,Cl)0.007; |
| Dark: i0.003(Zr*0.941Fe0.009REE*0.009NF0.041)∑=1(Si0.964Al0.001P0.003Fe0.031O3.933)(OH,Cl)0.006. |
© 2019 by the authors. Licensee MDPI, Basel, Switzerland. This article is an open access article distributed under the terms and conditions of the Creative Commons Attribution (CC BY) license (http://creativecommons.org/licenses/by/4.0/).
Share and Cite
Courtney-Davies, L.; Ciobanu, C.L.; Verdugo-Ihl, M.R.; Slattery, A.; Cook, N.J.; Dmitrijeva, M.; Keyser, W.; Wade, B.P.; Domnick, U.I.; Ehrig, K.; et al. Zircon at the Nanoscale Records Metasomatic Processes Leading to Large Magmatic–Hydrothermal Ore Systems. Minerals 2019, 9, 364. https://doi.org/10.3390/min9060364
Courtney-Davies L, Ciobanu CL, Verdugo-Ihl MR, Slattery A, Cook NJ, Dmitrijeva M, Keyser W, Wade BP, Domnick UI, Ehrig K, et al. Zircon at the Nanoscale Records Metasomatic Processes Leading to Large Magmatic–Hydrothermal Ore Systems. Minerals. 2019; 9(6):364. https://doi.org/10.3390/min9060364
Chicago/Turabian StyleCourtney-Davies, Liam, Cristiana L. Ciobanu, Max R. Verdugo-Ihl, Ashley Slattery, Nigel J. Cook, Marija Dmitrijeva, William Keyser, Benjamin P. Wade, Urs I. Domnick, Kathy Ehrig, and et al. 2019. "Zircon at the Nanoscale Records Metasomatic Processes Leading to Large Magmatic–Hydrothermal Ore Systems" Minerals 9, no. 6: 364. https://doi.org/10.3390/min9060364