Article

Cryogenic Raman Spectroscopic Studies on Common Ore-forming Fluid Systems

MNR Key Laboratory of Metallogeny and Mineral Assessment, Institute of Mineral Resources, Chinese Academy of Geological Sciences, Beijing 100037, China
*
Author to whom correspondence should be addressed.
Minerals 2019, 9(6), 363; https://doi.org/10.3390/min9060363
Submission received: 10 May 2019 / Revised: 5 June 2019 / Accepted: 10 June 2019 / Published: 13 June 2019

Abstract

:
The composition and properties of ore-forming fluids are key to understanding the mechanisms of mineralization in ore deposits. These characteristics can be understood by studying fluid inclusions. Hydrates in fluid inclusions containing NaCl–H2O and MgCl2–H2O were studied using cryogenic Raman spectroscopy. The intensity ratio of peaks at 3401, 3464, 3514, and 3090 cm−1 shows a positive correlation with the concentration of hydrates in the inclusions, as does the ratio of the total integrated area of the MgCl2 hydrate peak (3514 cm−1) to the 3090 cm−1 peak with the concentration of MgCl2 (correlation coefficient >0.90). These correlations are important in the quantitative analysis of MgCl2 in synthetic and natural NaCl–MgCl2–CaCl2–H2O-bearing fluid inclusions. Semi-quantitative analysis of NaCl–MgCl2–H2O solutions indicates that peaks at 3437 and 3537 cm−1 reflect the presence of NaCl in the solution. Further, a peak at 3514 cm−1 is indicative of the presence of MgCl2. The relative intensities of these peaks may be related to the relative abundances of NaCl and MgCl2. A quantitative attempt was made on NaCl–MgCl2–CaCl2–H2O system, but it was found that quantifying NaCl, MgCl2 and CaCl2 separately in NaCl–MgCl2–CaCl2–H2O system by the secondary freezing method is difficult.

1. Introduction

Fluid inclusions give insight into the composition of mineralizing fluids and the physical and chemical conditions of mineralization during the trapping of fluids. In recent years, advances have been made in micro-analytical techniques that can be applied to the in situ analysis of fluid inclusions, including laser ablation–inductively coupled plasma–mass spectrometry (LA–ICP–MS) [1,2,3,4,5], secondary ion mass spectrometry (SIMS) [6], particle-induced X-ray emission (PIXE) [7,8,9], and synchrotron X-ray fluorescence spectroscopy (SR–XRF) [9,10,11,12,13,14]. Most of these methods are destructive and semi-quantitative.
Raman spectroscopy is a non-destructive technique that can be used to obtain compositional information of individual fluid inclusions [15,16,17,18,19,20]. Because samples are not destroyed during analysis, they can be used to study the same fluid inclusions using other techniques, such as microthermometry. The ions that dominate natural fluid inclusions, such as Na+, Ca2+, Mg2+, and Cl, do not show Raman peaks in the wavelength range measured [21]; however, low-temperature inorganic salt hydrates containing these ions do show such peaks, meaning they can be measured quantitatively using Raman spectroscopy.
In order to identify the type of inorganic salt species present in fluid inclusions, Dubessy et al [22], demonstrated that salt hydrates (NaC1∙2H2O, CaCl2∙6H2O, MgCl2∙6H2O, MgCl2∙12H2O, FeC13∙6H2O, and KC1∙MgCl2∙6H2O) can be identified using Raman spectroscopy. However, when the Raman peaks of salt hydrates in natural inclusions overlap, it is difficult to identify and quantify the cations in these inclusions [21]. Complex hydrates, or several kinds of salt hydrates mixed in different proportions, occur in natural inclusions at low temperatures [23], inhibiting the quantification of cations in these inclusions using cryogenic Raman spectroscopy [24]. Samson and Walker [25] analyzed hydrohalite and antarcticite using a series of standard solutions (NaCl–H2O, CaCl2–H2O, NaCl–CaCl2–H2O) in order to estimate the ratio of NaCl to CaCl2 in the system, and considered that rapid crystallization in the NaCl–CaCl2–H2O system at temperatures between −70 and −50 °C (by rapid cooling to −180 °C, and slow heating to between −70 and −50 °C) originates from a liquid phase rather than metastable eutectics. This is a crystallization process, not a melting process. Bakker [16] applied a combination of Raman spectrometry and microthermometry to synthetic fluid inclusions filled with pure H2O, a NaCl brine and a MgCl2 brine, the advantage of this combination is two-fold: the determination of the types of dissolved salts from the presence of salt hydrates at low temperatures, and an accurate estimate of true temperatures of melting, even of phases that are difficult to observe within fluid inclusions.
A quantitative study on synthetic inclusions containing different concentrations of NaCl [26] showed that the concentration of NaCl in synthetic inclusions can be quantified from the ratio of intensity, or the ratio of the peak areas of the 3423 and 3098 cm−1 features, in hydrohalite. Their subsequent research also confirmed the existence of characteristic peaks of antarcticite and MgCl2 hydrate in the synthetic fluid inclusions by cryogenic Raman spectra technique [27,28]. In recent years, the quantification of NaCl has been achieved in the synthetic solution of H2O–NaCl–CaCl2 system by cryogenic Raman spectra technique [29,30,31]. However, MgCl2 is also a common component in natural inclusions, and there is little quantitative study on MgCl2. Moreover, the characteristic peaks of hydrohalite and antarcticite are clearly distinguished. The characteristic peaks of MgCl2 hydrate may overlap with those of hydrohalite and antarcticite, which is a difficulty in quantitative analysis of natural inclusions.
Here, hydrates in NaCl–H2O, MgCl2–H2O, and NaCl–MgCl2–H2O of standard solutions were analyzed using cryogenic Raman spectroscopy, obtaining semi-quantitative or quantitative data, in order to realize the quantitative analysis of these ions in natural fluid inclusions in the future.

2. Experimental Methodology

Synthetic solutions of NaCl–H2O, MgCl2–H2O, NaCl–MgCl2–H2O and NaCl–MgCl2–CaCl2–H2O were prepared using Fisher analytical grade NaCl, MgCl2, CaCl2 and deionized water (>18.2 MΩ) (See Table 1 for details). Raman spectra were collected using a Renishaw RM2000 Raman spectrometer fitted with a peltier cooling CCD detector at MNR Key Laboratory of Metallogeny and Mineral Assessment, Institute of Mineral Resources, Chinese Academy of Geological Sciences. Excitation was achieved using a CW Diode laser tuned to 514.5 nm. The integration time was 10s. The grating used is 1800 l/mm with blaze wavelength at 633 nm, size 50 × 50 mm, and objective is ×50 with long working distance, WD 8 mm, NA 0.55. Laser power 20 mw, spectra were collected between 100 and 4000 cm−1, exposure time 10 s, accumulation 1, entrance slit 50 μm, CCD binning 1, and the focal length of the monochromator is 250 mm while spectrum resolution is 1.6 cm−1.
Synthetic solutions were cooled using a Linkam THMSG-600 heating–cooling stage, operated using a TMS94 programmable temperature controller. The prepared solutions were sealed in a quartz cuvette. In order to find the optimum formation conditions of salt hydrates in common ore-forming fluid systems, three cooling methods were adopted:(1) rapid cooling from room temperature to −180 °C; (2) cooling to −180 °C at a rate of −20 °C/min; (3) the second freezing method (the rapid cooling of a solution to −180 °C, the solution is warmed slowly to within the range of −40 and −22 °C where a visible phase change occurs, and again cooled rapidly to −180 °C ).
The resulting spectra were analyzed by the software WIRE (Renishaw Inc.) in order to estimate the peak position, intensity (I), FWHM (full width at half maxima), total integrated area and fraction of Gauss function (g) in Gaussian–Lorentzian contributions.

3. Results and Discussion

3.1. Determining Optimal Experimental Conditions for Hydrate Generation from NaCl–H2O and MgCl2–H2O Solutions

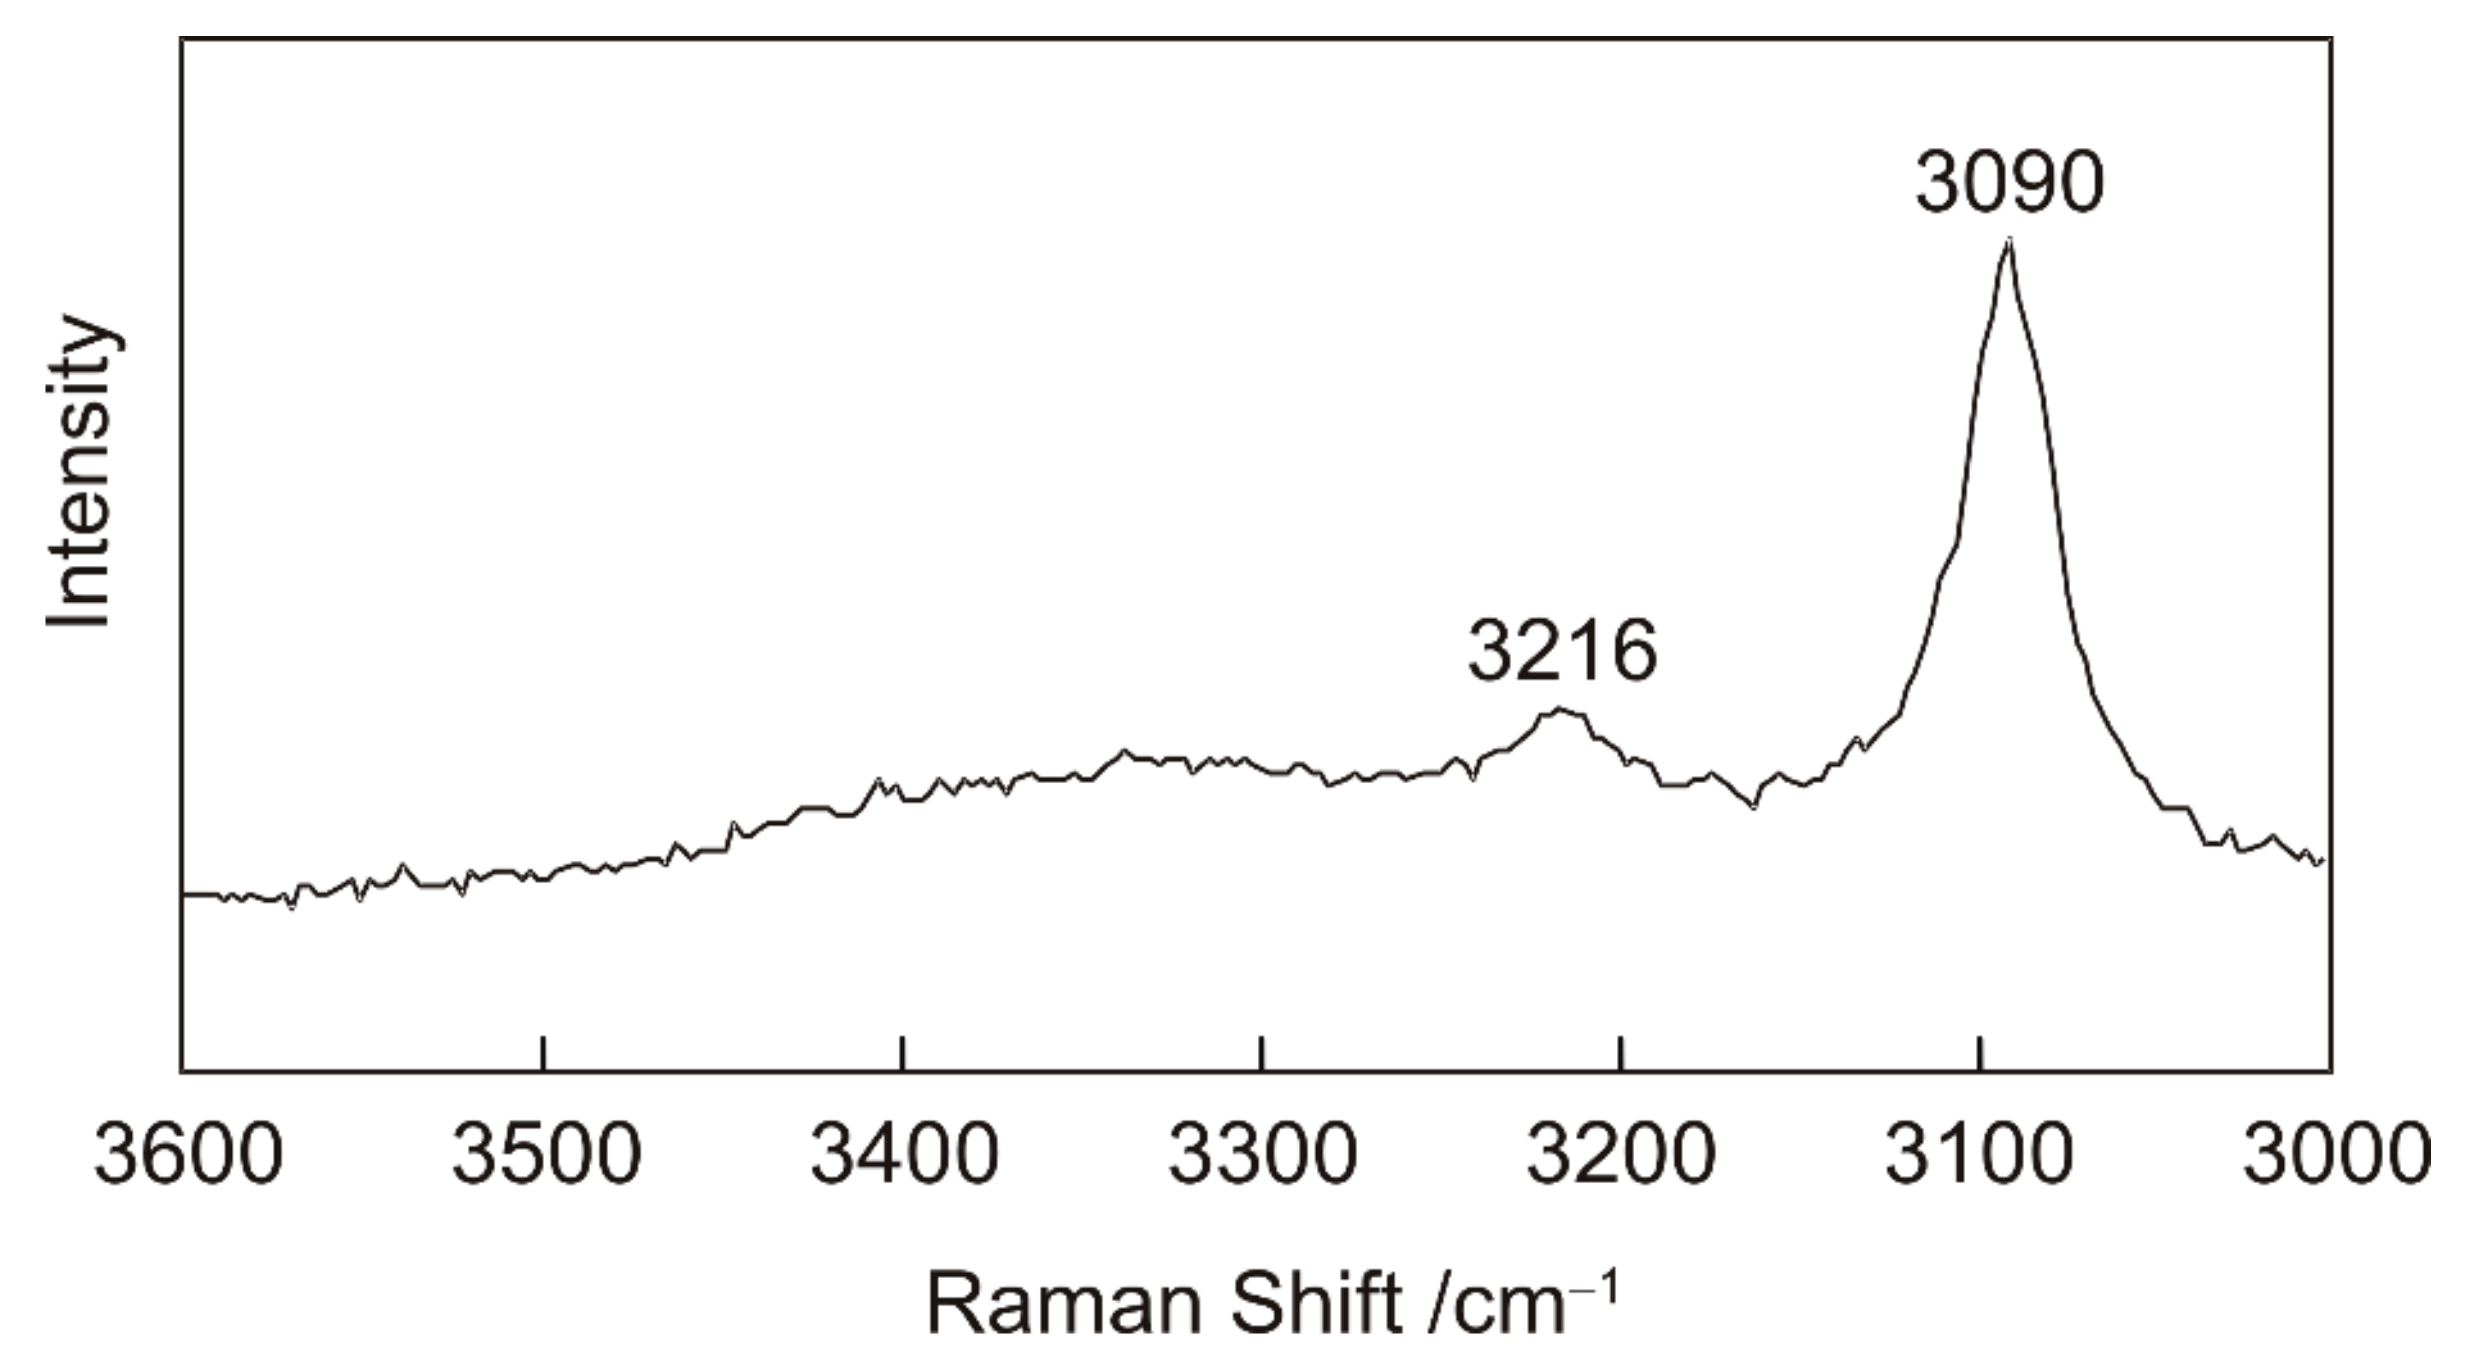
3.1.1. Cryogenic Raman Spectroscopy of H2O

The Raman spectrum of H2O (Figure 1) shows prominent peaks at 3090 and 3216 cm−1, with weaker features at higher wavenumbers. Dubessy et al. [22] assigned these peaks to hexagonal ice (Ih); however, the Raman spectra of cubic ice (Ic) and Ih are identical [32,33]. The cubic ice (Ic) should be the stable phase at −180 °C at which the spectra were collected [34,35]. Although these interpretations of the Raman peaks are inconsistent with each other, there is agreement that these peaks correspond to O–H stretching vibrations in ice. These peaks are also present in all of the chloride solution spectra [22,32,33,34,35].

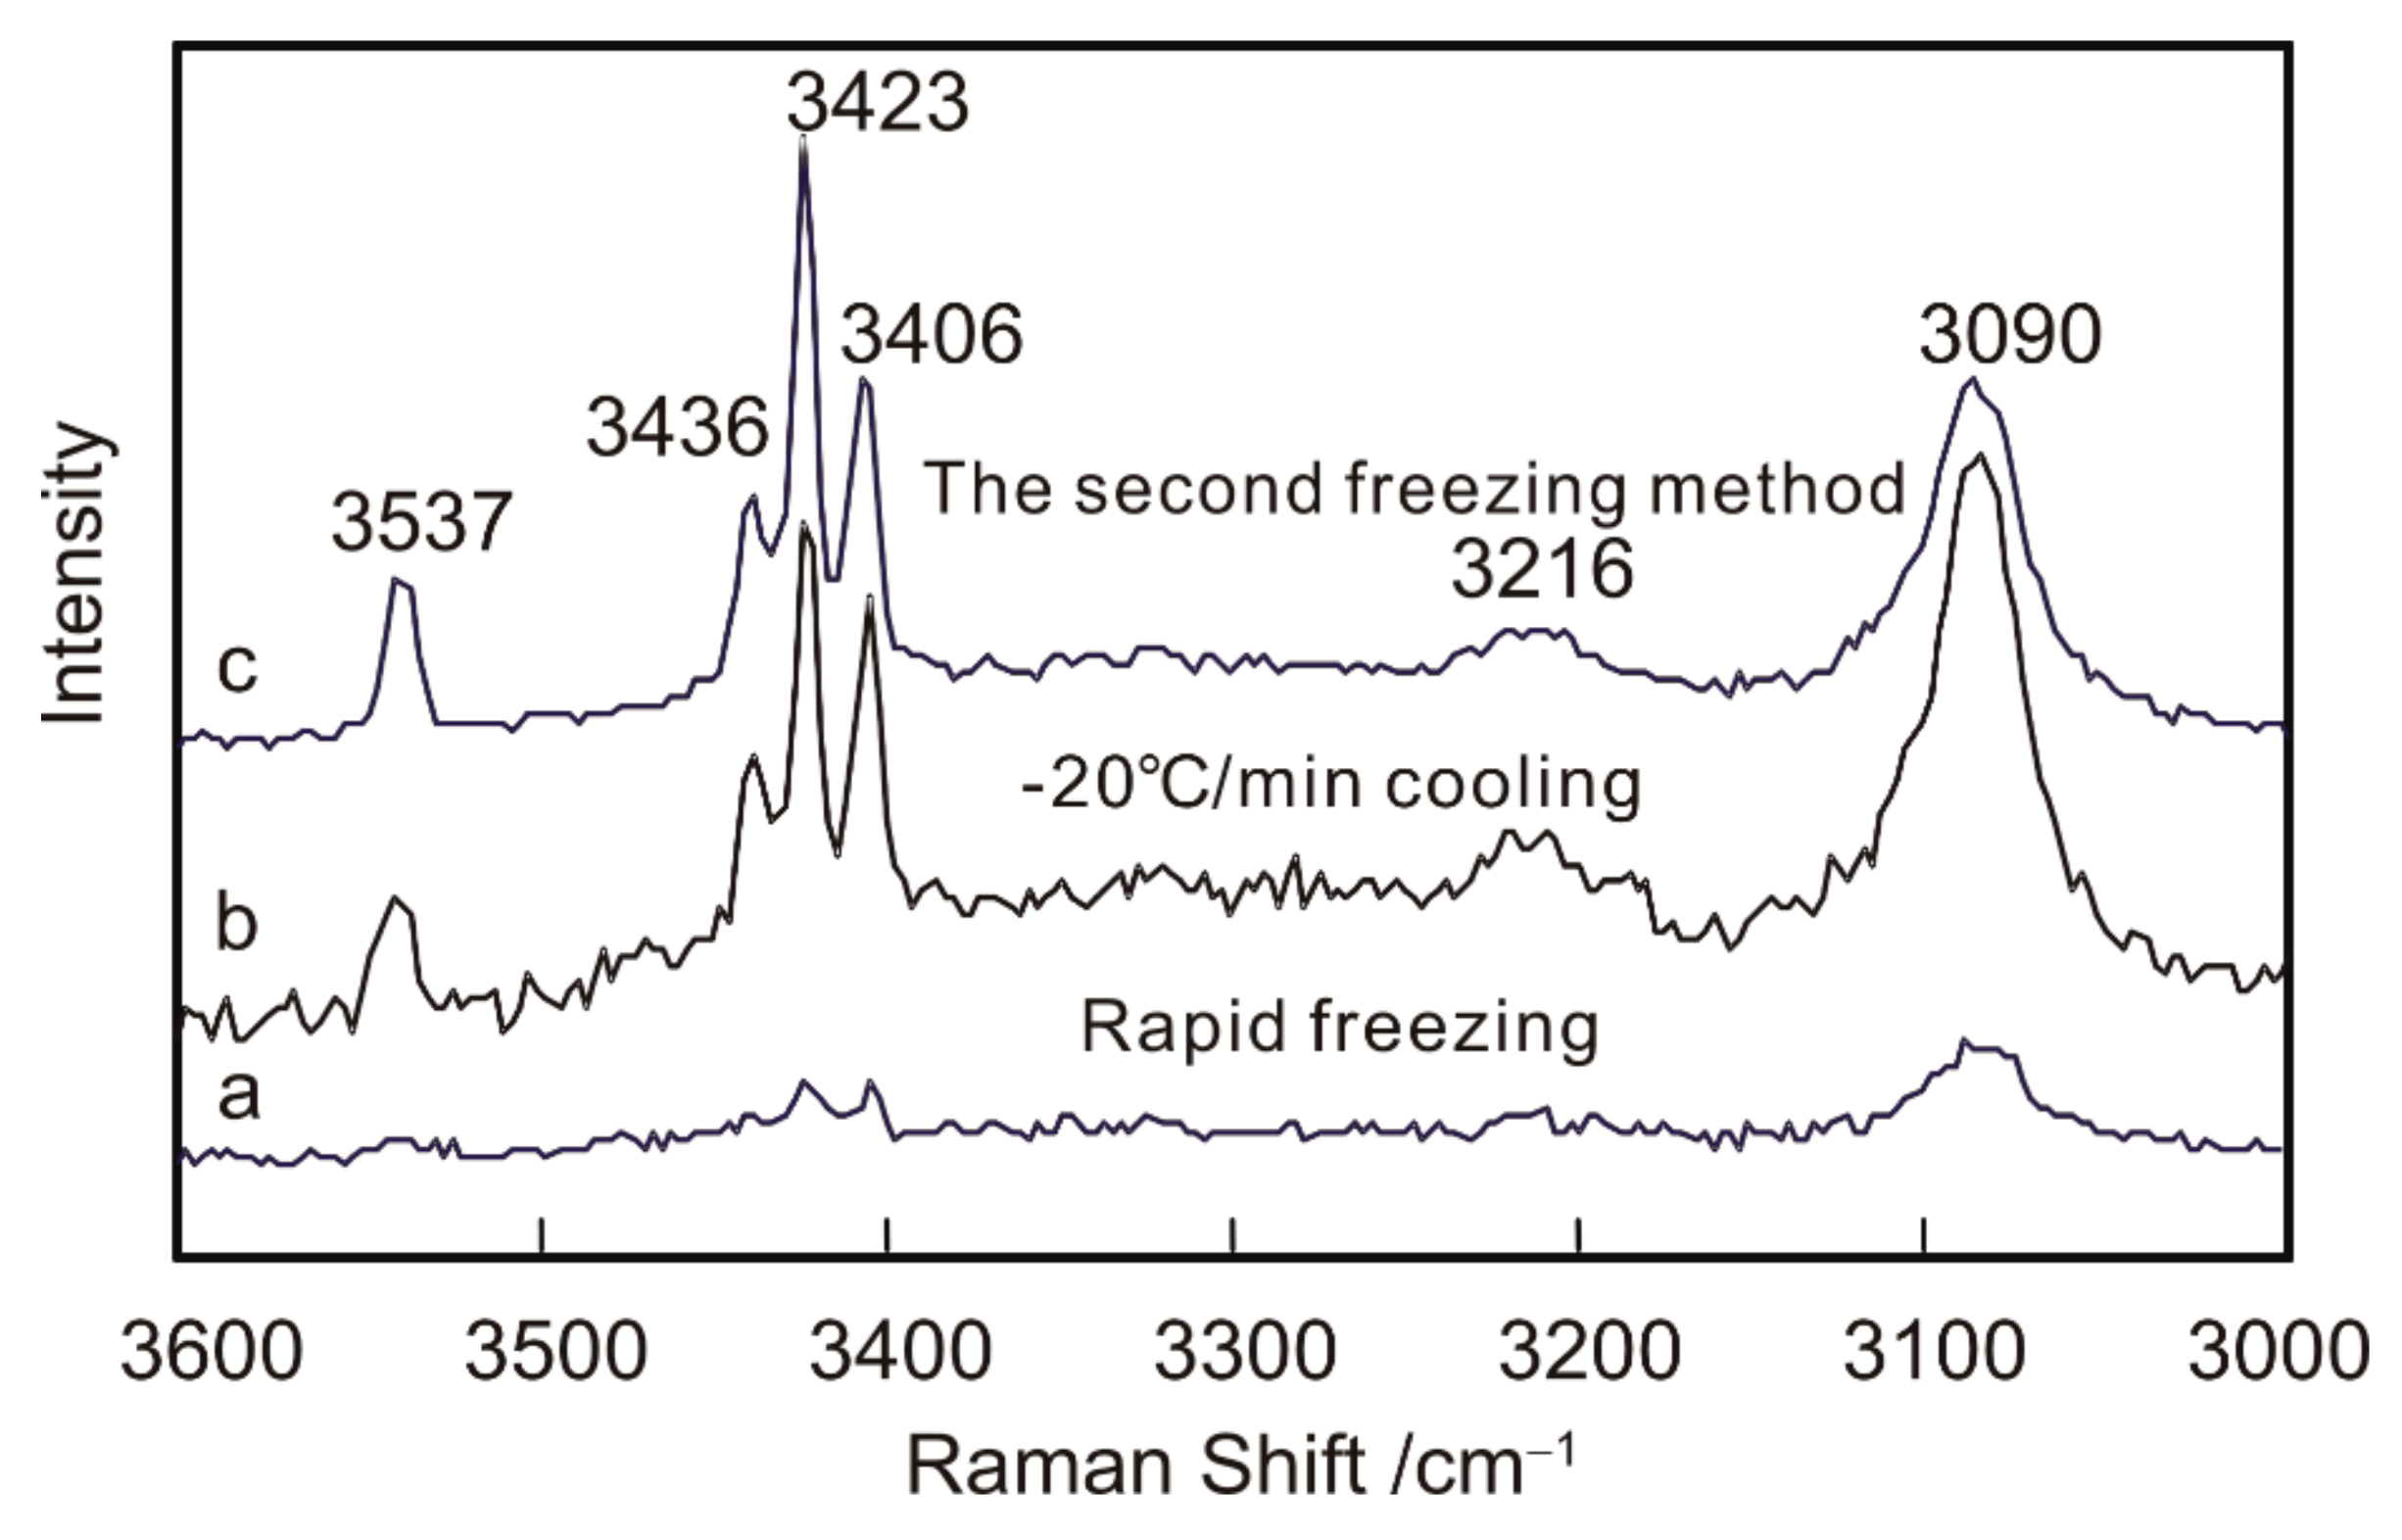
3.1.2. Cryogenic Raman Spectroscopy of NaCl–H2O Solution

Figure 2 shows the Raman spectrum of a 15 wt.% NaCl solution under different cooling conditions. First, a Raman spectrum was taken at −180 °C after rapid cooling of the solution from room temperature (Figure 2a). Raman peaks at 3406 and 3423 cm−1 are present but are weak. Hydrohalite peaks are indistinguishable from background noise, indicating that hydrohalite did not form during the rapid cooling of the solution. The solution was then cooled to −180 °C at a rate of −20 °C/min (Figure 2b). A phase change was observed at approximately −40 °C. Peaks at 3406, 3423, 3436, and 3537 cm−1 are sharp, indicating that hydrohalite is able to form more readily under these cooling conditions. A third spectrum (Figure 2c) was taken by the secondary method [26,34,35], whereby the solution was rapidly cooled to −180 °C, slowly warmed until a phase change was observed (−20 °C), and then quickly re-cooled to −180 °C. Under these conditions, peaks at 3406, 3423, 3436, and 3537 cm−1 are well defined and symmetrical, indicating that this is an ideal method for crystallizing hydrohalite.
Davis et al. [36], Vanko et al. [37], and Ni et al. [26] showed that Raman spectra collected during the rapid cooling of a solution to −180 °C exhibit a prominent ice peak (3090 cm−1); however, the characteristic peaks of hydrohalite are not present. When the solution is warmed slowly to within the range −40 to −22 °C, a visible phase change occurs that represents the crystallization of hydrohalite. If the solution is again cooled rapidly to −180 °C, ideal Raman spectra of hydrohalite are obtained. In the present study, Raman spectra show only the ice peak (3090 cm−1) in the case of rapid cooling. However, the spectrum taken after cooling from room temperature at a rate of −20 °C/min is similar to that taken after secondary freezing, and a phase change can be observed at approximately −40 °C. Therefore, hydrohalite forms by both slow cooling and secondary freezing.

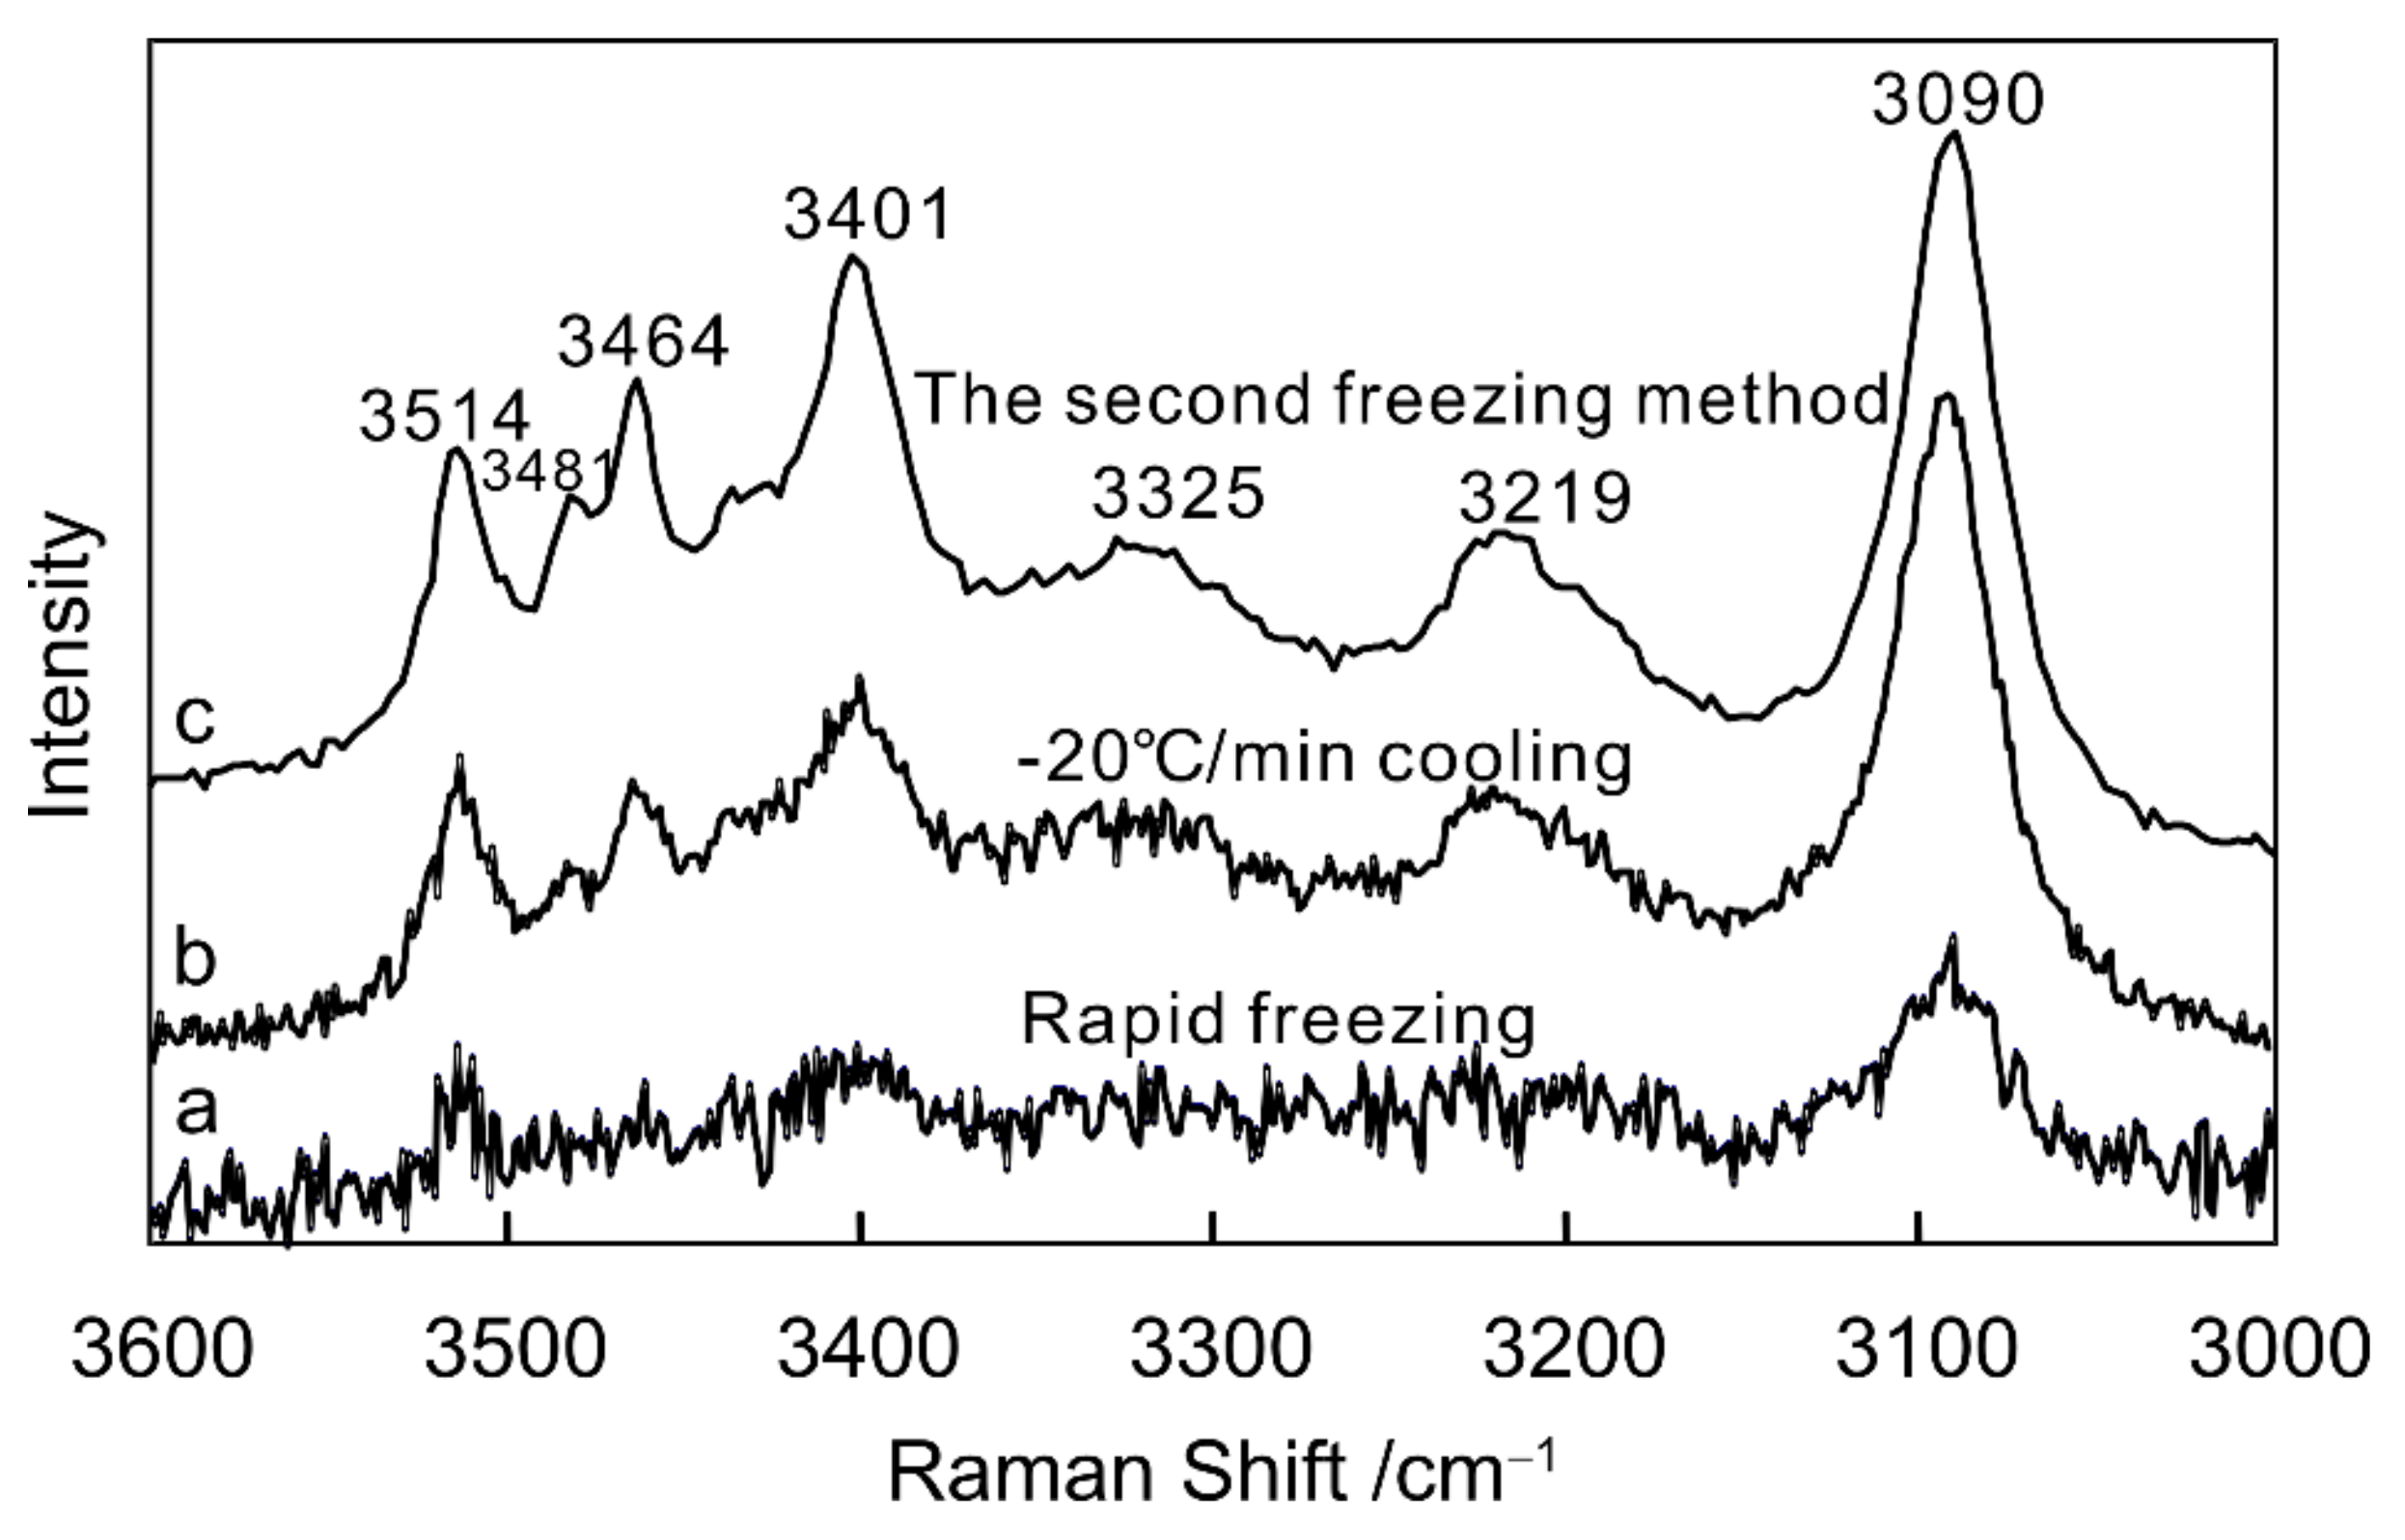
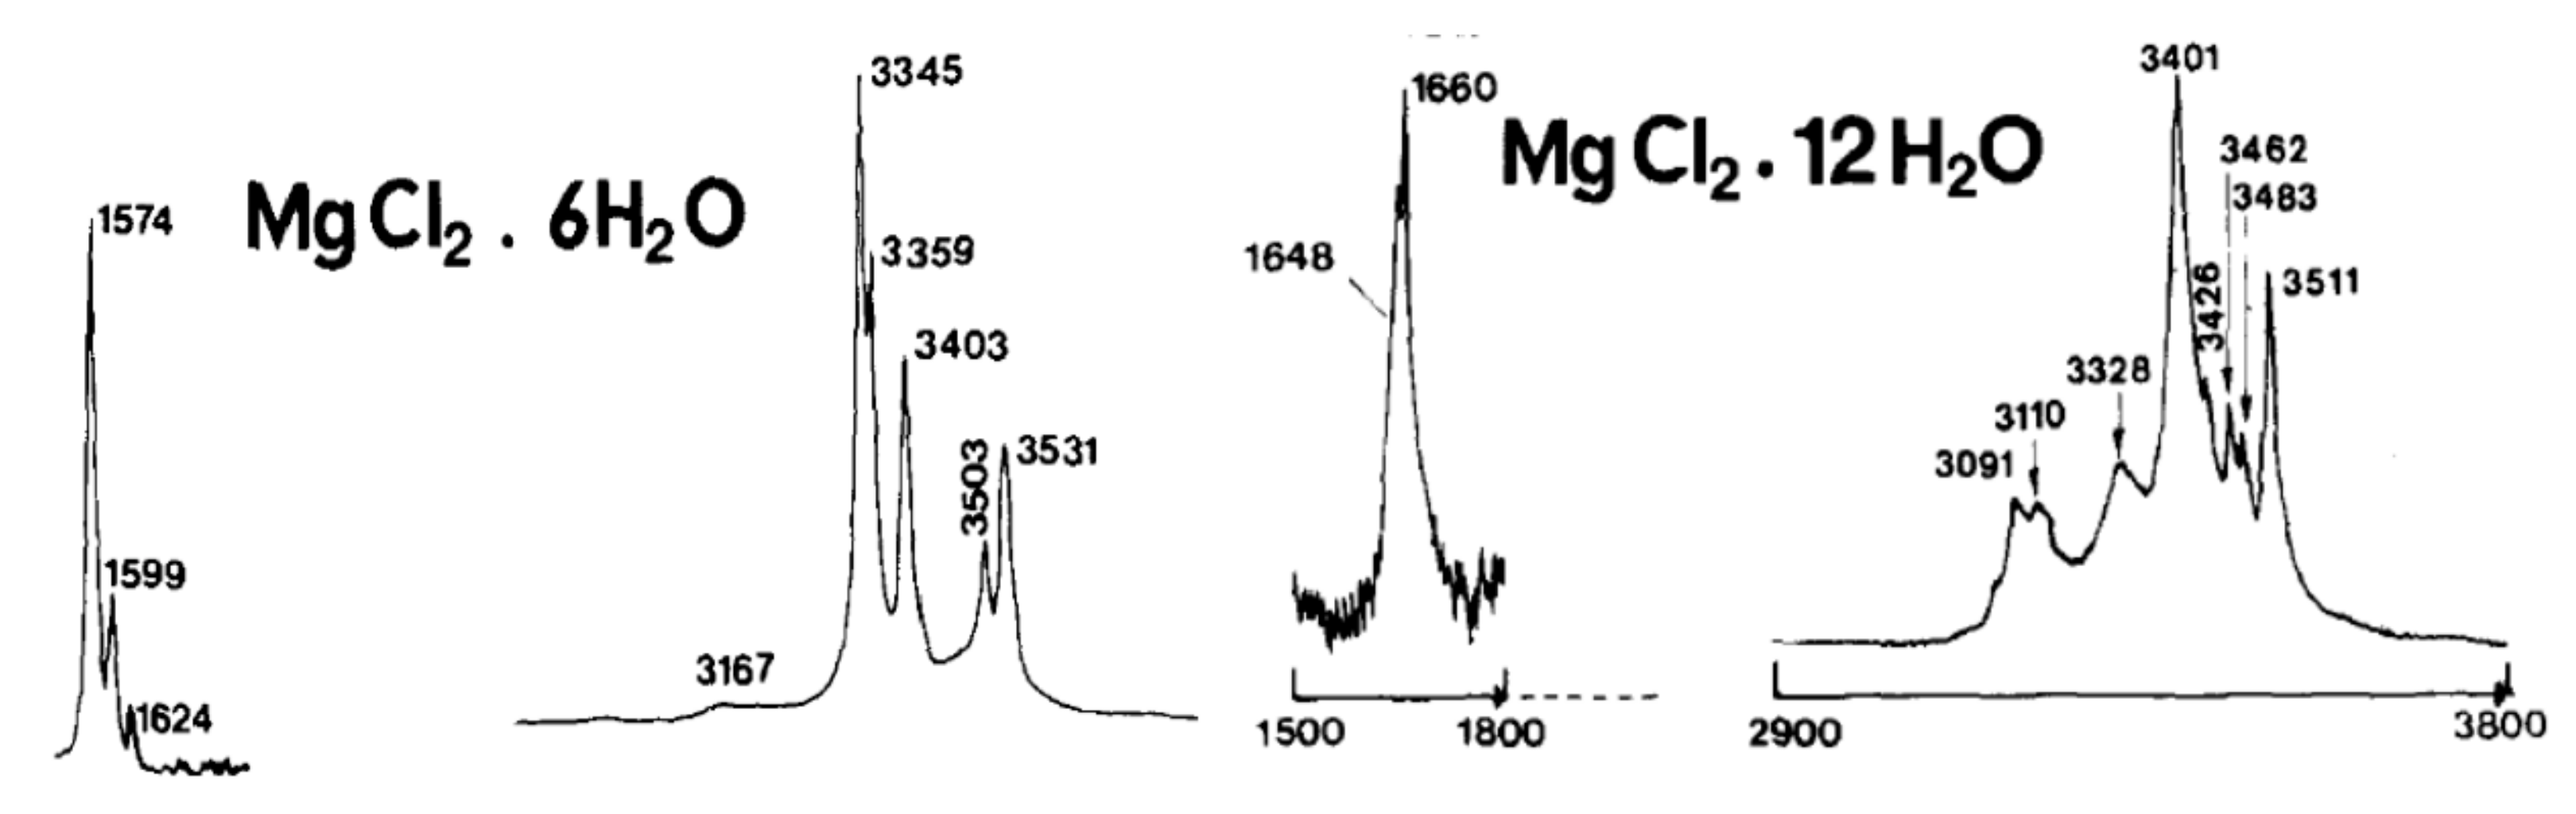
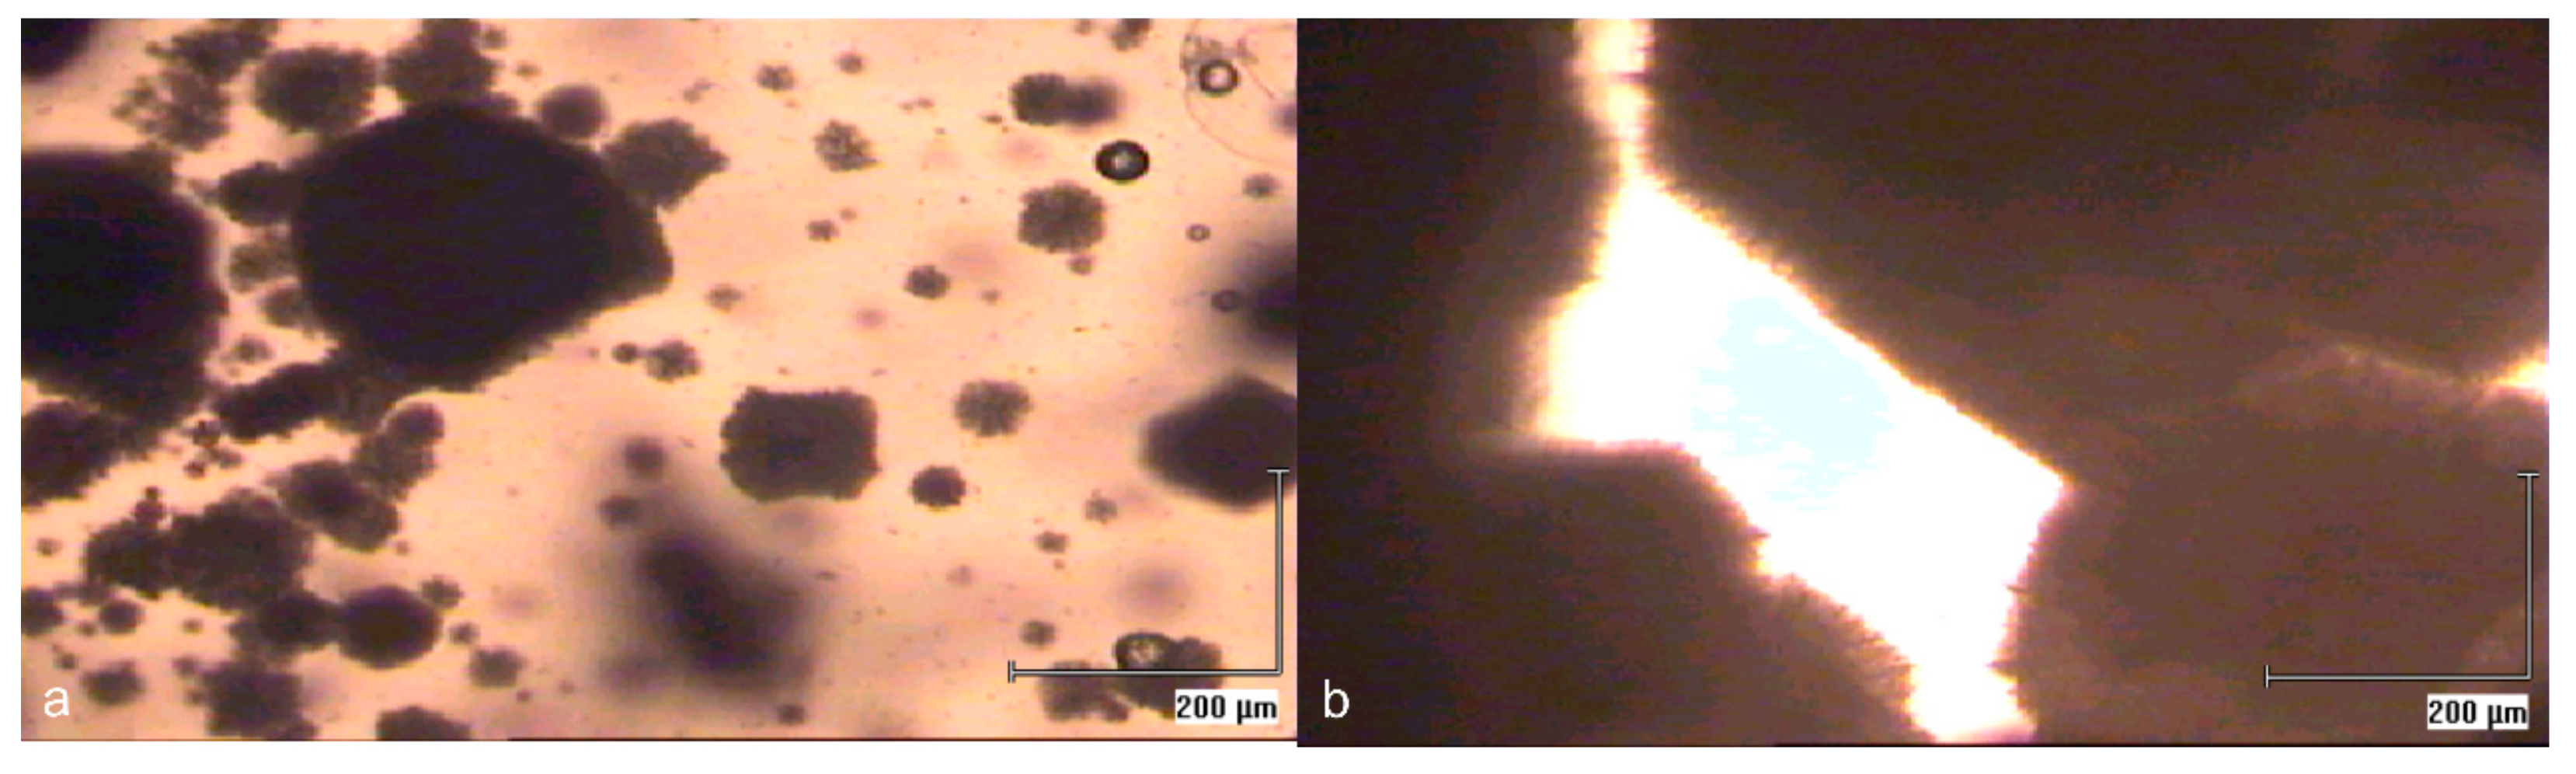
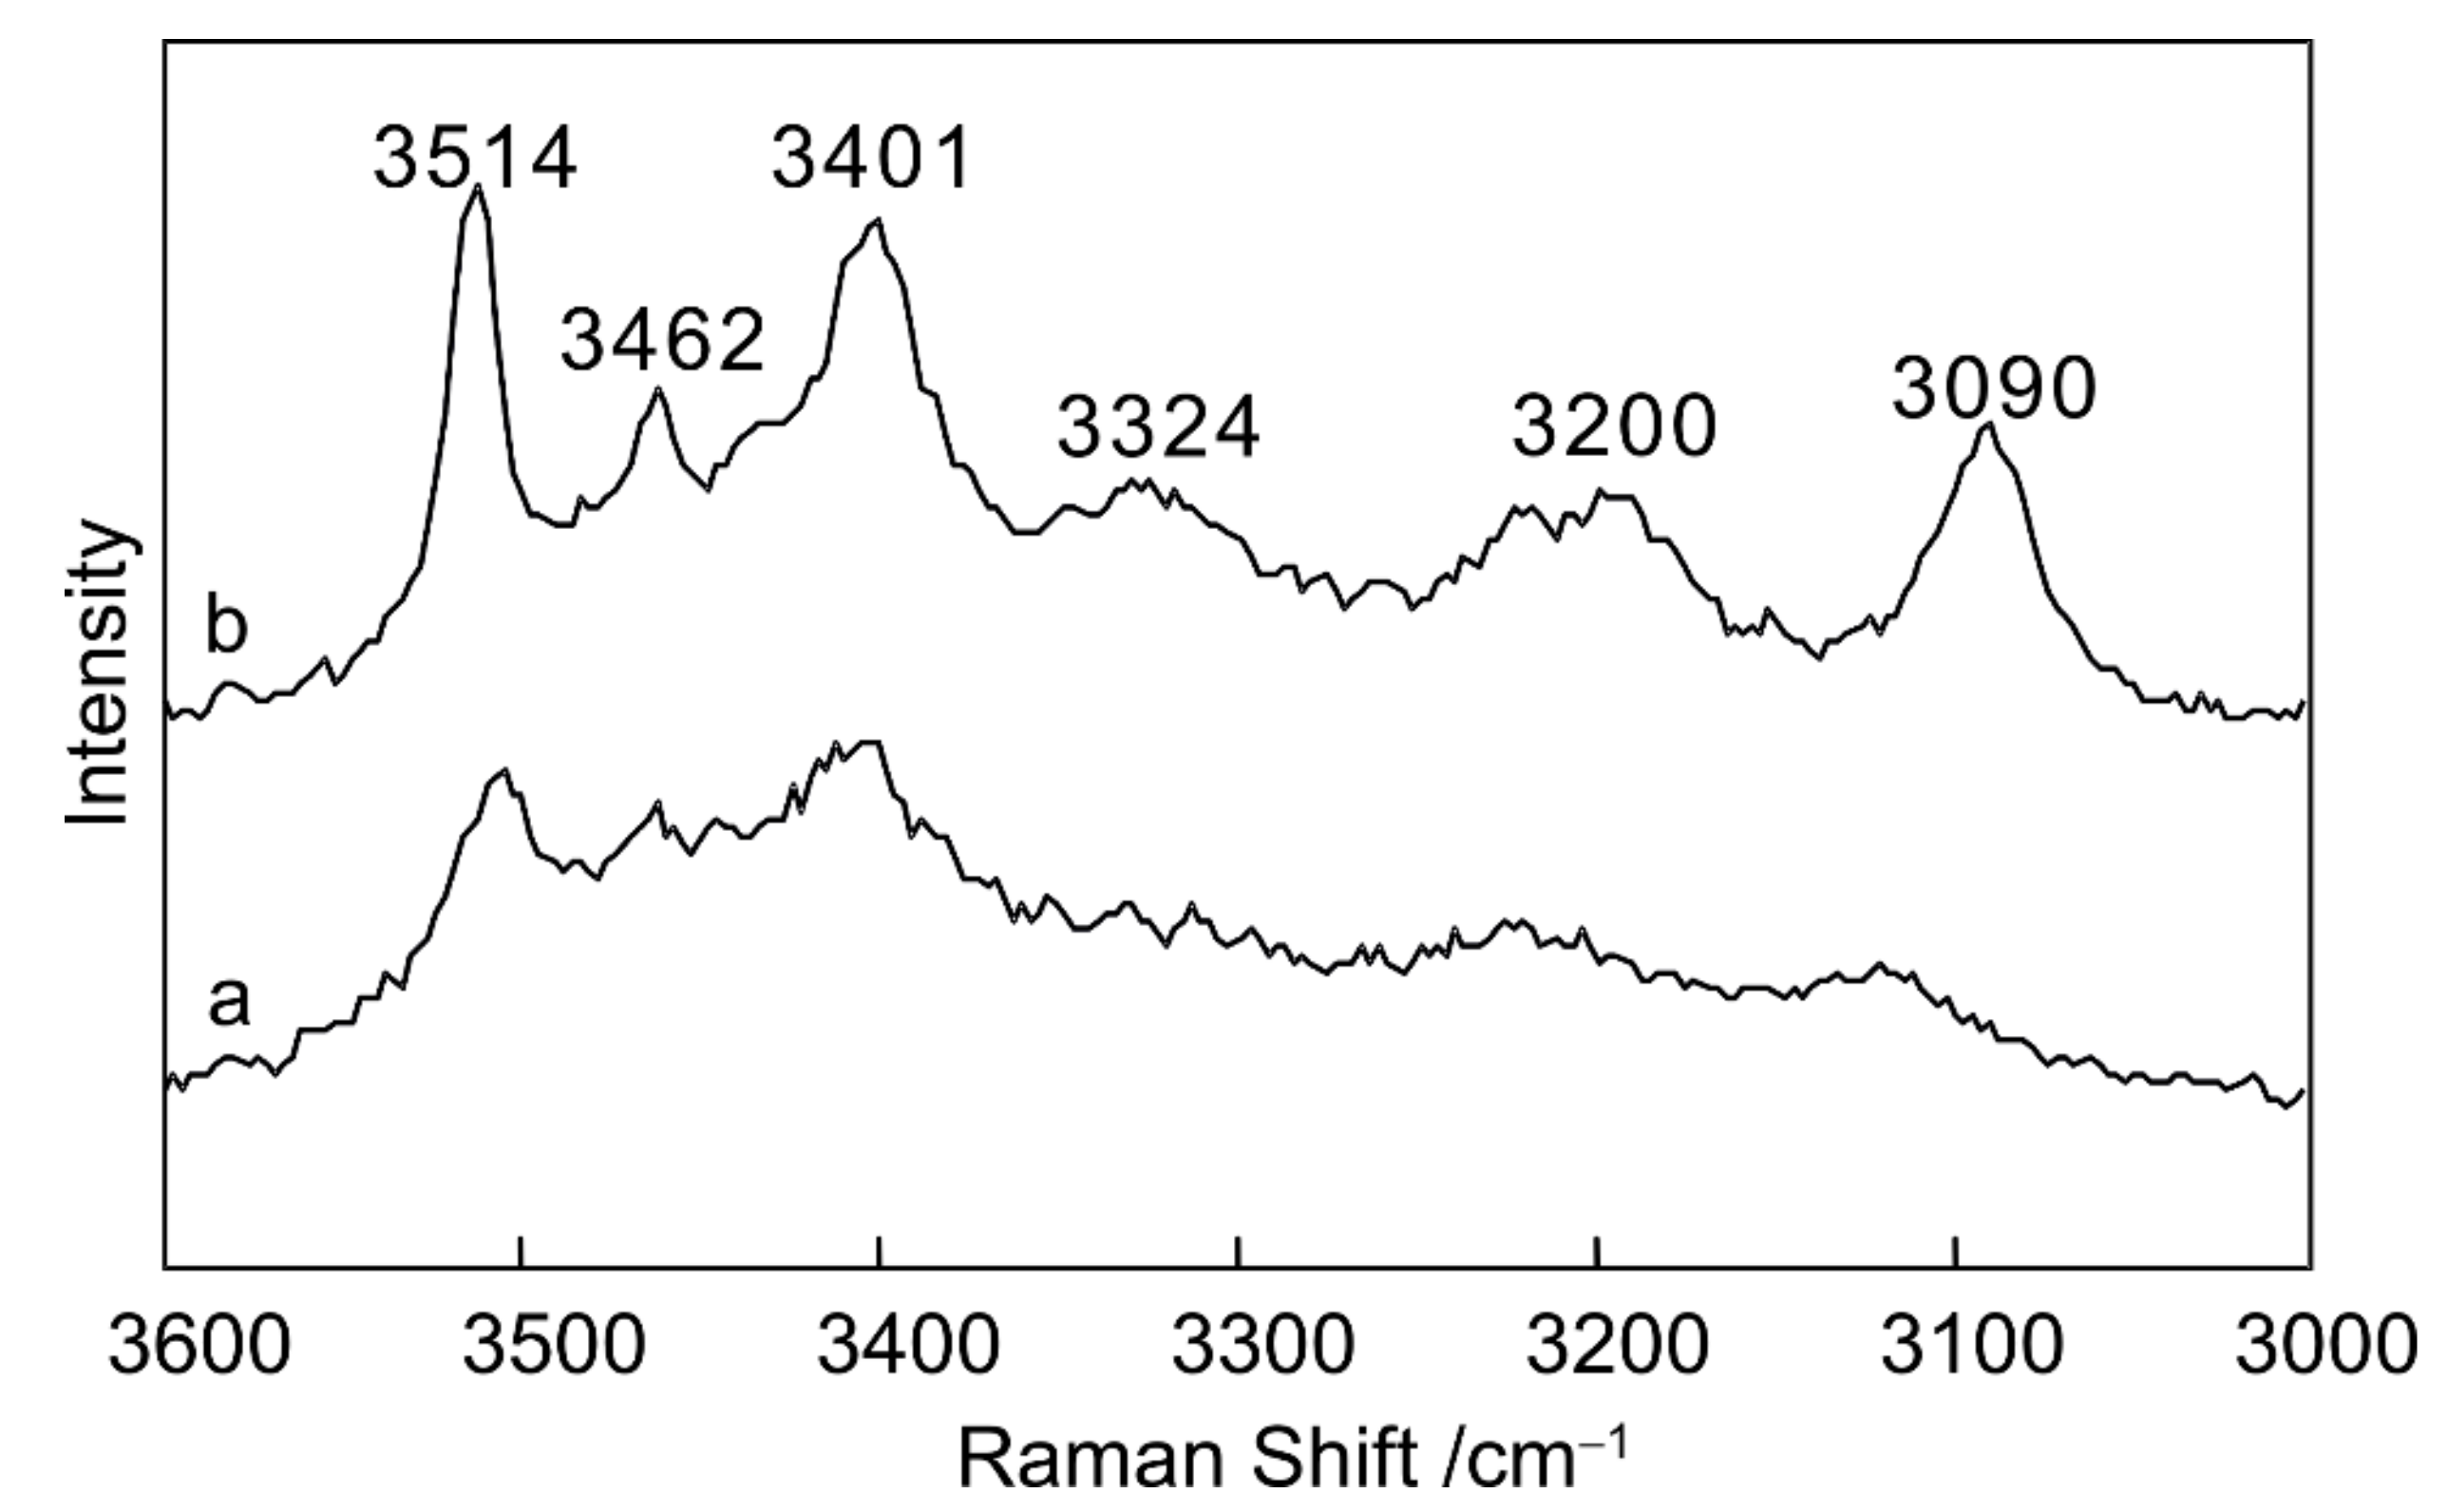
3.1.3. Cryogenic Raman Spectroscopy of MgCl2–H2O Solution

Figure 3 shows the Raman spectra of a 9.37 wt.% MgCl2 solution cooled to −180 °C under different cooling conditions. The characteristic ice peaks occur at 3090 and 3219 cm−1 [32,33], and peaks at 3325, 3401, 3464, 3481, and 3514 cm−1 are related to O–H stretching vibrations in the MgCl2 hydrate structure [22]. The spectrum of the 9.37 wt.% MgCl2 solution cooled by the secondary freezing method is similar to that of MgCl2·12H2O reported by Dubessy et al. [22]; however, it differs from the spectrum of MgCl2·6H2O (Figure 4). Similar to the behavior of the NaCl–H2O solution, the hydrate peaks are indistinguishable from background noise when the MgCl2–H2O solution is cooled rapidly, and ice peaks are only weakly developed (Figure 3a). This finding suggests that MgCl2 hydrates do not form under conditions of rapid cooling. When the solution was cooled from room temperature to −180 °C at a rate of −20 °C/min a phase change was not observed, and peaks at 3401, 3464, and 3514 cm−1 are poorly developed; at 3325 and 3481 cm−1 they are indistinguishable from background noise. Thus, it is concluded that only minor MgCl2 hydrate, or hydrate with a low degree of crystallinity, formed by this cooling method. Under conditions of secondary cooling, no phase change was observed; however, well-developed peaks occur at 3325, 3401, 3464, 3481, and 3514 cm−1. Therefore, secondary freezing is the most effective experimental method for crystallizing MgCl2 hydrates.
No phase changes were observed in experiments on solutions with concentrations of 2.34, 9.37, and 16.40 wt.% MgCl2; however, a phase change was observed between −70 and −64.5 °C when a frozen solution containing 23.43 wt.% MgCl2 was warmed. Initially, small hexagonal crystals were observed to form, after which coarse crystals formed rapidly (Figure 5). The Raman spectra of the MgCl2 hydrate collected at the end of the phase change (Figure 6a) are less well-developed than those collected after the solution was re-cooled to −180 °C (Figure 6b). This indicates that poorly crystalline MgCl2 hydrate begins to form when the frozen solution is heated to −70 to −64.5 °C, and MgCl2 hydrates recrystallize to form more well-developed crystalline polymorph during secondary freezing.
Thus, the most effective method for crystallizing MgCl2 hydrate is rapid cooling to −180 °C, followed by slow warming to completion of the phase change (−20 °C) and rapid cooling to −180 °C.

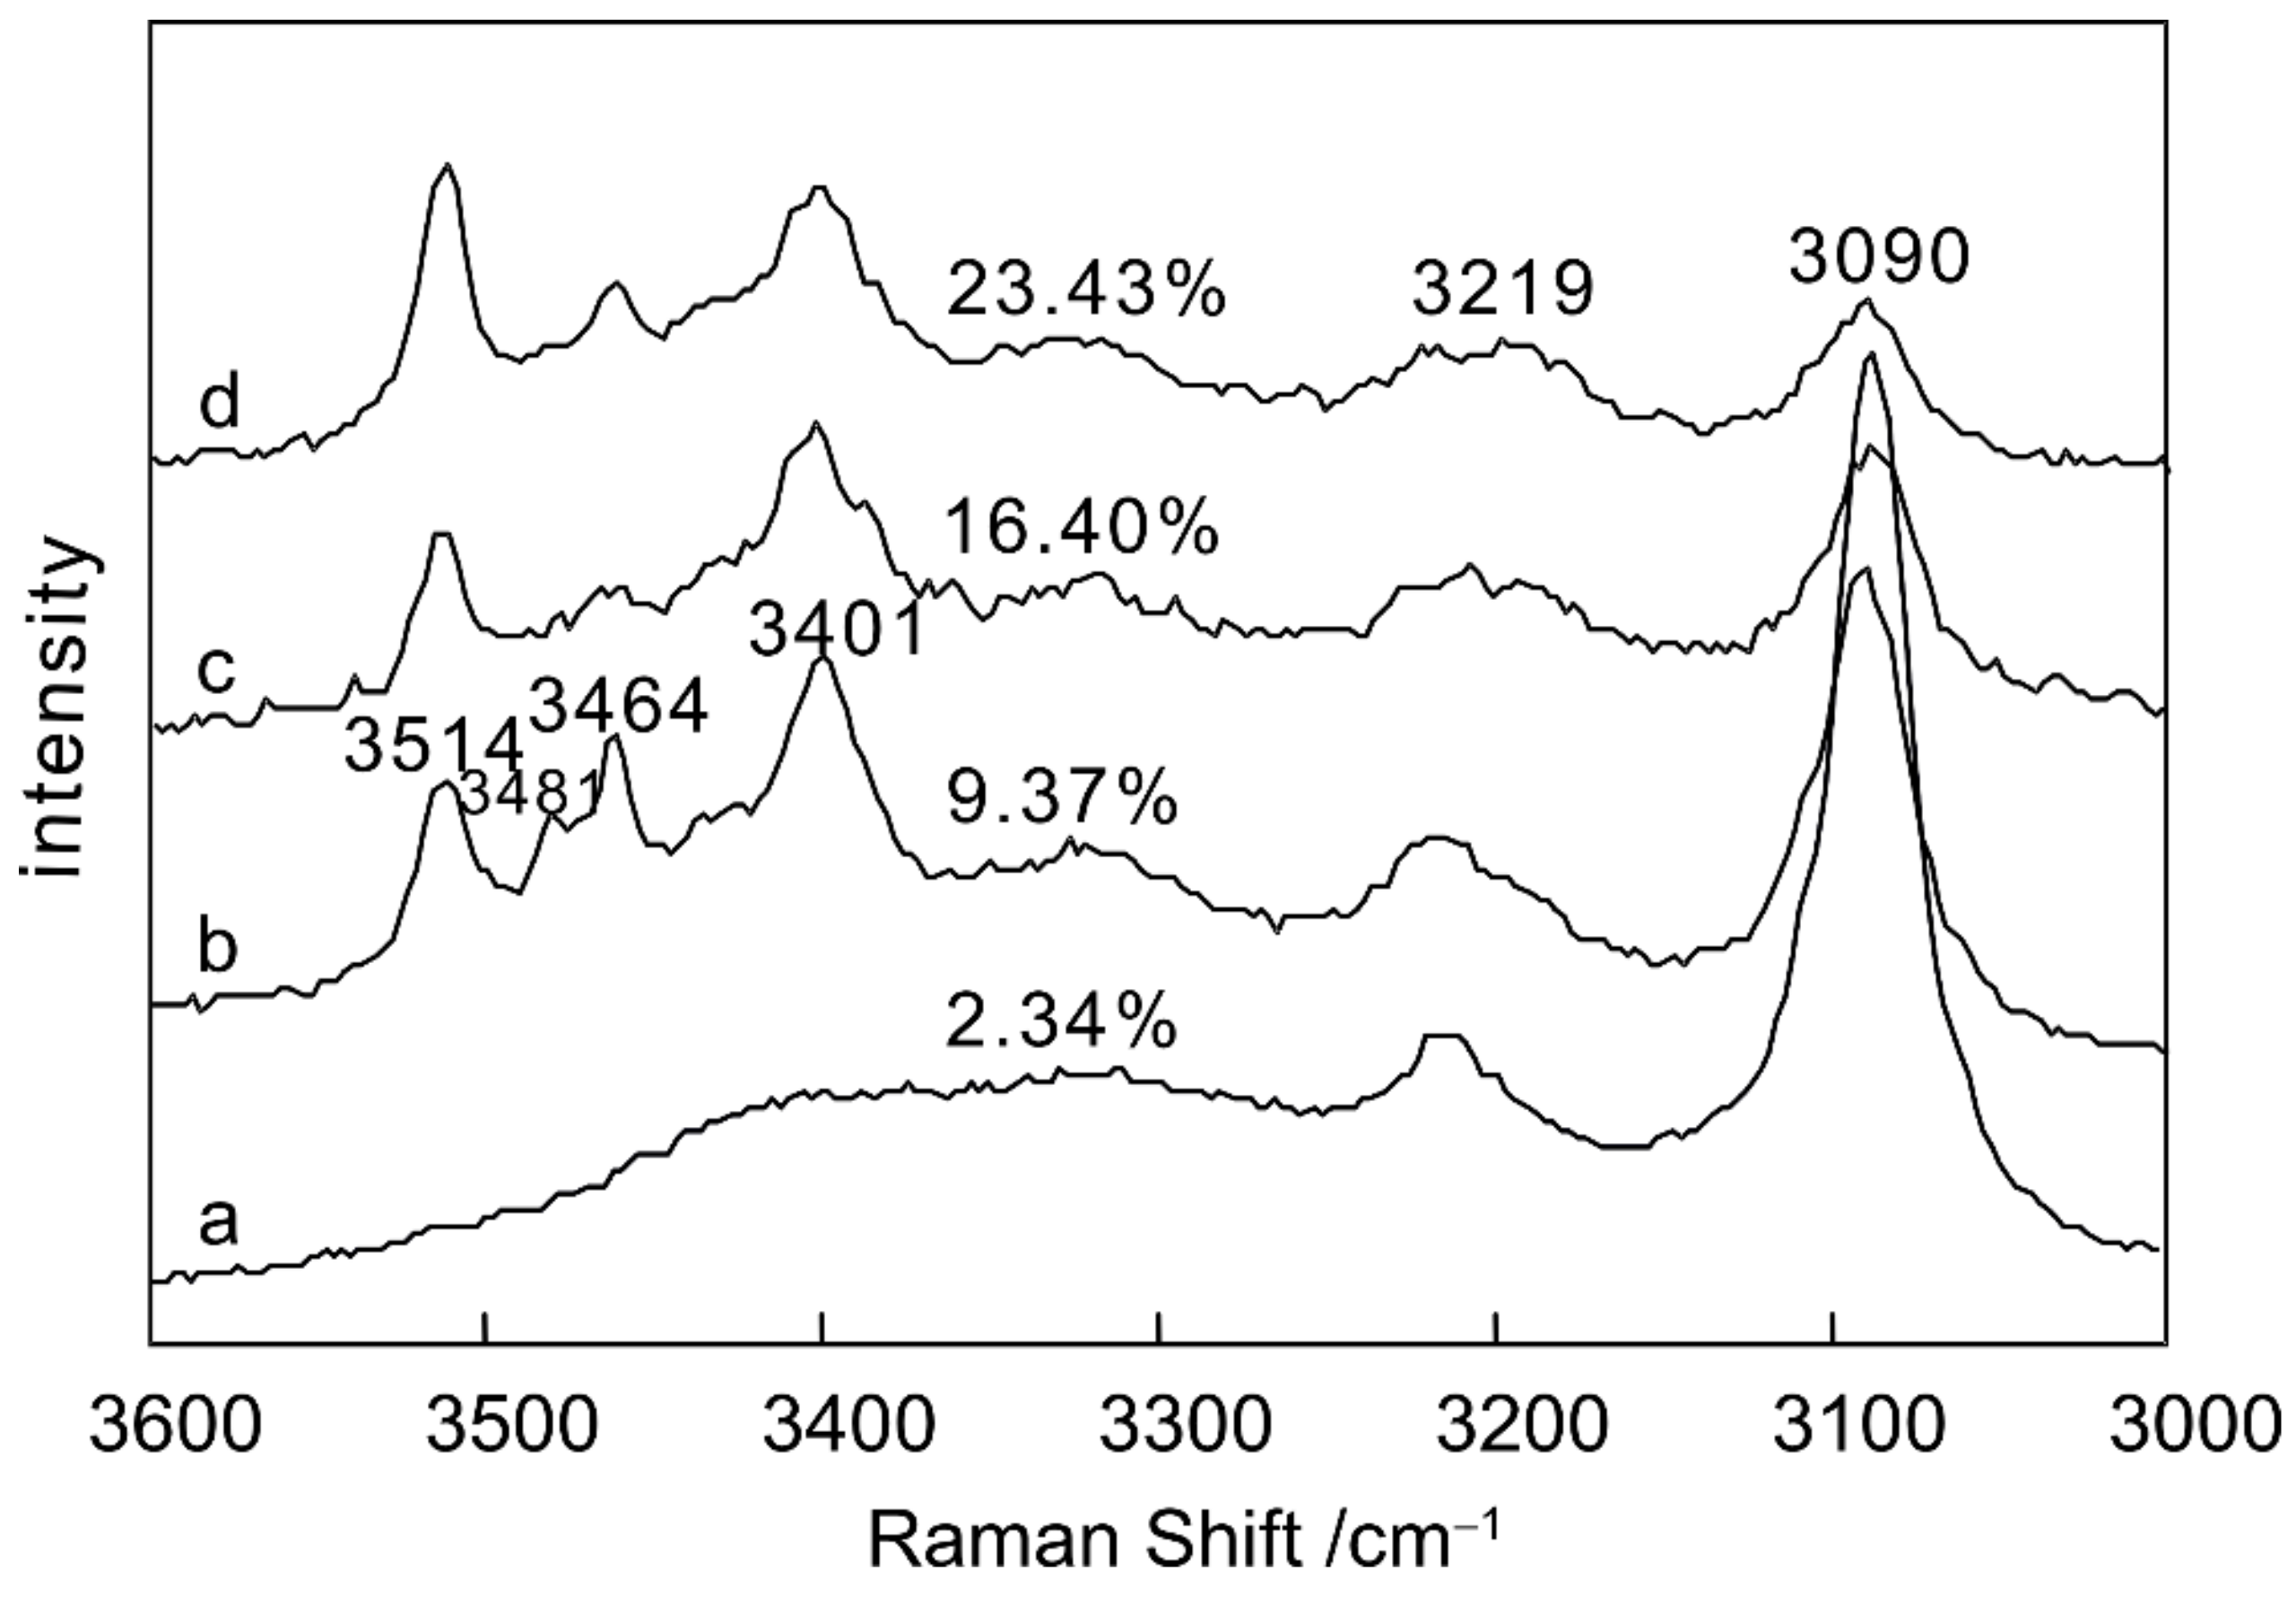
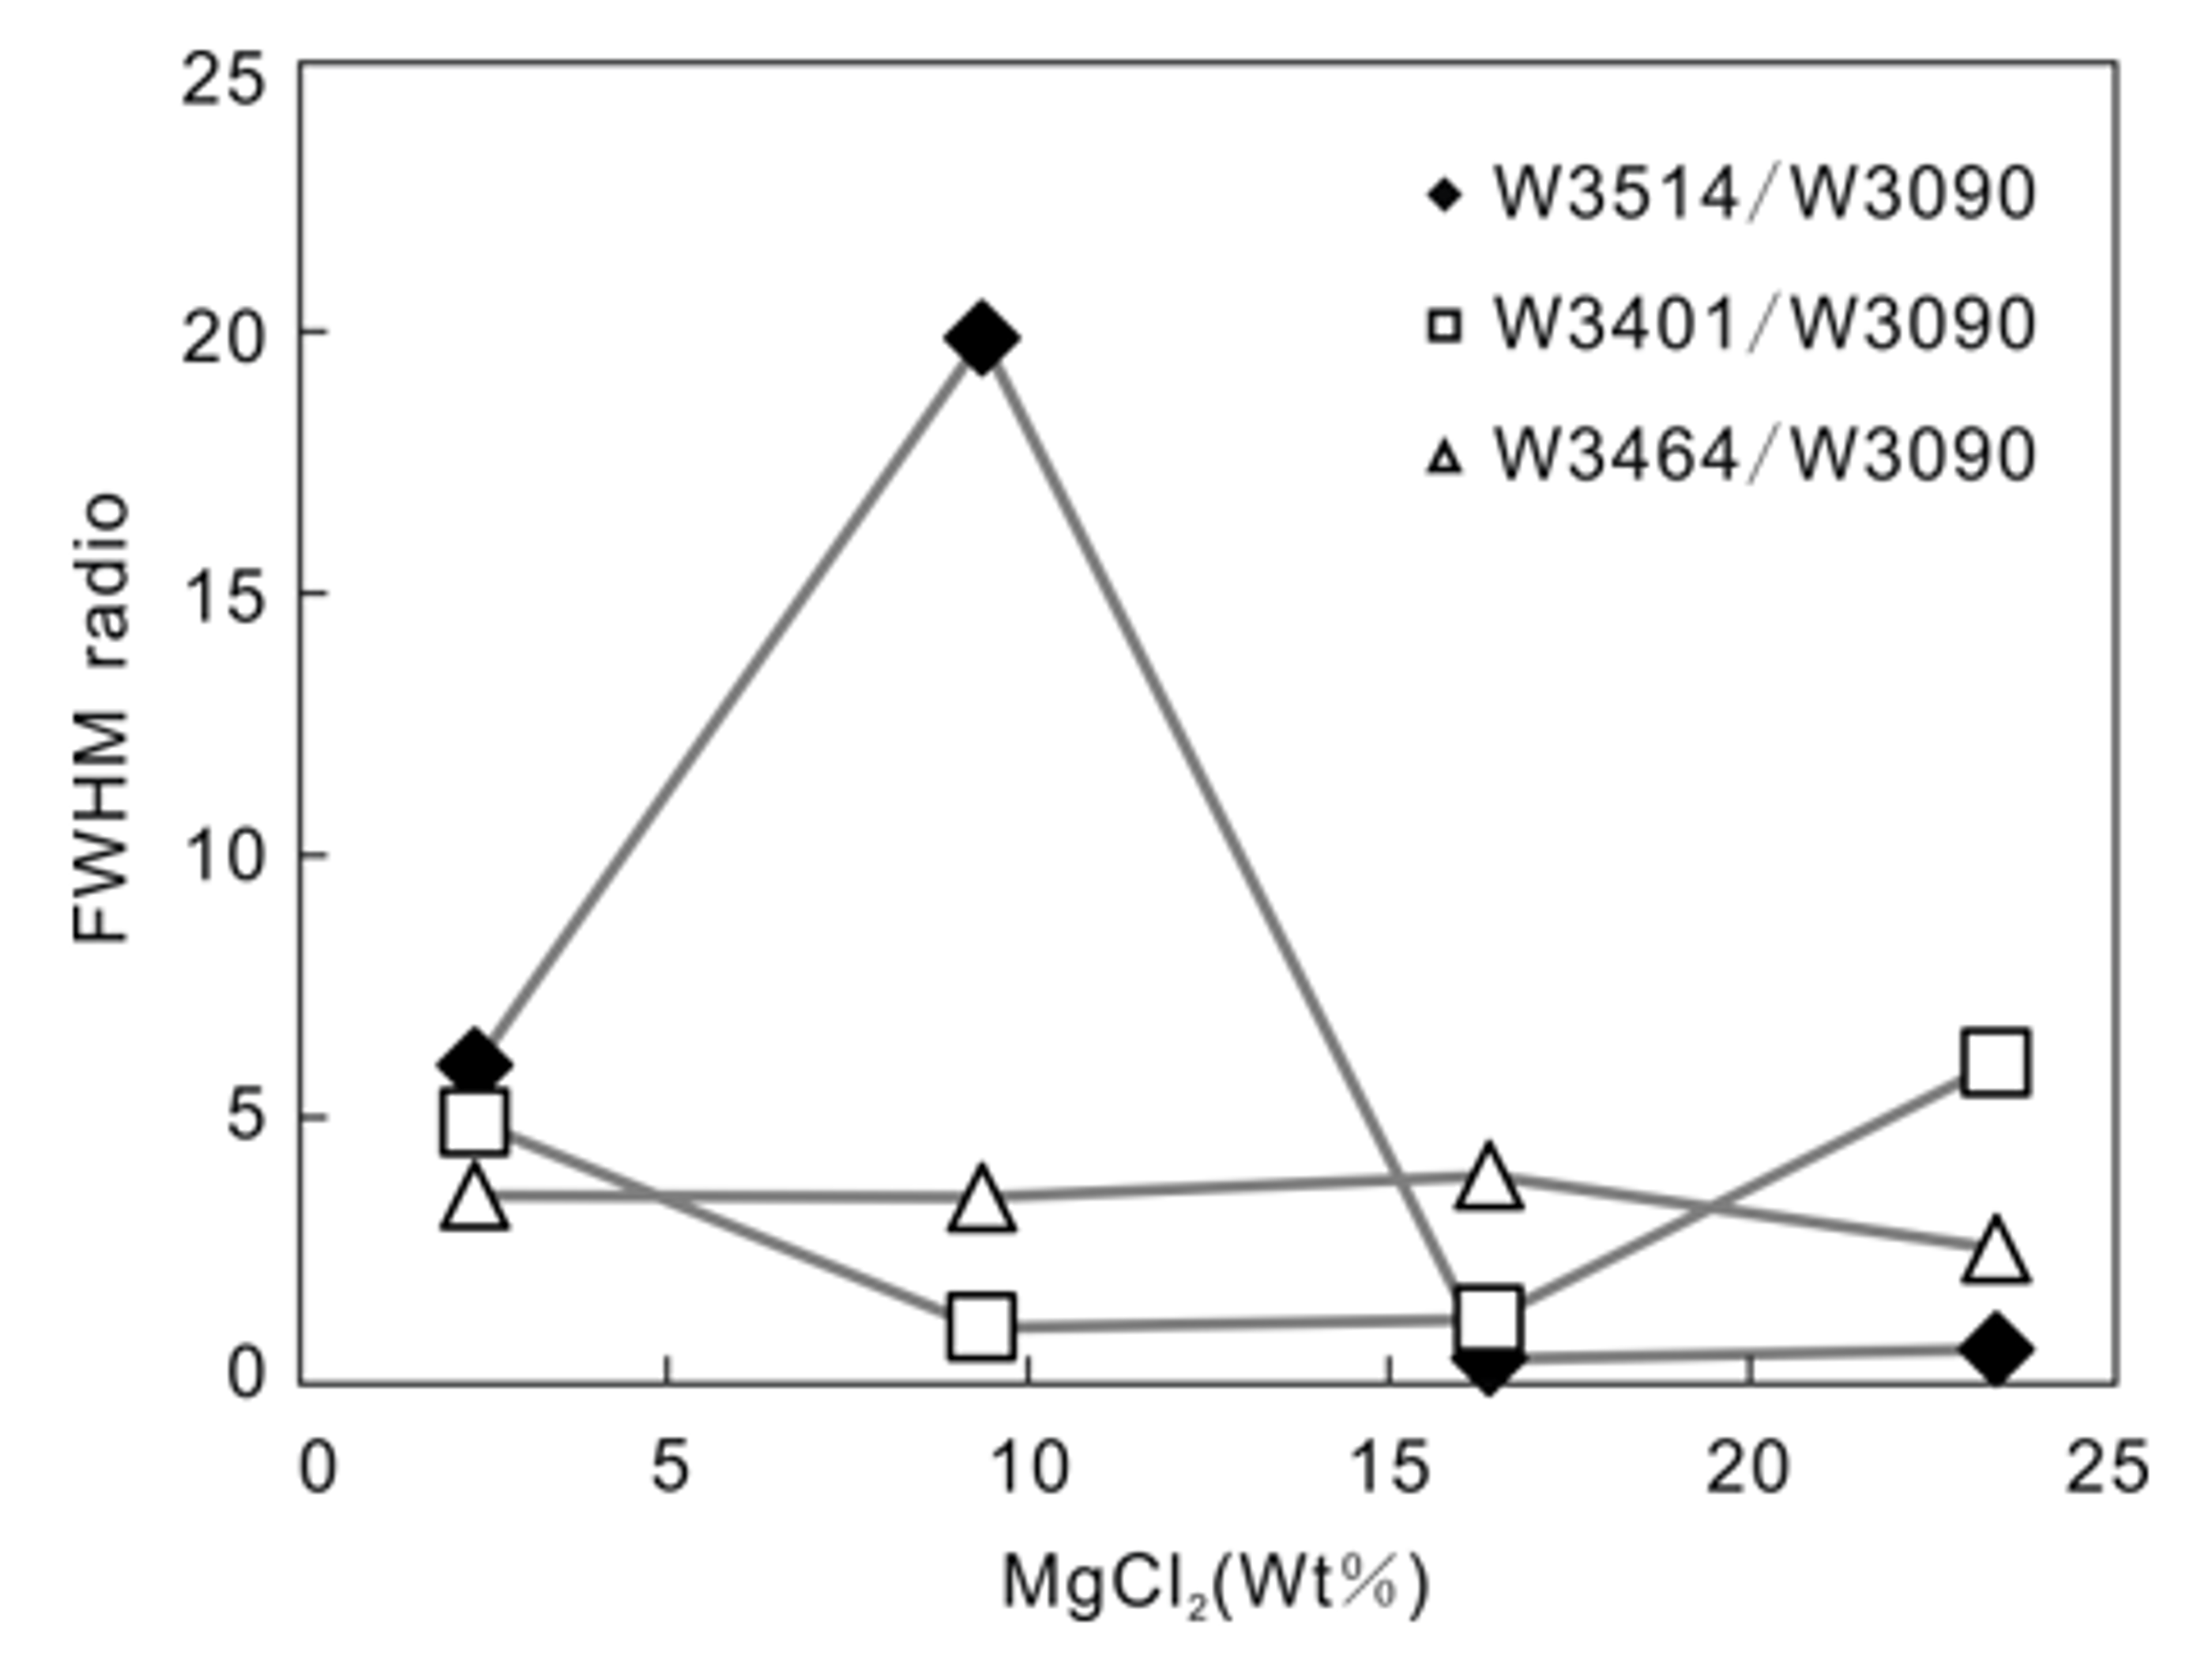
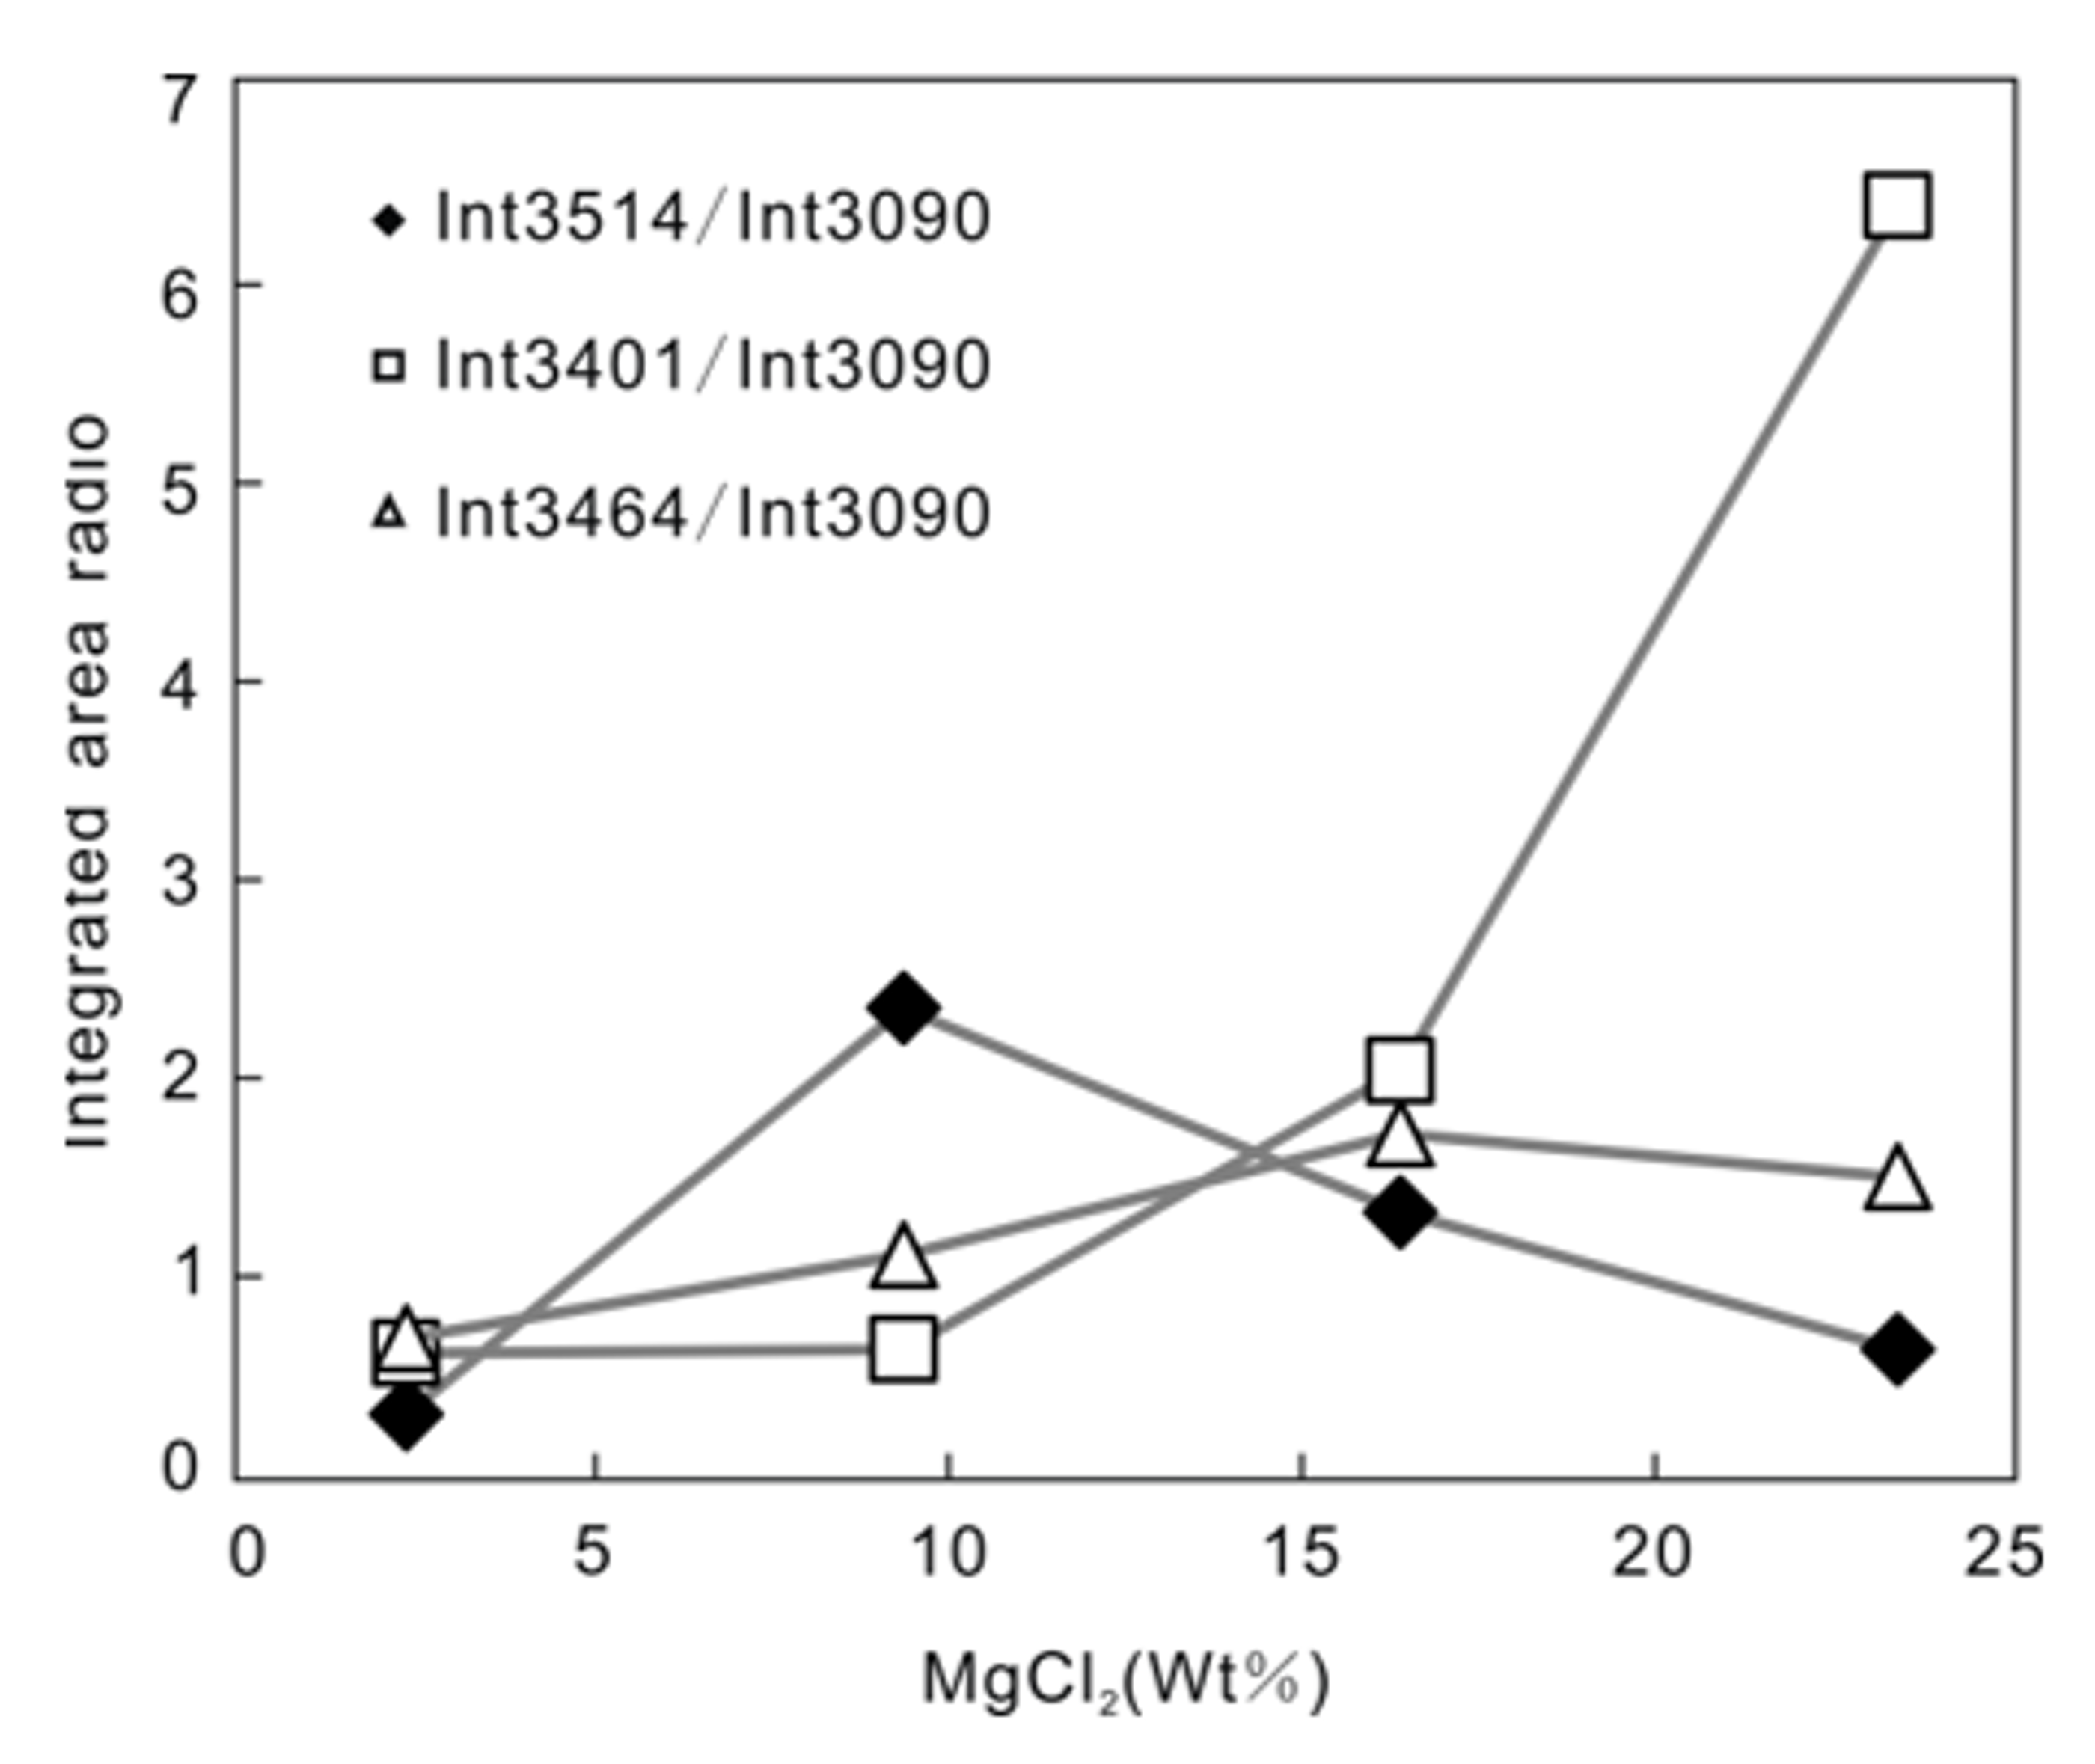
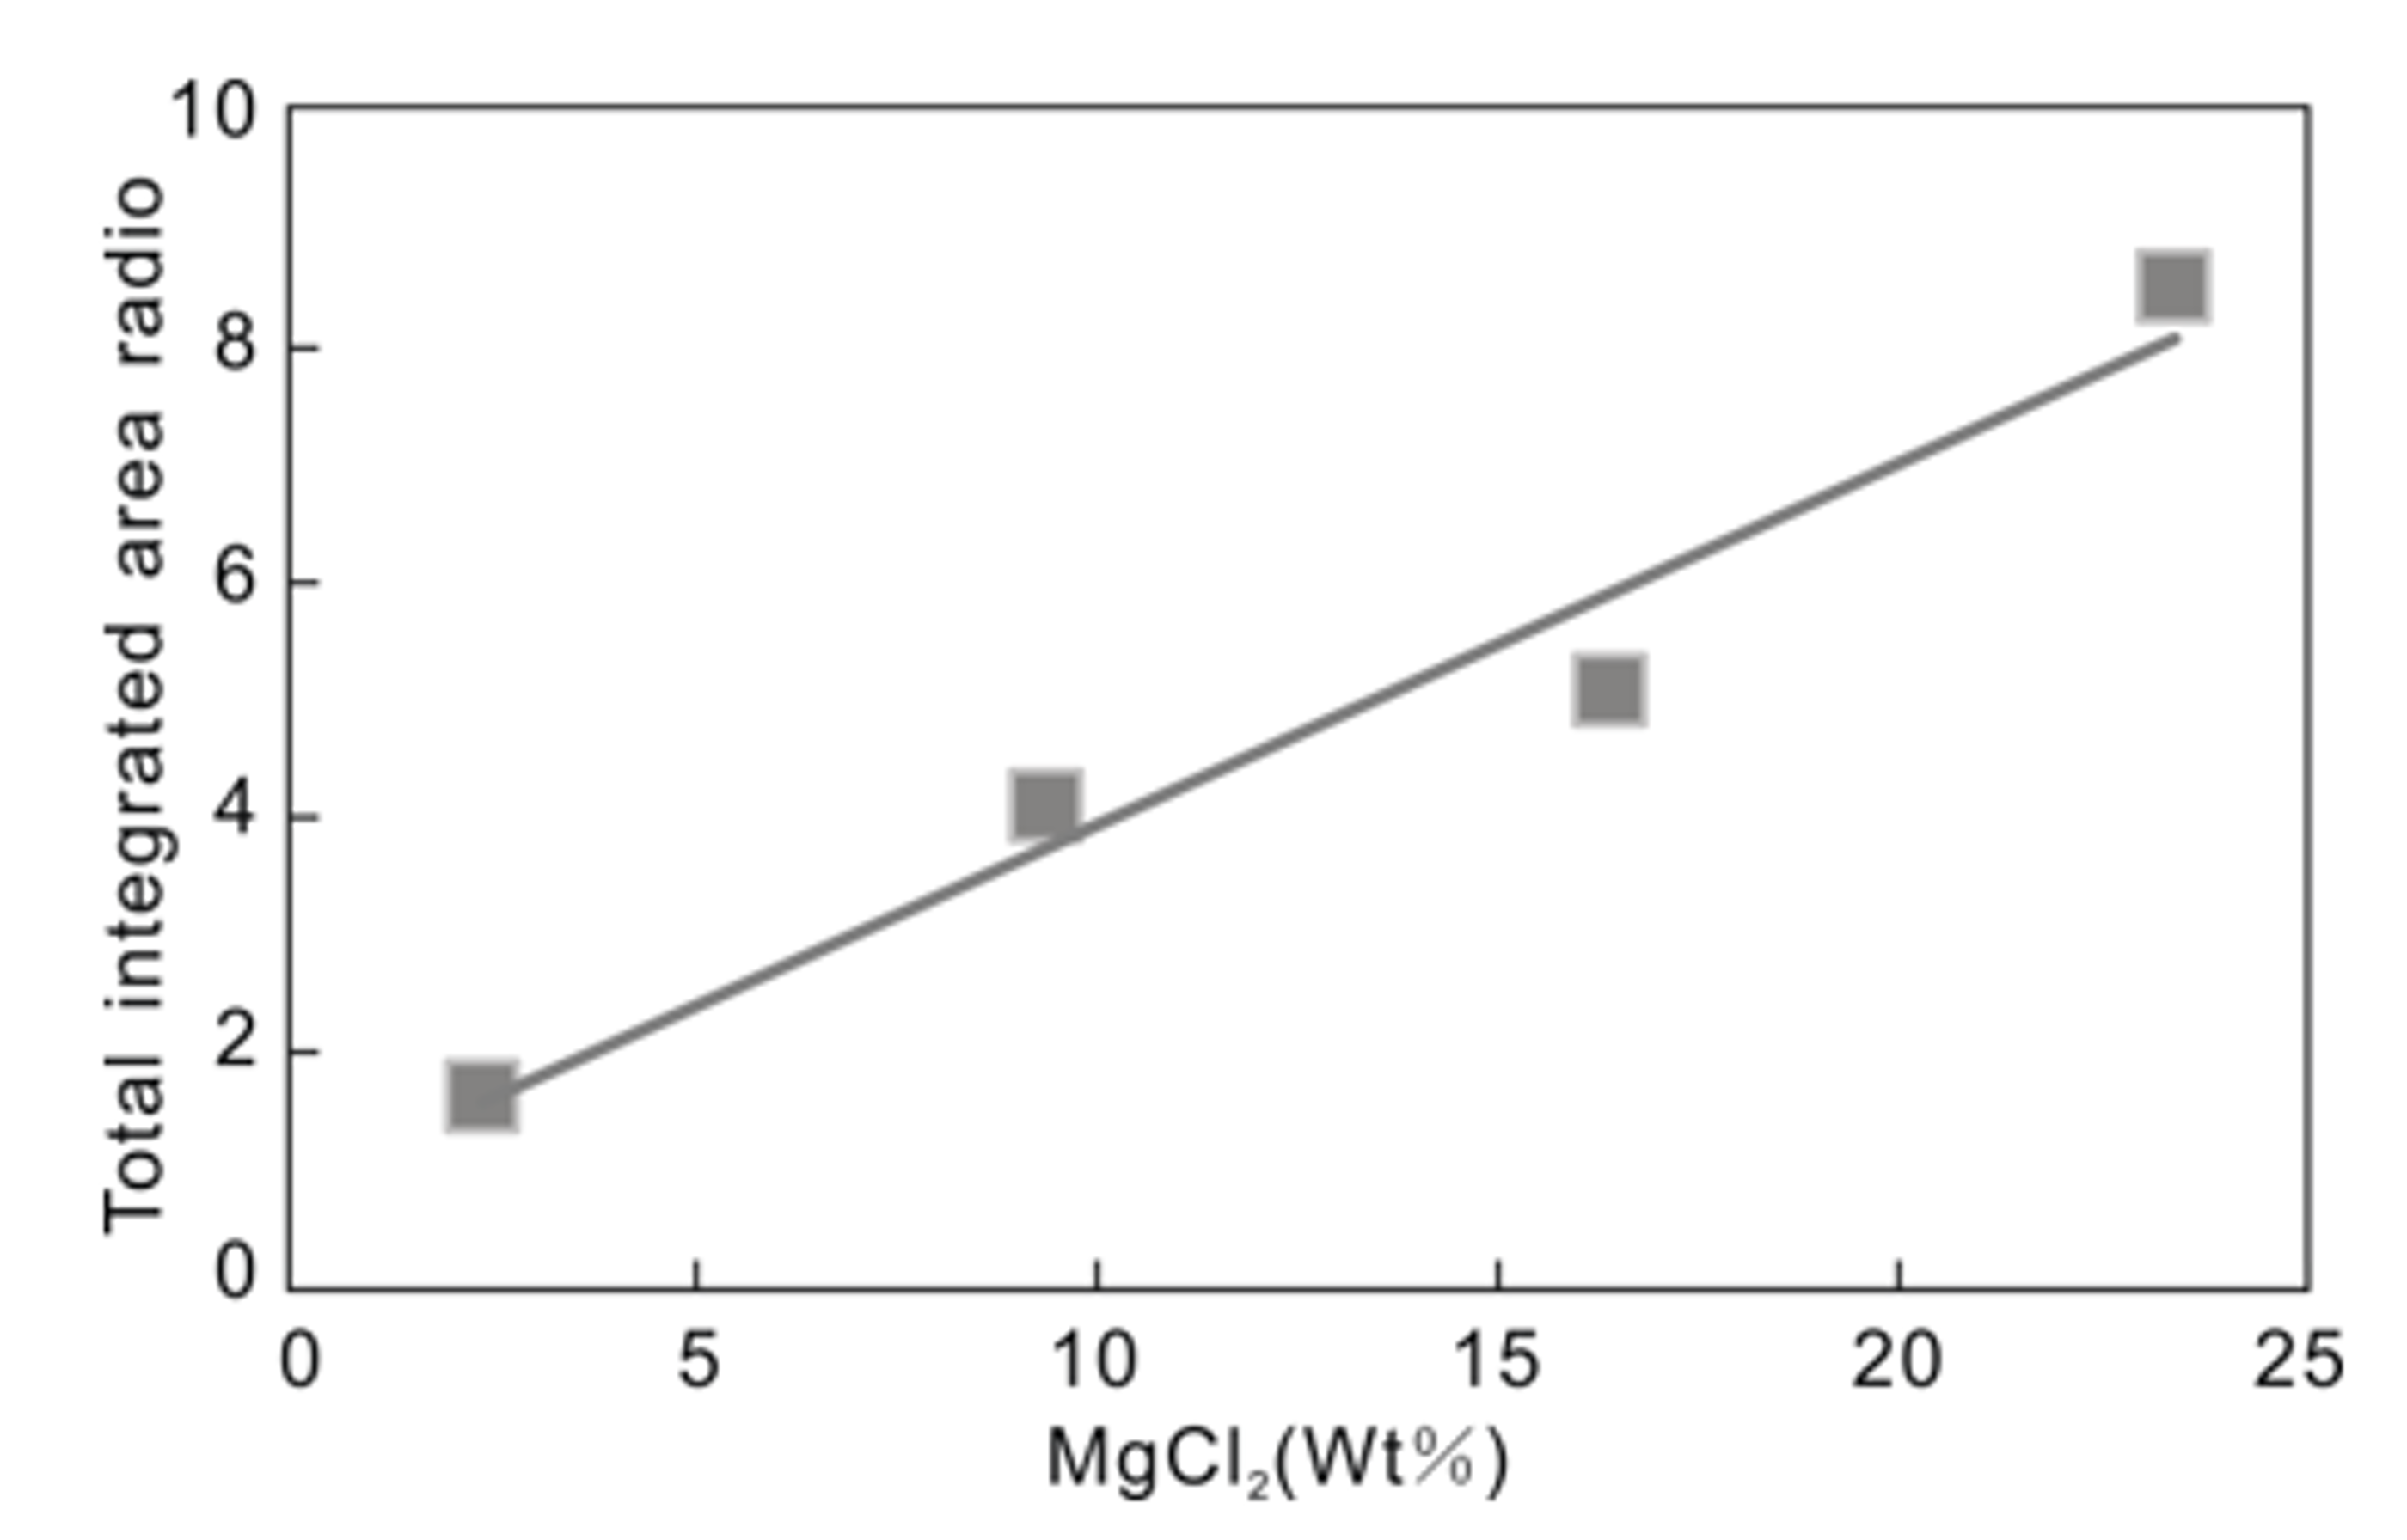
3.2. Quantitative Analysis of MgCl2–H2O

Figure 7 shows the spectra obtained for solutions containing different concentrations of MgCl2. The MgCl2 hydrate peaks at 3514, 3481, 3464, and 3401 cm−1 are well developed for all except the solution with the weakest MgCl2 concentration (Figure 7a). The spectra were fitted using Lorentz–Gauss automatic scaling, in automatic peak-fitting mode. The parameters of characteristic peaks, including intensity, full width at half maximum (FWHM) and the integrated area, are listed in Table 2. The ratio of these parameters, and those of the corresponding values for ice, were calculated and regression lines were plotted.
The intensity (I) ratio and concentration (C) show a linear relationship (Figure 8). Linear regressions were calculated as follows:
I3401−1/I3090−1 = 0.0189C + 0.1185 R2 = 0.9388
I3464−1/I3090−1 = 0.0093C + 0.1802 R2 = 0.9025
I3514−1/I3090−1 = 0.0258C − 0.2094 R2 = 0.9124
However, the FWHM, integrated area, and MgCl2 of concentration correlate poorly (Figure 9 and Figure 10). The ratio of the total integrated area of MgCl2 hydrate peaks combined with the area of the 3090 cm−1 peak shows the strongest correlation with its concentration (Figure 11), with Int(total)/Int(3090cm1) = 0.1451C + 0.8298, and R2 = 0.9588. The high correlation coefficient indicates that the concentration of salt can be obtained from the ratio of the total integrated area of MgCl2 hydrate and the 3090 cm−1 peak.

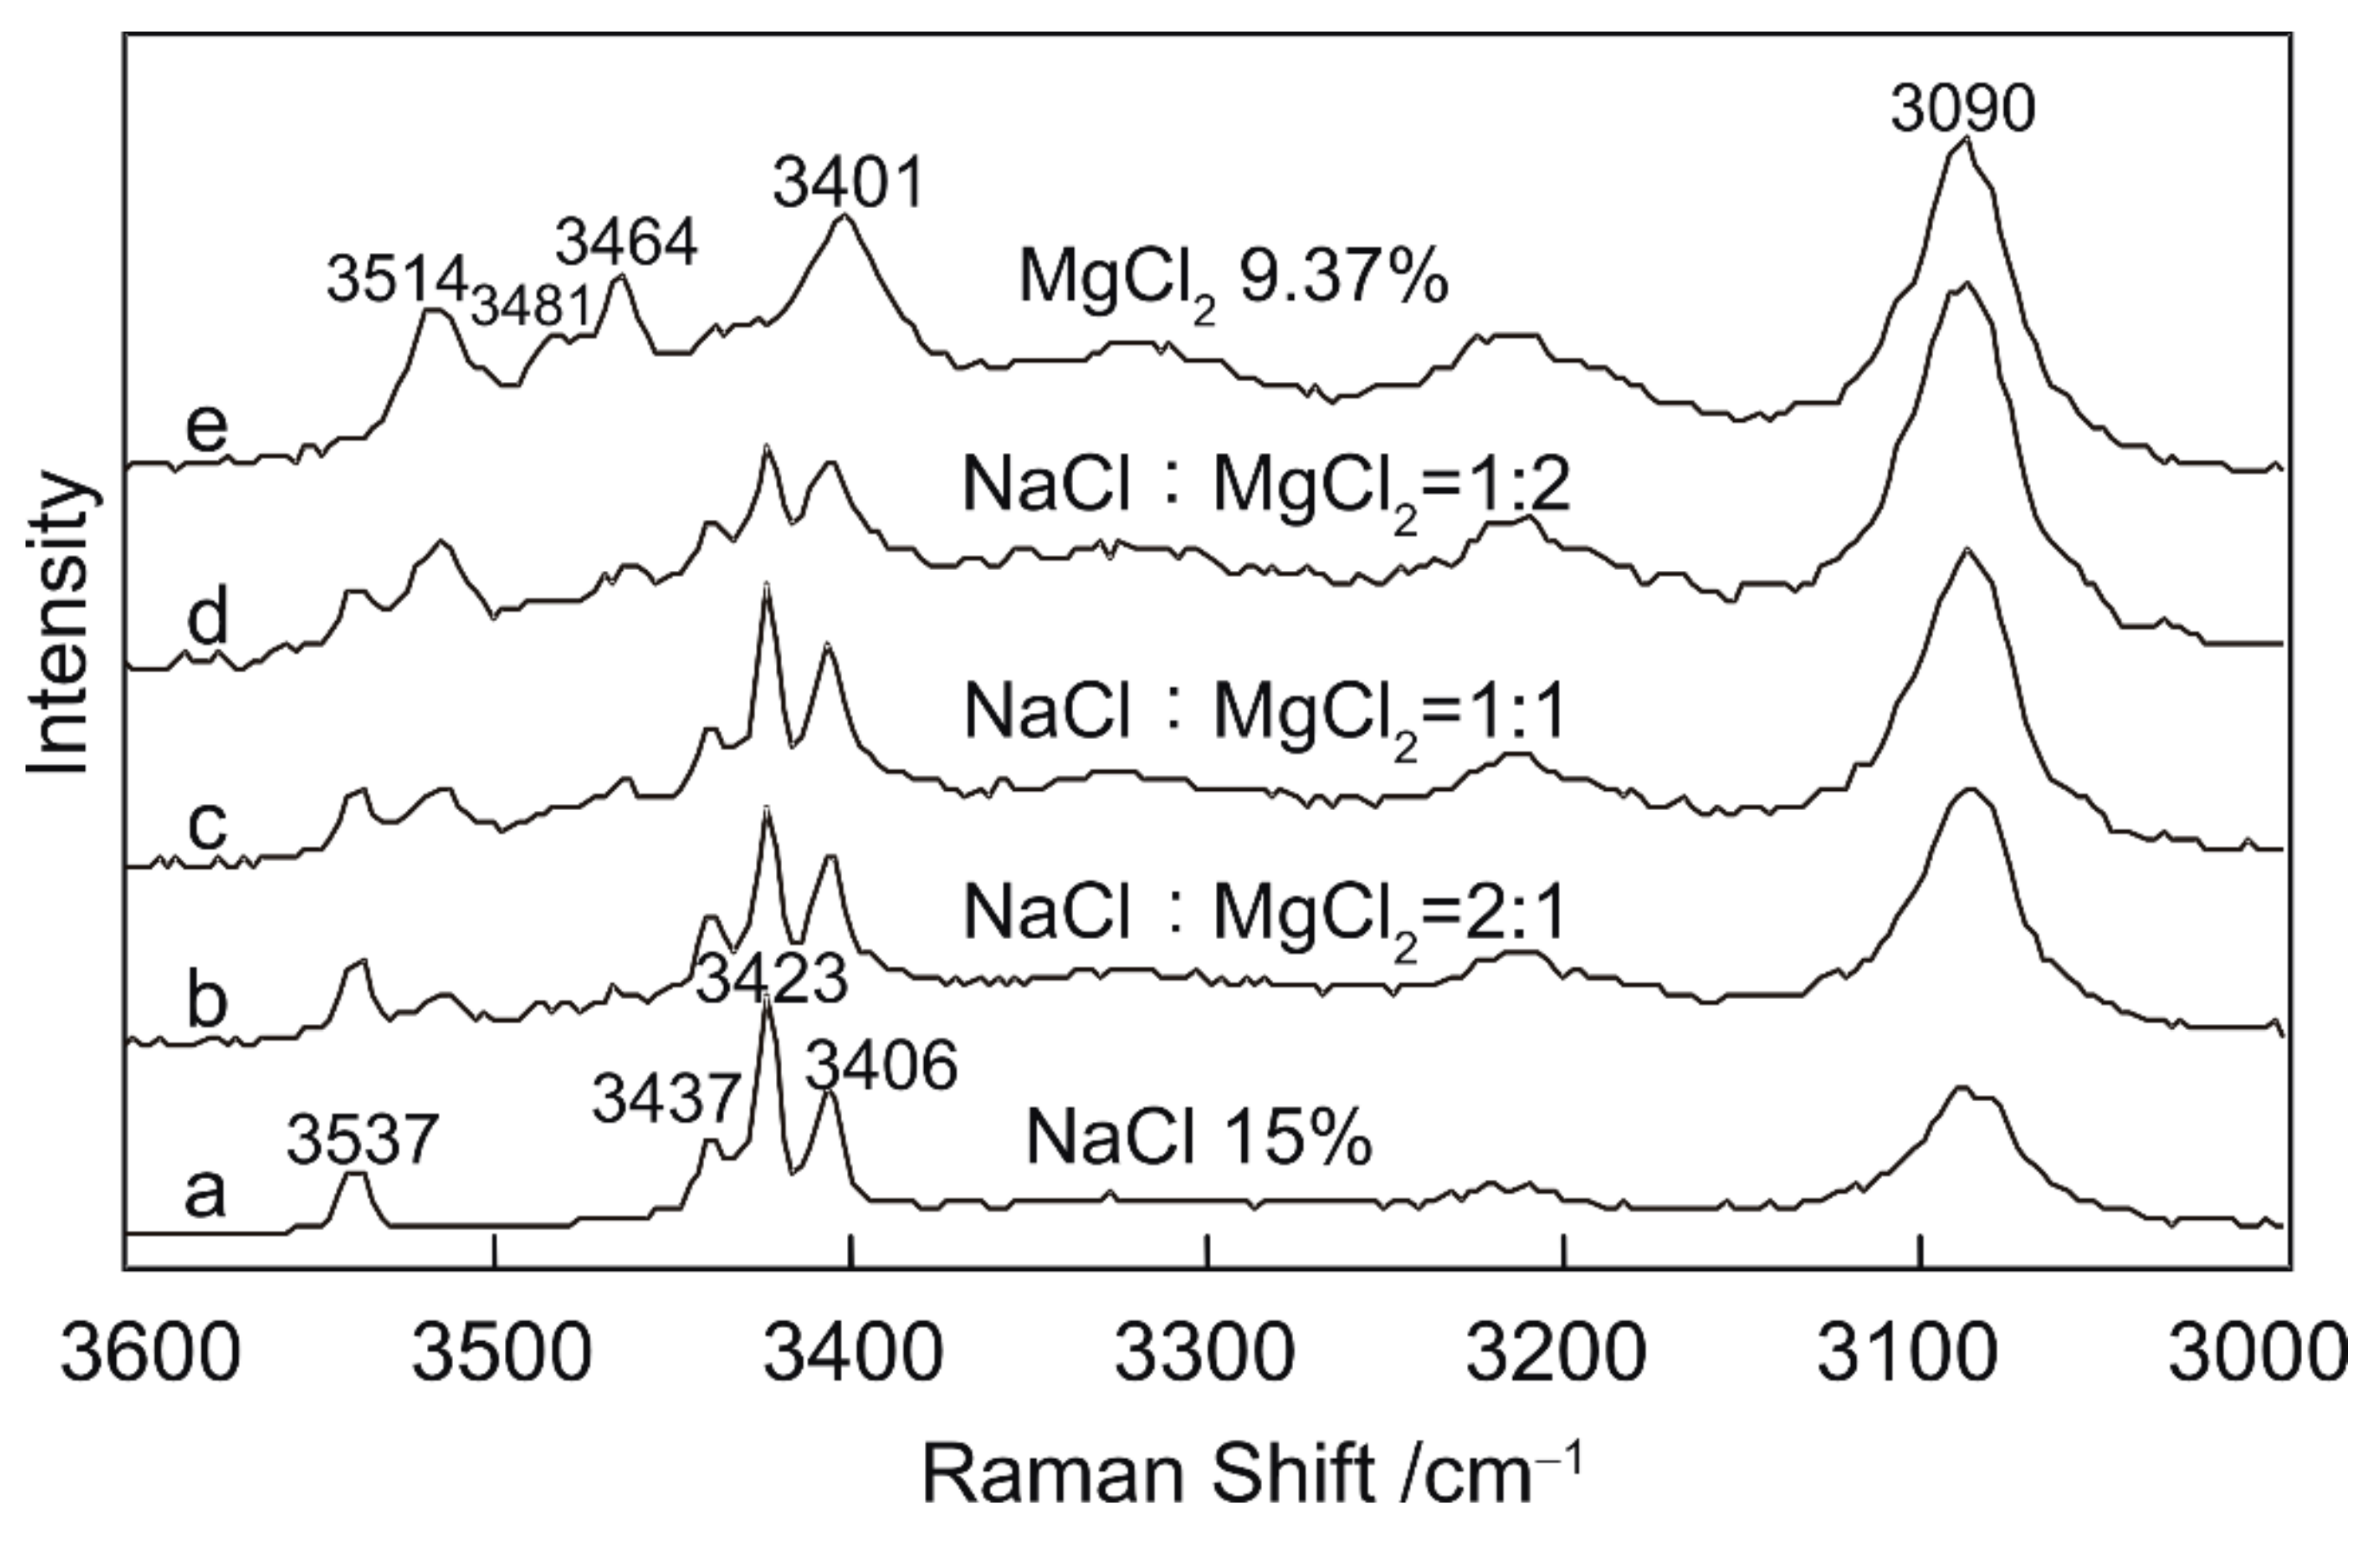
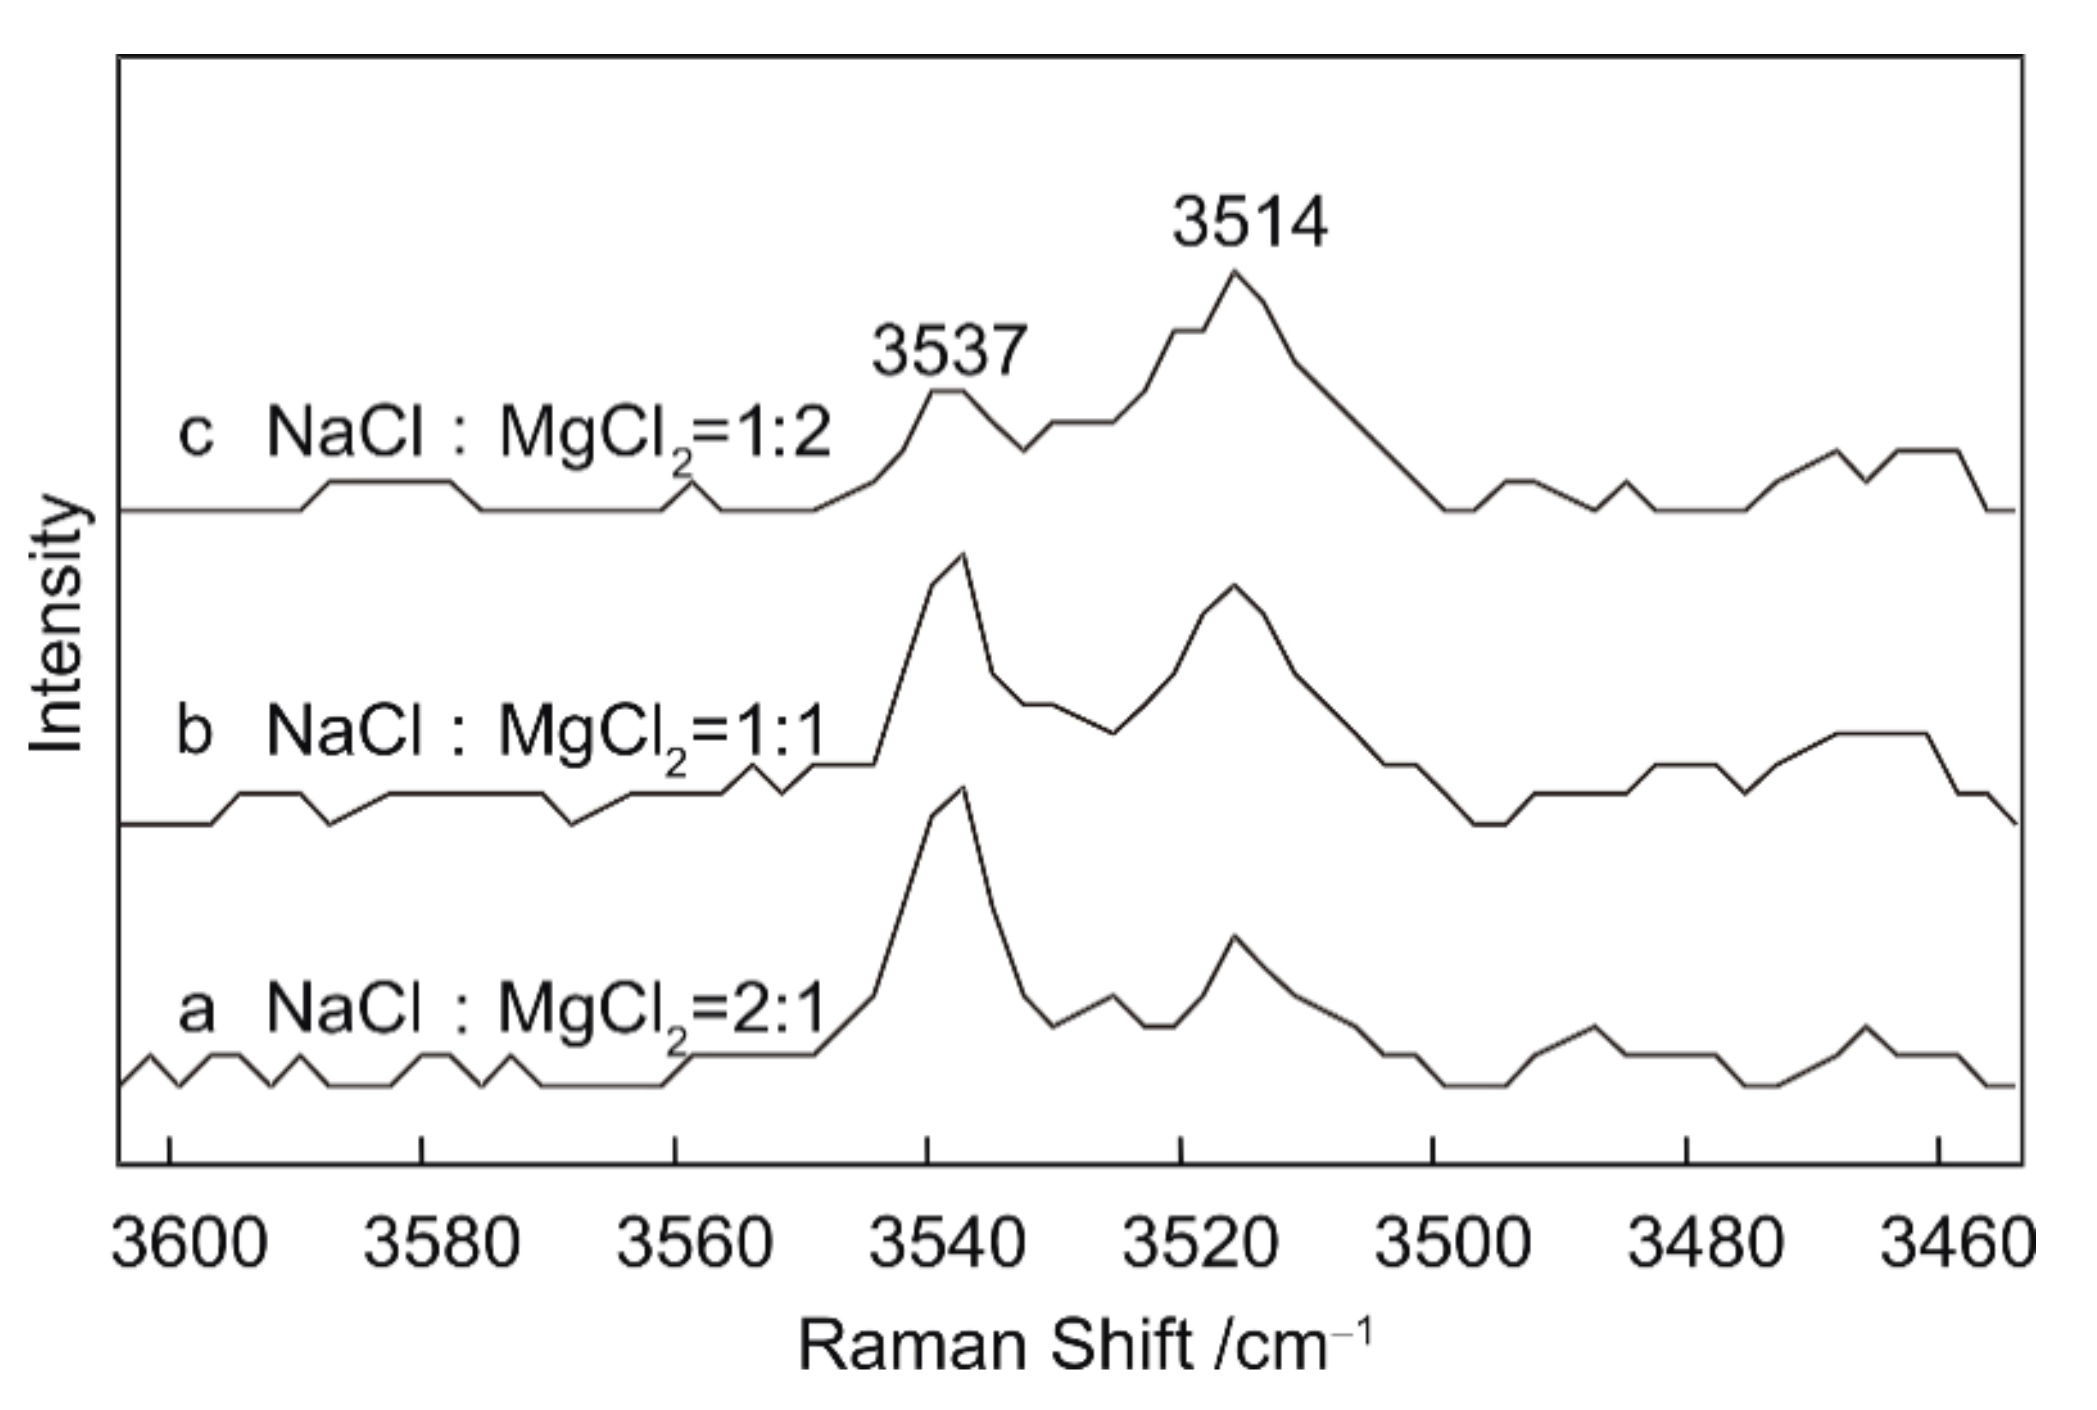
3.3. Semi-quantitative Research on NaCl–MgCl2–H2O system

Experimental Results and Spectral Analysis

Figure 12a shows the spectra of a 15 wt.% NaCl solution at −180 °C, cooled by the secondary freezing method. Figure 12e is the cryogenic spectra of a 9.37% MgCl2 solution, cooled by the secondary freezing method too. Prominent peaks at 3090 and 3216 cm−1 correspond to O–H stretching vibrations in ice [32,33], which are also present in the spectra of synthetic solutions (Figure 12a–e). Peaks at 3406, 3423, 3437, and 3537 cm−1 are related to the O–H stretching modes in hydrohalite [22], and peaks at 3401, 3464, 3481, and 3514 cm−1 are associated with O–H stretching in MgCl2 hydrate [22].
Binary NaCl and MgCl2 solutions were prepared at 15 and 9.37 wt.% salt. Solutions were prepared by mixing two stock solutions at weight ratios of 1:2, 1:1, and 2:1 (NaCl:MgCl2; Figure 12b–d).The 3423 cm−1 peak of hydrohalite is present in all mixtures, but diminishes in intensity relative to the other peaks with increasing MgCl2 concentration (Figure 12b–d). In addition, the 3406 and 3401 cm−1 peaks of hydrohalite and MgCl2 hydrate overlap sufficiently to appear as a single peak at ~3404 cm−1. Hydrohalite peaks at 3437 and 3537 cm−1 are observed in the Raman spectra of all three mixtures, and increase in intensity with increasing NaCl concentration. Similar behavior is observed in the spectra of MgCl2 hydrate, which is present in the mixed solutions and shows a positive correlation between intensity and MgCl2 concentration (Figure 13). Therefore, in the cryogenic Raman spectra of NaCl–MgCl2–H2O inclusions, peaks at 3437 and 3537 cm−1 indicate the presence of NaCl, and a peak at 3514 cm−1 may indicate the presence of MgCl2.
In Figure 13, the 3537 cm−1 peak is higher than the peak at 3514 cm−1 for the mixture where NaCl:MgCl2 = 2:1. The two peaks are almost equal in intensity for the NaCl:MgCl2 = 1:1 mixture, and the 3537 cm−1 peak is lower than the 3514 cm−1 peak for the mixture with NaCl:MgCl2 = 1:2. Thus, the relative intensity of peaks at 3537 and 3514 cm−1 reflects the relative amounts of NaCl and MgCl2.
The stretching region of cryogenic Raman spectra of NaCl–MgCl2–H2O can indicate the presence or absence of NaCl and MgCl2, although estimates of the relative abundances of NaCl and MgCl2 are semi-quantitative. Constructing calibration curves for synthetic solutions in NaCl–MgCl2–H2O is not difficult; however, the NaCl–MgCl2–CaCl2–H2O system is a common fluid system in natural fluid inclusions. Therefore, whether the characteristic peaks of CaCl2 hydrate overlap with those of hydrohalite and MgCl2 hydrate is the key to solve this problem.

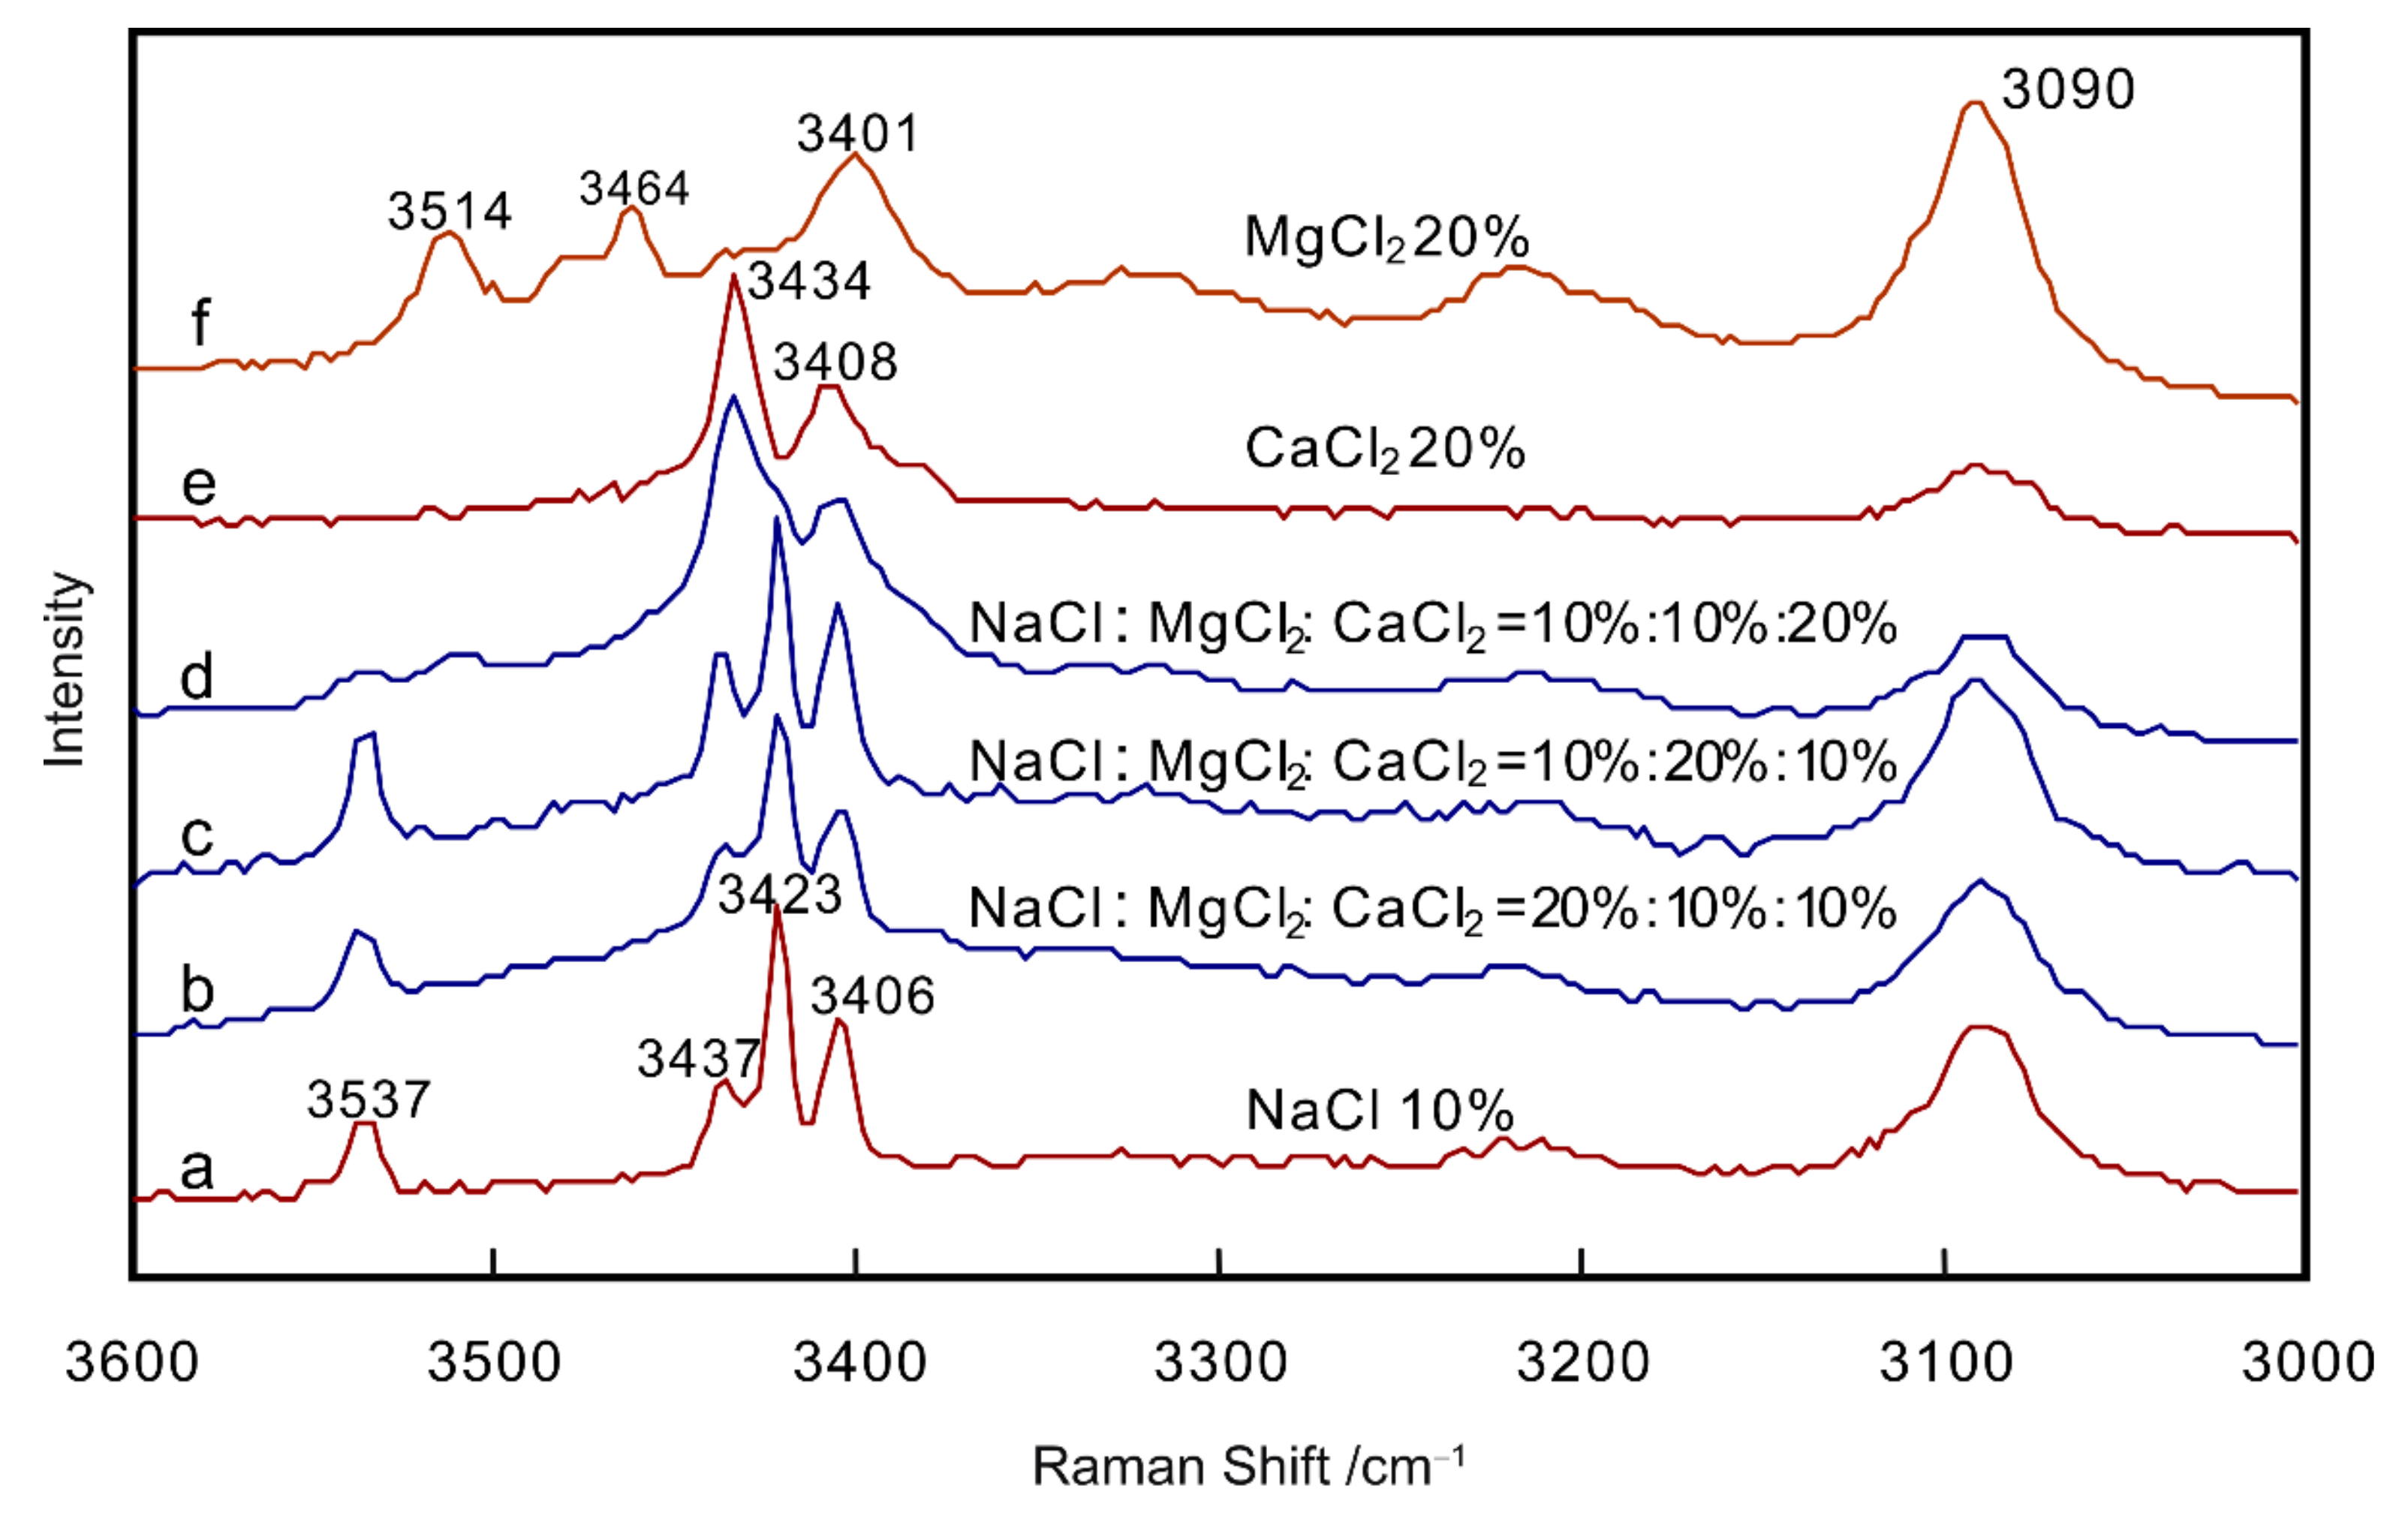
3.4. Attempt to Quantify NaCl–MgCl2–CaCl2–H2O System

Ternary NaCl, MgCl2 and CaCl2 solutions were prepared at 20, 10, 10 wt.% (Figure 14b), 10, 20, 10 wt.%(Figure 14c) and 10, 10, 20 wt.%(Figure 14d). The spectra that Figure 14 shows all cooled by the secondary freezing method. The characteristic peaks of hydrohalite are at 3406, 3423, 3437, and 3537 cm−1 [22] (Figure 14a, NaCl: 10 wt.%), and those of MgCl2 hydrate are at 3401, 3464, 3481, and 3514 cm−1 [22] (Figure 14f, MgCl2: 20 wt.%), and 3408, 3434 cm−1 are associated with O–H stretching in antarcticite (CaCl2 hydrate) [22] (Figure 14e, CaCl2: 20 wt.%).
The spectra in Figure 14f clearly show that the characteristic peaks of MgCl2 are 3514 cm−1 and 3464 cm−1, which are different from those of hydrohalite and antarcticite, however, these two peaks cannot be seen in mixed solutions. 3401 cm−1 is another characteristic peak of MgCl2 hydrate, which is close to 3408 cm−1 (the characteristic peak of antarcticite) and 3406 cm−1 (the characteristic peak of hydrohalite). In the mixed solution, this peak is obviously broadened, which indicates that the characteristic peaks of the three substances merge into one here. The peak at 3434 cm−1 is one of characteristic peaks of antarcticite, which is close to 3437 cm−1 (a characteristic peak of hydrohalite), and they merge into a wide peak in mixed solution. Therefore, it is difficult to quantify NaCl, MgCl2 and CaCl2 separately in NaCl–MgCl2–CaCl2–H2O system by the secondary freezing method. It is necessary to explore further the experimental conditions or spectral processing method of a complex system that is similar to natural inclusions.

3.5. Discussion on the Mode of Cryogenic Hydrate Formation

Davis et al. [36] and Vanko et al. [37] attributed phase changes in synthetic inclusions in the NaCl–CaCl2–H2O system at temperatures between −90 and −70 °C to melting events at metastable eutectics, and to liquid above these eutectics. It has been suggested that rapid crystallization in the NaCl–CaCl2–H2O system at temperatures between −70 and −50 °C (by rapid cooling to −180 °C, and slow heating to between −70 and −50 °C) originates from a liquid phase rather than metastable eutectics [25]. This is a crystallization process, not a melting process, attributed to the formation of chloride hydrate (metastable eutectics) in which ice forms on initial cooling, producing a residual hypersaline liquid from which salt hydrates crystallize.
Almost no hydrohalite and MgCl2 hydrate form by rapid cooling to −180 °C (Figure 2a and Figure 3a), however in the spectra obtained by the slow cooling method (−20 °C/min), we can clearly see the characteristic peaks of hydrohalite and MgCl2 hydrate (Figure 2b and Figure 3b). It seems that Davis et al. [36] and Vanko et al. [37] are incorrect. The experimental phenomena observed by us can directly show that hydrohalite and MgCl2 hydrate formation are a crystallization process rather than a melting process. The model proposed by Samson et al. [25] is relatively more reasonable. The second freezing method can obtain better hydrate spectra than slow cooling method (Figure 2 and Figure 3), but it does not seem to be certain that the secondary freezing method is the only way to form chlorine hydrate, which may be only an experimental condition conducive to the formation of hydrate. Although our series of experiments negate the views of Davis et al. [36] and Vanko et al. [37], they do not prove the hydrate formation process proposed by Samson et al. [25]. Further research is required in this field.

4. Conclusions

The following conclusions can be drawn from the current study:
(1)
Optimal experimental conditions for the formation of hydrates in the NaCl–H2O and MgCl2–H2O systems were determined. Secondary freezing is the most effective way of producing hydrates in both systems.
(2)
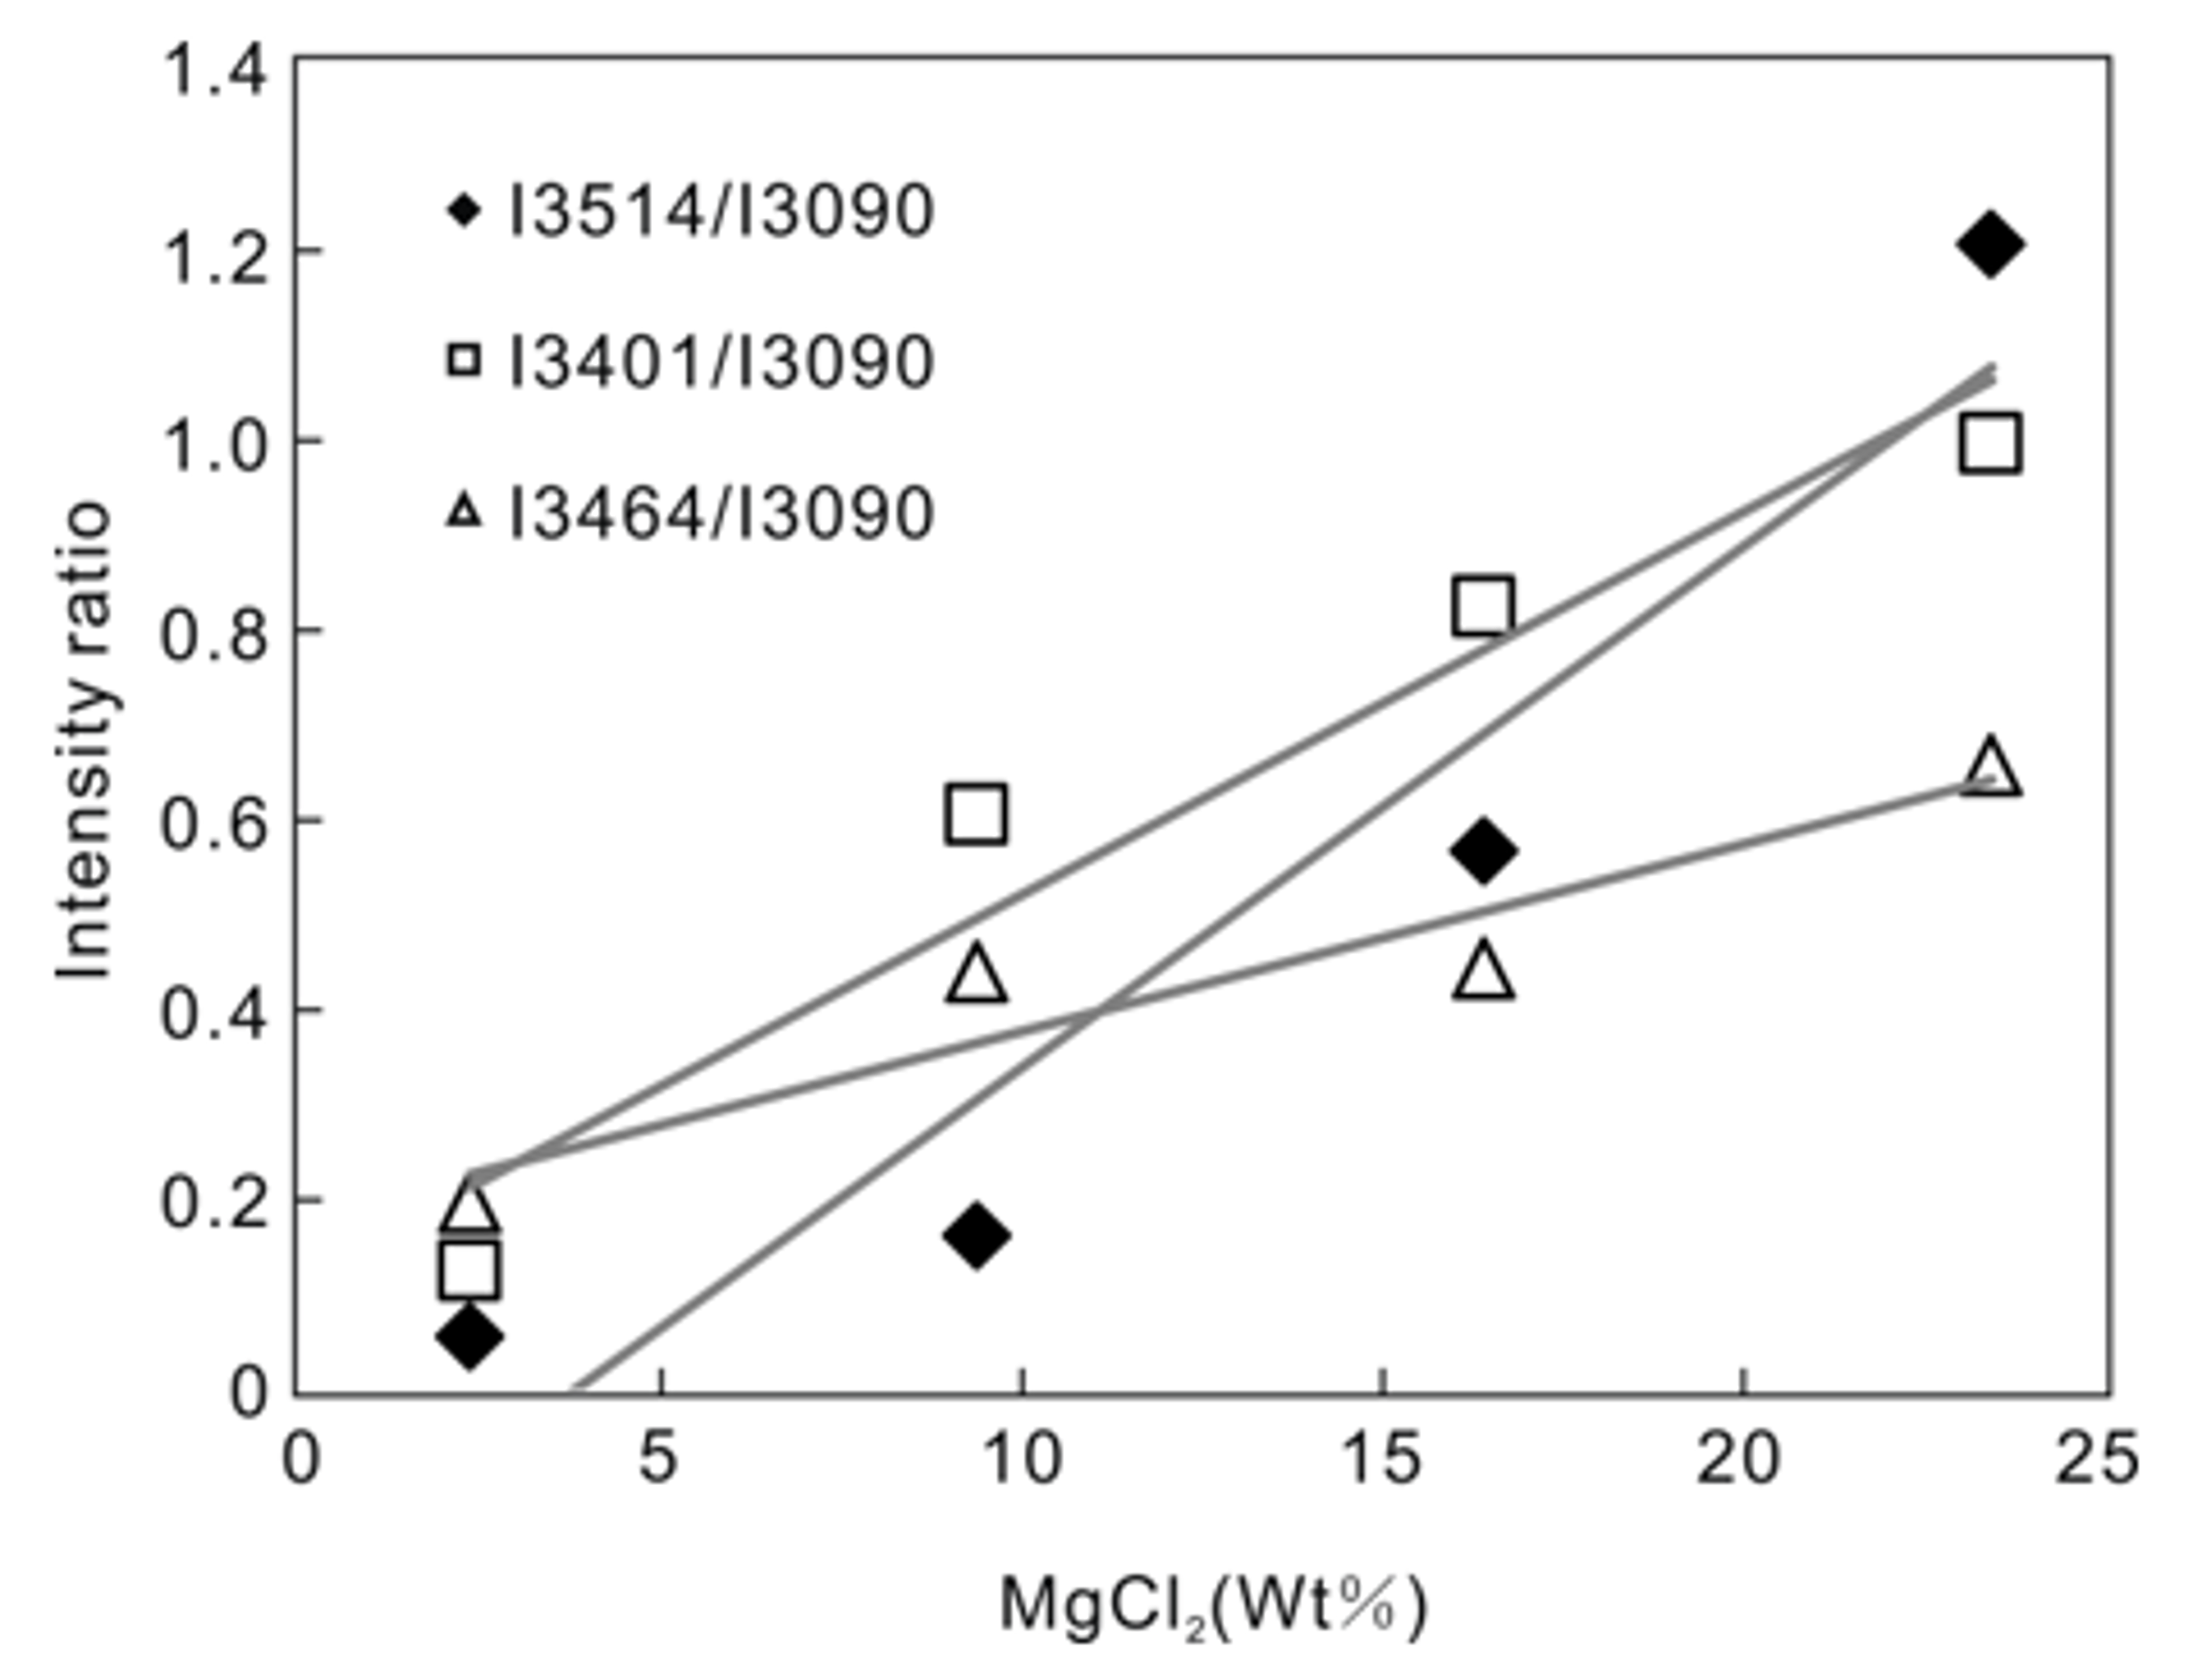
The quantitative determination of the concentration of salt in solution was attempted for a solution containing MgCl2–H2O. The intensity ratio and salt concentration show a positive correlation, as does the relationship between the concentration and the ratio of the total integrated area of MgCl2 hydrate peaks to the 3090 cm−1 peak. The correlation coefficient is >0.90.
(3)
The peak observed at 3514 cm−1 is a feature of MgCl2 hydrate that distinguishes the Raman spectrum of this hydrate from that of hydrohalite and antarcticite. The ratio of the intensity of the peak at 3514 cm−1 to that at 3090 cm−1 shows a positive correlation when plotted against salt concentration.
(4)
Semi-quantitative analysis of NaCl–MgCl2–H2O solutions indicates that peaks at 3437 and 3537 cm−1 reflect the presence of NaCl in the solution. Similarly, a peak at 3514 cm−1 is indicative of the presence of MgCl2. The relative intensities of these peaks may be related to the relative abundances of NaCl and MgCl2.
(5)
A quantitative attempt was made on NaCl–MgCl2–CaCl2–H2O system, and it was found that quantifying NaCl, MgCl2 and CaCl2 separately in NaCl–MgCl2–CaCl2–H2O system by the secondary freezing method is difficult.
(6)
Phase changes observed during secondary freezing method can be caused by the formation of hydrates from the crystallization of a hypersaline liquid or the re-crystallization of a vitreous salt, rather than melting processes.

Author Contributions

D.Y. designed and initiated the research, and interpreted data and wrote this draft. X.X. and W.C. worked on experiments.

Funding

This study was funded by the NSFC (National Natural Science Foundation of China, 41573038, 41630320, 41103005), and the China Geological Survey (DD20190398).

Conflicts of Interest

The authors declare that there are no conflicts of interest regarding the publication of this paper.

References

  1. Audétat, A.; Günther, D.; Heinrich, C.A. Formation of a Magmatic-Hydrothermal Ore Deposit: Insights with LA-ICP-MS Analysis of Fluid Inclusions. Science 1998, 279, 2091–2094. [Google Scholar] [PubMed] [Green Version]
  2. Audétat, A. Quantitative analysis of melt and fluid inclusions by LA-ICP-MS: Practical aspects and selected results. Acta Petrol. Sin. 2000, 16, 715–716. [Google Scholar]
  3. Guillong, M.; Latkoczy, C.; Seo, J.H.; Günther, D.; Heinrich, C.A. Determination of sulfur in fluid inclusions by laser ablation ICP-MS. J. Anal. Atom. Spectrom. 2008, 23, 1581–1589. [Google Scholar] [CrossRef]
  4. Seo, J.H.; Guillong, M.; Aerts, M.; Zajacz, Z.; Heinrich, C.A. Microanalysis of S, Cl, and Br in fluid inclusions by LA–ICP-MS. Chem. Geol. 2011, 284, 35–44. [Google Scholar] [CrossRef]
  5. Pettke, T.; Oberli, F.; Audétat, A.; Guillong, M.; Simon, A.C.; Hanley, J.J.; Klemm, L.M. Recent developments in element concentration and isotope ratio analysis of individual fluid inclusions by laser ablation single and multiple collector ICP-MS. Ore Geol. Rev. 2012, 44, 10–38. [Google Scholar] [CrossRef] [Green Version]
  6. Siljeström, S.; Volk, H.; George, S.C.; Lausmaa, J.; Sjövall, P.; Dutkiewicz, A.; Hode, T. Analysis of single oil-bearing fluid inclusions in mid-Proterozoic sandstones (Roper Group, Australia). Geochim. Cosmochim. Acta 2013, 122, 448–463. [Google Scholar] [CrossRef]
  7. Heinrich, C.A.; Ryan, C.G.; Mernagh, T.P.; Eadington, P.J. Segregation of Ore Metals between Magmatic Brine and Vapor: A Fluid Inclusion Study using PIXE Microanalysis. Econ. Geol. 1992, 87, 1566–1583. [Google Scholar] [CrossRef]
  8. Heinrich, C.A.; Günther, D.; Audétat, A.; Ulrich, T.; Frischknecht, R. Metal fractionation between magmatic brine and vapor, determined by microanalysis of fluid inclusions. Geology 1999, 27, 755–758. [Google Scholar] [CrossRef]
  9. Vanko, D.A.; Bonnin-Mosbah, M.; Philippot, P.; Roedder, E.; Sutton, S.R. Fluid inclusions in quartz from oceanic hydrothermal specimens and the Bingham, Utah porphyry-Cu deposit: A study with PIXE and SXRF. Chem. Geol. 2001, 173, 227–238. [Google Scholar] [CrossRef]
  10. Ménez, B.; Philippot, P.; Bonnin-Mosbah, M.; Simionovici, A.; Gibert, F. Analysis of individual fluid inclusions using synchrotron X-ray fluorescence microprobe: Progress toward calibration for trace elements. Geochim. Cosmochim. Acta 2002, 66, 561–576. [Google Scholar] [CrossRef]
  11. Cauzid, J.; Philippot, P.; Somogyi, A.; Simionovici, A.; Bleuet, P. Quantification of single fluid inclusions by combining synchrotron radiation-induced mu-X-ray fluorescence and transmission. Anal. Chem. 2004, 76, 3988–3994. [Google Scholar] [CrossRef] [PubMed]
  12. Cauzid, J.; Philippot, P.; Somogyi, A.; Ménez, B.; Simionovici, A.; Bleuet, P. Standardless quantification of single fluid inclusions using synchrotron radiation induced X-ray fluorescence. Chem. Geol. 2006, 227, 165–183. [Google Scholar] [CrossRef]
  13. Cauzid, J.; Philippot, P.; Martinez-Criado, G.; Ménez, B.; Labouré, S. Contrasting Cu-complexing behaviour in vapour and liquid fluid inclusions from the Yankee Lode tin deposit, Mole Granite, Australia. Geochim. Cosmochim. Acta 2007, 246, 39–54. [Google Scholar] [CrossRef]
  14. Foriel, J.; Philippot, P.; Rey, P.; Somogyi, A.; Banks, D.; Ménez, B. Biological control of Cl/Br and low sulfate concentration in a 3.5-Gyr-old seawater from North Pole, Western Australia. Earth Planet. Sci. Lett. 2004, 228, 451–463. [Google Scholar] [CrossRef]
  15. Pasteris, J.D.; Wopenka, B.; Seitz, J.C. Practical aspects of quantitative laser Raman microprobe spectroscopy for the study of fluid inclusions. Geochim. Cosmochim. Acta 1988, 52, 979–988. [Google Scholar] [CrossRef]
  16. Bakker, R.J. Raman spectra of fluid and crystal mixtures in the systems H2O, H2O-NaCl and H2O-MgCl2 at low temperatures: Applications to fluid-inclusion research. Can. Mineral. 2004, 42, 1283–1314. [Google Scholar] [CrossRef]
  17. Wopenka, B.; Pasteris, J.D. Limitations to quantitative analysis in of fluid inclusions in geological samples by laser Raman microprobe spectroscopy. Appl. Spectrosc. 1986, 40, 144–151. [Google Scholar] [CrossRef]
  18. Wopenka, B.; Pasteris, J.D. Raman intensities and detections limits of geochemically relevant gas mixtures for a laser Raman microprobe. Anal. Chem. 1987, 59, 2165–2170. [Google Scholar] [CrossRef]
  19. Seitz, J.C.; Pasteris, J.D.; Wopenka, B. Characterization of CO2–CH4–H2O fluid inclusions by microthermometry and laser Raman microprobe spectroscopy: Inferences for clathrate and fluid equilibria. Geochim. Cosmochim. Acta 1987, 51, 1651–1664. [Google Scholar] [CrossRef]
  20. Murphy, P.J.; Roberts, S. Micro-Raman spectroscopy of gas portioning during clathrate formation: Implications for micro-thermaometric analysis. Arch Miner. 1993, 49, 152. [Google Scholar]
  21. Mernagh, T.P.; Wilde, A.R. The use of the laser Raman microprobe for the determination of salinity in fluid inclusions. Geochim. Cosmochim. Acta 1989, 53, 765–771. [Google Scholar] [CrossRef]
  22. Dubessy, J.; Audeoud, D.; Wilkins, R.; Kosztolanyi, C. The use of the Raman microprobe MOLE in the determination of the electrolytes dissolved in the aqueous phase of fluid inclusions. Chem. Geol. 1982, 37, 137–150. [Google Scholar] [CrossRef]
  23. Winter, C.J.; Roberts, S. Laser Raman studies of low temperature hydrates produced in the highly saline fluids. Arch Miner. 1993, 49, 246. [Google Scholar]
  24. Grishina, S.; Dubessy, J.; Kontorovich, A.; Pironon, J. Inclusions in salt beds resulting from thermal metamorphism by dolerite sills (eastern Siberia, Russia). Eur. J. Mineral. 1992, 4, 1187–1202. [Google Scholar] [CrossRef]
  25. Samson, I.M.; Walker, R.T. Cryogenic Raman spectroscopoic studies in the system NaCl–CaCl2–H2O and implications for low-temperaturephase behavior in aqueous fluid inclusions. Can. Mineral. 2000, 38, 35–43. [Google Scholar] [CrossRef]
  26. Ni, P.; Ding, J.Y.; Rao, B. Application of in situ cryogenic Raman spectroscopy to analyze synthetic fluid inclusions in systems H2O, NaCl–H2O. Chin. Sci. Bull. 2006, 51, 1073–1078. [Google Scholar] [CrossRef]
  27. Ni, P.; Ding, J.Y.; Dubeesy, J.; Zhang, T. Application of in situ ryogenic Raman spectroscopy to analyze synthetic fluid inclusions in the systems CaCl2–H2O and MgCl2–H2O II: Phase transformation behavior at lower temperatures. Acta Petrol. Sinica 2008, 24, 1968–1974. [Google Scholar]
  28. Ni, P.; Ding, J.Y.; Dubeesy, J.; Zhang, T. Application of in situ ryogenic Raman spectroscopy to analyze synthetic fluid inclusions in the systems CaCl2- H2O and MgCl2- H2O I: Cryogenic Raman spectra. Acta Petrol. Sinica 2008, 24, 1961–1967. [Google Scholar]
  29. Mao, C.; Chen, Y.; Zhou, Y.Q.; Ge, Y.J.; Zhou, Z.Z.; Wang, Y.Z. Cryogenic Raman spectroscopic characteristics of NaCl–H2O, CaCl2–H2O, and NaCl–CaCl2–H2O:application to analysis of fluid inclusions. Spectrosc. Spectr. Anal. 2010, 30, 3258–3263. [Google Scholar]
  30. Chi, G.X.; Chu, H.X.; Ryan, S.; Chou, I.M. A New Method for Determining Fluid Compositions in the H2O-NaCl-CaCl2 System with Cryogenic Raman Spectroscopy. Acta Geol. Sinica 2014, 88, 1169–1182. [Google Scholar] [CrossRef]
  31. Chu, H.; Chi, G. Determining Fluid Compositions in the H2O-NaCl-CaCl2 System with Cryogenic Raman Spectroscopy: Application to Natural Fluid Inclusions. Acta Geol. Sinica 2015, 89, 894–901. [Google Scholar]
  32. Taylor, M.J.; Whalley, E. Raman Spectra of Ices Ih, Ic, II, III, and V. J. Chem. Phys. 1964, 40, 1660–1664. [Google Scholar] [CrossRef]
  33. Whalley, E. A detailed assignment of the O-H stretching bands of ice I. Can. J. Chem. 1977, 55, 3429–3441. [Google Scholar] [CrossRef]
  34. Bertie, J.E.; Calvert, L.D.; Whalley, E. Transformations of Ice II, Ice III, and Ice V at Atmospheric Pressure. J. Chem. Phys. 1963, 38, 840–846. [Google Scholar] [CrossRef]
  35. Franks, F. The properties of ice. In The Physics and Physical Chemistry of Water; Water, A Comprehensive Treatise.1; Plenum Press: New York, NY, USA, 1972; pp. 115–149. [Google Scholar]
  36. Davis, D.W.; Lowenstein, T.K.; Spencer, R.J. Melting behavior of fluid inclusions in laboratory-grown halite crystals in the systems NaCl–H2O, NaCl–KCl–H2O, NaCl–MgCl2-H2O, and NaCl–CaCl2–H2O. Geochim. Cosmochim. Acta 1990, 54, 591–601. [Google Scholar] [CrossRef]
  37. Vanko, D.A.; Bodnar, R.J.; Sterner, S.M. Synthetic fluid inclusions: VIII. Vapor-saturated halite solubility in part of the system NaCl–CaCl2–H2O, with application to fluid inclusions from oceanic hydrothermal systems. Geochim. Cosmochim. Acta 1988, 52, 2451–2456. [Google Scholar] [CrossRef]
Figure 1. Raman spectrum of deionized water at −180 °C.
Minerals 09 00363 g001
Figure 2. Raman spectra of a 15 wt.% NaCl solution cooled to −180 °C under conditions of (a) rapid freezing, (b) controlled cooling at a rate of −20 °C/min, and (c) secondary cooling.
Minerals 09 00363 g002
Figure 3. Raman spectra of a 9.37 wt.% MgCl2 solution cooled to −180 °C under conditions of (a) rapid freezing, (b) controlled cooling at a rate of −20 °C/min, and (c) secondary cooling.
Minerals 09 00363 g003
Figure 4. Raman spectra of MgCl2·6H2O and MgCl2·12H2O at −170 °C [22].
Minerals 09 00363 g004
Figure 5. Photomicrograph captured at −70 to −64.5 °C showing the formation of MgCl2 hydrate from a solution containing 23.43 wt.% MgCl2.(a) Initially, small hexagonal crystals were observed to form; (b) soon after these small crystals grew up to solid assemblage rapidly, as a wave of darkening that sweeps across entire field of vision.
Minerals 09 00363 g005
Figure 6. Raman spectra of 23.43 wt.% MgCl2 solution cooled by secondary freezing, captured at −64.5 °C (a) and −180 °C (b).
Minerals 09 00363 g006
Figure 7. Spectra of MgCl2 solutions of different concentrations at −180 °C, cooled using the secondary freezing method and showing (a) 2.34 wt.% MgCl2, (b) 9.37 wt.% MgCl2, (c) 16.40 wt.% MgCl2, and (d) 23.43 wt.% MgCl2.
Minerals 09 00363 g007
Figure 8. Least squares regression of the intensity of the ratio of MgCl2 hydrate peaks and the 3090 cm−1 peak at different MgCl2 concentrations.
Minerals 09 00363 g008
Figure 9. Relationship between the FWHM ratio of MgCl2 hydrate and the 3090 cm−1 peak at different MgCl2 concentrations.
Minerals 09 00363 g009
Figure 10. Plot of the ratio of MgCl2 hydrate peaks and the 3090 cm−1 peak at different MgCl2 concentrations.
Minerals 09 00363 g010
Figure 11. Least squares regression of the ratio of total integrated area of MgCl2 hydrate peaks and the 3090 cm−1 peak at different MgCl2 concentrations.
Minerals 09 00363 g011
Figure 12. Raman spectra of a solution containing NaCl–MgCl2–H2O at −180 °C, for the cases of (a) 15 wt.% NaCl, (b) NaCl and MgCl2 mixed at a ratio of 2:1, (c) NaCl and MgCl2 mixed at a ratio of 1:1, (d) NaCl and MgCl2 mixed at a ratio of 1:2, and (e) 9.37 wt.% MgCl2.
Minerals 09 00363 g012
Figure 13. Amplified Raman spectra of the NaCl–MgCl2–H2O system at −180 °C showing the 3514 and 3537 cm−1 peaks for NaCl and MgCl2 mixed at ratios of (a) 2:1, (b) 1:1, and (c) 1:2.
Minerals 09 00363 g013
Figure 14. Raman spectra of a solution containing NaCl–MgCl2–CaCl2–H2O at −180 °C, for the cases of (a) 10wt.% NaCl, (b) NaCl, MgCl2 and CaCl2 mixed at the wt.% of 20%:10%:10%, (c) NaCl, MgCl2 and CaCl2 mixed at the wt.% of 10%:20%:10%, (d) NaCl, MgCl2 and CaCl2 mixed at the wt.% of 10%:10%:20%, (e) 20wt.% CaCl2, (f) 20 wt.% MgCl2.
Minerals 09 00363 g014
Table 1. The detail list of solutions in different systems.
SystemComponentsProportion
NaCl–H2ONaCl15 (wt.%)
MgCl2–H2OMgCl22.34, 9.37, 16.40, 23.43 (wt.%)
NaCl–MgCl2–H2ONaCl, MgCl2NaCl: MgCl2 = 1:2, 1:1, 2:1 (NaCl: 15 wt.%, MgCl2: 9.37 wt.%)
NaCl–MgCl2–CaCl2–H2ONaCl, MgCl2, CaCl2NaCl:MgCl2:CaCl2 = 10 wt.%:10 wt.%:20 wt.%
          = 10 wt.%:20 wt.%:10 wt.%
          = 20 wt.%:10 wt.%:10 wt.%
Table 2. Spectral features of solutions containing different concentrations of MgCl2 at −180 °C.
ParameterMgCl2 (wt.%)3090 cm−13401 cm−13464 cm−13514 cm−13401 cm−1/3090 cm−13464 cm−1/3090 cm−13514 cm−1/3090 cm−1
intensity2.3411,843.2701480.4002328.384666.4160.12500.19660.0563
9.375869.3893558.5642584.893952.6280.60630.44040.1623
16.401678.4011385.837744.722953.5110.82570.44370.5681
23.433341.8843333.5392200.5614039.0880.99750.65851.2086
FWHM2.3429.714145.077103.595177.2524.88243.48645.9653
9.3731.57230.54827109.078626.8860.96763.454919.8558
16.4034.12138.19824132.04412.5521.11953.86980.36787
23.4332.513195.360280.36917.8586.00862.47190.5493
integrated area2.34552,780.900337,363.114378,889.813167,682.9100.61030.68540.3033
9.37271,251.500170,758.141300,133.212637,126.4020.62951.10652.3488
16.40899,57.820183,152.514154,465.901118,800.0312.03601.71711.3206
23.43159,941.1121,022,967.023239,932.803100,747.5026.39591.50010.6299
Total integrated area of MgCl2 hydrate peaksTotal integrated area of MgCl2 hydrate peaks/3090 cm−1
2.34883,935.6821.5991
9.371,108,017.7334.0848
16.40456,418.3825.0737
23.431,363,647.3018.5259

