LKZ-1: A New Zircon Working Standard for the In Situ Determination of U–Pb Age, O–Hf Isotopes, and Trace Element Composition

 , , , , and
Abstract
:1. Introduction
2. Materials and Methods
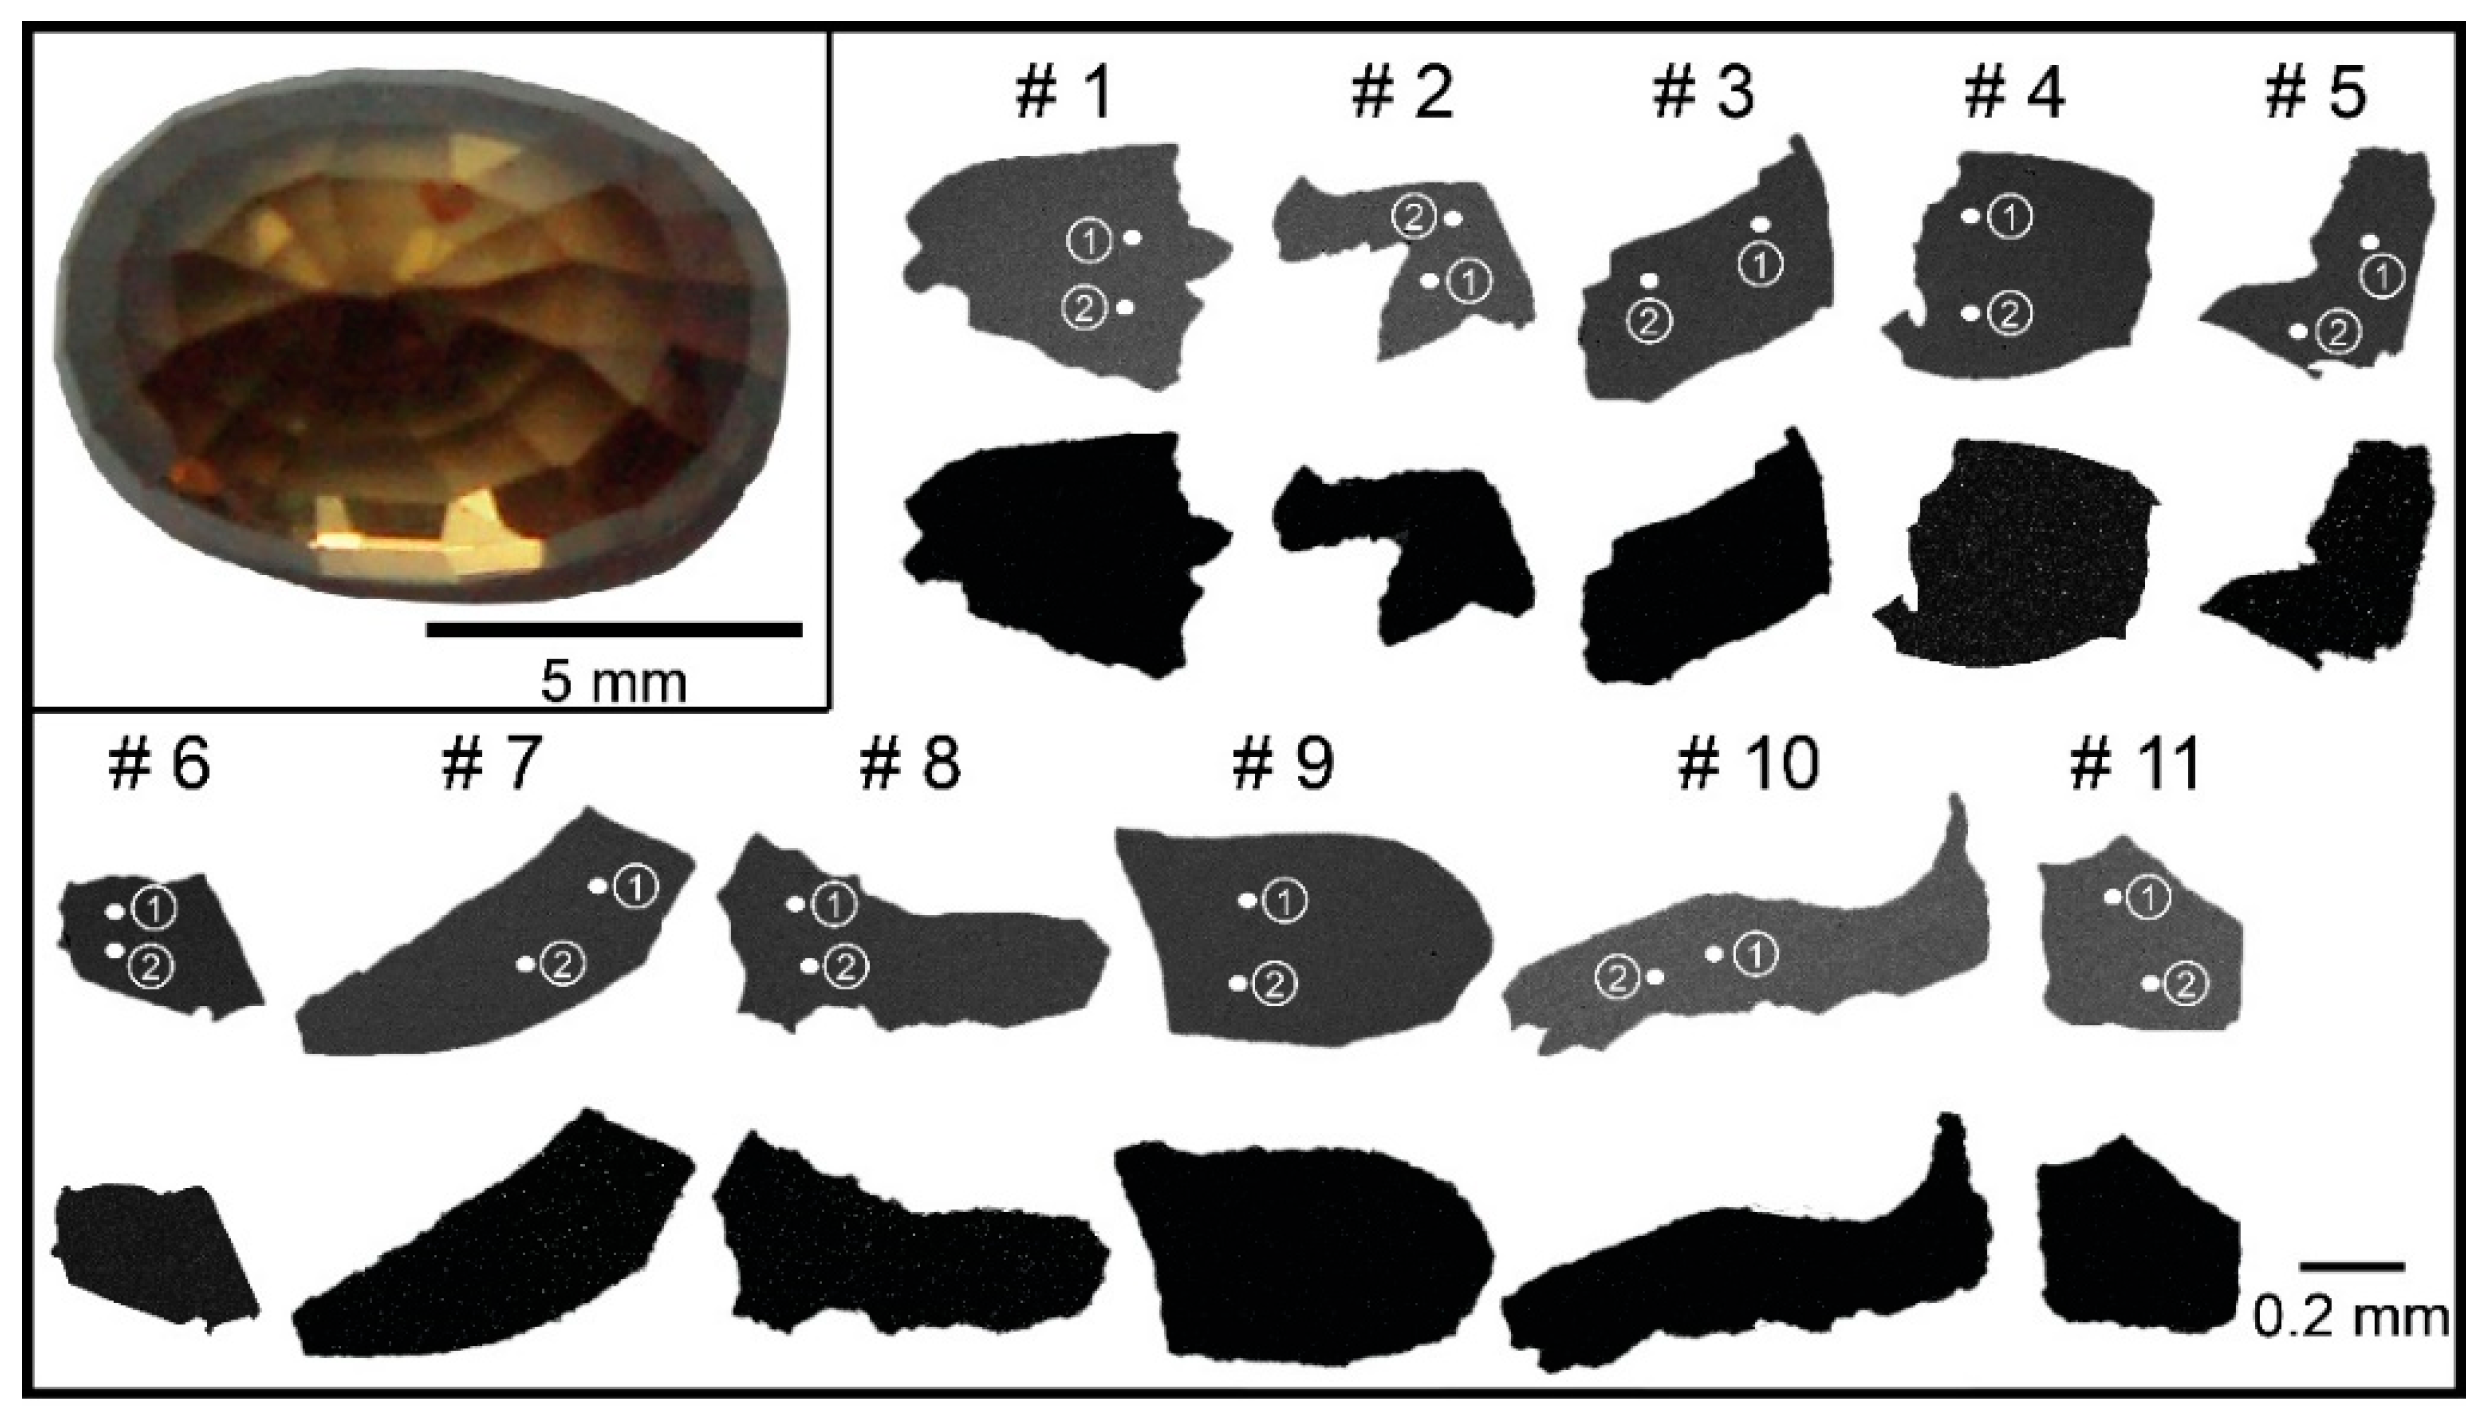
2.1. LKZ-1
2.2. HR-SIMS U–Pb Analysis
2.3. ID-TIMS U–Pb Analysis
2.4. Oxygen Isotope Analysis
2.5. LA-MC-ICPMS U–Pb and Lu–Yb–Hf Isotope Analysis
2.6. LA-Quadrupole ICPMS Analysis
3. Results and Discussion
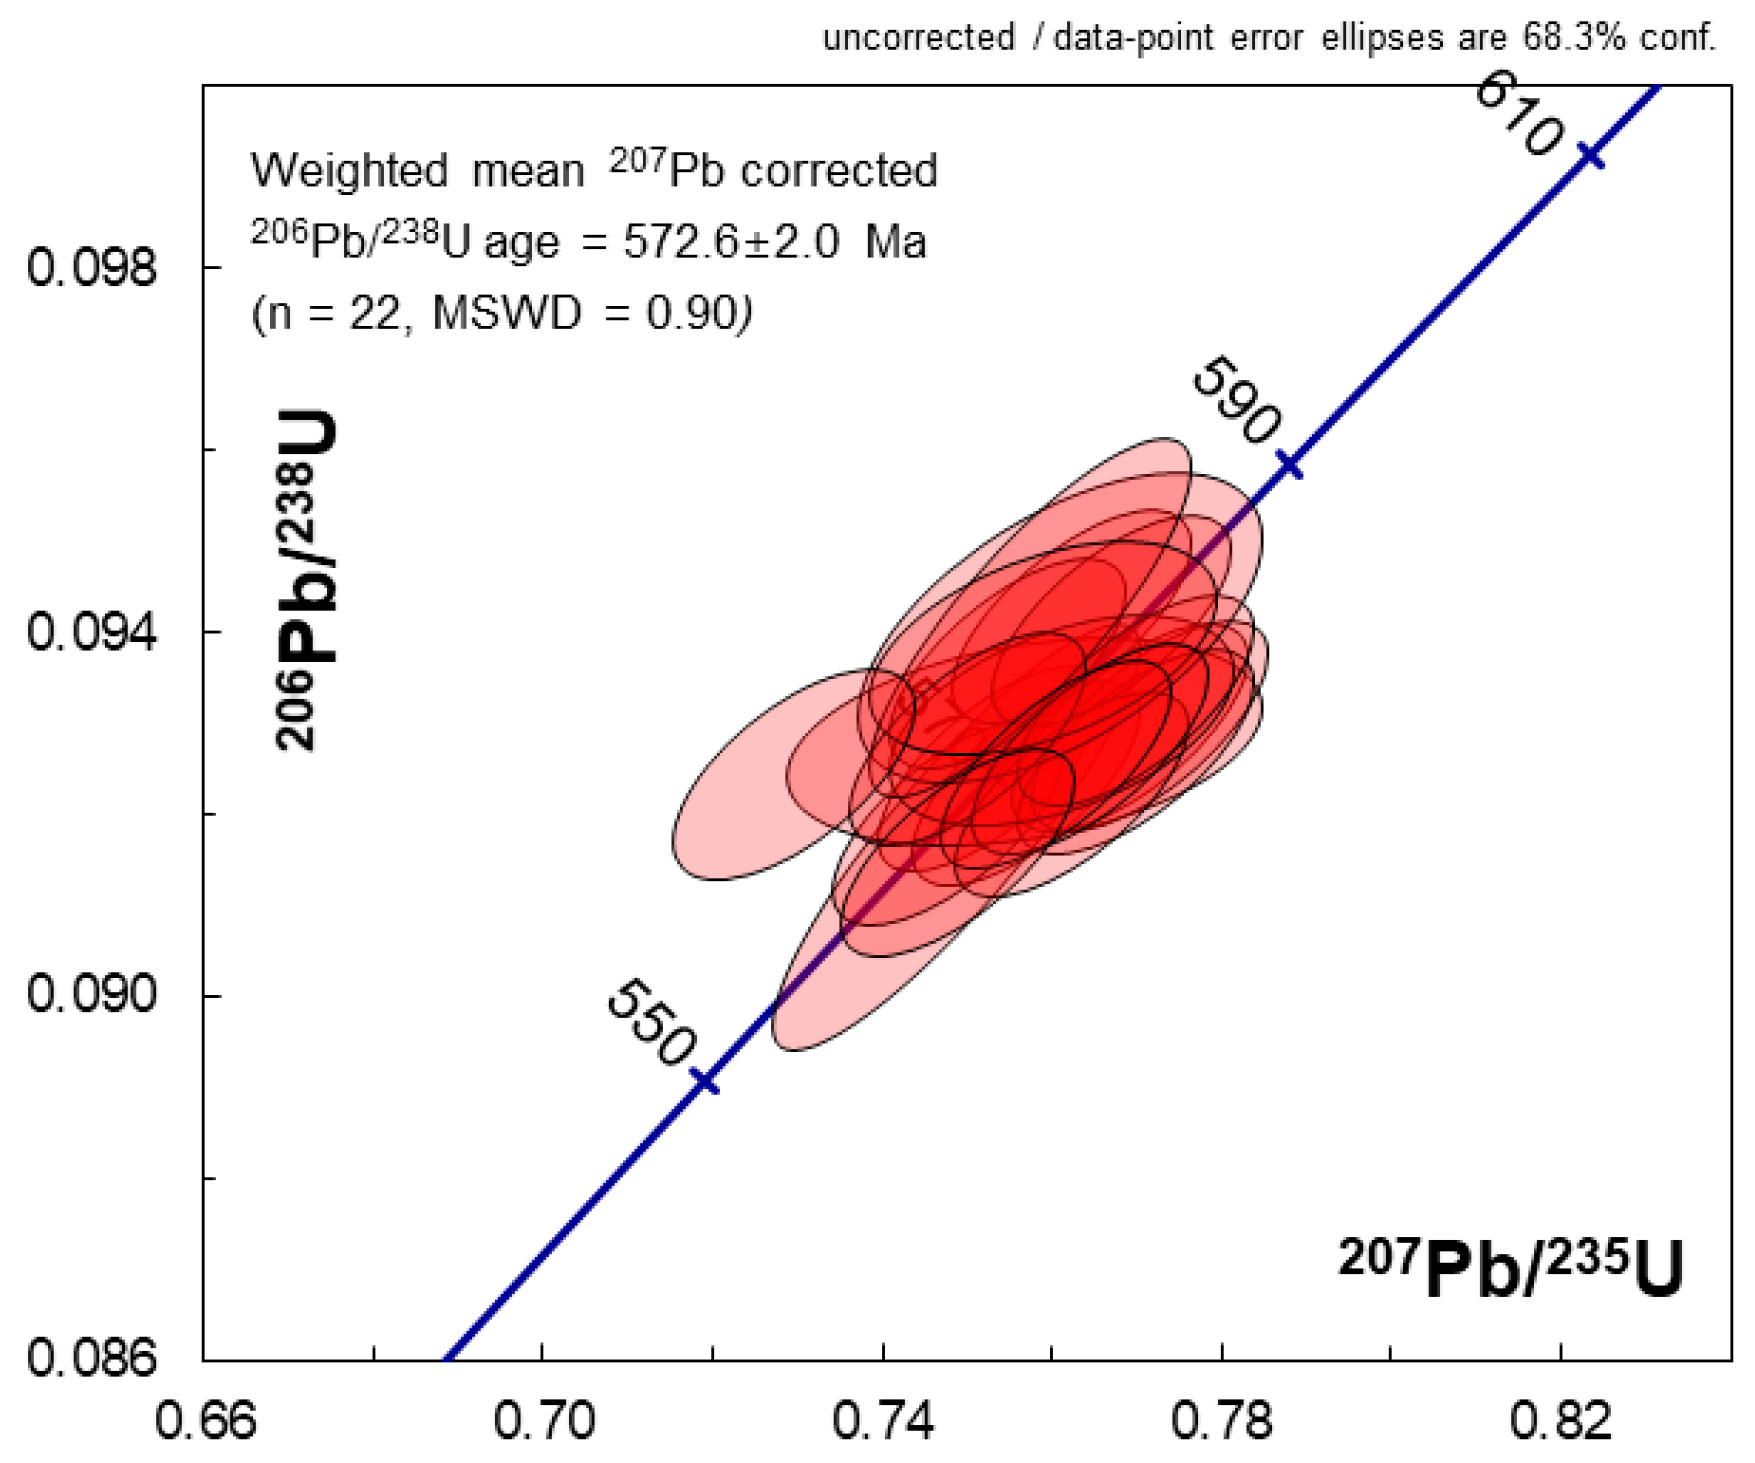
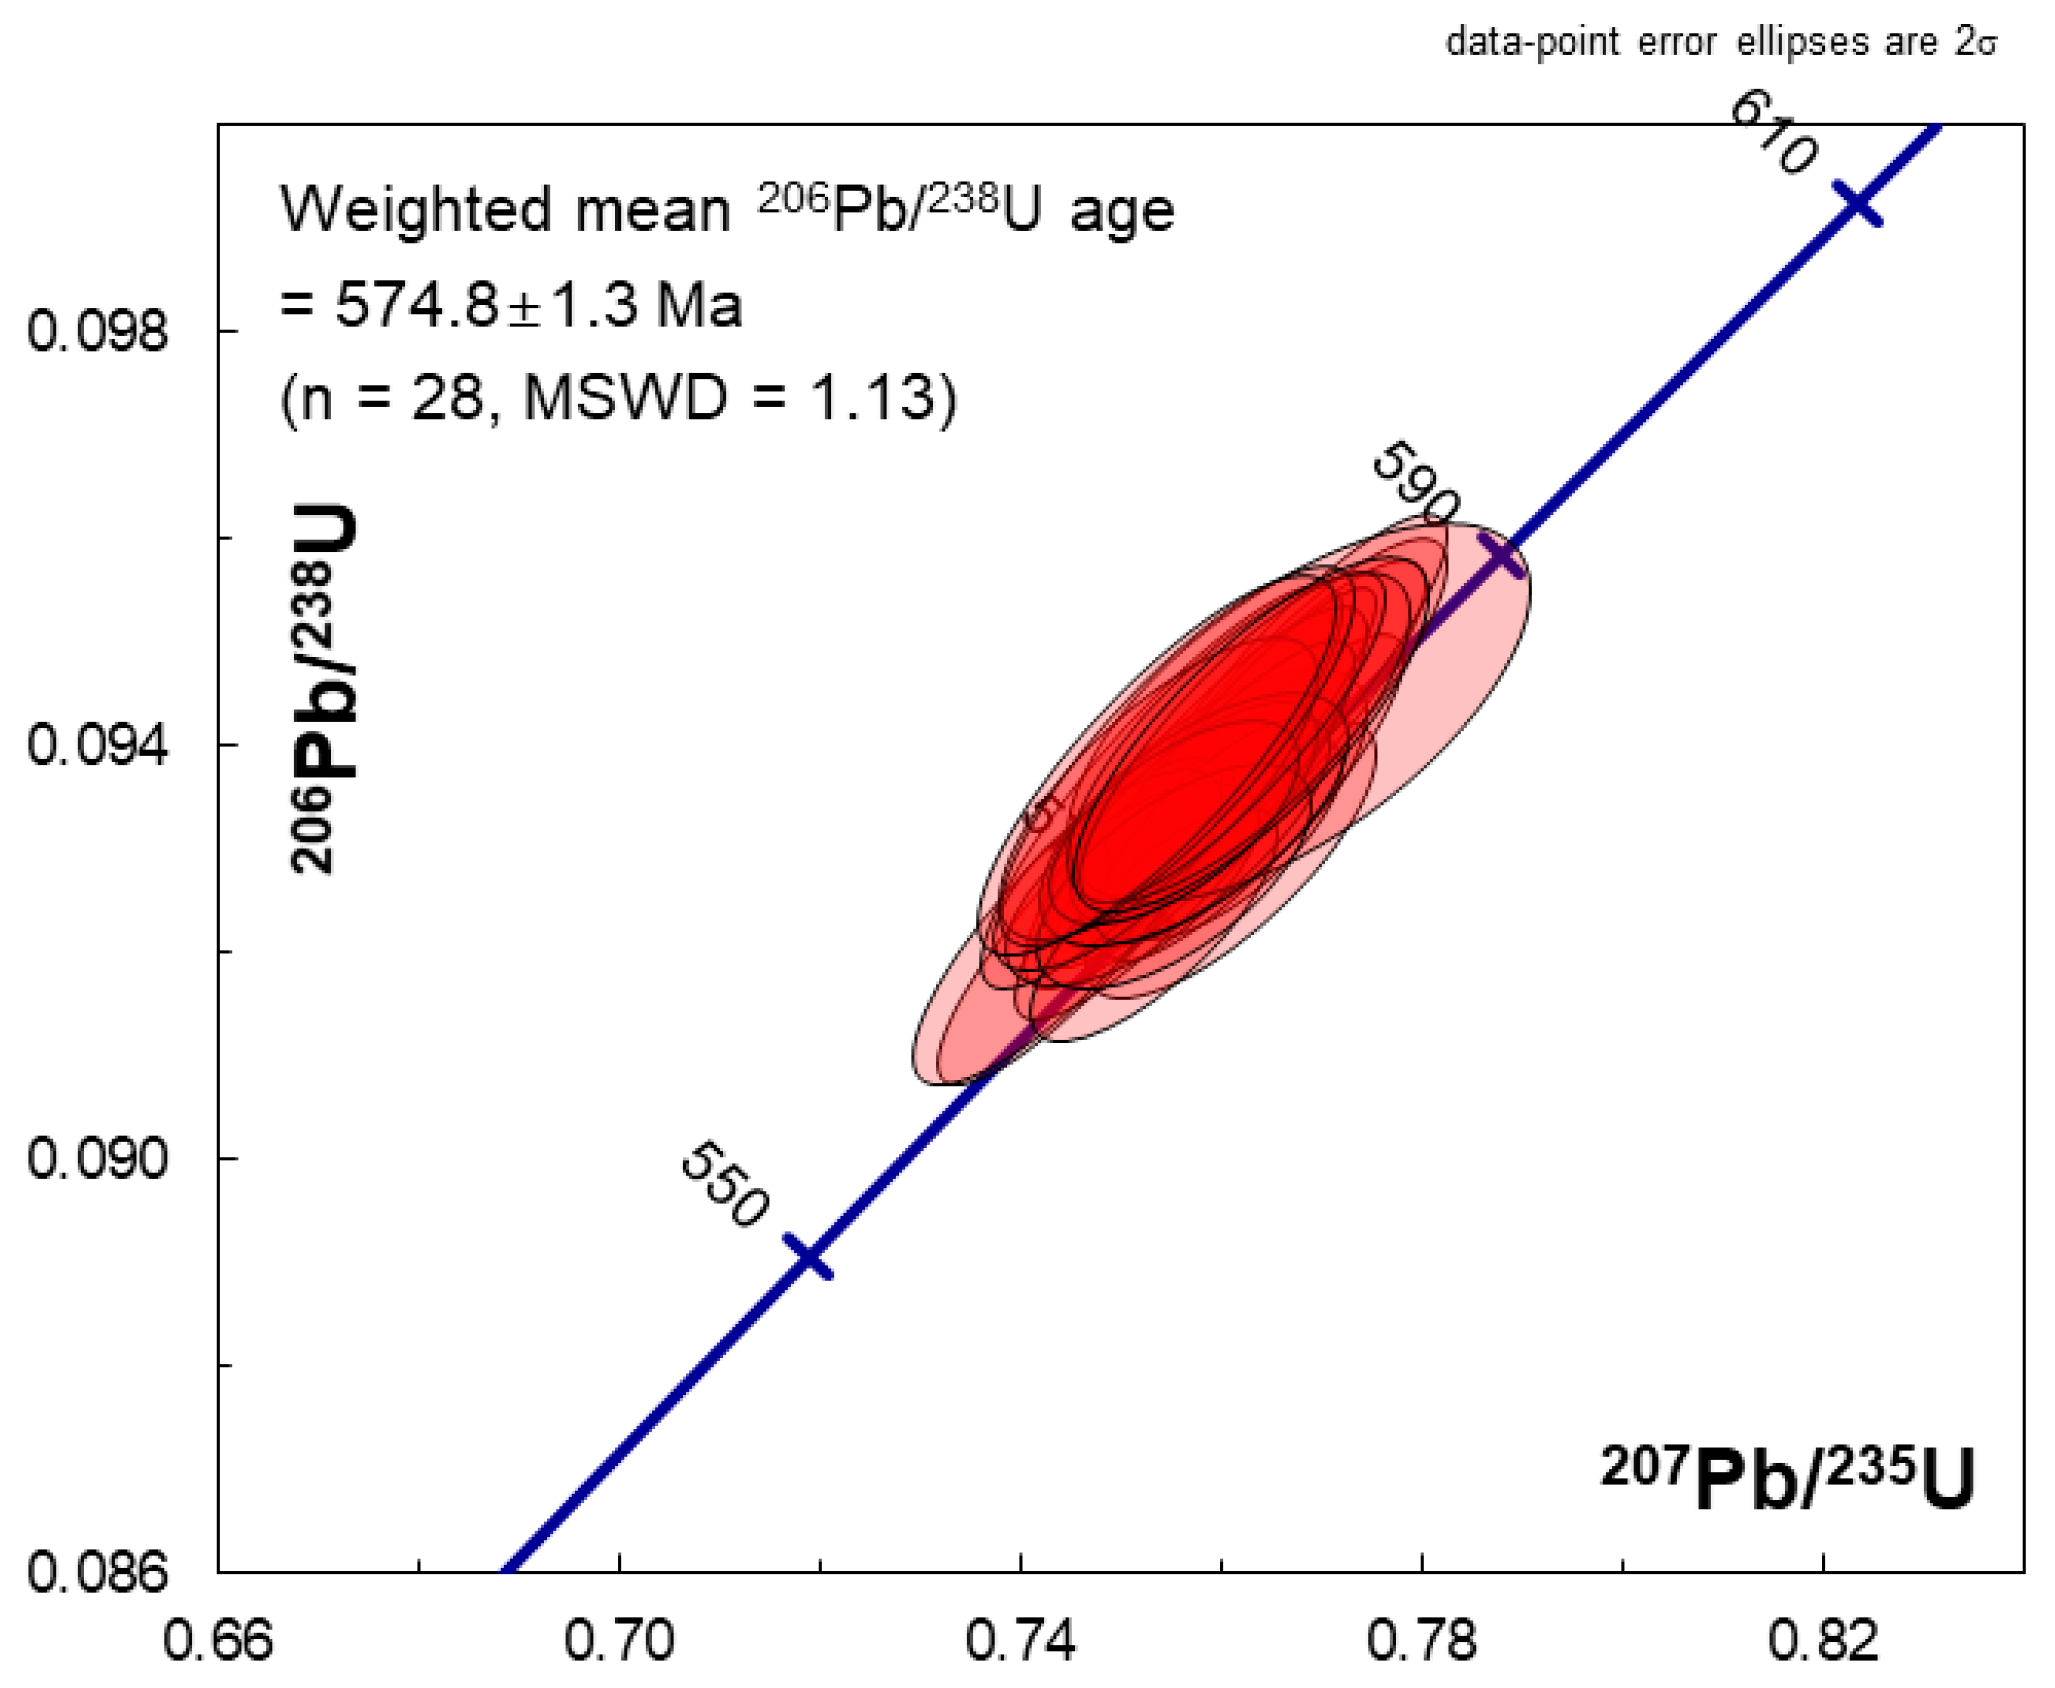
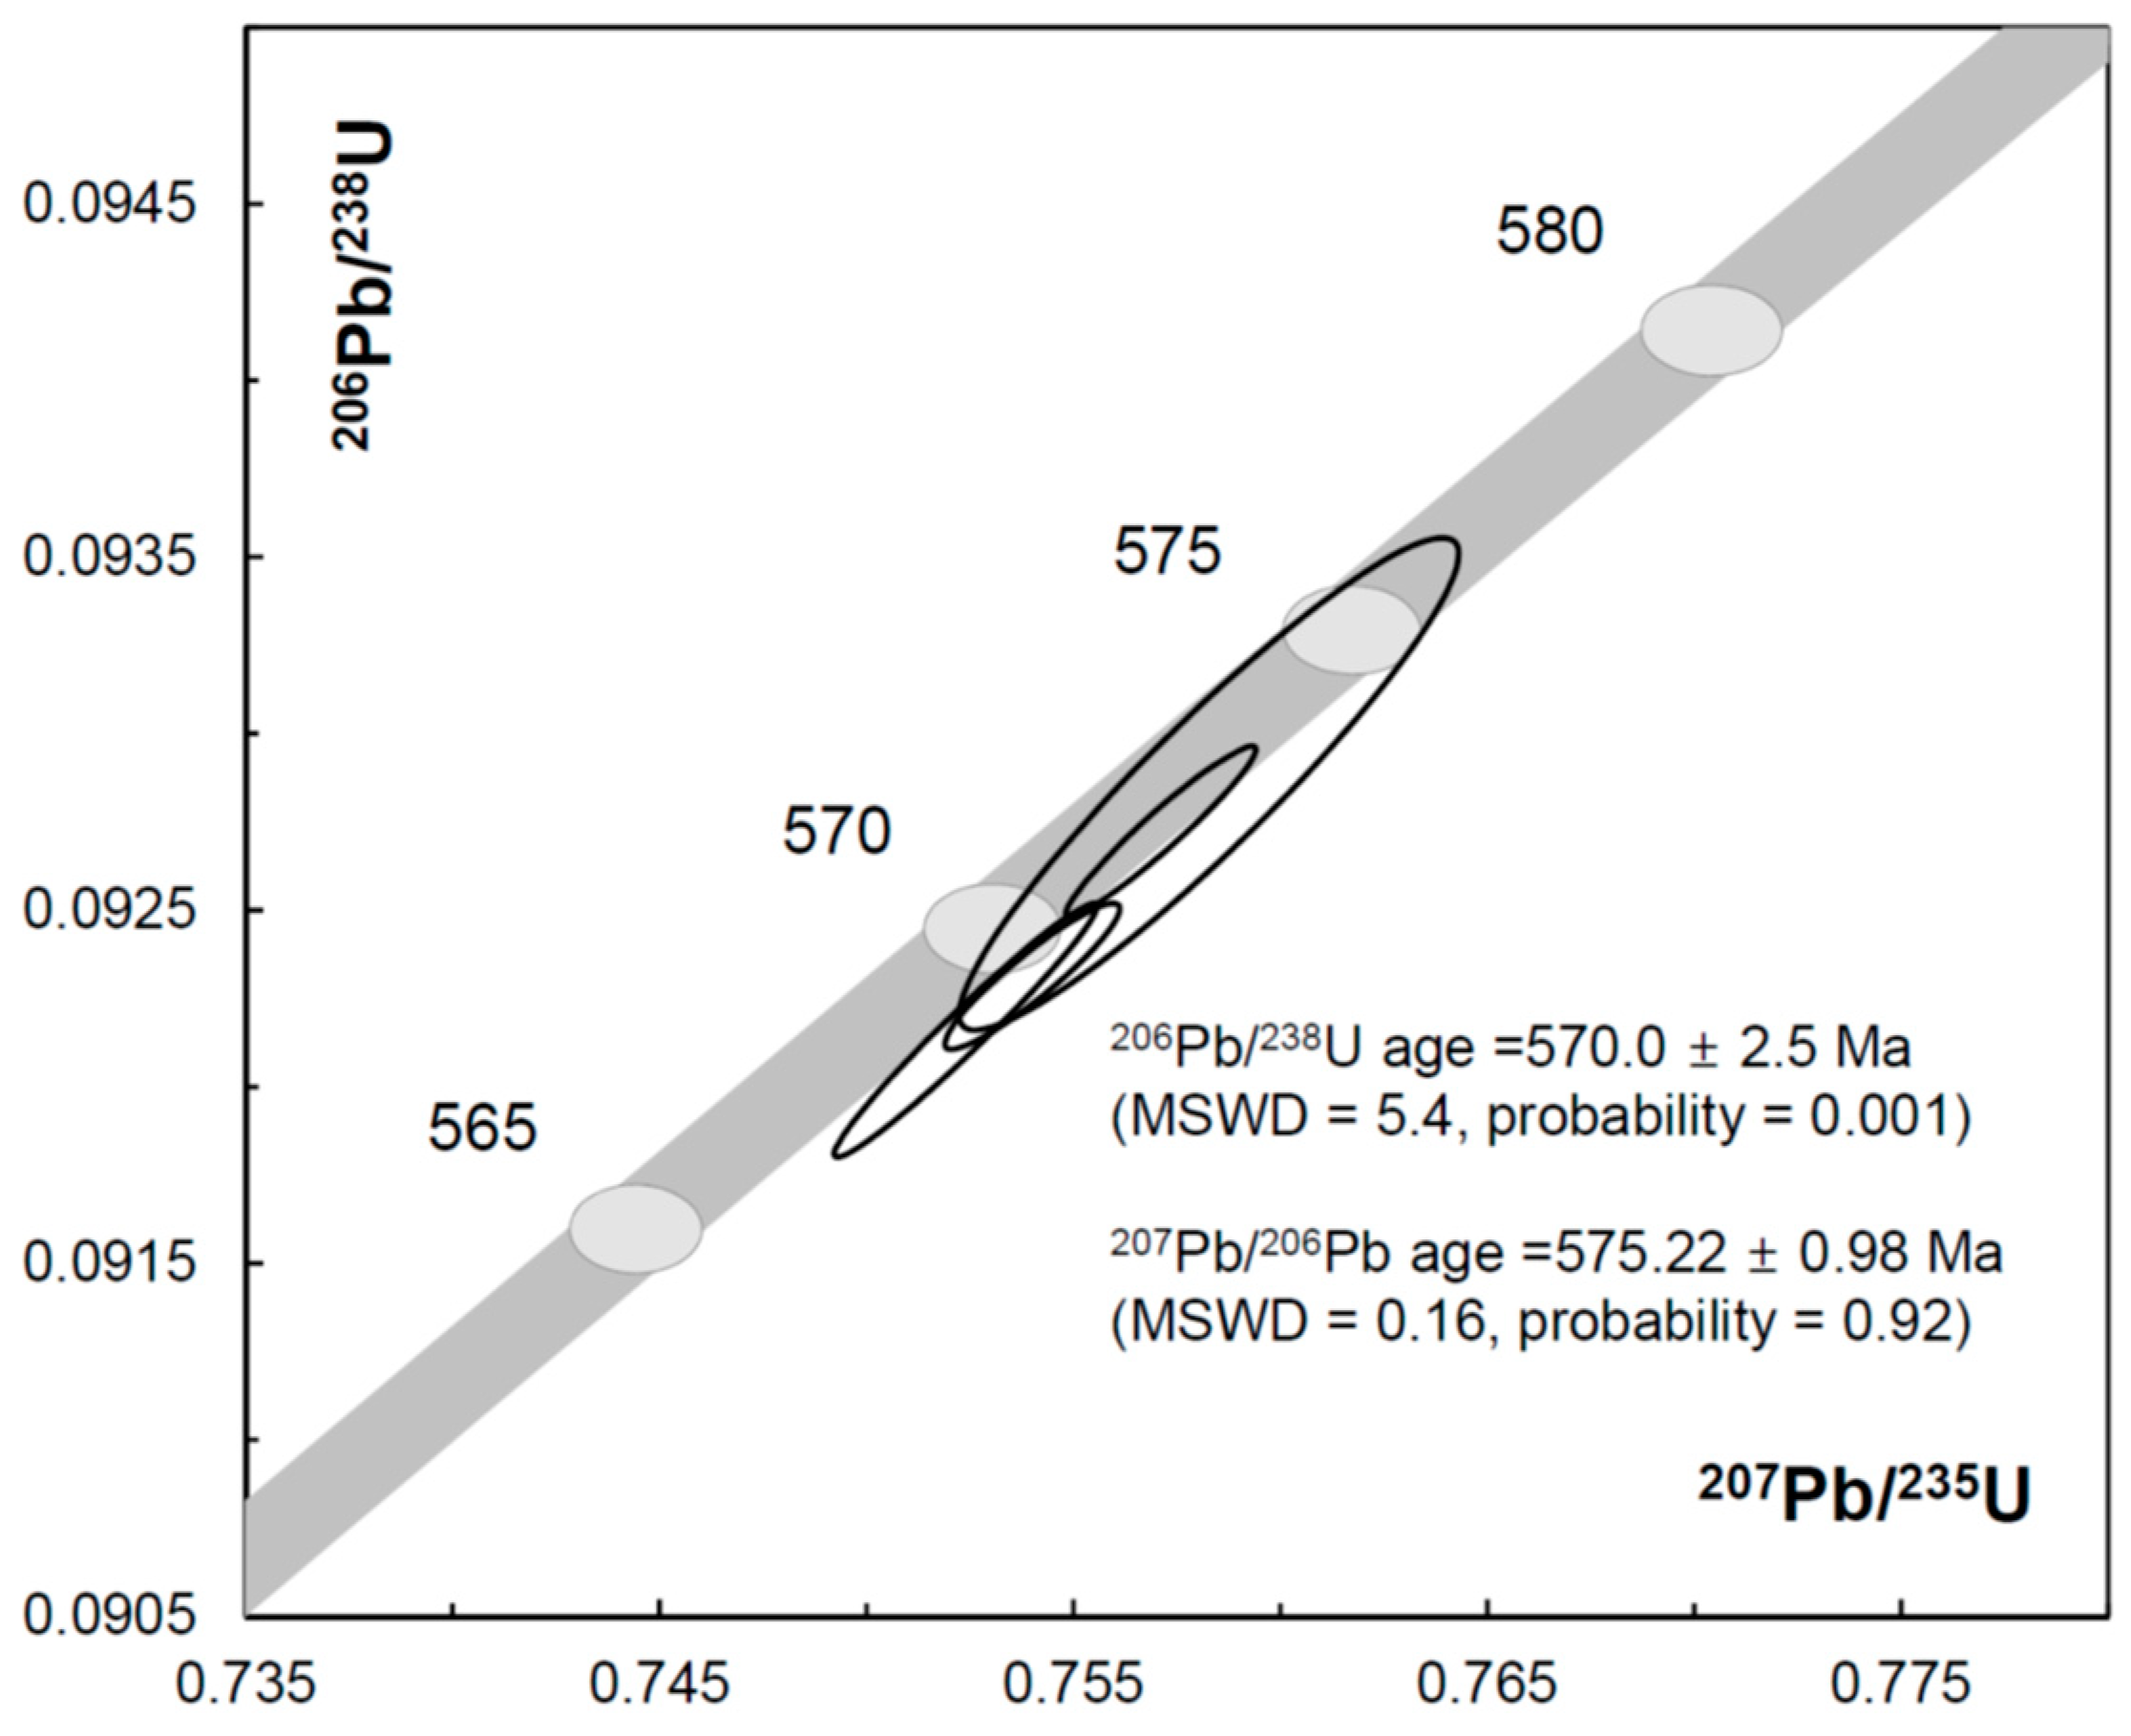
3.1. U–Pb Age
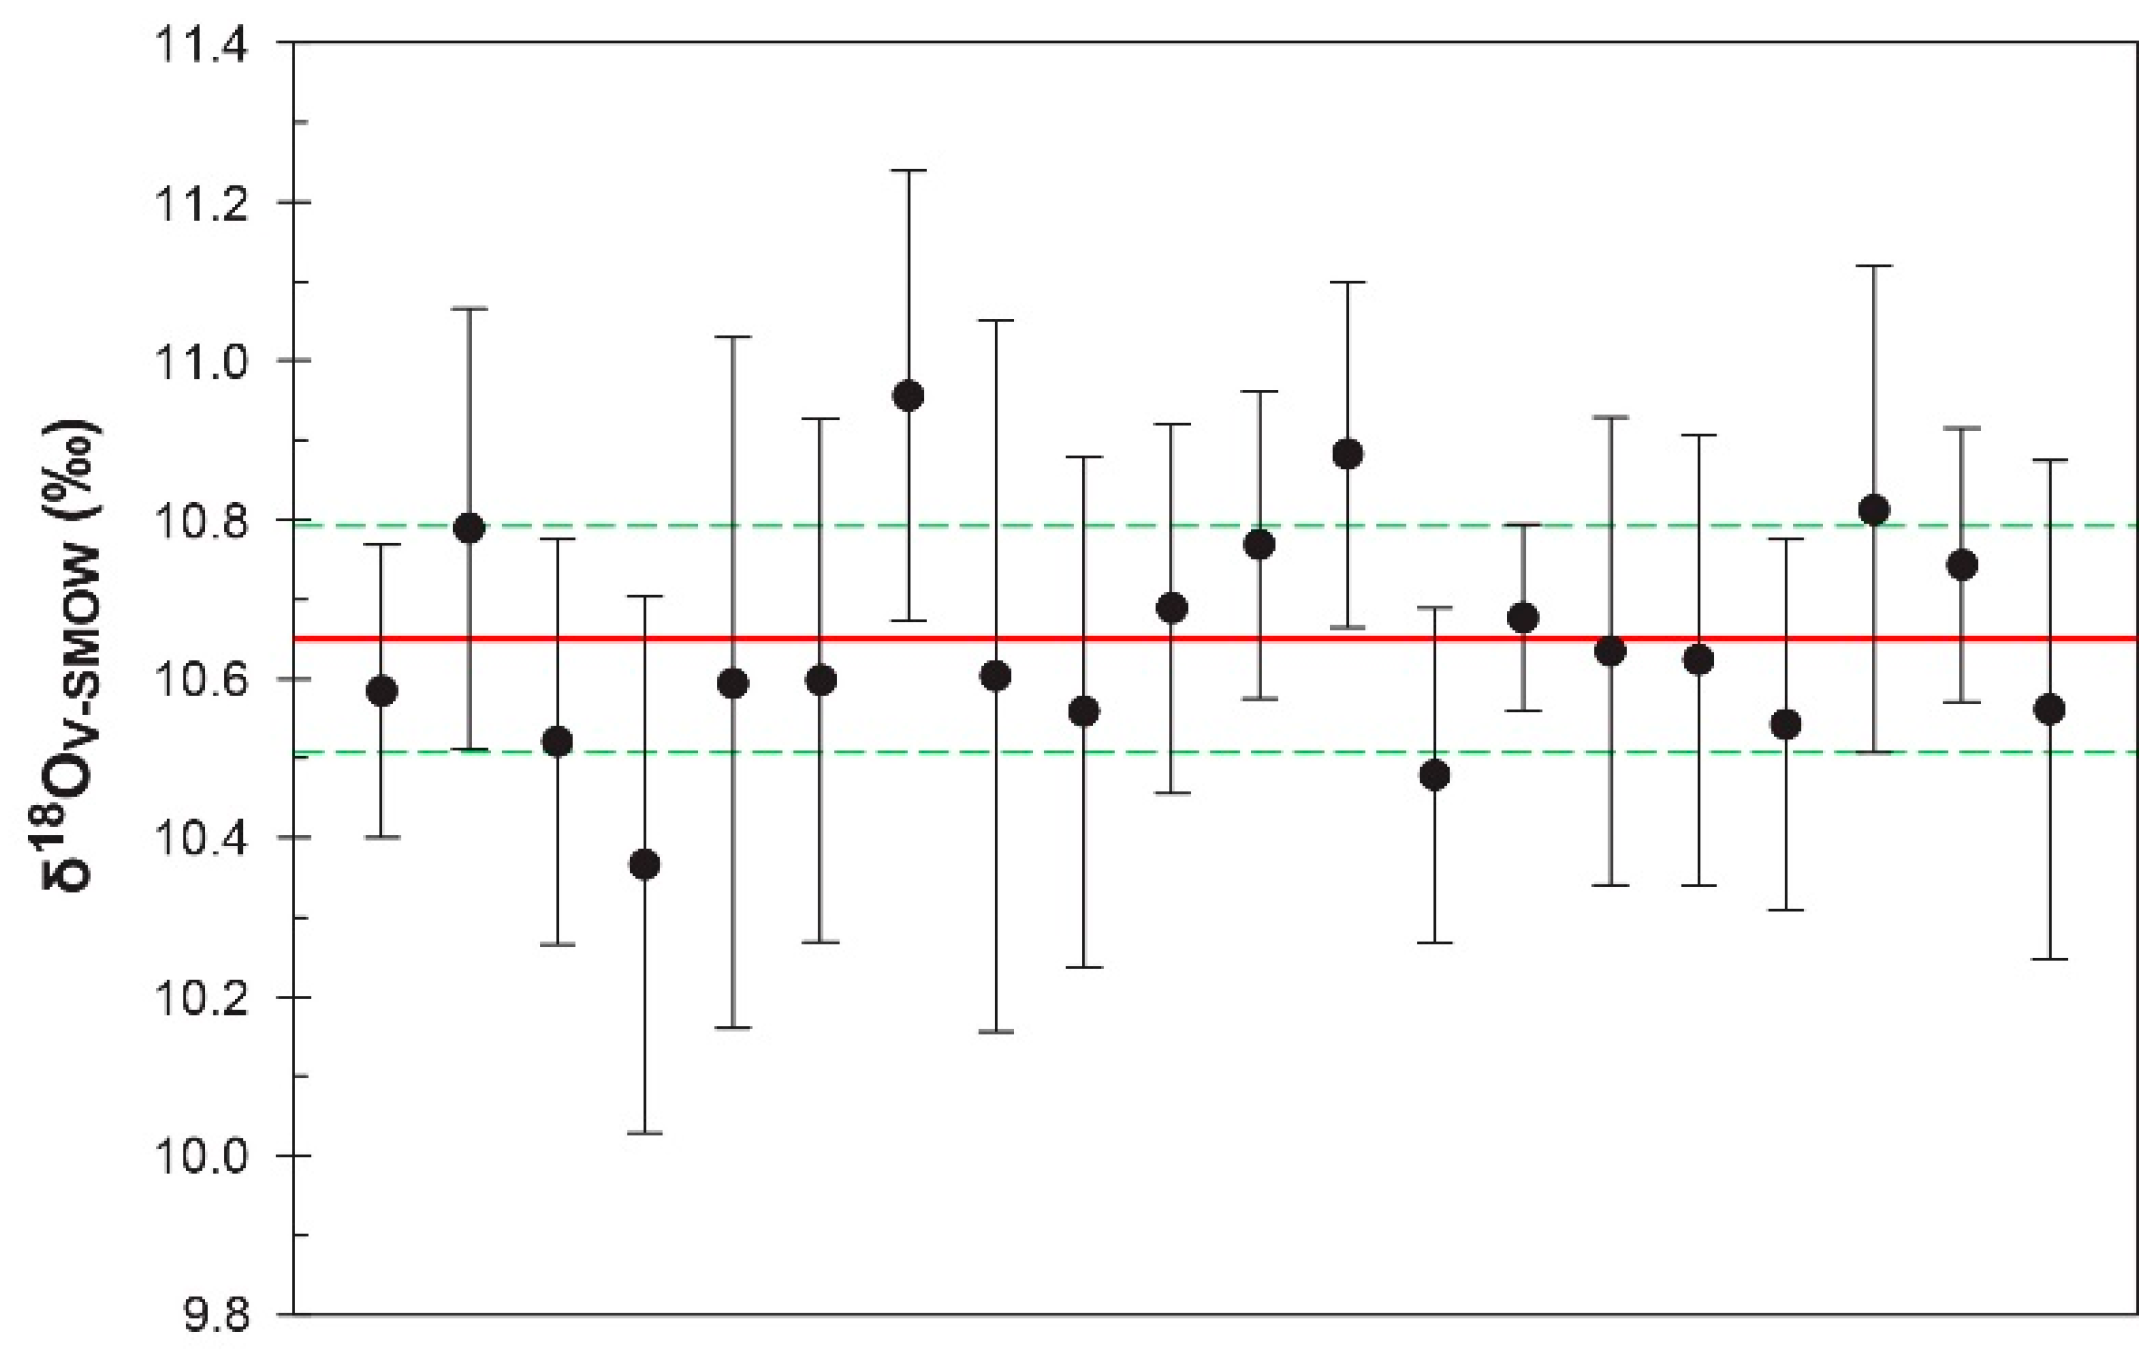
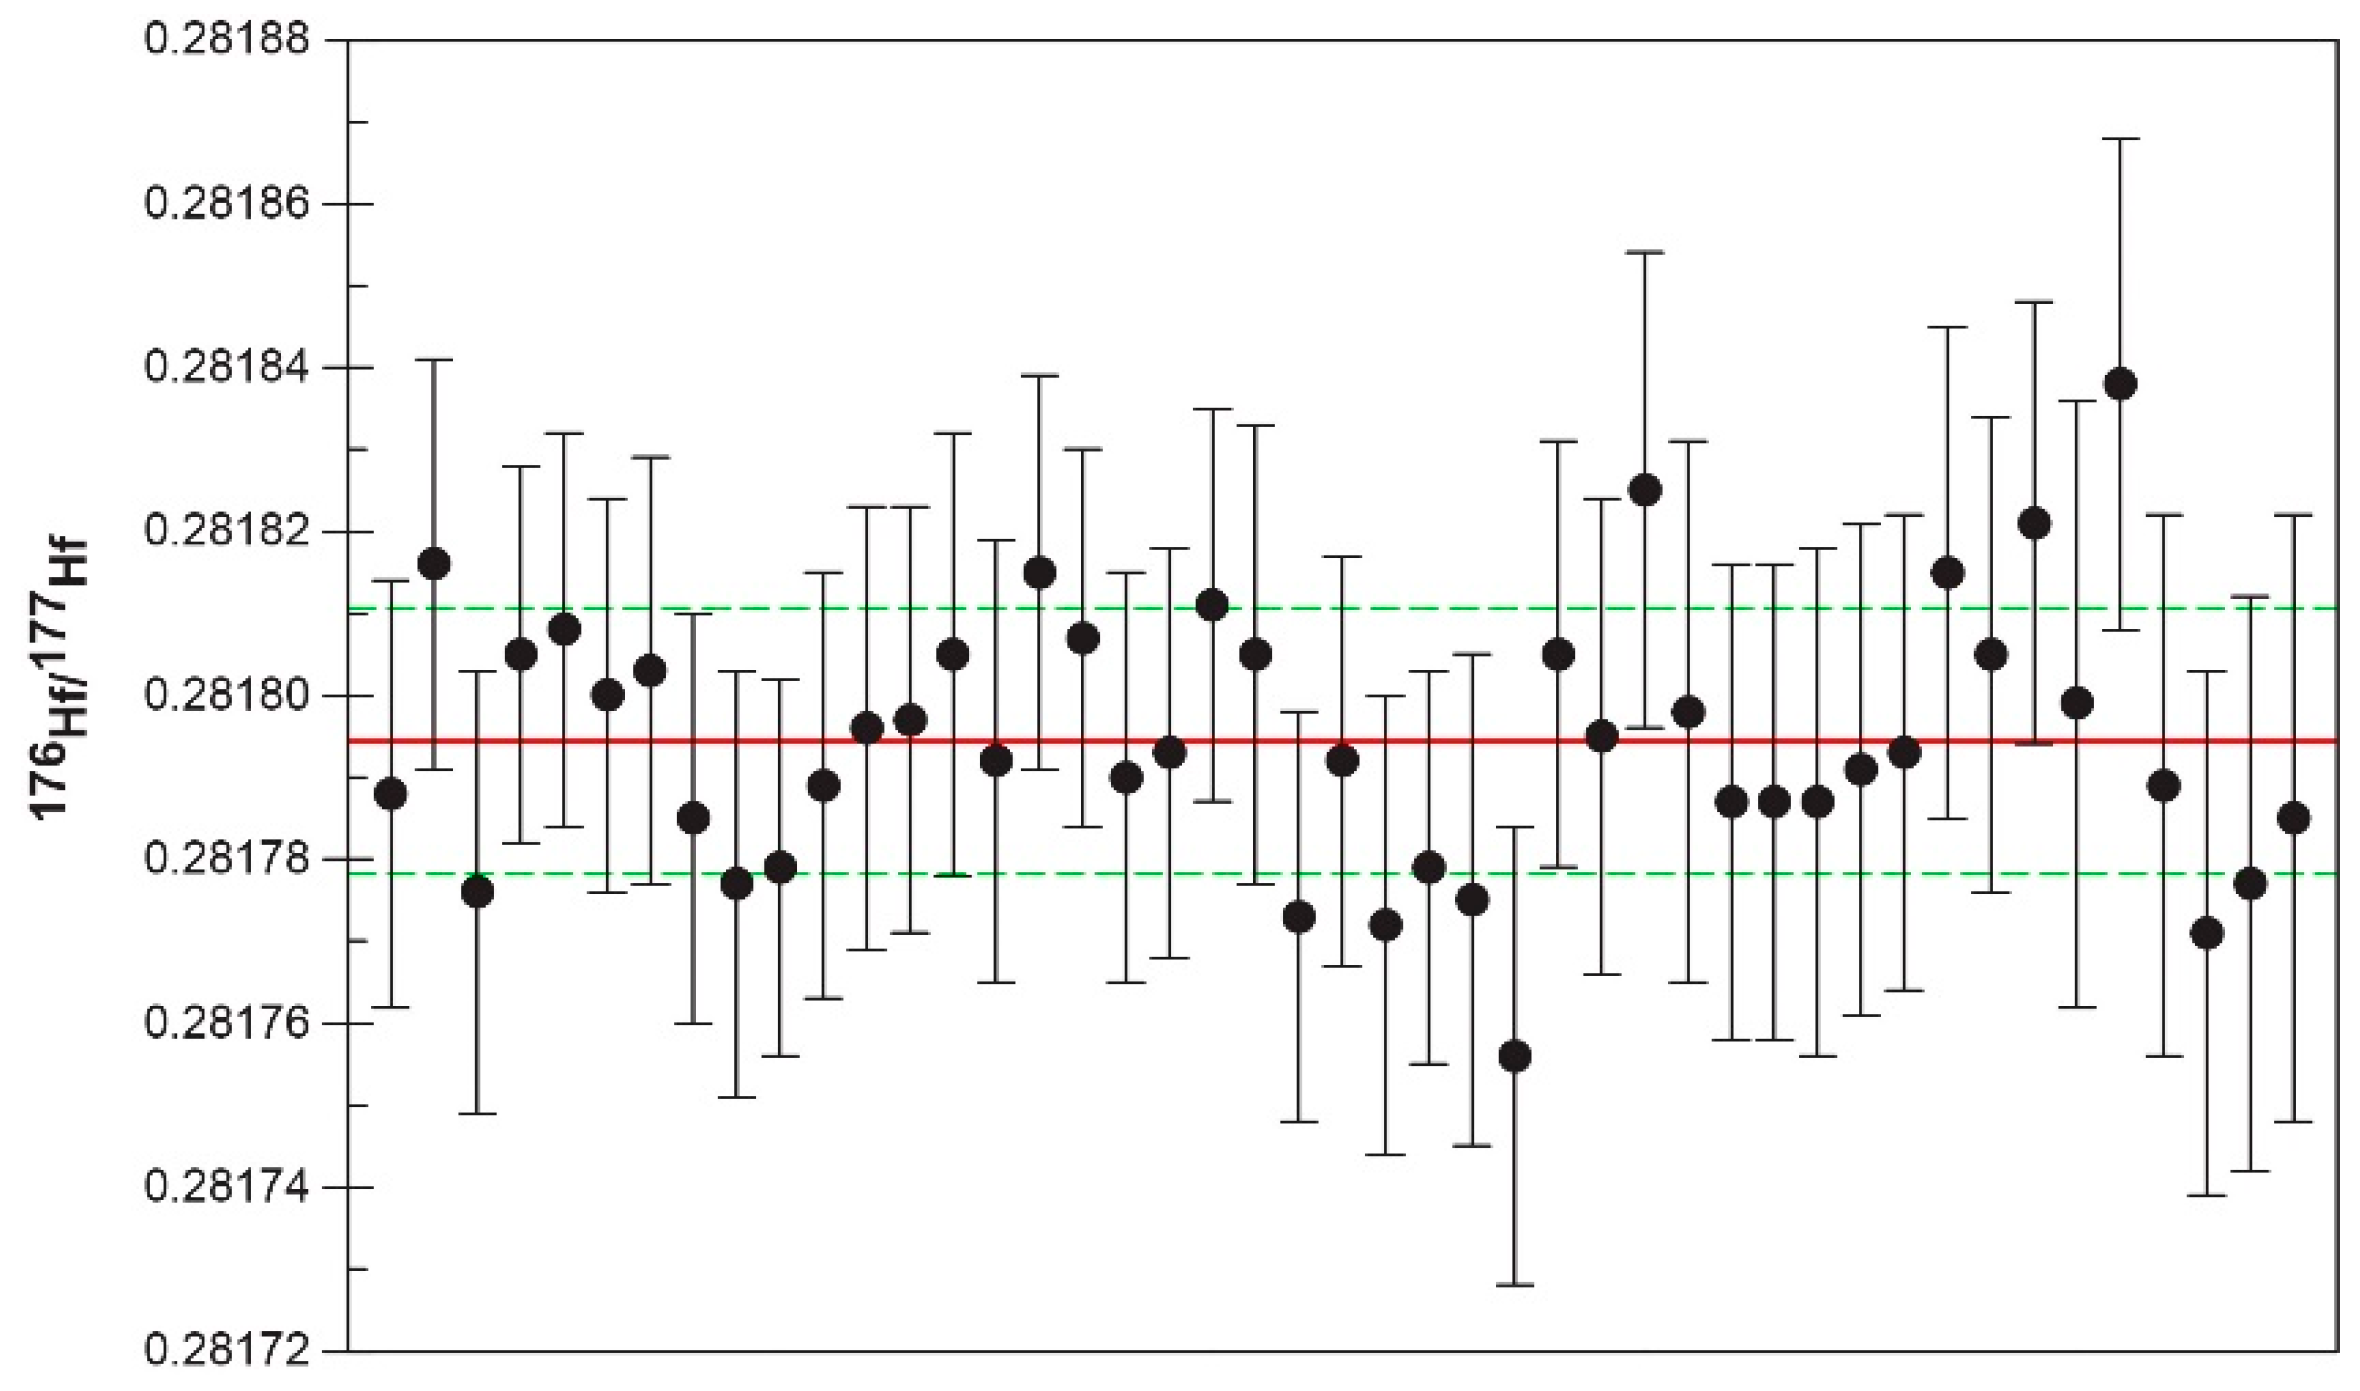
3.2. O and Lu–Y–Hf Isotopic Compositions
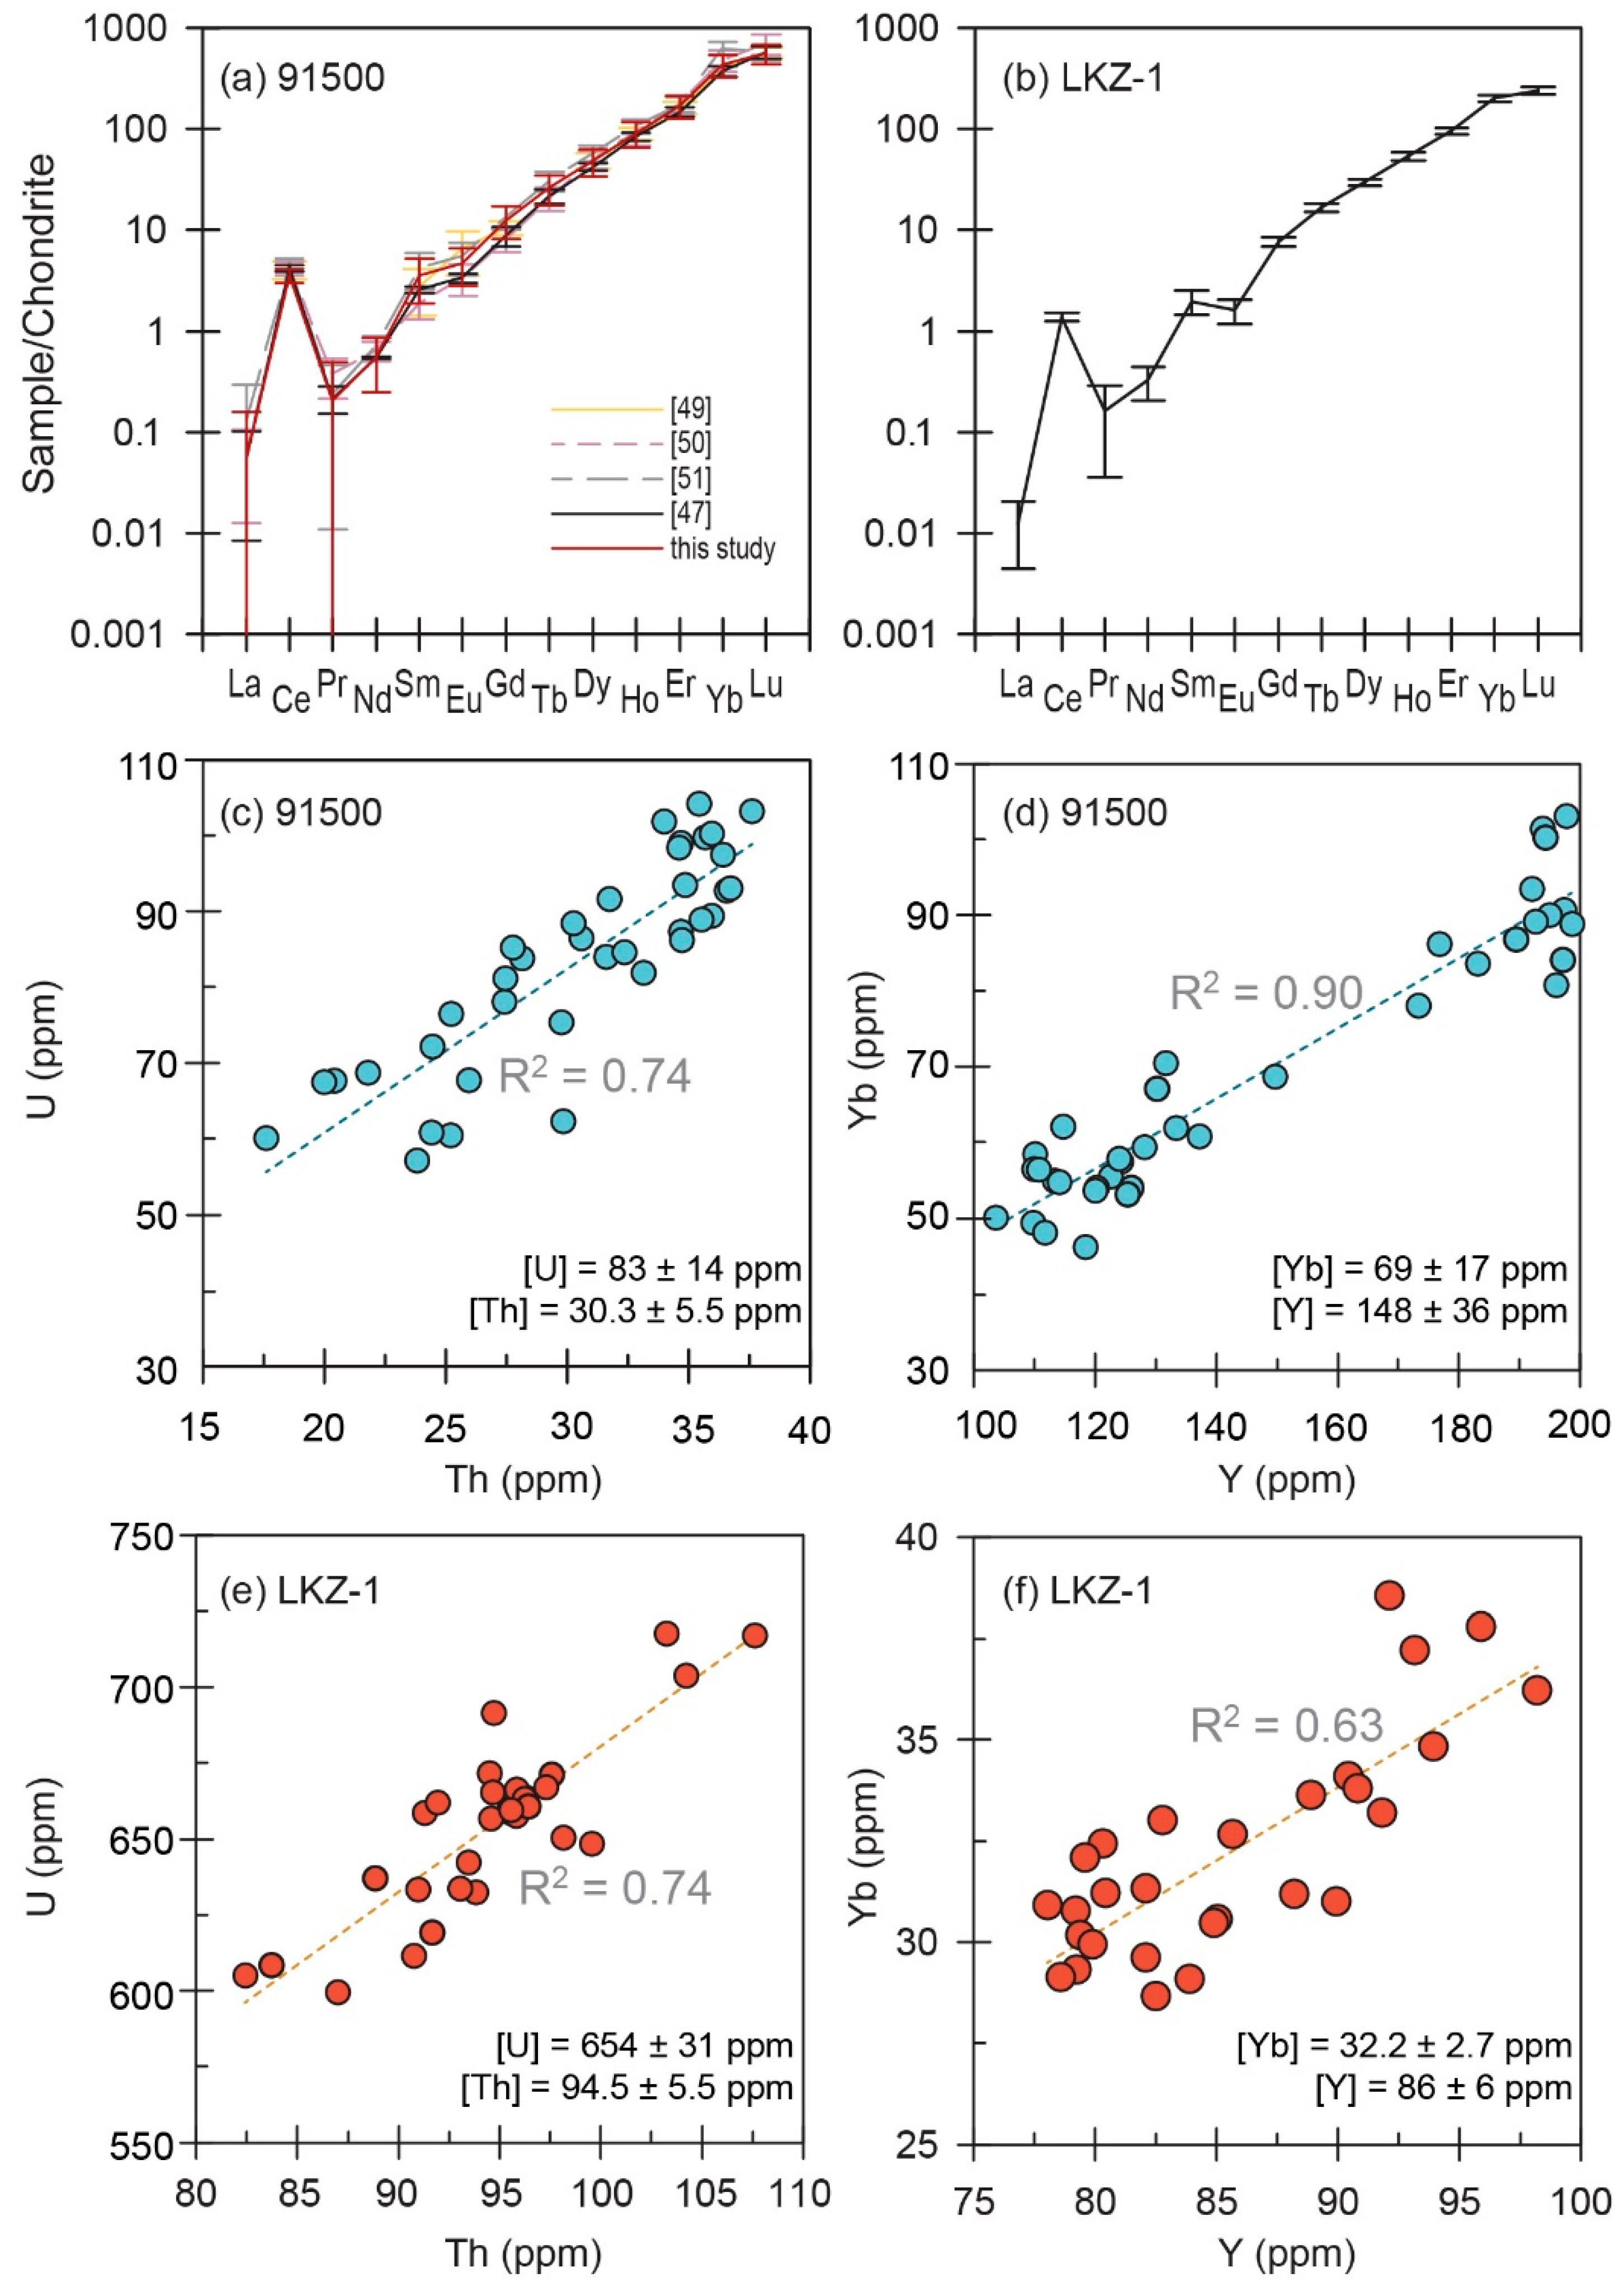
3.3. Chemical Composition
4. Conclusions
Supplementary Materials
Author Contributions
Funding
Acknowledgments
Conflicts of Interest
References
- Jeffery, P.G.; Hutchison, D. Chemical Methods of Rock Analysis, 3rd ed.; Pergamon Press: Oxford, UK, 1981; p. 379. [Google Scholar]
- Potts, P.J. Handbook of Rock Analysis; Viridian Publishing: Surrey, UK, 2003; p. 622. [Google Scholar]
- Bardo, J.; Ryerson, F.J.; Weber, P.K.; Ricolleau, A.; Fallon, S.J.; Hutcheon, I.D. Chemical imaging with NanoSIMS: A window into deep-Earth geochemistry. Earth Planet. Sci. Lett. 2007, 262, 543–551. [Google Scholar]
- Valley, J.W.; Cavosie, A.J.; Ushikubo, T.; Reinhard, D.A.; Lawrence, D.F.; Larson, D.J.; Clifton, P.H.; Kelly, T.F.; Wilde, S.A.; Moser, D.E.; et al. Hadean age for a post-magma-ocean zircon confirmed by atom-probe tomography. Nat. Geosci. 2014, 7, 219–223. [Google Scholar] [CrossRef]
- Davidson, J.P.; Morgan, D.J.; Charlier, B.L.A.; Harlou, R.; Hora, J.M. Microsampling and isotopic analysis of igneous rocks: Implications for the study of magmatic systems. Annu. Rev. Earth Planet. Sci. 2007, 35, 273–311. [Google Scholar] [CrossRef]
- Ireland, T.R.; Williams, I.S. Considerations in zircon geochronology by SIMS. Rev. Mineral. Geochem. 2003, 53, 215–241. [Google Scholar] [CrossRef]
- Valley, J.W. Oxygen isotopes in zircon. Rev. Mineral. Geochem. 2003, 53, 343–385. [Google Scholar] [CrossRef]
- Košler, J.; Sylvester, P.J. Present trends and the future of zircon in geochronology: Laser ablation ICP-MS. Rev. Mineral. Geochem. 2003, 53, 243–275. [Google Scholar] [CrossRef]
- Yokoyama, T.D.; Suzuki, T.; Kon, Y.; Hirata, T. Determinations of rare earth element abundance and U-Pb age of zircons using multisport laser ablation-inductively coupled plasma mass spectrometry. Anal. Chem. 2011, 83, 8892–8899. [Google Scholar] [CrossRef] [PubMed]
- Cherniak, D.J.; Watson, B. Diffusion in zircon. Rev. Mineral. Geochem. 2003, 53, 113–143. [Google Scholar] [CrossRef]
- Hawkesworth, C.J.; Kemp, A.I.S. Using hafnium and oxygen isotopes in zircons to unravel the record of crustal evolution. Chem. Geol. 2006, 226, 144–162. [Google Scholar] [CrossRef]
- Kemp, A.I.S.; Hawkesworth, C.J.; Paterson, B.A.; Kinny, P.D. Episodic growth of the Gondwana supercontinent from hafnium and oxygen isotopes in zircon. Nature 2006, 439, 580–583. [Google Scholar] [CrossRef]
- Jo, H.J.; Cheong, A.C.S.; Ryu, J.S.; Kim, N.; Yi, K.; Jung, H.; Li, X.H. In situ oxygen isotope records of crustal self-cannibalization selectively captured by zircon crystals from high-δ26Mg granitoids. Geology 2016, 44, 339–342. [Google Scholar] [CrossRef]
- Grimes, C.B.; John, B.E.; Kelemen, P.B.; Mazdab, F.K.; Wooden, J.L.; Cheadle, M.J.; Hanghøj, K.; Schwartz, J.J. Trace element chemistry of zircons from oceanic crust: A method for distinguishing detrital zircon provenance. Geology 2007, 35, 643–646. [Google Scholar] [CrossRef]
- Wiedenbeck, M.; Allé, P.; Corfu, F.; Griffin, W.L.; Meier, M.; Oberli, F.; von Quadt, A.; Roddick, J.C.; Speigel, W. Three natural zircon standards for U-Th-Pb, Lu-Hf, trace element and REE analyses. Geostand. Newslett. 1995, 19, 1–23. [Google Scholar] [CrossRef]
- Paces, J.B.; Miller, J.D., Jr. Precise U–Pb ages of Duluth Complex and related mafic intrusions, Northeastern Minnesota: geochronological insights to physical, petrogenic, paleomagnetic, and tectonomagmatic processes associated with the 1.1 Ga midcontinent rift system. J. Geophys. Res. 1993, 98, 13997–14013. [Google Scholar] [CrossRef]
- Black, L.P.; Kamo, S.L.; Allen, C.M.; Aleinikoff, J.N.; Davis, D.W.; Korsch, R.J.; Foudoulis, C. TEMORA 1: A new zircon standard for Phanerozoic U–Pb geochronology. Chem. Geol. 2003, 200, 155–170. [Google Scholar] [CrossRef]
- Black, L.P.; Kamo, S.L.; Allen, C.M.; Davis, D.W.; Aleinikoff, J.N.; Valley, J.W.; Mundil, R.; Campbell, I.H.; Korsch, R.J.; Williams, I.S.; et al. Improved 206Pb/238U microprobe geochronology by the monitoring of a trace-element-related matrix effect; SHRIMP, ID-TIMS, ELA-ICP-MS and oxygen isotope documentation for a series of zircon standards. Chem. Geol. 2004, 205, 115–140. [Google Scholar] [CrossRef]
- Sláma, J.; Košler, J.; Condon, D.J.; Crowley, J.L.; Gerdes, A.; Hanchar, J.M.; Horstwood, M.S.A.; Morris, G.A.; Nasdala, L.; Norberg, N.; et al. Plešovice zircon—A new natural reference material for U-Pb and Hf isotopic microanalysis. Chem. Geol. 2008, 249, 1–35. [Google Scholar] [CrossRef]
- Takehara, M.; Horie, K.; Hokada, T.; Kiyokawa, S. New insight into disturbance of U-Pb and trace-element systems in hydrothermally altered zircon via SHRIMP analyses of zircon from the Duluth Gabbro. Chem. Geol. 2018, 484, 168–178. [Google Scholar] [CrossRef]
- Jeong, Y.J.; Lee, S.; Kim, S.J.; Jo, H.J.; Yi, K.; Cheong, A.C.S. U–Th isotopic microanalysis of zircon reference materials and KBSI working standards. J. Anal. Sci. Technol. 2018, 9, 16. [Google Scholar] [CrossRef]
- Kim, S.J.; Lee, T.H.; Yi, K.; Jeong, Y.J.; Cheong, C.S. Characterization of new zircon and monazite working standards LKZ-1, BRZ-1, COM-1 and BRM-1. In Proceedings of the 1st Japan-Korea SHRIMP meeting, Higashi-Hiroshima, Japan, 14–16 September 2015. [Google Scholar]
- Williams, I.S. U-Th-Pb geochronology by ion microprobe. In Applications of Microanalytical Techniques to Understanding Mineralizing Processes; McKibben, M.A., Shanks, W.C., III, Rindley, W.I., Eds.; Society of Economic Geologists: Littleton, CO, USA, Reviews in Economic Geology; 1998; Volume 7, pp. 1–35. [Google Scholar]
- Ludwig, K.R. User’s manual for Squid 2.50; Berkeley Geochronology Center: Berkeley, CA, USA, Special Publication No. 5; 2009; 110p. [Google Scholar]
- Ludwig, K.R. User’s manual for Isoplot 3.6: A geochronological toolkit for Microsoft Excel; Berkeley Geochronology Center: Berkeley, CA, USA, Special Publication No. 4; 2008; 77p. [Google Scholar]
- Mattinson, J.M. Zircon U-Pb chemical abrasion (“CA-TIMS”) method: Combined annealing and multi-step partial dissolution analysis for improved precision and accuracy of zircon ages. Chem. Geol. 2005, 220, 47–66. [Google Scholar] [CrossRef]
- Krogh, T.E. A low contamination method for hydrothermal decomposition of zircon and extraction of U and Pb for isotopic age determinations. Geochim. Cosmochim. Acta 1973, 37, 485–494. [Google Scholar] [CrossRef]
- Gerstenberger, H.; Haase, G. A highly effective emitter substance for mass spectrometric Pb isotope ratio determinations. Chem. Geol. 1997, 136, 309–312. [Google Scholar] [CrossRef]
- Jaffey, A.H.; Flynn, K.F.; Glendenin, L.E.; Bentley, W.C.; Essling, A.M. Precision measurement of half-lives and specific activities of 235U and 238U. Phys. Rev. 1971, 4, 1889–1906. [Google Scholar]
- Ludwig, K.R. User’s manual for Isoplot 3.00: A geochronological toolkit for Microsoft Excel; Berkeley Geochronology Center: Berkeley, CA, USA, Special Publication No. 4; 2003; p. 71. [Google Scholar]
- Kim, N.K.; Kusakabe, M.; Park, C.; Lee, J.I.; Nagao, K.; Enokido, Y.; Yamashita, S.; Park, S.Y. An automated laser fluorination technique for high-precision analysis of three oxygen isotopes in silicates. Rapid Commun. Mass Sp. 2019, 33, 641–649. [Google Scholar] [CrossRef] [PubMed]
- Baertschi, P. Absolute 18O content of Standard Mean Ocean Water. Earth Planet. Sci. Lett. 1976, 31, 341–344. [Google Scholar] [CrossRef]
- Paton, C.; Hellstrom, J.; Paul, B.; Woodhead, J.; Hergt, J. Iolite: freeware for the visualisation and processing of mass spectrometric data. J. Anal. At. Spectrom. 2011, 26, 2508–2518. [Google Scholar] [CrossRef]
- Chu, N.C.; Taylor, R.N.; Chavagnac, V.; Nesbitt, R.W.; Boella, M.; Milton, J.A. Hf isotope ratio analysis using multi-collector inductively coupled plasma mass spectrometry: An evaluation of isobaric interference corrections. J. Anal. At. Spectrom. 2002, 17, 1567–1574. [Google Scholar] [CrossRef]
- Vervoort, J.D.; Patchett, P.J.; Söderlund, U.; Baker, M. Isotopic composition of Yb and the determination of Lu concentrations and Lu/Hf ratios by isotope dilution using MC-ICPMS. Geochem. Geophys. Geosyst. 2004, 5, Q11002. [Google Scholar] [CrossRef]
- Choi, M.S.; Cheong, C.S.; Kim, J.; Shin, H.S. Hafnium isotope analysis of mixed standard solutions by multi-collector inductively coupled plasma mass spectrometry: an evaluation of isobaric interference corrections. J. Anal. Sci. Technol. 2013, 4, 1. [Google Scholar] [CrossRef] [Green Version]
- Iizuka, T.; Hirata, T. Improvements of precision and accuracy in in-situ Hf isotope microanalysis of zircon using the laser ablation-MC-ICPMS technique. Chem. Geol. 2005, 220, 121–137. [Google Scholar] [CrossRef]
- Scherer, E.; Münker, C.; Mezger, K. Calibration of the lutetium-hafnium clock. Science 2001, 293, 683–687. [Google Scholar] [CrossRef] [PubMed]
- Blichert-Toft, J.; Albarède, F. The Lu-Hf isotope geochemistry of chondrites and the evolution of the mantle-crust system. Earth Planet. Sci. Lett. 1997, 148, 243–258. [Google Scholar] [CrossRef]
- Guillong, M.; Günther, D. Effect of particle size distribution on ICP-induced elemental fractionation in laser ablation-inductively coupled plasma-mass spectrometry. J. Anal. At. Spectrom. 2002, 17, 831–837. [Google Scholar] [CrossRef]
- Jochum, K.P.; Weis, U.; Stoll, B.; Kuzmin, D.; Yang, Q.; Raczek, I.; Jacob, D.E.; Stracke, A.; Birbaum, K.; Frick, D.A.; et al. Determination of reference values for NIST SRM 610-617 glasses following ISO guidelines. Goestan. Geoanal. Res. 2011, 35, 397–429. [Google Scholar] [CrossRef]
- Stacey, J.S.; Kramers, J.D. Approximation of terrestrial lead isotope evolution by a two-stage model. Earth Planet. Sci. Lett. 1975, 26, 207–221. [Google Scholar] [CrossRef]
- Claoué-Long, J.C.; Compston, W.; Roberts, J.; Fanning, C.M. Two Carboniferous ages: A comparison of SHRIMP zircon dating with conventional zircon ages and 40Ar/39Ar analysis. In Geochronology Time Scales and Global Stratigraphic Correlation; Berggren, W.A., Kent, D.V., Aubrey, M.-P., Hardenbol, J., Eds.; Society for Sedimentary Geology Special Publication: Tulsa, OK, USA, 1995; Volume 54, pp. 3–21. [Google Scholar]
- Mattinson, J.M. U–Pb ages of zircons: A basic examination of error propagation. Chem. Geol. 1987, 66, 151–162. [Google Scholar] [CrossRef]
- Black, L.P.; Kamo, S.L.; Williams, I.S.; Mundil, R.; Davis, D.W.; Korsch, R.J.; Foudoulis, C. The application of SHRIMP to Phanerozoic geochronology; a critical appraisal of four zircon standards. Chem. Geol. 2003, 200, 171–188. [Google Scholar] [CrossRef]
- Li, X.H.; Long, W.G.; Li, Q.L.; Liu, Y.; Zheng, Y.F.; Yang, Y.H.; Chamberlain, K.R.; Wan, D.F.; Guo, C.H.; Wang, X.C.; et al. Penglai zircon megacrysts: A potential new working reference microbeam determination of Hf–O isotopes and U–Pb age. Geostand. Geoanal. Res. 2010, 34, 117–134. [Google Scholar] [CrossRef]
- Wiedenbeck, M.; Hanchar, J.M.; Peck, W.H.; Sylvester, P.; Valley, J.; Whitehouse, M.; Kronz, A.; Morishita, Y.; Nasdala, L.; Fiebig, J.; et al. Further characterisation of the 91500 zircon crystal. Geostand. Geoanal. Res. 2004, 28, 9–39. [Google Scholar] [CrossRef]
- Blichert-Toft, J. The Hf isotopic composition of zircon reference material 91500. Chem. Geol. 2008, 253, 252–257. [Google Scholar] [CrossRef]
- Belousova, E.A.; Griffin, W.L.; O’Reilly, S.Y.; Fisher, N.I. Igneous zircon: Trace element composition as an indicator of source rock type. Contrib. Mineral. Petrol. 2002, 143, 602–622. [Google Scholar] [CrossRef]
- Sano, Y.; Terada, K.; Fukuoka, T. High mass resolution ion microprobe analysis of rare earth elements in silicate glass, apatite and zircon: lack of matrix dependency. Chem. Geol. 2002, 184, 217–230. [Google Scholar] [CrossRef]
- Iizuka, T.; Hirata, T. Simultaneous determinations of U–Pb age and REE abundances for zircons using ArF excimer laser ablation-ICPMS. Geochem. J. 2004, 38, 229–241. [Google Scholar] [CrossRef]
- McDonough, W.F.; Sun, S.S. The composition of the Earth. Chem. Geol. 1995, 120, 223–253. [Google Scholar] [CrossRef]


| Parameter | U–Pb | Lu–Yb–Hf |
|---|---|---|
| MC-ICPMS | ||
| Instrument | Nu Plasma II | |
| RF power | 1300 W | 1300 W |
| Reflected power | <1 W | <1 W |
| Mixed gas & flow rate | Ar, ~0.9 L/min | Ar, ~0.7 L/min |
| Auxiliary gas & flow rate | Ar, 0.9 L/min | Ar, 0.9 L/min |
| Cool gas & flow rate | Ar, 13 L/min | Ar, 13 L/min |
| Sampler cone | Ni (1 mm orifice) | Ni (1 mm orifice) |
| Skimmer cone | Ni (0.7 mm orifice) | Ni (0.7 mm orifice) |
| Data acquisition mode | Time resolved analysis | Time resolved analysis |
| Integration time | 0.2 s | 0.2 s |
| Collectors | 2 Faraday cups and 5 ion counters | 10 Faraday cups |
| Measured isotopes | 238U, 232Th, 208Pb, 207Pb, 206Pb, 204Pb, 202Hg | 172Yb, 173Yb, 174(Hf + Yb), 175Lu, 176(Hf + Yb + Lu), 177Hf, 178Hf, 179Hf, 180Hf, 183W |
| Laser ablation system | ||
| Laser | ESI machines 193nm ArF excimer laser | |
| Ablation mode | Single hole drilling | |
| Cell | Two volume 2 cell (10 × 10 cm) | |
| Sample transport tubing | 0.5 m length | 0.5m length |
| Pulse repetition rate & width | 5Hz, <4 ns | 10Hz, <4 ns |
| Pulse energy density | ~3 J/cm2 | ~ 8 J/cm2 |
| Ablation duration | 30 s | 60 s |
| Carrier gas & flow rate | He, 0.65 L/min | He, 0.65 L/min; N2, 0.002 L/min |
| Crater size | ~15 µm | ~50 µm |
| Drill depth | ~4 µm | ~20 µm |
| Spot No. | 206Pbc1 (%) | 206Pb/238U2 | ±% | 207Pb/206Pb2 | ±% | Th (ppm) | U (ppm) | Disc.% | Date3 (Ma) | ||
|---|---|---|---|---|---|---|---|---|---|---|---|
| LKZ_1.1 | 0.01 | 0.2322 | 2.62 | 0.0590 | 0.84 | 97.4 | 652 | −1.1 | 570.3 | ± | 4.5 |
| LKZ_1.2 | 0.04 | 0.2310 | 3.17 | 0.0595 | 0.85 | 93.4 | 636 | 0.6 | 569.1 | ± | 4.5 |
| LKZ_2.1 | 0.13 | 0.2220 | 0.45 | 0.0592 | 0.88 | 87.0 | 603 | −6.3 | 565.7 | ± | 9.4 |
| LKZ_2.2 | 0.07 | 0.2157 | 2.50 | 0.0590 | 0.89 | 87.7 | 607 | −3.8 | 566.9 | ± | 4.5 |
| LKZ_3.1 | 0.05 | 0.2227 | 2.80 | 0.0600 | 0.87 | 90.3 | 619 | 2.7 | 572.5 | ± | 4.6 |
| LKZ_3.2 | 0.07 | 0.2299 | 1.86 | 0.0591 | 2.31 | 86.3 | 597 | −3.7 | 572.2 | ± | 4.6 |
| LKZ_4.1 | 0.06 | 0.2272 | 1.53 | 0.0602 | 0.86 | 92.4 | 626 | 3.2 | 572.4 | ± | 4.6 |
| LKZ_4.2 | 0.01 | 0.2210 | 2.11 | 0.0603 | 0.88 | 92.6 | 631 | 6.4 | 570.5 | ± | 4.5 |
| LKZ_5.1 | 0.2248 | 1.42 | 0.0587 | 0.89 | 90.3 | 621 | −3.8 | 580.8 | ± | 4.7 | |
| LKZ_5.2 | 0.2189 | 1.76 | 0.0584 | 0.89 | 90.3 | 627 | −5.9 | 577.8 | ± | 4.6 | |
| LKZ_6.1 | 0.2224 | 2.14 | 0.0600 | 0.88 | 89.1 | 619 | 8.3 | 568.0 | ± | 4.5 | |
| LKZ_6.2 | 0.2185 | 0.45 | 0.0591 | 0.89 | 96.3 | 656 | 1.1 | 580.1 | ± | 4.6 | |
| LKZ_7.1 | 0.07 | 0.2261 | 1.90 | 0.0593 | 1.55 | 82.0 | 576 | −2.8 | 573.4 | ± | 4.6 |
| LKZ_7.2 | 0.08 | 0.2294 | 1.41 | 0.0599 | 0.89 | 86.4 | 599 | 0.0 | 574.3 | ± | 4.6 |
| LKZ_8.1 | 0.16 | 0.2272 | 1.78 | 0.0587 | 1.69 | 89.7 | 620 | −15.1 | 580.0 | ± | 6.8 |
| LKZ_8.2 | 0.03 | 0.2228 | 1.98 | 0.0583 | 0.91 | 89.8 | 619 | −9.2 | 580.9 | ± | 7.8 |
| LKZ_9.1 | 0.01 | 0.2261 | 1.76 | 0.0586 | 0.91 | 85.4 | 598 | −4.6 | 572.6 | ± | 4.6 |
| LKZ_9.2 | 0.2245 | 2.20 | 0.0587 | 1.57 | 86.8 | 607 | −3.6 | 578.7 | ± | 4.7 | |
| LKZ_10.1 | 0.2275 | 2.00 | 0.0598 | 0.85 | 96.8 | 649 | 6.2 | 571.1 | ± | 4.6 | |
| LKZ_10.2 | 0.02 | 0.2303 | 2.05 | 0.0596 | 0.85 | 97.7 | 652 | 2.0 | 570.2 | ± | 4.6 |
| LKZ_11.1 | 0.2313 | 1.84 | 0.0593 | 0.88 | 87.7 | 602 | 3.8 | 564.7 | ± | 4.6 | |
| LKZ_11.2 | 0.07 | 0.2297 | 1.72 | 0.0572 | 0.99 | 89.3 | 608 | −19.7 | 571.3 | ± | 4.6 |
| Spot No. | 206Pb/238U | 2SE | Date (Ma) | 2SE | 207Pb/206Pb | 2SE | Date (Ma) | 2SE |
|---|---|---|---|---|---|---|---|---|
| LKZ-1-1 | 0.0929 | 0.0011 | 574.1 | 6.6 | 0.0594 | 0.0006 | 580 | 11 |
| LKZ-1-2 | 0.0934 | 0.0011 | 575.6 | 6.2 | 0.0589 | 0.0007 | 562 | 17 |
| LKZ-1-3 | 0.0931 | 0.0008 | 573.9 | 4.7 | 0.0593 | 0.0005 | 571 | 10 |
| LKZ-1-4 | 0.0928 | 0.0013 | 572.2 | 7.7 | 0.0592 | 0.0007 | 564 | 13 |
| LKZ-1-5 | 0.0924 | 0.0008 | 569.8 | 4.6 | 0.0589 | 0.0005 | 566 | 12 |
| LKZ-1-6 | 0.0942 | 0.0013 | 580.4 | 7.8 | 0.0589 | 0.0005 | 566 | 10 |
| LKZ-1-7 | 0.0935 | 0.0013 | 576.9 | 7.5 | 0.0592 | 0.0005 | 572 | 10 |
| LKZ-1-8 | 0.0943 | 0.0014 | 581.0 | 8.0 | 0.0589 | 0.0005 | 568 | 10 |
| LKZ-1-9 | 0.0944 | 0.0015 | 581.4 | 9.0 | 0.0588 | 0.0005 | 559 | 11 |
| LKZ-1-10 | 0.0937 | 0.0015 | 577.9 | 8.7 | 0.0587 | 0.0004 | 555 | 9 |
| LKZ-1-11 | 0.0935 | 0.0015 | 576.1 | 8.6 | 0.0587 | 0.0005 | 559 | 11 |
| LKZ-1-12 | 0.0923 | 0.0013 | 569.1 | 7.9 | 0.0587 | 0.0005 | 553 | 11 |
| LKZ-1-13 | 0.0932 | 0.0015 | 574.3 | 8.9 | 0.0589 | 0.0005 | 561 | 12 |
| LKZ-1-14 | 0.0923 | 0.0013 | 568.8 | 7.5 | 0.0585 | 0.0006 | 547 | 12 |
| LKZ-1-15 | 0.0936 | 0.0016 | 576.6 | 9.5 | 0.0584 | 0.0006 | 547 | 13 |
| LKZ-1-16 | 0.0927 | 0.0008 | 571.2 | 4.8 | 0.0588 | 0.0006 | 561 | 14 |
| LKZ-1-17 | 0.0923 | 0.0009 | 569.0 | 5.5 | 0.0592 | 0.0005 | 577 | 10 |
| LKZ-1-18 | 0.0932 | 0.0009 | 574.4 | 5.2 | 0.0591 | 0.0005 | 565 | 10 |
| LKZ-1-19 | 0.0928 | 0.0008 | 572.0 | 4.6 | 0.0585 | 0.0005 | 559 | 9 |
| LKZ-1-20 | 0.0934 | 0.0009 | 575.4 | 5.1 | 0.0588 | 0.0006 | 554 | 12 |
| LKZ-1-21 | 0.0943 | 0.0015 | 580.8 | 8.8 | 0.0590 | 0.0011 | 574 | 19 |
| LKZ-1-22 | 0.0927 | 0.0009 | 571.6 | 5.3 | 0.0591 | 0.0007 | 567 | 14 |
| LKZ-1-23 | 0.0933 | 0.0010 | 575.1 | 5.9 | 0.0589 | 0.0008 | 573 | 14 |
| LKZ-1-24 | 0.0936 | 0.0012 | 576.9 | 7.2 | 0.0584 | 0.0007 | 532 | 16 |
| LKZ-1-25 | 0.0933 | 0.0008 | 574.7 | 4.7 | 0.0587 | 0.0006 | 553 | 13 |
| LKZ-1-26 | 0.0941 | 0.0013 | 579.9 | 7.5 | 0.0587 | 0.0007 | 563 | 14 |
| LKZ-1-27 | 0.0941 | 0.0013 | 579.3 | 7.7 | 0.0586 | 0.0005 | 552 | 12 |
| LKZ-1-28 | 0.0939 | 0.0015 | 578.5 | 9.0 | 0.0583 | 0.0006 | 544 | 14 |
| LKZ-1-29 | 0.0938 | 0.0015 | 577.6 | 8.9 | 0.0583 | 0.0006 | 541 | 12 |
| LKZ-1-30 | 0.0941 | 0.0014 | 579.9 | 8.1 | 0.0588 | 0.0007 | 547 | 14 |
| No. | Weight (mg) | U (ppm) | Th/U | Pbc (pg) | 206Pb/204Pb | 207Pb/235U | 2σ | 206Pb/238U | 2σ | Error Corr. |
| sk40p10 | 0.151 | 464 | 0.149 | 1.4 | 292650 | 0.7524 | 0.0026 | 0.09216 | 0.00029 | 0.976 |
| sk40p11 | 0.165 | 494 | 0.147 | 2.0 | 238760 | 0.7571 | 0.0019 | 0.09273 | 0.00020 | 0.959 |
| sk40p12 | 0.101 | 818 | 0.147 | 4.7 | 104445 | 0.7583 | 0.0049 | 0.09286 | 0.00057 | 0.935 |
| sk40p42 | 0.060 | 183 | 0.150 | 0.5 | 118809 | 0.7540 | 0.0018 | 0.09232 | 0.00017 | 0.925 |
| No. | 207Pb/206Pb | 2σ | 206Pb/238U Age (Ma) | 2σ | 207Pb/235U Age (Ma) | 2σ | 207Pb/206Pb Age (Ma) | 2σ | Disc. % | |
| sk40p10 | 0.059212 | 0.000046 | 568.31 | 1.74 | 569.63 | 1.51 | 574.90 | 1.67 | 1.2 | |
| sk40p11 | 0.059218 | 0.000045 | 571.64 | 1.17 | 572.34 | 1.10 | 575.13 | 1.66 | 0.6 | |
| sk40p12 | 0.059224 | 0.000136 | 572.43 | 3.35 | 573.02 | 2.84 | 575.34 | 5.00 | 0.5 | |
| sk40p42 | 0.059237 | 0.000056 | 569.23 | 1.00 | 570.55 | 1.01 | 575.81 | 2.04 | 1.2 |
| Spot No. | δ18OV-SMOW (‰) | 2SE | Spot No. | δ18OV-SMOW (‰) | 2SE |
|---|---|---|---|---|---|
| LKZ-1@1 | 10.58 | 0.18 | LKZ-1@11 | 10.77 | 0.19 |
| LKZ-1@2 | 10.79 | 0.28 | LKZ-1@12 | 10.88 | 0.22 |
| LKZ-1@3 | 10.52 | 0.25 | LKZ-1@13 | 10.48 | 0.21 |
| LKZ-1@4 | 10.37 | 0.34 | LKZ-1@14 | 10.68 | 0.12 |
| LKZ-1@5 | 10.59 | 0.43 | LKZ-1@15 | 10.63 | 0.29 |
| LKZ-1@6 | 10.60 | 0.33 | LKZ-1@16 | 10.62 | 0.28 |
| LKZ-1@7 | 10.96 | 0.28 | LKZ-1@17 | 10.54 | 0.23 |
| LKZ-1@8 | 10.60 | 0.45 | LKZ-1@18 | 10.81 | 0.31 |
| LKZ-1@9 | 10.56 | 0.32 | LKZ-1@19 | 10.74 | 0.17 |
| LKZ-1@10 | 10.69 | 0.23 | LKZ-1@20 | 10.56 | 0.31 |
| Average | 10.65 | ||||
| SD | 0.14 |
| Spot No. | 176Hf/177Hf | 2SE (ppm) | 178Hf/177Hf | 2SE (ppm) | 176Lu/177Hf | 2SE (%) | 176Yb/177Hf | 2SE (%) | εHf(0) | εHf(t) |
|---|---|---|---|---|---|---|---|---|---|---|
| LKZ-1 | 0.281788 | 92 | 1.467234 | 45 | 0.000104 | 0.13 | 0.00394 | 0.64 | −34.8 | −22.3 |
| LKZ-2 | 0.281816 | 89 | 1.467252 | 53 | 0.000104 | 0.12 | 0.00392 | 0.61 | −33.8 | −21.3 |
| LKZ-3 | 0.281776 | 96 | 1.467270 | 75 | 0.000102 | 0.14 | 0.00388 | 0.62 | −35.2 | −22.7 |
| LKZ-4 | 0.281805 | 82 | 1.467186 | 57 | 0.000104 | 0.13 | 0.00394 | 0.56 | −34.2 | −21.7 |
| LKZ-5 | 0.281808 | 85 | 1.467226 | 48 | 0.000104 | 0.12 | 0.00395 | 0.63 | −34.1 | −21.6 |
| LKZ-6 | 0.281800 | 85 | 1.467237 | 42 | 0.000104 | 0.12 | 0.00393 | 0.61 | −34.4 | −21.8 |
| LKZ-7 | 0.281803 | 92 | 1.467215 | 51 | 0.000103 | 0.13 | 0.00393 | 0.64 | −34.3 | −21.7 |
| LKZ-8 | 0.281785 | 89 | 1.467261 | 50 | 0.000104 | 0.13 | 0.00392 | 0.61 | −34.9 | −22.4 |
| LKZ-9 | 0.281777 | 92 | 1.467226 | 58 | 0.000104 | 0.13 | 0.00393 | 0.61 | −35.2 | −22.6 |
| LKZ-10 | 0.281779 | 82 | 1.467236 | 55 | 0.000104 | 0.14 | 0.00393 | 0.54 | −35.1 | −22.6 |
| LKZ-11 | 0.281789 | 92 | 1.467268 | 55 | 0.000103 | 0.16 | 0.00376 | 0.48 | −34.8 | −22.2 |
| LKZ-12 | 0.281796 | 96 | 1.467236 | 57 | 0.000106 | 0.17 | 0.00393 | 0.46 | −34.5 | −22.0 |
| LKZ-13 | 0.281797 | 92 | 1.467261 | 61 | 0.000103 | 0.16 | 0.00379 | 0.45 | −34.5 | −21.9 |
| LKZ-14 | 0.281805 | 96 | 1.467233 | 51 | 0.000106 | 0.18 | 0.00397 | 0.53 | −34.2 | −21.7 |
| LKZ-15 | 0.281792 | 96 | 1.467264 | 65 | 0.000103 | 0.15 | 0.00383 | 0.47 | −34.7 | −22.1 |
| LKZ-16 | 0.281815 | 85 | 1.467229 | 44 | 0.000103 | 0.14 | 0.00391 | 0.59 | −33.8 | −21.3 |
| LKZ-17 | 0.281807 | 82 | 1.467233 | 51 | 0.000104 | 0.12 | 0.00392 | 0.54 | −34.1 | −21.6 |
| LKZ-18 | 0.281790 | 89 | 1.467161 | 59 | 0.000104 | 0.14 | 0.00397 | 0.55 | −34.7 | −22.2 |
| LKZ-19 | 0.281793 | 89 | 1.467256 | 57 | 0.000103 | 0.13 | 0.00392 | 0.61 | −34.6 | −22.1 |
| LKZ-20 | 0.281811 | 85 | 1.467302 | 62 | 0.000104 | 0.14 | 0.00394 | 0.58 | −34.0 | −21.4 |
| LKZ-21 | 0.281805 | 99 | 1.467251 | 50 | 0.000102 | 0.17 | 0.00377 | 0.50 | −34.2 | −21.7 |
| LKZ-22 | 0.281773 | 89 | 1.467230 | 52 | 0.000103 | 0.15 | 0.00381 | 0.47 | −35.3 | −22.8 |
| LKZ-23 | 0.281792 | 89 | 1.467250 | 52 | 0.000102 | 0.16 | 0.00381 | 0.55 | −34.7 | −22.1 |
| LKZ-24 | 0.281772 | 99 | 1.467269 | 55 | 0.000102 | 0.16 | 0.00377 | 0.53 | −35.4 | −22.8 |
| LKZ-25 | 0.281779 | 85 | 1.467225 | 52 | 0.000102 | 0.15 | 0.00385 | 0.65 | −35.1 | −22.6 |
| LKZ-26 | 0.281775 | 106 | 1.467352 | 44 | 0.000105 | 0.21 | 0.00310 | 0.52 | −35.3 | −22.7 |
| LKZ-27 | 0.281756 | 99 | 1.467289 | 42 | 0.000107 | 0.20 | 0.00320 | 0.50 | −35.9 | −23.4 |
| LKZ-28 | 0.281805 | 92 | 1.467365 | 39 | 0.000104 | 0.19 | 0.00318 | 0.47 | −34.2 | −21.7 |
| LKZ-29 | 0.281795 | 103 | 1.467350 | 44 | 0.000104 | 0.19 | 0.00320 | 0.50 | −34.6 | −22.0 |
| LKZ-30 | 0.281825 | 103 | 1.467347 | 44 | 0.000104 | 0.19 | 0.00323 | 0.50 | −33.5 | −21.0 |
| LKZ-31 | 0.281798 | 117 | 1.467337 | 48 | 0.000104 | 0.21 | 0.00318 | 0.53 | −34.4 | −21.9 |
| LKZ-32 | 0.281787 | 103 | 1.467351 | 44 | 0.000103 | 0.20 | 0.00318 | 0.53 | −34.8 | −22.3 |
| LKZ-33 | 0.281787 | 103 | 1.467360 | 42 | 0.000105 | 0.19 | 0.00324 | 0.49 | −34.8 | −22.3 |
| LKZ-34 | 0.281787 | 110 | 1.467324 | 46 | 0.000101 | 0.23 | 0.00307 | 0.59 | −34.8 | -22.3 |
| LKZ-35 | 0.281791 | 106 | 1.467343 | 40 | 0.000105 | 0.21 | 0.00321 | 0.56 | −34.7 | −22.2 |
| LKZ-36 | 0.281793 | 103 | 1.467316 | 44 | 0.000103 | 0.23 | 0.00318 | 0.57 | −34.6 | −22.1 |
| LKZ-37 | 0.281815 | 106 | 1.467329 | 41 | 0.000104 | 0.23 | 0.00321 | 0.56 | −33.8 | −21.3 |
| LKZ-38 | 0.281805 | 103 | 1.467327 | 42 | 0.000108 | 0.24 | 0.00334 | 0.54 | −34.2 | −21.7 |
| LKZ-39 | 0.281821 | 96 | 1.467361 | 42 | 0.000106 | 0.21 | 0.00328 | 0.55 | −33.6 | −21.1 |
| LKZ-40 | 0.281799 | 131 | 1.467363 | 40 | 0.000106 | 0.21 | 0.00328 | 0.61 | −34.4 | −21.9 |
| LKZ-41 | 0.281838 | 106 | 1.467339 | 36 | 0.000105 | 0.20 | 0.00327 | 0.55 | −33.0 | −20.5 |
| LKZ-42 | 0.281789 | 117 | 1.467322 | 42 | 0.000103 | 0.23 | 0.00315 | 0.60 | −34.8 | −22.2 |
| LKZ-43 | 0.281771 | 114 | 1.467375 | 40 | 0.000101 | 0.26 | 0.00311 | 0.64 | −35.4 | −22.9 |
| LKZ-44 | 0.281777 | 124 | 1.467349 | 36 | 0.000104 | 0.23 | 0.00320 | 0.63 | −35.2 | −22.7 |
| LKZ-45 | 0.281785 | 131 | 1.467365 | 41 | 0.000101 | 0.21 | 0.00315 | 0.64 | −34.9 | −22.4 |
| Average | 0.281794 | 1.467286 | 0.000104 | 0.00358 | −34.6 | −22.0 | ||||
| SD | 0.000016 | 0.000057 | 0.000001 | 0.00035 | 0.6 | 0.6 |
| 91500 | LKZ-1 | ||||||||||||||||
|---|---|---|---|---|---|---|---|---|---|---|---|---|---|---|---|---|---|
| [15,47] | [49] | [50] | [51] | This Study | SD (n = 37) | This Study | SD (n = 28) | ||||||||||
| P | 35 | ± | 17 | 14 | 7 | 17 | 8 | ||||||||||
| Ca | 102 | 66 | 68 | 50 | |||||||||||||
| Y | 153 | ± | 14 | 147 | ± | 22 | 148 | 36 | 86 | 6 | |||||||
| La | 0.013 | ± | 0.01 | <0.08 | ± | 0.05 | 0.014 | ± | 0.011 | 0.031 | ± | 0.038 | 0.013 | 0.025 | 0.003 | 0.002 | |
| Ce | 2.56 | ± | 0.20 | 2.5 | ± | 0.5 | 2.59 | ± | 0.43 | 2.77 | ± | 0.41 | 2.19 | 0.34 | 0.84 | 0.08 | |
| Pr | 0.020 | ± | 0.01 | <0.05 | ± | 0.05 | 0.035 | ± | 0.015 | 0.022 | ± | 0.021 | 0.019 | 0.027 | 0.015 | 0.012 | |
| Nd | 0.25 | ± | 0.01 | <0.35 | ± | 0.07 | 0.295 | ± | 0.064 | 0.324 | ± | 0.085 | 0.25 | 0.14 | 0.15 | 0.05 | |
| Sm | 0.38 | ± | 0.03 | 0.41 | ± | 0.2 | 0.278 | ± | 0.084 | 0.624 | ± | 0.246 | 0.52 | 0.24 | 0.29 | 0.08 | |
| Eu | 0.19 | ± | 0.02 | 0.37 | ± | 0.17 | 0.191 | ± | 0.065 | 0.310 | ± | 0.112 | 0.26 | 0.11 | 0.09 | 0.03 | |
| Gd | 1.76 | ± | 0.39 | 2.1 | ± | 0.35 | 1.60 | ± | 0.39 | 2.719 | ± | 0.658 | 2.50 | 0.90 | 1.53 | 0.17 | |
| Tb | 0.78 | ± | 0.12 | 0.75 | ± | 0.20 | 1.11 | ± | 0.25 | 0.94 | 0.31 | 0.61 | 0.06 | ||||
| Dy | 10.3 | ± | 0.9 | 12 | ± | 2.1 | 12.3 | ± | 2.5 | 14.2 | ± | 2.5 | 11.8 | 3.4 | 7.3 | 0.6 | |
| Ho | 4.60 | ± | 0.46 | 4.9 | ± | 0.7 | 5.1 | ± | 1.4 | 5.83 | ± | 0.90 | 4.92 | 1.37 | 2.93 | 0.26 | |
| Er | 23.7 | ± | 2.6 | 26 | ± | 3.6 | 28.6 | ± | 6.2 | 28.2 | ± | 4.6 | 27.1 | 7.0 | 15.3 | 1.2 | |
| Tm | 5.95 | ± | 0.71 | 7.5 | ± | 1.8 | 8.44 | ± | 1.27 | 6.81 | 1.63 | 3.44 | 0.32 | ||||
| Yb | 60.1 | ± | 8.4 | 66 | ± | 7.3 | 77 | ± | 18 | 101 | ± | 16 | 69 | 17 | 32 | 3 | |
| Lu | 14.1 | ± | 1.7 | 14 | ± | 1.9 | 17.1 | ± | 3.8 | 13.9 | ± | 2.0 | 13.8 | 3.1 | 5.9 | 0.5 | |
| Hf | 5895 | 6400 | ± | 900 | 5780 | 340 | 7740 | 310 | |||||||||
| Th | 28.61 | ± | 0.07 | 31 | ± | 4.9 | 30 | 6 | 94 | 6 | |||||||
| U | 81.2 | 88 | ± | 15 | 83 | 14 | 654 | 31 | |||||||||
© 2019 by the authors. Licensee MDPI, Basel, Switzerland. This article is an open access article distributed under the terms and conditions of the Creative Commons Attribution (CC BY) license (http://creativecommons.org/licenses/by/4.0/).
Share and Cite
Cheong, A.C.-s.; Jeong, Y.-J.; Lee, S.; Yi, K.; Jo, H.J.; Lee, H.-S.; Park, C.; Kim, N.K.; Li, X.-H.; Kamo, S.L. LKZ-1: A New Zircon Working Standard for the In Situ Determination of U–Pb Age, O–Hf Isotopes, and Trace Element Composition. Minerals 2019, 9, 325. https://doi.org/10.3390/min9050325
Cheong AC-s, Jeong Y-J, Lee S, Yi K, Jo HJ, Lee H-S, Park C, Kim NK, Li X-H, Kamo SL. LKZ-1: A New Zircon Working Standard for the In Situ Determination of U–Pb Age, O–Hf Isotopes, and Trace Element Composition. Minerals. 2019; 9(5):325. https://doi.org/10.3390/min9050325
Chicago/Turabian StyleCheong, Albert Chang-sik, Youn-Joong Jeong, Shinae Lee, Keewook Yi, Hui Je Jo, Ho-Sun Lee, Changkun Park, Nak Kyu Kim, Xian-Hua Li, and Sandra L. Kamo. 2019. "LKZ-1: A New Zircon Working Standard for the In Situ Determination of U–Pb Age, O–Hf Isotopes, and Trace Element Composition" Minerals 9, no. 5: 325. https://doi.org/10.3390/min9050325