Article

Heat-Assisted Batch Settling of Mineral Suspensions in Inclined Containers

1
Laboratory for Rheology and Fluid Dynamics, Department of Mining Engineering, Universidad de Chile, Beauchef 850, 8370448 Santiago, Chile
2
Advanced Mining Technology Center, Universidad de Chile, Tupper 2007, 8370451 Santiago, Chile
3
Department of Mechanical Engineering, Universidad de Antofagasta, Av. Angamos 601, 1240000 Antofagasta, Chile
4
Departamento de Ingeniería Química y Procesos de Minerales, Universidad de Antofagasta, Av. Angamos 601, 1240000 Antofagasta, Chile
*
Author to whom correspondence should be addressed.
Minerals 2019, 9(4), 228; https://doi.org/10.3390/min9040228
Submission received: 2 February 2019 / Revised: 22 March 2019 / Accepted: 4 April 2019 / Published: 12 April 2019

Abstract

:
In mineral processing, the common requirement for progressively finer milling due to the decreasing of ore grades implies the need for more challenging water recovery conditions in thickeners. Several mining operations exist in arid areas, where water recovery becomes critical. The present paper explores the process of particle separation in batch inclined settlers where the downward facing wall is subject to heating. To this purpose, two-dimensional numerical simulations using a mixture model have been run for a number of combinations of temperature jumps at the downward facing fall, particle diameters, and concentrations. Results show that, for particle sizes on the order of 10 µm, heating has a significant effect on the particle settling velocity at the bottom, but it also promotes particle resuspension, affecting the particle concentration at the supernatant layer. The initial concentration also affects settling: for the concentration range tested (8%–15% by volume), when re-normalized by the average concentration, particle accumulation rates at the bottom were found to be lower for higher average concentrations, thus suggesting that the separation process is more efficient at lower concentrations.

1. Introduction

Solid-liquid separation in mining operations is a critical unit operation occurring in commonly adverse conditions such as water scarcity, energy cost [1,2,3], or a naturally fine particle size range [4,5,6]. While there are several means to recycle water, including centrifugal separation and filtration [7], due to its considerably low cost per recovered m 3 water, gravity settling [8] is still the most commonly-used technique in the sector. Among this type of technology are lamellar settlers, which are a type of process equipment consisting of a vessel fitted with a set of parallel inclined plates immersed in a slurry vessel. Differently from other industries such as water treatment, this kind of equipment has been historically scarcely used in the mining sector, possibly because their capacity to separate fine solids at small particle loadings was not such an important requirement in the past; this has changed significantly in recent years due to the progressively decreasing particle sizes in comminution products. In the present paper, this working principle is explored, for the first time, in combination with the use of heat, considerably abundant from natural sources in arid areas, to further enhance the particle settling process. To this purpose, a set of two-dimensional numerical simulations for the case of batch settling within a single convection cell consisting of two parallel inclined plates is presented and analyzed. The present paper uses a two-phase CFD model using the OpenFOAM library [9], adapted for the purposes of this problem.
Lamellar equipment [10] uses the Boycott effect [11] either to enhance the settling process in comparison with upright settlers such as conventional thickeners and clarifiers or to separate fine from coarse particles in a slurry [12]. In batch settling, as the suspension flows within the inclined plates, particle settling near the upward facing wall induces the upward flux of a thin, clear liquid below the downward facing wall. As a result, the velocity of the horizontal boundary between the suspension and the clear fluid region resulting from the existence of a settling process is considerably larger than the particle settling velocity. Indeed, when the plate spacing is small—and thus the suspension height-to-plate spacing, H / b , is large—then d H / d t v 0 H / b , where v 0 is the vertical settling velocity of a particle subject or not to hindrance effects due to the concentration [13].
The same arid environment that challenges water supply in several mining operations can offer, in exchange, very generous solar radiation conditions. The potential for solar energy harvesting in arid countries is significant, and governments have already started to put incentives and goals toward the use of these energy sources [14,15]. In the absence of particles, a heated vertical plate induces an upward vertical flow, whose characteristics will depend on the relative importance of inertial heat advection and diffusion (given by the Grashof number) and the relative thicknesses of the momentum and the heat boundary layer (Prandtl number, both described in [16]). When laminar flow is present, natural convection below a downward facing boundary has been found to share features with its vertical plate counterpart [16], except by the projection of the gravity term along the angle of the plate [17]. The paper is organized as follows: Section 2 describes the governing equations used in the numerical approach; Section 3 indicates the specific cases to be analyzed, recalling the present focus on fine fraction recovery from process water; Section 4 presents results and a discussion of them, and final remarks are given in Section 5.

2. Governing Equations

We consider an initially homogeneous, solid-liquid suspension confined in an inclined, slender batch container of overall height h (Figure 1). According to this figure, the plate spacing is b = W cos θ , where θ is the cell angle measured with respect to the vertical. The length of the plates is h / cos θ .
This configuration mimics the batch operation mode of lamella settlers, where normally the upper and lower plates are closely spaced (a few centimeters’ distance, as reviewed by Leung and Probstein [10]). This configuration promotes an accelerated settling of particles, which implies an upward flow near the downward-facing top plate when compared to the case of particle settling in an upright settler.
The suspension is modeled as a two-dimensional continuum with solid velocity, density and volume fraction fields u s , ρ s , and ϕ s , respectively, superimposed on the liquid with velocity ( u l ), density ρ l , and volume fraction ϕ l = 1 ϕ s , with the initial average concentration ϕ s ( x , t = 0 ) = ϕ 0 , a constant value.
The mass transport equation for the solid phase is:
( ϕ s ρ s ) t + · ( ϕ s ρ s u s ) = 0 ,
while the liquid phase transport equation is given by:
( ϕ s ρ l ) t + · [ ( 1 ϕ s ) ρ l u l ] = 0 .
From Equations (1) and (2), it is concluded that the mean velocity, defined as u = ϕ s u s + ( 1 ϕ s ) u l , verifies · u = 0 .
The momentum conservation equations are computed in standard form as [18,19]:
( ϕ i ρ i u i ) t + · ( ϕ i ρ i u i u i ) + · ( ϕ i τ i ) = ϕ i p + · ( ϕ i p s , i ) + ϕ i ρ i g + f i ,
where the sub-index i stands for solid s or liquid l. The pressure is assumed common to both phases. An additional solid pressure contribution p s ϕ s , which sharply increases around the maximum packing fraction ϕ m a x , is added on the momentum equation for the solid in order to bound the volume fraction of solid ϕ s below ϕ max . This extra pressure term in the liquid equation is zero p s , l = 0 . The liquid density or water density was calculated as a function of temperature only, from Maidment et al. [20]:
ρ l ( T ) = 1000 × 1 ( T + 288.9414 ) 508929.2 ( T + 68.12963 ) ( T 3.9863 ) 2 ,
where T has units of degrees Celsius.
The shear stress tensor for each phase is given by [21]:
τ i = μ i u i + ( u i ) T 2 2 3 ( · u i ) I ,
where the effective viscosity of the solid μ s is obtained from the expression for the slurry:
μ mix = ϕ s μ s + ϕ l μ l = μ l ( 1 + ϕ s ϕ max ) [ η ] ϕ max ,
with μ l the temperature-dependent dynamic viscosity of the liquid phase (in this case, water) by [22]:
μ ( T ) = 2.414 × 10 5 × 10 247.8 T 140 ,
where T has units of Kelvin. It is noted that this mixture model can alternatively be extended using formulations suitable for dilute-granular regimes [23,24]. However, considering the mostly low concentrations in the present domain, the model represented by Equation (6) is a reasonable approximation of most of the mixture behavior.
The temperature field was calculated by an advection-diffusion equation:
( ϕ l ρ l T l ) t + · ( ϕ l ρ l T l u l ) = α 2 ( ϕ l ρ l T l ) .
In this equation, the thermal diffusivity of the liquid phase, α , has a fixed value of 1.43 × 10 7   m 2 s 1 , corresponding to ambient conditions ( 25   ° C ). Particles are dilute enough to assume that their thermal inertia is negligibly small when compared to water mass, and thus, the water phase temperature remains unaffected by a difference in particle temperature. On the other hand, it is assumed that particles are small enough to quickly reach the temperature of the liquid phase. This is seen noting that the heat diffuses within each particle with a time scale τ p such as τ p d s 2 / α s , where d s and α s are the particle diameter and thermal diffusivity, respectively. On the other hand, in a purely convective flow ( ϕ = 0 ), from dimensional arguments, a convective velocity scale can be estimated as v c g sin θ β Δ T b , where g, β , and Δ T are the acceleration due to gravity, water thermal expansion coefficient, and temperature jump, respectively. Comparing the time scale required for the thermally-diffusive flow to span the particle diameter with the time scale required to offset a particle of its own size due to convection (in the absence of a drag force), τ c = d p / v c , yields the dimensionless ratio τ p / τ c = d p α s g sin θ β Δ T b . Assuming d s 10   μ m (typical of fine particle content), Δ T 10   K , α s × 10 6   m 2 / s [25], β × 10 4   K 1 [26], and b between 1 cm and 10 cm yields values of τ p × 10 4   s and the ratio τ p / τ c between about 1 / 3 and 1 / 10 , which implies that in the slowest particle heating scenario, the time required for particle heating to reach the surrounding temperature is that required to displace one particle diameter. Therefore, it is assumed herein that T s ( x , t ) = T l ( x , t ) . Although this hypothesis is debatable at high particle concentrations (i.e., near the bottom boundary) due to the high mass of particles and a near-stagnant condition, the particle separation process occurs in dilute conditions near the downward facing wall. Although experimental evidence shows that there is a wide applicability of the mixture model even at high concentrations [18], the very weak flow conditions occurring near the bottom may have significant uncertainty, not only due to the thermal coupling between phases, but also due to the high viscosity values and particle contacts in the sediment zone, which are not modeled in detail herein.
The volumetric forces between phases, denoted by the last term of the right-hand side of Equation (3), are given by f i = f D + f L + f WL , where f D is the drag force, f L is the lift force, and f WL is the wall lubrication force (see [19] and the references therein, except that in that work, there was a turbulent dispersion force that here is null because the flow is laminar). Here, f i = f s = f l is the force per unit volume the fluid applies on the solid. The computational implementation used in the present problem is, as in the previous reference, based on the OpenFOAM library.

3. Simulation Cases and Boundary Conditions

The Boycott effect implies the formation of a momentum boundary layer near the downward facing wall, creating a greater suspension-supernatant boundary velocity than if the tube was vertical [13]. In a monodisperse suspension of spheres, the separation efficiency in the absence of heating the downward facing wall is conditioned by the container height, H 0 , along with ρ s , ϕ s , ρ l , μ mix ( ϕ s ) , g, and d s . Table 1 shows the geometry of various cases considered to analyze the combined effect of heating and particle settling within the cell.
Kinematic boundary conditions at the walls are no slip, without particle flow through them. This implies a zero particle gradient boundary condition at the walls. In the particular case of the top (horizontal) boundary, it was necessary to define a thin layer without particles near the top, thus ensuring numerical stability at the early stages of the flow development. Initially, the temperature at the walls and in the bulk of the (also homogeneous) suspension was T 0 = 20   ° C . Numerical experiments started from this condition, imposing a temperature jump at the downward facing wall, referred to as Δ T DFW in Table 1, such that at this boundary, T DFW = T 0 + Δ T DFW . The total number of cells considered for the present computation was 67,000 for a width equal to 5 c m , corresponding to a physical element size of 0.8 mm and 1 m m in the horizontal and vertical direction, respectively.

4. Results and Discussion

Figure 2 shows an example of the flow and particle progression in the cell, for the case Δ T DFW = 30   ° C , ϕ 0 = 0.05 , and d s = 10   μ m . The Boycott effect induces particle accumulation at the upward facing wall, which transport them towards the bottom. In this case, the particle settling process is enhanced by heating at the downward facing wall, which, besides, accelerating it, as will be discussed below, tends to create some degree of additional resuspension near the top, as seen by the low, but nonzero particle concentration near the top for t = 800   s and 1600 s in Figure 2a. On the other hand, heating also introduces flow variations in the line parallel to the plates. This is observed especially for t = 200   s and t = 1600   s in Figure 2b. In the former case, near Y = 0.3   m , there is an intense vorticity zone that tends to accelerate particle migration towards the upward facing wall. For the latter time, it is seen that vorticity is concentrated near the zone between Y = 0.3   m and Y = 0.4   m , affecting resuspension. This complex and asymmetrical dynamics impedes relying solely on a simplified Boycott effect interpretation to predict particle segregation within the cell.
Results have been analyzed in terms of the relative impact of the key variables shown in Table 1, in light of the distribution of particles within the cell. This will be seen directly from concentration maps or spatiotemporal diagrams in the present section. Additionally, data were interpreted in terms of the particle presence in specific areas of the cell, as depicted in Figure 3. Here, A1 denotes an initial concentration-dependent settling area at the bottom, A2 a fixed one at the top, and A3 a fixed one near the upward facing wall. In the former case, the height of A1 was assumed as that corresponding to the accumulation of particles at the bottom. To enable comparison of results between different experiments, the sediment accumulation length in the upright case, Y = ϕ 0 H 0 cos θ ϕ max , was considered as a reference length scale. The purpose of the area A2 was to assess particle resuspension due to convection within the cell and was defined by the horizontal planes bound by Y z = 0.86 H 0 and H 0 .
The area A3 was defined as Y sed δ / cos θ , with δ = 5   m m and Y sed ( t ) the vertical projection of the length of the solid bed accumulated near the upward facing wall. In narrow tilted containers, Y sed can have two connotations: one is to define the boundary between the supernatant region, where below such a boundary, there is a suspension roughly homogeneously distributed in the horizontal direction; the second possibility is that Y sed denotes a narrow area near the upward facing wall (as we consider herein through A3), where particles are concentrated. Herbolzheimer and Acrivos [27] have identified, in the absence of heating, that these two modes of convection are defined by the particle Reynolds number, the geometry, and the dimensionless number Λ = H 0 2 g ( ρ s ρ l ) ϕ 0 / w 0 μ mix [13,28], where w 0 corresponds to the Stokes settling velocity of a particle, corrected by hindrance effects. As in the latter references, here, Λ 1 , implying that the convective process occurs in an enclosure where the vertical flow path is considerably higher than the characteristic particle size, a common assumption in lamellar settlers.

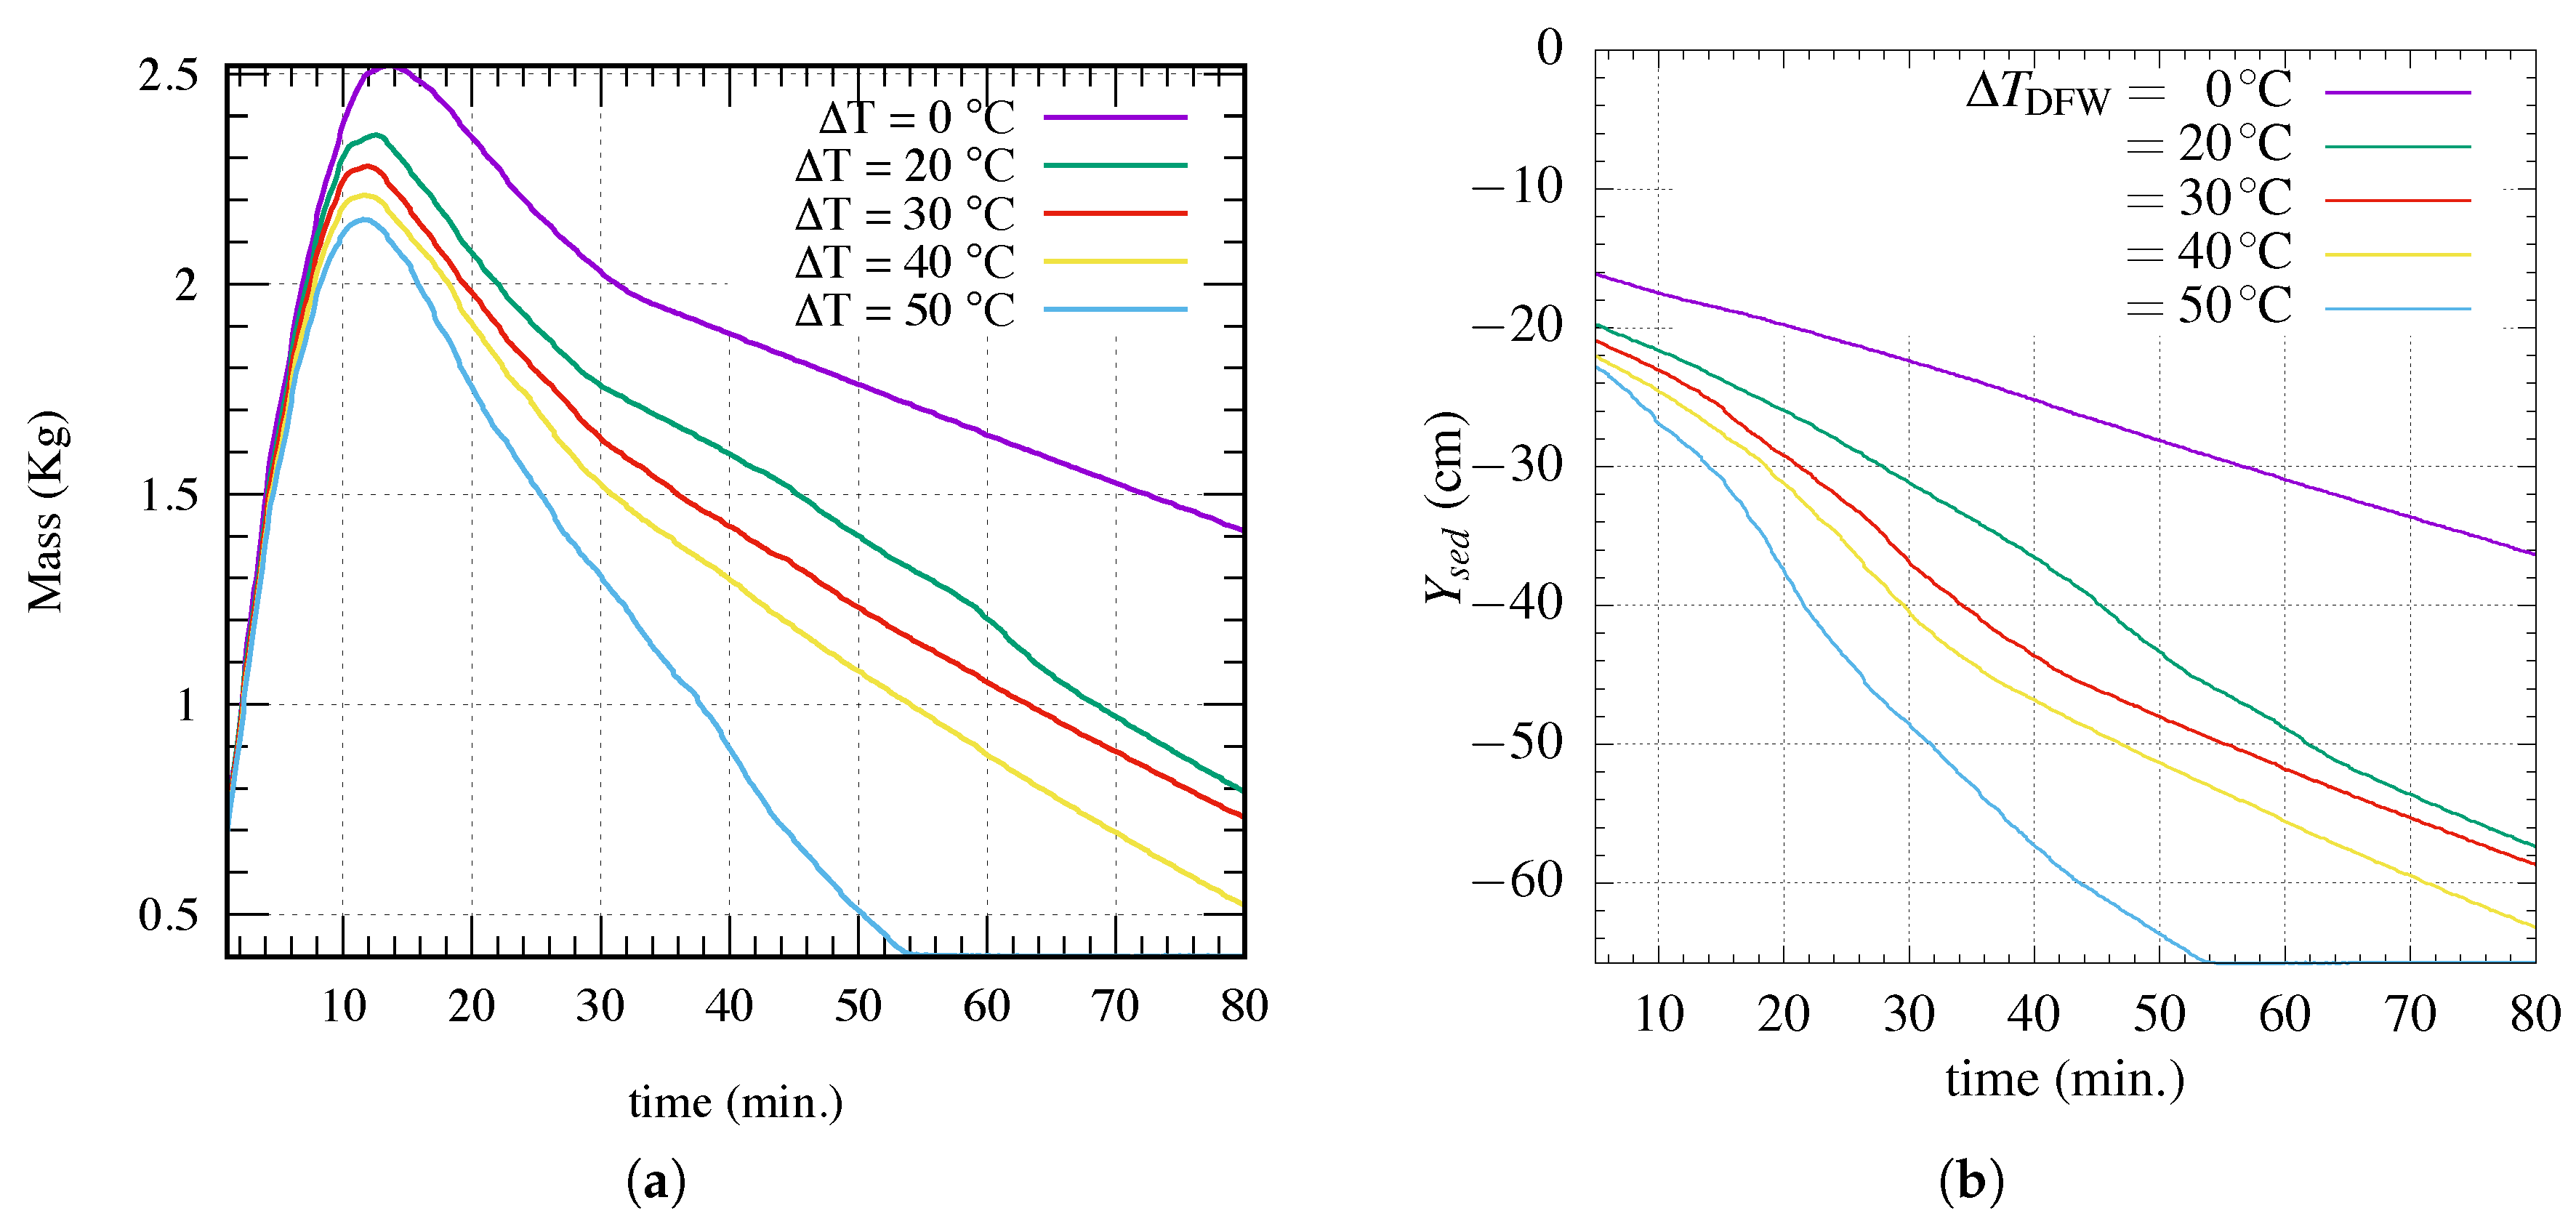
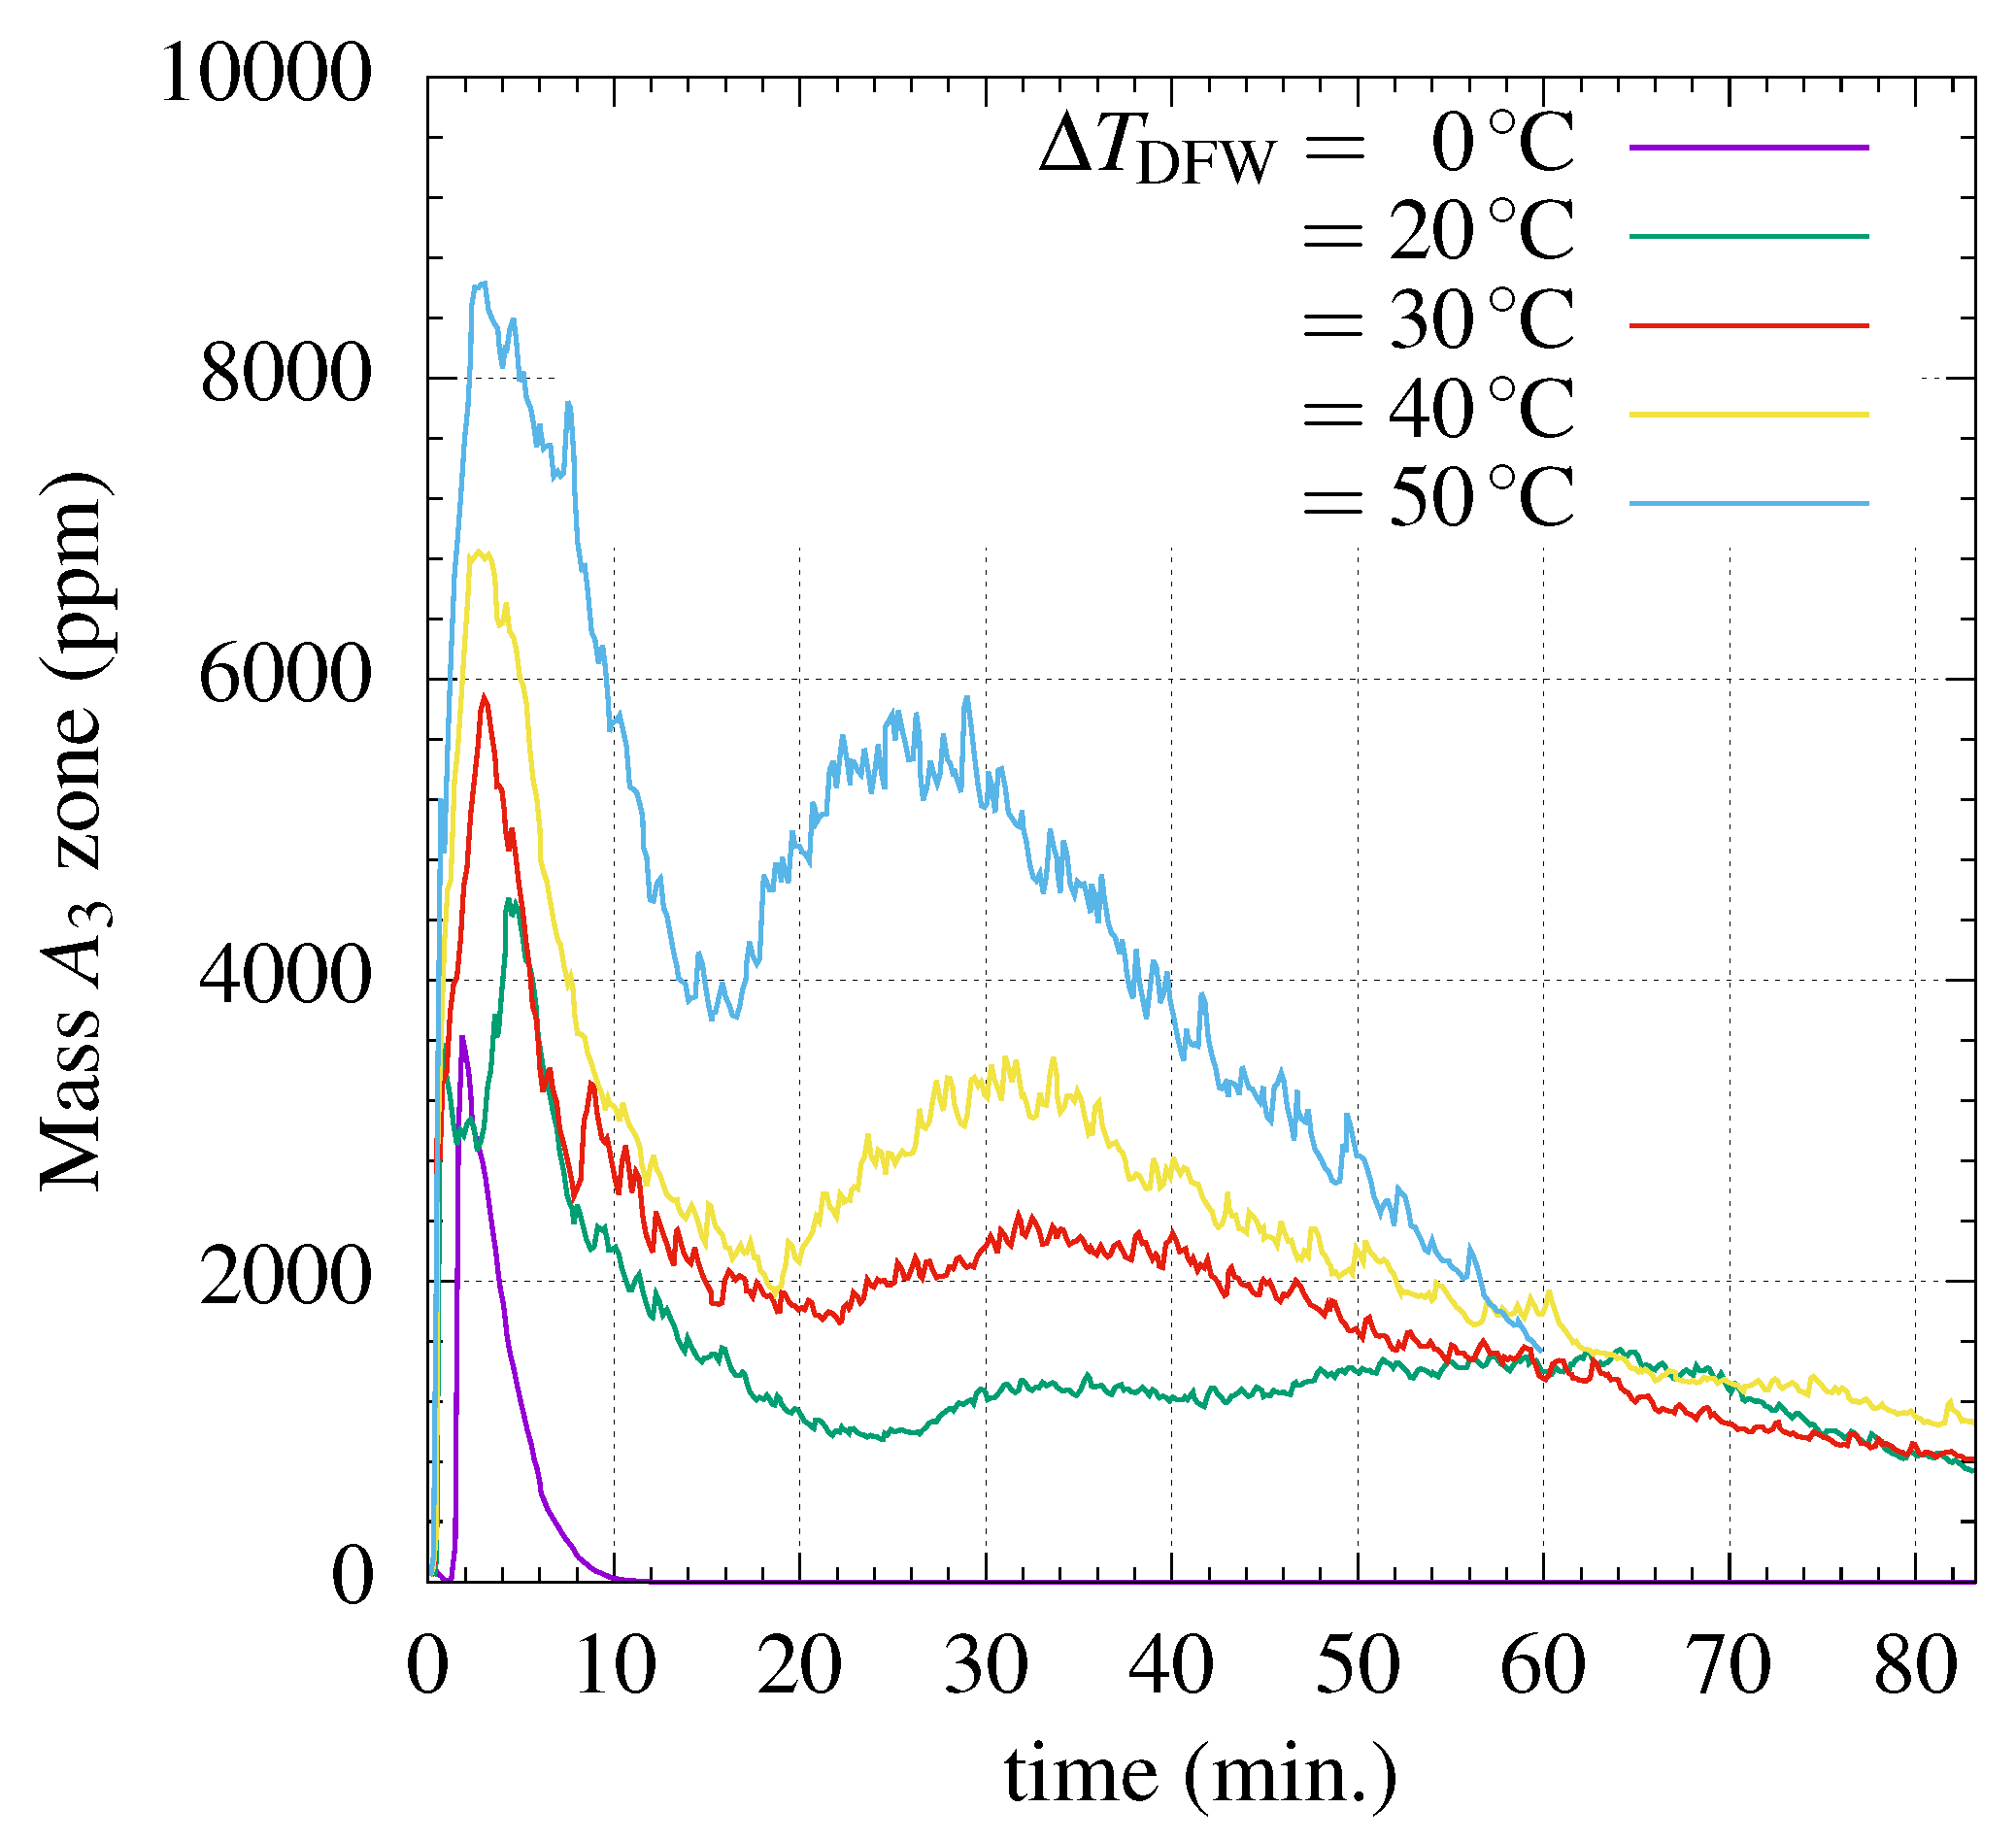
4.1. Effect of Temperature

The effect of temperature was analyzed for a particle size where both the Boycott effect and natural convection are relevant. This is an intermediate situation between two opposites: one where particles are so coarse that only the Boycott effect (if any) exerts an influence on the separation process and a second instance where particles are so fine that the time scale for separation is too large, and therefore, the suspension behaves essentially as a homogeneous medium. It is thus convenient to use a fixed particle size to isolate the effect of temperature. In particular, a value of d s = 10   μ m is considered throughout this section. Additionally, to put the present problem into a suitable context for mineral particle separation, an analysis based on particle size is given in Section 4.2.
The effect of temperature on the settling dynamics can be seen looking at the average horizontal concentration as a function of the vertical coordinate. Figure 4 represents the spatiotemporal evolution of the suspension in the base case for Δ T DFW = 0 ° C , 20 ° C , 30 ° C , and 50 ° C . The boundaries between colors represent average concentration isolines, which can be interpreted as the propagation velocity of constant concentration waves [8]. The dark zone near the bottom in the figure represents the sediment accumulation at the bottom of the cell, which has been previously characterized in terms of average values at A1. Particle resuspension near the top is denoted by the cyan-blue area near the top for times below about 20 min, where is it evident that this process is short term in comparison with the settling of the bulk of the suspension towards the bottom section. The orange zone near the left of each panel denotes the presence of a dense area close to the upward facing wall. Once the suspension migrated towards the bottom and left a specific height, the average concentration dropped to values on the order of 1% (yellow-green areas in the figure). Furthermore, a sharp transition between this (low) concentration and the virtually particle-free area corresponding to the supernatant (whose concentration has been expressed in previous figures herein in ppm) is denoted by the green-blue boundary.
The momentum boundary layer buildup at the downward facing wall when particle settling occurs enhanced when the latter was heated. This is not surprising as in the absence of particle settling, this process occurs as a direct consequence of natural convection, causing lighter fluid neighboring the downward facing wall (due to heating) to migrate towards the upper region. The impact of this heating enhancement on the filling process at the bottom is somewhat suggested in Figure 4a–d (brown zone), but is more evident from Figure 5, which shows the concurrent impact of the Boycott effect and heating of the downward facing wall for various values of Δ T DFW and d s = 10   μ m , where it is evident, from the degree of particle accumulation at A1, that heating the downward facing wall enhanced the accumulation at the bottom of the enclosure.
Figure 5 reveals two different trends on the rate of particle accumulation, depending on whether the size of the control volume is 0.6 Y or 0.9 Y . In both cases, there is a strong particle accumulation of the corresponding area; however, when considering a smaller control volume saturation when filling A1 occurs at relatively early values of time (close to 45 min for Δ T DFW = 0   ° C ) and on the order of 23 min when heating at the downward facing wall is set (Figure 5a). When considering a larger control area of A1 the initial stage of sedimentation, due to the settling of the suspension, is followed by the re-accommodation of the sediment placed at the upward facing wall. This naturally occurs at a lower rate due to the high concentration gravitational flow at this boundary. However, the effect of heating becomes significant with Δ T DFW = 50   ° C , where the second slope is close to the first (Figure 5b). It is suggested that this occurs due to the additional shear, induced by natural convection due to heating, at the surface of the sediment zone above the upward facing wall. This also is shown in Table 2, where the end of the settling process can be between ≈4% and 46% faster for Δ T DFW = 50   ° C heating given both control areas.
The particle accumulation sequence was confirmed by the observation of both the settled particle height at the upward facing wall and the corresponding mass therein (Figure 6). Figure 6a shows the particle mass confined within A3, where two stages of particle accumulation are observed: a growing mass phase (Figure 6a), where the confined mass per unit width at t = 0 is ϕ 0 A3 and increments as the combined thermal convection-Boycott effect pushes particles away the downward facing wall, towards the upward facing wall. This increasing mass near the upward facing wall reaches a limit, after which the part of the particle matter trapped in A3 is transferred horizontally to the part of A1 not included in A3. This mass transport process corresponds to a monotonic decrease of the dimensionless height of the dense thin layer that defines the length of A3, Y sed , whose progression ( | d Y sed / d t | ) is faster when Δ T DFW is higher. In particular, in light of the present simulations, compared to the base situation Δ T DFW = 0 , the cases Δ T DFW = 50   ° C and Δ T DFW = 40   ° C caused decreased rates of Y sed faster by about 50 % and 18 % , respectively. In this regard, the contribution of heating to the efficiency of the separation process is evident.
A second noticeable sign of the impact of heating at the downward facing wall is the departure from straight iso-concentration lines for Δ T DFW > 0 . While in Figure 4a ( Δ T DFW = 0 ), the mean suspension concentration neighboring the supernatant region (green-blue boundary) follows a straight line from early times, this is not so for Δ T DFW > 0 . This early time behavior can be leading-order explained using the PNK theory, which states that the supernatant velocity is proportional to the settling velocity, a constant in the present problem. Besides the observation of the suspension acceleration effect of heating, it is also seen that this cannot be interpreted as an equivalent higher settling velocity as there is no longer a single higher (constant) slope, but the influence of a more complex mechanism that couples particle settling with flow velocity with stronger drag on particles. This effect of heating can be seen in the yellow/blue and yellow green intersections for times between 5 min and 40 min in Figure 4b,c and for times between 5 min and 20 min in Figure 4d, the latter corresponding to the strongest heating.
The present results show that, besides that heating promotes an overall faster settling process, it causes an increase of particle resuspension. This trend is apparent from the light blue/green zones in Figure 4b–d, denoting increasing (but yet very low) concentrations near the top for higher heating rates. Figure 7 shows the mean particle concentration at zone A2 (near the top). Although for the various instances of Δ T DFW that were tested in simulations, a convergence was observed for simulation times in excess of 60 min, the transient behavior has been found to be significantly different. Higher temperature jumps at the downward facing wall tend to induce a stronger upward convective flow, pushing additional particles towards the top of the cell. This can also be seen in the spatiotemporal diagrams in Figure 4b–d, as a progressively lighter false color in the supernatant region in comparison with the base case with Δ T DFW = 0 (Figure 4a).
The convergence of mean concentration values in A2 shown in Figure 7 is explained by mass conservation. When particles reach the top of the enclosure, the same particle- and thermally-induced circulation that lifts the particles induces a downward motion that exerts a downward drag on the side near the upward facing wall, thus nudging particles away from the top.

4.2. Effect of Particle Diameter

The PNK model states that efficiency, defined as the vertical speed of the supernatant-suspension interface, is proportional to the settling velocity, the latter being proportional to d s 2 . It is therefore no surprise that higher particle sizes are related to faster settling speeds and thus to considerably smaller overall particle deposition times.
Figure 8 shows the impact on heating via the opposing cases of Δ T DFW = 0   ° C (left column) and 30 ° C (right column), for particle sizes on the order of those found in copper sulfide comminution processes, i.e., d s = 10   μ m , 50 μ m and 100 μ m, in Rows 1–3, respectively. It is firstly noted that within this particle range, the higher the particle size, the more involved is the particle distribution. This can be attributed to the development of flow instabilities that depend on a monotonically increasing function of the settling velocity, whose primary effect is to accelerate the overall settling process. Herbolzheimer [29] analyzed the onset of strong mixing using linear stability analysis to long wave disturbances and found that, to first order disturbances, the system becomes unstable depending on a function of the cell geometry and the dimensionless number Λ , suggesting that the onset of stability occurs at a critical channel distance measured from the base that, in particular, depends on d s 2 . The present combination of cell geometry, fluid, and particle characteristics shows that such instability occurs, in the presence of heating for some particle diameter between 10 μ m and 50 μ m, even for Δ T DFW = 0 (Figure 8c,d), but not for d s = 10   μ m (Figure 8a,b).
The spatiotemporal progressions in Figure 8 suggests that heating the downward facing wall causes the settling sequence to depart from being explained by the Boycott effect only. Although the whole process occurs considerably faster than in the smaller particle size, while in the case of d s = 10   μ m the particle input was smooth and occurred from the early stages of the settling process, as denoted by the contact line between the orange and the brown areas in Figure 8a,b, higher particle sizes are related to strong particle influxes to the bottom that proceed after a resuspension stage. This can be seen by the orange-red bands of Figure 8c–f, whose contact lines appear after a stage of smaller settling rate, denoted by the orange area near the beginning of the process. A comparison between Figure 8e,f denotes a slight retardation of the sediment bed formation due to heating, an aspect that can also be noticed by the presence of a second (reddish) high concentration characteristic above the main one, directed towards the bottom.
Besides the observation of a considerable enhancement of sediment base formation (noticeable by the time scale of Figure 8c–e in contrast to Figure 8a,b), the effect of heating is to enhance, by higher values of the flow velocity near the downward facing wall, the kinetic energy. Figure 8e,f, corresponding to d s = 100   μ m , confirms this flow nonlinearity. Nonetheless, the quantitative implications on the sediment bed formation are not evident from the present set of simulations. Figure 9, showing the temporal progression of particle accumulation at A1 for d s = 50   μ m and d s = 100   μ m , exposes the considerable difference on the settling time scale in comparison with 10   μ m (Figure 5).
When comparing the relative impact of the heating on the corresponding particle sizes for Δ T DFW = 30   ° C , there is no clear distinction on particle accumulation rates. Table 3 shows, for the case Δ T DFW = 30   ° C , that the dimensionless time scale of the end of the settling process at A1 was similar comparing d s = 10   μ m and d s = 50   μ m , but much shorter for d s = 100   μ m . Although this single result represents no proof of a trend due to the limitations of the numerical scheme used for computations—a mixture model, where close interaction between particles has only been regarded via a concentration-dependent viscosity and a solid phase pressure term—it is suggested that the effect of particle size on the separation efficiency should be analyzed in light of a time scale based both on the settling velocity and the convective process.
The impact of heating at the downward facing wall is also noticeable noting the concentration range of the supernatant layer. This is suggested from the spatiotemporal Figure 8b,d,f (heated), in comparison with their non-heated counterparts in Figure 8a,c,e, respectively.
While there was clear resuspension in the heated cell with 10 μ m particles, there was not such a clear influence of heating on supernatant turbidity for d s = 50   μ m and 100 μ m. This can also be seen from the computation of the particle accumulation at A2 in terms of the dimensionless time τ = t w s / b (Figure 10), where the highest contrast between no heating and heating on the supernatant concentration was found for the smallest particle size tested. An explanation is based on the particle size being able to be obtained from two key aspects: first is the submerged weight of particles, equal to ( ρ l ρ s ) g π d s 3 / 6 k ^ , exerting a greater force on particles if their size is larger; second is the drag of the liquid phase on particles, causing them to move upwards and also decreasing with particle diameter. In Stokes flow—applicable to the present particle range—the drag force on a single particle can be written as F d = 3 π μ u r d s . Therefore, the work of drag required to move a single particle a distance z is related to the change of mechanical energy as Δ E F d Δ z . Note that the relative velocity, u s , can be related to the absolute velocity of the solid phase as u r = u s / ( 1 ϕ ) . If u s is a scale of the solid phase velocity and ϕ 0 , the average particle concentration, is a scale of the concentration, then the single effect of drag is to modify the velocity of the solid phase as:
u s drag ( 1 ϕ 0 ) Δ E μ d s Δ z ,
thus implying that increasing z and d s within the cell causes a decrease of the drag force, proportional to u s , thus reducing the opposing force to particle weight in the supernatant layer by a factor proportional to 1 / d s .

4.3. Effect of Particle Concentration

Increasing mean particle concentration causes, at constant cell dimensions, a higher total particle volume, which implies an enhanced particle settling per unit time. In the absence of natural convection due to heating, following the PNK concept, then the position of the interface between the suspension and the supernatant layer ( H ( t ) ) can be written, in terms of the present set of variables, as [13]:
d H d t = w 0 1 + H W tan θ .
Assuming particle mass concentration in the sediment layer, the top of the sediment layer (with vertical position h s , measured from the base of the cell) has the form:
d h s d t = w 0 1 + H 0 W tan θ F ( ϕ 0 , t ) ,
with:
F ( ϕ 0 , t ) = ϕ 0 f ( ϕ 0 ) ϕ m ϕ 0 exp w 0 f ( ϕ 0 ) tan θ W t ,
where at low volume concentrations (as in the present case), f ( ϕ 0 ) is a weak function of the concentration ([30] has derived a similar expression with exponential dependence of the concentration). Assuming there is no flocculation and considering f ( ϕ 0 ) 1 ϕ 0 1 / 3 [31], suitable for a low concentration, the particle concentration-dependent function for early values of time (neglecting the exponential term in Equation (12)) is given by ϕ 0 ( 1 ϕ 0 1 / 3 ) ϕ m ϕ 0 , which is a monotonically-increasing function with the concentration. For larger values of time, the effect of the exponential term is slight. Even considering times on the order of the total settling time, the exponential term cause no significant difference. Solving for the critical condition when H ( t f ) = h s ( t f ) , based on the PNK model, a final time for settling is estimated, for low concentrations, as:
t f = W w 0 tan θ ln 1 + H 0 W tan θ .
Figure 11 shows the time- and concentration-dependent term.
The same trend to increase the rate of particle accumulation with concentration was reproduced in the presence of heating at the downward facing wall. This can be seen in terms of the particle accumulation at zone A1, as shown in Figure 12. However, compared to the non-heating case, it was found, as expected, that the A1 filling process was faster in front of heating, as discussed above.
A related question is on the impact of increasing particle concentration on the overall efficiency of the separation process. An indication of this can be observed from the rate of particle accumulation at A1 in relation with the initial volume of particles or, equivalently, the dimensionless ratio ϕ A 1 / ϕ 0 . This is depicted in Figure 13, where it is shown that, at equal values of Δ T DFW , the concentration rise at A1 with time became slower at higher concentrations. This result reveals that particle settling at the bottom is a more efficient process for lower particle hindrance conditions. However, this implies that, at equal throughput, comparatively larger settler areas would be required. In this context, a final choice of particle concentration entering the cell should then be posed in terms of a trade-off analysis.
A significant impact of the initial concentration could be seen on the resuspended material near the top of the cell, in the supernatant layer. This is depicted in Figure 14 for the case Δ T DFW = 30   ° C . Higher particle concentrations are bonded to smaller rates of resuspension, whose evidence, in Figure 14, was lower concentrations in zone A2. As in the previous section, this can also be interpreted in terms of the drag force between the solid and the liquid phase. The scale shown in Equation (9) suggests that the drag force, proportional to u s , decreased with a factor proportional to ( 1 ϕ 0 ) / Δ z .

5. Conclusions

The use of heat to enhance particle settling in inclined containers has been tested using high-resolution, two-dimensional numerical simulations in batch mode. Besides the finding that particle separation has a nonlinear effect with heating, the present study shows that both the particle size range and concentration corresponding to the highest enhancement of heating are within the particle size range of comminution processes and, in particular, copper ore tailings, thus rendering this approach viable for either primary or secondary solid separation stages in concentrator plants. Being solely gravity assisted and potentially energized by solar radiation, the use of heat-assisted lamellar settlers (HALS) could represent a viable option for a combined thickener-HALS unit process. Further development of this topic requires an extension to the continuous mode of operation, where a key aspect to consider is the interplay between enhanced settling and stronger mixing at the supernatant layer, both due to heating, the latter aspect promoting resuspension and therefore naturally suggesting an optimization problem on best operational conditions.

Author Contributions

Conceptualization, C.F.I. and C.R.; methodology, C.R. and C.F.I.; software, C.R.; validation, C.R. formal analysis, C.F.I. and C.R.; investigation, C.R. and C.F.I.; resources, C.F.I.; data curation, C.R.; writing, original draft preparation, C.F.I. and C.R.; writing, review and editing, F.A. and L.A.C.; visualization, C.R.; supervision, C.F.I.; project administration, C.F.I.; funding acquisition, C.F.I. and L.A.C.

Funding

This research was funded by the Chilean National Commission (CONICYT) for Science and Technology through Fondecyt Project Grant 1160971.

Acknowledgments

The authors acknowledge support from the Mining Engineering Department and the Advanced Mining Technology Center, Universidad de Chile.

Conflicts of Interest

The authors declare no conflict of interest.

References

  1. Ihle, C.; Tamburrino, A. Variables affecting energy efficiency in turbulent ore concentrate pipeline transport. Miner. Eng. 2012, 39, 62–70. [Google Scholar] [CrossRef]
  2. Ihle, C.F.; Kracht, W. The relevance of water recirculation in large scale mineral processing plants with a remote water supply. J. Clean. Prod. 2018, 177, 34–51. [Google Scholar] [CrossRef]
  3. Herrera-León, S.; Lucay, F.A.; Cisternas, L.A.; Kraslawski, A. Applying a multi-objective optimization approach in designing water supply systems for mining industries. The case of Chile. J. Clean. Prod. 2019, 210, 994–1004. [Google Scholar] [CrossRef]
  4. Wang, C.; Harbottle, D.; Liu, Q.; Xu, Z. Current state of fine mineral tailings treatment: A critical review on theory and practice. Miner. Eng. 2014, 58, 113–131. [Google Scholar] [CrossRef] [Green Version]
  5. Tankosić, L.; Tančić, P.; Sredić, S.; Nedić, Z. Comparative Study of the Mineral Composition and Its Connection with Some Properties Important for the Sludge Flocculation Process-Examples from Omarska Mine. Minerals 2018, 8, 119. [Google Scholar] [CrossRef]
  6. Ma, X.; Fan, Y.; Dong, X.; Chen, R.; Li, H.; Sun, D.; Yao, S. Impact of Clay Minerals on the Dewatering of Coal Slurry: An Experimental and Molecular-Simulation Study. Minerals 2018, 8, 400. [Google Scholar] [CrossRef]
  7. Falconer, A. Gravity separation: Old technique/new methods. Phys. Sep. Sci. Eng. 2003, 12, 31–48. [Google Scholar] [CrossRef]
  8. Concha, F. Solid-Liquid Separation in the Mining Industry; Springer: Berlin, Germany, 2014. [Google Scholar]
  9. Chen, G.; Xiong, Q.; Morris, P.J.; Paterson, E.G.; Sergeev, A.; Wang, Y. OpenFOAM for computational fluid dynamics. Not. AMS 2014, 61, 354–363. [Google Scholar] [CrossRef]
  10. Leung, W.F.; Probstein, R.F. Lamella and tube settlers. 1. Model and operation. Ind. Eng. Chem. Process Des. Dev. 1983, 22, 58–67. [Google Scholar] [CrossRef]
  11. Boycott, A.E. Sedimentation of blood corpuscles. Nature 1920, 104, 532. [Google Scholar] [CrossRef]
  12. Davis, R.H.; Zhang, X.; Agarwala, J.P. Particle classification for dilute suspensions using an inclined settler. Ind. Eng. Chem. Res. 1989, 28, 785–793. [Google Scholar] [CrossRef]
  13. Acrivos, A.; Herbolzheimer, E. Enhanced sedimentation in settling tanks with inclined walls. J. Fluid Mech. 1979, 92, 435. [Google Scholar] [CrossRef]
  14. Ortega, A.; Escobar, R.; Colle, S.; De Abreu, S.L. The state of solar energy resource assessment in Chile. Renew. Energy 2010, 35, 2514–2524. [Google Scholar] [CrossRef]
  15. Solangi, K.H.; Islam, M.R.; Saidur, R.; Rahim, N.A.; Fayaz, H. A review on global solar energy policy. Renew. Sustain. Energy Rev. 2011, 15, 2149–2163. [Google Scholar] [CrossRef]
  16. Kaviany, M. Essentials of Heat Transfer: Principles, Materials, And Applications; Cambridge University Press: Cambridge, UK, 2011. [Google Scholar]
  17. Fujii, T.; Imura, H. Natural-convection heat transfer from a plate with arbitrary inclination. Int. J. Heat Mass Transf. 1972, 15, 755–767. [Google Scholar] [CrossRef]
  18. Palma, S.; Ihle, C.F.; Tamburrino, A.; Dalziel, S.B. Particle organization after viscous sedimentation in tilted containers. Phys. Fluids 2016, 28. [Google Scholar] [CrossRef]
  19. Reyes, C.; Ihle, C.F. Numerical simulation of cation exchange in fine-coarse seawater slurry pipeline flow. Miner. Eng. 2018, 117, 14–23. [Google Scholar] [CrossRef]
  20. Maidment, D.R. Handbook of Hydrology; McGraw-HillL: New York, NY, USA, 1993; Volume 1. [Google Scholar]
  21. Enwald, H.; Peirano, E.; Almstedt, A.E. Eulerian two-phase flow theory applied to fluidization. Int. J. Multiph. Flow 1996, 22, 21–66. [Google Scholar] [CrossRef]
  22. Al-Shemmeri, T. Engineering Fluid Mechanics; Bookboon: London, UK, 2012. [Google Scholar]
  23. Boyer, F.; Guazzelli, É.; Pouliquen, O. Unifying suspension and granular rheology. Phys. Rev. Lett. 2011, 107, 188301. [Google Scholar] [CrossRef] [PubMed]
  24. Baumgarten, A.S.; Kamrin, K. A general fluid–sediment mixture model and constitutive theory validated in many flow regimes. J. Fluid Mech. 2019, 861, 721–764. [Google Scholar] [CrossRef]
  25. Hanley, E.J.; Dewitt, D.P.; Roy, R.F. The thermal diffusivity of eight well-characterized rocks for the temperature range 300–1000 K. Eng. Geol. 1978, 12, 31–47. [Google Scholar] [CrossRef]
  26. MacIntyre, S.; Romero, J.R.; Kling, G.W. Spatial-temporal variability in surface layer deepening and lateral advection in an embayment of Lake Victoria, East Africa. Limnol. Oceanogr. 2002, 47, 656–671. [Google Scholar] [CrossRef] [Green Version]
  27. Herbolzheimer, E.; Acrivos, A. Enhanced sedimentation in narrow tilted channels. J. Fluid Mech. 1981, 108, 485. [Google Scholar] [CrossRef]
  28. Hill, W.D.; Rothfus, R.; Li, K. Boundary-enhanced sedimentation due to settling convection. Int. J. Multiph. Flow 1977, 3, 561–583. [Google Scholar] [CrossRef]
  29. Herbolzheimer, E. Stability of the flow during sedimentation in inclined channels. Phys. Fluids 1983, 26, 2043–2054. [Google Scholar] [CrossRef]
  30. Dobashi, T.; Idonuma, A.; Toyama, Y.; Sakanishi, A. Effect of concentration on enhanced sedimentation rate of erythrocytes in an inclined vessel. Biorheology 1994, 31, 383–393. [Google Scholar] [CrossRef]
  31. Davis, R.H.; Acrivos, A. Sedimentation of noncolloidal particles at low Reynolds numbers. Annu. Rev. Fluid Mech. 1985, 17, 91–118. [Google Scholar] [CrossRef]
Figure 1. Cell. The heated downward-facing, heated wall corresponds to the right side boundary of the domain. The horizontal arrows denote the heat flux on the downward facing wall, while the diagonal arrows show a scheme of the liquid (and partially fine solid) fraction flowing upwards near it.
Minerals 09 00228 g001
Figure 2. Typical flow and particle progression for the case Δ T DFW = 30   ° C , ϕ 0 = 0.05 , and d S = 10   μ m and (from left to right) t = 200   s , 800 s, 1600 s, and 3200 s. (a) Particle concentration ( ϕ , with color scale in logarithmic scale) and (b) local parallel mean velocity, defined as u · p ^ , with p ^ a unit vector parallel to the upward facing wall.
Minerals 09 00228 g002aMinerals 09 00228 g002b
Figure 3. Zones of interest for the analysis.
Minerals 09 00228 g003
Figure 4. Spatiotemporal diagram of concentration for (a) Δ T DFW = 0 , (b) Δ T DFW = 20   ° C , (c) Δ T DFW = 30   ° C , and (d) Δ T DFW = 50   ° C . The x and y axes represent time and vertical position ( y = 0 standing for the top of the cell). False color represents horizontally-averaged particle concentration.
Minerals 09 00228 g004
Figure 5. Effect of temperature on the mean particle volume concentration within A 1 = Y z W , for d s = 10   μ m , θ = 45 ° , ϕ 0 = 5 % , and W = 5   c m . The mass in A1 in these cases is equivalent to 60% of the total mass in the cell. (a) Y z = 0.6 Y and (b) Y z = 0.9 Y .
Minerals 09 00228 g005
Figure 6. Particle accumulation at zone A3 for d s = 10   μ m , θ = 45 ° , ϕ 0 = 5 % , and W = 5   c m . (a) Particle mass and (b) the vertical position ( Y sed ) of the particle sediment above the upward facing wall.
Minerals 09 00228 g006
Figure 7. Mass resuspended at zone A2 for d s = 10   μ m , θ = 45 ° , ϕ 0 = 5 % , and W = 5   c m .
Minerals 09 00228 g007
Figure 8. Spatiotemporal diagram of concentration for (a) ( d s , Δ T DFW ) = ( 10   μ m , 0   ° C ) , (b) ( d s , Δ T DFW ) = ( 10   μ m , 30   ° C ) , (c) ( d s , Δ T DFW ) = ( 50   μ m , 0   ° C ) , (d) ( d s , Δ T DFW ) = ( 50   μ m , 30   ° C ) , (e) ( d s , Δ T DFW ) = ( 100   μ m , 0   ° C ) , and (f) ( d s , Δ T DFW ) = ( 100   μ m , 30   ° C ) , with θ = 45 ° , ϕ 0 = 5 % , and W = 5   cm . The x and y axes represent time and vertical position ( y = 0 standing for the top of the cell). False color represents horizontally-averaged particle concentration.
Minerals 09 00228 g008
Figure 9. Average concentration at zone A1 as a function of particle diameter for (a) d s = 50   μ m and (b) d s = 100   μ m .
Minerals 09 00228 g009
Figure 10. Average concentration at zone A2 for d s = 10   μ m , 50 μ m and 100 μ m, Δ T DFW = 0 and 50 ° C as a function of the dimensionless time τ = t w 0 / b , with w 0 the Stokes velocity for each particle size.
Minerals 09 00228 g010
Figure 11. Concentration-dependent function of the rate of particle accumulation at the bottom in the absence of heating for three values of time, given by Equation (12). Time has been normalized by the scale of the particle settling process, given by Equation (13).
Minerals 09 00228 g011
Figure 12. Effect of the initial particle concentration on the particle concentration in A1.
Minerals 09 00228 g012
Figure 13. Dependence of the initial particle concentration on the normalized accumulation in A1, defined as ϕ A 1 / ϕ 0 .
Minerals 09 00228 g013
Figure 14. Effect of the initial particle concentration in the particle concentration in the clear water zone or A2.
Minerals 09 00228 g014
Table 1. Range of variables studied in the numerical simulations. The acronym DFW stands for downward facing wall. In all the cases, the initial temperature prior to the start of the heating of the downward facing wall was T 0 = 20   ° C . At the start of each experiment, the temperature at the downward facing wall was set as T DFW = T 0 + Δ T DFW . Variables d s , ϕ 0 , θ , and W denote particle diameter (monosized), initial concentration (constant), cell inclination, and horizontal projection of cell spacing, respectively. H 0 is equivalent to cos ( 45 ) , and the length of the cell is 1 m.
VariableCases Considered
H 0 0.707 m
Δ T DFW 20, 30, 40, and 50 ° C
d s 5, 10, and 50 μ m
ϕ 0 2%, 5%, 8%, and 15%
θ 45 °
W5 c m
Table 2. Dimensionless particle accumulation lapse in A1 for temperature difference Δ T DFW at the downward facing wall ( t Δ T DFW * ), normalized by the particle accumulation time without heating ( t Δ T DFW = 0 * ), ψ Δ T DFW t Δ T DFW * / t Δ T DFW = 0 * , where a and bare the case where Y z = 0.6 Y and Y z = 0.9 Y , respectively. Here, d s = 10   μ m , θ = 45 ° , ϕ 0 = 5 % , and W = 5   cm .
Δ T DFW (K) ψ Δ T DFW , a ψ Δ T DFW , b
200.620.54
300.580.53
400.530.43
500.510.29
Table 3. Dimensionless particle accumulation lapse in A1 for temperature difference Δ T DFW = 50   ° C at the downward facing wall for d s = 10   μ m , d s = 50   μ m , and d s = 100   μ m ( t 50 , d s * ), normalized by the particle accumulation time without heating ( t 0 , d s * ), ψ 50 , d s t 50 , d s * / t 0 , d s * . Here, θ = 45 ° , ϕ 0 = 5 % , and W = 5   cm .
d s ( μ m) ψ 50 , d s
100.94
500.94
1000.70

