Origin and Evolution of Ore-Forming Fluid and Gold-Deposition Processes at the Sanshandao Gold Deposit, Jiaodong Peninsula, Eastern China

 ,
,
Abstract
:1. Introduction
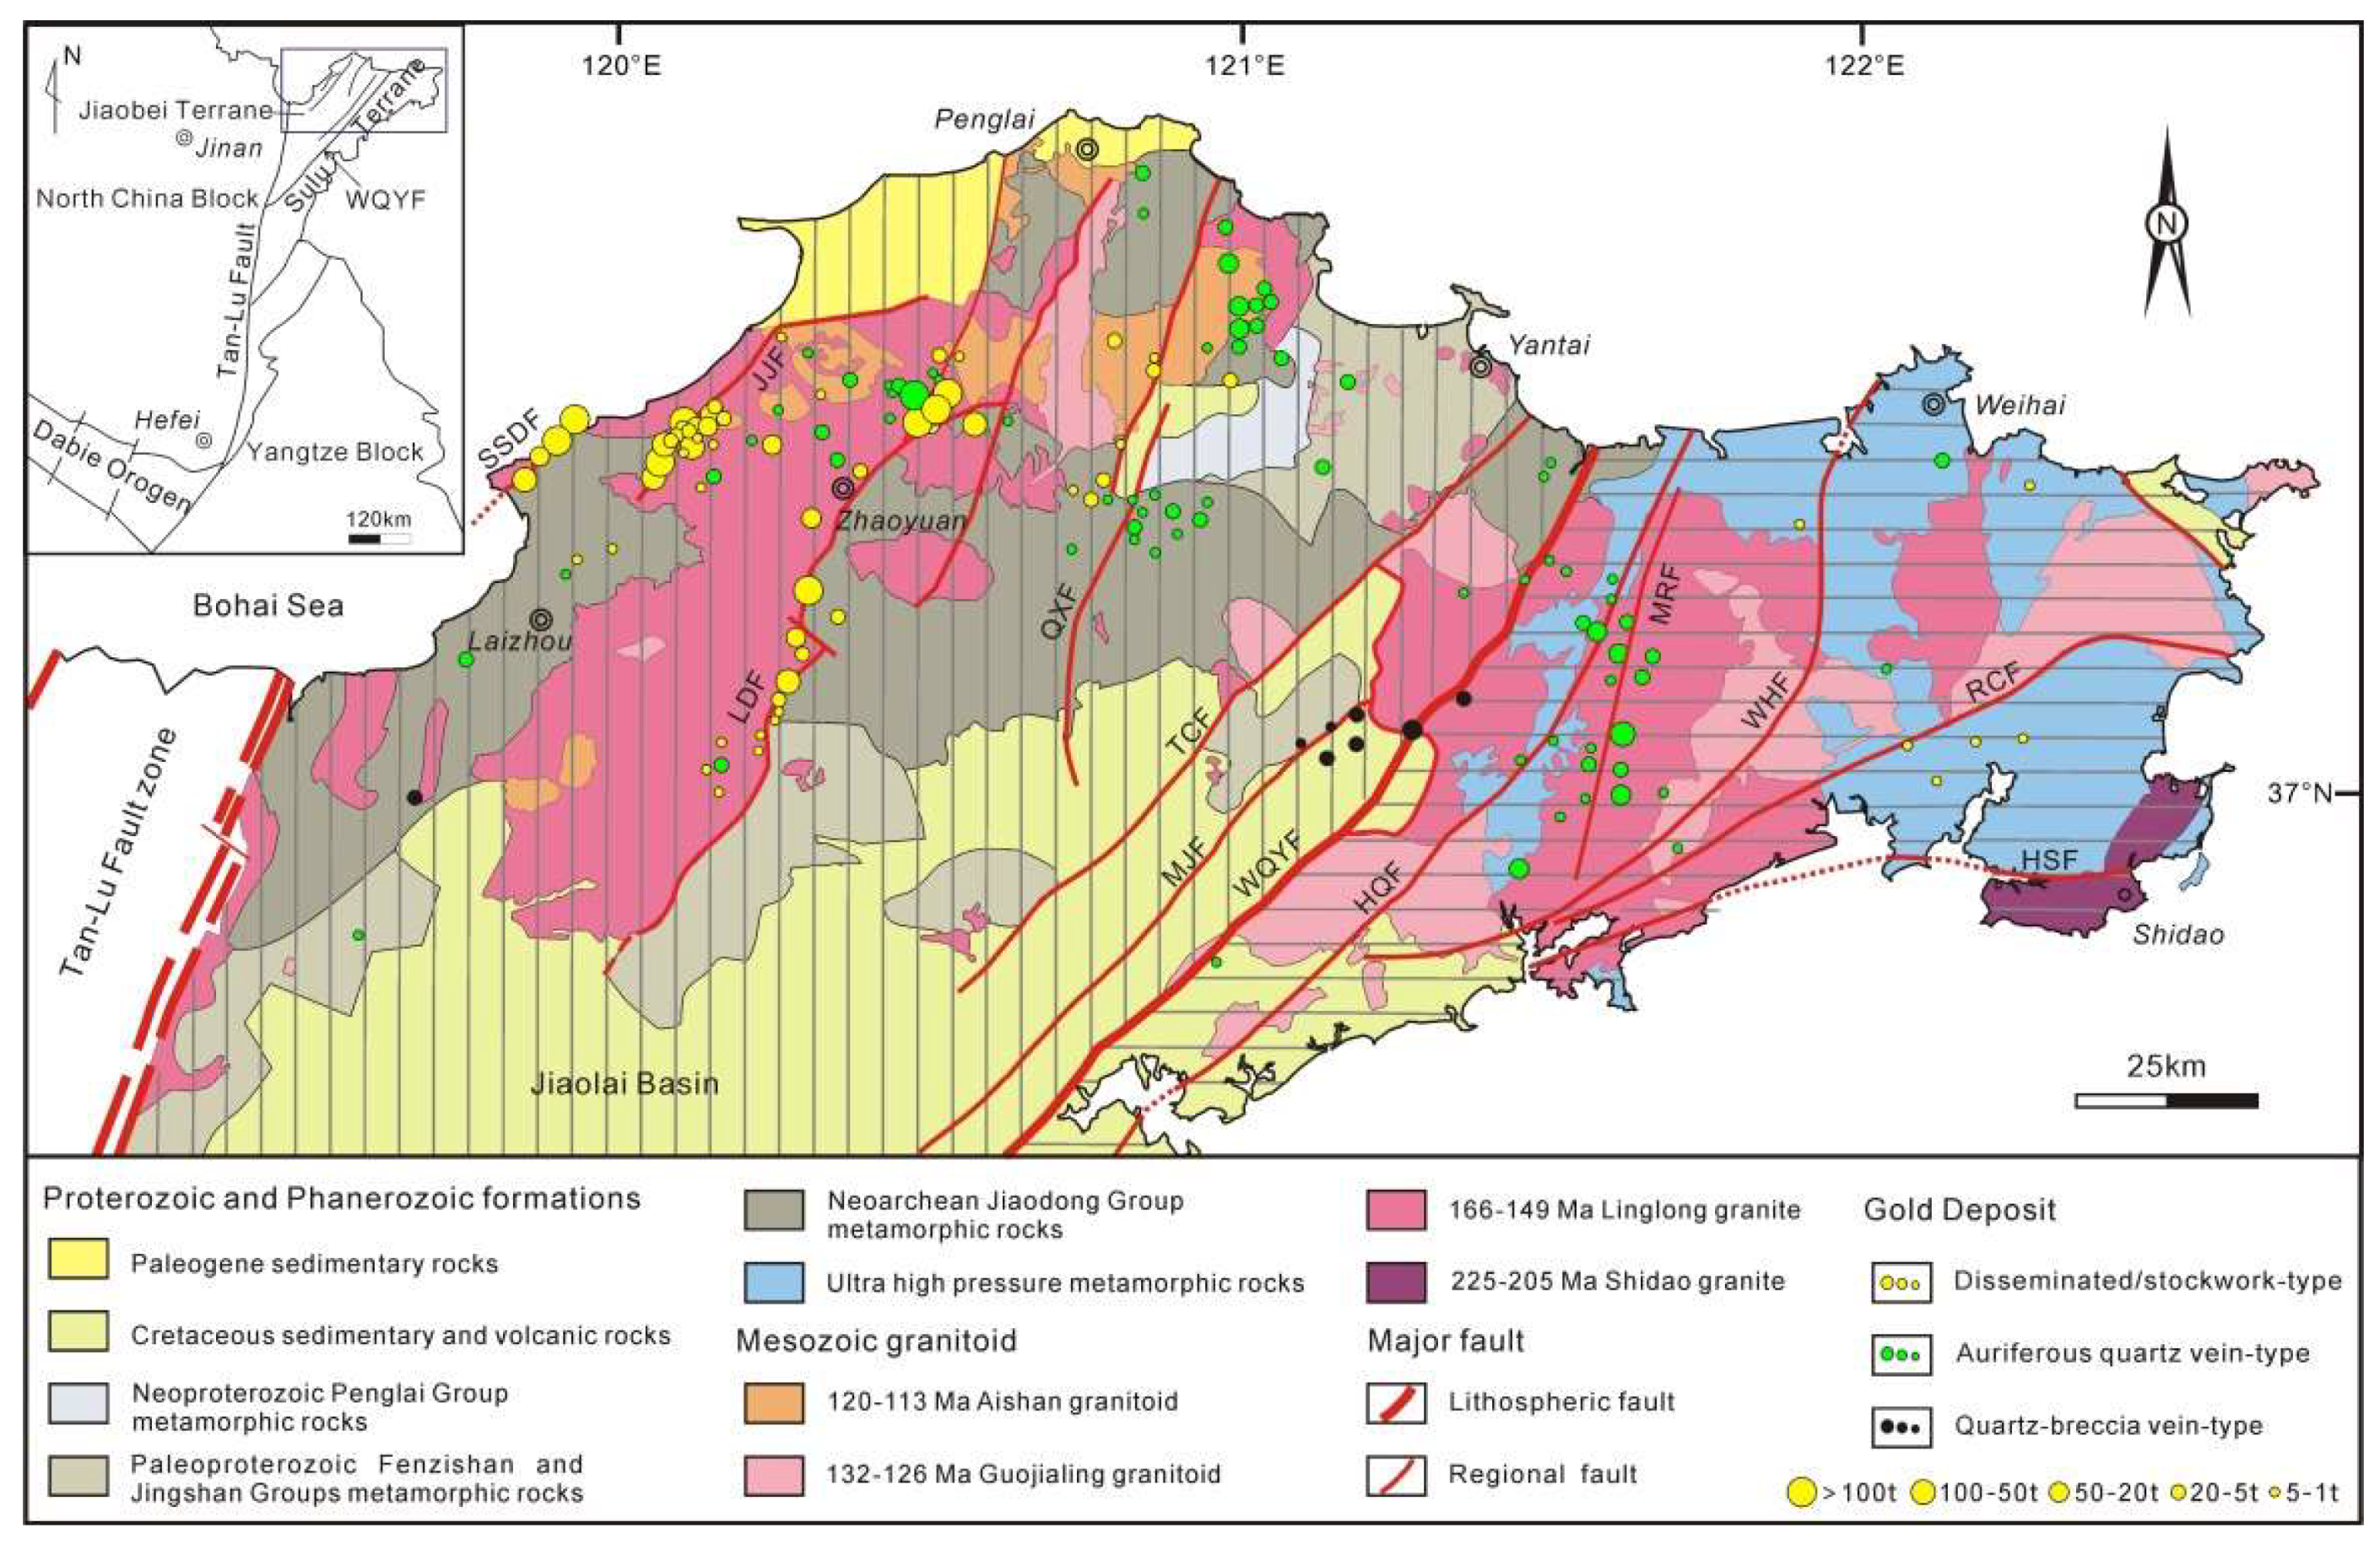
2. Regional Geology
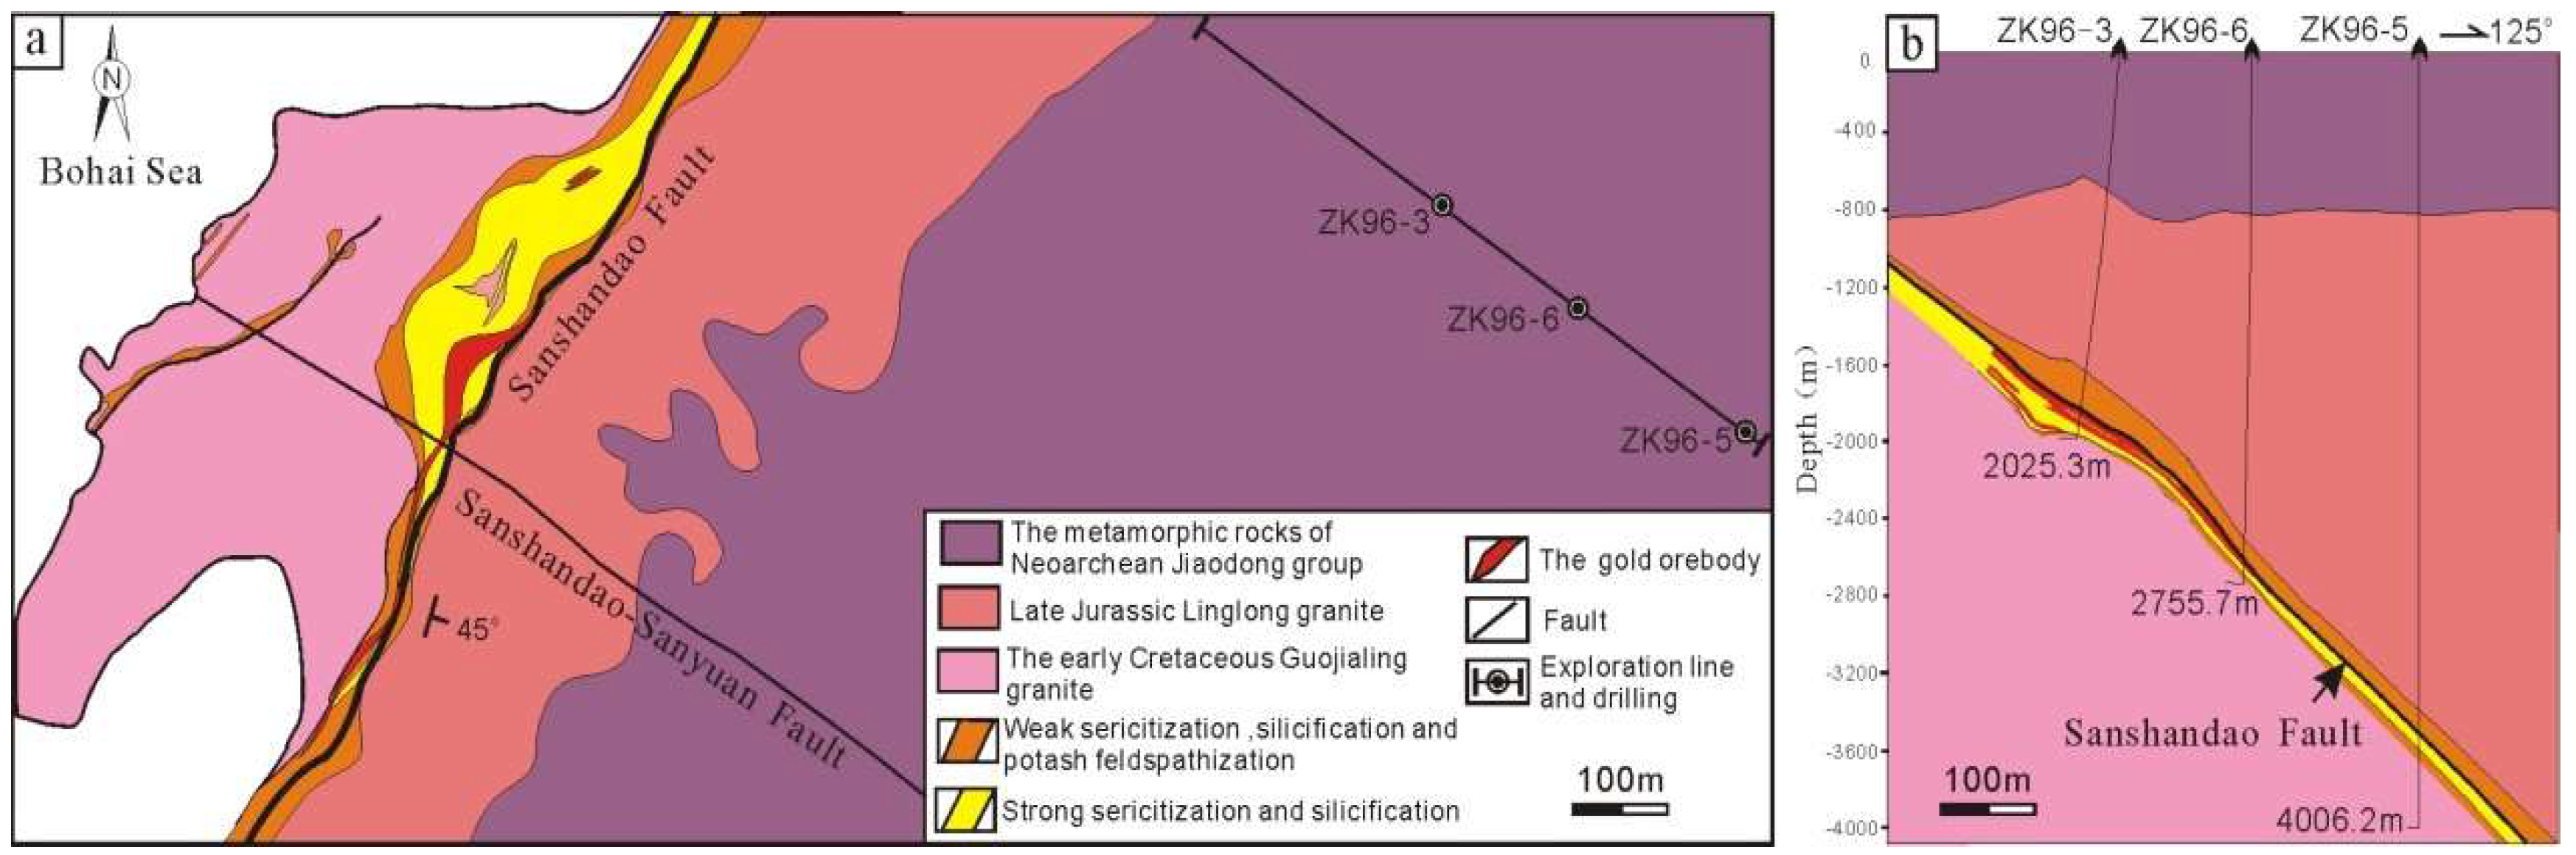
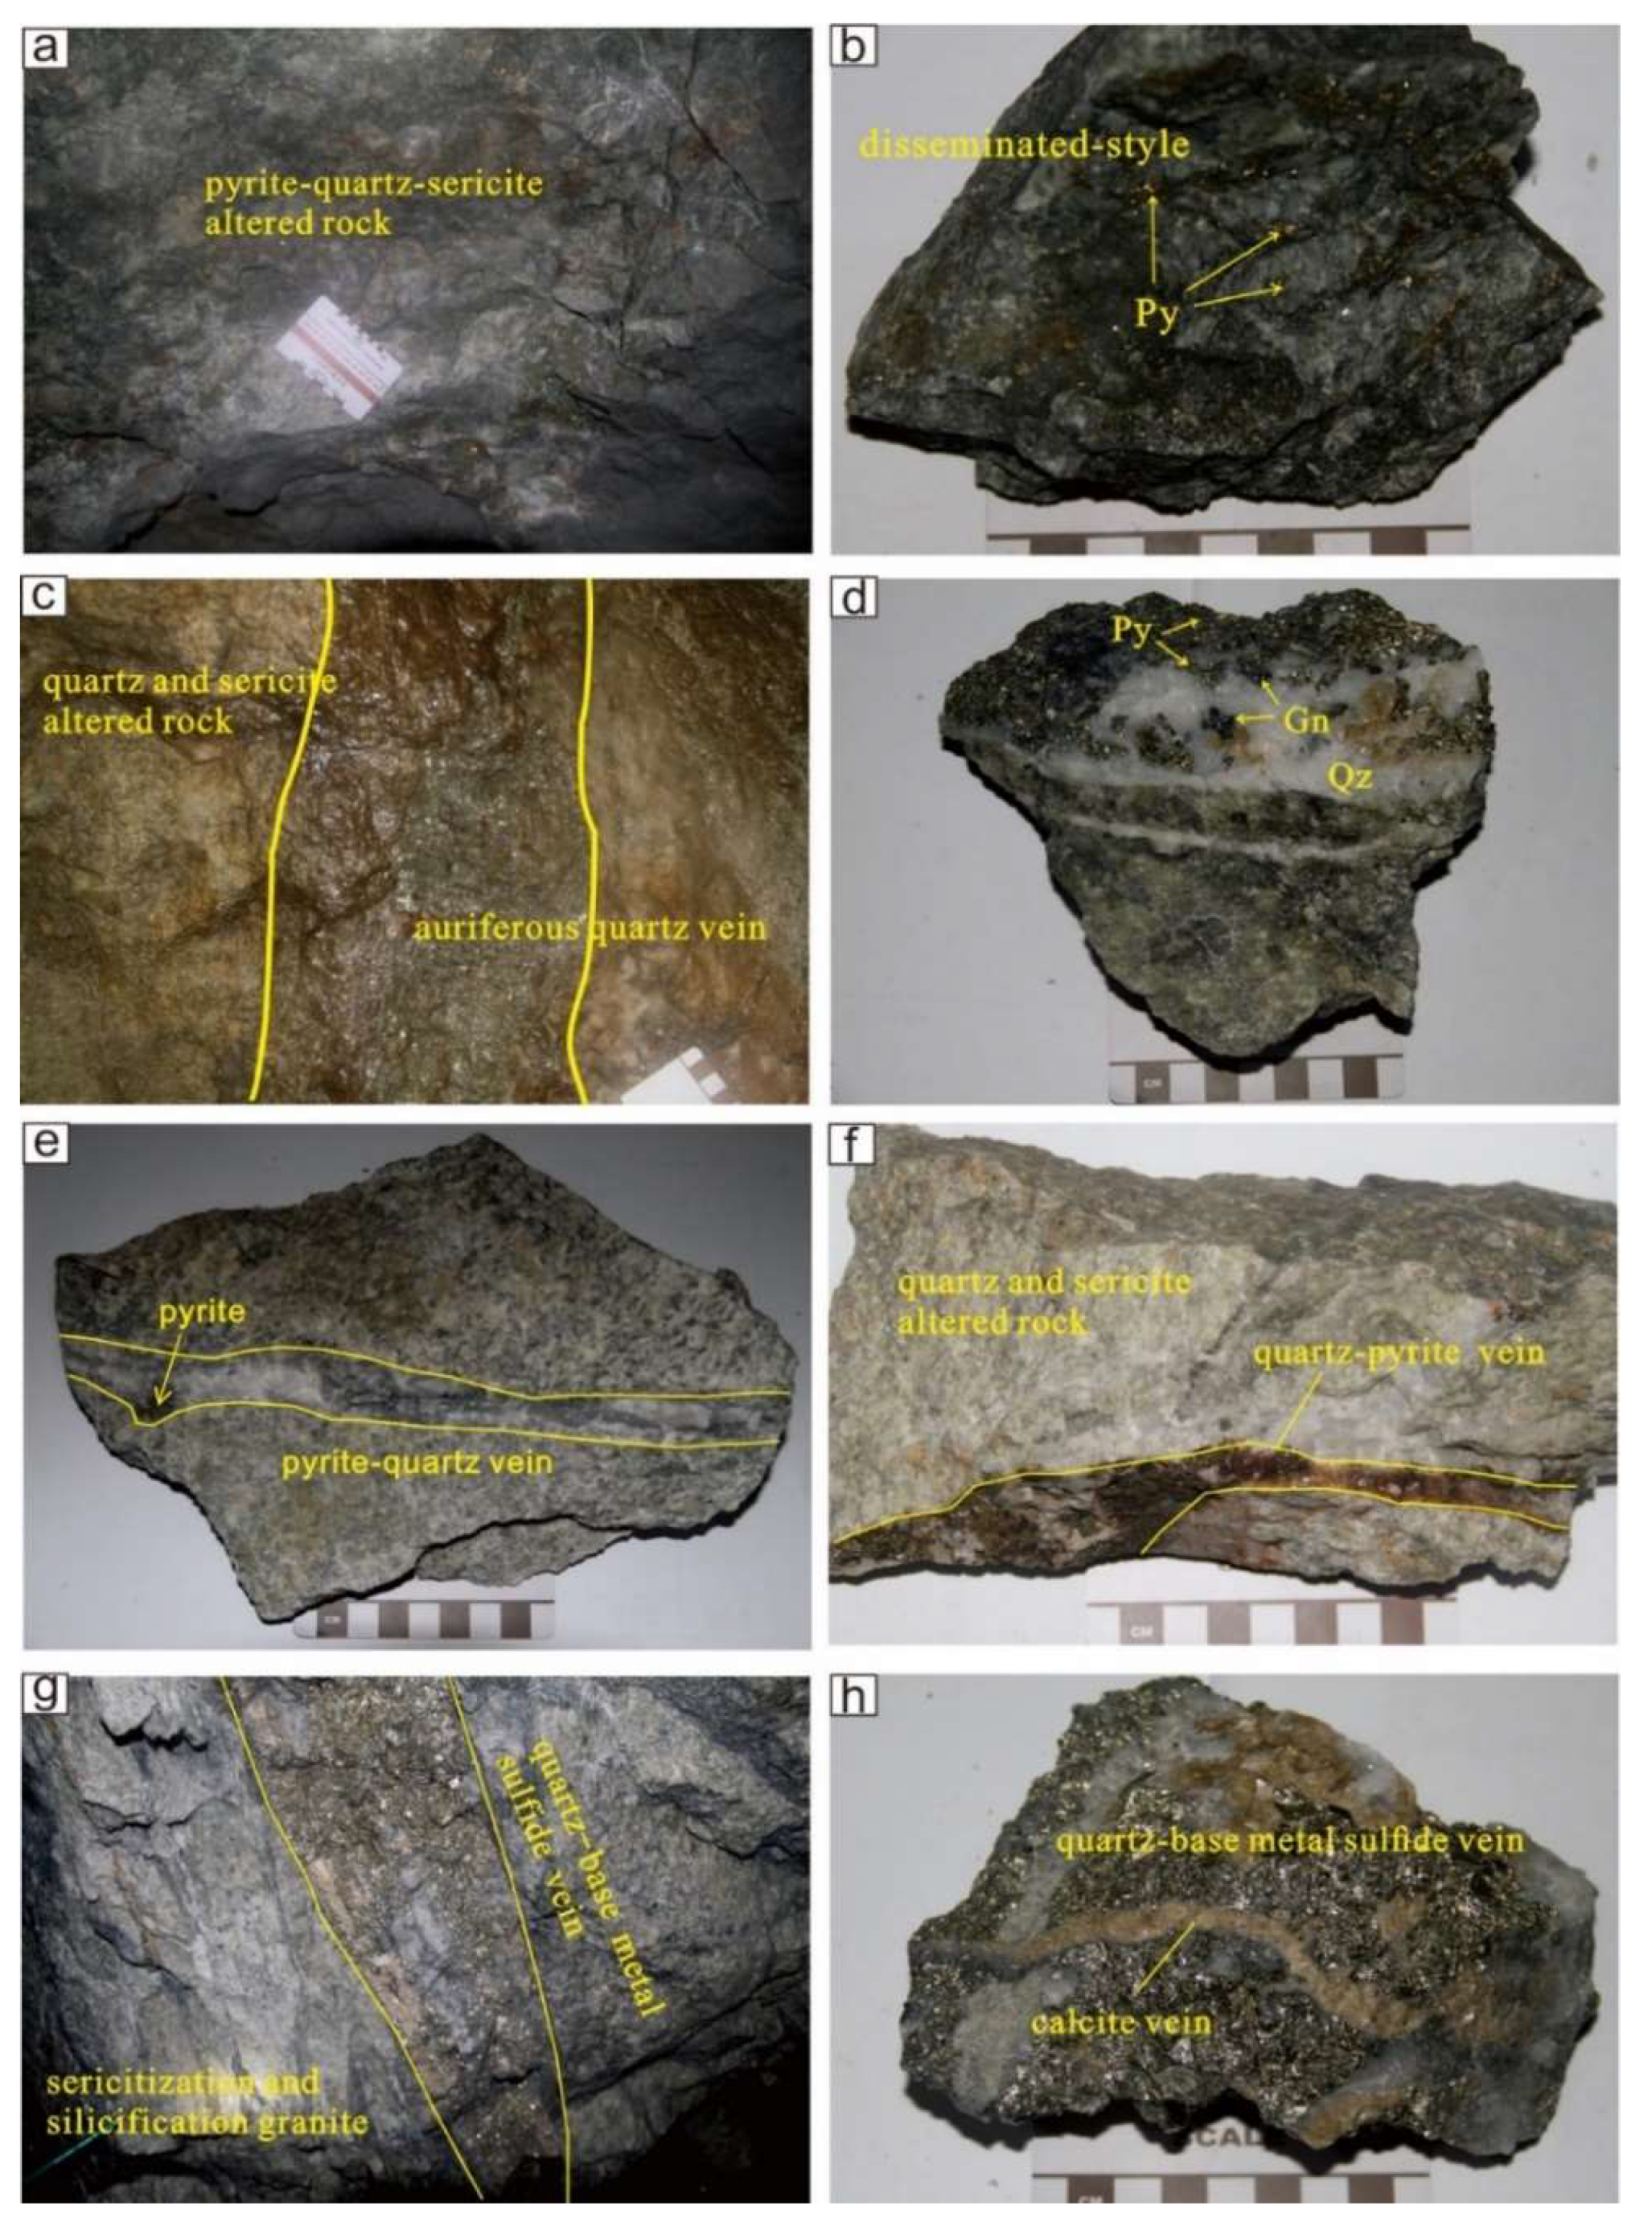
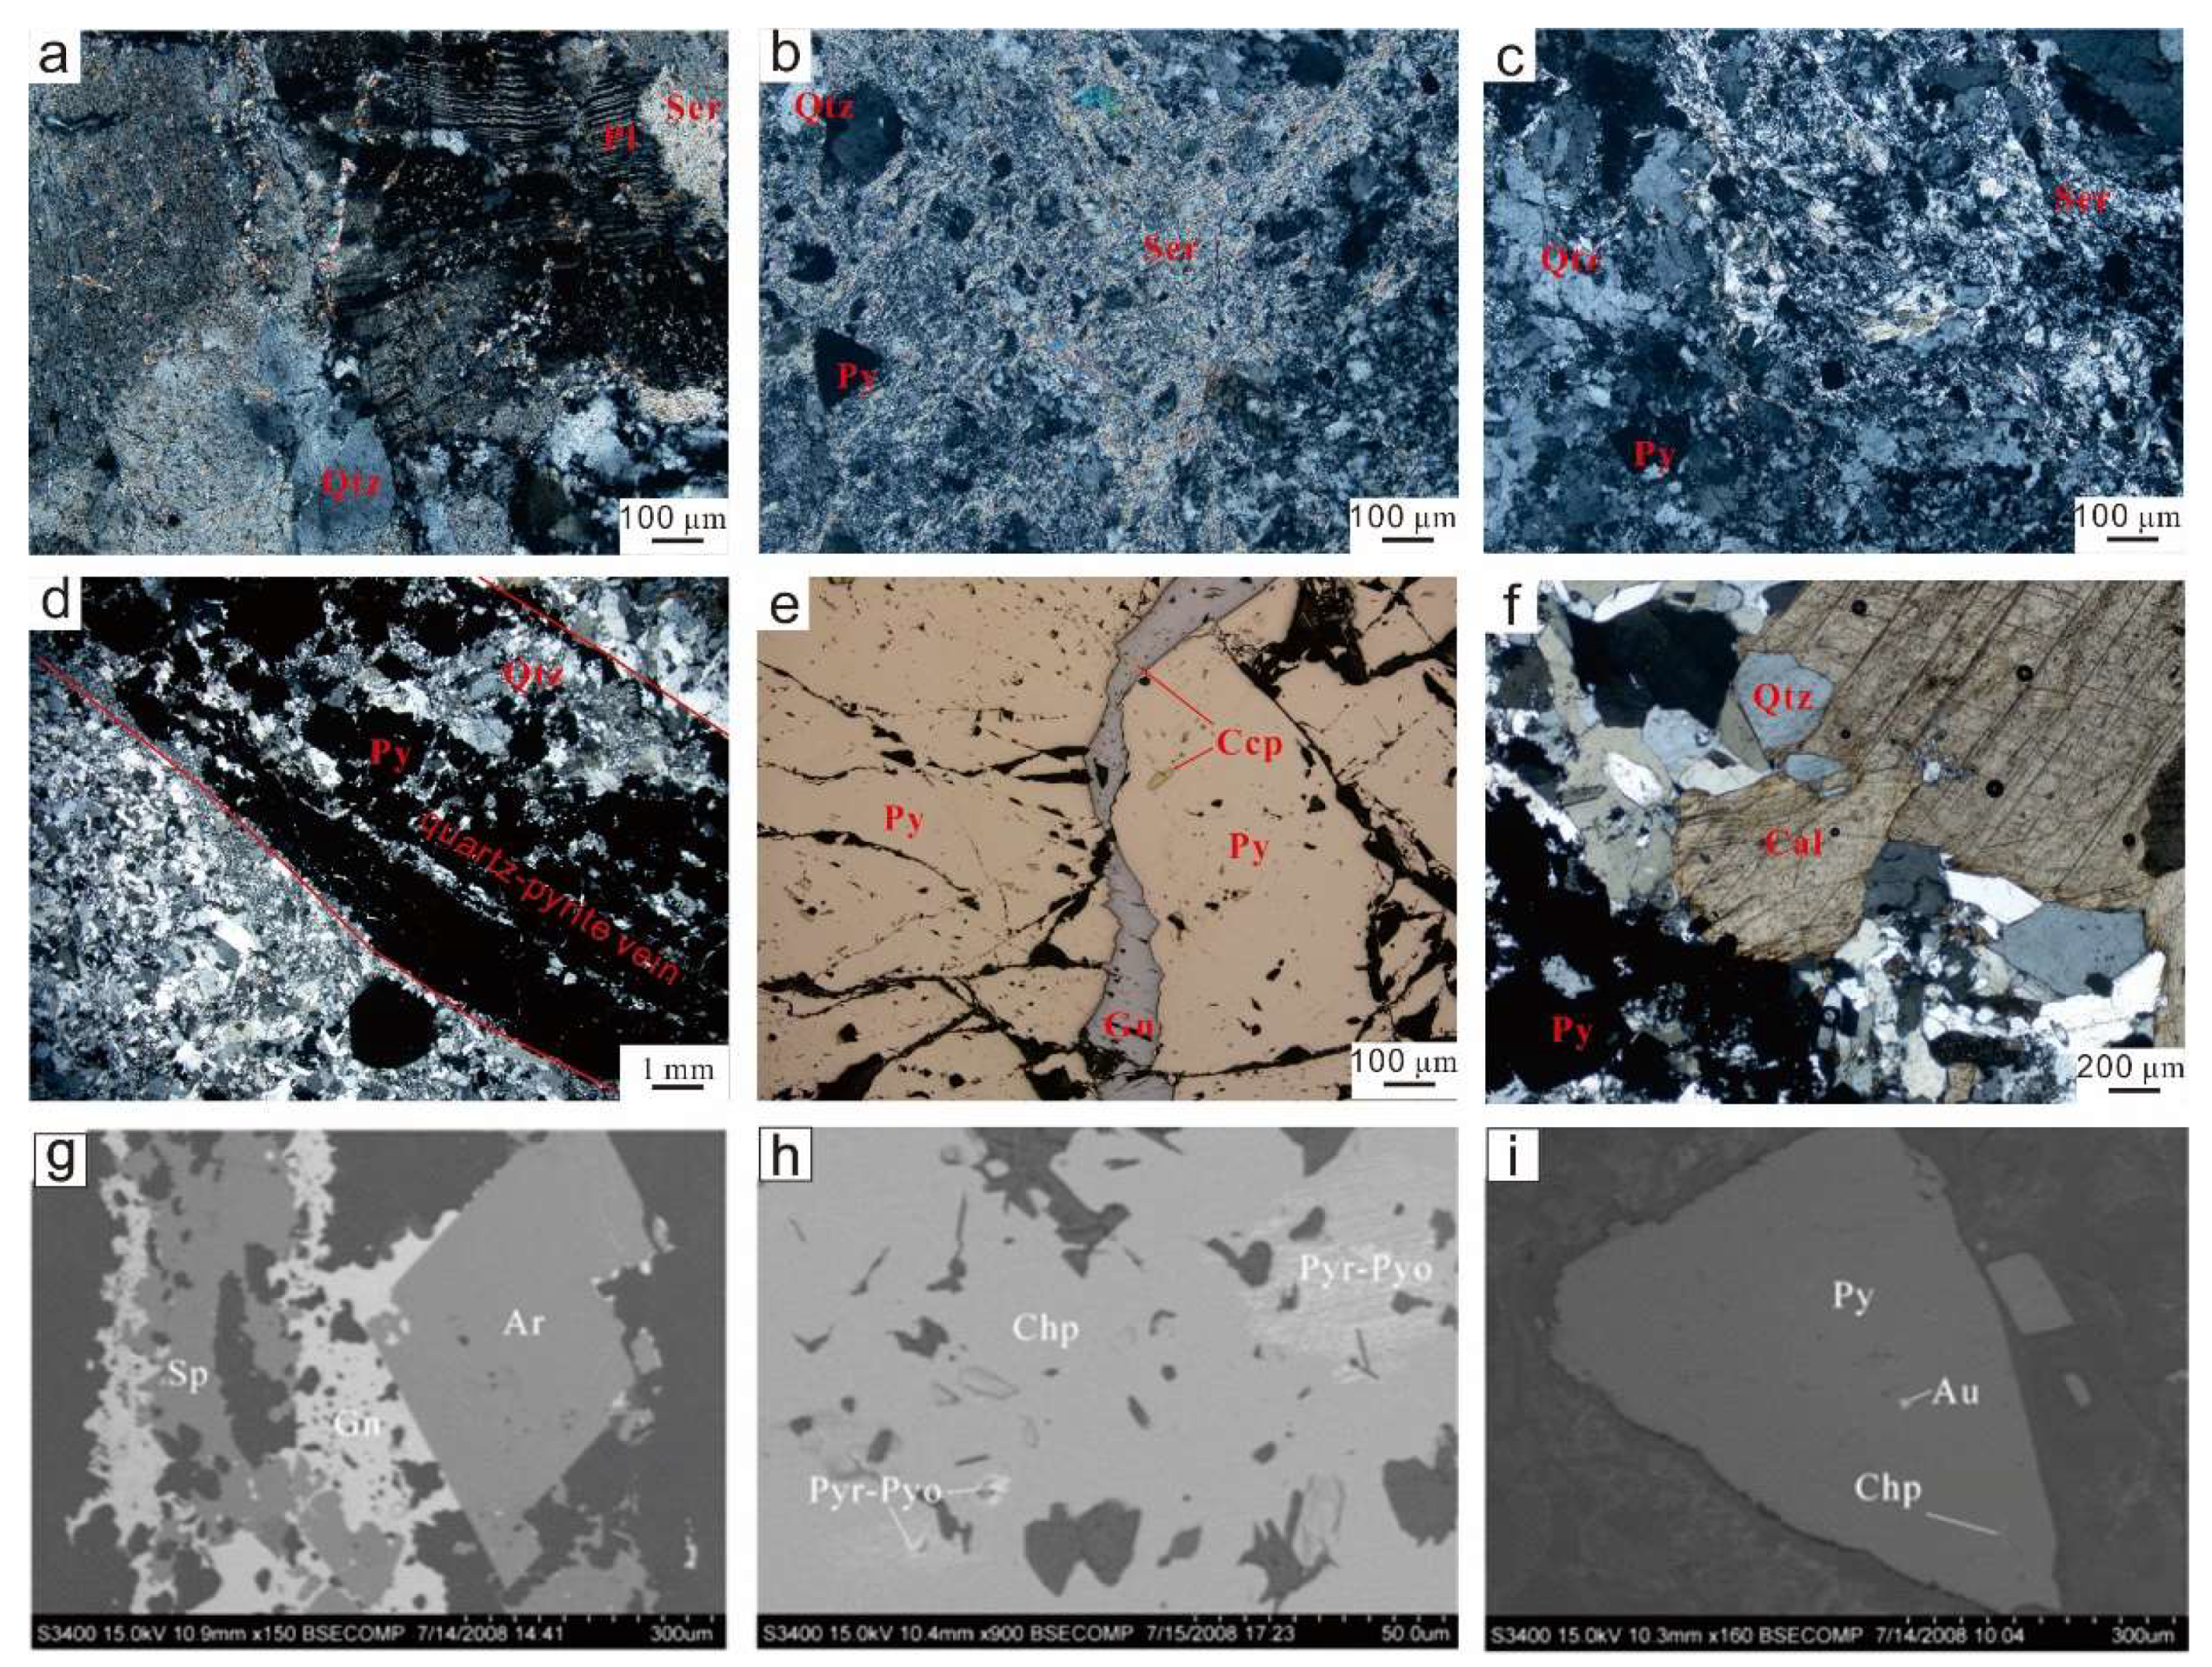
3. Deposit Geology
4. Sampling and Analytical Methods
4.1. Fluid-Inclusion Analysis
4.2. Laser Raman Spectroscopy
4.3. Isotope Analysis
5. Results
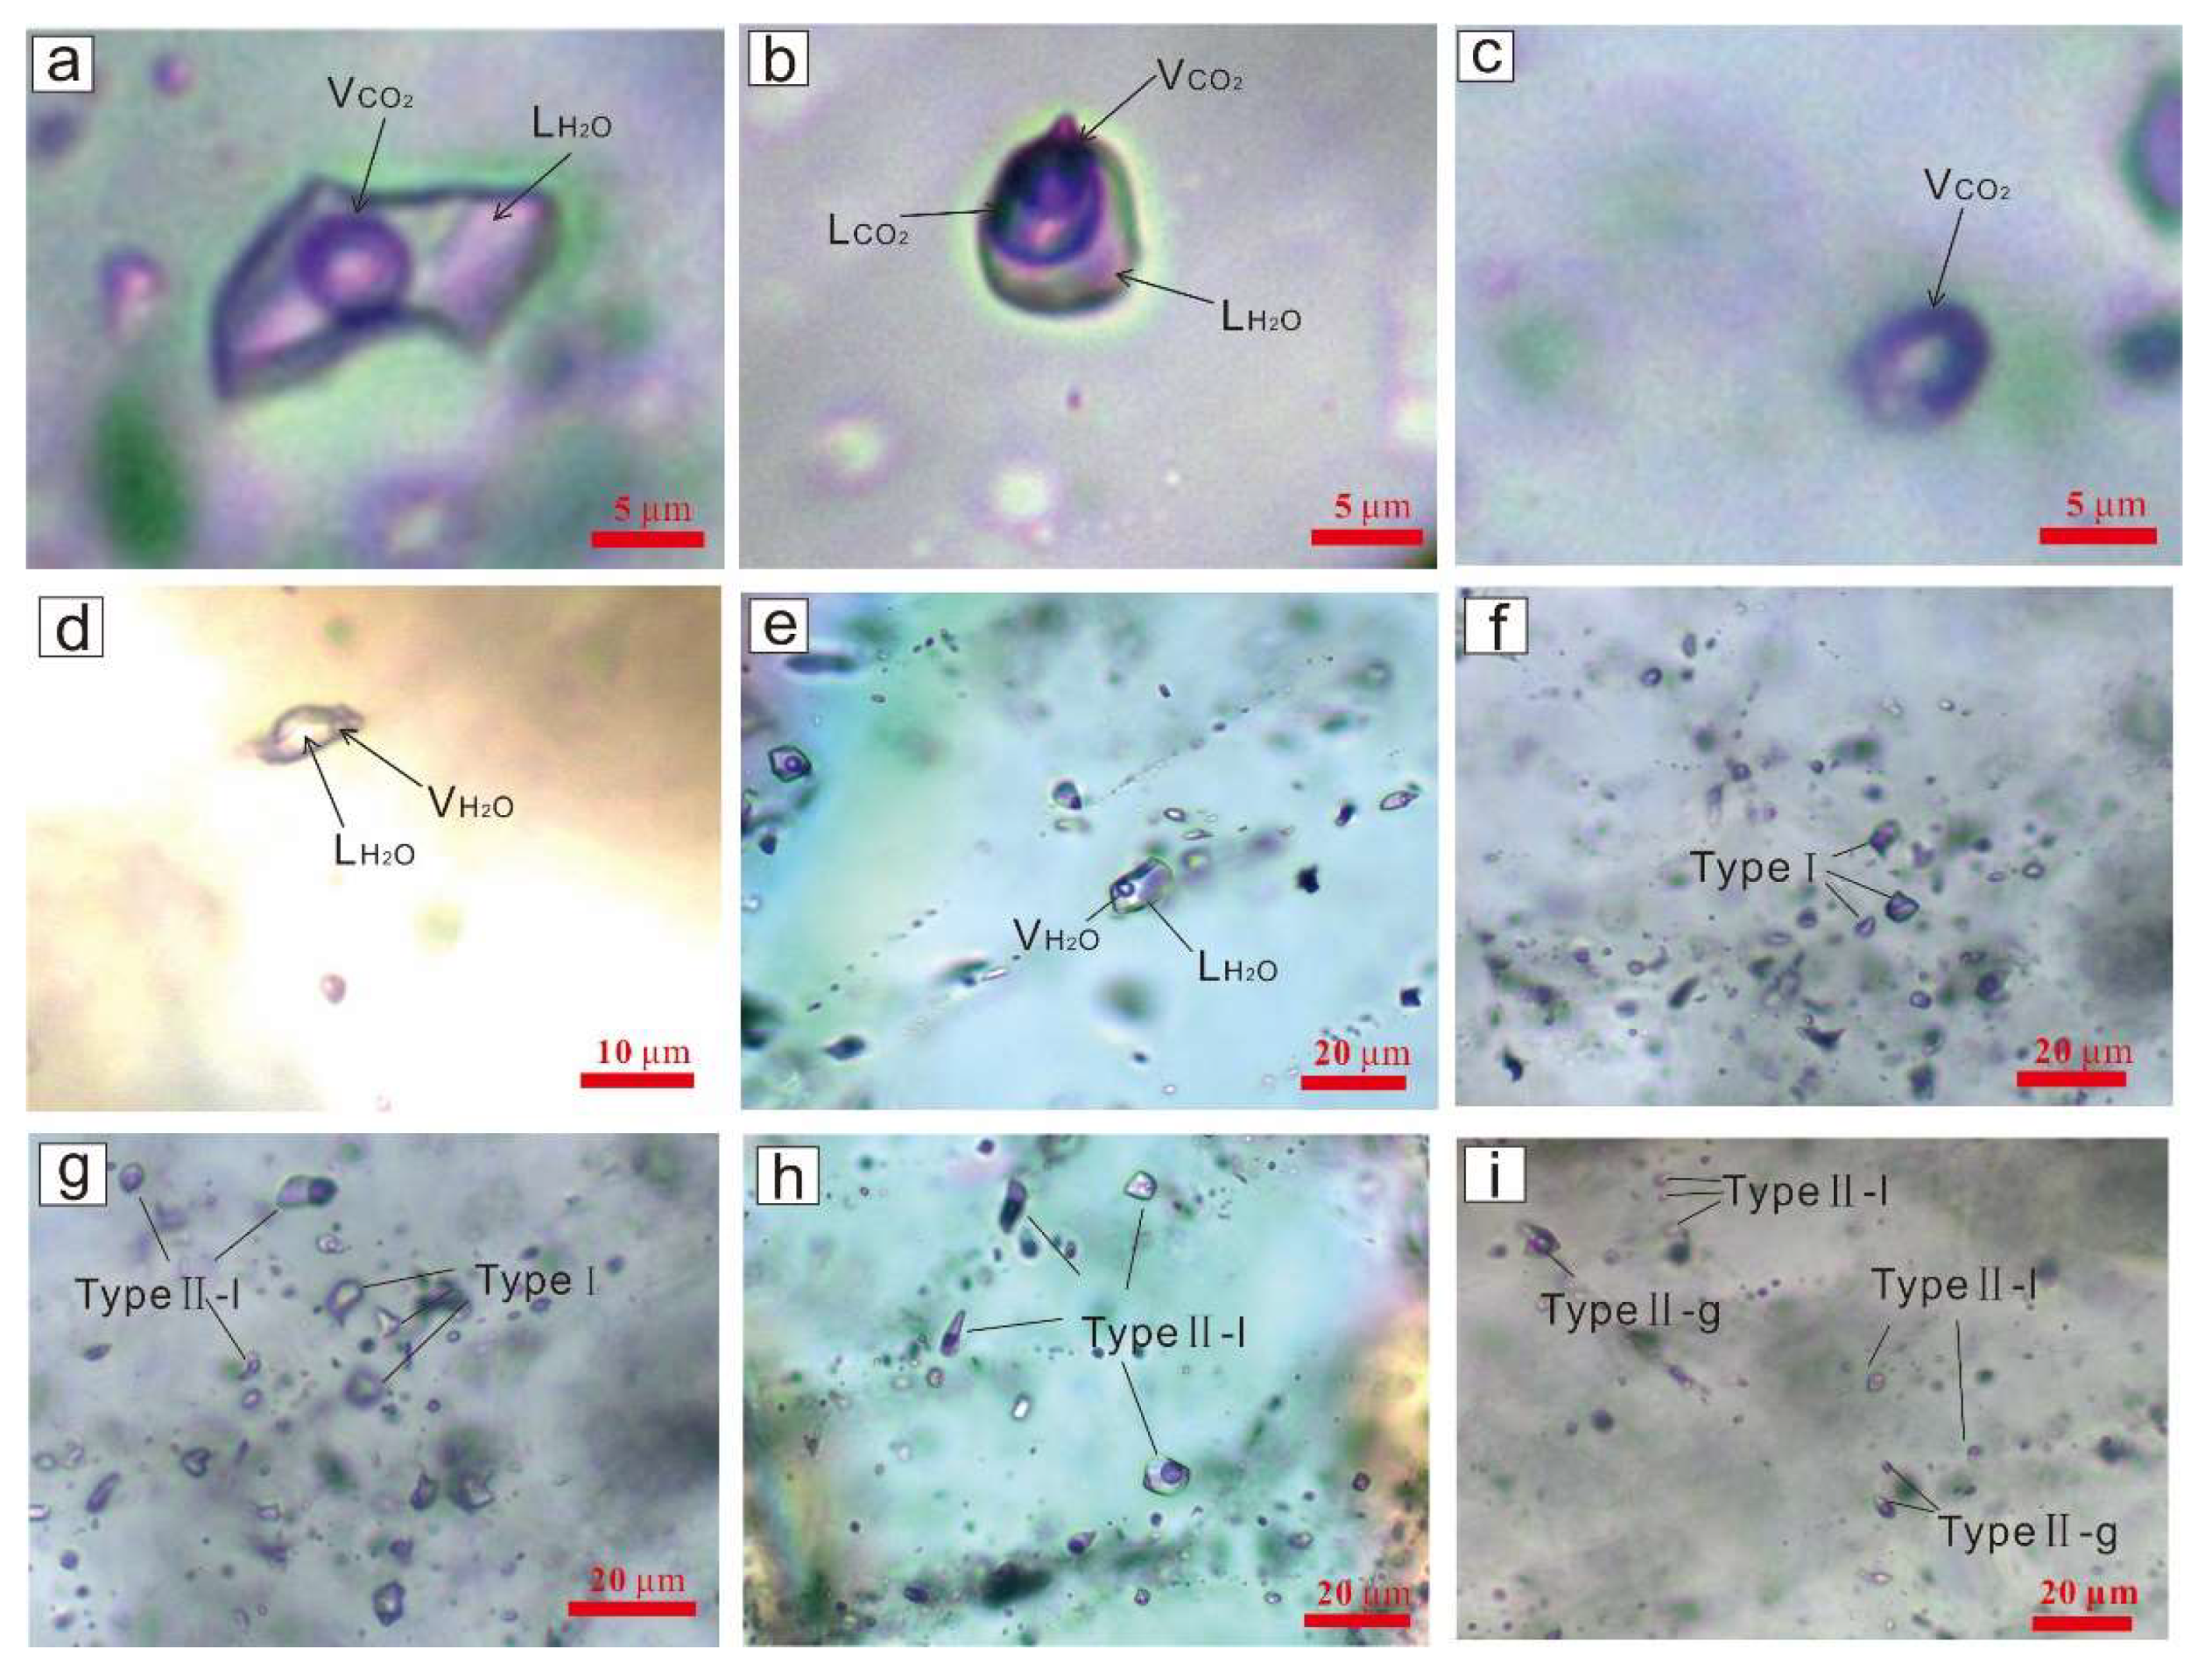
5.1. Fluid-Inclusion Types
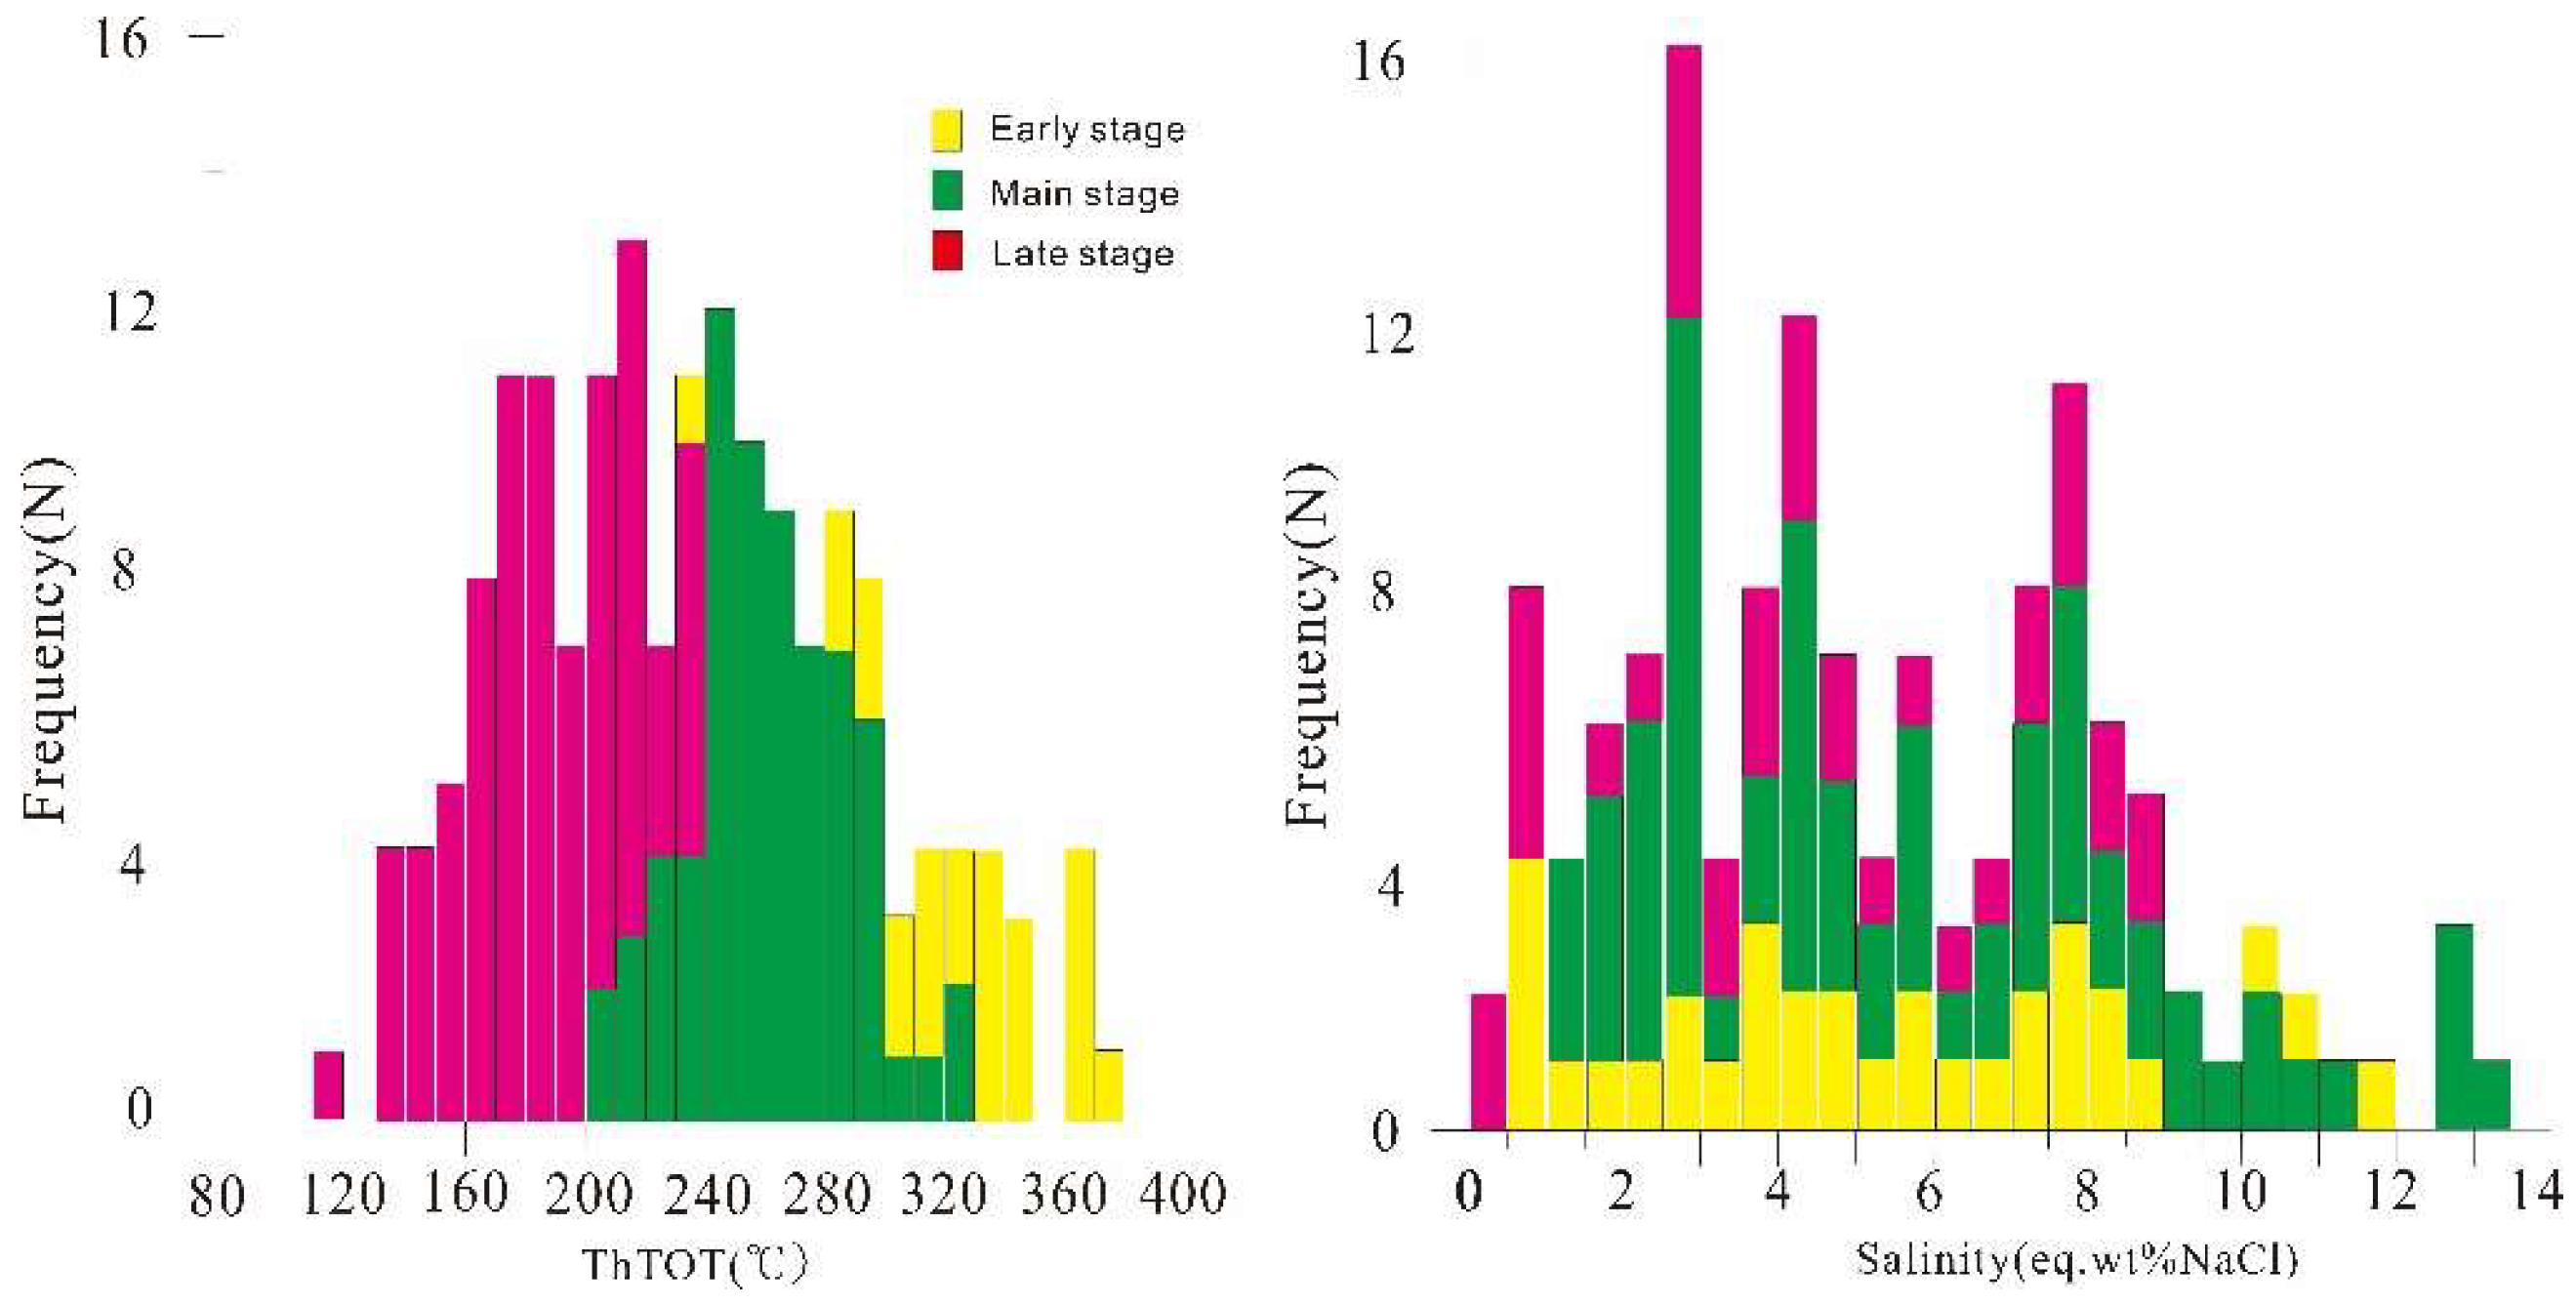
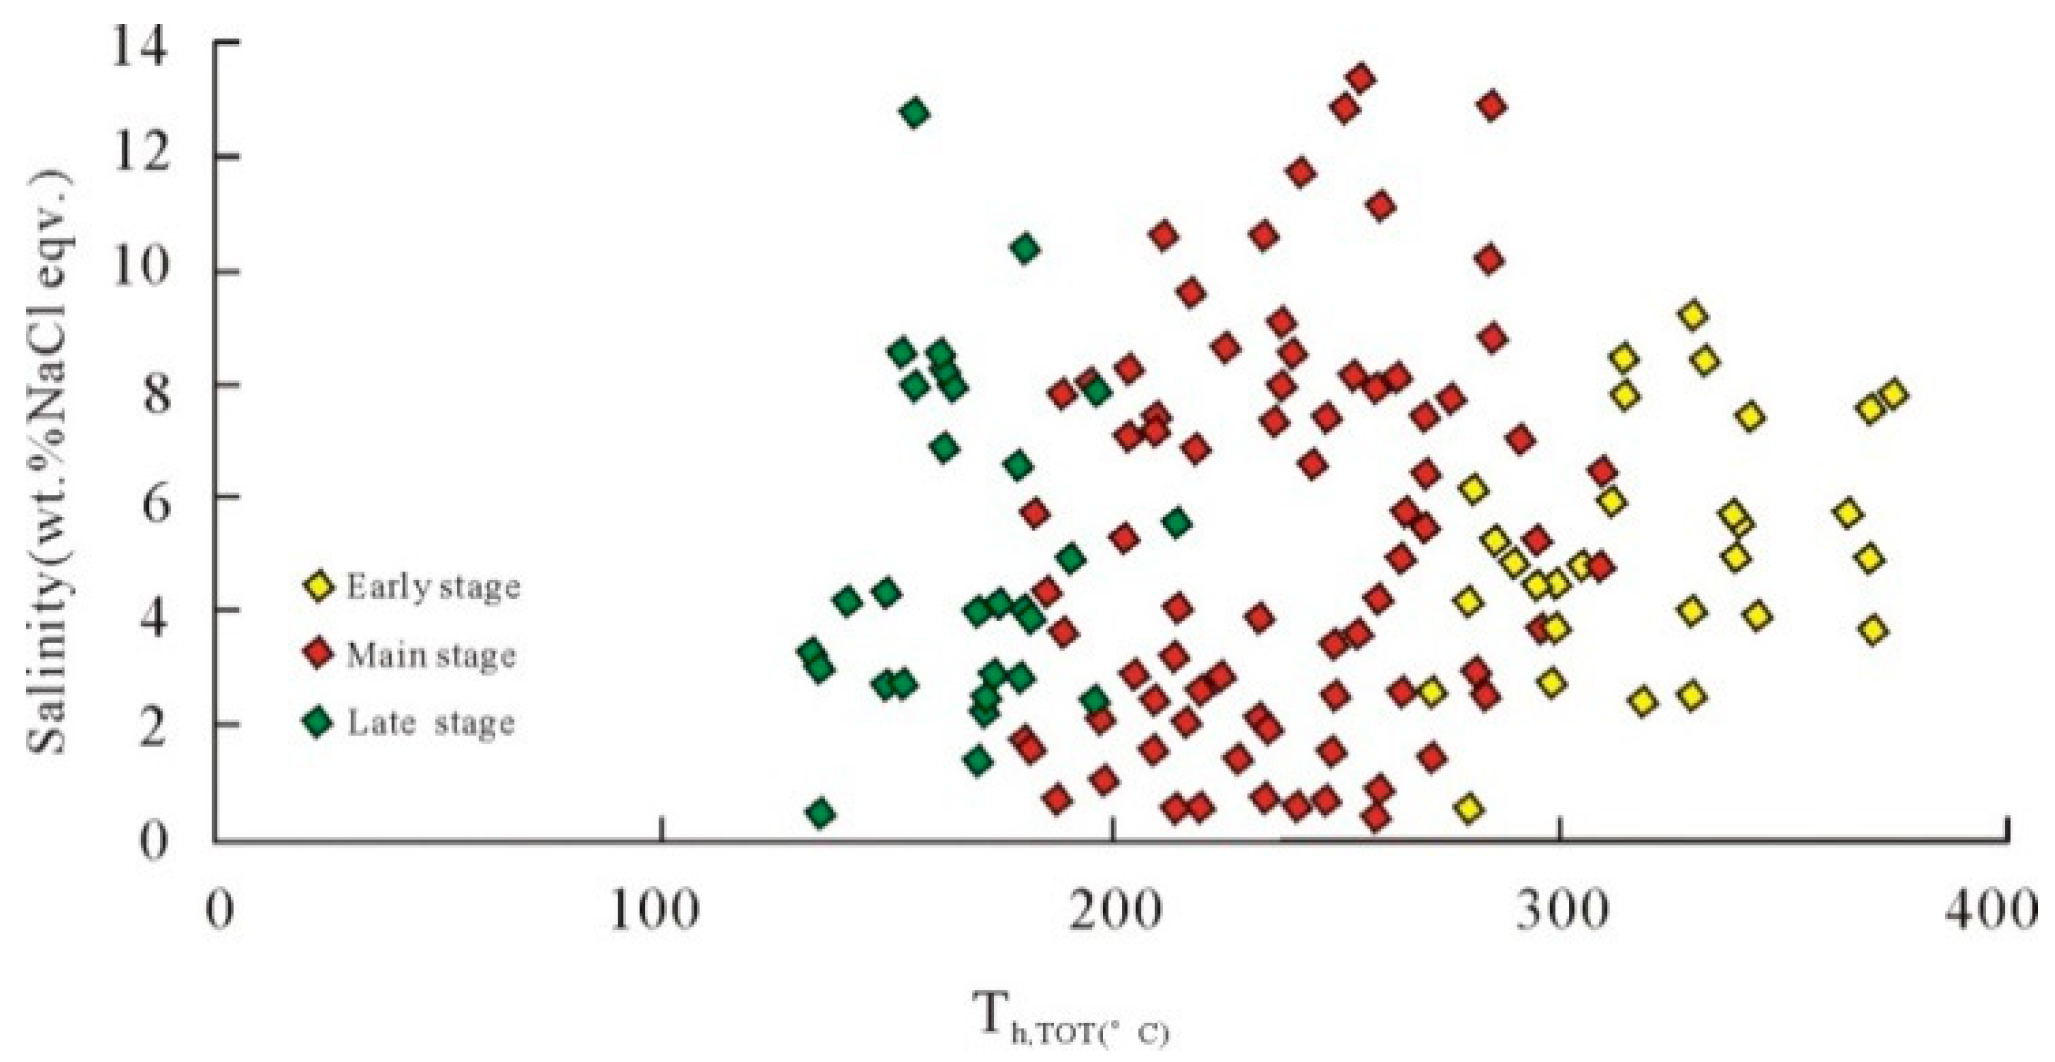
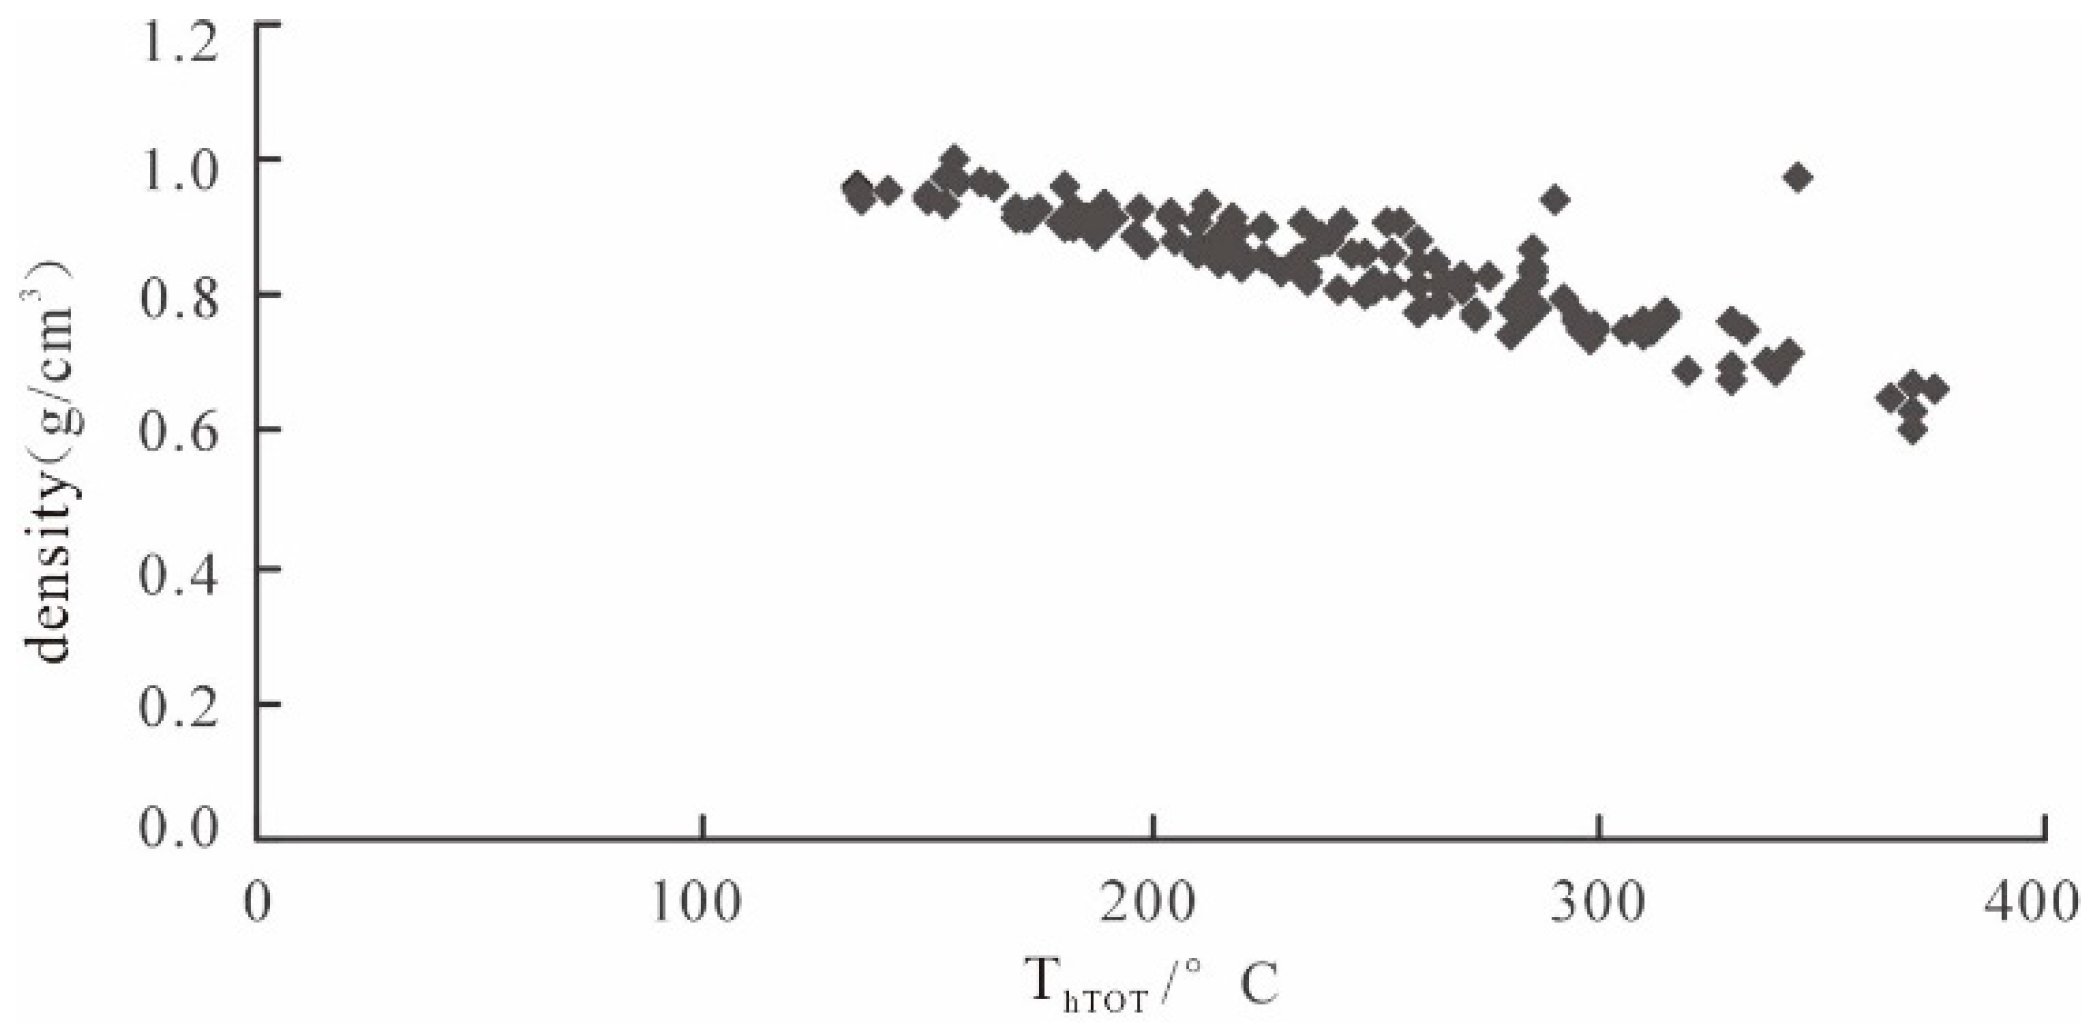
5.2. Microthermometry
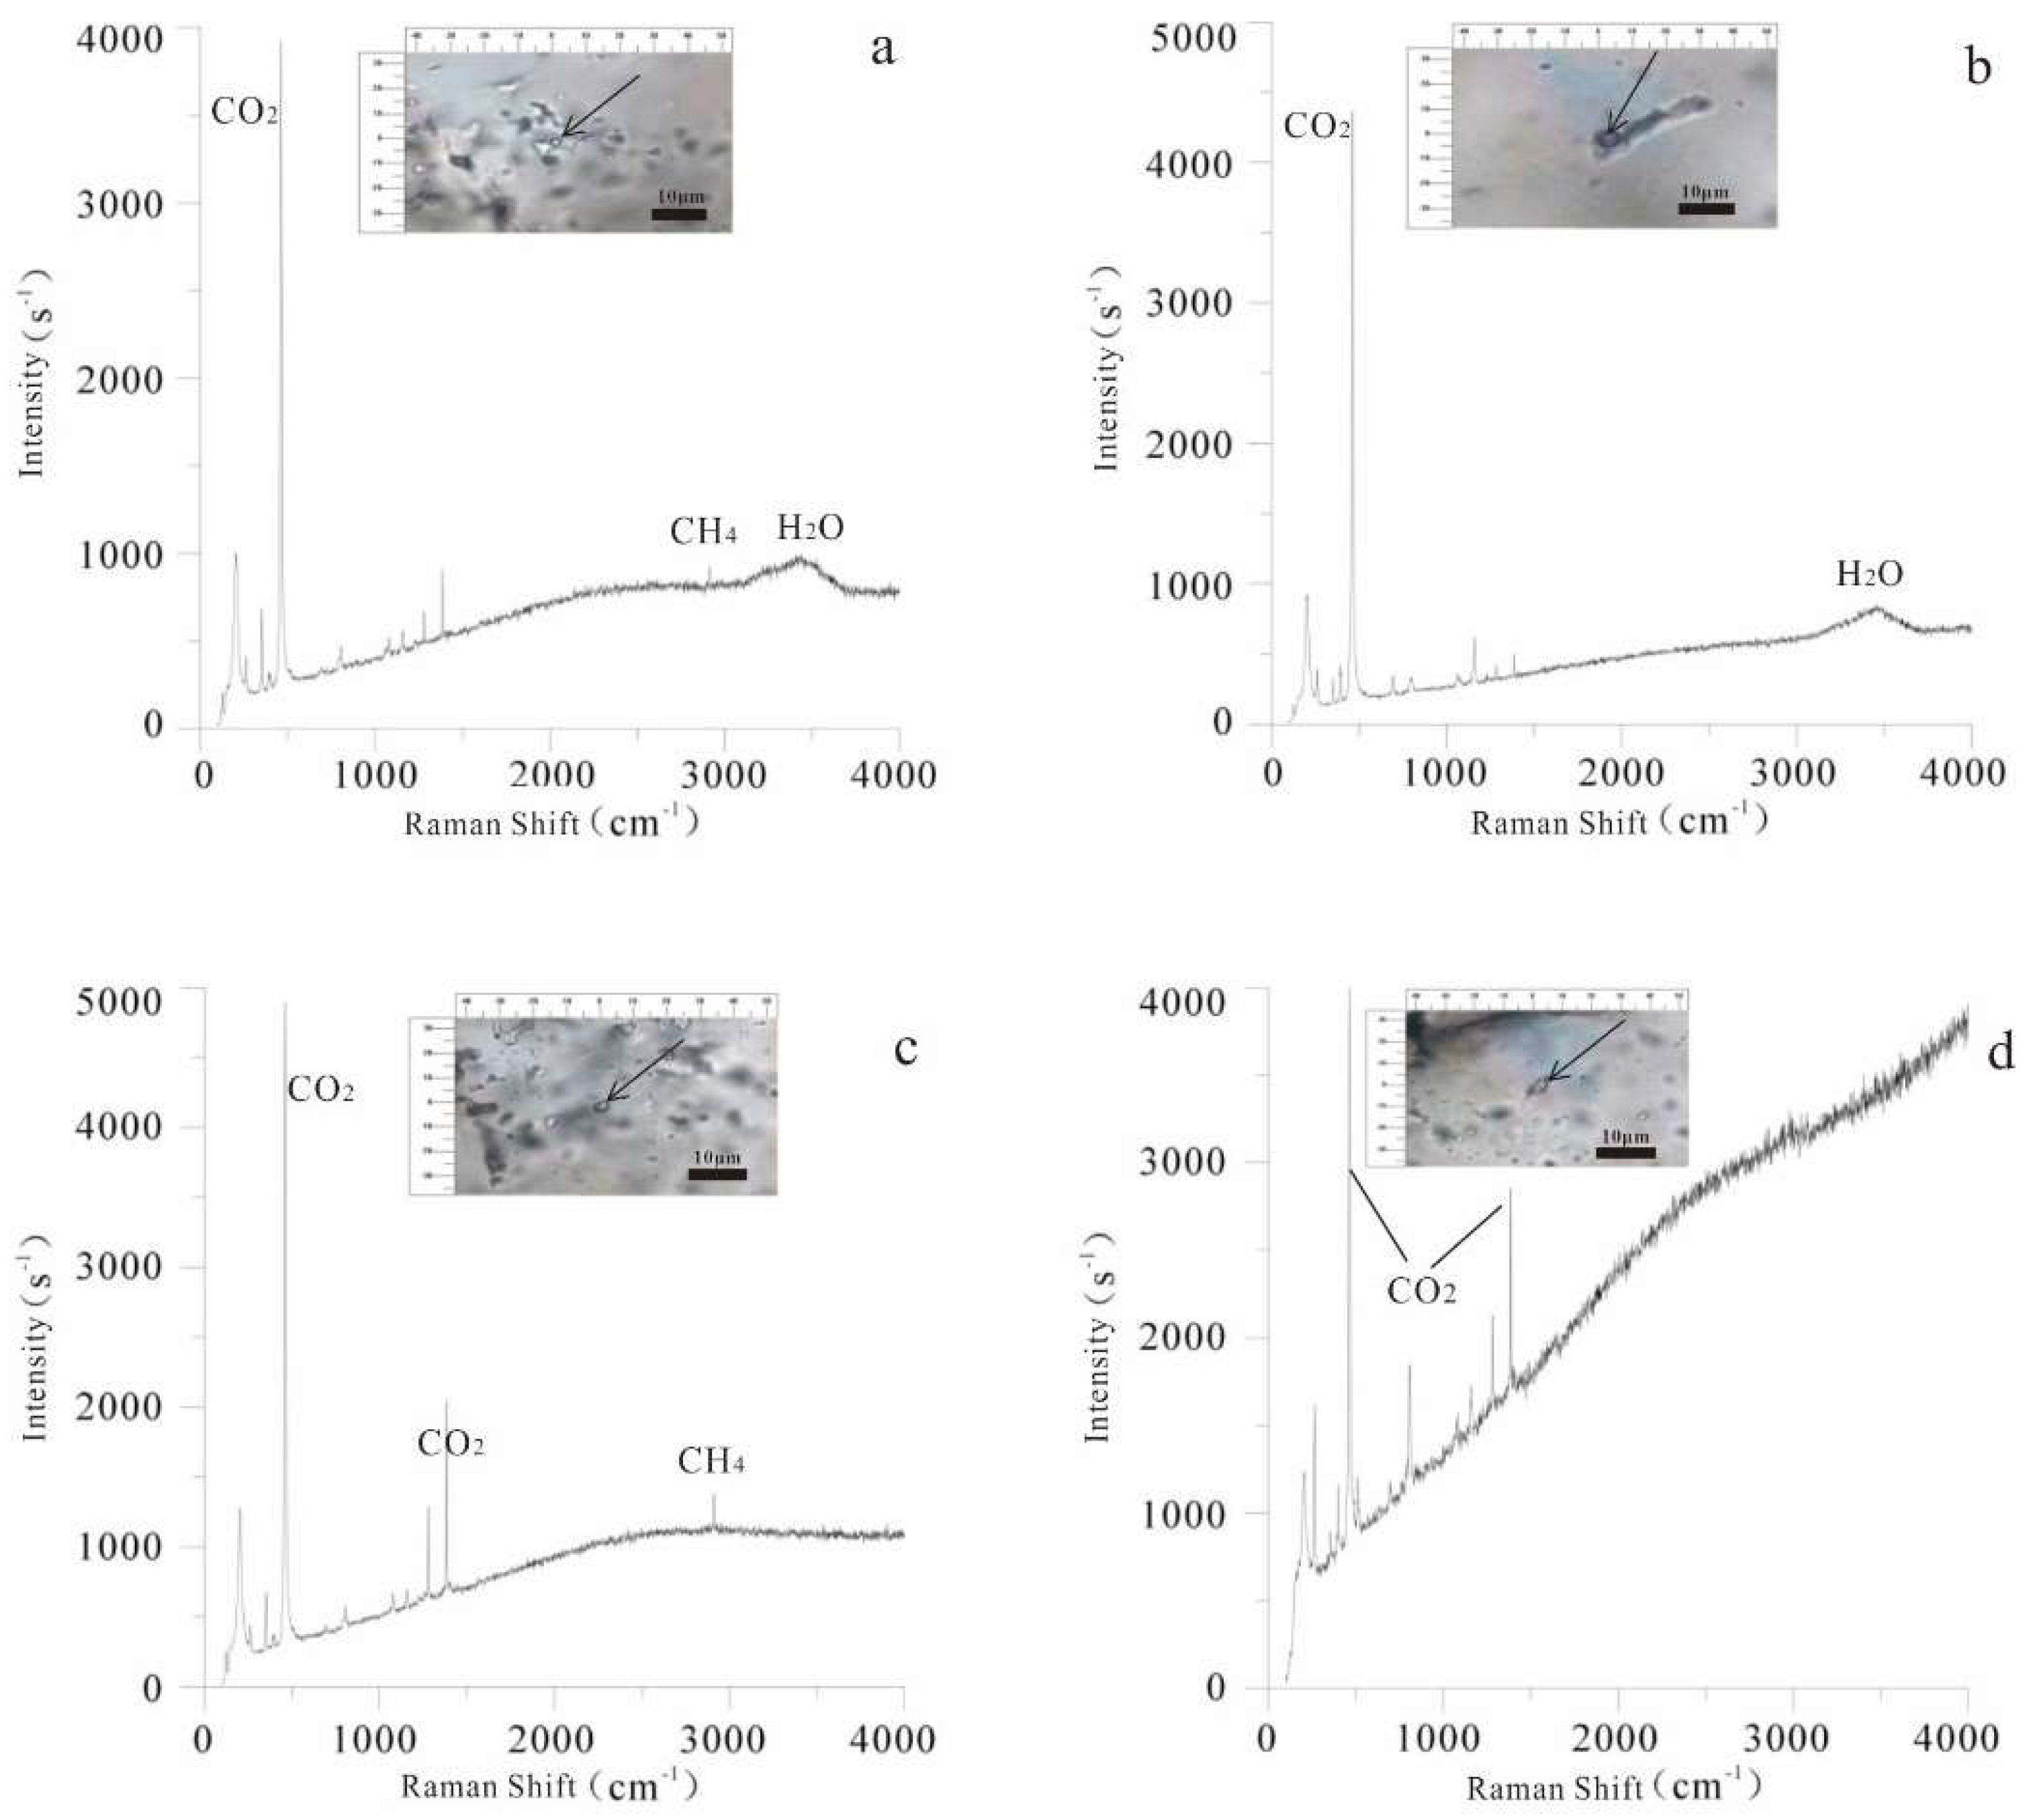
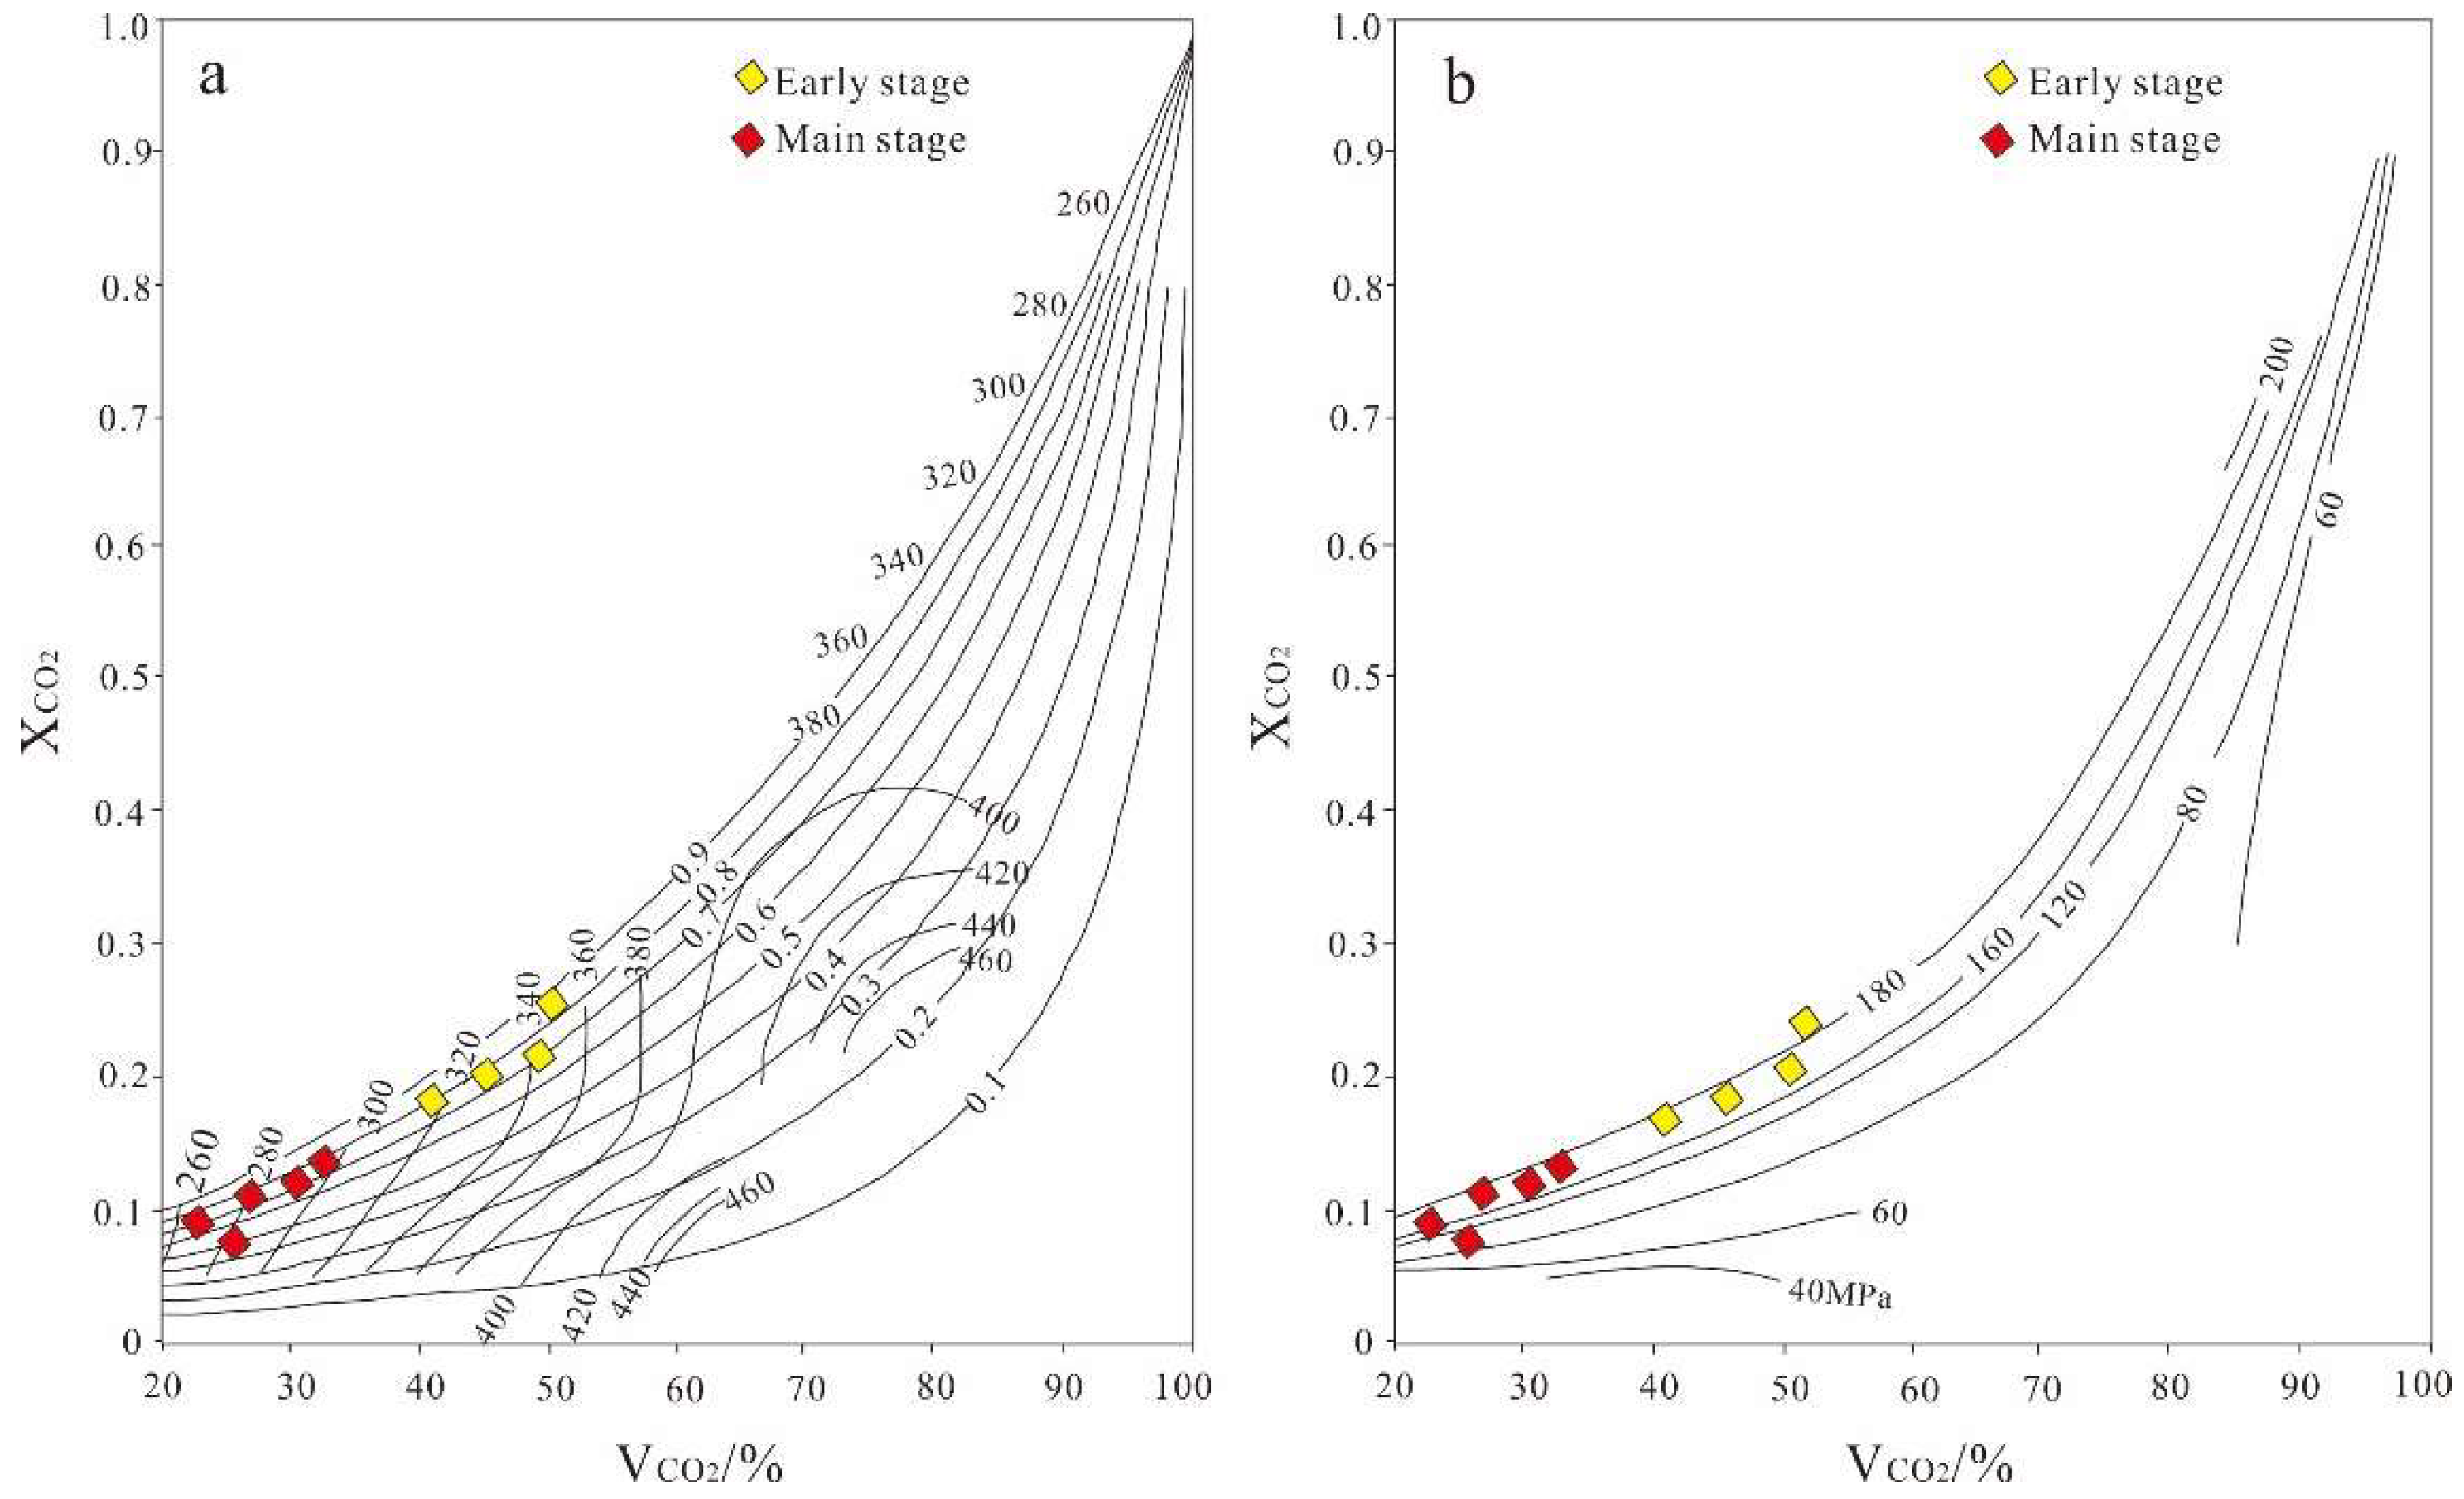
5.3. Fluid-Inclusion Composition
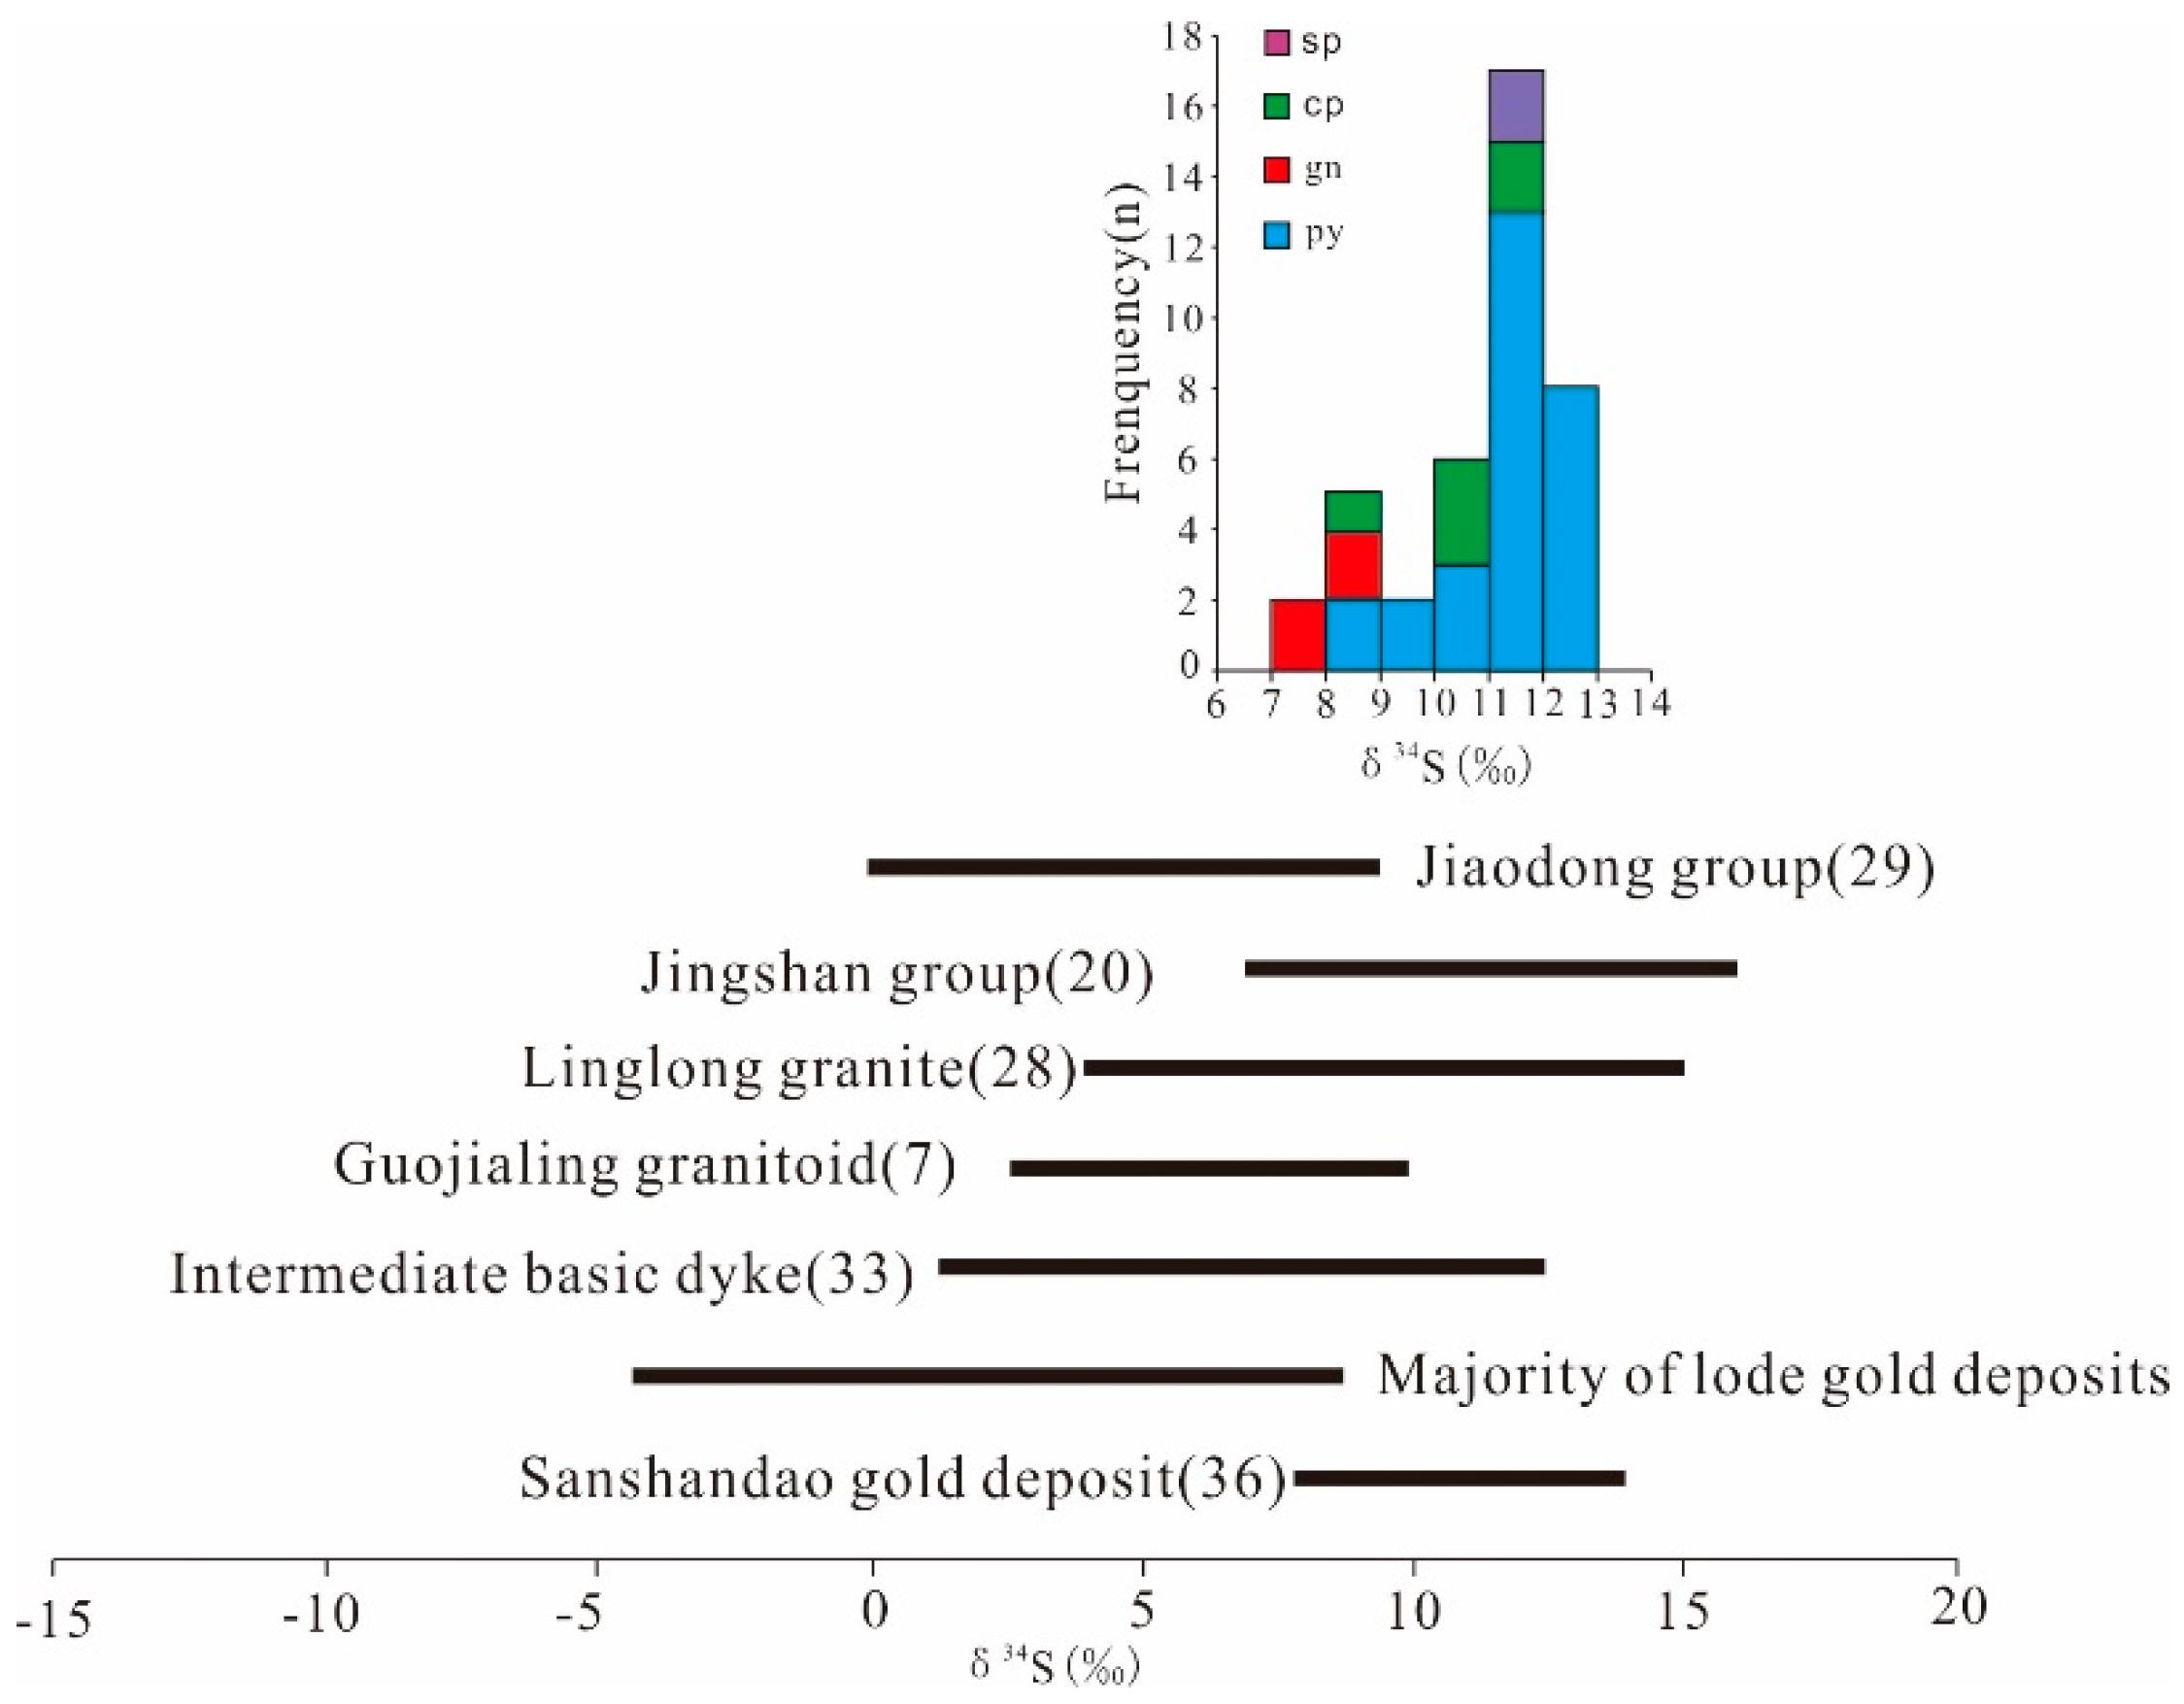
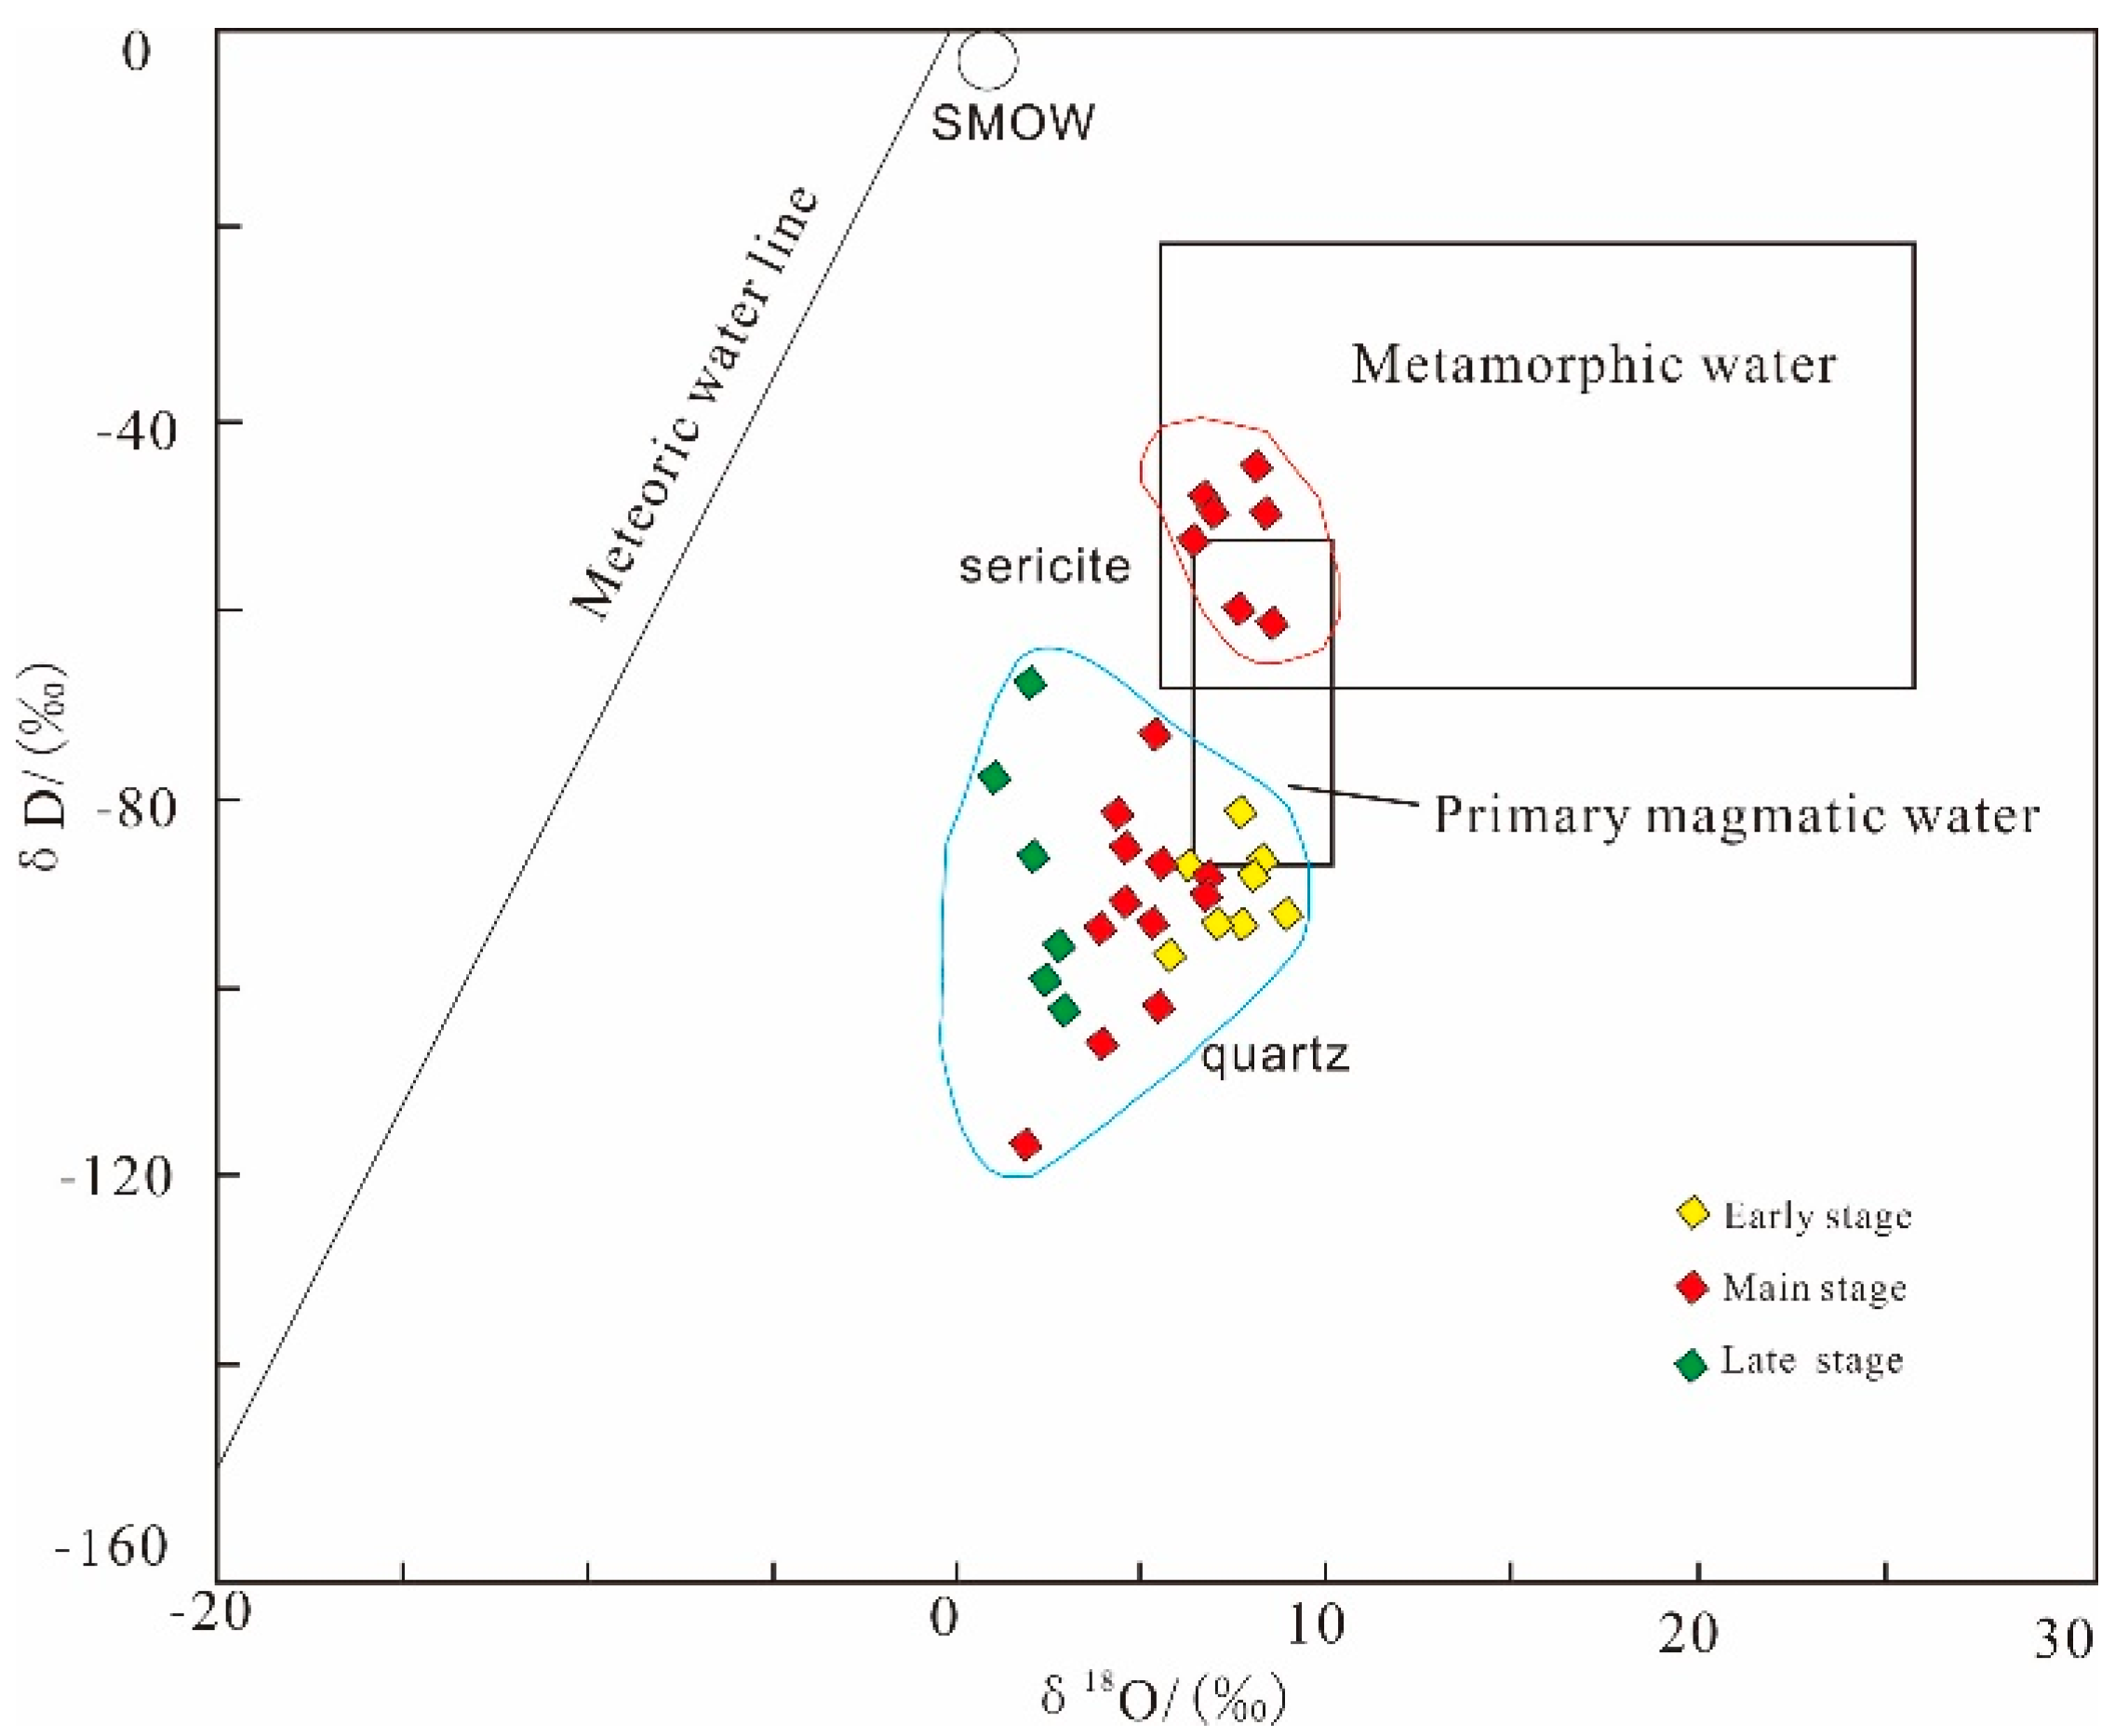
5.4. Isotope Composition
6. Discussion
6.1. Fluid Immiscibility in the Main Stage
6.2. Source and Evolution of Ore-Forming Fluids
6.2.1. Source of Ore-Forming Fluids
6.2.2. Evolution of Ore-Forming Fluids
6.3. Mechanisms of Gold Deposition
7. Conclusions
Author Contributions
Funding
Acknowledgments
Conflicts of Interest
References
- Deng, J.; Yang, L.Q.; Sun, Z.S.; Wang, J.P.; Wang, Q.F.; Xin, H.B.; Li, X.J. A metallogenic model of gold deposits of the Jiaodong granite green stone belt. Acta Geol. Sin. 2003, 77, 537–546. [Google Scholar]
- Deng, J.; Yang, L.Q.; Li, R.H.; Groves, D.I.; Santosh, M.; Wang, Z.L.; Sai, S.X.; Wang, S.R. Regional structural control on the distribution of world-class gold deposits: An overview from the Giant Jiaodong Gold Province, China. Geol. J. 2018. [Google Scholar] [CrossRef]
- Yang, L.Q.; Deng, J.; Wang, Q.F.; Zhou, Y.H. Coupling effects on gold mineralization of deep and shallow structures in the northwestern Jiaodong Peninsula, eastern China. Acta Geol. Sin. 2006, 80, 400–411. [Google Scholar]
- Yang, L.Q.; Dilek, Y.; Wang, Z.L.; Weinberg, R.F.; Liu, Y. Late Jurassic, High Ba-Sr Linglong granites in the Jiaodong Peninsula, East China: Lower crustal melting products in the Eastern North China Craton. Geol. Mag. 2018, 155, 1040–1062. [Google Scholar] [CrossRef]
- Groves, D.I.; Santosh, M. The giant Jiaodong gold province: The key to a unified model for orogenic gold deposits? Geosci. Front. 2016, 7, 409–417. [Google Scholar] [CrossRef] [Green Version]
- Goldfarb, R.J.; Santosh, M. The dilemma of the Jiaodong gold deposits: Are they unique? Geosci. Front. 2014, 5, 139–153. [Google Scholar] [CrossRef] [Green Version]
- Goldfarb, R.J.; Hart, C.J.R.; Davis, G.; Groves, D.I. East Asian gold–deciphering the anomaly of Phanerozoic gold in Precambrian cratons. Econ. Geol. 2007, 102, 341–346. [Google Scholar] [CrossRef]
- Yang, L.Q.; Deng, J.; Guo, R.P.; Guo, L.N.; Wang, Z.L.; Chen, B.H.; Wang, X.D. World-class Xincheng gold deposit: An example from the giant Jiaodong Gold Province. Geosci. Front. 2016, 7, 419–430. [Google Scholar] [CrossRef]
- Wang, Z.L.; Yang, L.Q.; Deng, J.; Santosh, M.; Zhang, H.F.; Liu, Y.; Li, R.H.; Huang, T.; Zheng, X.L.; Zhao, H. Gold-hosting high Ba-Sr granitoids in the Xincheng gold deposit, Jiaodong Peninsula, East China: Petrogenesis and tectonic setting. J. Asian Earth Sci. 2014, 95, 274–299. [Google Scholar] [CrossRef]
- Deng, J.; Liu, X.F.; Wang, Q.F.; Pan, R.G. Origin of the Jiaodong-type Xinli gold deposit, Jiaodong Peninsula, China: Constraints from fluid inclusion and C–D–O–S–Sr isotope compositions. Ore Geol. Rev. 2014, 65, 674–686. [Google Scholar] [CrossRef]
- Qiu, Y.M.; Groves, D.I.; McNaughton, N.J.; Wang, L.Z.; Zhou, T.H. Nature, age and tectonic setting of granitoid-hosted orogenic gold deposits of the Jiaodong Peninsula, eastern North China craton, China. Miner. Depos. 2002, 37, 283–305. [Google Scholar] [CrossRef]
- Yang, L.Q.; Deng, J.; Wang, Z.L.; Zhang, L.; Guo, L.N.; Song, M.C.; Zheng, X.L. Mesozoic gold metallogenic system of the Jiaodong gold province, eastern China. Acta Petrol. Sin. 2014, 30, 2447–2467, (In Chinese with English Abstract). [Google Scholar]
- Yang, L.Q.; Guo, L.N.; Wang, Z.L.; Zhao, R.X.; Song, M.C.; Zheng, X.L. Timing and mechanism of gold mineralization at the Wang’ershan gold deposit, Jiaodong Peninsula, eastern China. Ore Geol. Rev. 2017, 88, 491–510. [Google Scholar] [CrossRef]
- Deng, J.; Wang, Q.F.; Wan, L.; Yang, L.Q.; Gong, Q.J.; Zhao, J.; Liu, H. Self-similar fractal analysis of gold mineralization of Dayingezhuang disseminated-veinlet deposit in Jiaodong gold province, China. J. Geochem. Explor. 2009, 102, 95–102. [Google Scholar] [CrossRef]
- Deng, J.; Yang, L.Q.; Gao, B.F.; Sun, Z.S.; Guo, C.Y.; Wang, Q.F.; Wang, J.P. Fluid evolution and metallogenic dynamics during tectonic regime transition: Example from the Jiapigou gold belt in Northeast China. Resour. Geol. 2009, 59, 140–152. [Google Scholar] [CrossRef]
- Fan, H.R.; Zhai, M.G.; Xie, Y.H.; Yang, J.H. Ore-forming fluids associated with granite hosted gold mineralization at the Sanshandao deposit, Jiaodong gold province, China. Miner. Depos. 2003, 38, 739–750. [Google Scholar] [CrossRef]
- Li, S.R.; Santosh, M. Metallogeny and craton destruction: Records from the North China Craton. Ore Geol. Rev. 2014, 56, 376–414. [Google Scholar] [CrossRef]
- Tan, J.; Wei, J.H.; Audétat, A.; Pettke, T. Source of metals in the Guocheng gold deposit, Jiaodong Peninsula, North China Craton: Link to early Cretaceous mafic magmatism originating from Paleoproterozoic metasomatized lithospheric mantle. Ore Geol. Rev. 2012, 48, 70–87. [Google Scholar] [CrossRef]
- Wang, L.; Sun, F.Y.; Wang, J.L. Geochemical features of ore-forming fluids of the Jinling gold deposit, Shandong Province. Acta Petrol. Sin. 2010, 26, 3735–3744, (In Chinese with English Abstract). [Google Scholar]
- Yang, L.Q.; Deng, J.; Goldfarb, R.J.; Zhang, J.; Gao, B.F.; Wang, Z.L. 40Ar/39Ar geochronological constraints on the formation of the Dayingezhuang gold deposit: New implications for timing and duration of hydrothermal activity in the Jiaodong gold province, China. Gonwana Res. 2014, 25, 1469–1483. [Google Scholar] [CrossRef] [Green Version]
- Zhang, L.; Li, G.W.; Zheng, X.L.; An, P.; Chen, B.Y. Tectonic-thermal history of Sanshandao gold deposit in eastern Jiaodong: Constraints of 40Ar/39Ar and fission track chronology. Acta Petrol. Sin. 2016, 32, 2465–2476, (In Chinese with English Abstract). [Google Scholar]
- Zhai, M.G.; Yang, J.H.; Liu, W.J. Large clusters of gold deposits and large-scale metallogenesis in the Jiaodong Peninsula of Eastern China. Sci. China Ser. D 2001, 44, 758–768. [Google Scholar] [CrossRef]
- Groves, D.I.; Goldfarb, R.J.; Robert, F.; Hart, C.J.R. Gold deposits in metamorphic belts: Overview of current understanding, outstanding problems, future research, and exploration significance. Econ. Geol. 2003, 98, 1–29. [Google Scholar]
- Mao, J.W.; Wang, Y.T.; Li, H.M.; Pirajno, F.; Zhang, C.Q.; Wang, R.T. The relationship of mantle-derived fluids to gold metallogenesis in the Jiaodong Peninsula: Evidence from D–O–C–S isotope systematics. Ore Geol. Rev. 2008, 33, 361–381. [Google Scholar] [CrossRef]
- Deng, J.; Wang, C.M.; Bagas, L.; Carranza, E.J.M.; Lu, Y.J. Cretaceous-Cenozoic tectonic history of the Jiaojia Fault and gold mineralization in the Jiaodong Peninsula, China: Constraints from zircon U-Pb, illite K-Ar and apatite fission track thermochronometry. Miner. Depos. 2015, 50, 987–1006. [Google Scholar] [CrossRef]
- Chen, G.Y.; Shao, W.; Sun, D.S. Genetic Mineralogy of Gold Deposits in Jiaodong Region with Emphasis on Gold Prospecting; Chongqing Publishing House: Chongqing, China, 1989; pp. 181–224, (In Chinese with English Abstract). [Google Scholar]
- Zhang, L.; Yang, L.Q.; Wang, Y.; Weinberg, R.F.; An, P.; Chen, B.Y. Thermochronologic constrains on the processes of formation and exhumation of the Xinli orogenic gold deposit, Jiaodong Peninsula, eastern China. Ore Geol. Rev. 2017, 81, 140–153. [Google Scholar] [CrossRef]
- Goldfarb, R.J.; Groves, D.I.; Gardoll, S. Orogenic gold and geological time: A synthesis. Ore Geol. Rev. 2001, 18, 1–75. [Google Scholar] [CrossRef]
- Deng, J.; Yuan, W.; Carranza, E.J.; Yang, L.; Wang, C.; Yang, L.; Hao, N. Geochronology and thermochronometry of the Jiapigou gold belt, northeastern China: New evidence for multiple episodes of mineralization. J. Asian Earth Sci. 2014, 89, 10–27. [Google Scholar] [CrossRef]
- Zhang, X.O.; Cawood, P.A.; Wilde, S.A.; Liu, R.Q.; Song, H.L.; Li, W.; Snee, L.W. Geology and timing of mineralization at the Cangshang gold deposit, north-western Jiaodong Peninsula, China. Miner. Depos. 2003, 38, 141–153. [Google Scholar] [CrossRef]
- Wang, Z.L.; Yang, L.Q.; Guo, L.N.; Marsh, E.; Wang, J.P.; Liu, Y.; Zhang, C.; Li, R.H.; Zhang, L.; Zheng, X.L.; et al. Fluid immiscibility and gold deposition in the Xincheng deposit, Jiaodong Peninsula, China: A fluid inclusion study. Ore Geol. Rev. 2015, 65, 701–717. [Google Scholar] [CrossRef]
- Yang, L.Q.; Deng, J.; Guo, L.N.; Li, J.L. Origin and evolution of ore fluid, and gold deposition processes at the giant Taishang gold deposit, Jiaodong Peninsula, eastern China. Ore Geol. Rev. 2016, 72, 585–602. [Google Scholar] [CrossRef]
- Deng, J.; Wang, Q.F.; Wan, L.; Liu, H.; Yang, L.Q.; Zhang, J. A mutifractal analysis of mineralization characteristics of the Dayinggezhuang disseminated-veinlet gold deposit in the Jiaodong gold province of China. Ore Geol. Rev. 2011, 40, 54–64. [Google Scholar] [CrossRef]
- Mao, J.W.; Li, H.M.; Wang, Y.T.; Zhang, C.Q.; Wang, R.T. The relationship between mantle-derived fluid and gold ore-formation in the Eastern Shandong Peninsula: Evidences from D–O–C–S isotopes. Acta Geol. Sin. 2005, 79, 839–857, (In Chinese with English Abstract). [Google Scholar]
- Brown, P.E. Fluid inclusion modeling for hydrothermal systems. Rev. Econ. Geol. 1998, 10, 151–171. [Google Scholar]
- Uemoto, T.; Ridely, J.; Mikucki, E.; Groves, D.I. Fluid chemical evolution as a factor in controlling the distribution of gold at the Archean Golden Crown lode gold deposit, Murchison Province, Western Australia. Econ. Geol. 2002, 97, 1227–1248. [Google Scholar] [CrossRef]
- Dugdale, A.L.; Hagemann, S.G. The Bronzewing lode gold deposit, eastern Australia: P–T–X evidence for fluid immiscibility caused by cyclic decompression in goldbearing quartz-veins. Chem. Geol. 2001, 173, 59–90. [Google Scholar] [CrossRef]
- Hagemann, S.G.; Luders, V. P–T–X conditions of hydrothermal fluids and precipitation mechanism of stibnite–gold mineralization at the Wiluna lode-gold deposits, Western Australia: Conventional and infrared microthermometric constraints. Mineral. Deposita 2003, 38, 936–952. [Google Scholar] [CrossRef]
- Hu, S.X. Petrology of Metasomatic Rocks and Implications for Ore Exploration; Science Press: Beijing, China, 2002; pp. 1–264. (In Chinese) [Google Scholar]
- Bodnar, R.J.; Vityk, M.O. Interpretation of microthermometric data for H2O-NaCl fluid inclusions. In Fluid Inclusions in Minerals: Methods and Applications; de Vivo, B., Frezzotti, M.L., Eds.; Verginia Tech: Blacksburg, VA, USA, 1994; pp. 117–130. [Google Scholar]
- Deng, J.; Liu, X.F.; Wang, Q.F.; Dilek, Y.; Liang, Y.Y. Isotopic Characterization and Petrogenetic Modeling of the Early Cretaceous Mafic Diking-Lithospheric Extension in the North China craton, eastern Asia. GSA Bull. 2017, 129, 1379–1407. [Google Scholar] [CrossRef]
- Faure, M.; Lin, W.; Monie, P.; Breton, N.L.; Poussineau, S.; Panis, D.; Deloule, E. Exhumation tectonics of the ultrahigh-pressure metamorphic rocks in the Qinling orogen in east China: New petrological–structural-radiometric insights from the Shandong Peninsula. Tectonics 2003, 22, 1018–1040. [Google Scholar] [CrossRef]
- Tang, J.; Zheng, Y.F.; Wu, Y.B.; Gong, B.; Zha, X.P.; Liu, X.M. Zircon u–pb age and geochemical constraints on the tectonic affinity of the Jiaodong terrane in the Sulu orogen, China. Precambrian Res. 2008, 161, 389–418. [Google Scholar] [CrossRef]
- Zhai, M.G.; Bian, A.G.; Zhao, T.P. The amalgamation of the supercontinent of north China craton at the end of Neo-archaean and its breakup during late Palaeoproterozoic and Mesoproterozoic. Sci. China Earth Sci. 2000, 43, 219–232. [Google Scholar] [CrossRef]
- Li, Q.L.; Chen, F.; Wang, X.L.; Li, X.H.; Li, C.F. Ultra-low procedural blank and the single-grain mica Rb–Sr isochron dating. Chin. Sci. Bull. 2005, 50, 2861–2865. [Google Scholar]
- Zhang, J.; Zhao, Z.F.; Zheng, Y.F.; Dai, M. Postcollisional magmatism: Geochemical constraints on the petrogenesis of Mesozoic granitoids in the Sulu orogen, China. Lithos 2010, 119, 512–536. [Google Scholar] [CrossRef]
- Yang, L.Q.; Deng, J.; Wang, Z.L.; Guo, L.N.; Li, R.H.; Groves, D.I.; Danyushevskiy, L.; Zhang, C.; Zheng, X.L.; Zhao, H. Relationships between gold and pyrite at the Xincheng gold deposit, Jiaodong Peninsula, China: Implications for gold source and deposition in a brittle epizonal environment. Econ. Geol. 2016, 111, 105–126. [Google Scholar] [CrossRef]
- Jiang, N.; Chen, J.; Guo, J.; Chang, G. In situ zircon U-Pb, oxygen and hafnium isotopic compositions of Jurassic granites from the North China craton: Evidence for Triassic subduction of continental crust and subsequent metamorphism-related 18O depletion. Lithos 2012, 142, 84–94. [Google Scholar] [CrossRef]
- Yang, L.Q.; Deng, J.; Wang, Z.L.; Zhang, L.; Goldfarb, R.J.; Yuan, W.M.; Weinberg, R.F.; Zhang, R.Z. Thermochronologic constraints on evolution of the Linglong Metamorphic Core Complex and implications for gold mineralization: A case study from the Xiadian gold deposit, Jiaodong Peninsula, eastern China. Ore Geol. Rev. 2016, 72, 165–178. [Google Scholar] [CrossRef]
- Liu, Y.; Deng, J.; Wang, Z.L.; Zhang, L.; Zhang, C.; Liu, X.D.; Zheng, X.L.; Wang, X.D. Zircon U-Pb age, Lu-Hf isotopes and petrogeochemistry of the monzogranites from Xincheng gold deposit, northwestern Jiaodong Peninsula, China. Acta Petrol. Sin. 2014, 30, 2559–2573, (In Chinese with English Abstract). [Google Scholar]
- Hou, M.L.; Jiang, Y.H.; Jiang, S.Y.; Ling, H.F.; Zhao, K.D. Contrasting origins of late Mesozoic adakitic granitoids from the northwestern Jiaodong Peninsula, East China: Implications for crustal thickening to delamination. Geol. Mag. 2007, 144, 619–631. [Google Scholar] [CrossRef]
- Goss, S.C.; Wilde, S.A.; Wu, F.; Yang, J. The age, isotopic signature and significance of the youngest Mesozoic granitoids in the Jiaodong terrane, Shandong province, North China craton. Lithos 2010, 3, 309–326. [Google Scholar] [CrossRef]
- Yang, L.Q.; Deng, J.; Wang, Z.L. Ore-controlling structural pattern of Jiaodong gold deposits: Geological- geophysical integration constraints. In The Deep-Seated Structures of Earth in China; Chen, Y., Jin, Z., Shi, Y., Yang, W., Zhu, R., Eds.; Sciences Press: Beijing, China, 2014; pp. 1006–1030. [Google Scholar]
- Faure, M.; Lin, W.; Chen, Y. Is the Jurassic (Yanshanian) intraplate tectonics of North China due to westward indentation of the North China block? Terra Nova 2012, 24, 456–466. [Google Scholar] [CrossRef] [Green Version]
- Zhu, G.; Niu, M.L.; Xie, C.L.; Wang, Y.S. Sinistral to normal faulting along the Tan-Lu fault zone: Evidence for geodynamic switching of the East China continental margin. J. Geol. 2010, 118, 277–293. [Google Scholar] [CrossRef]
- Collins, P.L.F. Gas hydrates in CO2-bearing fluid inclusions and use freezing data for estimation of salinity. Econ. Geol. 1979, 74, 1435–1444. [Google Scholar] [CrossRef]
- Bakker, R.J.; Jansen, J.B.H. A mechanism for preferential H2O leakage from fluid inclusions in quartz, based on TEM observations. Contrib. Mineral. Petrol. 1994, 116, 7–20. [Google Scholar] [CrossRef]
- Brown, P.E.; Hagemann, S.G. MacFlincor and its application to fluids in Archaean lode-gold deposits. Geochim. Cosmochim. Acta 1995, 59, 3943–3952. [Google Scholar] [CrossRef]
- Liu, H.B.; Jin, G.S.; Li, J.J.; Han, J.; Zhang, J.F.; Zhang, J.; Zhong, F.W.; Guo, D.Q. Determination of stable isotope composition in uranium geological samples. World Nucl. Geosci. 2013, 3, 174–179. [Google Scholar]
- Roedder, E. Fluid inclusions. Rev. Mineral. 1984, 12, 1–664. [Google Scholar]
- Clayton, R.N.; O’Neil, J.R.; Mayeda, T.K. Oxygen isotope exchange between quartz and water. J. Geophys. Res. 1972, 77, 3057–3067. [Google Scholar] [CrossRef]
- Li, X.M. Studies and implications of the oxygen, hydrogen and carbon stable isotopes of the Sanshandao gold deposit, Shandong province. Contrib. Geol. Miner. Resour. Res. 1988, 3, 62–71. (In Chinese) [Google Scholar]
- Zhang, L.G.; Chen, Z.S.; Liu, J.X.; Yu, G.X.; Wang, B.C.; Xu, J.F.; Zheng, W.S. Water-Rock Exchange in Jiaojia Type Gold Deposit: Hydrogen and Oxygen Isotope Composition of Ore-forming Fluids. Miner. Depos. 1994, 13, 193–200. (In Chinese) [Google Scholar]
- Wang, Y.W.; Zhu, F.S.; Gong, R.T. Tectonic isotope geochemistry-Restudy of sulfur isotope in Jiaodong gold province. Gold 2002, 23, 1–16. (In Chinese) [Google Scholar]
- Huang, D.Y. Sulfur Isotope Study of Metallogenic Series of Jiaodong Gold Deposit. Miner. Depos. 1994, 13, 75–87. (In Chinese) [Google Scholar]
- Xavier, R.P.; Foster, R.P. Fluid evolution and chemical controls in the FazendaMaria Preta (FMP) gold deposit, Rio Itapicuru greenstone belt, Bahia, Brazil. Chem. Geol. 1999, 154, 133–154. [Google Scholar] [CrossRef]
- Rusk, B.G.; Reed, M.H.; Dilles, J.H. Fluid inclusion evidence for magmatic- hydrothermal fluid evolution in the porphyry copper–molybdenum deposit at butte, Montana. Econ. Geol. 2008, 103, 307–334. [Google Scholar] [CrossRef]
- Goldfarb, R.J.; Groves, D.I. Orogenic gold: Common or evolving fluid and metal sources through time. Lithos 2015, 233, 2–26. [Google Scholar] [CrossRef]
- Li, Y.P. The genesis of the Rushan gold deposits in east Shandong. Miner. Depos. 1992, 11, 165–172, (In Chinese with English Abstract). [Google Scholar]
- Luo, Z.K.; Miao, L.C. Granites and Gold Deposits in Zhaoyuan–Laizhou Area, Eastern Shandong Province; Metallurgical Industry Press: Beijing, China, 2002; pp. 84–117, (In Chinese with English Abstract). [Google Scholar]
- Ohmoto, H.; Rye, R. Isotopes of sulfur and carbon. In Geochemistry of Hydrothermal Ore Deposits, 2nd ed.; Bernes, H.L., Ed.; John Wiley and Sons: New York, NY, USA, 1979; pp. 509–567. [Google Scholar]
- Zhong, R.C.; Li, W.B. The multistage genesis of the giant Dongshengmiao Zn-Pb-Cu deposit in western Inner Mongolia, China: Syngenetic stratabound mineralization and metamorphic remobilization. Geosci. Front. 2016, 7, 529–542. [Google Scholar] [CrossRef] [Green Version]
- Zhu, Z.Y.; Jiang, S.Y.; Ryan, M.; Cook, N.J.; Yang, T.; Wang, M.L.; Ma Ciobanu, C.L. Iron isotope behavior during fluid/rock interaction in K-feldspar alteration zone—A model for pyrite in gold deposits from the Jiaodong Peninsula, East China. Geochim. Cosmochim. Acta 2018, 222, 94–116. [Google Scholar] [CrossRef]
- Sangster, D.F. Relative sulphur isotope abundances of ancient seas and strata-bound sulphide deposits. Proc. Geol. Assoc. Can. 1968, 17, 79–91. [Google Scholar]
- Goodfellow, W.D.; Lydon, J.W.; Turner, R. Geology and genesis of stratiform sediment-hosted (SEDEX) zinc-lead silver sulphide deposits. Geol. Assoc. Can. Spec. Pap. 1993, 40, 1–25. [Google Scholar]
- Huston, D.L. Stable isotopes and their significance for understanding the genesis of volcanic-hosted massive sulfide deposits: A review. Rev. Econ. Geol. 1999, 8, 157–179. [Google Scholar]
- Roedder, E. Fluid Inclusions as Samples of Ore Fluids. In Geochemistry of Hydrothermal Ore Deposits, 2nd ed.; Wiley: New York, NY, USA, 1979; pp. 684–737. [Google Scholar]
- Gui, F.; Wang, L.; Ma, F. Study on Fluid Inclusions in Sanshandao Gold Deposit. Gold 2014, 35, 27–32, (In Chinese with English Abstract). [Google Scholar]
- Shepherd, T.J.; Rankin, A.H.; Alderton, D.H.M. A Practical Guide to Fluid Inclusion Studies; Blackie & Son Limited: Glasgow, UK; London, UK, 1985; pp. 1–154. [Google Scholar]
- Anderson, M.R.; Rankin, A.H.; Spiro, B. Fluid mixing in the generation of isothermal gold mineralization in the Transvaal Sequence, Transvaal, South Africa. Eur. J. Mineral. 1992, 4, 933–948. [Google Scholar] [CrossRef]
- Yang, M.Z. The Geochemistry of Wallrock Alteration Zone of Gold Deposits-As Exemplified by Jiaodong Gold Deposits; Geological Publishing House: Beijing, China, 1998; pp. 1–120. (In Chinese) [Google Scholar]
- Li, H.Q.; Liu, J.Q.; Wei, L. Chronological Study of Fluid Inclusion for Hydrothermal Deposit and Its Geological Applications; Geological Publishing House: Beijing, China, 1993; pp. 1–126. (In Chinese) [Google Scholar]
- Deng, J.; Wang, Q.F. Gold mineralization in China: Metallogenic provinces, deposit types and tectonic framework. Gondwana Res. 2016, 36, 219–274. [Google Scholar] [CrossRef]
- Zhai, D.G.; Liu, J.J.; Wang, J.P.; Yang, Y.Q.; Liu, X.W.; Wang, G.W.; Liu, Z.J.; Wang, X.L.; Zhang, Q.B. Characteristics of melt–fluid inclusions and sulfur isotopic compositions of the Hashitu molybdenum deposit, Inner Mongolia. Earth Sci. J. China Univ. Geosci. 2012, 37, 1279–1290, (In Chinese with English Abstract). [Google Scholar]
- Yang, L.Y.; Yang, L.Q.; Yuan, W.M.; Zhang, C.; Zhao, K.; Yu, H.J. Origin and evolution of ore fluid for orogenic gold traced by D-O isotopes: A case from the Jiapigou gold belt, China. Acta Petrol. Sin. 2013, 29, 4025–4035, (In Chinese with English Abstract). [Google Scholar]
- Seward, T.M. Thio complexes of gold and the transport of gold in hydrothermal ore solutions. Geochim. Cosmochim. Acta 1973, 37, 379–399. [Google Scholar] [CrossRef]
- Seward, T.M. The Hydrothermal Geochemistry of Gold, Gold Metallogeny and Exploration; Springer: New York, NY, USA, 1990; pp. 37–62. [Google Scholar]
- Hayashi, K.I.; Ohmoto, H. Solubility of gold in NaCl- and H2S-bearing aqueous olutions at 250–350 °C. Geochim. Cosmochim. Acta 1991, 55, 2111–2126. [Google Scholar] [CrossRef]
- Gammons, C.H.; Williams-Jones, A.E.; Yu, Y. New data on the stability of gold I) chloride complexes at 300 °C. Mineral. Mag. A 1994, 58, 309–310. [Google Scholar] [CrossRef]
- Benning, L.G.; Seward, T.M. Hydrosulphide complexing of gold (I) in hydrothermal solutions from 150 to 500 °C and 500 to 1500 bars. Geochim. Cosmochim. Acta 1996, 60, 849–1871. [Google Scholar] [CrossRef]
- Yang, L.Q.; Badal, J. Mirror symmetry of the crust in the oil/gas region of Shengli, China. J. Asian Earth Sci. 2013, 78, 327–344. [Google Scholar] [CrossRef]
- Cox, S.F. Faulting processes at high uid pressures: An example of fault valve behaviour from the Wattle Gully Fault, Victoria, Australia. J. Geophys. Res. 1995, 100, 12841–12859. [Google Scholar] [CrossRef]
- Sibson, R.H.; Robert, F.; Poulsen, K.H. High angle reverse faults, uid-pressure cycling, and mesothermal gold–quartz deposits. Geology 1988, 16, 551–555. [Google Scholar] [CrossRef]
- Naden, J.; Shepherd, T.J. Role of methane and carbon dioxide in gold depositions. Nature 1989, 342, 793–795. [Google Scholar] [CrossRef]
- Cox, S.F.; Sun, S.S.; Etheridge, M.A.; Wall, V.J.; Potter, T.F. Structural and geochemical controls on the development of turbidite-hosted gold quartz vein deposits, Wattle Gully mine, central Victoria, Australia. Econ. Geol. 1995, 90, 1722–1746. [Google Scholar] [CrossRef]
- Mikucki, E.J. Hydrothermal transport and depositional processes in Archean lode gold systems: A review. Ore Geol. Rev. 1998, 13, 307–321. [Google Scholar] [CrossRef]
- Wilkinson, J.J.; Johnston, J.D. Pressure fluctuations, phase separation, and gold precipitation during seismic fracture propagation. Geology 1996, 24, 395–398. [Google Scholar] [CrossRef]
- Yang, L.Q.; Deng, J.; Guo, C.Y.; Zhang, J.; Jiang, S.Q.; Gao, B.F.; Gong, Q.J.; Wang, Q.F. Ore-forming fluid characteristics of the Dayingezhuang gold deposit, Jiaodong gold province, China. Resour. Geol. 2009, 59, 182–195. [Google Scholar] [CrossRef]
- Qiu, K.F.; Marsh, E.; Yu, H.C.; Pfaff, K.; Gulbransen, C.; Gou, Z.Y.; Li, N. Fluid and metal sources of the Wenquan porphyry molybdenum deposit, Western Qinling, NW China. Ore Geol. Rev. 2017, 86, 459–473. [Google Scholar] [CrossRef]
- Qiu, K.F.; Deng, J.; Taylor, R.D.; Song, K.R.; Song, Y.H.; Li, Q.Z.; Goldfarb, R.J. Paleozoic magmatism and porphyry Cu-mineralization in an evolving tectonic setting in the North Qilian Orogenic Belt, NW China. J. Asian Earth Sci. 2016, 122, 20–40. [Google Scholar] [CrossRef]
- Yang, Q.Y.; Santosh, M.; Shen, J.F.; Li, S.R. Juvenile vs. recycled crust in NE China: Zircon U–Pb geochronology, Hf isotope and an integrated model for Mesozoic gold mineralization in the Jiaodong Peninsula. Gondwana Res. 2014, 25, 1445–1468. [Google Scholar] [CrossRef]
- Yang, L.Q.; Deng, J.; Qiu, K.F.; Ji, X.Z.; Santosh, M.; Song, K.R.; Song, Y.H.; Geng, J.Z.; Zhang, C.; Hua, B. Magma mixing and crust mantle interaction in the Triassic monzogranites of Bikou Terrane, central China: Constraints from petrology, geochemistry, and zircon U–Pb–Hf isotopic systematic. J. Asian Earth Sci. 2015, 98, 320–341. [Google Scholar] [CrossRef]
- Qiu, K.F.; Taylor, R.D.; Song, Y.H.; Yu, H.C.; Song, K.R.; Li, N. Geologic and geochemical insights into the formation of the Taiyangshan porphyry copper–molybdenum deposit, Western Qinling Orogenic Belt, China. Gondwana Res. 2016, 35, 40–58. [Google Scholar] [CrossRef]
- Yang, L.Q.; Deng, J.; Dilek, Y.; Qiu, K.F.; Ji, X.Z.; Li, N.; Taylor, R.D.; Yu, J.Y. Structure, Geochronology, and Petrogenesis of the Late Triassic Puziba Granitoid Dikes in the Mianlue Suture Zone, Qinling Orogen, China. GSA Bulletin 2015, 127, 1831–1854. [Google Scholar] [CrossRef]
- Qiu, K.F.; Deng, J. Petrogenesis of granitoids in the Dewulu skarn copper deposit: implications for the evolution of the Paleotethys ocean and mineralization in Western Qinling, China. Ore Geol. Rev. 2017, 90, 1078–1098. [Google Scholar] [CrossRef]
- Groves, D.I.; Phillips, G.; Ho, S.E.; Houstoun, S.M. The nature, genesis and regional controls of gold mineralization in Archaean greenstone belts of the Western Australian Shield; a brief review. S. Afr. J. Geol. 1985, 88, 135–148. [Google Scholar]
- Qiu, K.F.; Song, K.R.; Song, Y.H. Magmatic-hydrothermal fluid evolution of the Wenquan porphyry molybdenum deposit in the north margin of the Western Qinling, China. Acta Petrol. Sin. 2015, 31, 3391–3404, (In Chinese with English Abstract). [Google Scholar]
- Schwartz, M.O. Determining phase volumes of mixed CO2-H2O inclusions using microthermetric measurements. Miner. Depos. 1989, 24, 43–47. [Google Scholar] [CrossRef]


| Sample ID | Depth (m) | Mineral | Sample | Depth (m) | Mineral |
|---|---|---|---|---|---|
| SSD600C | −600 | Quartz | SSD28505 | −285 | Quartz |
| SSD51001 | −510 | Quartz | SSD25508 | −255 | Quartz |
| SSD49501 | −495 | Quartz | SSD25505 | −255 | Quartz |
| SSD39006 | −390 | Quartz | SSD19504 | −195 | Quartz |
| SSD37501 | −375 | Quartz | SSD15003 | −150 | Quartz |
| SSD33004 | −330 | Quartz | SSD-02 | 0 | Quartz |
| Stage | Sample | Type | TmCO2 (°C) | Tmclath (°C) | Tmice (°C) | ThCO2 (°C) | Thtot (°C) | Salinity (wt % NaCl eqv.) | Bulk Density (g/cm3) | CO2 Density (g/cm3) |
|---|---|---|---|---|---|---|---|---|---|---|
| early | SSD28505 | Ⅱ | from –56.9 to –56.4 (n = 19) | 7.4–7.7 (n = 23) | 27.4–31.2 (n = 9) | 280–400 (n = 22) | 0.35–10.4 (n = 23) | 0.61–1.07 (n = 12) | 0.52–0.93 (n = 6) | |
| SSD-02 | Ⅱ | |||||||||
| SSD33004 | Ⅱ | |||||||||
| SSD19504 | Ⅱ | |||||||||
| main | SSD51001 | Ⅲ | form –7.5 to –3.5 (n = 13) | 210–300 (n = 28) | 5.7–11.1 (n = 13) | 0.77–0.94 (n = 22) | ||||
| SSD49501 | Ⅱ | from –59.3 to –56.6 (n = 25) | 7.3–8.0 (n = 31) | 22–31.2 (n = 11) | 220–320 (n = 32) | 2.2–13.33 (n = 31) | 0.7–0.98 (n = 25) | 0.64–0.90 (n = 6) | ||
| SSD39006 | Ⅱ | |||||||||
| SSD25505 | Ⅰ | from –57.6 to –56.4 (n = 9) | 24.3–28.4 (n = 8) | 0.52–0.84 (n = 4) | ||||||
| late | SSD15003 | Ⅲ | from –3.5 to 0.0 (n = 33) | 100–230 (n = 68) | 0.1–8.5 (n = 26) | 0.82–1 (n = 27) | ||||
| SSD25508 | Ⅲ | |||||||||
| SSD600C | Ⅲ |
| Stage | Sample | Mineral | δDV-SMOW (‰) | δDwater | δ18Omineral (‰) SMOW | δ18Owater (‰) SMOW | T (°C) | Reference |
|---|---|---|---|---|---|---|---|---|
| early | SSD28505 | quartz | −100 | 13.3 | 4.9 | 315 | This study | |
| SSD02 | quartz | −86 | 13.5 | 9.4 | 350 | This study | ||
| quartz | 14.0 | 7.1 | 320 | [62] | ||||
| quartz | 15.0 | 7.0 | 290 | |||||
| quartz | 18.8 | 7.5 | 220 | |||||
| main | sericite | −52 | −36 | 10.7 | 7.6 | 250 | [35] | |
| sericite | −48 | −32 | 11.7 | 8.6 | 250 | |||
| sericite | −52 | −36 | 12.0 | 8.9 | 250 | |||
| sericite | −53 | −37 | 9.7 | 6.6 | 250 | |||
| sericite | −50 | −33 | 10.9 | 7.8 | 250 | |||
| sericite | −67 | −51 | 11.0 | 7.9 | 250 | |||
| quartz | −92 | 12.5 | 4.1 | 280 | [62] | |||
| quartz | −72 | 12.8 | 4.8 | 290 | ||||
| quartz | −62 | 14.3 | 6.9 | 300 | [63] | |||
| quartz | −71 | 14.7 | 5.3 | 250 | ||||
| SSD600H | quartz | −65 | 13.2 | 4.7 | 284 | This study | ||
| SSD51001 | quartz | −95 | 13.6 | 5.5 | 272 | |||
| SSD49501 | quartz | −86 | 13.9 | 5.9 | 258 | |||
| SSD39006 | quartz | −85 | 13.9 | 5.2 | 255 | |||
| SSD39007 | quartz | −84 | 12.6 | 4.2 | 250 | |||
| SSD25505 | quartz | −94 | 12.8 | 4.4 | 247 | |||
| late | quartz | −92 | 13.4 | 2.5 | 220 | [63] | ||
| quartz | −70 | 11.1 | 1.4 | 250 | [62] | |||
| SSD15003 | quartz | −76 | 13.5 | 2.6 | 200 | This study | ||
| SSD25508 | quartz | −99 | 13.5 | 1.2 | 177 |
| Mineral | δ34S (‰) | Reference | Mineral | δ34S (‰) | Reference |
|---|---|---|---|---|---|
| Py | 11.1 | This study | Gn | 7.9 | [64] |
| Py | 9.7 | Sp | 11.4 | ||
| Py | 11.5 | Sp | 11.1 | ||
| Gn | 7.8 | Py | 11.8 | ||
| Py | 11.8 | Py | 11.6 | ||
| Py | 11.0 | Py | 11.1 | ||
| Py | 11.0 | Py | 10.5 | ||
| Py | 10.7 | Py | 10.4 | ||
| Py | 11.8 | [63] | Cp | 8.3 | [65] |
| Py | 12.6 | Py | 9.5 | ||
| Py | 12.6 | Py | 12.0 | [35] | |
| Py | 12.6 | Py | 12.0 | ||
| Cp | 10.1 | Py | 11.7 | ||
| Cp | 10.7 | Py | 11.9 | ||
| Cp | 10.5 | Py | 11.5 | ||
| Py | 11.3 | [64] | Py | 12.6 | [65] |
| Cp | 11.5 | Py | 12.5 | ||
| Cp | 11.4 | Py | 12.1 |
© 2019 by the authors. Licensee MDPI, Basel, Switzerland. This article is an open access article distributed under the terms and conditions of the Creative Commons Attribution (CC BY) license (http://creativecommons.org/licenses/by/4.0/).
Share and Cite
Liu, Y.; Yang, L.; Wang, S.; Liu, X.; Wang, H.; Li, D.; Wei, P.; Cheng, W.; Chen, B. Origin and Evolution of Ore-Forming Fluid and Gold-Deposition Processes at the Sanshandao Gold Deposit, Jiaodong Peninsula, Eastern China. Minerals 2019, 9, 189. https://doi.org/10.3390/min9030189
Liu Y, Yang L, Wang S, Liu X, Wang H, Li D, Wei P, Cheng W, Chen B. Origin and Evolution of Ore-Forming Fluid and Gold-Deposition Processes at the Sanshandao Gold Deposit, Jiaodong Peninsula, Eastern China. Minerals. 2019; 9(3):189. https://doi.org/10.3390/min9030189
Chicago/Turabian StyleLiu, Yazhou, Liqiang Yang, Sirui Wang, Xiangdong Liu, Hao Wang, Dapeng Li, Pengfei Wei, Wei Cheng, and Bingyu Chen. 2019. "Origin and Evolution of Ore-Forming Fluid and Gold-Deposition Processes at the Sanshandao Gold Deposit, Jiaodong Peninsula, Eastern China" Minerals 9, no. 3: 189. https://doi.org/10.3390/min9030189