Study of K-Feldspar and Lime Hydrothermal Reaction: Phase and Mechanism with Reaction Temperature and Increasing Ca/Si Ratio


Abstract
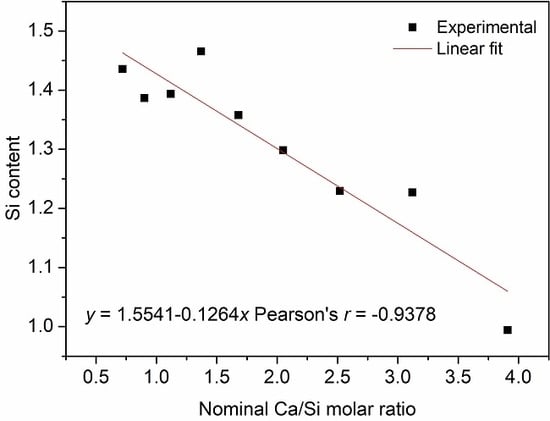
:
1. Introduction
2. Materials and Methods
2.1. Materials
2.2. Hydrothermal Method
2.2.1. Reaction Temperature
2.2.2. Reactant Ratio
2.3. Leaching Experiment
2.4. Analytical Methods
2.4.1. SEM and EDS
2.4.2. XRPD
2.4.3. ICP-OES
3. Results and Discussion
3.1. Phase
3.1.1. Crystal
3.1.2. Amorphous
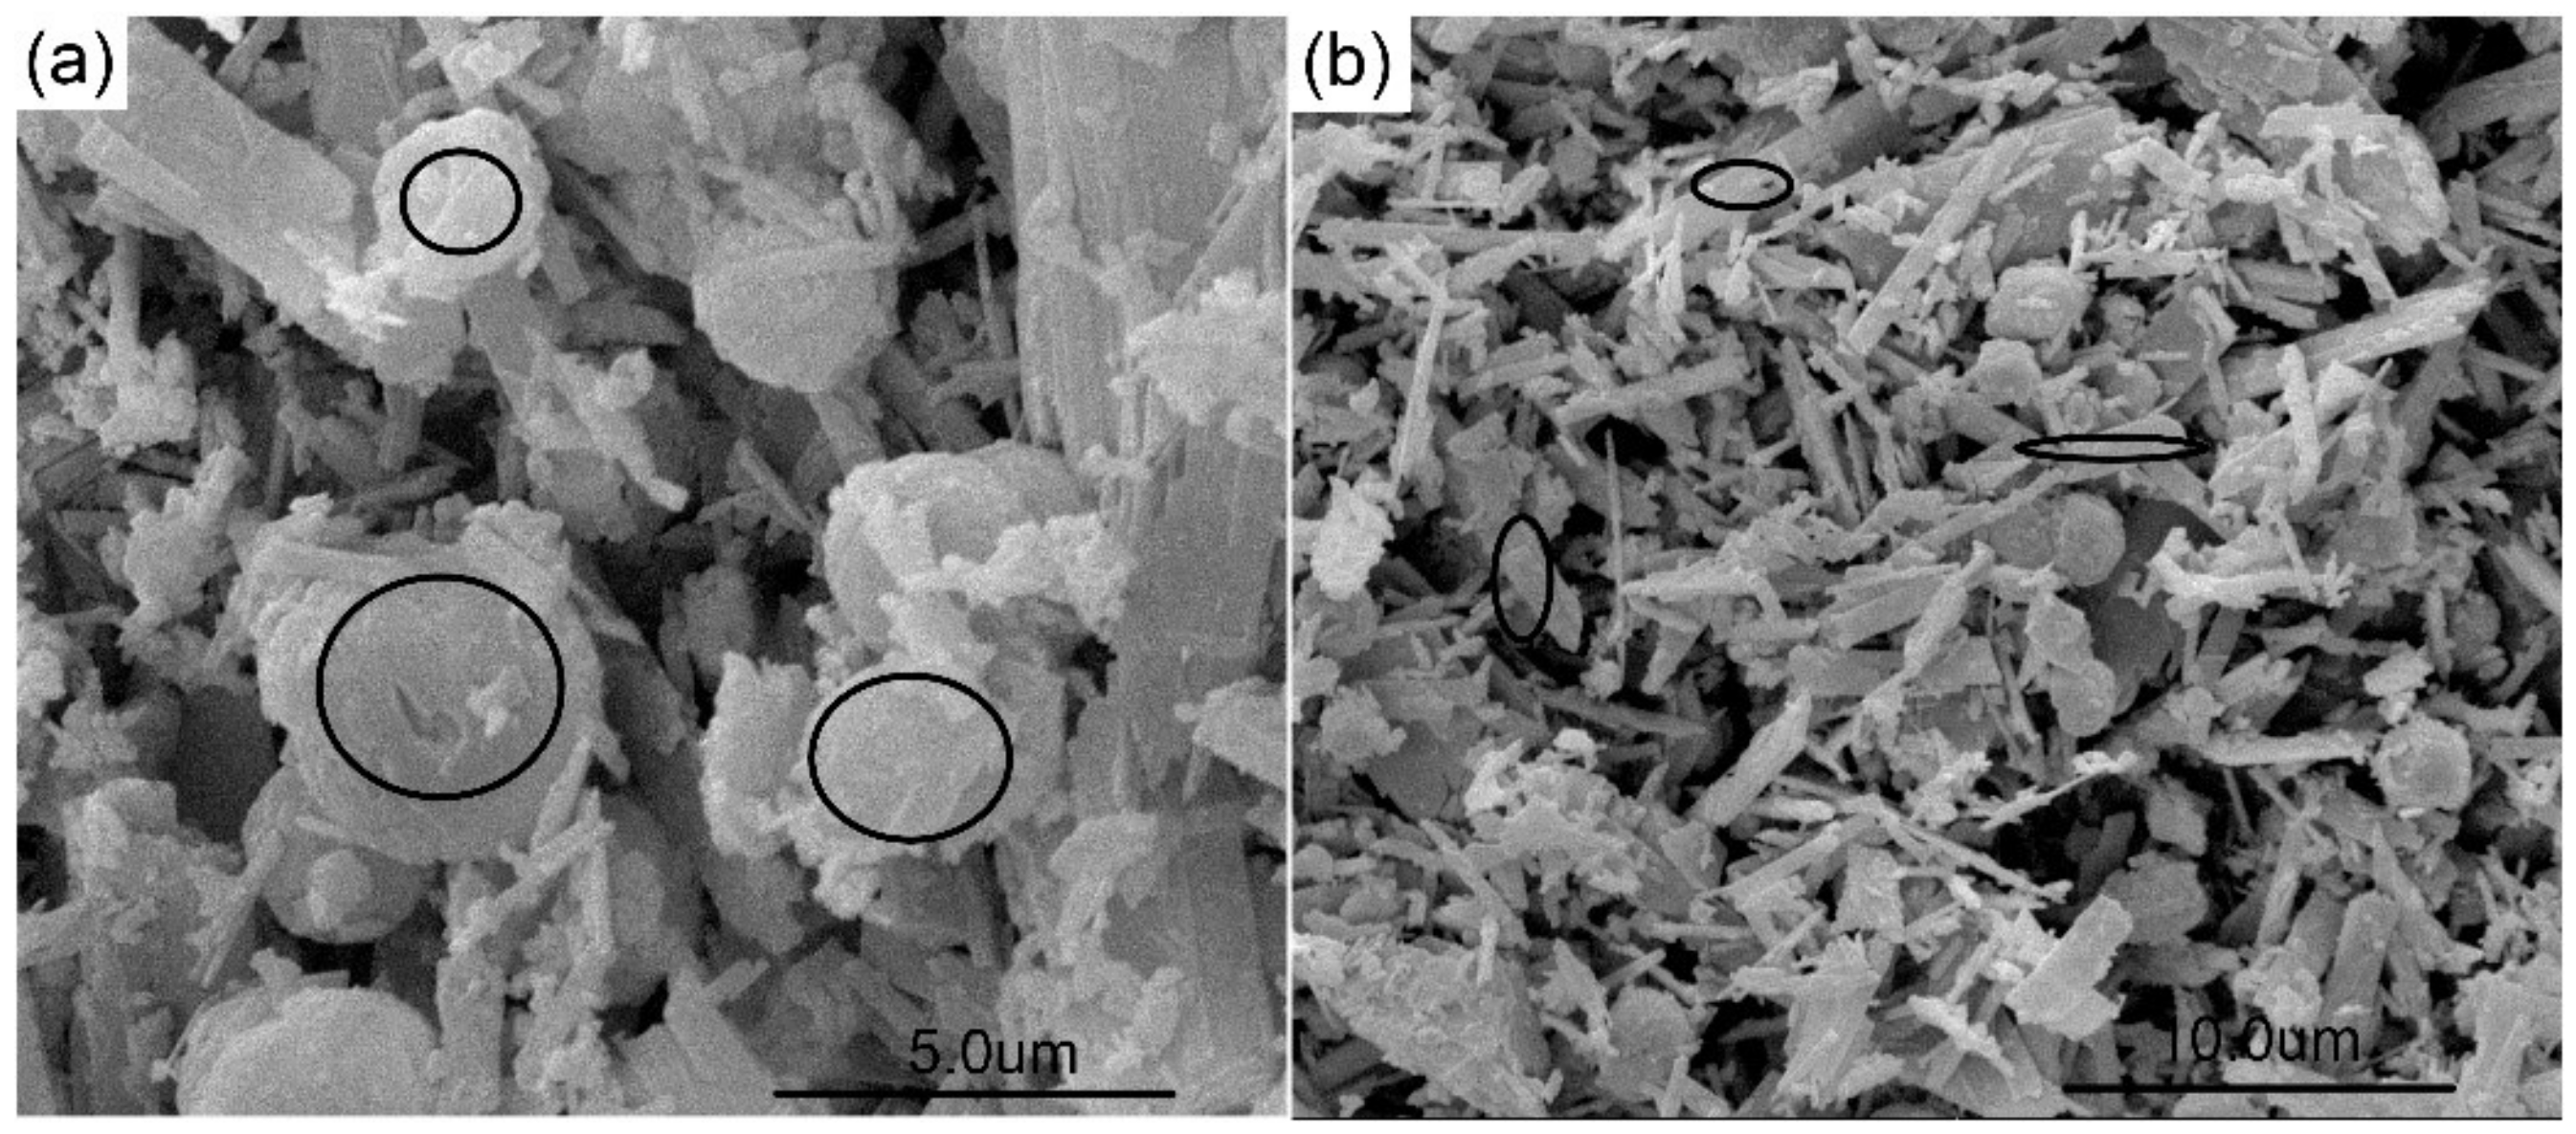
3.2. Morphology
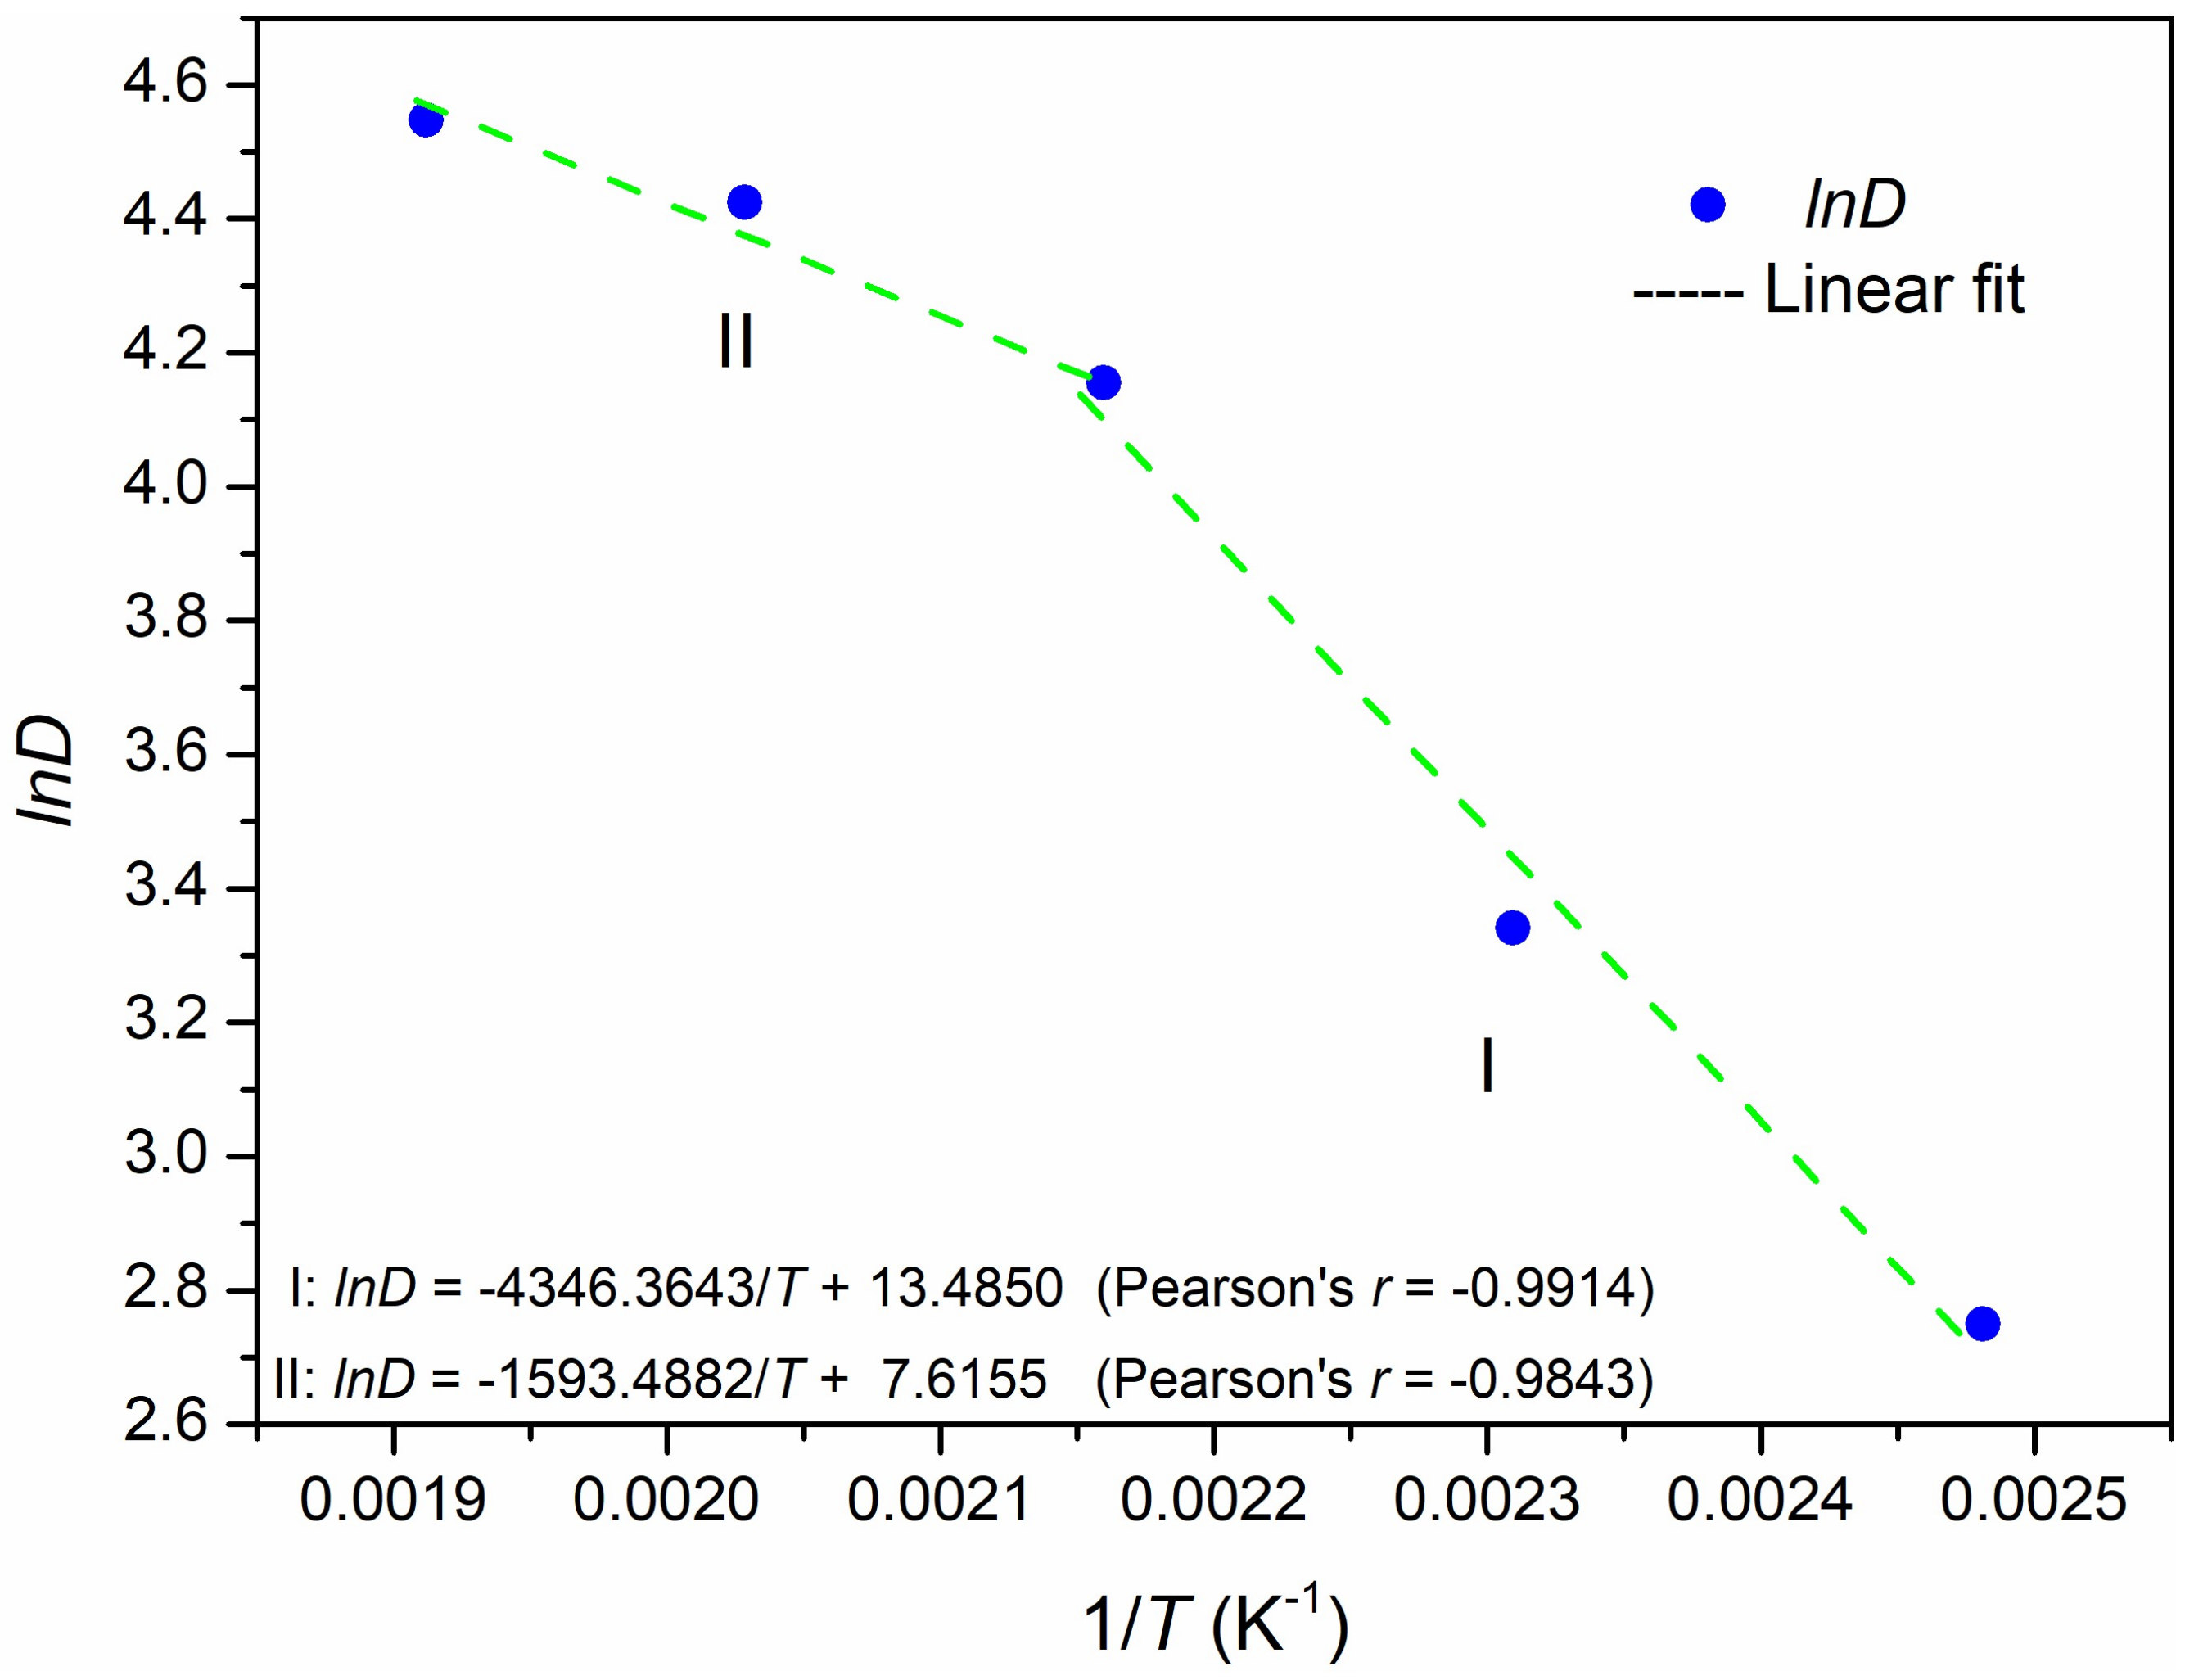
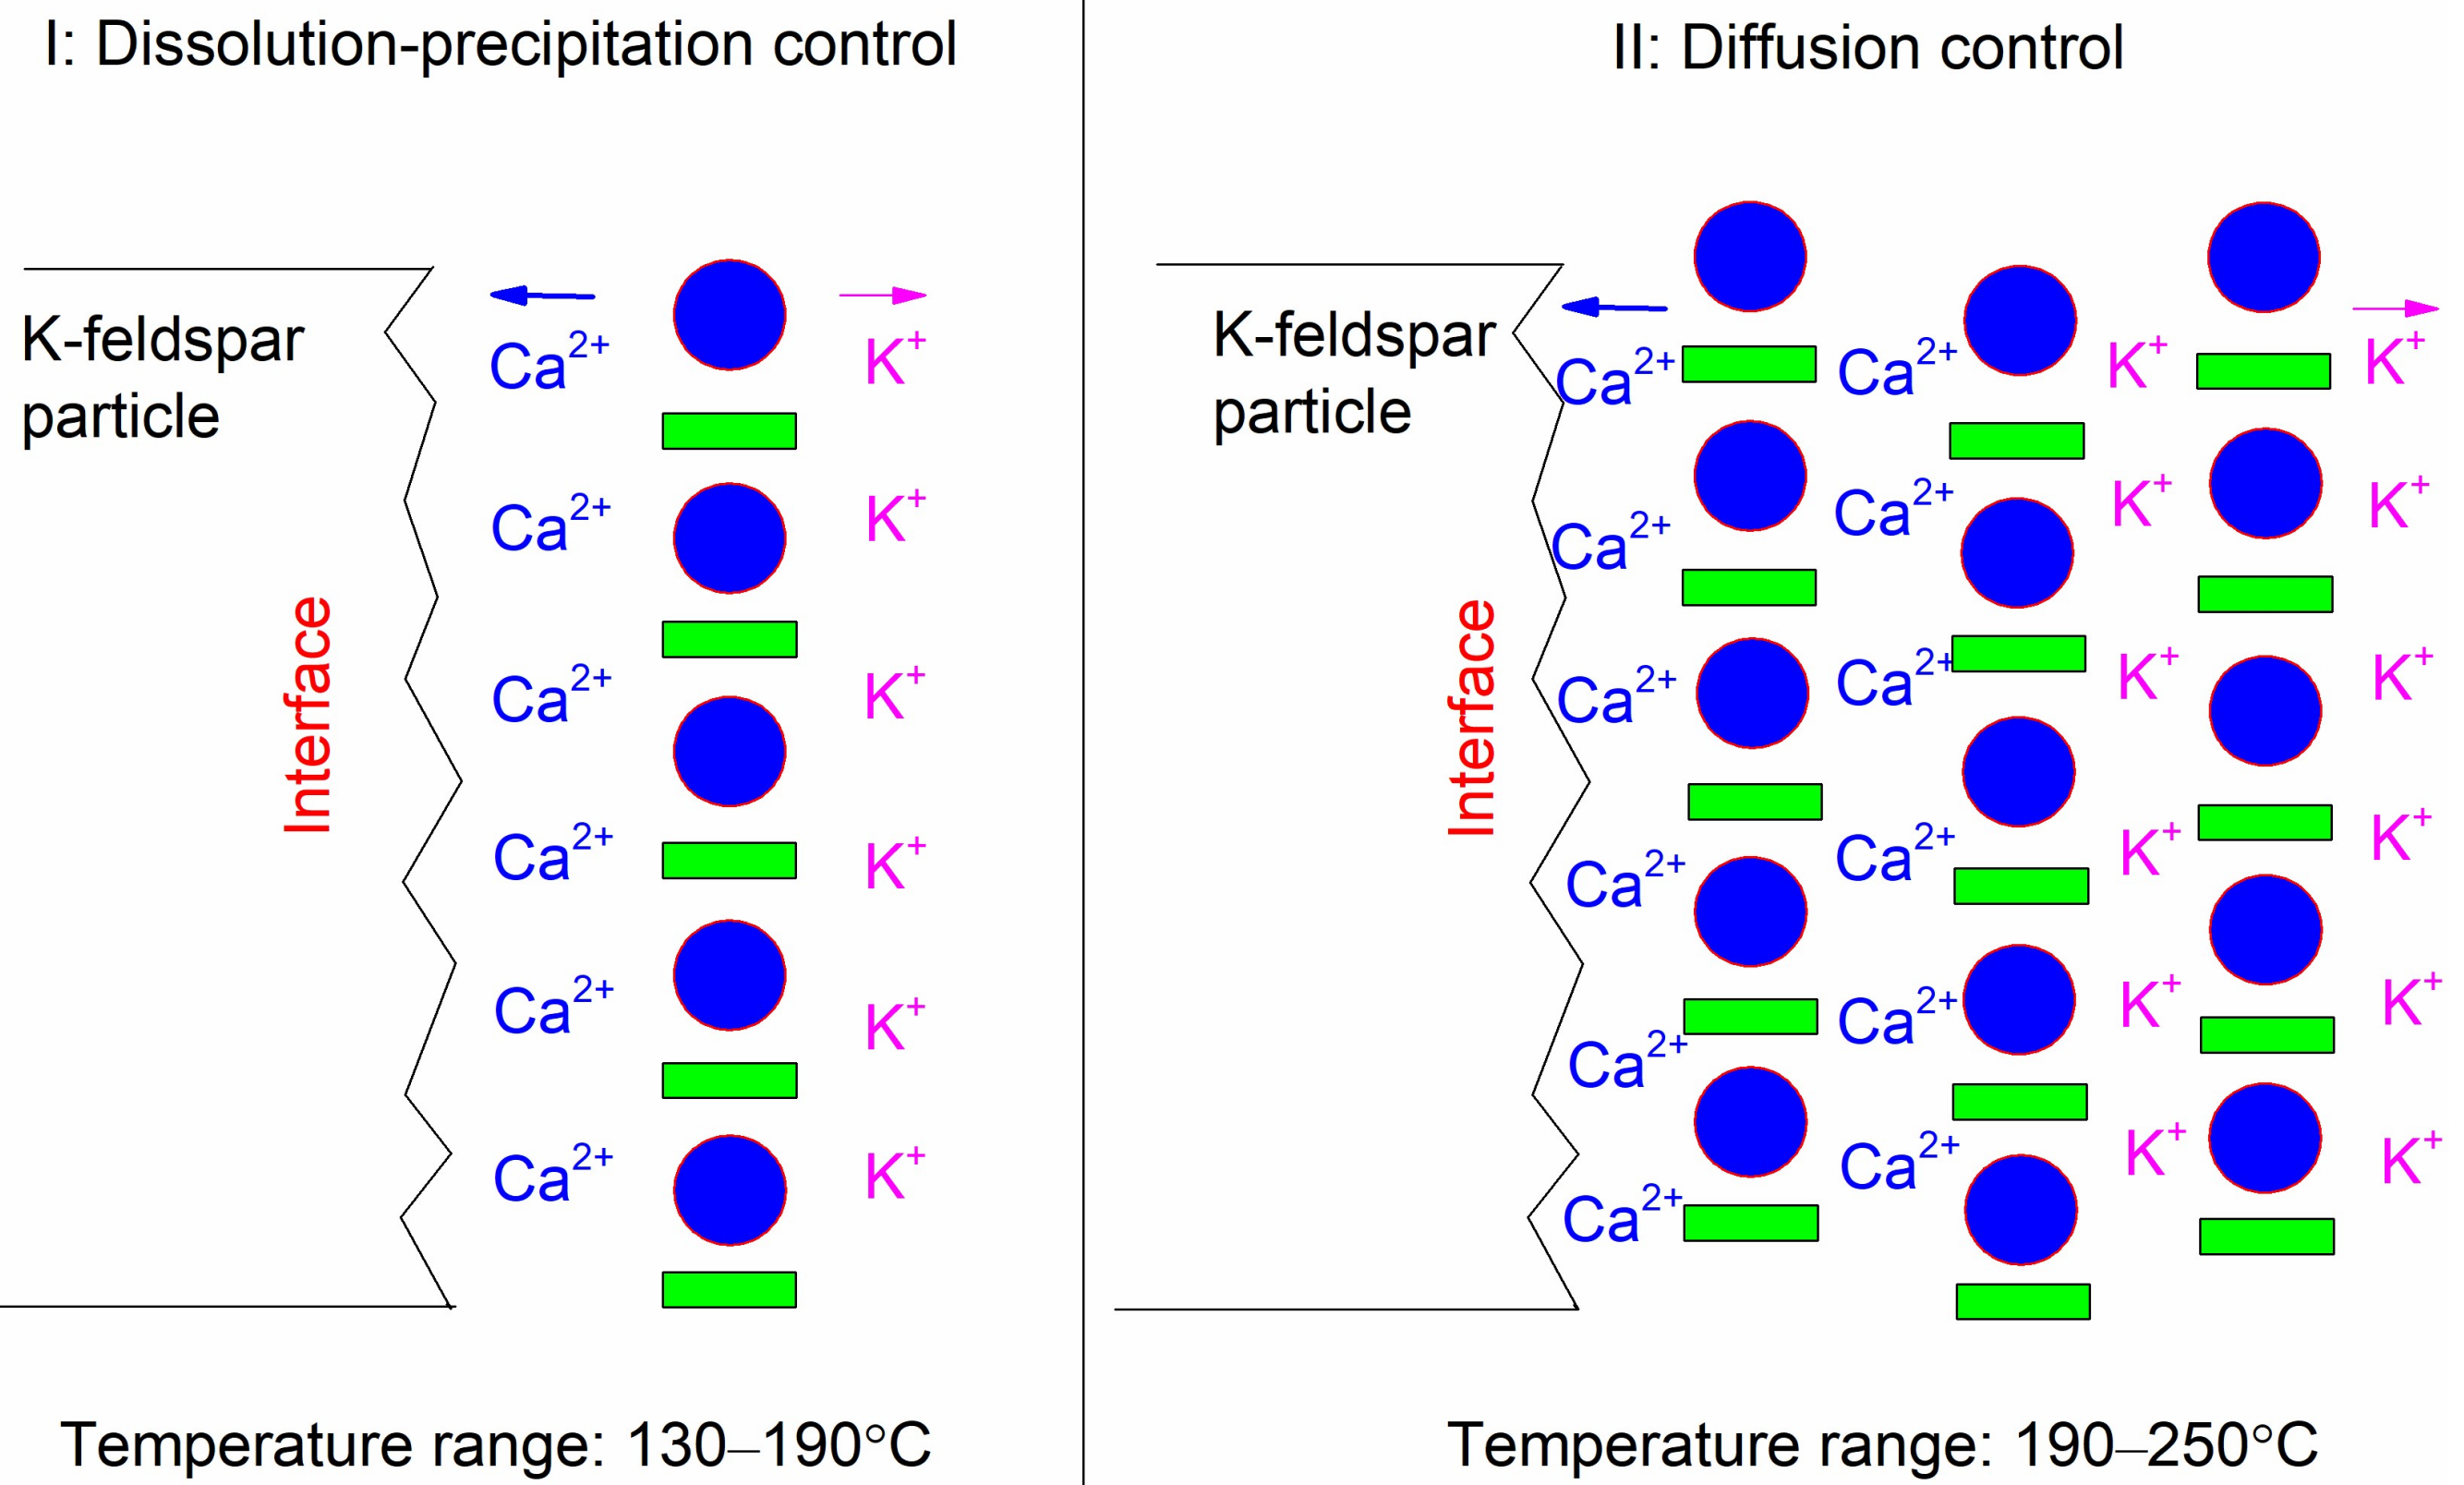
3.3. Dissolution Mechanism
4. Conclusions
Supplementary Materials
Author Contributions
Funding
Acknowledgments
Conflicts of Interest
References
- Klein, C.; Philpotts, A.R. Chapter 7 Igneous rock-forming minerals. In Earth Materials: Introduction to Mineralogy and Petrology, 2nd ed.; Klein, C., Philpotts, A.R., Eds.; Cambridge University Press: New York, NY, USA, 2017; p. 161. [Google Scholar]
- Xu, Y.; Liang, X.; Xu, Y.; Qin, X.; Huang, Q.; Wang, L.; Sun, Y. Remediation of heavy metal-polluted agricultural soils using clay minerals: A review. Pedosphere 2017, 27, 193–204. [Google Scholar] [CrossRef]
- Guo, B.; Liu, B.; Yang, J.; Zhang, S. The mechanisms of heavy metal immobilization by cementitious material treatments and thermal treatments: A review. J. Environ. Manag. 2017, 193, 410–422. [Google Scholar] [CrossRef] [PubMed]
- Misaelides, P. Application of natural zeolites in environmental remediation: A short review. Microporous Mesoporous Mater. 2011, 144, 15–18. [Google Scholar] [CrossRef]
- Liu, J.M.; Liu, S.K.; Han, C.; Sheng, X.B.; Qi, X.; Zhang, Z.L. Mineral technology for soil remediation and improvement: A new applied research direction from mineralogy, petrology and geochemistry. Bull. Mineral. Petrol. Geochem. 2014, 33, 556–560. [Google Scholar]
- Han, C.; Liu, J.M. Method for Preparing Microporous Mineral Fertilizer from Silicates Rock Using Hydrothermal Chemical Reaction. Patent WO2009070953A1, 5 December 2007. [Google Scholar]
- Han, C. Method for Producing Micropore Silicon-Potassium-Calcium Mineral Fertilizer. Patent CN101054313B, 26 April 2007. [Google Scholar]
- Liu, S.K.; Qi, X.; Han, C.; Liu, J.M.; Sheng, X.B.; Li, H.; Luo, A.M.; Li, J.L. Novel nano-submicron mineral-based soil conditioner for sustainable agricultural development. J. Clean. Prod. 2017, 149, 896–903. [Google Scholar] [CrossRef]
- Liu, S.K.; Li, H.; Han, C.; Sheng, X.B.; Liu, J.M. Cd inhibition and pH improvement via a nano-submicron mineral-based soil conditioner. Environ. Sci. Pollut. Res. 2017, 24, 4942–4949. [Google Scholar] [CrossRef] [PubMed]
- Richardson, I.G. The calcium silicate hydrates. Cem. Concr. Res. 2008, 38, 137–158. [Google Scholar] [CrossRef]
- Komarneni, S.; Roy, D.M. Tobermorites: A new family of cation exchangers. Science 1983, 221, 647–648. [Google Scholar] [CrossRef] [PubMed]
- Zou, J.J.; Guo, C.B.; Zhou, X.Q.; Sun, Y.J.; Yang, Z. Sorption capacity and mechanism of Cr3+ on tobermorite derived from fly ash acid residue and carbide slag. Colloids Surf. A 2018, 538, 825–833. [Google Scholar] [CrossRef]
- Guo, X.L.; Shi, H.S. Microstructure and heavy metal adsorption mechanisms of hydrothermally synthesized Al-substituted tobermorite. Mater. Struct. 2017, 50, 10. [Google Scholar] [CrossRef]
- Yao, Z.D.; Tamura, C.; Matsuda, M.; Miyake, M. Resource recovery of waste incineration fly ash: Synthesis of tobermorite as ion exchanger. J. Mater. Res. 1999, 14, 4437–4442. [Google Scholar] [CrossRef]
- Rios, C.A.; Williams, C.D.; Fullen, M.A. Hydrothermal synthesis of hydrogarnet and tobermorite at 175 °C from kaolinite and metakaolinite in the CaO-Al2O3-SiO2-H2O system: A comparative study. Appl. Clay Sci. 2009, 43, 228–237. [Google Scholar] [CrossRef]
- Meller, N.; Kyritsis, K.; Hall, C. The mineralogy of the CaO-Al2O3-SiO2-H2O (CASH) hydroceramic system from 200 to 350 °C. Cem. Concr. Res. 2009, 39, 45–53. [Google Scholar] [CrossRef]
- Meller, N.; Hall, C.; Kyritsis, K.; Giriat, G. Synthesis of cement based CaO-Al2O3-SiO2-H2O (CASH) hydroceramics at 200 and 250 °C: Ex-situ and in-situ diffraction. Cem. Concr. Res. 2007, 37, 823–833. [Google Scholar] [CrossRef]
- Liu, S.K.; Han, C.; Liu, J.M.; Li, H. Research of extracting potassium, silica and aluminum from potassium feldspar by hydrothermal chemical reaction. Acta Mineral. Sin. 2009, 29, 320–326. [Google Scholar]
- Liu, S.K.; Han, C.; Liu, J.M.; Li, H. Hydrothermal decomposition of potassium feldspar under alkaline conditions. RSC Adv. 2015, 5, 93301–93309. [Google Scholar] [CrossRef]
- Ciceri, D.; de Oliveira, M.; Allanore, A. Potassium fertilizer via hydrothermal alteration of K-feldspar ore. Green Chem. 2017, 19, 5187–5202. [Google Scholar] [CrossRef]
- Skorina, T.; Allanore, A. Alkali Metal Ion Source with Moderate Rate of Ion Release and Methods of Forming. U.S. Patent US9340465B2, 6 May 2013. [Google Scholar]
- Liu, S.; Han, C.; Liu, J. Study of K-feldspar and lime hydrothermal reaction at 190 °c: Phase, kinetics and mechanism with reaction time. ChemistrySelect 2018, 3, 13010–13016. [Google Scholar] [CrossRef]
- Larson, A.C.; Von Dreele, R.B. General Structure Analysis System (GSAS); Los Alamos National Laboratory Report LAUR; Los Alamos National Laboratory: New Mexico, NM, USA, 2004; pp. 86–748. [Google Scholar]
- Toby, B.H. EXPGUI, a graphical user interface for GSAS. J. Appl. Crystallogr. 2001, 34, 210–213. [Google Scholar] [CrossRef]
- Rietveld, H.M. A profile refinement method for nuclear and magnetic structures. J. Appl. Crystallogr. 1969, 2, 65–71. [Google Scholar] [CrossRef] [Green Version]
- Reardon, E.J.; Fagan, R. The calcite/portlandite phase boundary: Enhanced calcite solubility at high pH. Appl. Geochem. 2000, 15, 327–335. [Google Scholar] [CrossRef]
- Pabst, A. Synthesis, properties, and structure of K2Ca(CO3)2, Bütschliite. Am. Mineral. 1974, 59, 353–358. [Google Scholar]
- Al-Wakeel, E.I.; El-Korashy, S.A. Reaction mechanism of the hydrothermally treated CaO-SiO2-Al2O3 and CaO-SiO2-Al2O3-CaSO4 systems. J. Mater. Sci. 1996, 31, 1909–1913. [Google Scholar] [CrossRef]
- Klimesch, D.S.; Ray, A. DTA-TG study of the CaO-SiO2-H2O and CaO-Al2O3-SiO2-H2O systems under hydrothermal conditions. J. Therm. Anal. Calorim. 1999, 56, 27–34. [Google Scholar] [CrossRef]
- Klimesch, D.S.; Ray, A. DTA-TGA evaluations of the CaO-Al2O3-SiO2-H2O system treated hydrothermally. Thermochim. Acta 1999, 334, 115–122. [Google Scholar] [CrossRef]
- Watanabe, O.; Kitamura, K.; Maenami, H.; Ishida, H. Hydrothermal treatment of a silica sand complex with lime. J. Am. Ceram. Soc. 2001, 84, 2318–2322. [Google Scholar] [CrossRef]
- Kyritsis, K.; Meller, N.; Hall, C. Chemistry and morphology of hydrogarnets formed in cement-based CASH hydroceramics cured at 200 to 350 °C. J. Am. Ceram. Soc. 2009, 92, 1105–1111. [Google Scholar] [CrossRef]
- Guo, X.L.; Meng, F.J.; Shi, H.S. Microstructure and characterization of hydrothermal synthesis of Al-substituted tobermorite. Constr. Build. Mater. 2017, 133, 253–260. [Google Scholar] [CrossRef]
- Organova, N.I.; Koporulina, E.V.; Ivanova, A.G.; Trubkini, N.V.; Zadov, A.E.; Khomyakov, A.P.; Marcille, I.M.; Chukanov, N.V.; Shmakov, A.N. Structure model of Al,K-substituted tobermorite and structural changes upon heating. Crystallogr. Rep. 2002, 47, 950–956. [Google Scholar] [CrossRef]
- Hu, X.L.; Yanagisawa, K.; Onda, A.; Kajiyoshi, K. Stability and phase relations of dicalcium silicate hydrates under hydrothermal conditions. J. Ceram. Soc. Jpn. 2006, 114, 174–179. [Google Scholar] [CrossRef]
- Pena, R.; Guerrero, A.; Goni, S. Hydrothermal treatment of bottom ash from the incineration of municipal solid waste: Retention of Cs(I), Cd(II), Pb(II) and Cr(III). J. Hazard. Mater. 2006, 129, 151–157. [Google Scholar] [CrossRef] [PubMed]
- Coleman, N.J. Interactions of Cd(II) with waste-derived 11 angstrom tobermorites. Sep. Purif. Technol. 2006, 48, 62–70. [Google Scholar] [CrossRef]
- Hinsinger, P. Potassium. In Encyclopedia of Soil Science; Lal, R., Ed.; Marcel Dekker Inc.: New York, NY, USA, 2002; pp. 1354–1358. [Google Scholar]
- Xu, R.K.; Zhao, A.Z.; Yuan, J.H.; Jiang, J. pH buffering capacity of acid soils from tropical and subtropical regions of China as influenced by incorporation of crop straw biochars. J. Soils Sediments 2012, 12, 494–502. [Google Scholar] [CrossRef]
- Weaver, A.R.; Kissel, D.E.; Chen, F.; West, L.T.; Adkins, W.; Rickman, D.; Luvall, J.C. Mapping soil pH buffering capacity of selected fields in the coastal plain. Soil Sci. Soc. Am. J. 2004, 68, 662–668. [Google Scholar] [CrossRef]
- Biagioni, C.; Merlino, S.; Bonaccorsi, E. The tobermorite supergroup: A new nomenclature. Mineral. Mag. 2015, 79, 485–495. [Google Scholar] [CrossRef]
- Wang, Z.H.; Ma, S.H.; Zheng, S.L.; Wang, X.H. Incorporation of Al and Na in Hydrothermally Synthesized Tobermorite. J. Am. Ceram. Soc. 2017, 100, 792–799. [Google Scholar] [CrossRef]
- Matsui, K.; Kikuma, J.; Tsunashima, M.; Ishikawa, T.; Matsuno, S.-Y.; Ogawa, A.; Sato, M. In situ time-resolved X-ray diffraction of tobermorite formation in autoclaved aerated concrete: Influence of silica source reactivity and Al addition. Cem. Concr. Res. 2011, 41, 510–519. [Google Scholar] [CrossRef]
- Maeda, H.; Abe, K.; Ishida, E.H. Hydrothermal synthesis of aluminum substituted tobermorite by using various crystal phases of alumina. J. Ceram. Soc. Jpn. 2011, 119, 375–377. [Google Scholar] [CrossRef] [Green Version]
- Grew, E.S.; Locock, A.J.; Mills, S.J.; Galuskina, I.O.; Galuskin, E.V.; Halenius, U. Nomenclature of the garnet supergroup. Am. Mineral. 2013, 98, 785–810. [Google Scholar] [CrossRef]
- Cohenaddad, C.; Ducros, P.; Bertaut, E.F. Etude de la substitution du groupement SiO4 par (OH)4 dans les composes Al2Ca3(OH)12 et Al2Ca3(SiO4)2,16(OH)3,36 de type grenat. Acta Crystallogr. 1967, 23, 220–230. [Google Scholar] [CrossRef]
- Oneill, B.; Bass, J.D.; Rossman, G.R. Elastic properties of hydrogrossular garnet and implications for water in the upper-mantle. J. Geophys. Res. Solid Earth 1993, 98, 20031–20037. [Google Scholar] [CrossRef]
- Okoronkwo, M.U.; Glasser, F.P. Compatibility of hydrogarnet, Ca3Al2(SiO4)(x)(OH)(4(3-x)), with sulfate and carbonate-bearing cement phases: 5–85 °C. Cem. Concr. Res. 2016, 83, 86–96. [Google Scholar] [CrossRef]
- Adhikari, P.; Dharmawardhana, C.C.; Ching, W.Y. Structure and properties of hydrogrossular mineral series. J. Am. Ceram. Soc. 2017, 100, 4317–4330. [Google Scholar] [CrossRef]
- Galvankova, L.; Masilko, J.; Solny, T.; Stepankova, E. Tobermorite synthesis under hydrothermal conditions. In Ecology and New Building Materials and Products 2016; Drdlova, M., Kubatova, D., Bohac, M., Eds.; Elsevier Science Bv: Amsterdam, The Netherlands, 2016; Volume 151, pp. 100–107. [Google Scholar]
- Maeda, H.; Kurosaki, Y.; Nakamura, T.; Nakayama, M.; Ishida, E.H.; Kasuga, T. Control of chemical composition of hydrogrossular prepared by hydrothermal reaction. Mater. Lett. 2014, 131, 132–134. [Google Scholar] [CrossRef]
- Grangeon, S.; Fernandez-Martinez, A.; Baronnet, A.; Marty, N.; Poulain, A.; Elkaim, E.; Roosz, C.; Gaboreau, S.; Henocq, P.; Claret, F. Quantitative X-ray pair distribution function analysis of nanocrystalline calcium silicate hydrates: A contribution to the understanding of cement chemistry. J. Appl. Crystallogr. 2017, 50, 14–21. [Google Scholar] [CrossRef] [PubMed]
- Hou, D.S.; Ma, H.Y.; Li, Z.J. Morphology of calcium silicate hydrate (C-S-H) gel: A molecular dynamic study. Adv. Cem. Res. 2015, 27, 135–146. [Google Scholar] [CrossRef]
- Grangeon, S.; Claret, F.; Lerouge, C.; Warmont, F.; Sato, T.; Anraku, S.; Numako, C.; Linard, Y.; Lanson, B. On the nature of structural disorder in calcium silicate hydrates with a calcium/silicon ratio similar to tobermorite. Cem. Concr. Res. 2013, 52, 31–37. [Google Scholar] [CrossRef]
- Houston, J.R.; Maxwell, R.S.; Carroll, S.A. Transformation of meta-stable calcium silicate hydrates to tobermorite: Reaction kinetics and molecular structure from XRD and NMR spectroscopy. Geochem. Trans. 2009, 10, 14. [Google Scholar] [CrossRef] [PubMed]
- Lothenbach, B.; Scrivener, K.; Hooton, R.D. Supplementary cementitious materials. Cem. Concr. Res. 2011, 41, 1244–1256. [Google Scholar] [CrossRef]
- Shaw, S.; Clark, S.M.; Henderson, C.M.B. Hydrothermal formation of the calcium silicate hydrates, tobermorite (Ca5Si6O16(OH)(2) · 4H(2)O) and xonotlite (Ca6Si6O17(OH)(2)): An in situ synchrotron study. Chem. Geol. 2000, 167, 129–140. [Google Scholar] [CrossRef]
- Mitsuda, T.; Sasaki, K.; Ishida, H. Phase evolution during autoclaving process of aerated concrete. J. Am. Ceram. Soc. 1992, 75, 1858–1863. [Google Scholar] [CrossRef]
- Zhang, P.; Ma, H.W. The synthesis of tobermorite from potassium feldspar powder: An experimental study. Acta Petrol. Et Mineral. 2005, 24, 333–338. [Google Scholar]
- Qiu, M.Y.; Ma, H.W.; Nie, Y.M.; Zhang, P.; Liu, H. Experimental study on synthesis of tobermorite by decomposing potassium feldspar. Geoscience 2005, 19, 348–354. [Google Scholar]
- Klimesch, D.S.; Ray, A. Effects of quartz particle size and kaolin on hydrogarnet formation during autoclaving. Cem. Concr. Res. 1998, 28, 1317–1323. [Google Scholar] [CrossRef]
- Klimesch, D.S.; Ray, A. Hydrogarnet formation during autoclaving at 180 °C in unstirred metakaolin-lime-quartz slurries. Cem. Concr. Res. 1998, 28, 1109–1117. [Google Scholar] [CrossRef]
- Klimesch, D.S.; Ray, A. Autoclaved cement-quartz pastes with metakaolin additions. Adv. Cem. Based Mater. 1998, 7, 109–118. [Google Scholar] [CrossRef]
- Liu, Y.; Xia, H.; Ma, H. Kinetics of hydrothermal decomposition of potassium feldspar with calcium hydroxide. Adv. Mater. Res. 2012, 549, 65–69. [Google Scholar] [CrossRef]
- Skorina, T.; Allanore, A. Aqueous alteration of potassium-bearing aluminosilicate minerals: From mechanism to processing. Green Chem. 2015, 17, 2123–2136. [Google Scholar] [CrossRef]
- Eckert, J.O.; HungHouston, C.C.; Gersten, B.L.; Lencka, M.M.; Riman, R.E. Kinetics and mechanisms of hydrothermal synthesis of barium titanate. J. Am. Ceram. Soc. 1996, 79, 2929–2939. [Google Scholar] [CrossRef]
- Berger, G.; Beaufort, D.; Lacharpagne, J.C. Experimental dissolution of sanidine under hydrothermal conditions: Mechanism and rate. Am. J. Sci. 2002, 302, 663–685. [Google Scholar] [CrossRef]


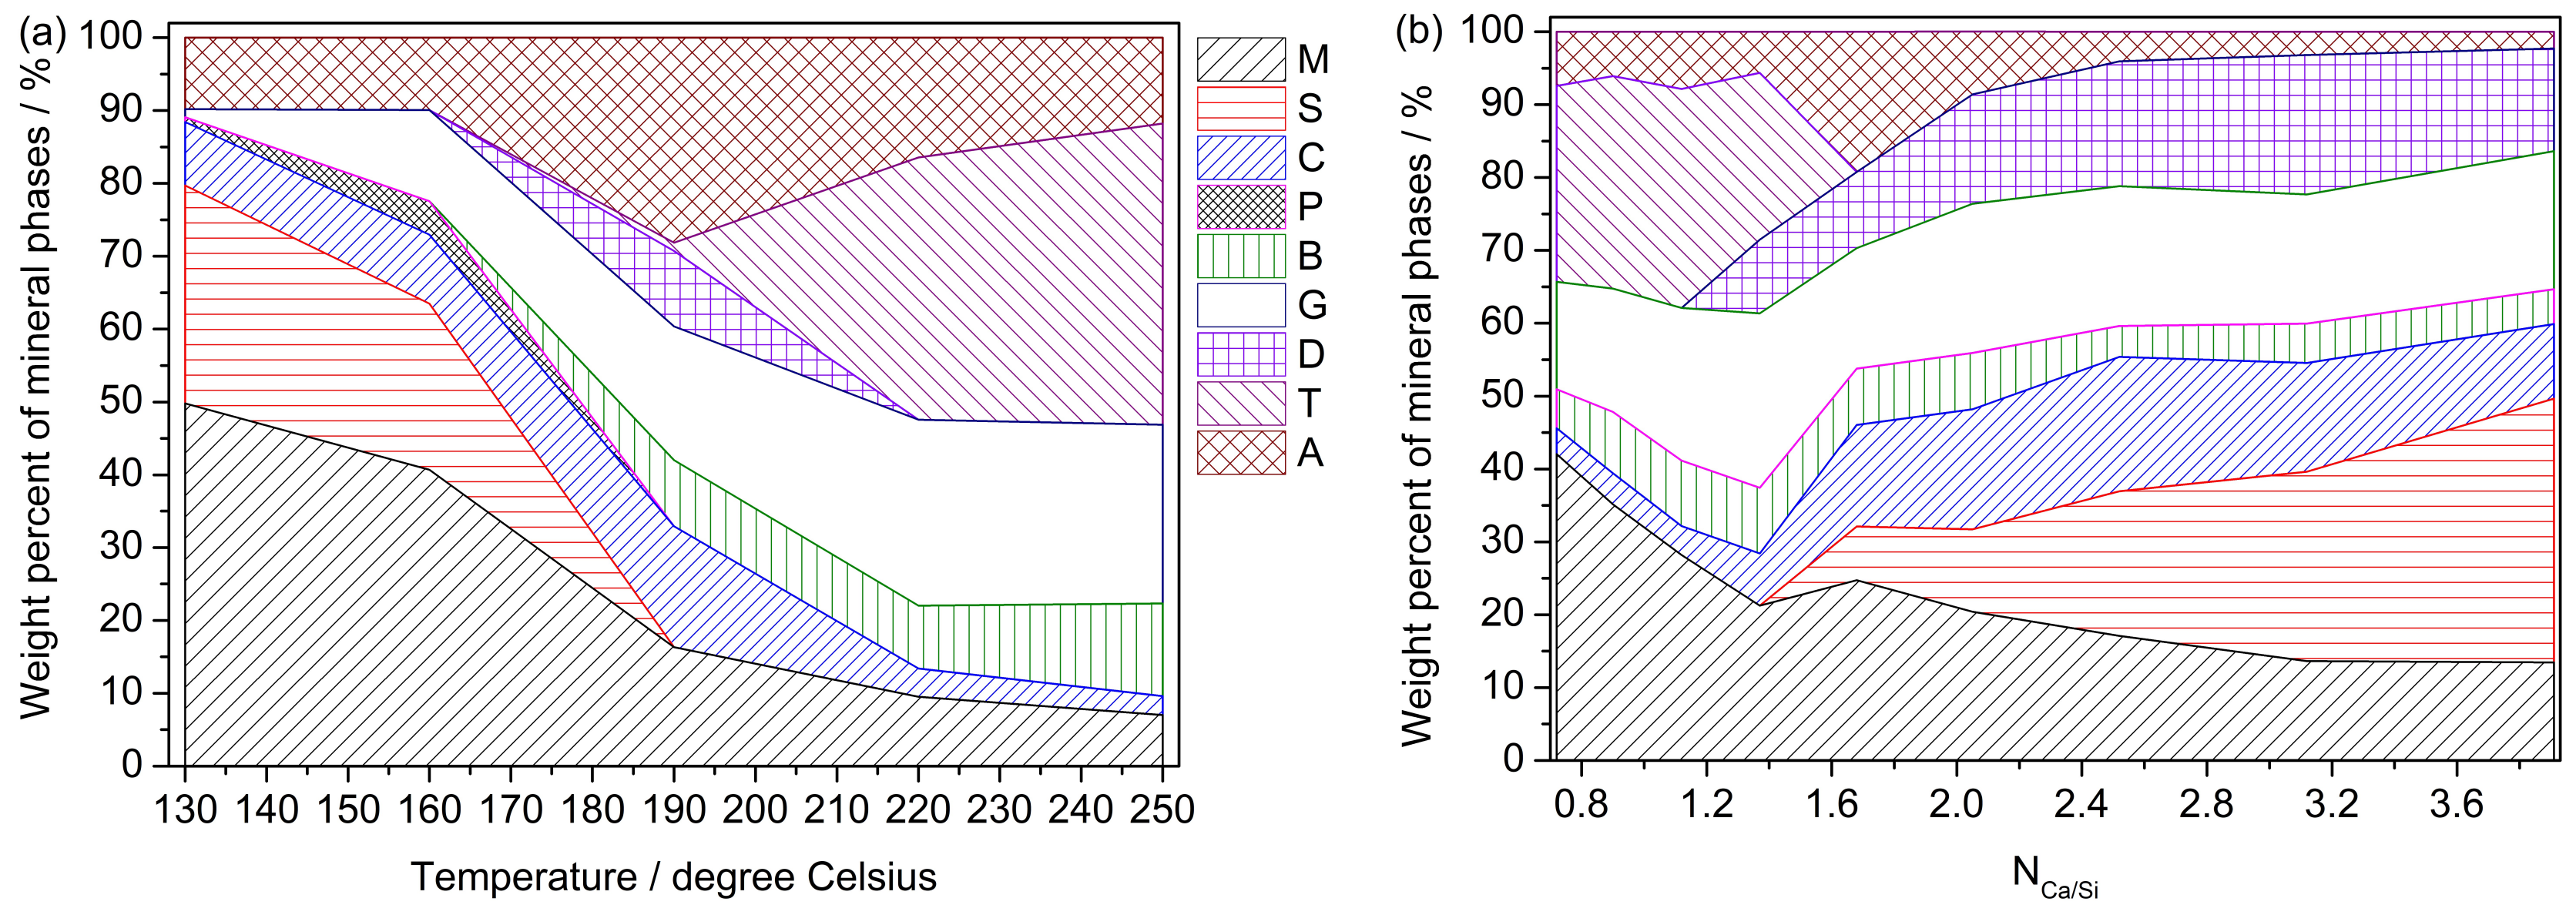
| Single Factor | NCa/Si | Temperature | Time (b) |
|---|---|---|---|
| Experimental condition | Temp = 190 °C | 130 °C ≤ Temp ≤ 250 °C | Temp = 190 °C |
| Time = 13.6 h | Time = 20 h | 0 h ≤ Time ≤ 36 h | |
| 0.72 ≤ NCa/Si ≤ 3.91 | NCa/Si = 1.37 | NCa/Si = 1.37 | |
| M (a) | all | all | all |
| S | NCa/Si ˃ 1.37 | 130 °C ≤ Temp < 190 °C | Time < 16 h |
| C | all | all | all |
| P | / | 130 °C ≤ Temp < 190 °C | 4 h < Time < 16 h |
| B | all | Temp ˃ 160 °C | Time ˃ 8 h |
| G | all | all | Time ˃ 4 h |
| D | NCa/Si ˃ 1.12 | 16 °C < Temp < 220 °C | 8 h < Time < 32 h |
| T | NCa/Si < 1.68 | Temp ˃ 160 °C | Time ˃ 16 h |
| A | all | all | all |
© 2019 by the authors. Licensee MDPI, Basel, Switzerland. This article is an open access article distributed under the terms and conditions of the Creative Commons Attribution (CC BY) license (http://creativecommons.org/licenses/by/4.0/).
Share and Cite
Liu, S.; Han, C.; Liu, J. Study of K-Feldspar and Lime Hydrothermal Reaction: Phase and Mechanism with Reaction Temperature and Increasing Ca/Si Ratio. Minerals 2019, 9, 46. https://doi.org/10.3390/min9010046
Liu S, Han C, Liu J. Study of K-Feldspar and Lime Hydrothermal Reaction: Phase and Mechanism with Reaction Temperature and Increasing Ca/Si Ratio. Minerals. 2019; 9(1):46. https://doi.org/10.3390/min9010046
Chicago/Turabian StyleLiu, Shanke, Cheng Han, and Jianming Liu. 2019. "Study of K-Feldspar and Lime Hydrothermal Reaction: Phase and Mechanism with Reaction Temperature and Increasing Ca/Si Ratio" Minerals 9, no. 1: 46. https://doi.org/10.3390/min9010046