1. Introduction
Precipitation in confinement is a phenomenon of significant interest in a number of areas such as geology (e.g., the impact of salt crystallization in rocks) [
1], environmental research (e.g., for the remediation of contaminants) [
2] as well as biomineralization and biomorphism [
3,
4]. Hence, it has been studied with a variety of techniques such as electron microscopy and X-ray spectroscopy to reveal the details of the transformation process from ion solutions to solid, often crystalline, precipitates. Moreover, the recent advent of liquid cell transmission electron microscopy techniques raises the prospect of investigating crystal growth in situ at the nanometer level [
5,
6] but also the question of how the confinement, which is a prerequisite for the application of this technique, affects the dynamics of crystallization.
An open aspect is here the impact of confinement on the concentration of the ions in solutions upon precipitation, which is the focus of this work. We are concentrating on the transport of ions to the growing particle and how it is affected in the presence of an already formed precipitate particle by the reduction of dimension.
The application of LCTEM for the investigation of particle precipitation and dissolution dynamics in polar solvents such as water, where the precipitates are either of amorphous or crystalline nature and a key problem is the mechanism of ion transport and its impact on the stability of precipitates. This is particularly important when taking into account the spatial boundary conditions defining the problem, namely the confinement of the liquid by thin membranes to create an electron transparent sample. Inspired by previous precipitation experiments using LCTEM we developed a MATLAB code to solve the involved ion transport equation numerically using Finite Element (FE) simulations for different confinement scenarios.
3. CaCO3 Formation in LCSTEM
The inspiration for this work originates from observations made for supersaturated aqueous solutions of calcium and carbonate using liquid cell transmission electron microscopy (LCSTEM). As has been reported the precipitation of crystalline calcium carbonate phases is only possible under standard conditions using a membrane spacing of 100–5000 nm for concentrations well exceeding 10 mM, which is more than 10 times above the supersaturation limit. To illustrate this we have studied the dynamics of calcium carbonate precipitation from supersaturated solutions with LCSTEM using a 500 nm spacer and 10 mM calcium chloride (CaCl2) and sodium carbonate concentration (Na2CO3). This corresponds to a significant supersaturation of 170 in bulk solution with respect to calcite at pH = 8 and a temperature of 300 K.
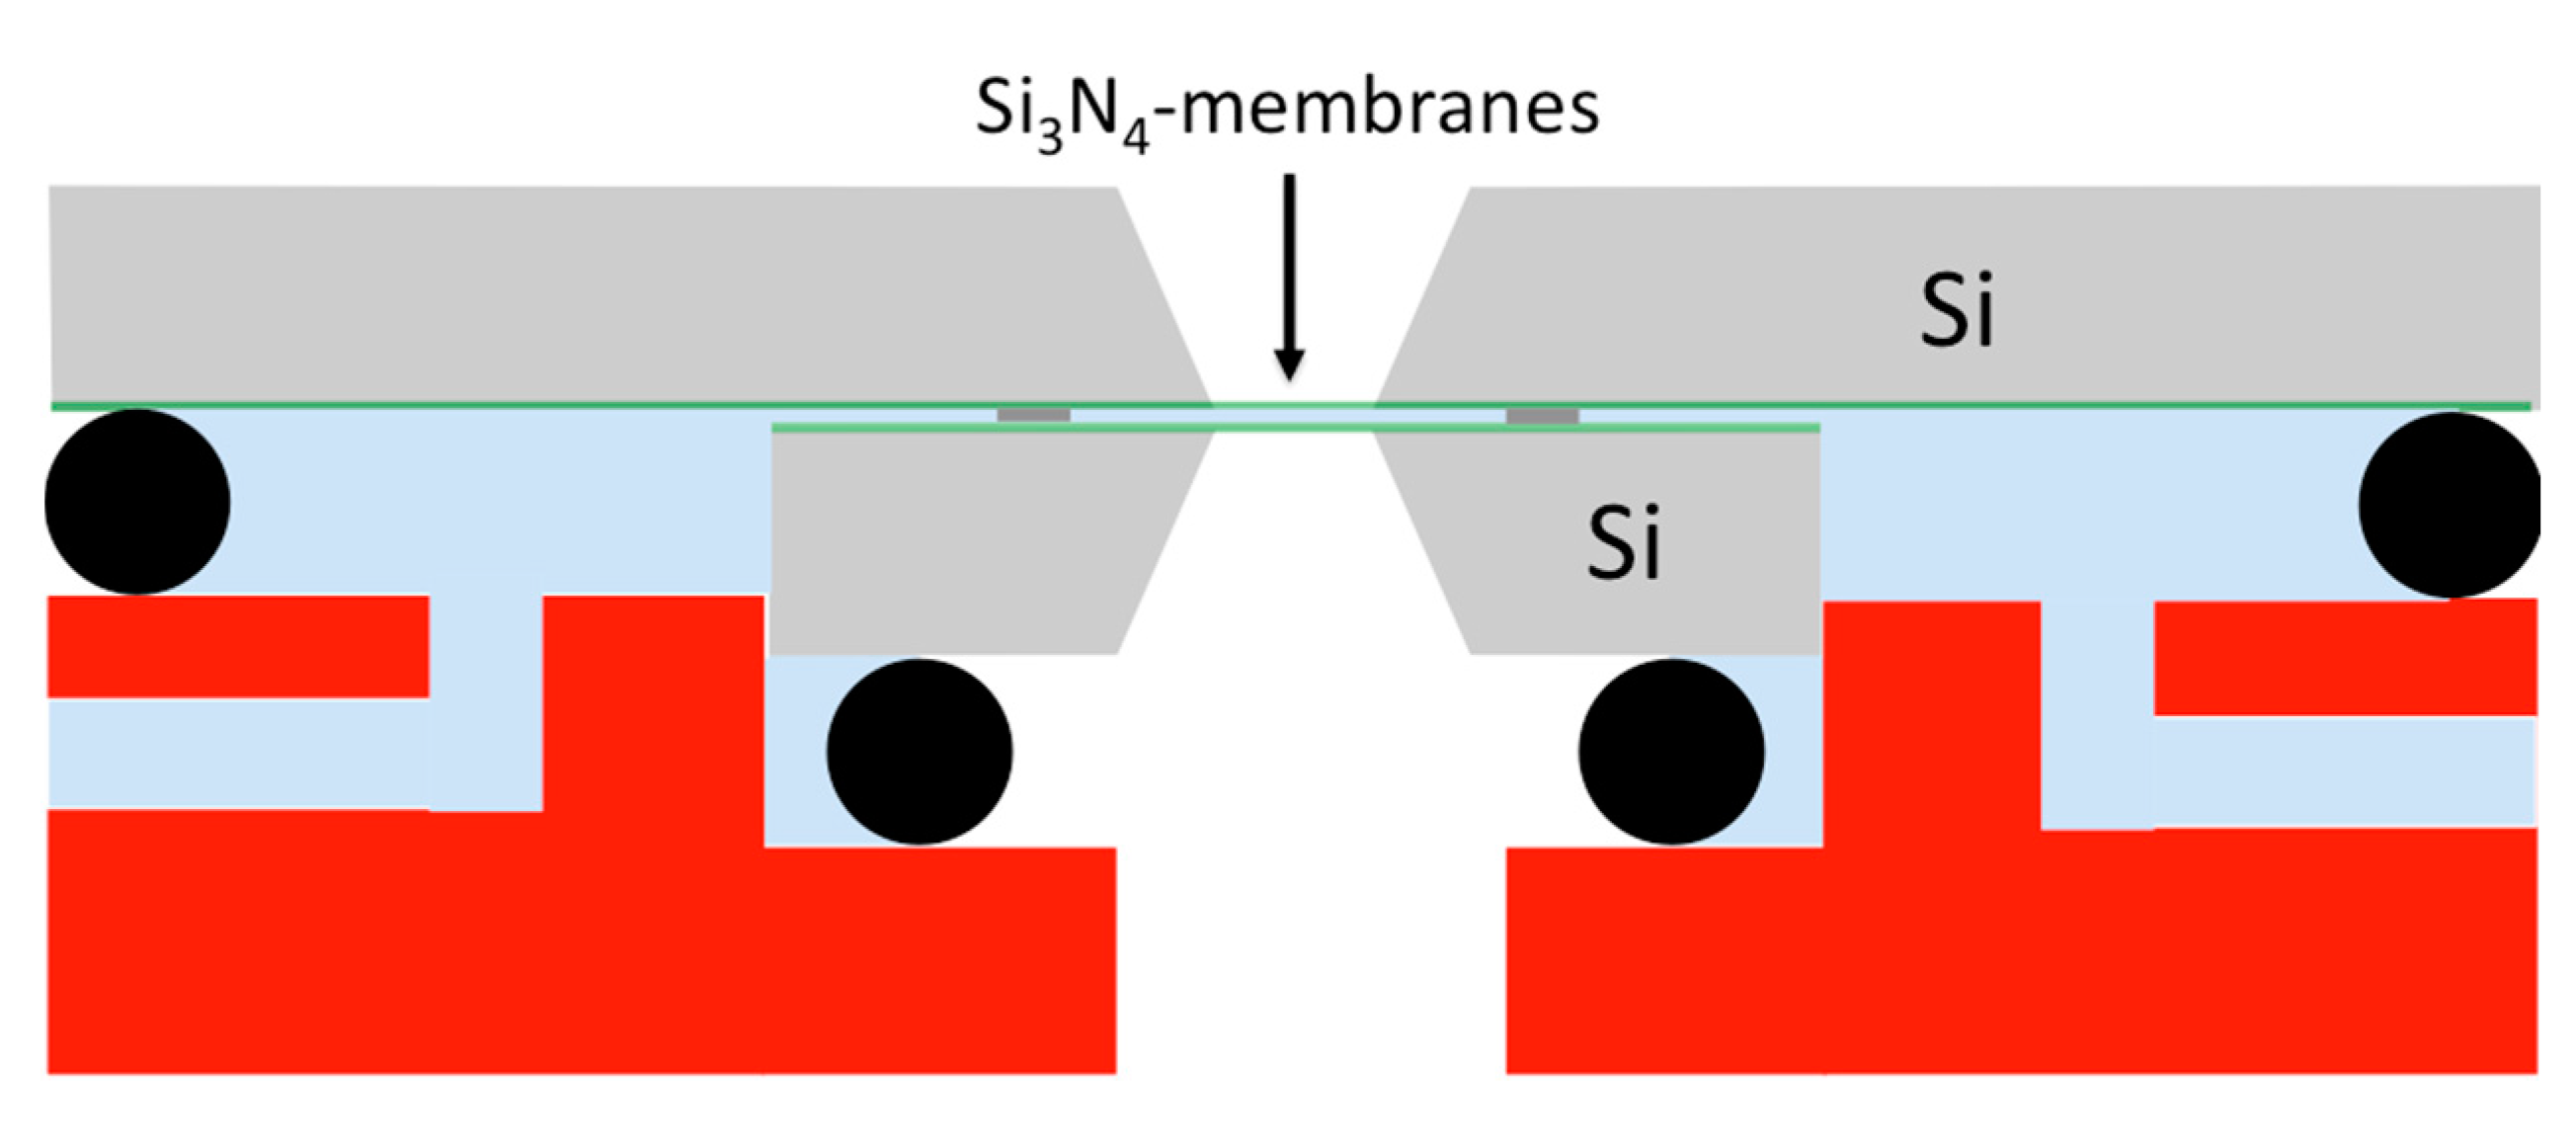
The growth or dissolution of a particle depends on the saturation level of the constituent ions. Since the standard liquid cell holders operate with membranes as depicted in
Figure 1 the confined area essentially depends on the lateral size of the smaller of the two encasing membrane-bearing chips generally in the order of several mm, and the choice of spacers [
8]. To create the electron transparent volume, spacers of varying thickness are used and are typically in the range between 0.1 and 5 µm. This results in an aspect ratio of the distance between the membranes and the cross-section of the flow channels surrounding the membrane area of approx. 10
−3 to 10
−2. These values result effectively in a convective flow barrier. Hence, in a two or three port liquid cell holder the supplied liquid can only arrive at the membrane area by diffusion [
9].
Imaging conditions were: 1.5 pA beam current, 200 kV acceleration voltage and 1 µs dwell time resulting in 0.5 s for each frame. For the lowest magnification and hence lowest electron dose (note, that we use “dose” in this context not in the strict radiochemistry sense, which considers the electron stopping power) no precipitation was observed throughout the field of view.
At magnifications of 20 k corresponding to approx. 3 e/Å2 even for long time periods of >30 min no precipitation could be observed in the observable membrane area of approx. 400 × 400 µm.
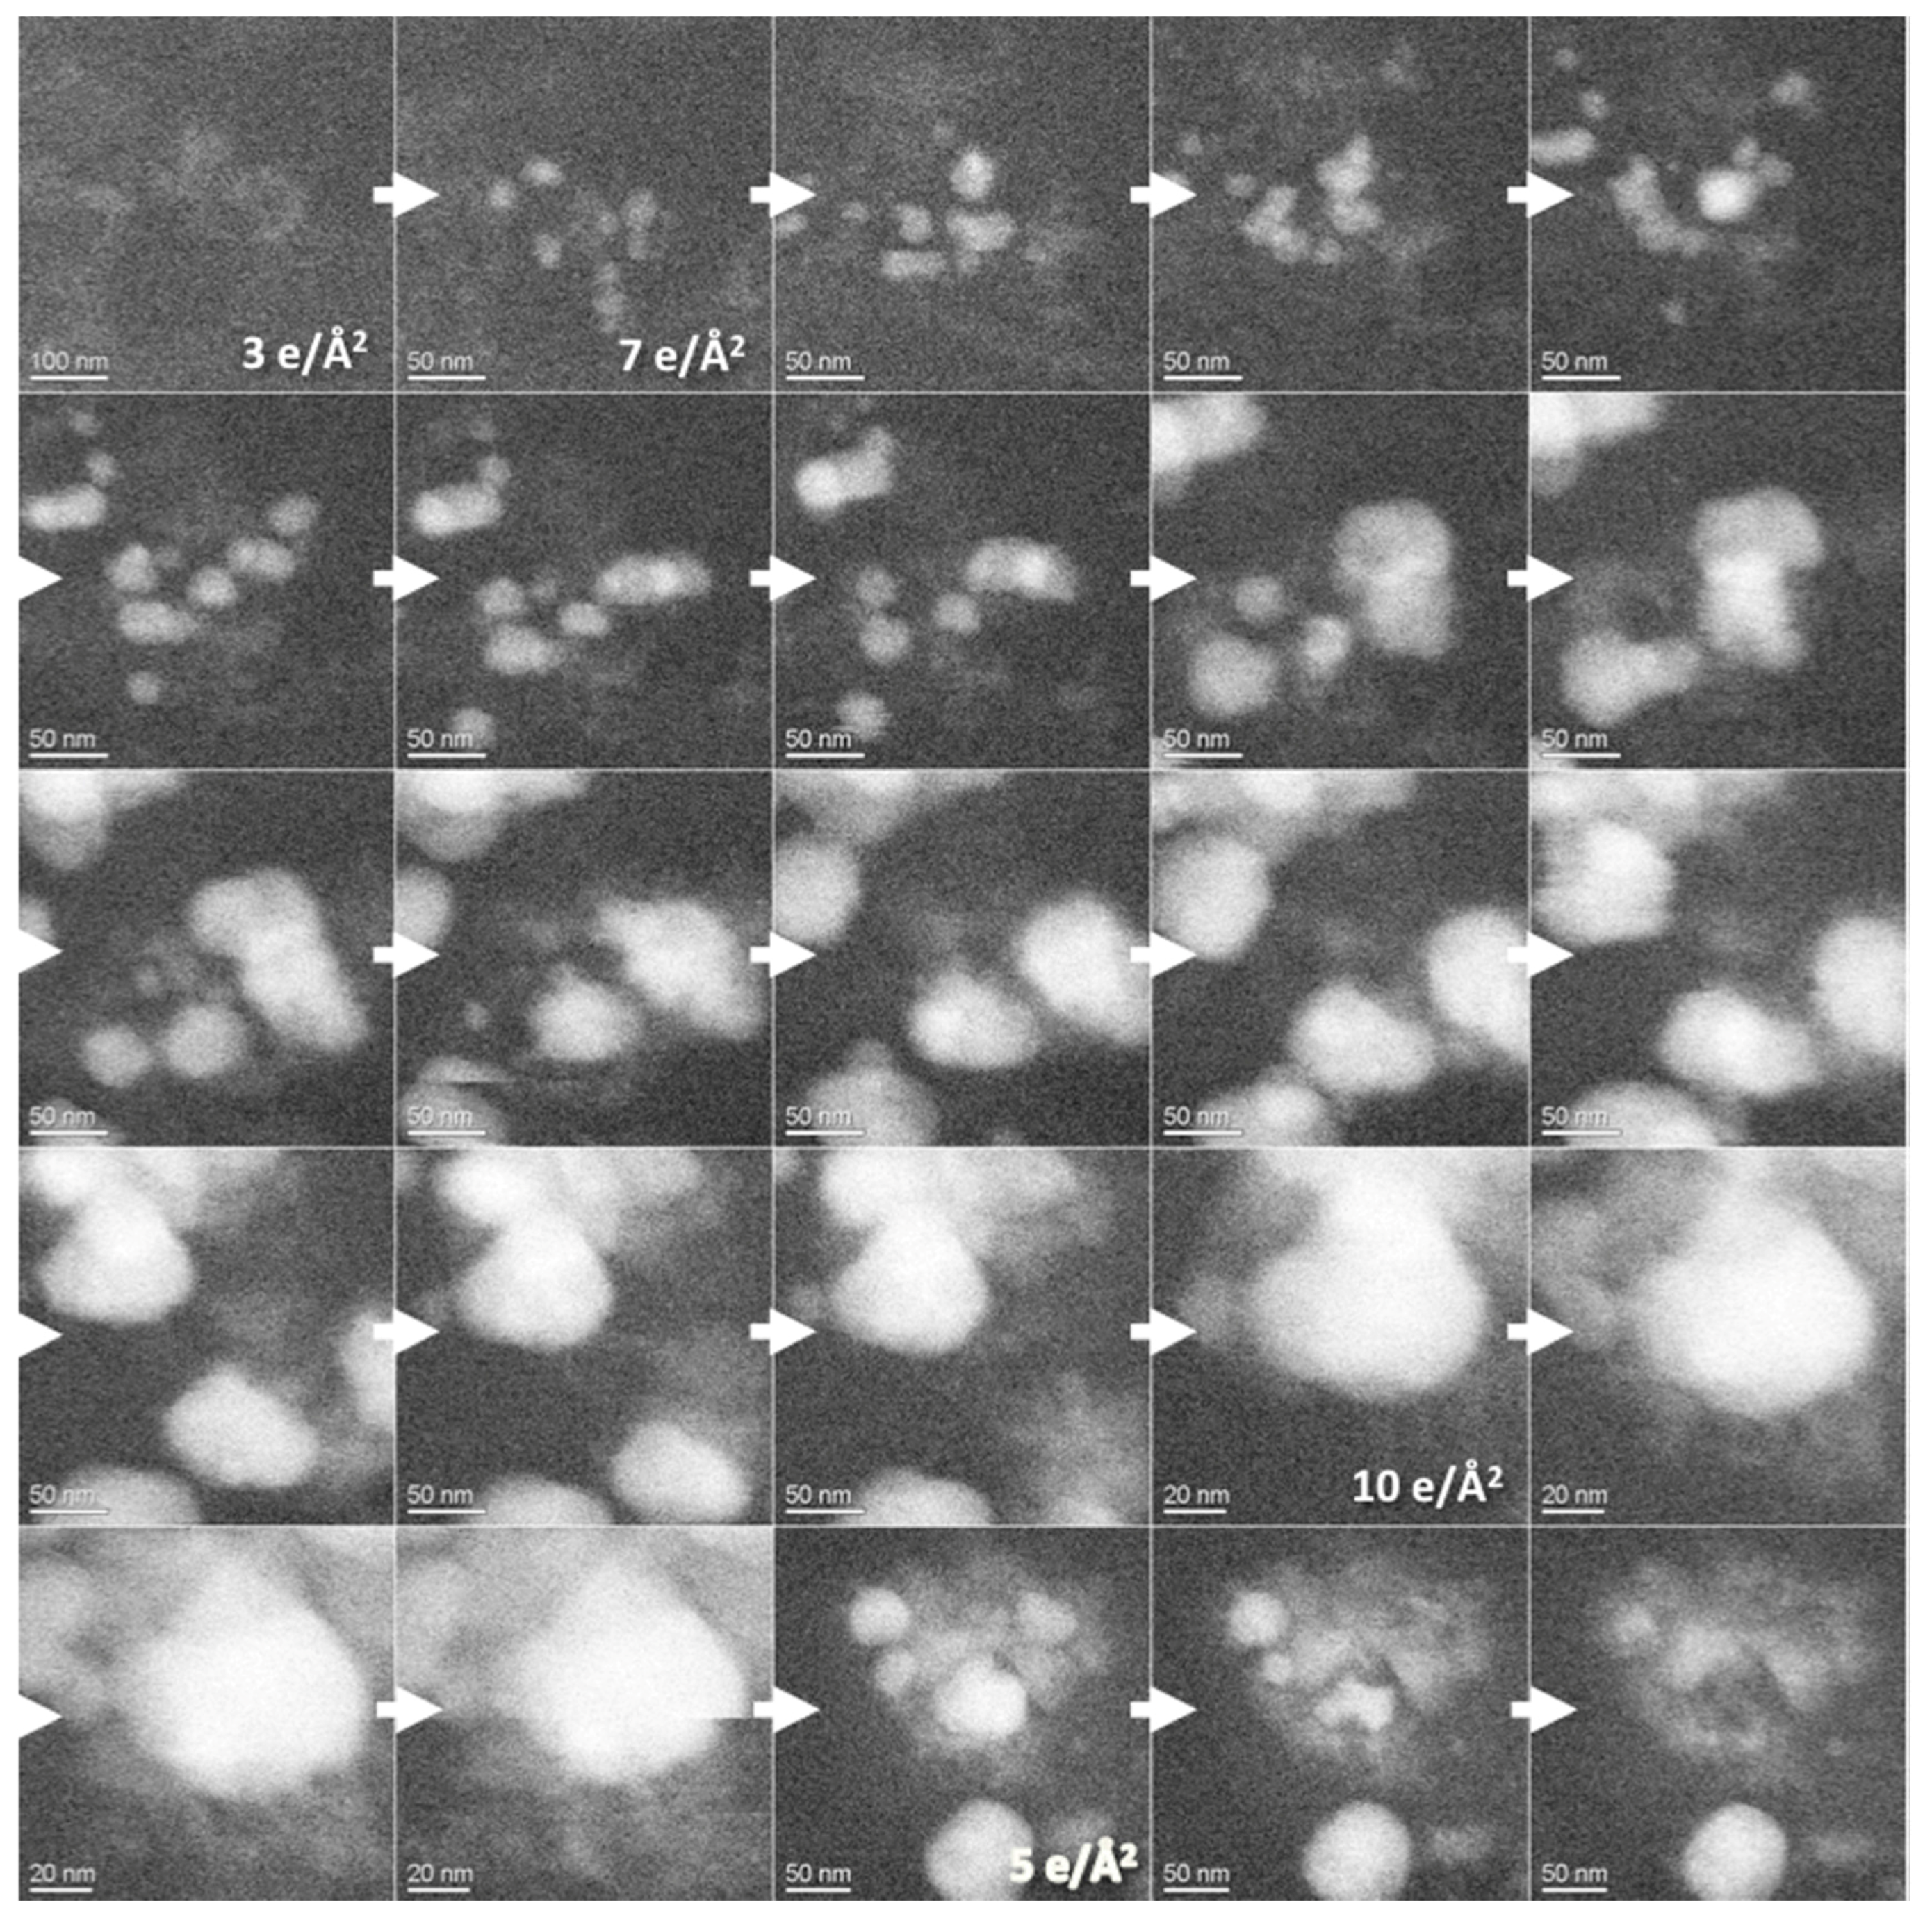
Upon the increase of magnification a spontaneous precipitation was triggered by the electron beam and, upon dose reduction, i.e., by lowering the magnification, the formed particles dissolved (see image sequence in
Figure 2). An inspection of the whole electron transparent sample area after the recording of the video sequence proved that no precipitation had occurred throughout in the absence of electron beam radiation. From the morphology of the nanoparticles we speculate that the formed particles were calcite rather than aragonite, vaterite or amorphous calcium carbonate.
A similar observation could be made when studying calcium carbonate formation in the presence of proteins where the nacre derived protein AP7 was found to lead to calcium binding and enhanced protein induced local ion concentration [
10]. These observations do not exclude a possible role of radiolysis in lowering the pH as has been reported elsewhere [
11]. However, we did not observe any bubble formation as to be expected from the CO
2 production accompanying the calcite particle dissolution resulting from a potential electron beam induced lowering of the pH value. Furthermore, the electron dose was maximal (10 e/Å
2) when the particle formation was observed in contrast to the reported pH reduction, which would lead to inhibition of nucleation and growth rather than to an enhancement. We further regard the previously reported finding that calcium and carbonate ion solution concentrations of a minimum of 20 mM were required to obtain precipitation with LCTEM as supportive for our observations [
12]. These observations raise the question of what role confinement plays in the control of crystallization. To quantitatively understand the impact of confinement on the concentration profiles established upon crystallization we therefore undertook Finite Element (FE) simulations.
4. 2D Finite Element Calculations of Supersaturation in Confinement
To study how confinement affects the dynamics of crystal evolution we assume that the precipitate consists of a bi-ionic compound constituted by divalent ions following our experimental example using Ca2+ and CO32−. If a critical nucleus of the compound AB has been formed in the center between the membranes its further growth will depend on the supply by the constituent ions A2+ and B2−. As long as the ion concentration in the vicinity of the seed precipitate is above supersaturation relative to the AB composite the crystal will continue to grow, if the concentration falls below the supersaturation level the crystal will dissolve.
Two transport determining processes need to be considered here: (i) the diffusion of ions from the boundaries of the confined region to the precipitate and (ii) the reaction rate at the precipitate surface. The first process will be driven by Fick’s second law of diffusion resulting in a second order linear partial differential equation (PDE).
where
i refers to either of the ions constituting the compound.
We employed finite element (FE) simulations to calculate the impact of constrains on the ion transport in the presence of a reactive surface emulating a precipitate in a supersaturated solution of ions. This approach was chosen since it allows for the numerical solution of the respective second order diffusion equation identifying appropriate boundary conditions at the membrane surface and entrance sites as discussed below.
For simplicity we are concentrating on the 2D solution for this PDE and steady state
DiΔ
ci = 0 with equal concentrations of A
2+ and B
2−. Our work uses a simplified system and does not aim to fully reproduce the geometry, the surface chemistry occurring in LCSTEM tips or the quantitative dependence of the precipitation on the ion activities. We neglect here the reported phenomenon of membrane bowing [
13] resulting from the pressure difference between the liquid and the surrounding vacuum. As a consequence of our simplifications we point out that the results of the simulations do not provide a complete quantitative analysis, which would require a full implementation of the (not fully available) nucleation and growth kinetics as well as the geometry of the liquid cell. Simplifications include the assumption of parallel membranes rather than the reported bowed membranes [
13], a first order surface reaction for the precipitate and a constant ion concentration at the membrane entrances.
The growth or dissolution of the precipitate is incorporated by the choice of boundary condition on the precipitate surface and can be expressed as:
where
kg is the surface reaction rate and the relative supersaturation Ω is given by
with
ceq denoting the supersaturation concentration of the respective ion. We assume equal concentrations of the anions and cations so that
ceq can be determined from the square root of the solubility product
Ks (for calcite at 25 °C:
Ks = 3.36 × 10
−9 mol
2/dm
3) [
14].
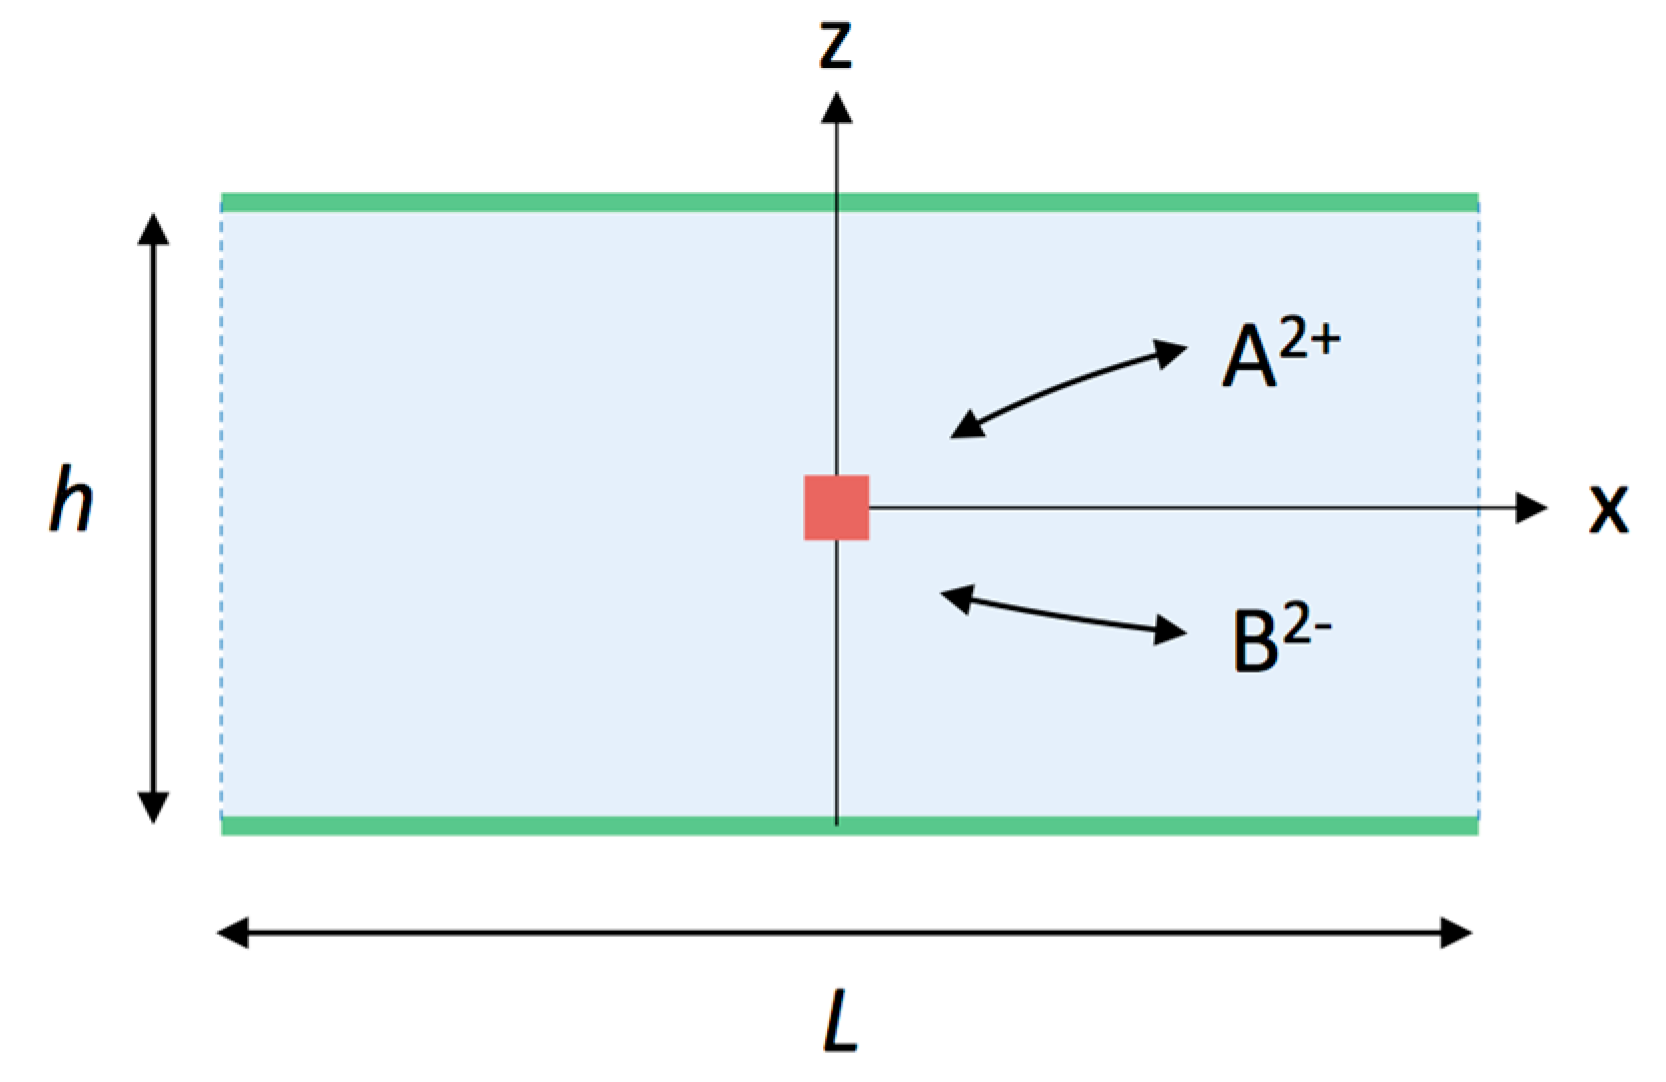
The characteristic parameters for this problem are shown in
Figure 3 where
h is the spacing between the membranes and
L the lateral extension of the smaller of the two chips as shown in
Figure 1. We have used a square shaped precipitate geometry with a lateral size of 1 nm.
The boundary conditions applicable to this problem are no-flux conditions at the confining walls (the SiN membranes at z = ±h/2) and constant concentrations ci = 10 mM at x = ±L/2. We assume L = 5 mm and that the precipitate is much smaller than h Hence we do not take the change in precipitate size into account effectively assuming that steady-state is reached faster than the time scale associated with particle growth or dissolution.
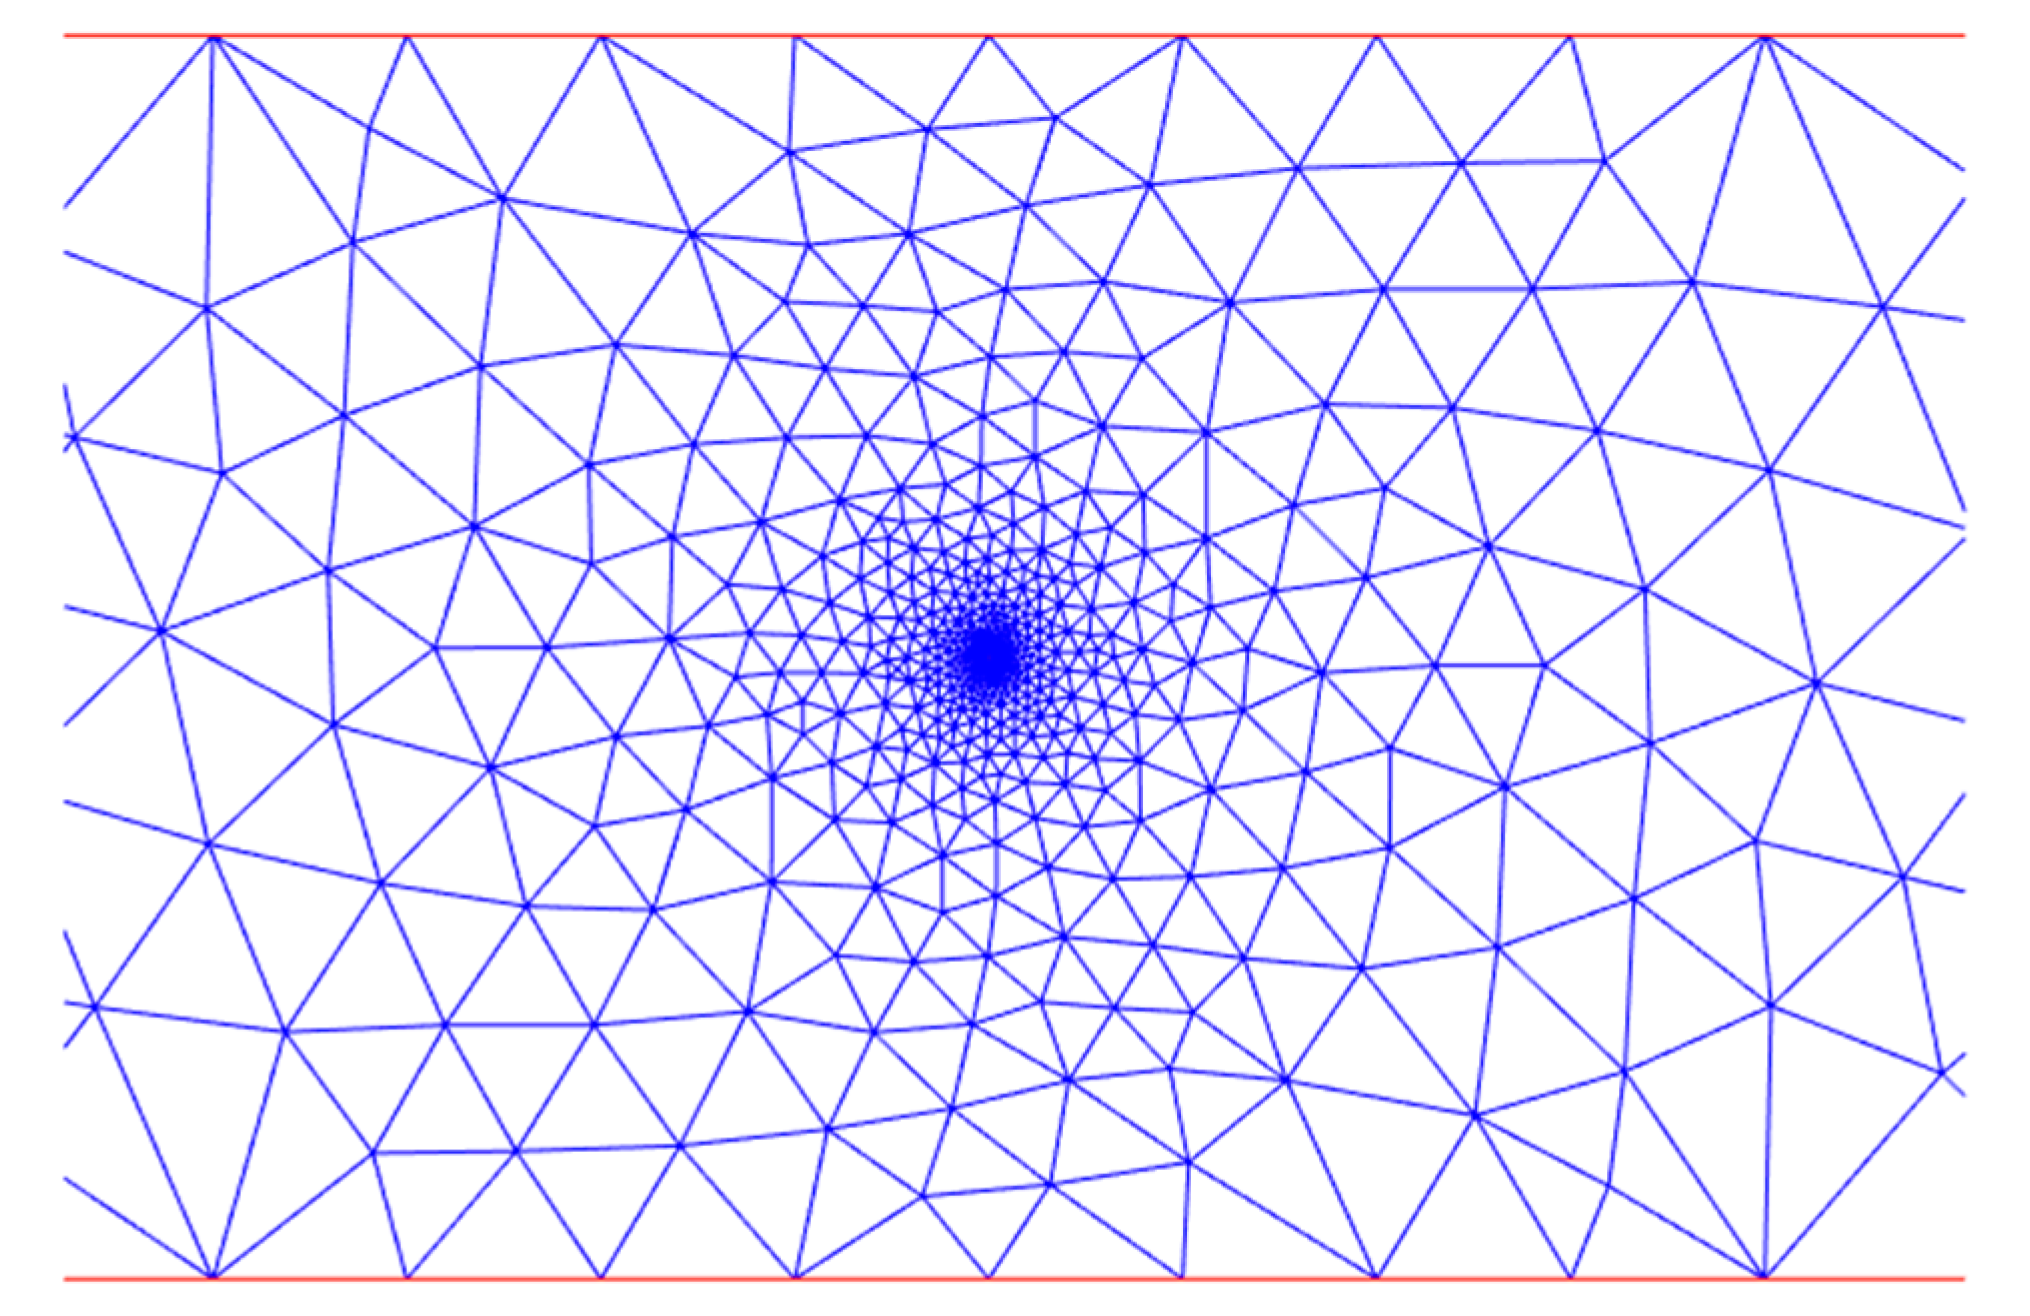
To calculate the resulting concentration profiles a mesh was created with a refined node density around the precipitate as shown in
Figure 4. The number of nodes number is adapted to the values of
h and
L.
We approximated the dependence of growth and dissolution rate on supersaturation using a rate constant of
kg = 1.7 × 10
15 m
2/s in accordance with values reported in the literature for the precipitation of CaCO
3 from supersaturated solutions of calcium and carbonate ions [
15]. 2D solutions for the partial differential equation were obtained choosing following parameters:
D = 9.0 × 10
−10 m
2/s [
8] and
assuming equal concentrations for cations and anions. Calculations were performed for membrane separations between 100 nm and 10 mm with the latter case effectively representing the absence of confinement.
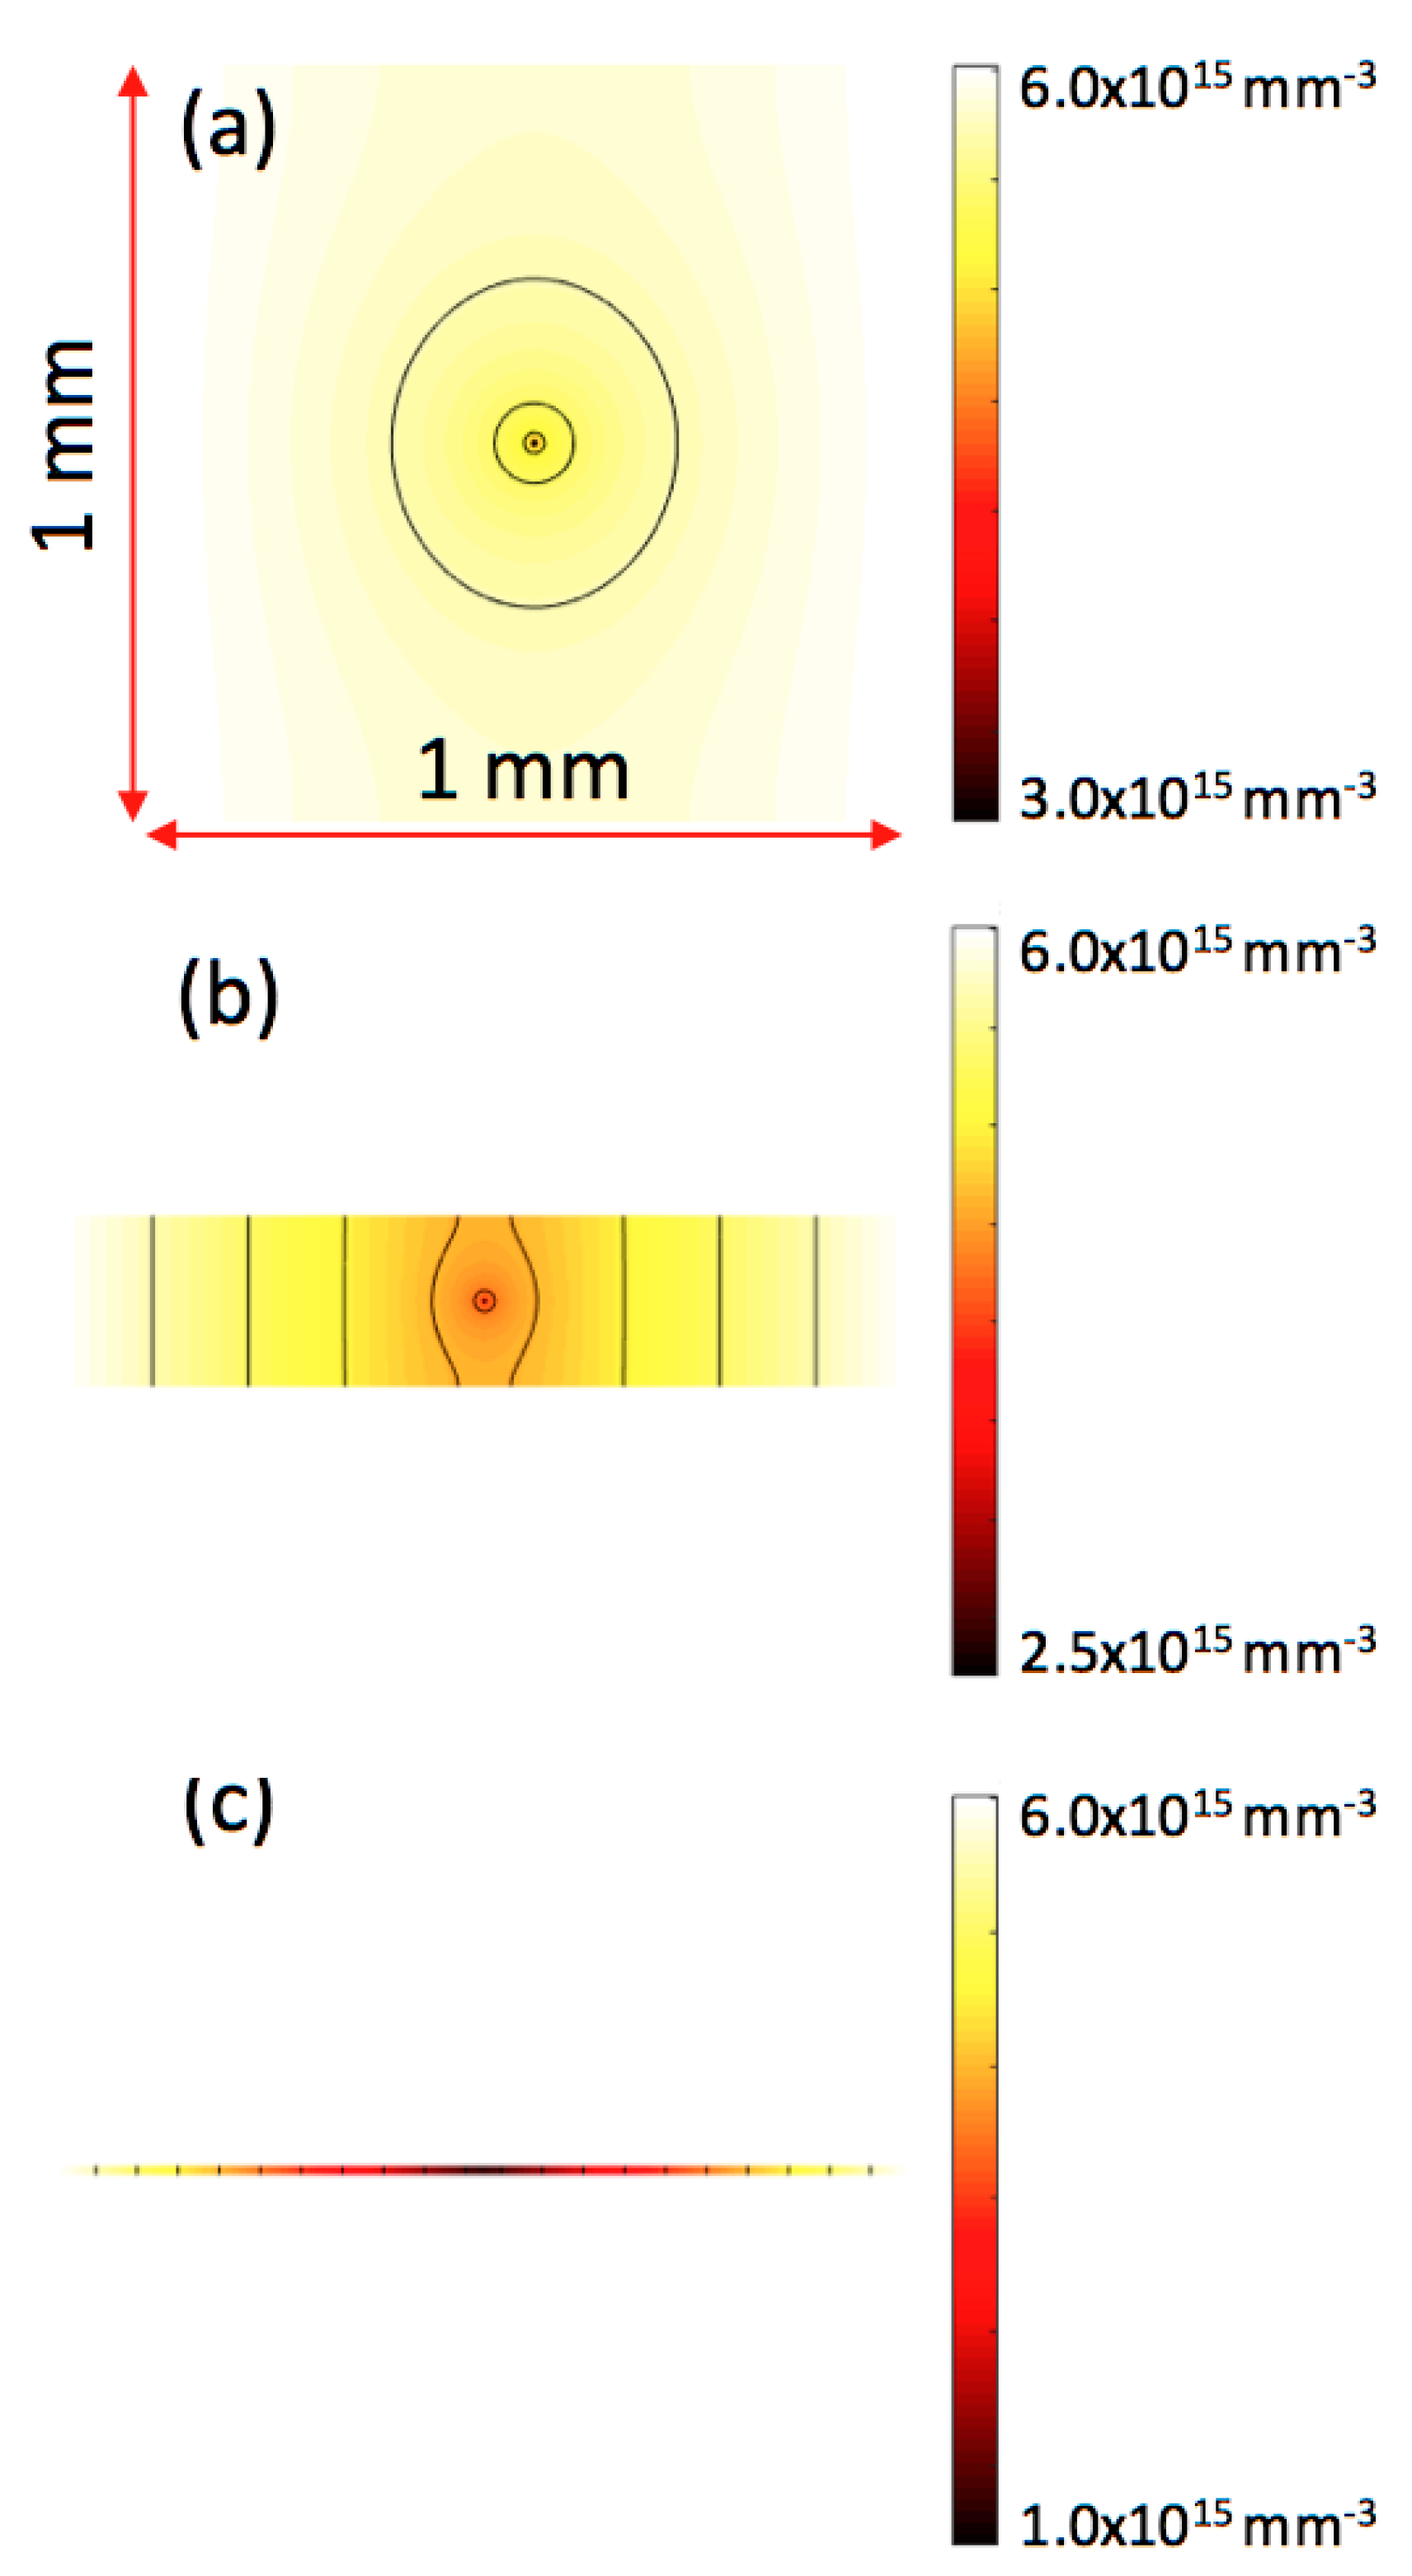
The results of the 2D numerical calculations of Equation (1) using the mentioned boundary conditions show how the concentration profile around a precipitate is affected by increasing confinement under steady state conditions.
Figure 5 shows three concentration maps with a steep recovery of the bulk ion concentration in the vicinity of the precipitate if essentially no confinement is applied (
Figure 5a), an increasing depletion of ions around the precipitate when a confinement of 10 µm is applied (
Figure 5b) and a significant ion depletion for a confinement of 1 µm (
Figure 5c).
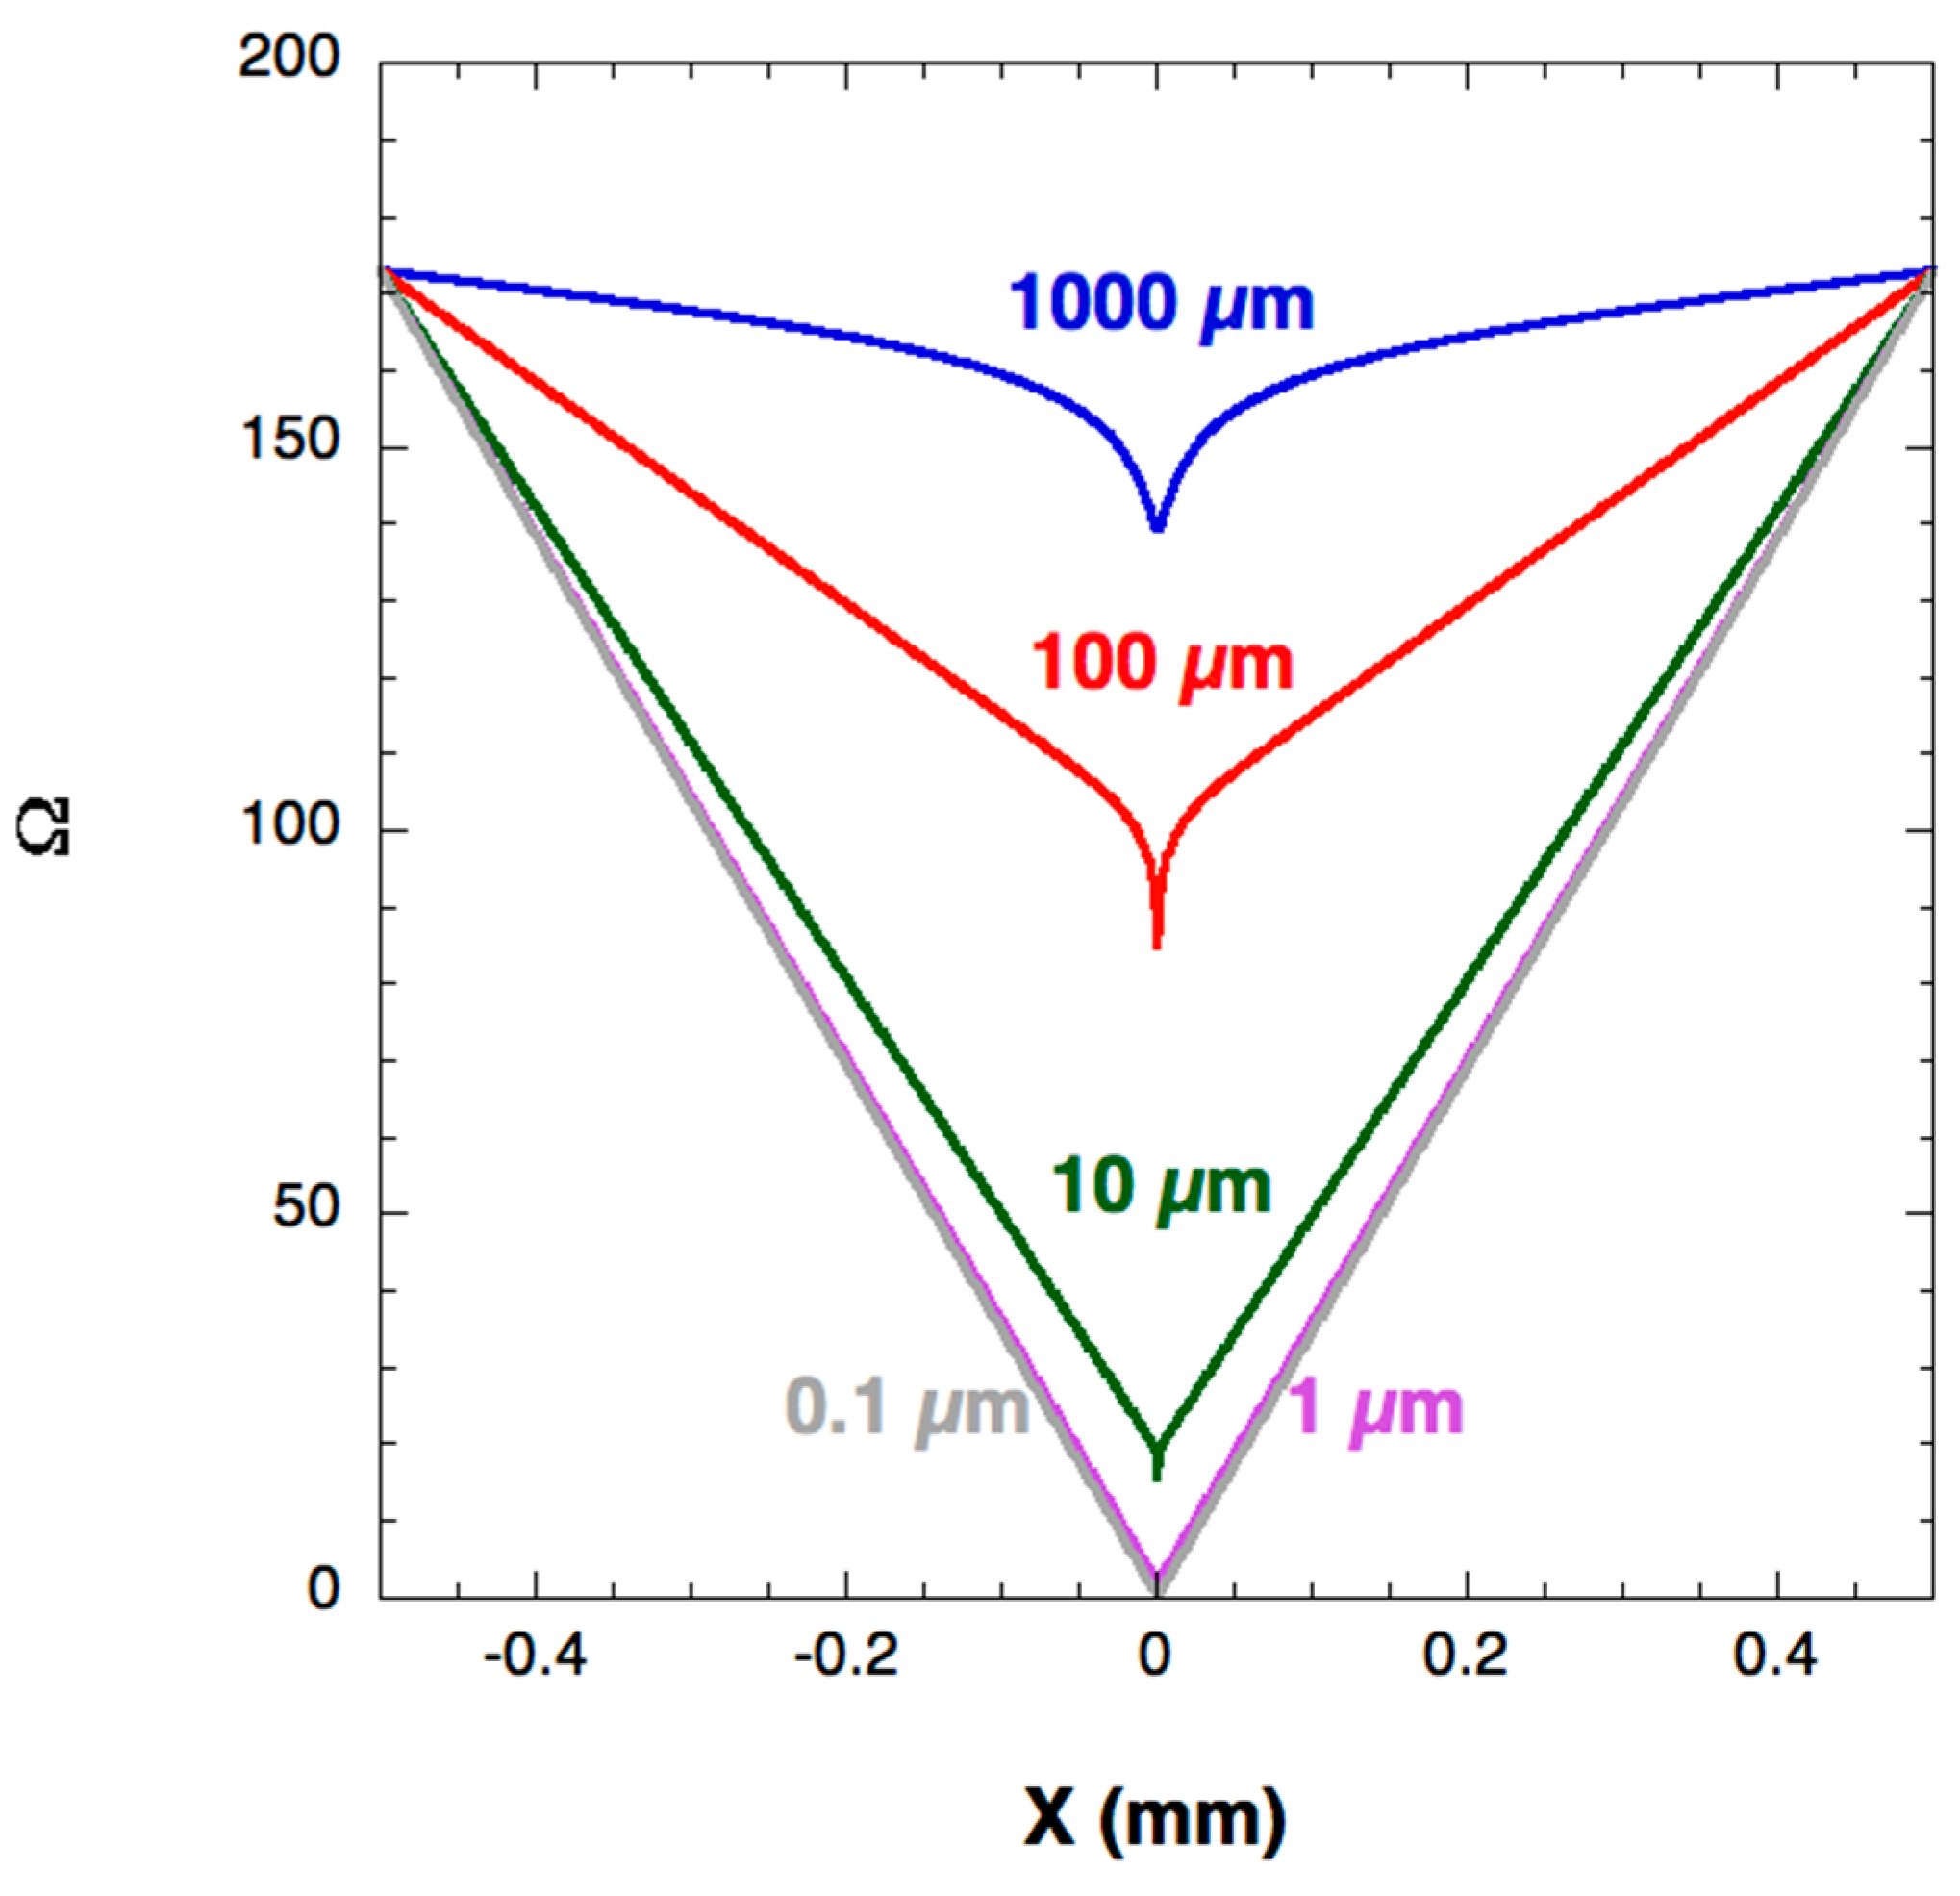
Concentration line profiles for different values for
h from
x = ±
L/2 across the precipitate at (0, 0) are plotted in
Figure 6. Due to the diffusion transport and the steric limitations the concentration profile shows a decrease of ion concentration at the precipitate position depending on the extent of confinement. The change in supersaturation is small for spacer values below 1 µm and above 1 mm (which is not experimentally realized). These calculations do not take into account temporal variations since we are focusing here on the steady state situation. However, from this we can already derive important information regarding the impact of confinement and growth rates on the concentration profiles and hence ion transport properties.
The incorporation of ions from solutions into the growing precipitate leads to a decrease of ion concentration and hence supersaturation in the immediate vicinity of the precipitate. The resulting concentration gradient drives the continued flux of ions from the solution to the precipitate. As mentioned, our simulations only consider a steady state between ion incorporation and supply and do not take into account the impact of supersaturation on nucleation. However, we can assume that simultaneous nucleation of neighboring precipitates will lead to an enhanced ion-depletion in solution and hence our problem provides an upper limit for the impact of confinement on supersaturation.
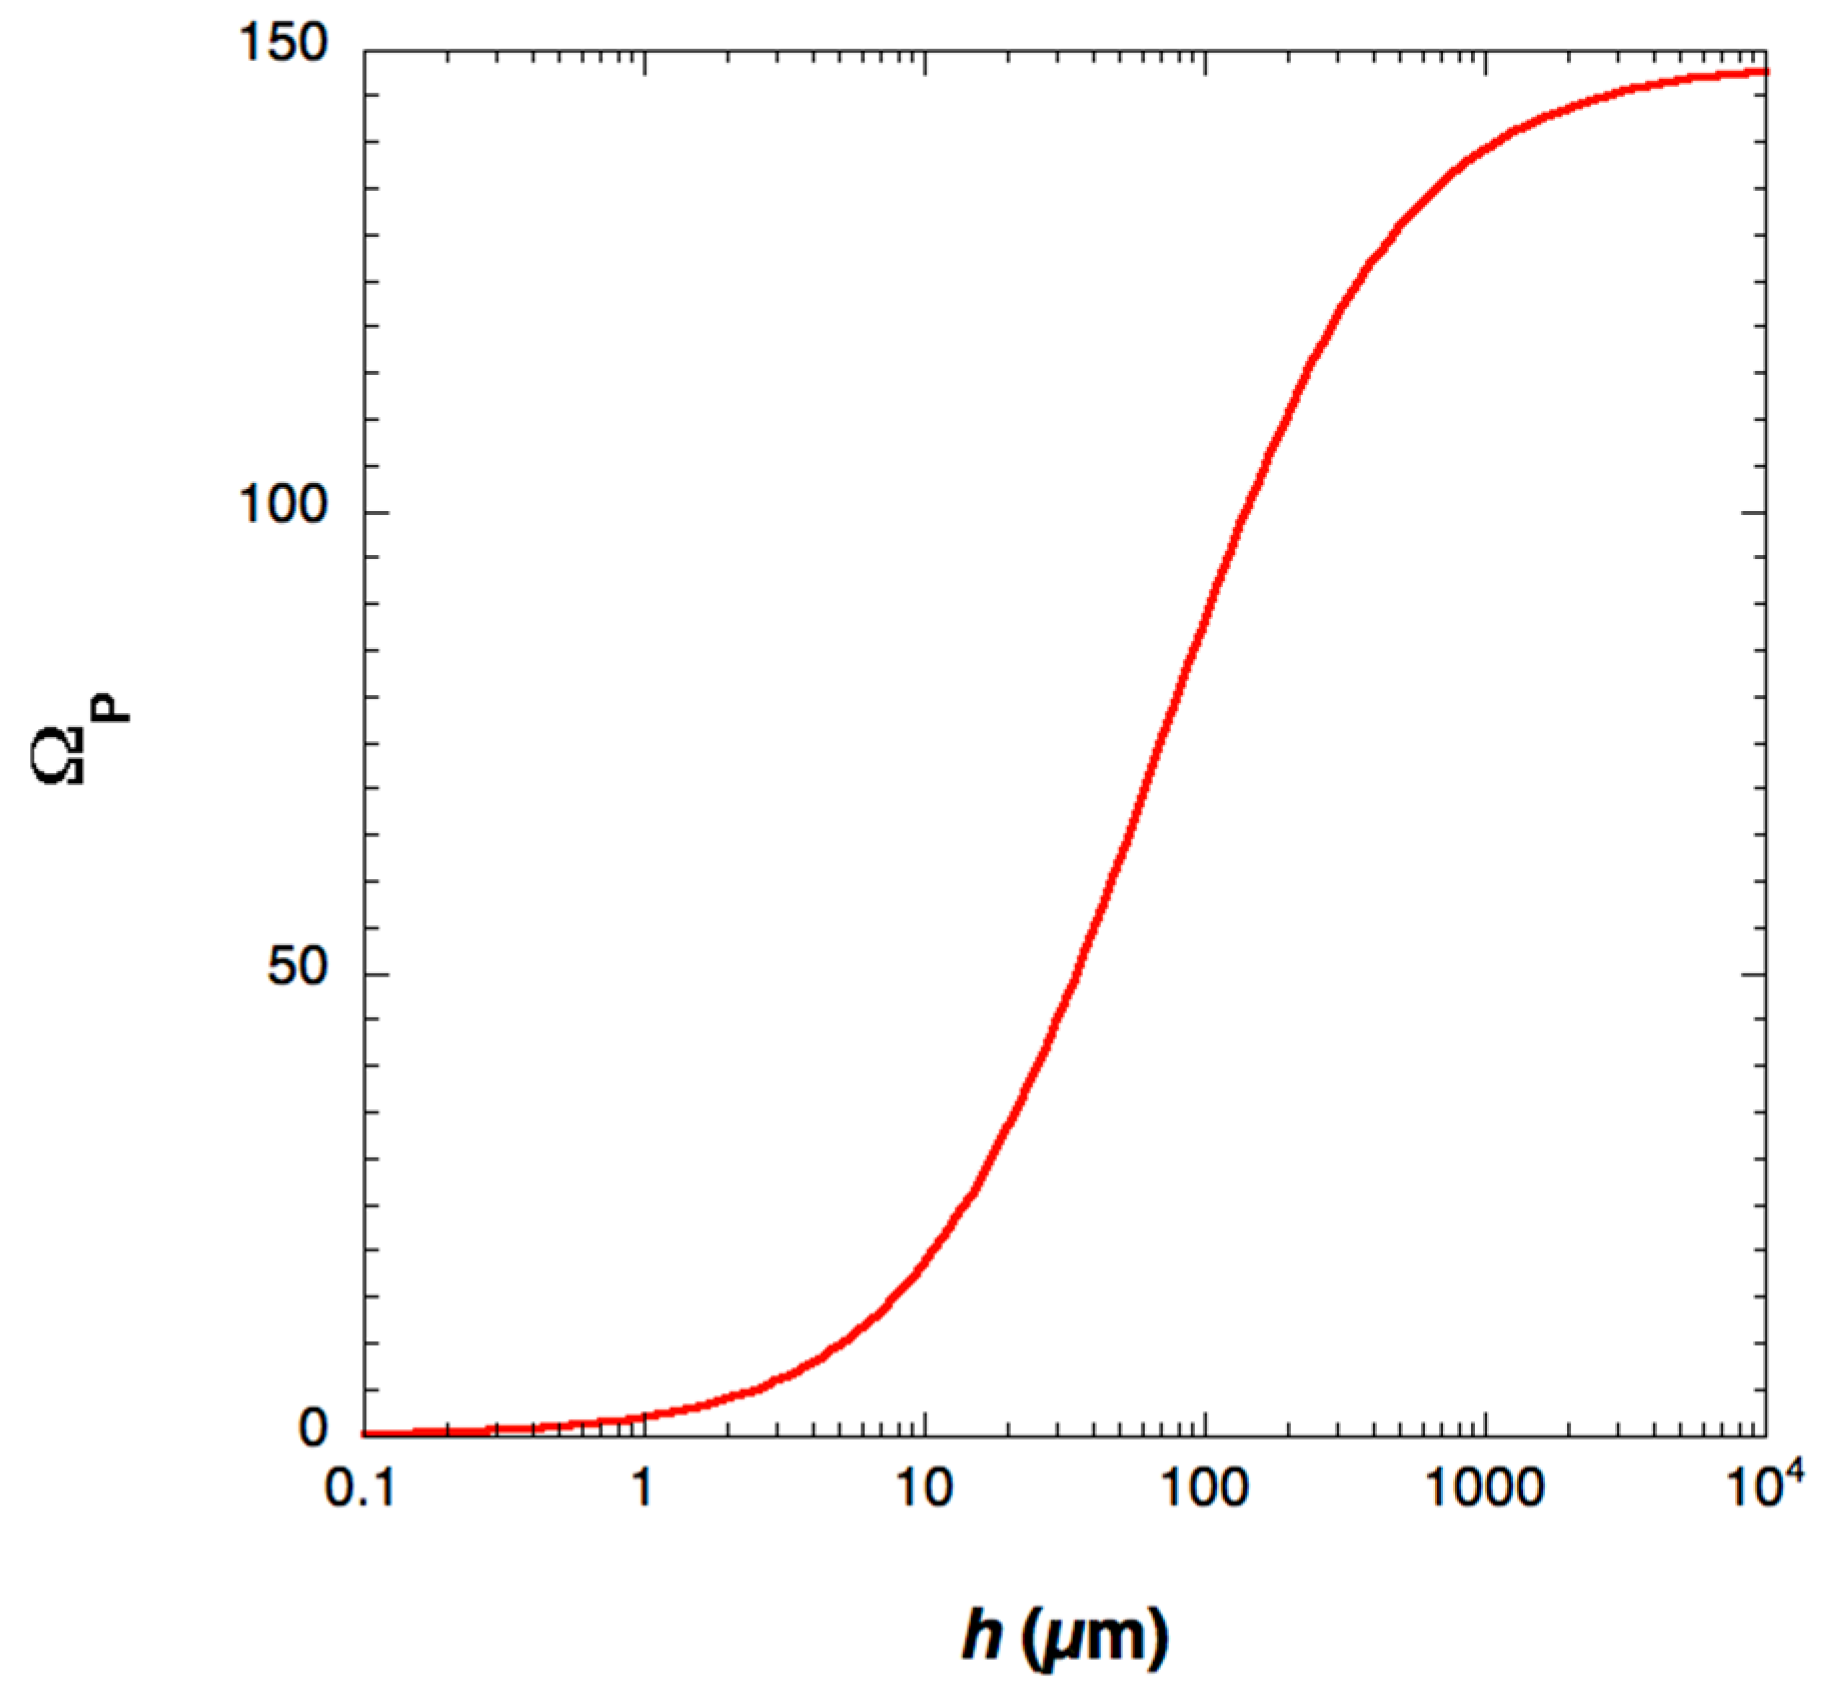
The change of supersaturation at the precipitate position as a function of
h is shown in
Figure 7 and shows a sharp drop of supersaturation to values close to zero for
h values below 1 µm and a steep increase and saturation near values of 150 above 1 mm spacing between the membranes.
These calculations provide insights into the impact of spatial confinement on the ion concentration and hence supersaturation levels in the presence of stable nuclei. Since the nucleation rate scales with exp(−
Aγ3/ln(Ω)
2) [
16], where
A is a constant and
γ denotes the interfacial energy (i.e., between precipitate and the membrane), confinement also forms a barrier for nucleation [
17]. Hence, both nucleation and growth are significantly diminished in this case.
The simulated supersaturation at the precipitate position as a function of h was fitted in the range 0 < h < 104 µm by the relation.
Equation (4) evinces a significant reduction of the supersaturation for a confinement of 70 µm and lower in our case. For typical spacer values of 5 µm and below Ω decreases to <5 and hence to less than 3% of the bulk value leading to reduced growth rates or, if Ω becomes negative, depending on pH and concentration, can result in a dissolution of the precipitate. We conclude that the confinement can considerably affect the stability of precipitates and hence leads to a reduction of both nucleation and growth if ion activities fall below critical levels.
We have ignored in our considerations the impact of complexation and hence ion removal from solution at the given supersaturation levels, which would lead to a further reduction of ion concentrations around the precipitate. However, this would primarily impact the density of available ions overall without affecting the qualitative validity of our observation.
As previously reported the ion transport to the crystal growth front in 10 mM calcium and carbonate ion solutions occurs through an ion depletion zone resulting from the ion incorporation into the growing crystal [
18]. The zone width has been found to be of the order of 4–5 µm [
10] under standard conditions. These experiments had been performed using atmospheric SEM observing precipitation in a petri dish through a Si
xN
y membrane in the bottom of the dish with no restriction of dimensions. In that case, the ion supply occurs from the bulk of the solution. We regard the width of the depletion zone as the limiting factor for the growth in confinement coinciding with our observed reduction in supersaturation if the confinement is reduced to similar values. It has also been shown that confinement in one dimension to below 10 µm has a strong impact e.g., on the morphology and polymorphism of calcium carbonate [
19]. Our observations indicate that a reduction below 1 µm has further repercussions for the overall stability of a solid phase.


