
Characterization of Tableware from Fábrica de Loiça de Sacavém—Linking Analytical and Documental Research


 , , , ,
Abstract
:1. Introduction
2. Materials and Methods
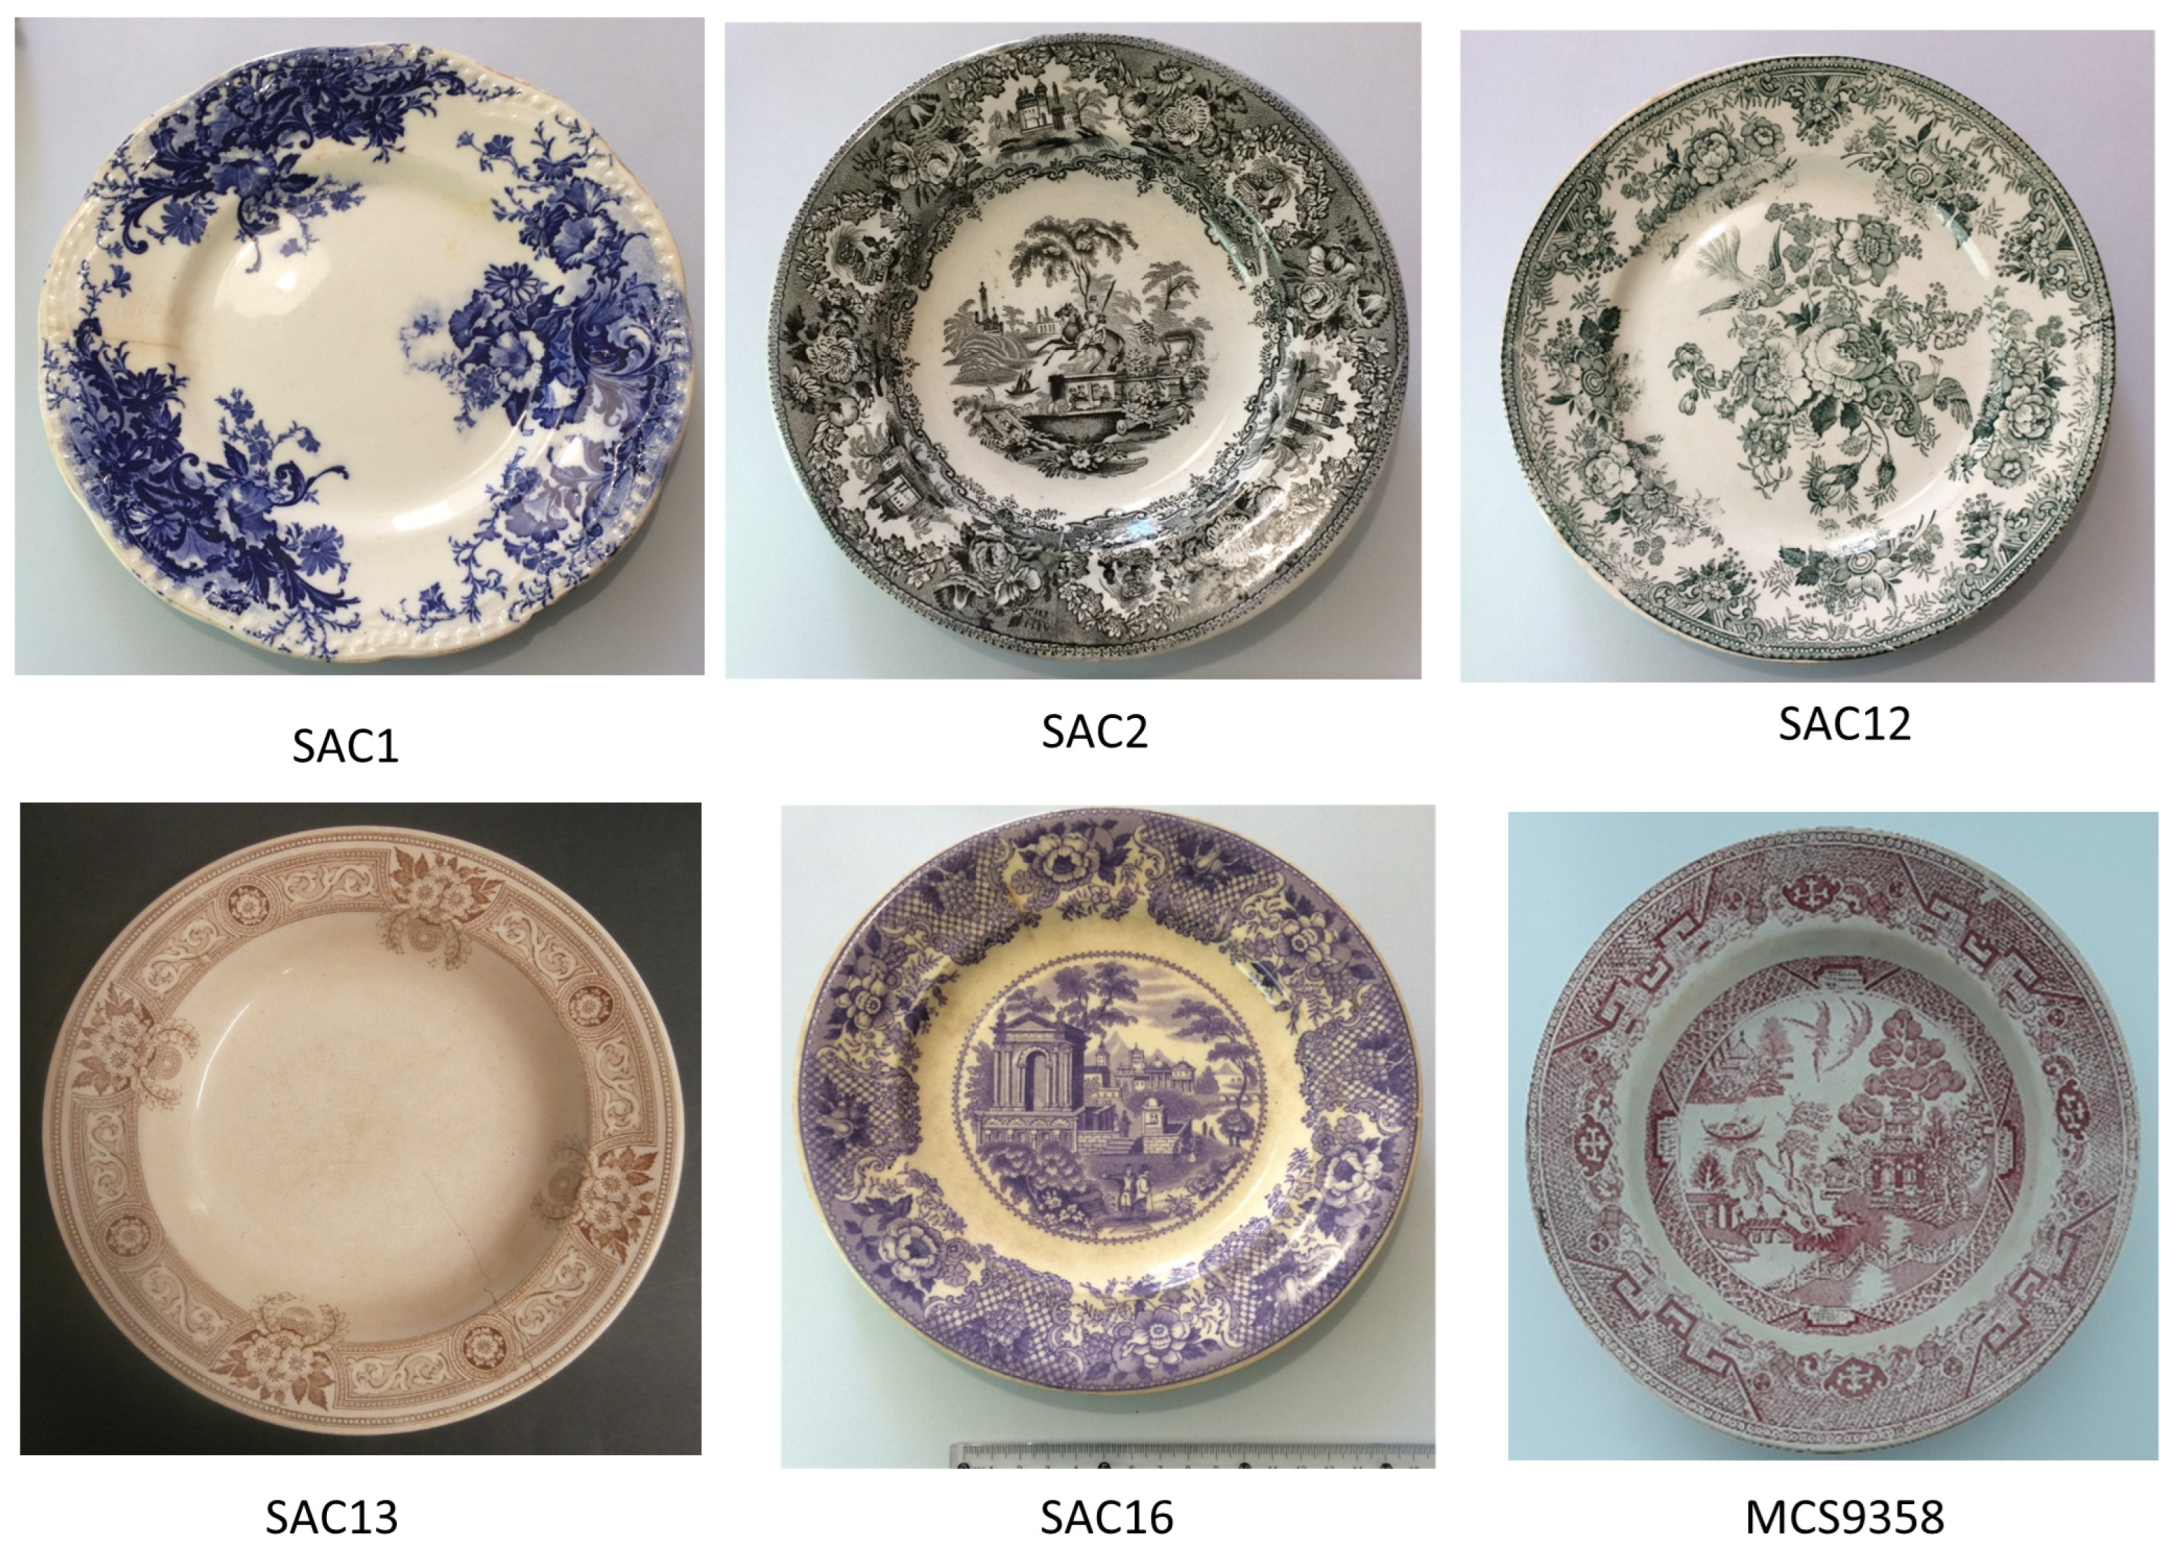
2.1. Materials
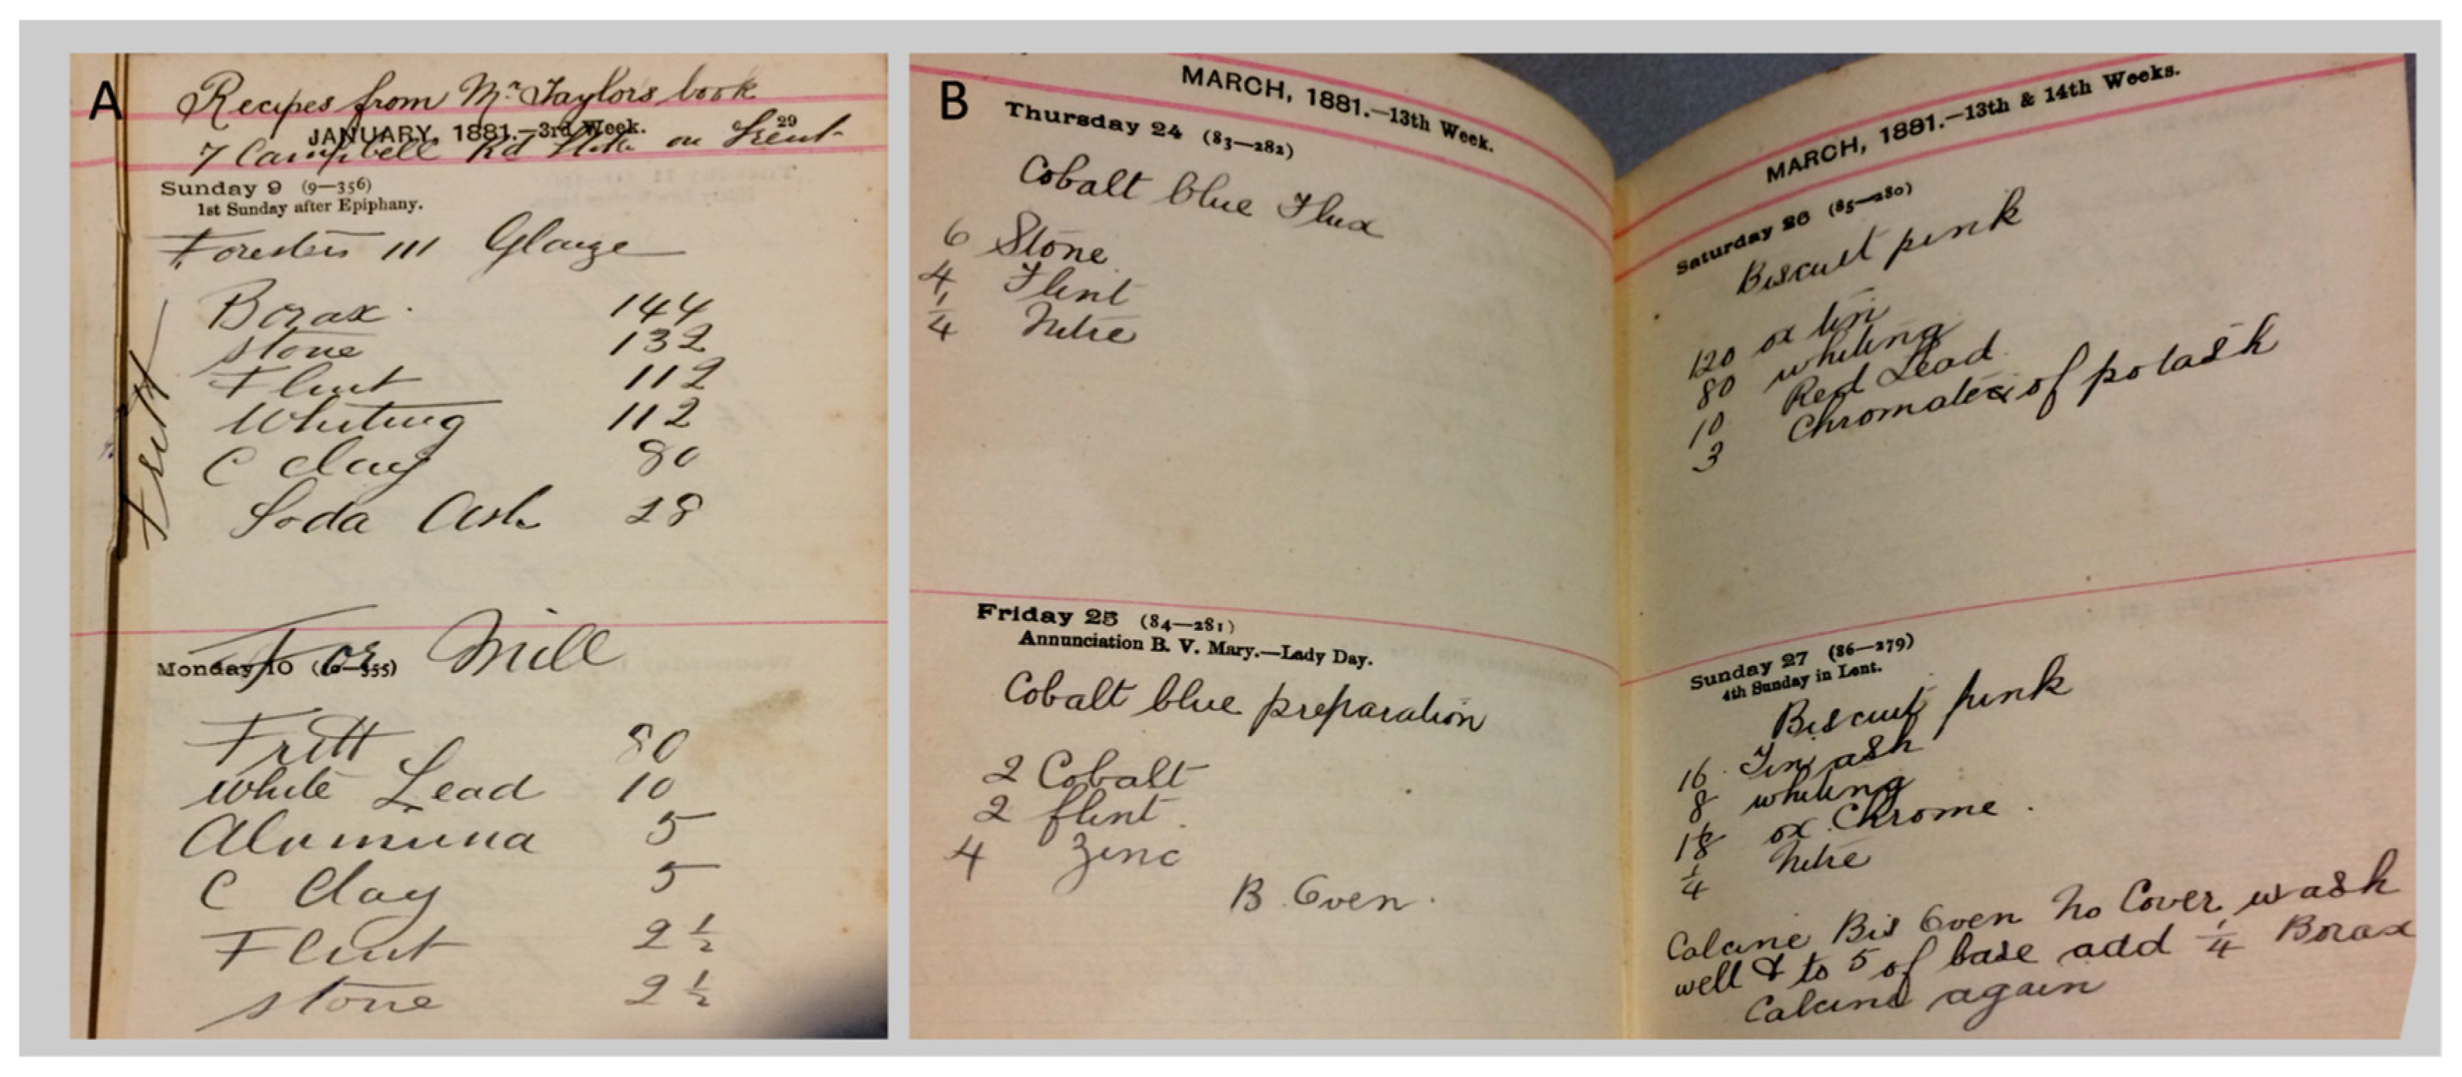
2.2. Manuscript from the Archive of Fábrica de Loiça de Sacavém
2.3. Analytical Approach
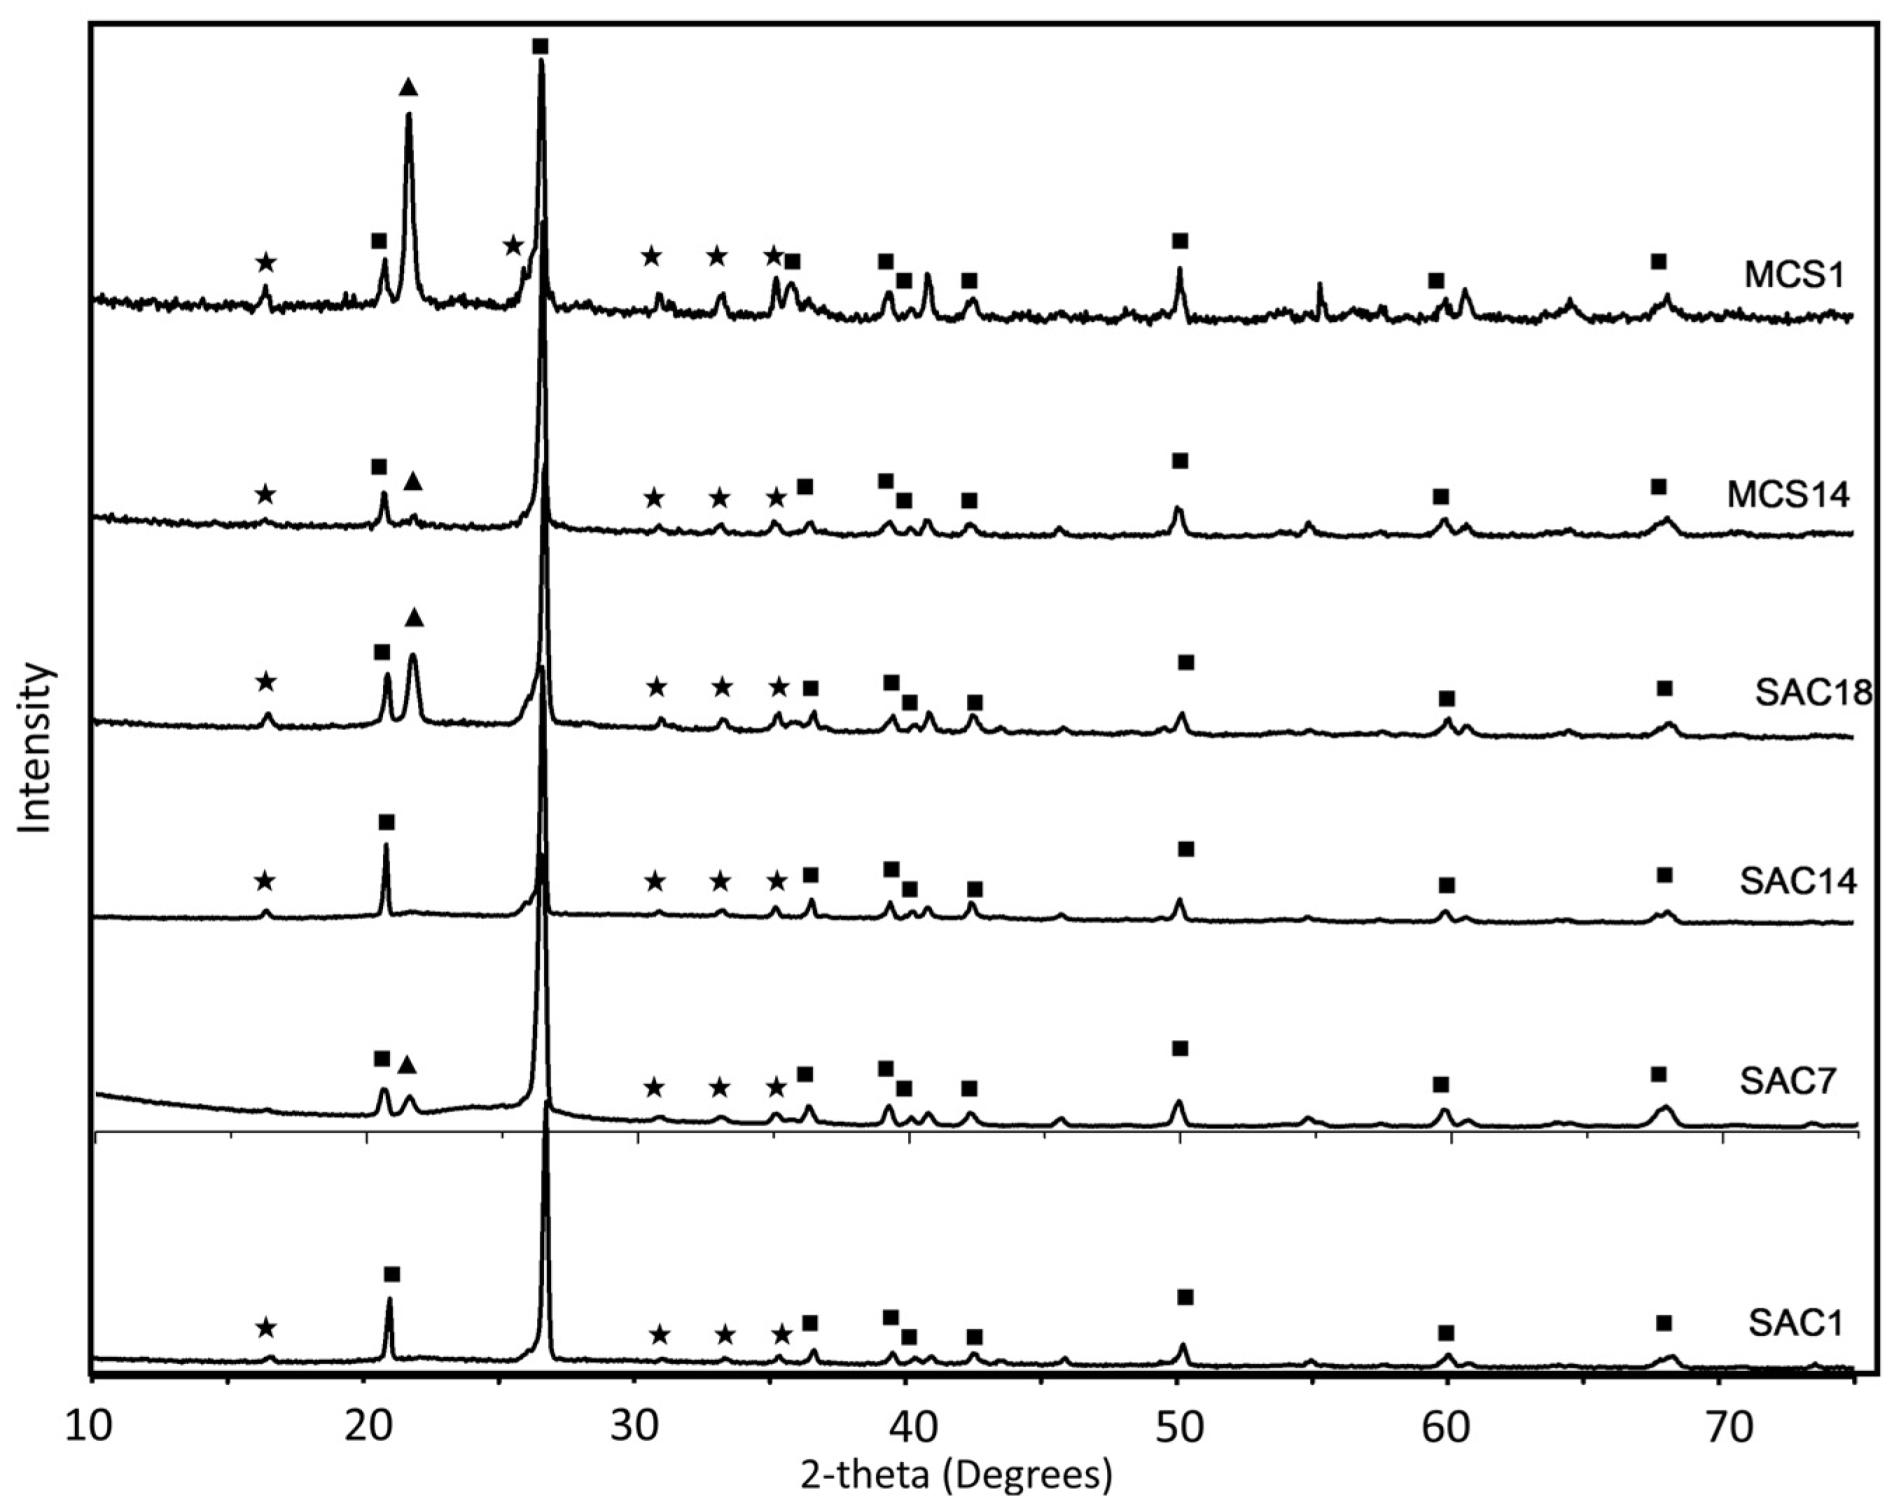
2.3.1. X-ray Microdiffraction (Micro-XRD)
2.3.2. Vis-SWIR Reflectance Spectroscopy
2.3.3. Optical Microscope (OM)
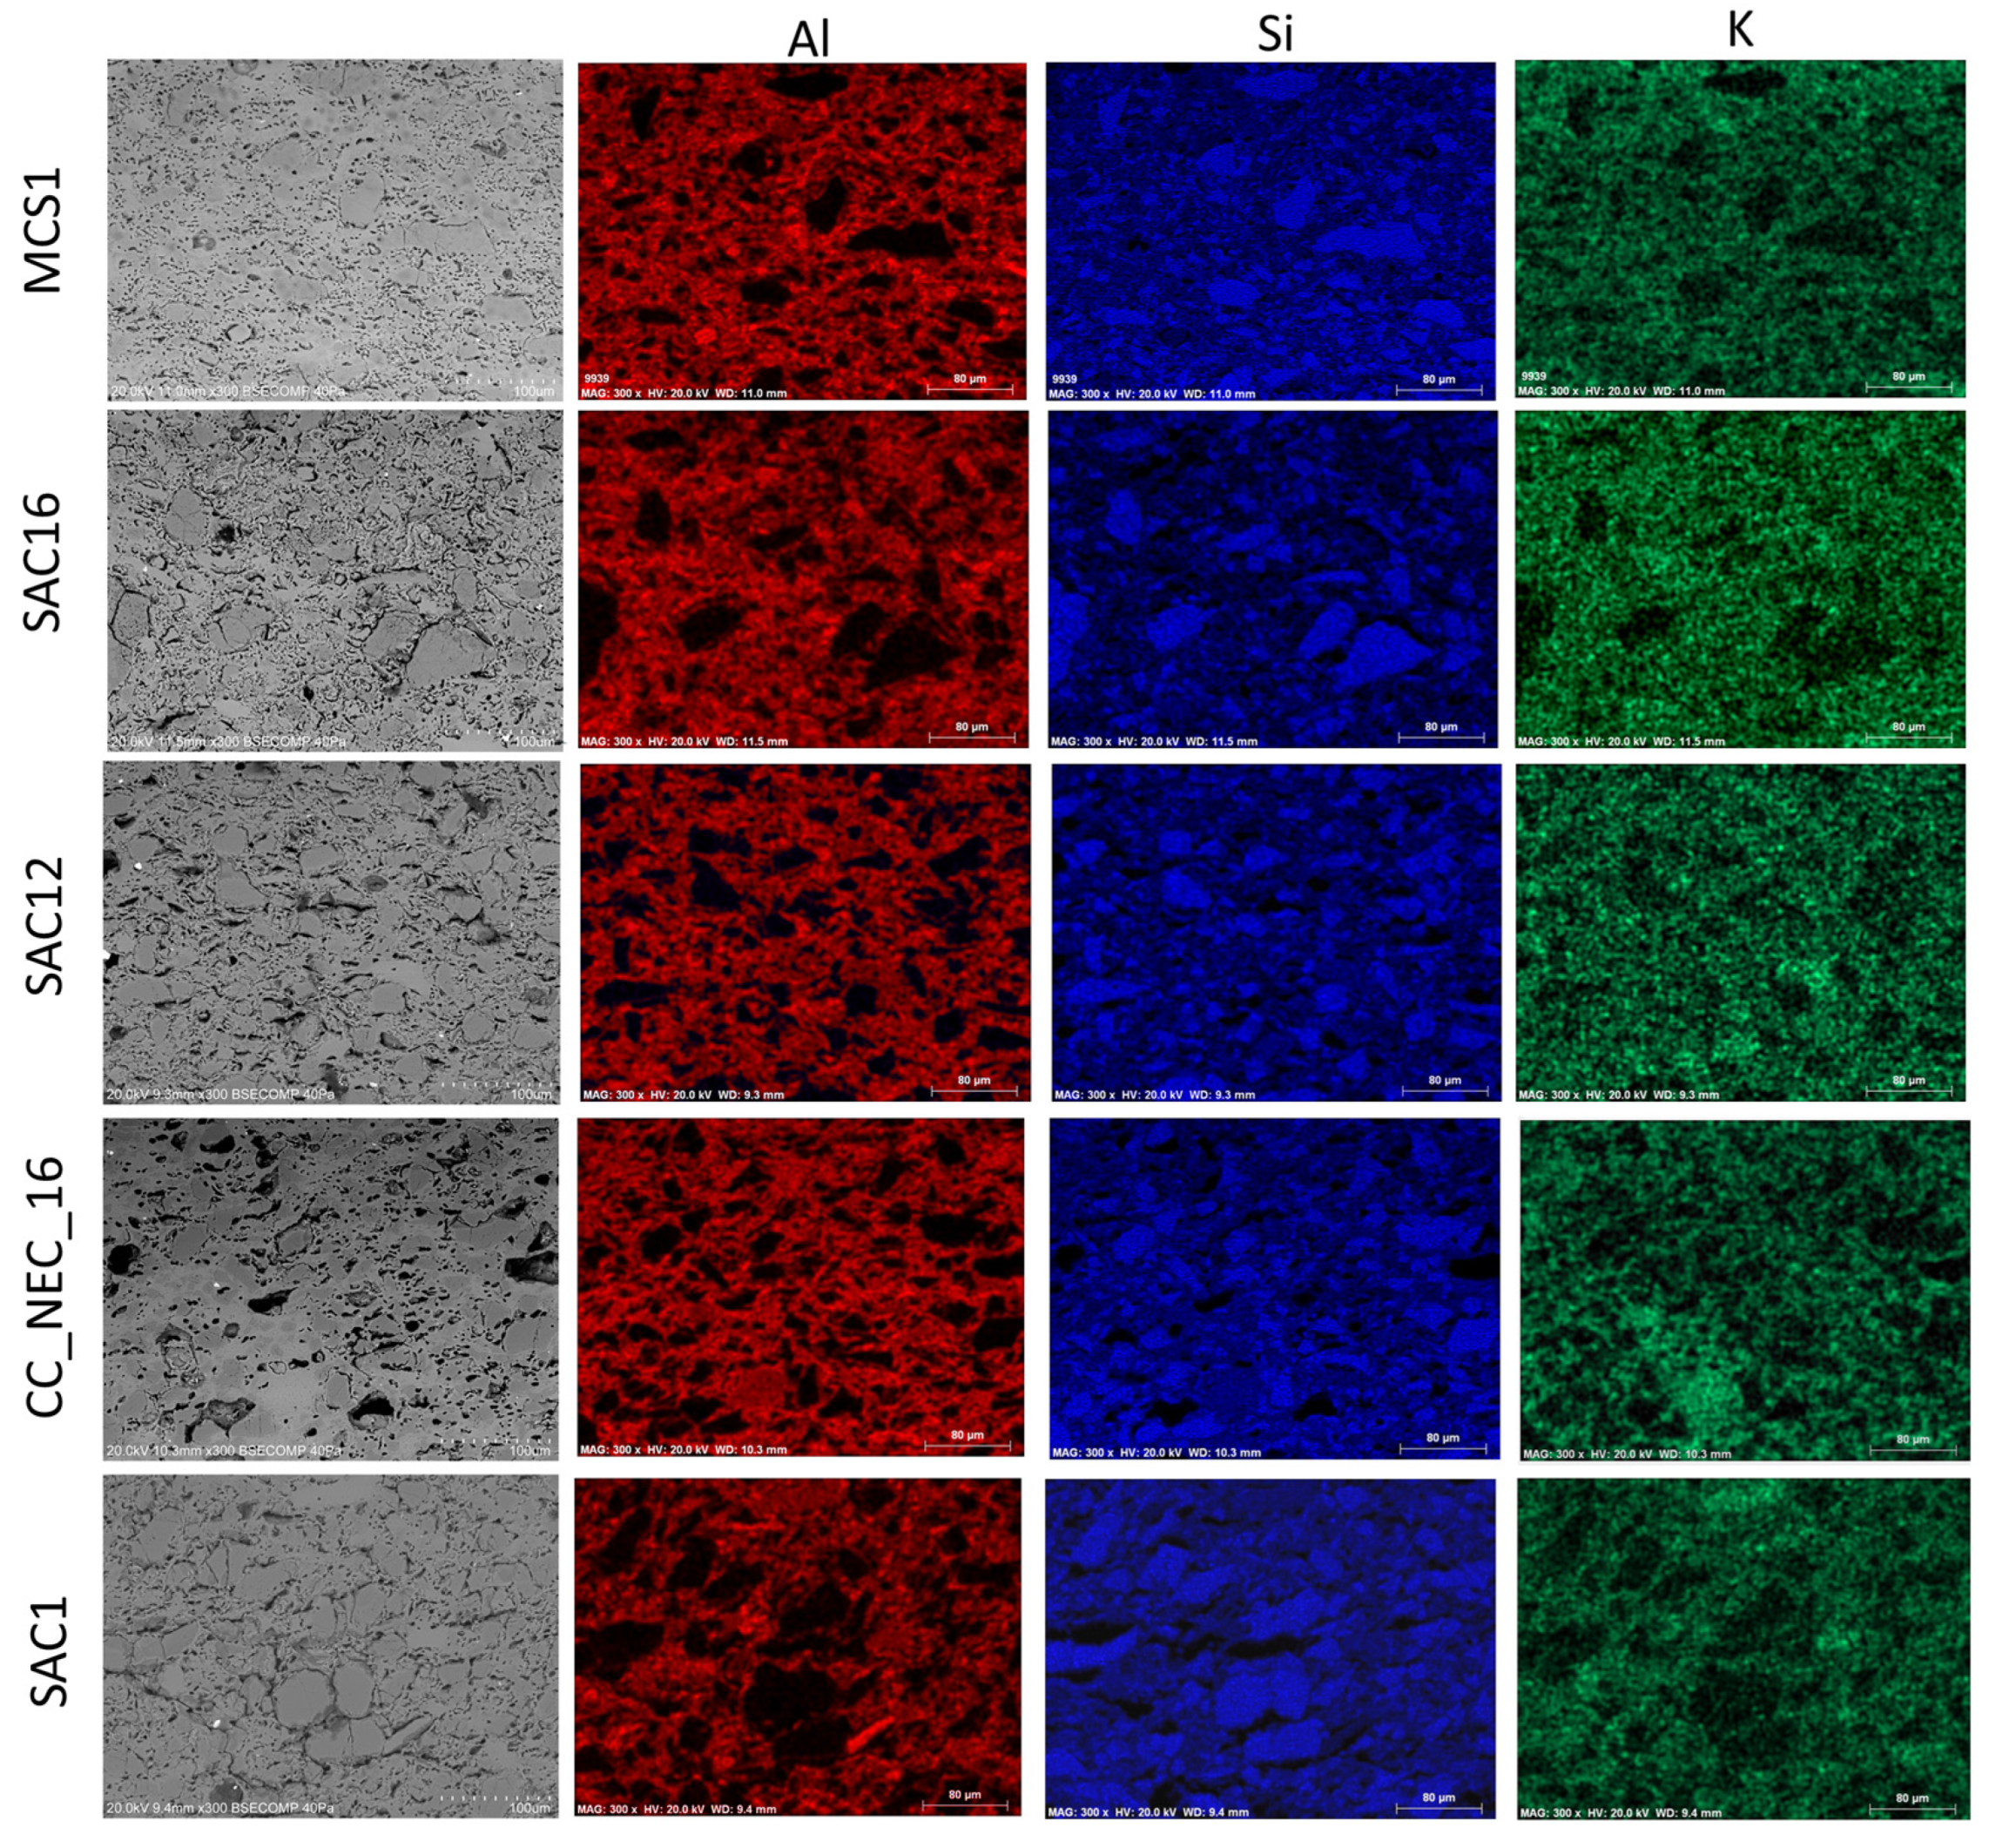
2.3.4. Variable-Pressure Scanning Electron Microscopy—Energy-Dispersive X-ray Spectroscopy (VP-SEM-EDS)
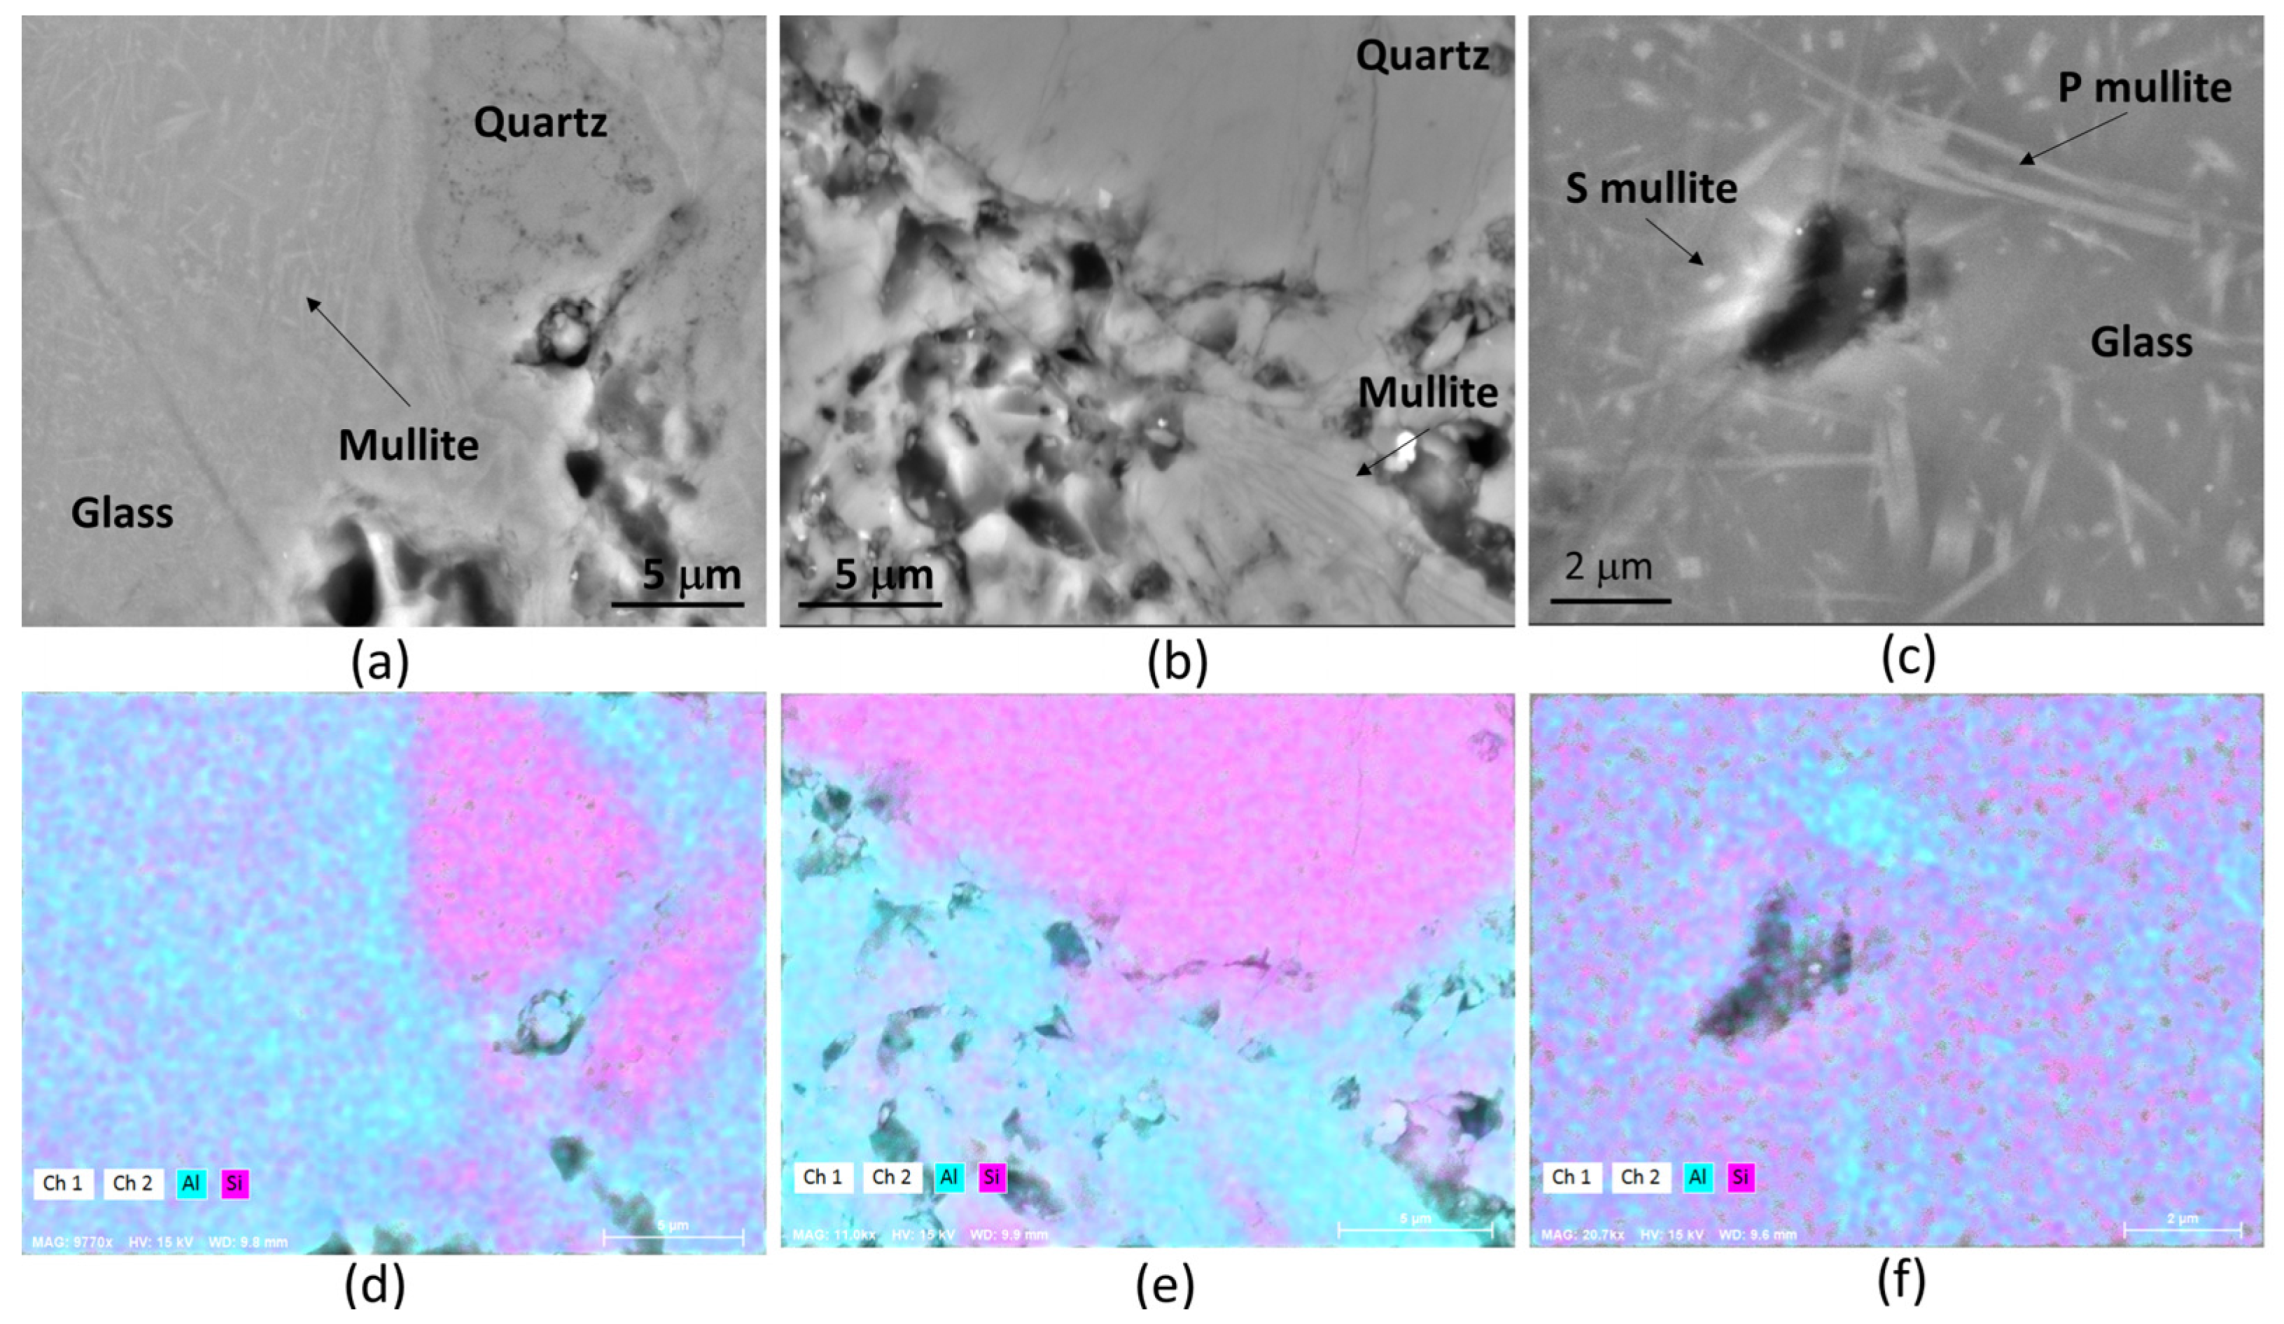
2.3.5. Field Emission Scanning Electron Microscopy—Energy-Dispersive X-ray Spectroscopy (FE-SEM-EDS)
2.3.6. Micro-Raman Spectroscopy (μ-Raman)
3. Results and Discussion
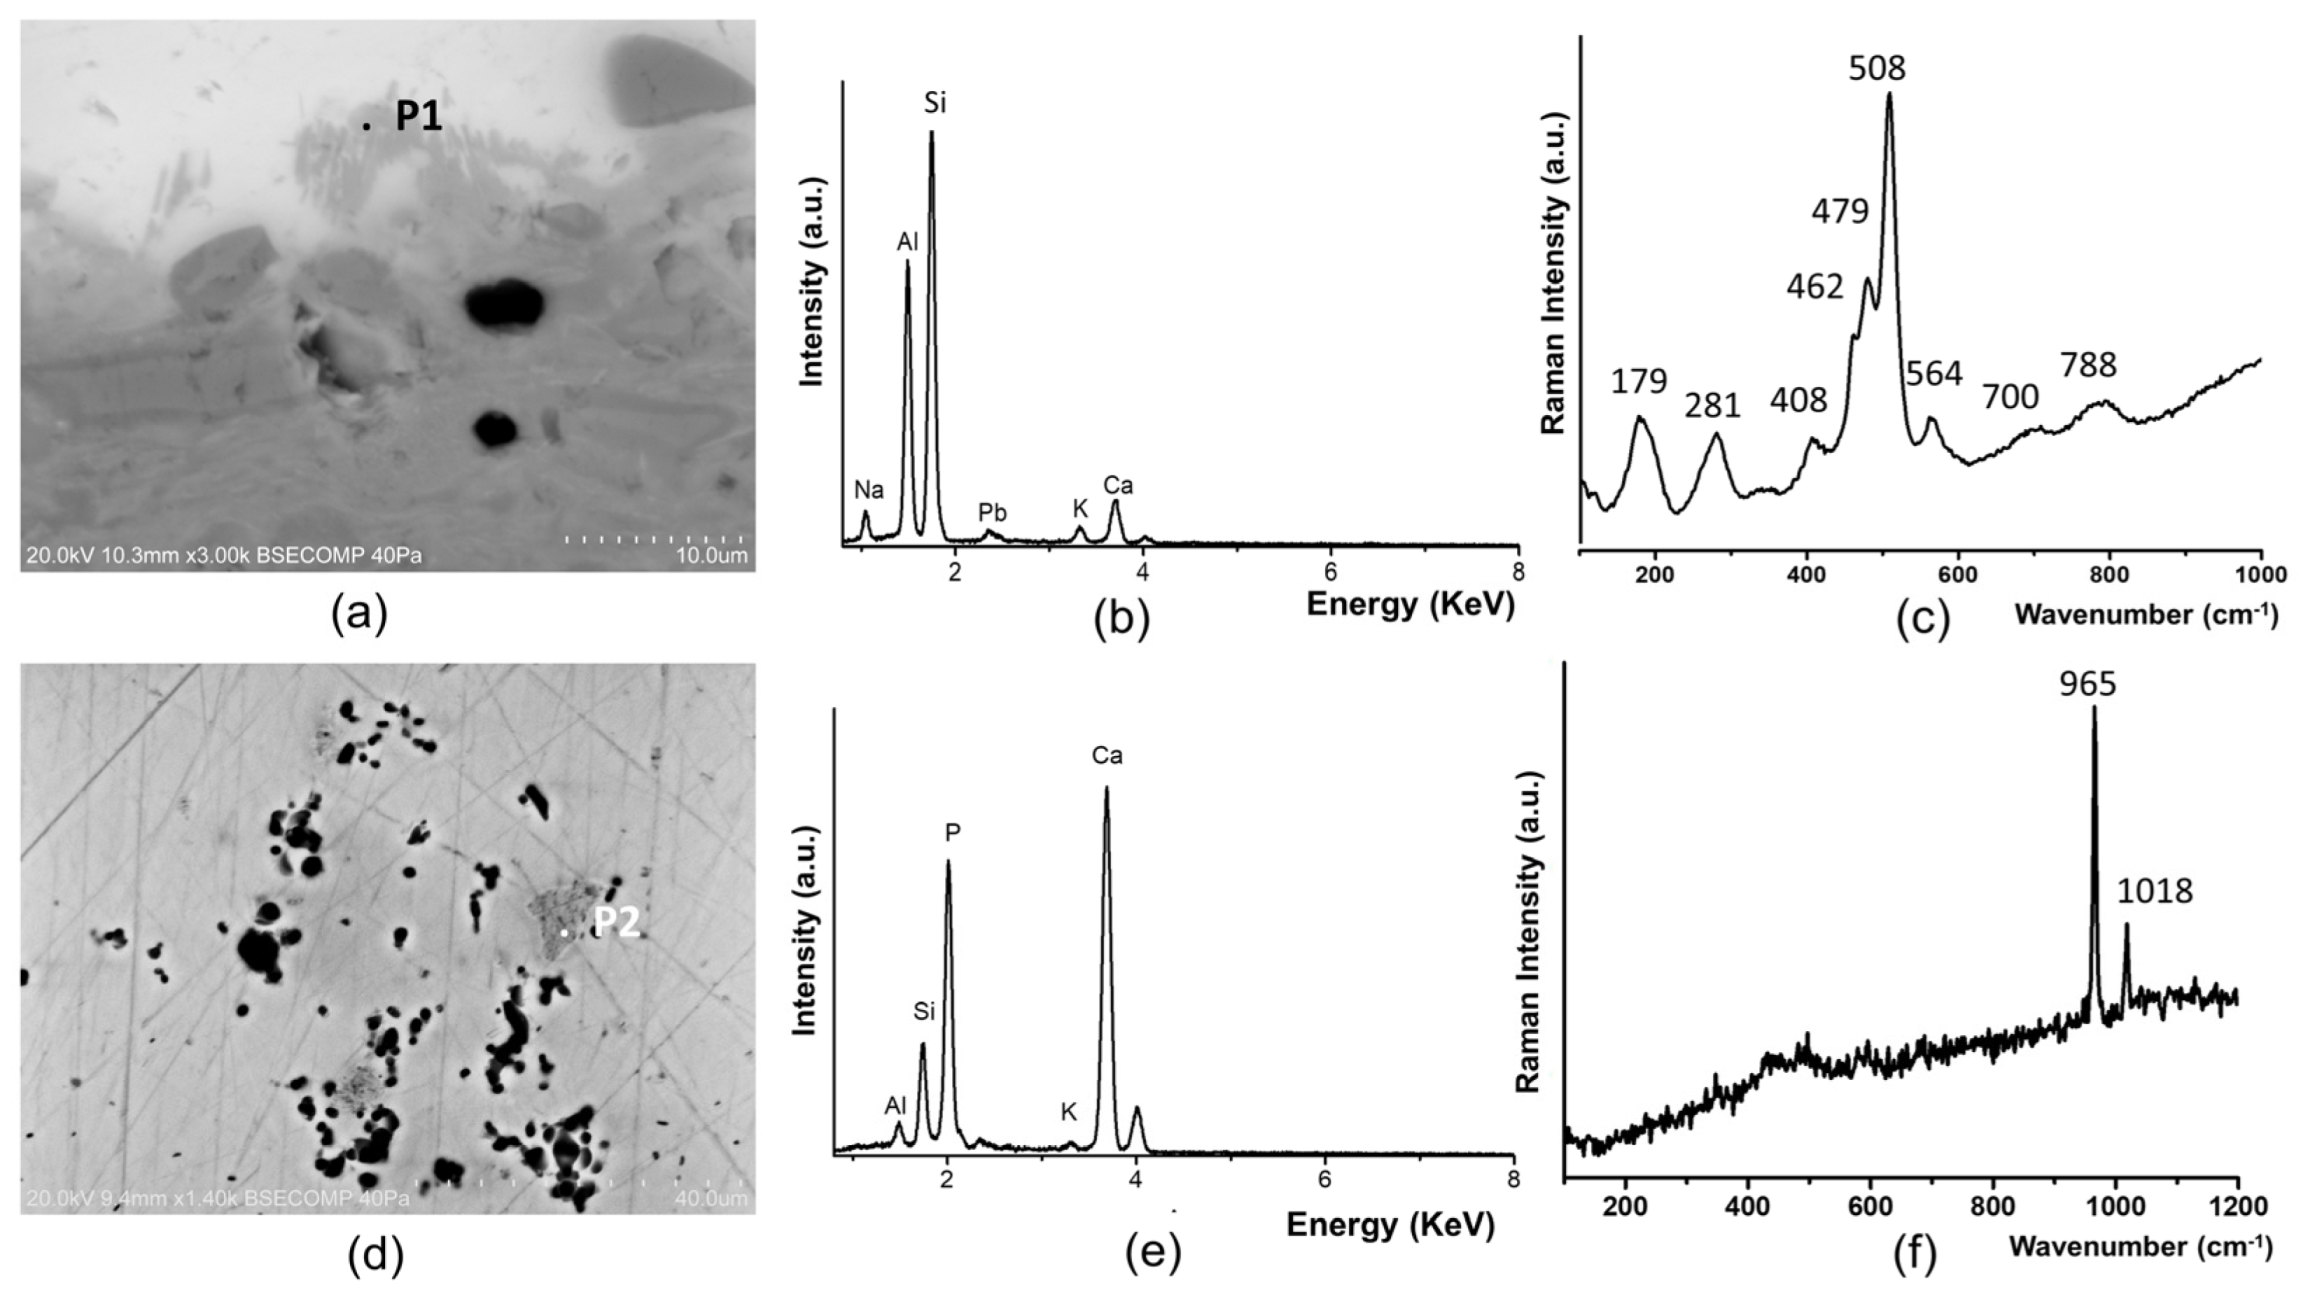
3.1. Ceramic Body
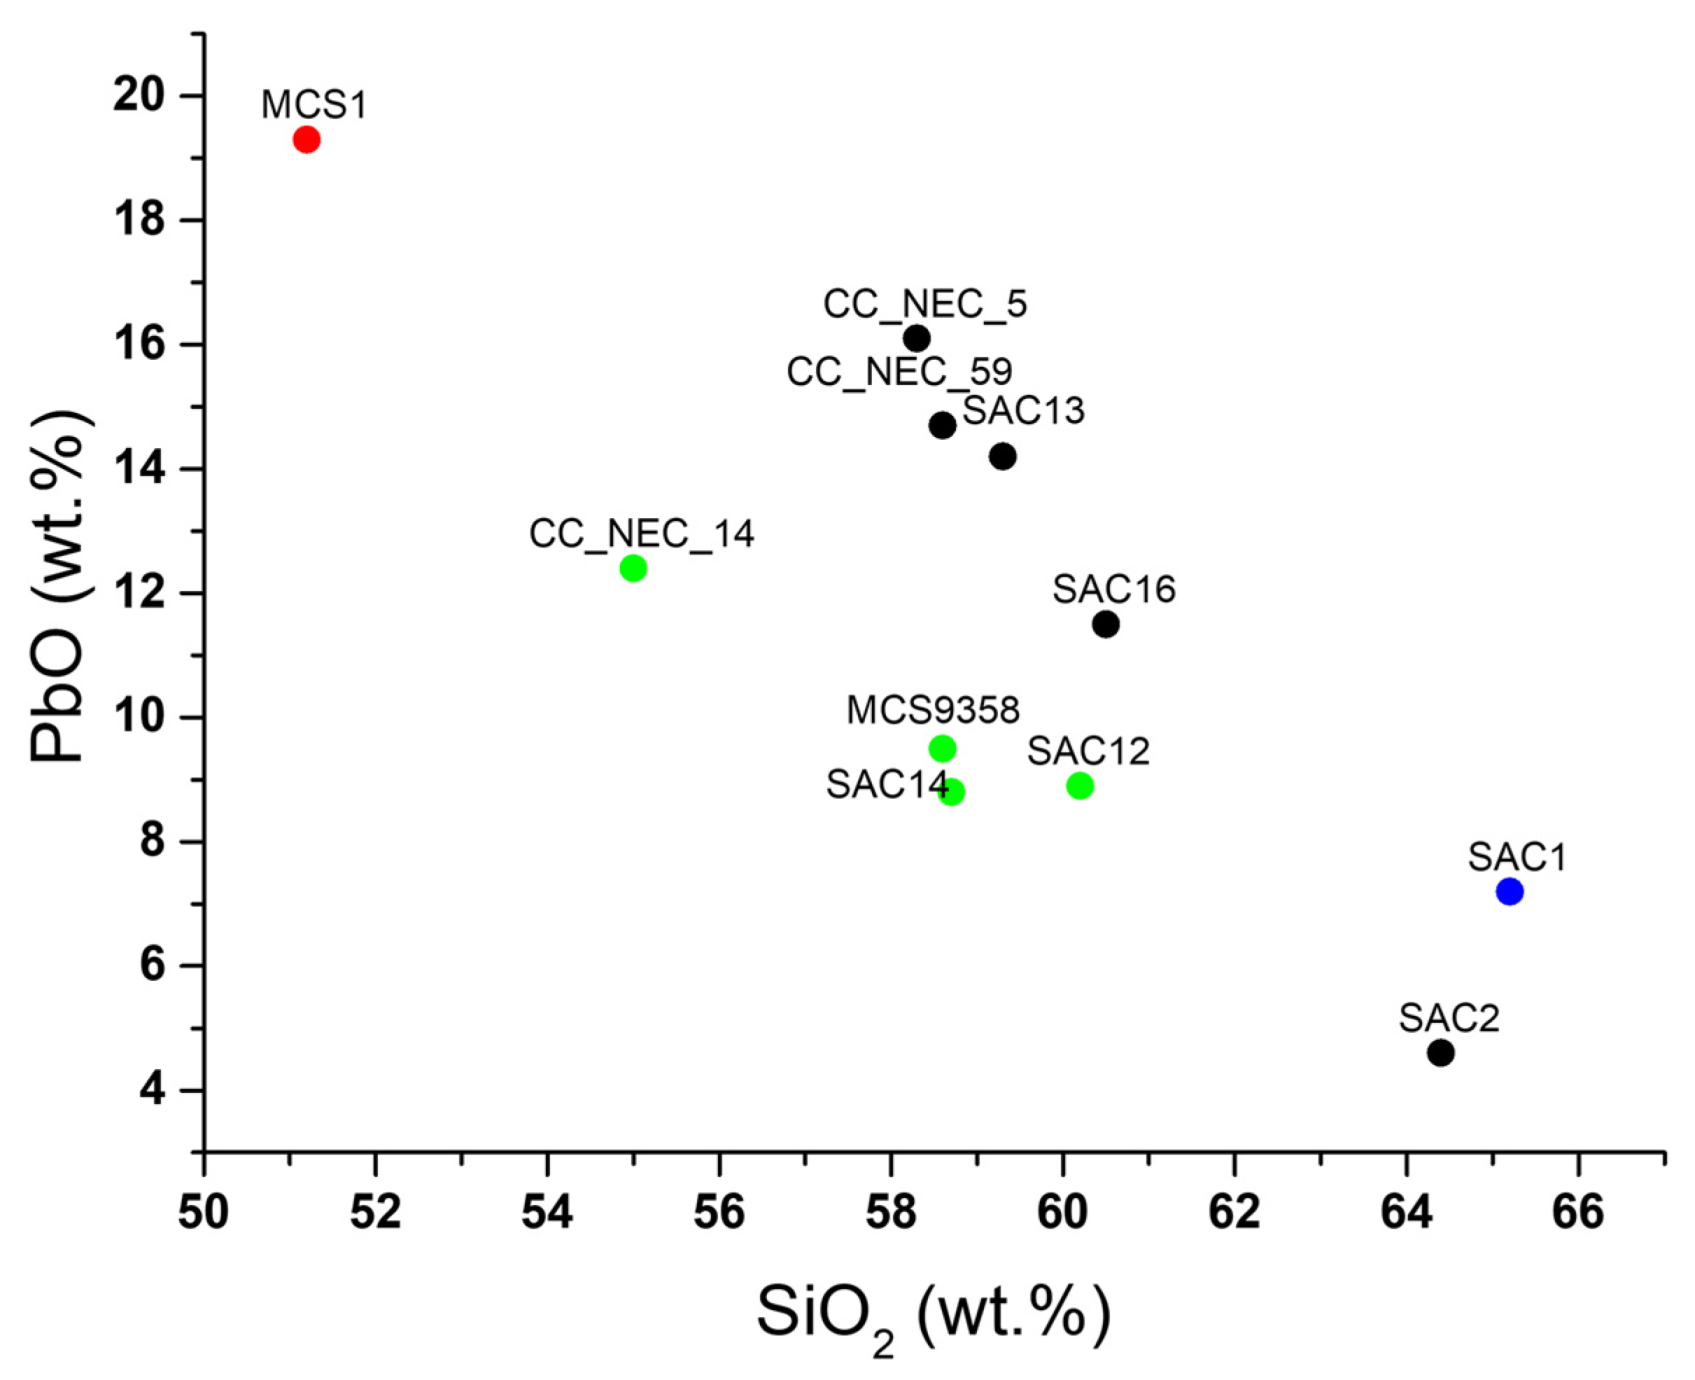
3.2. Transparent Glaze
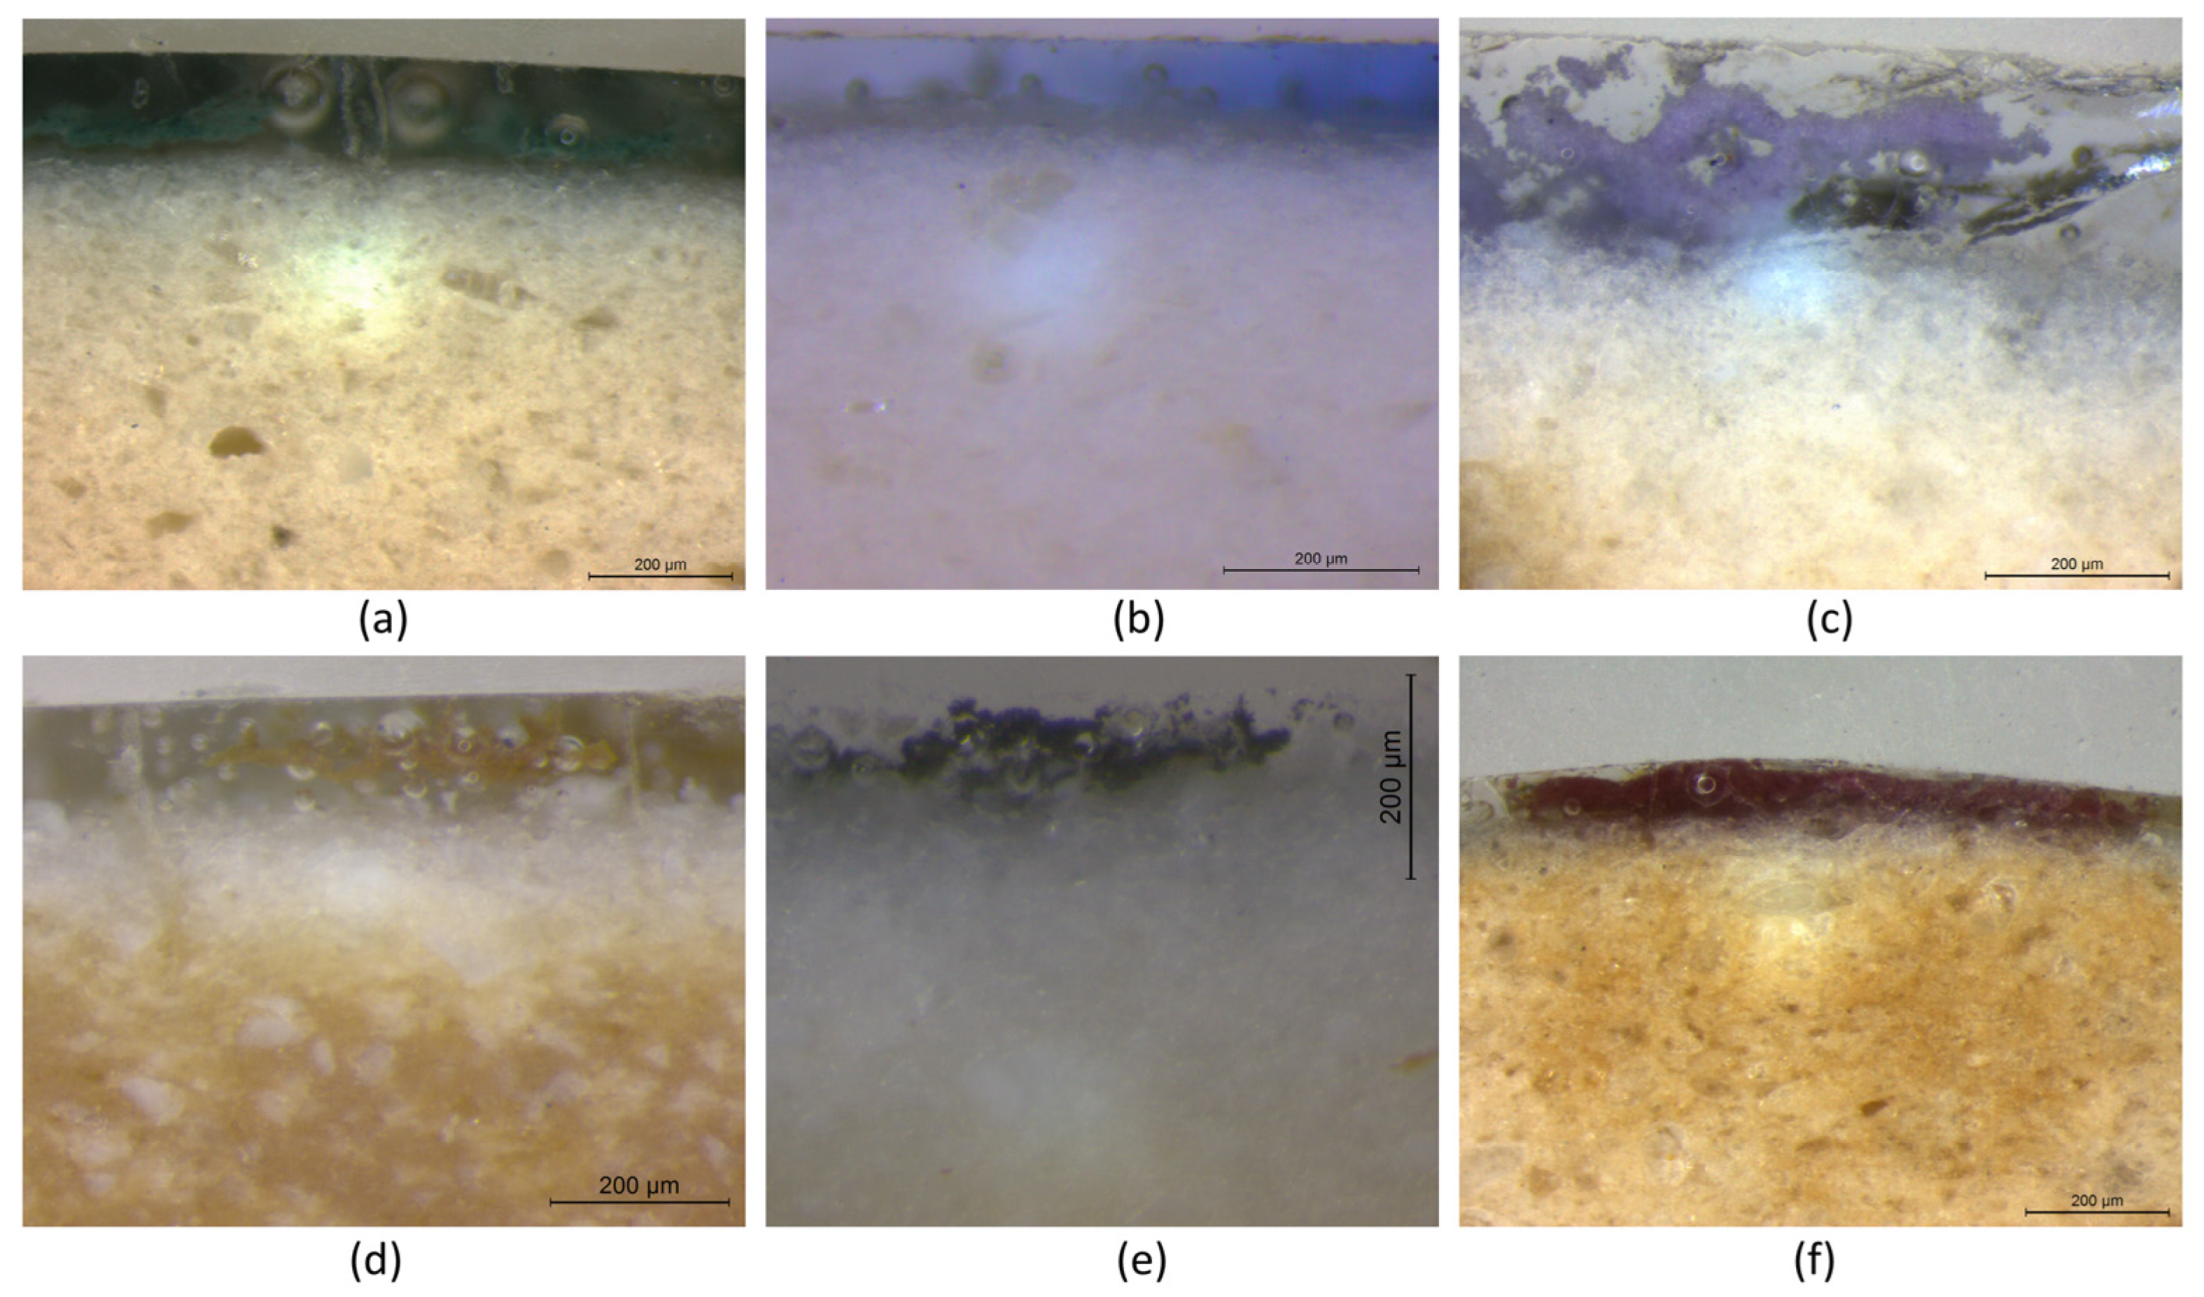
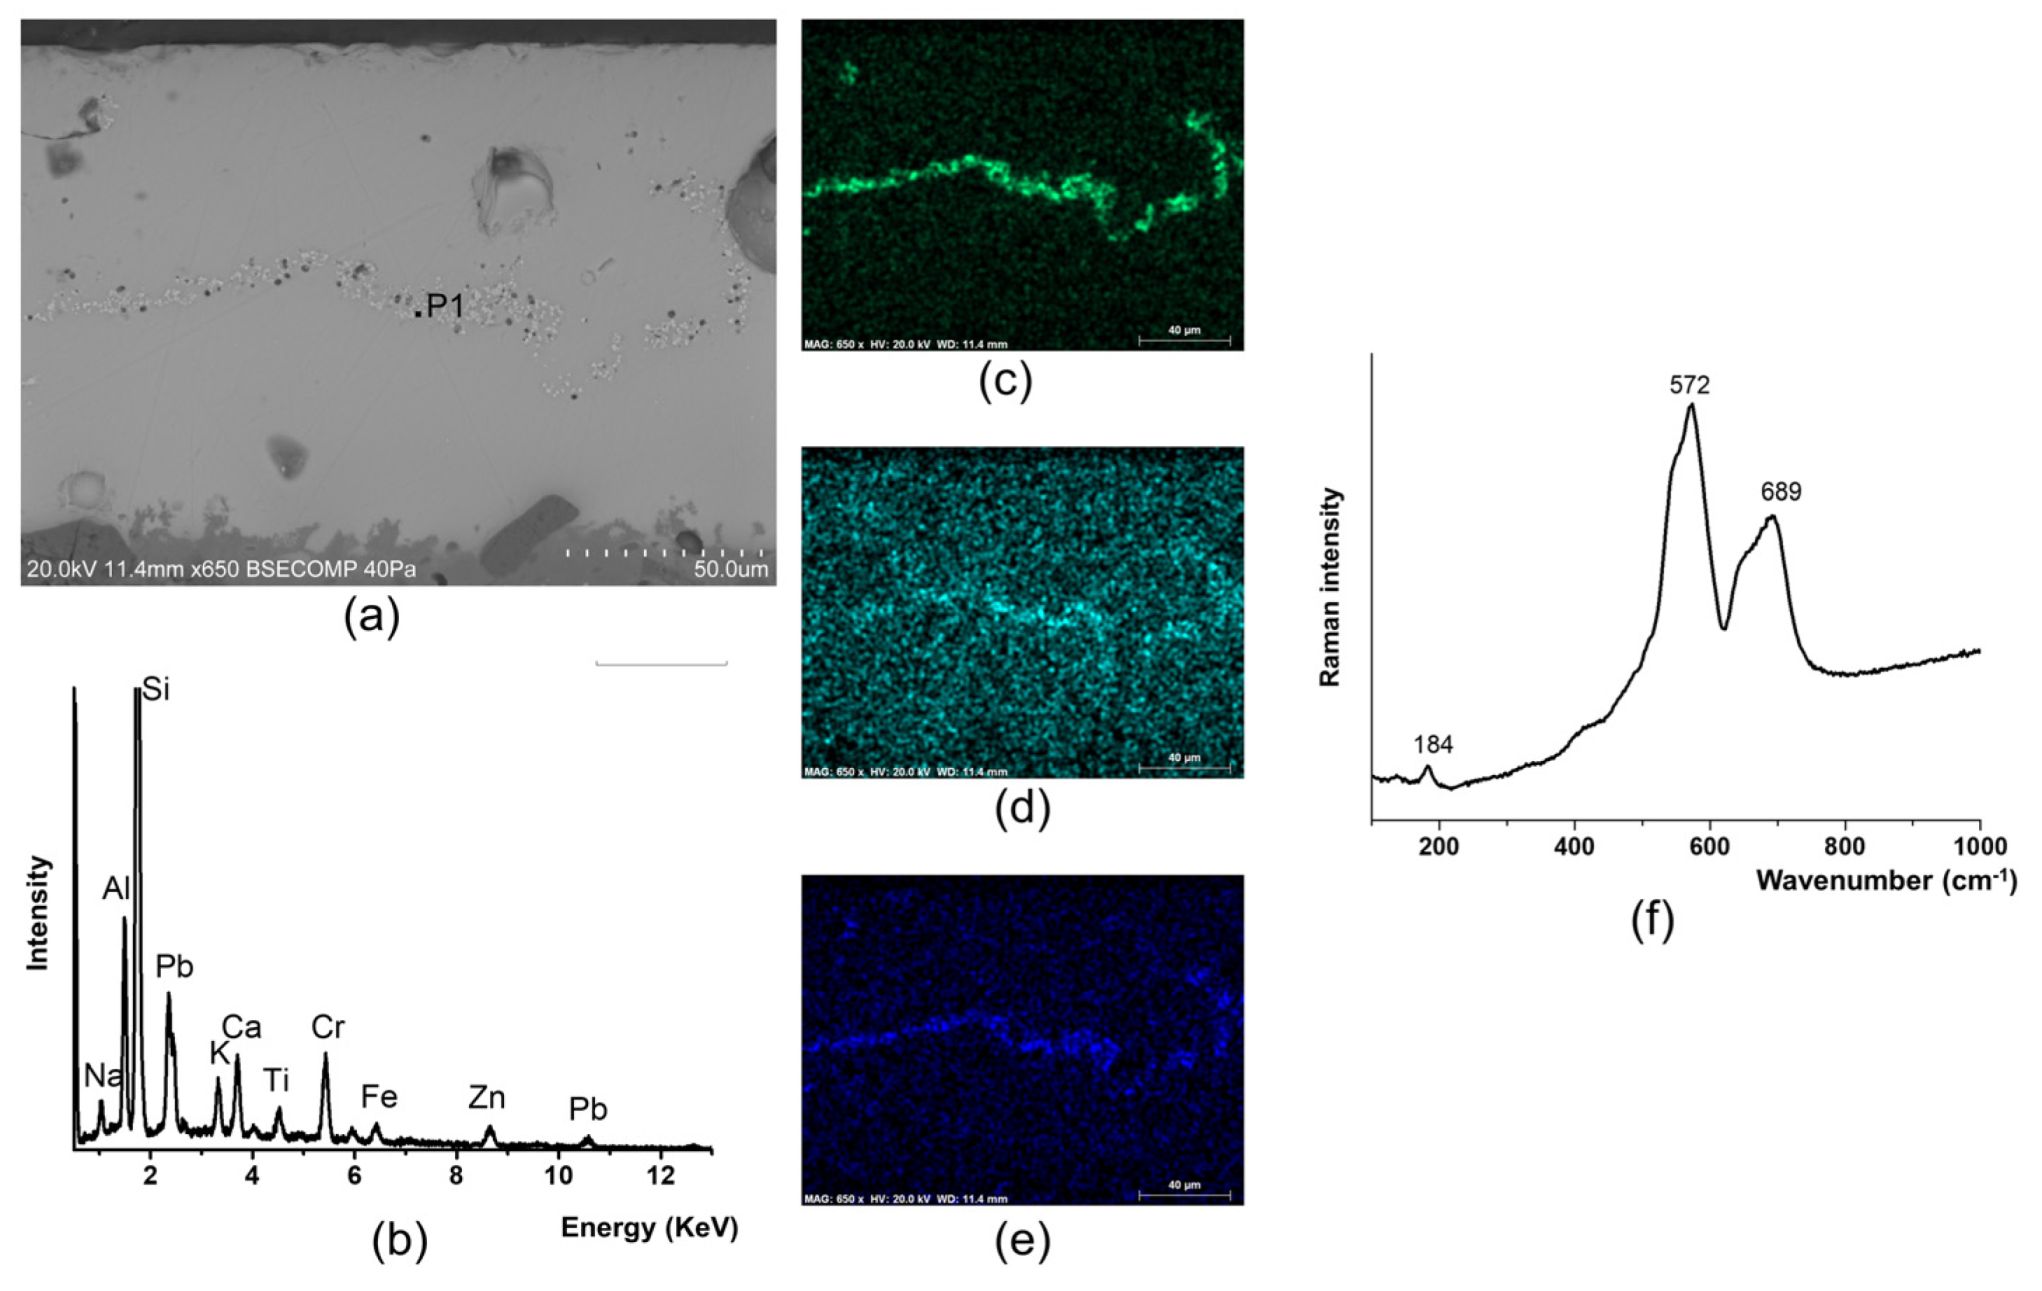
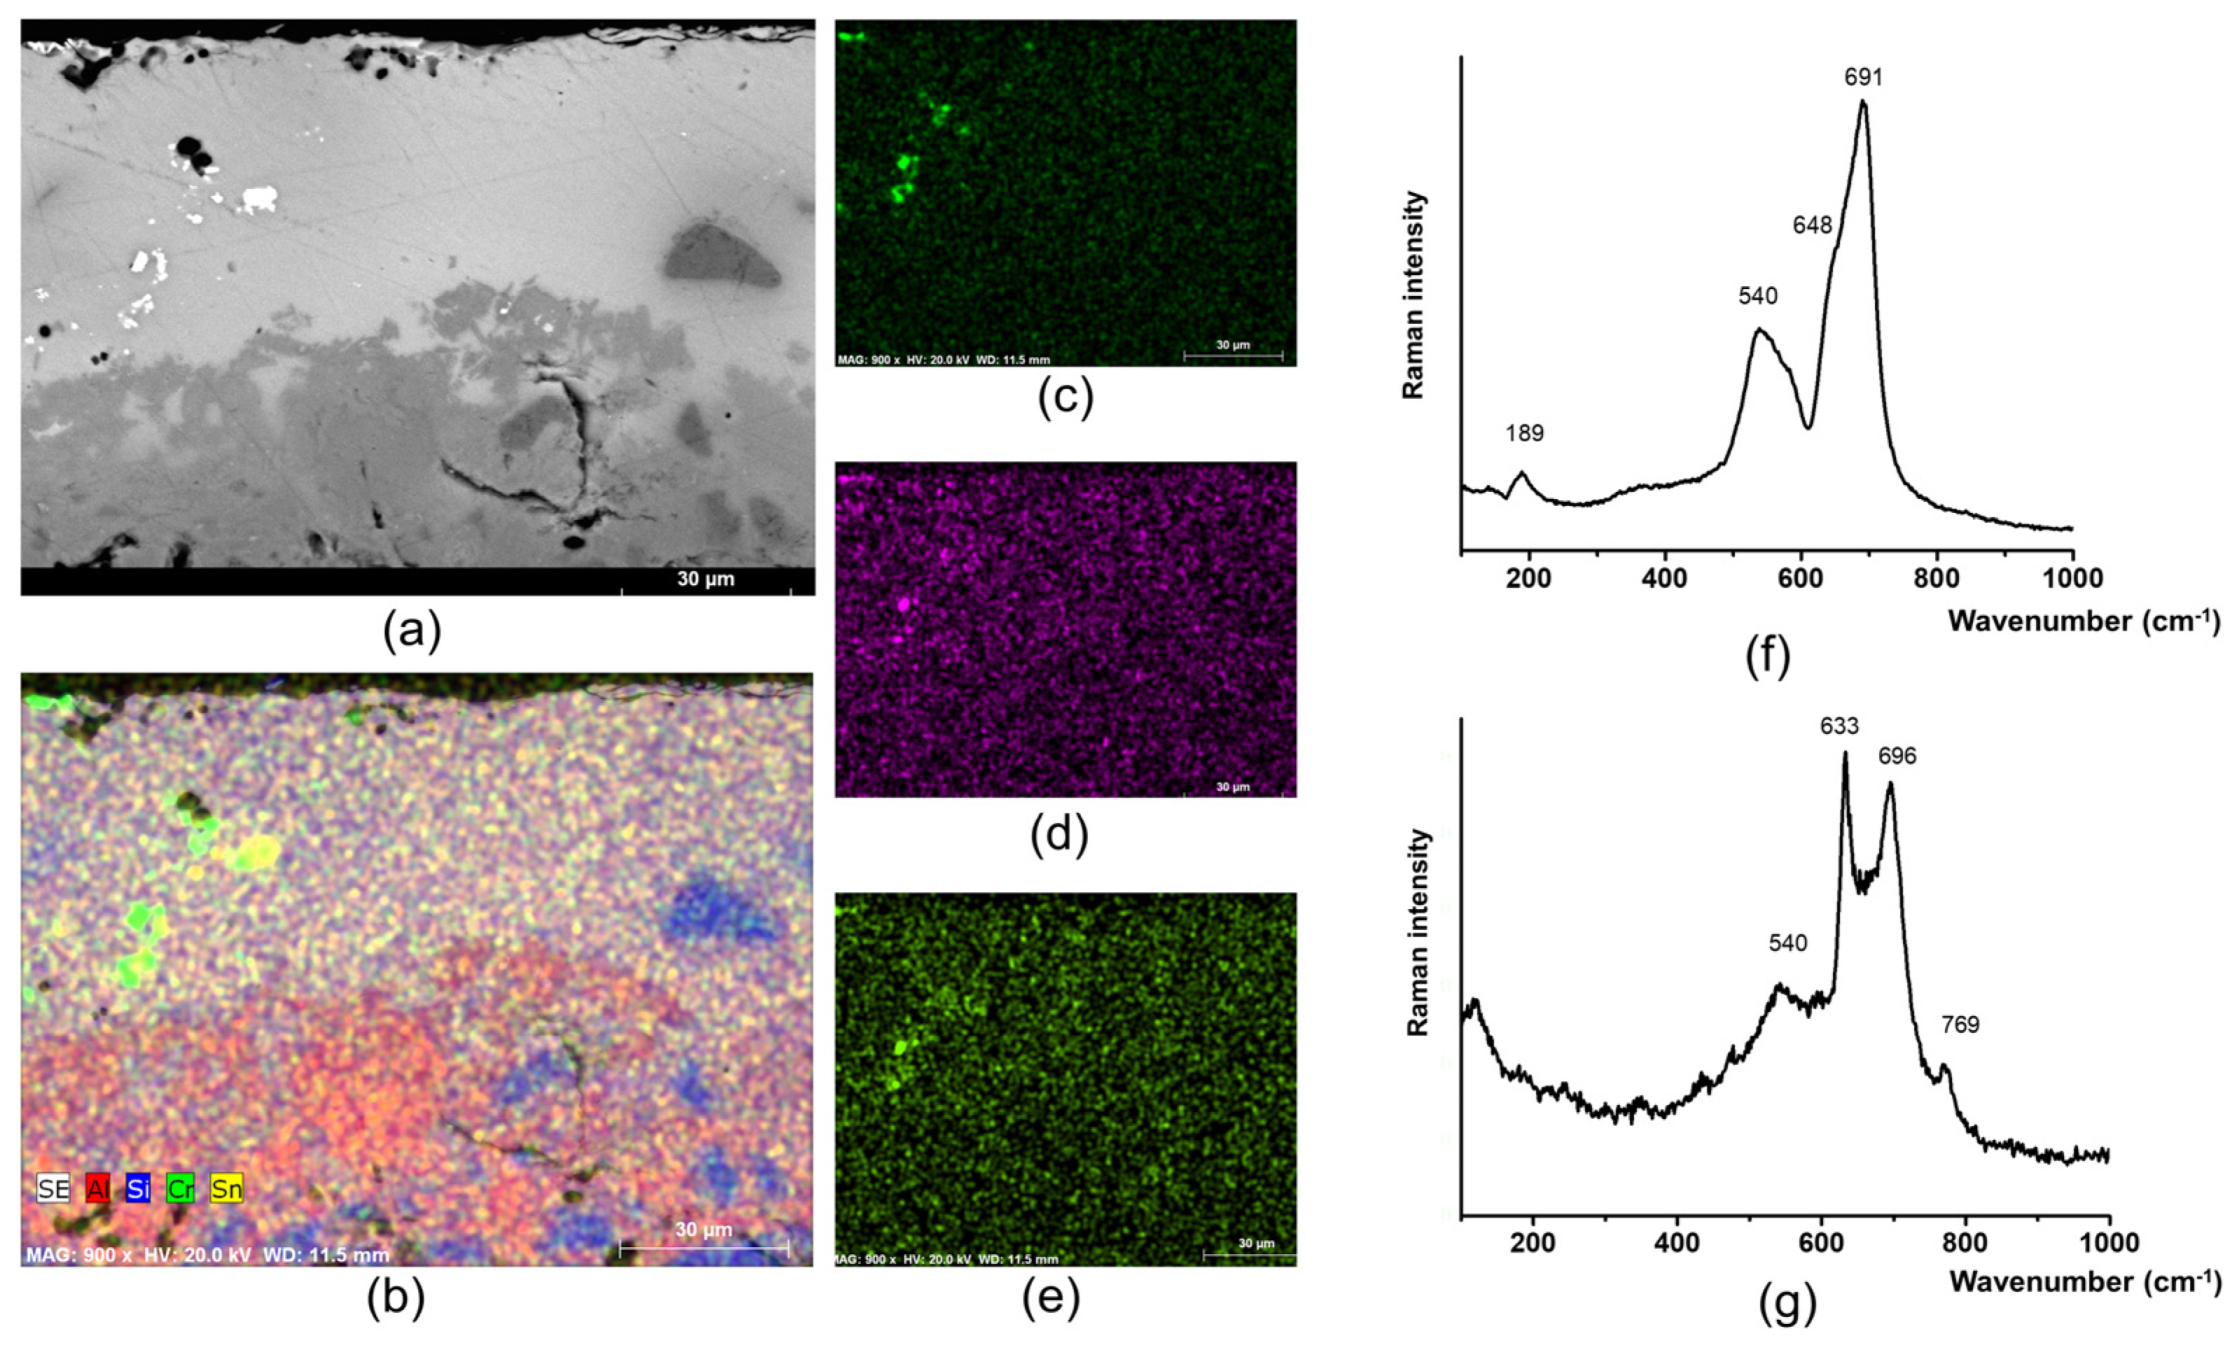
3.3. Pigments
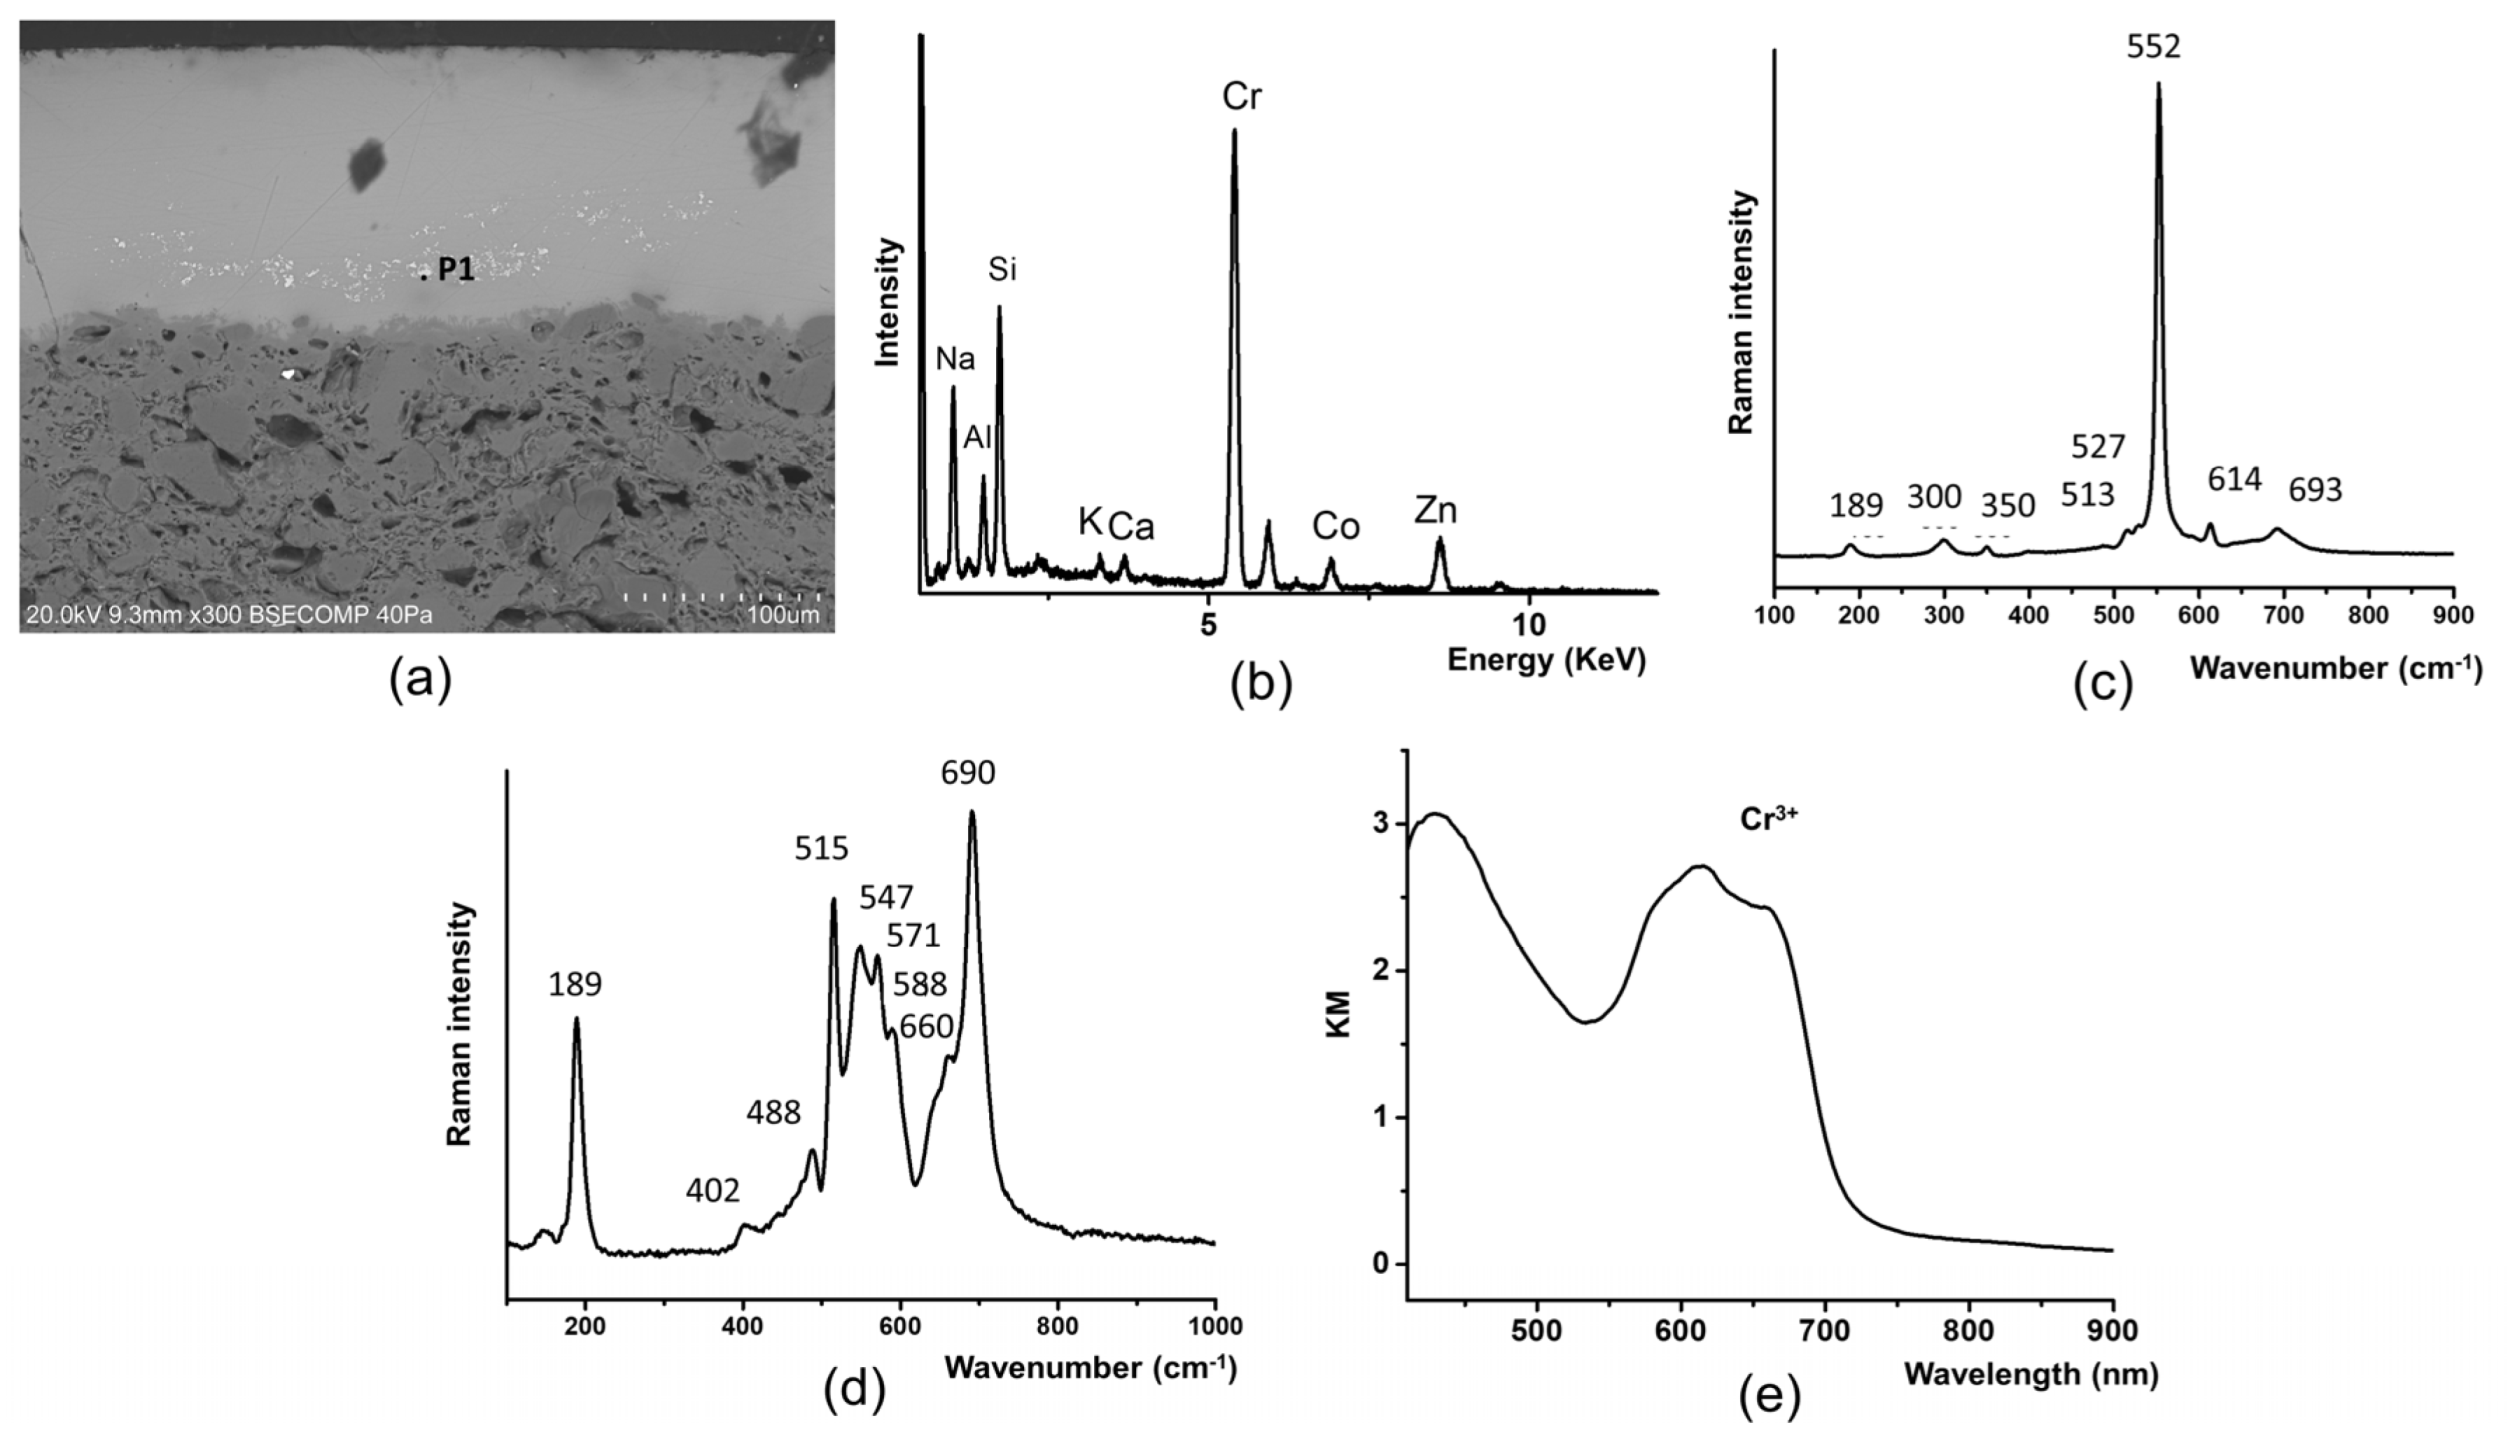
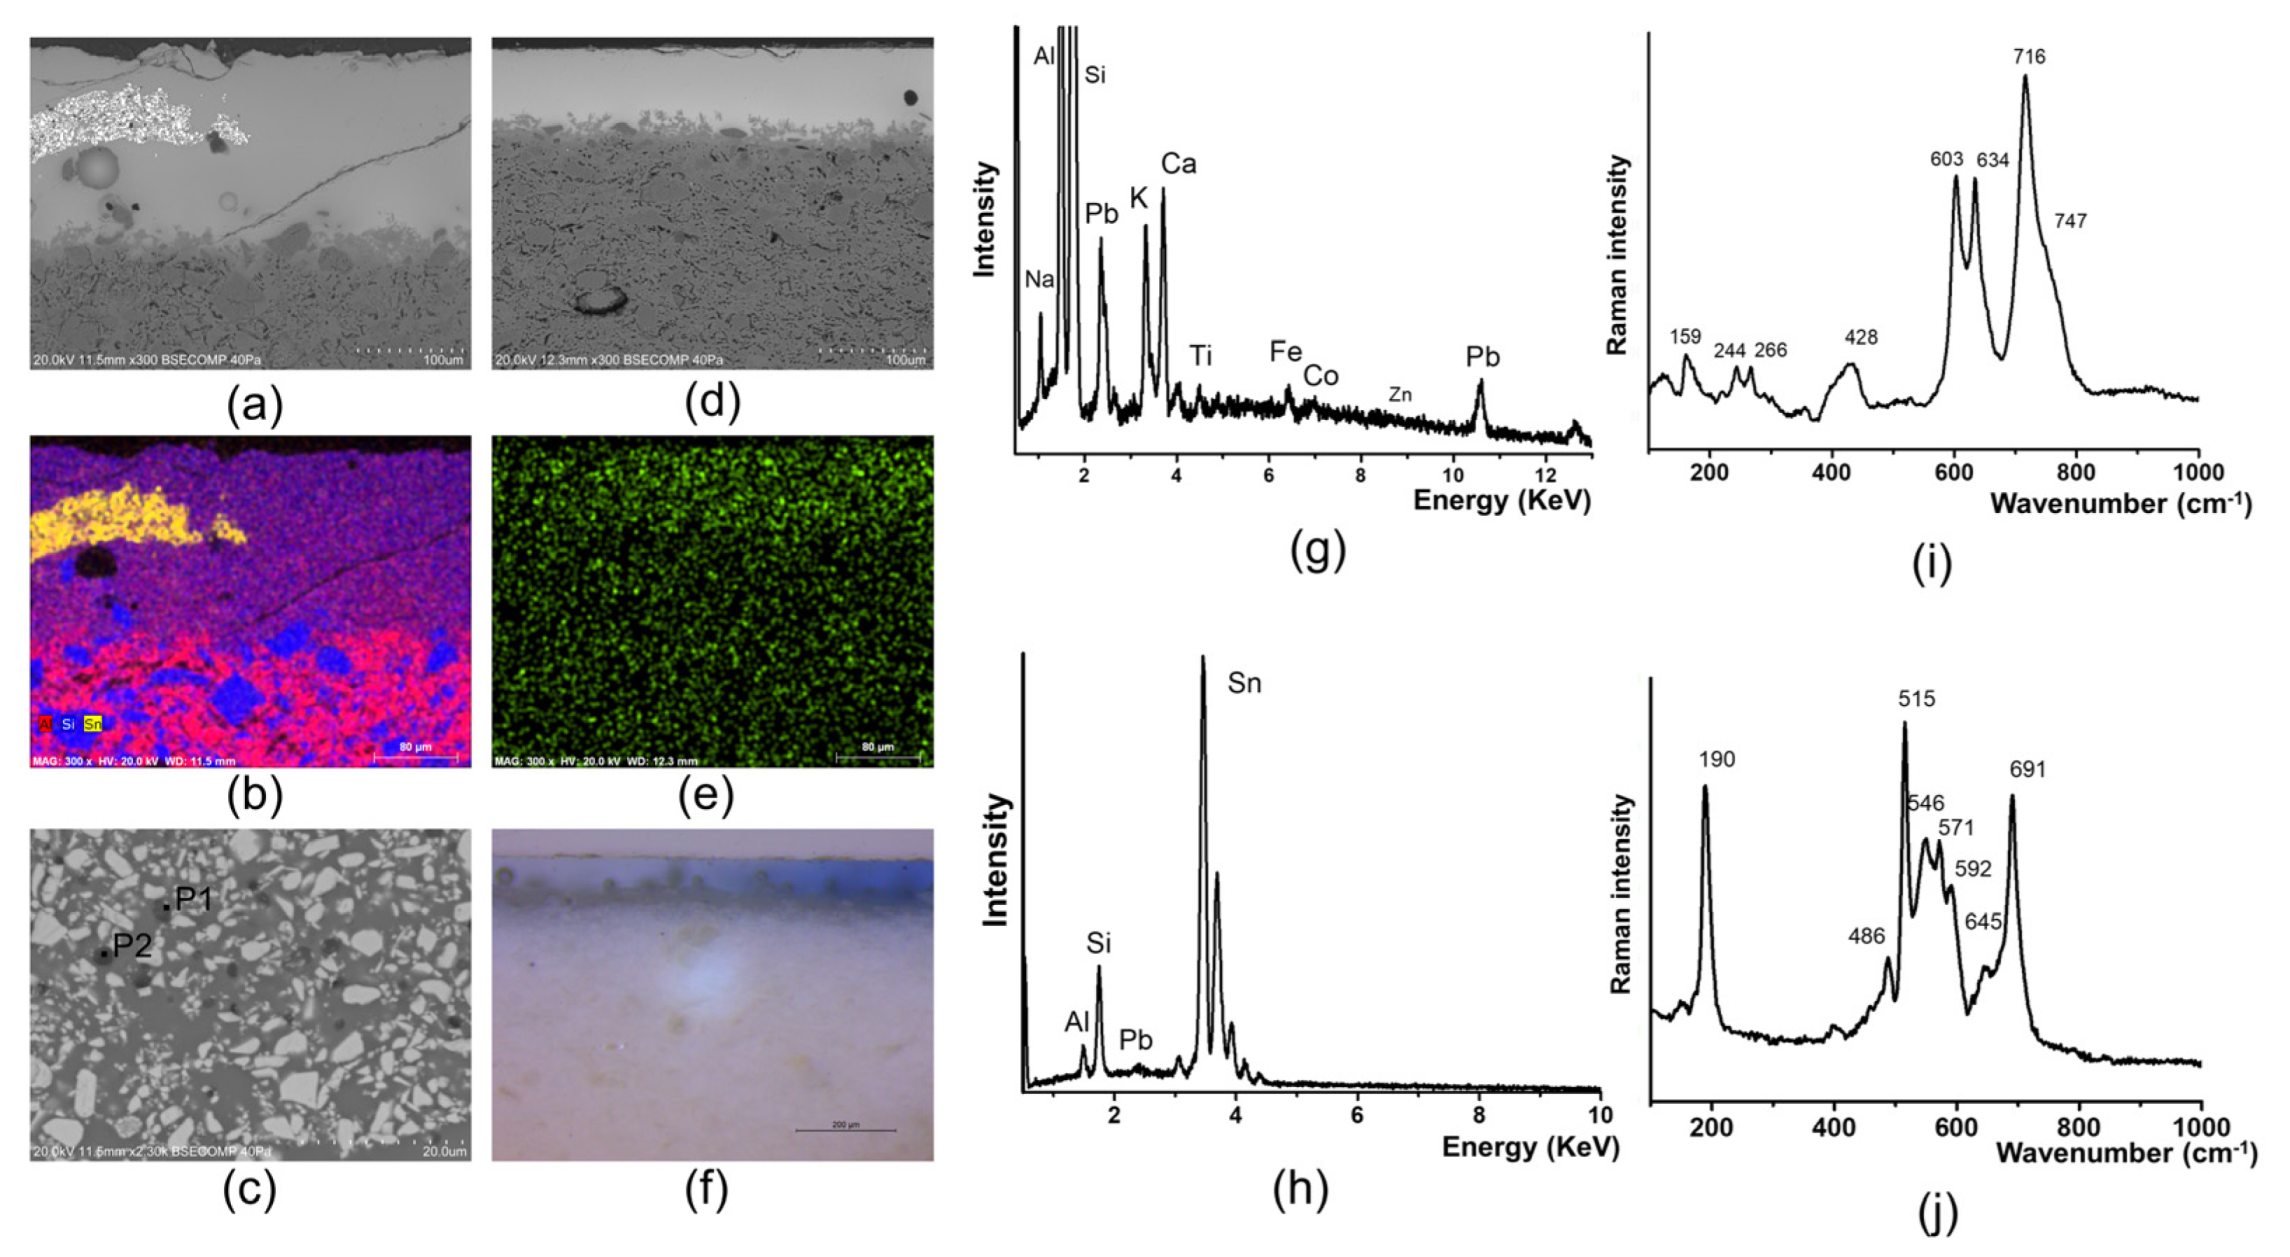
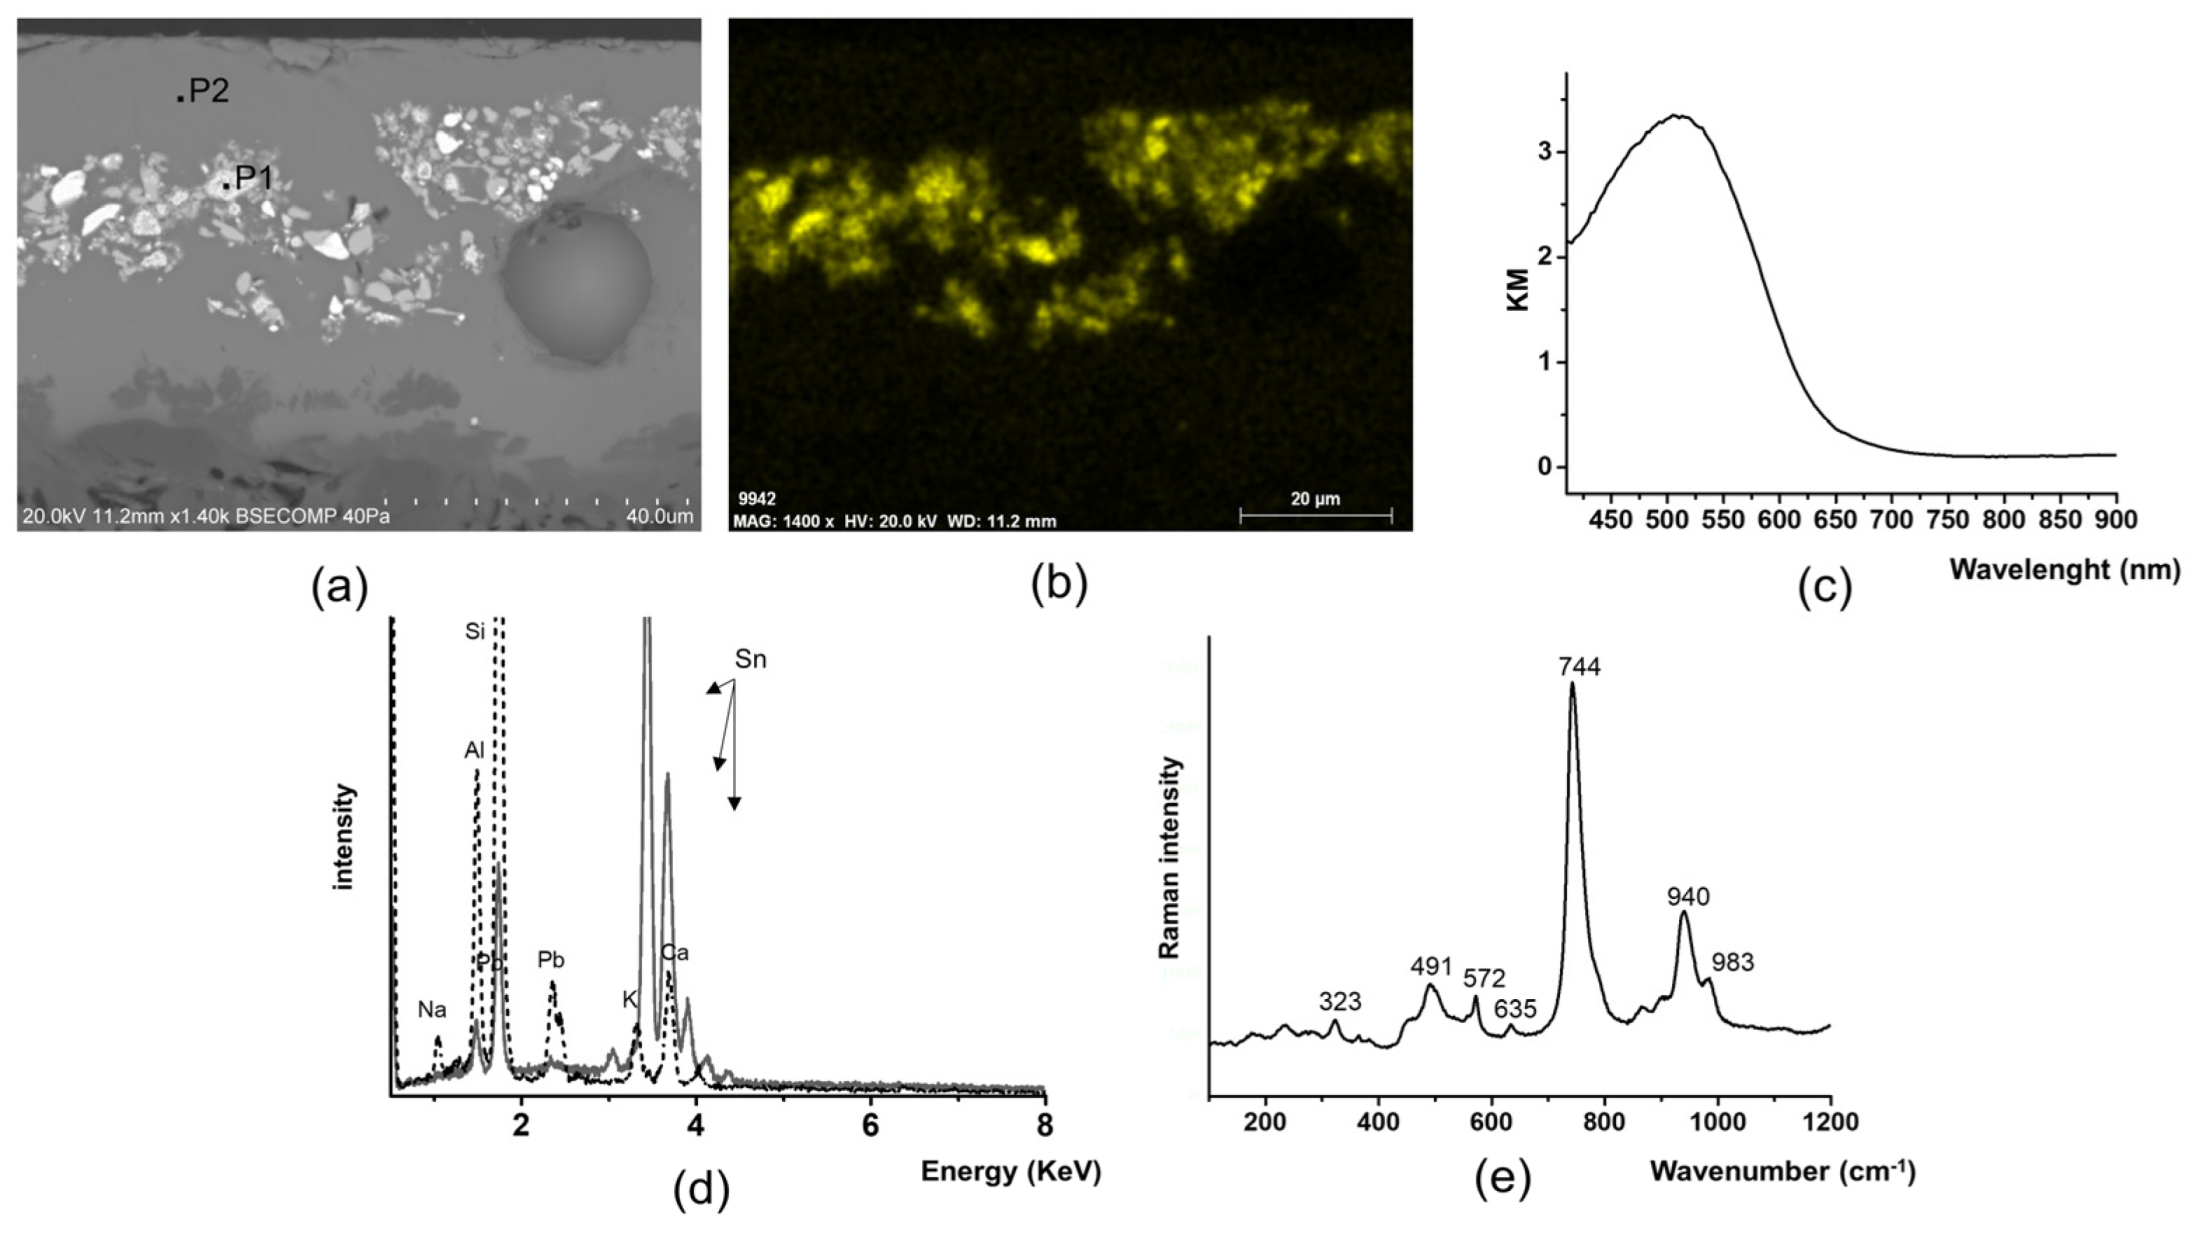
3.3.1. Green
3.3.2. Blue
3.3.3. Brown
3.3.4. Black
3.3.5. Pink
4. Conclusions
Supplementary Materials
Author Contributions
Funding
Data Availability Statement
Acknowledgments
Conflicts of Interest
References
- Maggetti, M.; Rosen, J.; Serneels, V. The origin of 18th–19th century tin-glazed pottery from Lorraine, France. Archaeometry 2015, 57, 426–452. [Google Scholar] [CrossRef]
- Maggetti, M.; Serneels, V.; Stasch, G. Journal of Archaeological Science: Reports Composition and technology of 18th century high magnesia faïences from Fulda. J. Archaeol. Sci. Rep. 2015, 2, 40–50. [Google Scholar] [CrossRef]
- Maggetti, M. Archaeometric Analyses of European 18th–20th Century White Earthenware—A Review. Minerals 2018, 8, 269. [Google Scholar] [CrossRef]
- Beauvoit, E.; Ben Amara, A.; Cantin, N.; Lemasson, Q.; Sireix, C.; Marache, V.; Chapoulie, R. Technological investigation on ceramic bodies of 19th century French white earthenware from the Bordeaux region. J. Archaeol. Sci. Rep. 2020, 31, 102314. [Google Scholar] [CrossRef]
- Maggetti, M.; Heege, A.; Serneels, V. Technological aspects of an early 19th c. English and French white earthenware assemblage from Bern (Switzerland). Period. Mineral. 2015, 84, 139–168. [Google Scholar] [CrossRef]
- Kováč, J.; Trník, A.; Medveď, I.; Vozár, L. Influence of calcite in a ceramic body on its thermophysical properties. J. Therm. Anal. Calorim. 2013, 114, 963–970. [Google Scholar] [CrossRef]
- Emiliani, G.P.; Corbara, F. Tecnologia Ceramica—Le Materie Prime; Grupo Editoriale Faenza Editrice S.p.A.: Faenza, Italy, 1999; ISBN 88-8138-043-9. [Google Scholar]
- Maggetti, M.; Rosen, J.; Serneels, V. White earthenware from Loraine (1755–c. 1820): Provenance and technique. Archaeometry 2011, 4, 765–790. [Google Scholar] [CrossRef]
- Beauvoit, E.; Ben Amara, A.; Tessier-Doyen, N.; Frugier, C.; Lemasson, Q.; Moignard, B.; Pacheco, C.; Pichon, L.; Chapoulie, R.; Gratuze, B. Chemical and Mechanical Characterisation of White Earthenware Glazes from the Johnston-Vieillard Manufactory (France, 19th Century). Archaeometry 2021, 63, 941–959. [Google Scholar] [CrossRef]
- Samford, P.M. Response to a market: Dating english underglaze transfer-printed wares. Hist. Archaeol. 1997, 31, 1–30. [Google Scholar] [CrossRef]
- Verger, L.; Dargaud, O.; Chassé, M.; Trcera, N.; Rousse, G.; Cormier, L. Synthesis, properties and uses of chromium-based pigments from the Manufacture de Sèvres. J. Cult. Herit. 2018, 30, 26–33. [Google Scholar] [CrossRef]
- Lepierre, C. Estudo Chimico e Technologico Sobre a Cerâmica Portugueza Moderna; Imprensa Nacional: Lisboa, Portugal, 1899.
- Lepierre, C. Estudo Chimico e Technologico Sobre a Cerâmica Portuguesa Moderna, 2nd ed.; do Fomento, M., Ed.; Tipografia da Associação de Classe fos Compositores Tipográficos: Lisbon, Portugal, 1912. [Google Scholar]
- Queirós, J. A Cerâmica Portuguesa e Outros Estudos, 3rd ed.; Editorial Presença, Lda: Lisboa, Portugal, 1987. [Google Scholar]
- Varios. Sacavém, a Outra Loiça; Camara Municipal de Loures: Loures, Portugal, 2019; ISBN 978-972-914-9142-58-1. [Google Scholar]
- Figueiredo, E.; Esteves, L.; Pais, A.N.; Vilarigues, M.G.; Coentro, S.X. As cores na azulejaria portuguesa: Uma revisão. Conserv. Património 2023, 42, 72–80. [Google Scholar] [CrossRef]
- Assunção, A.P. 150 Anos—150 Peças Fábrica de Loiça de Sacavém; Museu de Cerâmica de Sacavém, Mirandela-Artes Gráficas, S.A.: Loures, Portugal, 2006; ISBN 972-9142-33-5. [Google Scholar]
- Assunção, A.P.; Pereira, C.; Correia, E. Primeiras Peças da Produção da Fábrica de Loiça de Sacavém—O Papel do Coleccionador; António Coelho Dias, Museu de Cerâmica de Sacavém: Loures, Portugal, 2003.
- Pereira, C.; Pina, J.; Rodrigues, G.; David, F. Intenerário pela Produção da Fábrica de Loiça de Sacavém—Museu de Cerâmica de Sacavém; Palmigráfica, Artes Gráficas: Loures, Portugal, 2000. [Google Scholar]
- Aras, A. The change of phase composition in kaolinite- and illite-rich clay-based ceramic bodies. Appl. Clay Sci. 2004, 24, 257–269. [Google Scholar] [CrossRef]
- Lee, S.; Kim, Y.J.; Moon, H.S. Phase transformation sequence from kaolinite to mullite investigated by an energy-filtering transmission electron microscope. J. Am. Ceram. Soc. 1999, 82, 2841–2848. [Google Scholar] [CrossRef]
- Pressler, E.E.; Shearer, W.L. Properties of Potters’ Flints and Their Effects in White-Ware Bodies; Department of Commerce Bureau of Standards: Governmen Printing Office: Washington, DC, USA, 1926; Volume 20.
- Weymouth, J.H.; Williamson, W.O. Some physical properties of raw and calcined flint. Mineral. Mag. J. Mineral. Soc. 1951, 29, 573–593. [Google Scholar] [CrossRef]
- Chargui, F.; Hamidouche, M.; Belhouchet, H.; Jorand, Y.; Doufnoune, R.; Fantozzi, G. Mullite fabrication from natural kaolin and aluminium slag. Bol. Soc. Esp. Ceram. Vidr. 2018, 57, 169–177. [Google Scholar] [CrossRef]
- Bouquillon, A.; Castaing, J.; Barbe, F.; Crepin-Leblond, T.; Tilliard, L.; Paine, S.R.; Christman, B.; Heuer, A.H. French Decorative Ceramics Mass-Produced during and After the 17th Century: Chemical Analyses of the Glazes. Archaeometry 2018, 60, 946–965. [Google Scholar] [CrossRef]
- Coentro, S.; Mimoso, J.M.; Lima, A.M.; Silva, A.S.; Pais, A.N.; Muralha, V.S.F. Multi-analytical identification of pigments and pigment mixtures used in 17th century Portuguese azulejos. J. Eur. Ceram. Soc. 2012, 32, 37–48. [Google Scholar] [CrossRef]
- Freeman, J.J.; Wang, A.; Kuebler, K.E.; Jolliff, B.L.; Haskin, L.A. Characterization of natural feldspars by raman spectroscopy for future planetary exploration. Can. Mineral. 2008, 46, 1477–1500. [Google Scholar] [CrossRef]
- Rogers, K.D.; Daniels, P. An X-ray diffraction study of the effects of heat treatment on bone mineral microstructure. Biomaterials 2002, 23, 2577–2585. [Google Scholar] [CrossRef]
- Bouchard, M.; Smith, D.C.D.C.; Carabatos-Nédelec, C. An investigation of the feasibility of applying Raman microscopy for exploring stained glass. Spectrochim. Acta A Mol. Biomol. Spectrosc. 2007, 68, 1101–1113. [Google Scholar] [CrossRef]
- D’Ippolito, V.; Andreozzi, G.B.; Bersani, D.; Lottici, P.P. Raman fingerprint of chromate, aluminate and ferrite spinels. J. Raman Spectrosc. 2015, 46, 1255–1264. [Google Scholar] [CrossRef]
- Liang, S. Colour performance investigation of a Cr2O3 green pigment prepared via the thermal decomposition of CrOOH. Ceram. Int. 2014, 40, 4367–4373. [Google Scholar] [CrossRef]
- Bouchard, M.; Gambardella, A. Raman microscopy study of synthetic cobalt blue spinels used in the field of art. J. Raman Spectrosc. 2010, 41, 1477–1485. [Google Scholar] [CrossRef]
- Forés, A.; Llusar, M.; Badenes, J.A.; Calbo, J.; Tena, M.A.; Monrós, G. Cobalt minimisation in willemite (CoxZn2-xSiO4) ceramic pigments. Green Chem. 2000, 2, 93–100. [Google Scholar] [CrossRef]
- Caggiani, M.C.; Colomban, P. Raman identification of strongly absorbing phases: The ceramic black pigments. J. Raman Spectrosc. 2011, 42, 839–843. [Google Scholar] [CrossRef]
- Yurdakul, H.; Turan, S.; Ozel, E. The mechanism for the colour change of iron chromium black pigments in glazes through transmission electron microscopy techniques. Dye. Pigment. 2011, 91, 126–133. [Google Scholar] [CrossRef]
- Dondi, M.; Zanelli, C.; Ardit, M.; Cruciani, G.; Mantovani, L.; Tribaudino, M.; Andreozzi, G.B. Ni-free, black ceramic pigments based on Co–Cr–Fe–Mn spinels: A reappraisal of crystal structure, colour and technological behaviour. Ceram. Int. 2013, 39, 9533–9547. [Google Scholar] [CrossRef]
- Coentro, S.; Da Silva, R.C.; Relvas, C.; Ferreira, T.; Mirão, J.; Pleguezuelo, A.; Trindade, R.; Muralha, V.S.F. Mineralogical Characterization of Hispano-Moresque Glazes: A μ-Raman and Scanning Electron Microscopy with X-ray Energy Dispersive Spectrometry (SEM-EDS) Study. Microsc. Microanal. 2018, 24, 300–309. [Google Scholar] [CrossRef]
- Lopez-Navarrete, E.; Caballero, A.; Orera, V.M.; Lázaro, F.J.; Ocaña, M. Oxidation state and localization of chromium ions in Cr-doped cassiterite and Cr-doped malayaite. Acta Mater. 2003, 51, 2371–2381. [Google Scholar] [CrossRef]
- Faurel, X.; Vanderperre, A.; Colomban, P. Pink pigment optimization by resonance Raman spectroscopy. J. Raman Spectrosc. 2003, 34, 290–294. [Google Scholar] [CrossRef]
- Fischbach, N.; Ngo, A.T.; Colomban, P.; Pauly, M. Beads excavated from Antsiraka Boira Necropolis (Mayotte Island, 12th–13th centuries) colouring agents and glass matrix composition comparison with contemporary Southern Africa sites. ArcheoSciences 2016, 40, 83–102. [Google Scholar] [CrossRef]
- Vieira Ferreira, L.F.; Gonzalez, A.; Pereira, M.F.C.; Santos, L.F.; Casimiro, T.M.; Ferreira, D.P.; Conceição, D.S.; Machado, I.F. Spectroscopy of 16th century Portuguese tin-glazed earthenware produced in the region of Lisbon. Ceram. Int. 2015, 41, 13433–13446. [Google Scholar] [CrossRef]
- Buzanich, A.C. Spectroscopic Techniques for Characterizing Portuguese Glazed Ceramics: A Contributin to the Study of Ancient Faiences of Coimbra. Ph.D. Thesis, Universidade de Lisboa, Faculdade de Ciências, Lisboa, Portugal, 2013. [Google Scholar]


| Ref. | Typology | Provenance 1 | Colour | Period | Motif |
|---|---|---|---|---|---|
| SAC1 | Plate | AALS | Strong blue | RFS-G | TOGG |
| SAC2 | soup plate | AALS | Black | FS | Statue |
| SAC4 | soup plate | AALS | Light blue | RFS | Ornato |
| SAC7 | plate | AALS | Green | RFS | Pheasant |
| SAC12 | plate | AALS | Green | RFS | Pheasant |
| SAC13 | soup plate | AALS | Brown | FS | Metz |
| SAC14 | plate | AALS | Blue lavender | RFS | Statue |
| SAC16 | plate | AALS | Blue lavender | FS | Venice |
| SAC18 | plate | AALS | Blue lavender | FS | Venice |
| CC_NEC_5 | plate | Arq_CC | Green | FS | Statue |
| CC_NEC_14 | plate | Arq_CC | Green | RFS | Statue |
| CC_NEC_16 | plate | Arq_CC | Green | RFS | Statue |
| CC_NEC_59 | plate | Arq_CC | Strong blue | FS | Statue |
| CC_NEC_110 | plate | Arq_CC | Black | RFS | Statue |
| MCS1 | dish | MCS | Light blue | MJA | - |
| MCS14 | dish | MCS | Brown | FS | Oriental |
| MCS 9358 | plate | MCS | Pink | RFS | Willow |
| Period | Sample | Na2O | MgO | Al2O3 | SiO2 | K2O | CaO | TiO2 | Fe2O3 | CoO | ZnO | BaO | PbO | |
|---|---|---|---|---|---|---|---|---|---|---|---|---|---|---|
| MJA | MCS1 | σ | 3.7 | 0.1 | 13.7 | 51.2 | 3.5 | 9.5 | 0.1 | 0.6 | n.d. | n.d. | n.d. | 19.3 |
| S.D. | 0.1 | 0.1 | 0.4 | 1.0 | 0.1 | 0.1 | 0.04 | 0.05 | - | - | - | 0.5 | ||
| FLS | SAC2 | σ | 3.7 | 0.5 | 17.1 | 64.4 | 3.7 | 4.5 | 0.2 | 0.9 | 0.4 | n.d. | 0.03 | 4.6 |
| S.D. | 0.1 | 0.1 | 0.8 | 1.7 | 0.2 | 0.6 | 0.0 | 0.3 | 0.1 | - | 0.02 | 0.5 | ||
| SAC13 | σ | 2.1 | 0.2 | 14.3 | 59.3 | 3.4 | 5.1 | 0.2 | 0.5 | n.d | n.d | 0.8 | 14.2 | |
| S.D. | 0.2 | 0.1 | 1.3 | 0.4 | 0.5 | 1.0 | 0.0 | 0.2 | - | - | 0.1 | 1.2 | ||
| SAC16 | σ | 1.9 | 0.3 | 13.9 | 60.5 | 3.5 | 6.6 | 0.1 | 0.5 | n.d | n.d | 1.1 | 11.5 | |
| S.D. | 0.1 | 0.03 | 0.3 | 1.9 | 0.2 | 0.3 | 0.03 | 0.1 | - | - | 0.2 | 1.0 | ||
| CC_NEC_59 | σ | 1.4 | 0.2 | 14.2 | 58.6 | 3.4 | 5.7 | 0.3 | 0.4 | 0.2 | n.d | 0.8 | 14.7 | |
| S.D. | 0.1 | 0.02 | 0.7 | 0.8 | 0.3 | 0.5 | 0.4 | 0.1 | 0.1 | - | 0.6 | 0.5 | ||
| CC_NEC_5 | σ | 1.3 | 0.2 | 12.2 | 58.3 | 3.3 | 6.8 | 0.1 | 0.5 | n.d. | n.d | 1.2 | 16.1 | |
| S.D. | 0.1 | 0.0 | 0.3 | 0.7 | 0.0 | 0.1 | 0.0 | 0.0 | - | - | 0.1 | 0.7 | ||
| RFS | CC_NEC_14 | σ | 2.5 | 0.1 | 13.3 | 55.0 | 3.1 | 9.4 | 0.2 | 0.7 | 0.4 | 2.9 | n.d. | 12.4 |
| S.D. | 0.2 | 0.1 | 0.5 | 1.4 | 0.1 | 0.8 | 0.03 | 0.2 | 0.1 | 0.3 | - | 0.9 | ||
| SAC14 | σ | 2.0 | 0.2 | 15.8 | 58.7 | 4.3 | 9.5 | 0.1 | 0.6 | n.d. | n.d. | n.d. | 8.8 | |
| S.D. | 0.1 | 0.5 | 0.6 | 1.3 | 0.1 | 0.1 | 0.04 | 0.1 | - | - | - | 0.9 | ||
| SAC12 | σ | 1.7 | 0.2 | 15.4 | 60.2 | 4.0 | 8.9 | 0.2 | 0.5 | n.d. | n.d. | n.d. | 8.9 | |
| S.D. | 0.1 | 0.0 | 0.5 | 1.3 | 0.1 | 0.3 | 0.0 | 0.1 | - | - | - | 0.6 | ||
| MCS9358 | σ | 2.3 | 0.2 | 16.1 | 58.6 | 3.7 | 8.7 | 0.2 | 0.6 | 0.03 | n.d. | n.d. | 9.5 | |
| S.D. | 0.2 | 0.0 | 0.1 | 0.8 | 0.2 | 0.9 | 0.0 | 0.1 | 0.04 | - | 0.5 | |||
| RFS-G | SAC1 | σ | 1.6 | 0.2 | 14.7 | 65.2 | 4.8 | 5.6 | 0.2 | 0.4 | n.d. | n.d. | 0.1 | 7.2 |
| S.D. | 0.1 | 0.0 | 0.3 | 0.6 | 0.1 | 0.2 | 0.1 | 0.0 | - | - | 0.1 | 0.2 | ||
| CMOGC | Measured | σ | 3.7 | 0.5 | 17.1 | 64.4 | 3.7 | 4.5 | 0.2 | 0.9 | n.d. | n.d. | 11.8 | 36.8 |
| S.D. | 0.1 | 0.1 | 0.8 | 1.7 | 0.2 | 0.6 | 0.0 | 0.3 | - | - | 0.1 | 3.9 | ||
| Ref. | 2.1 | 0.2 | 14.3 | 59.3 | 3.4 | 5.1 | 0.2 | 0.5 | 0.18 | 0.052 | 11.4 | 36.7 |
Disclaimer/Publisher’s Note: The statements, opinions and data contained in all publications are solely those of the individual author(s) and contributor(s) and not of MDPI and/or the editor(s). MDPI and/or the editor(s) disclaim responsibility for any injury to people or property resulting from any ideas, methods, instructions or products referred to in the content. |
© 2024 by the authors. Licensee MDPI, Basel, Switzerland. This article is an open access article distributed under the terms and conditions of the Creative Commons Attribution (CC BY) license (https://creativecommons.org/licenses/by/4.0/).
Share and Cite
Coutinho, M.L.; Veiga, J.P.; Ruivo, A.; Pereira da Silva, T.; Bottura-Scardina, S.; Lima, M.M.R.A.; Pereira, C.; Dias, A.C.; Dias, L.; Vandenabeele, P.; et al. Characterization of Tableware from Fábrica de Loiça de Sacavém—Linking Analytical and Documental Research. Minerals 2024, 14, 324. https://doi.org/10.3390/min14030324
Coutinho ML, Veiga JP, Ruivo A, Pereira da Silva T, Bottura-Scardina S, Lima MMRA, Pereira C, Dias AC, Dias L, Vandenabeele P, et al. Characterization of Tableware from Fábrica de Loiça de Sacavém—Linking Analytical and Documental Research. Minerals. 2024; 14(3):324. https://doi.org/10.3390/min14030324
Chicago/Turabian StyleCoutinho, Mathilda L., João Pedro Veiga, Andreia Ruivo, Teresa Pereira da Silva, Silvia Bottura-Scardina, Maria Margarida R. A. Lima, Carlos Pereira, Ana Carvalho Dias, Luis Dias, Peter Vandenabeele, and et al. 2024. "Characterization of Tableware from Fábrica de Loiça de Sacavém—Linking Analytical and Documental Research" Minerals 14, no. 3: 324. https://doi.org/10.3390/min14030324