

Organic Matter Enrichment Mechanisms in the Lower Cambrian Shale: A Case Study from Xiangandi #1 Well
Abstract
:1. Introduction
2. Samples and Method
3. Results
3.1. TOC Content
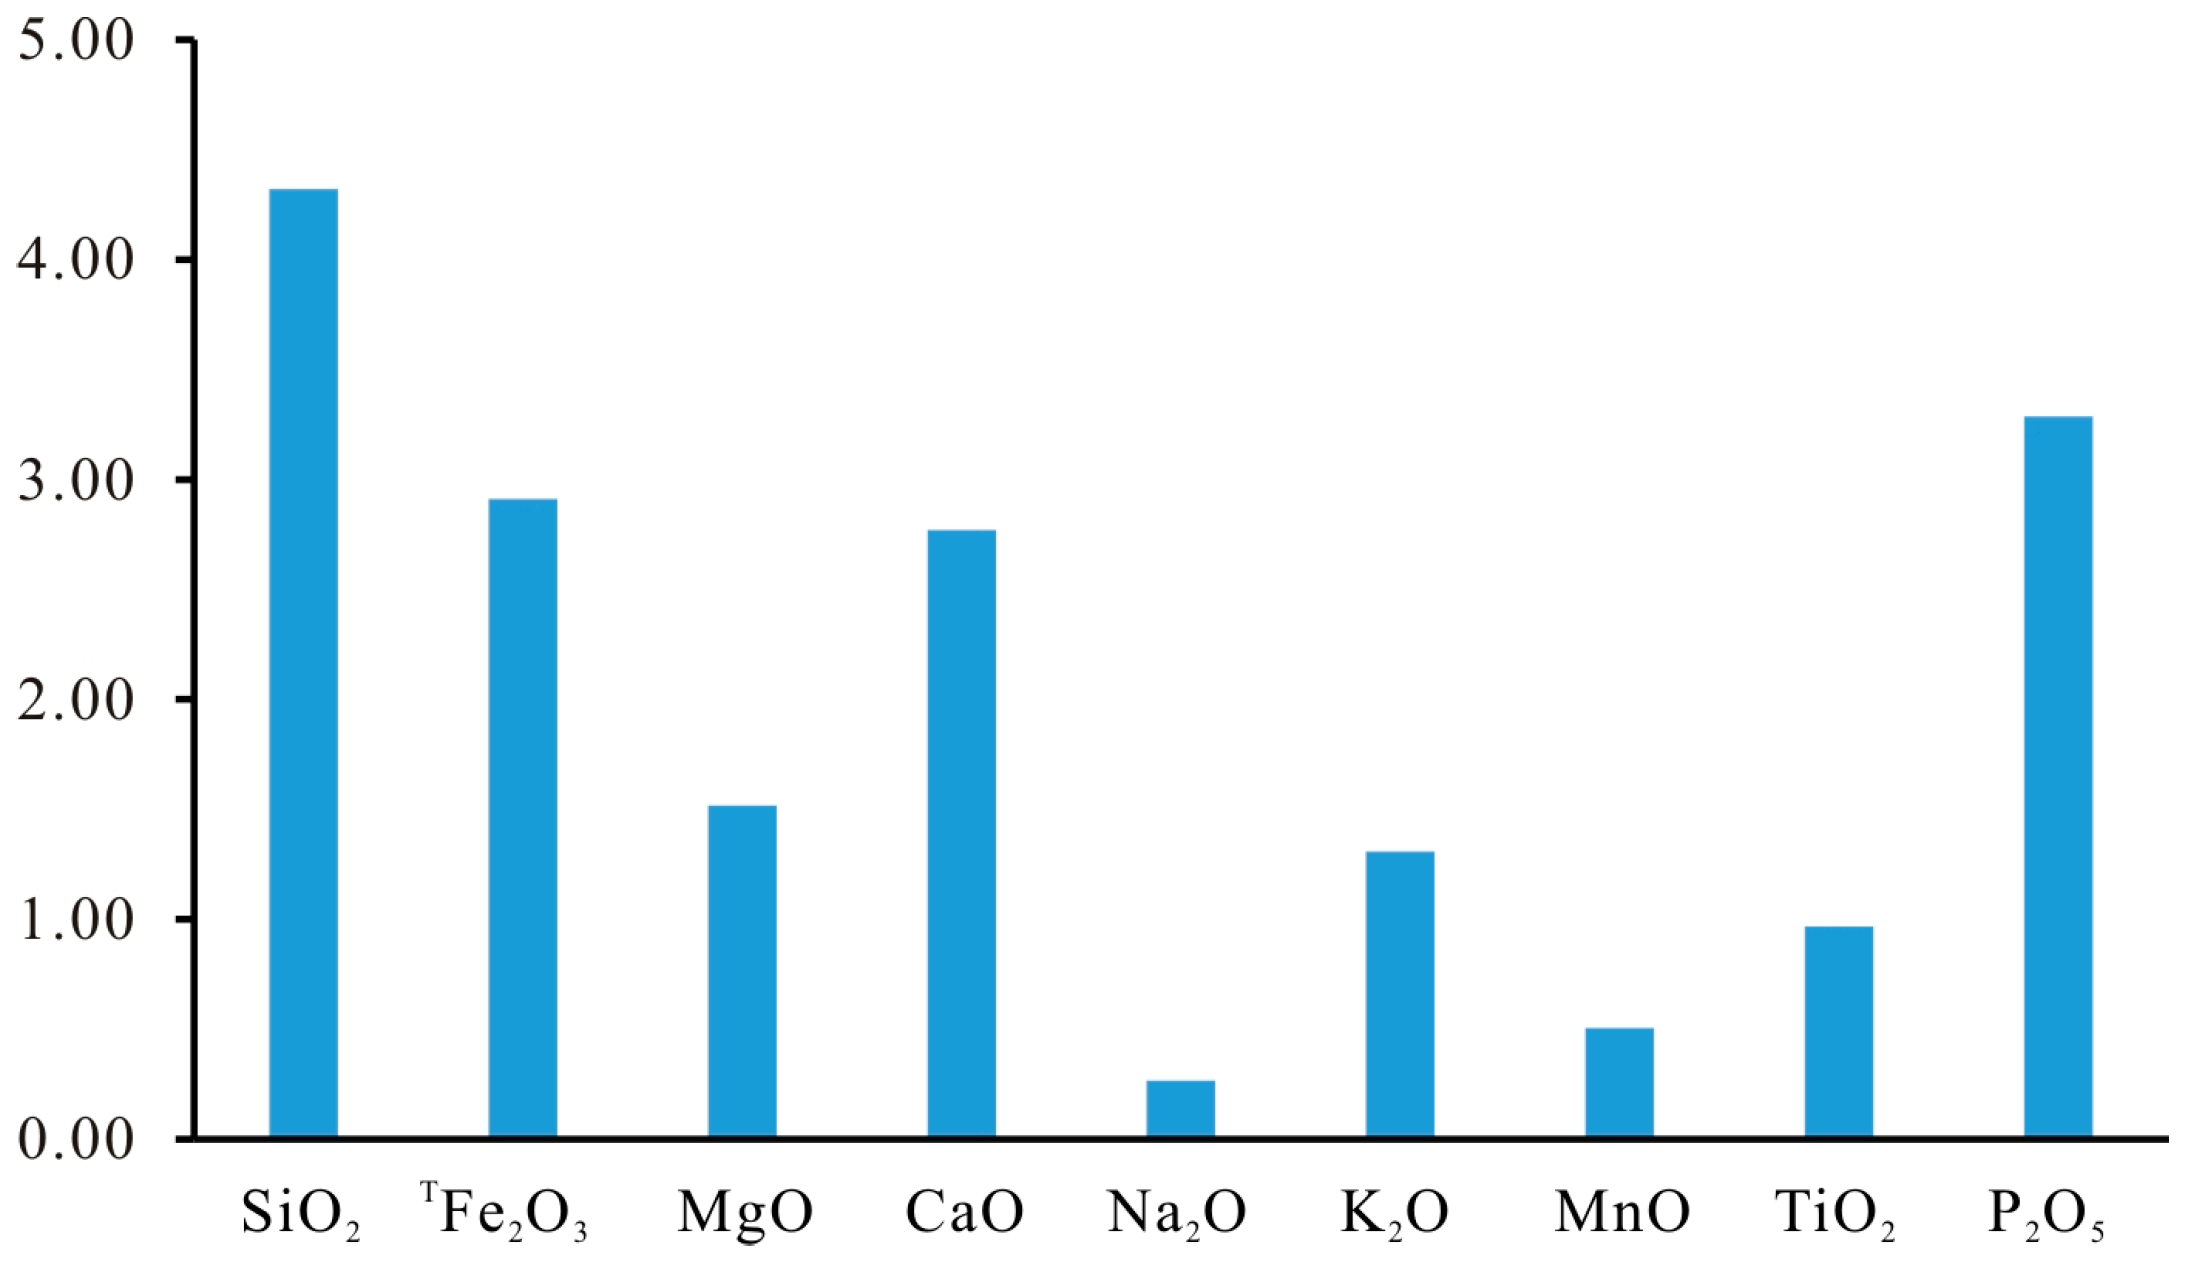
3.2. Major Element
3.3. Trace Element
4. Discussion
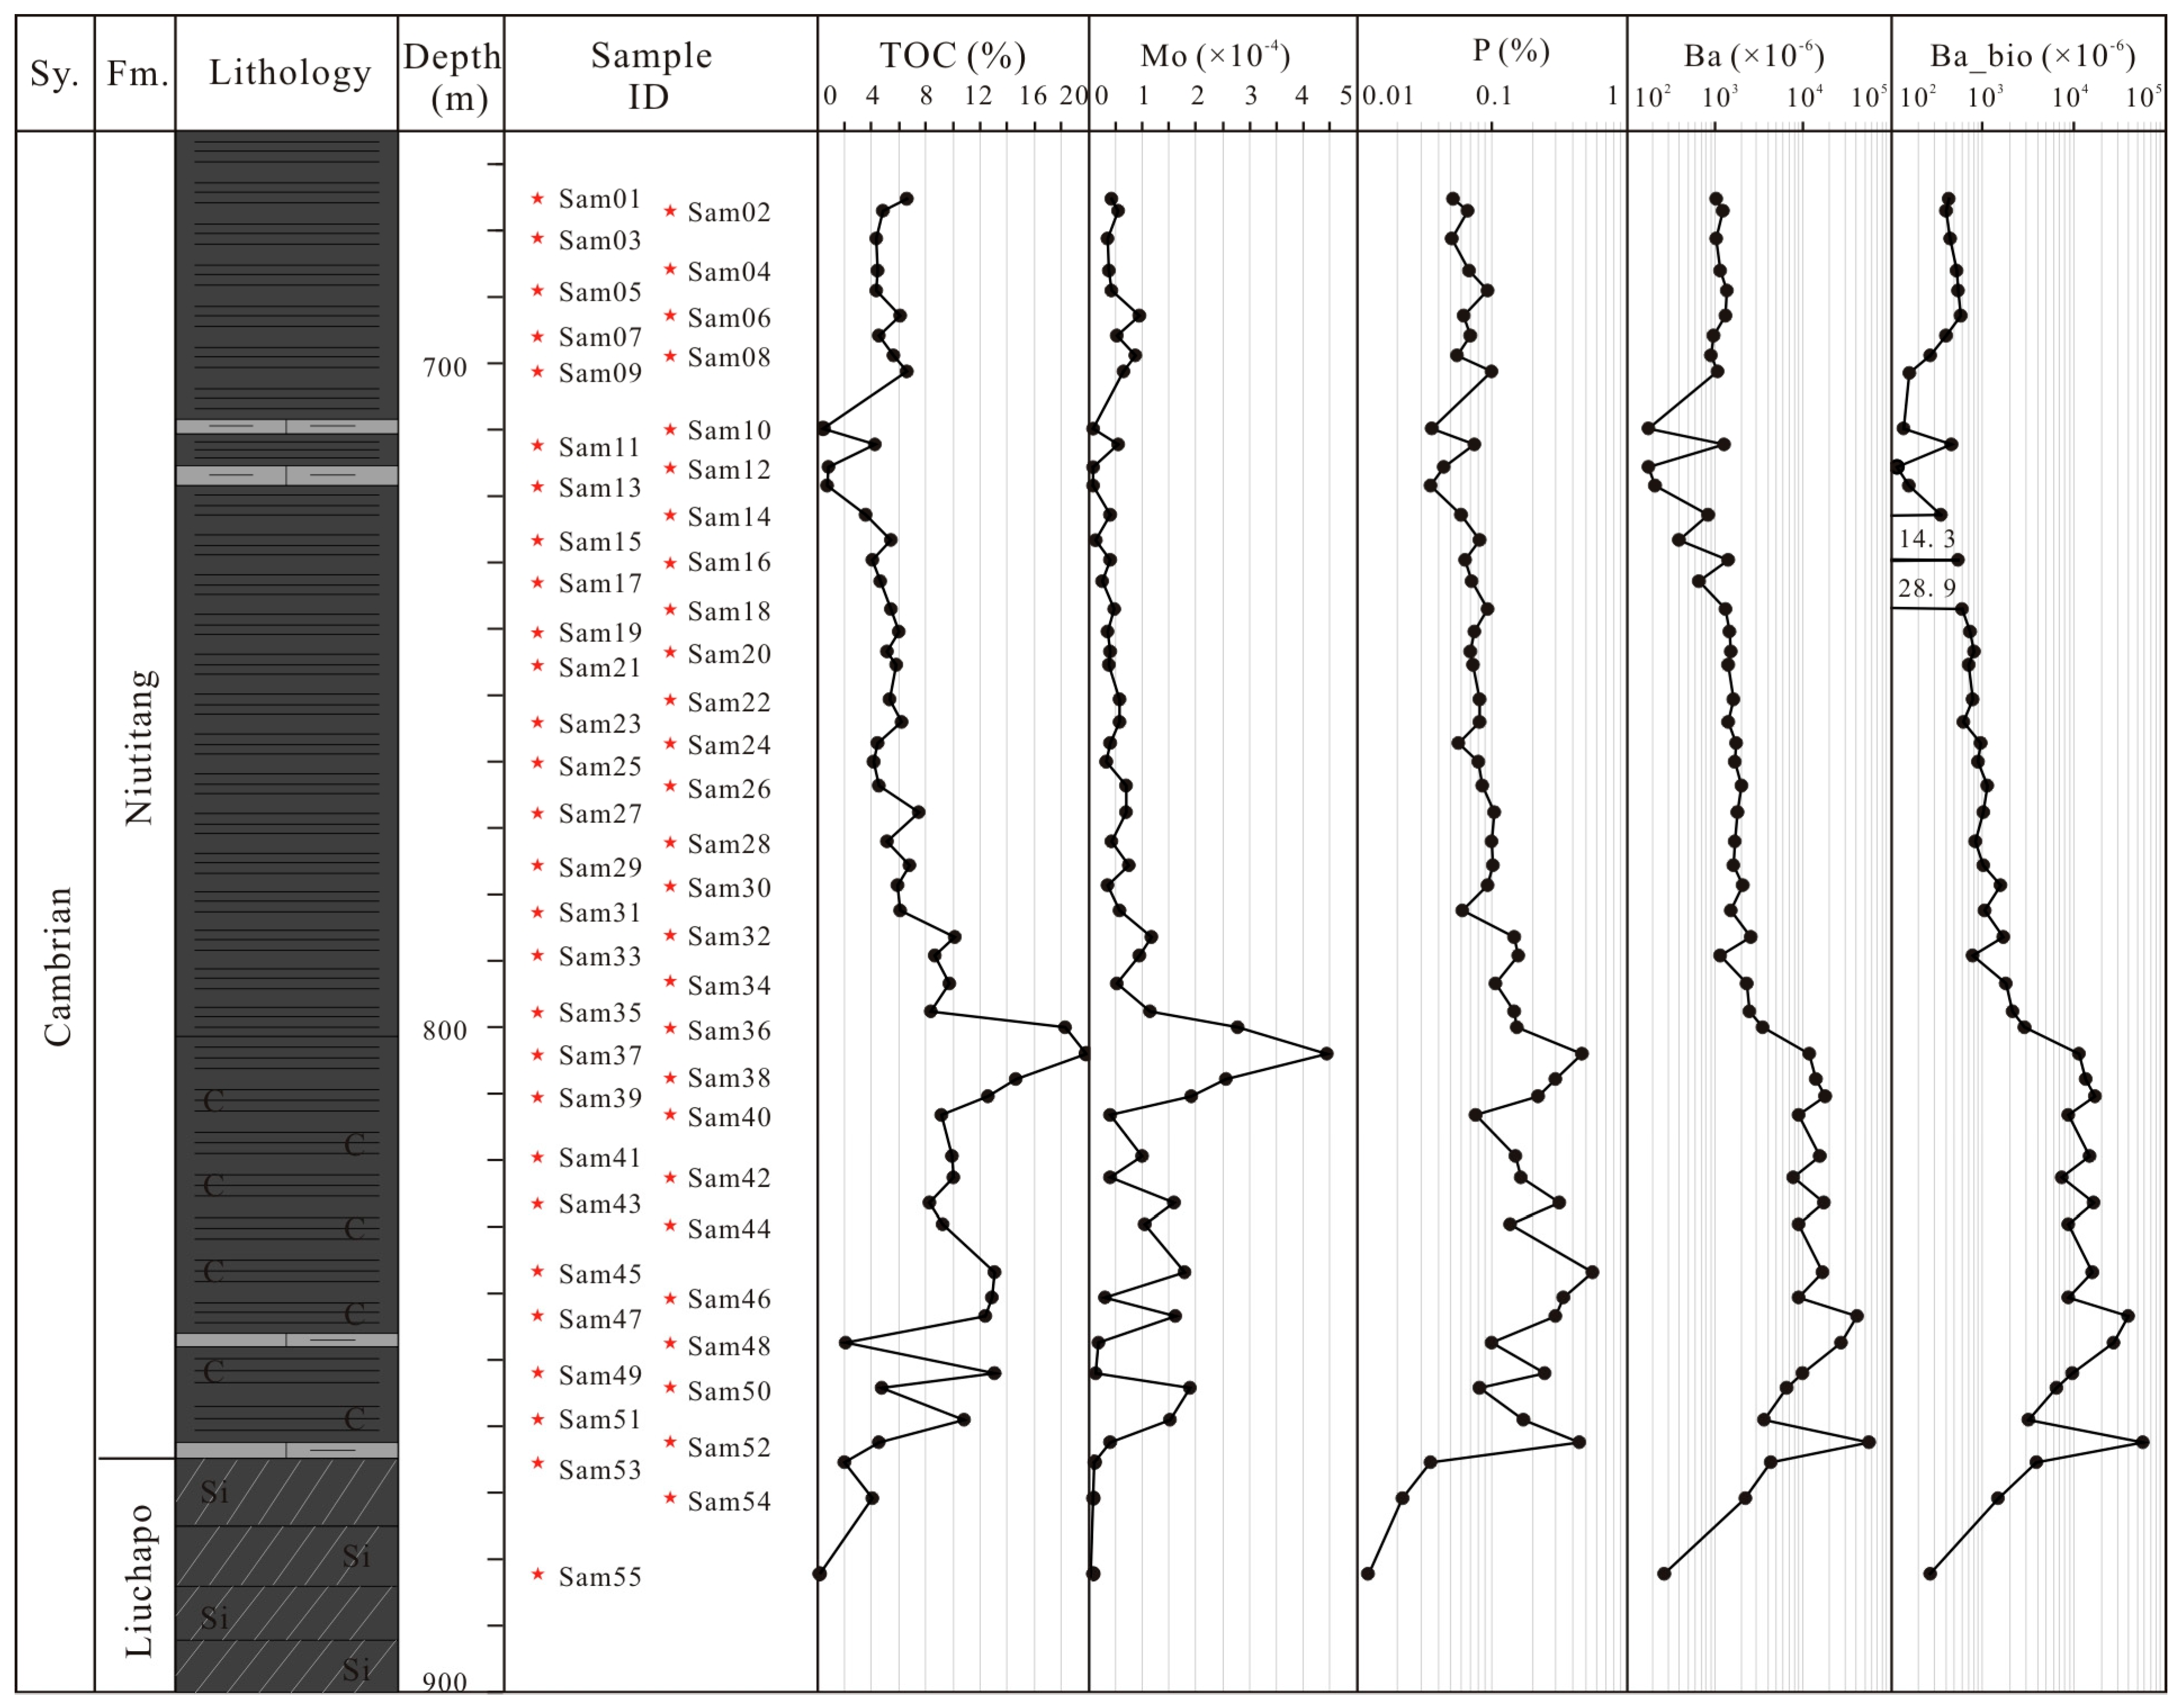
4.1. Primary Production
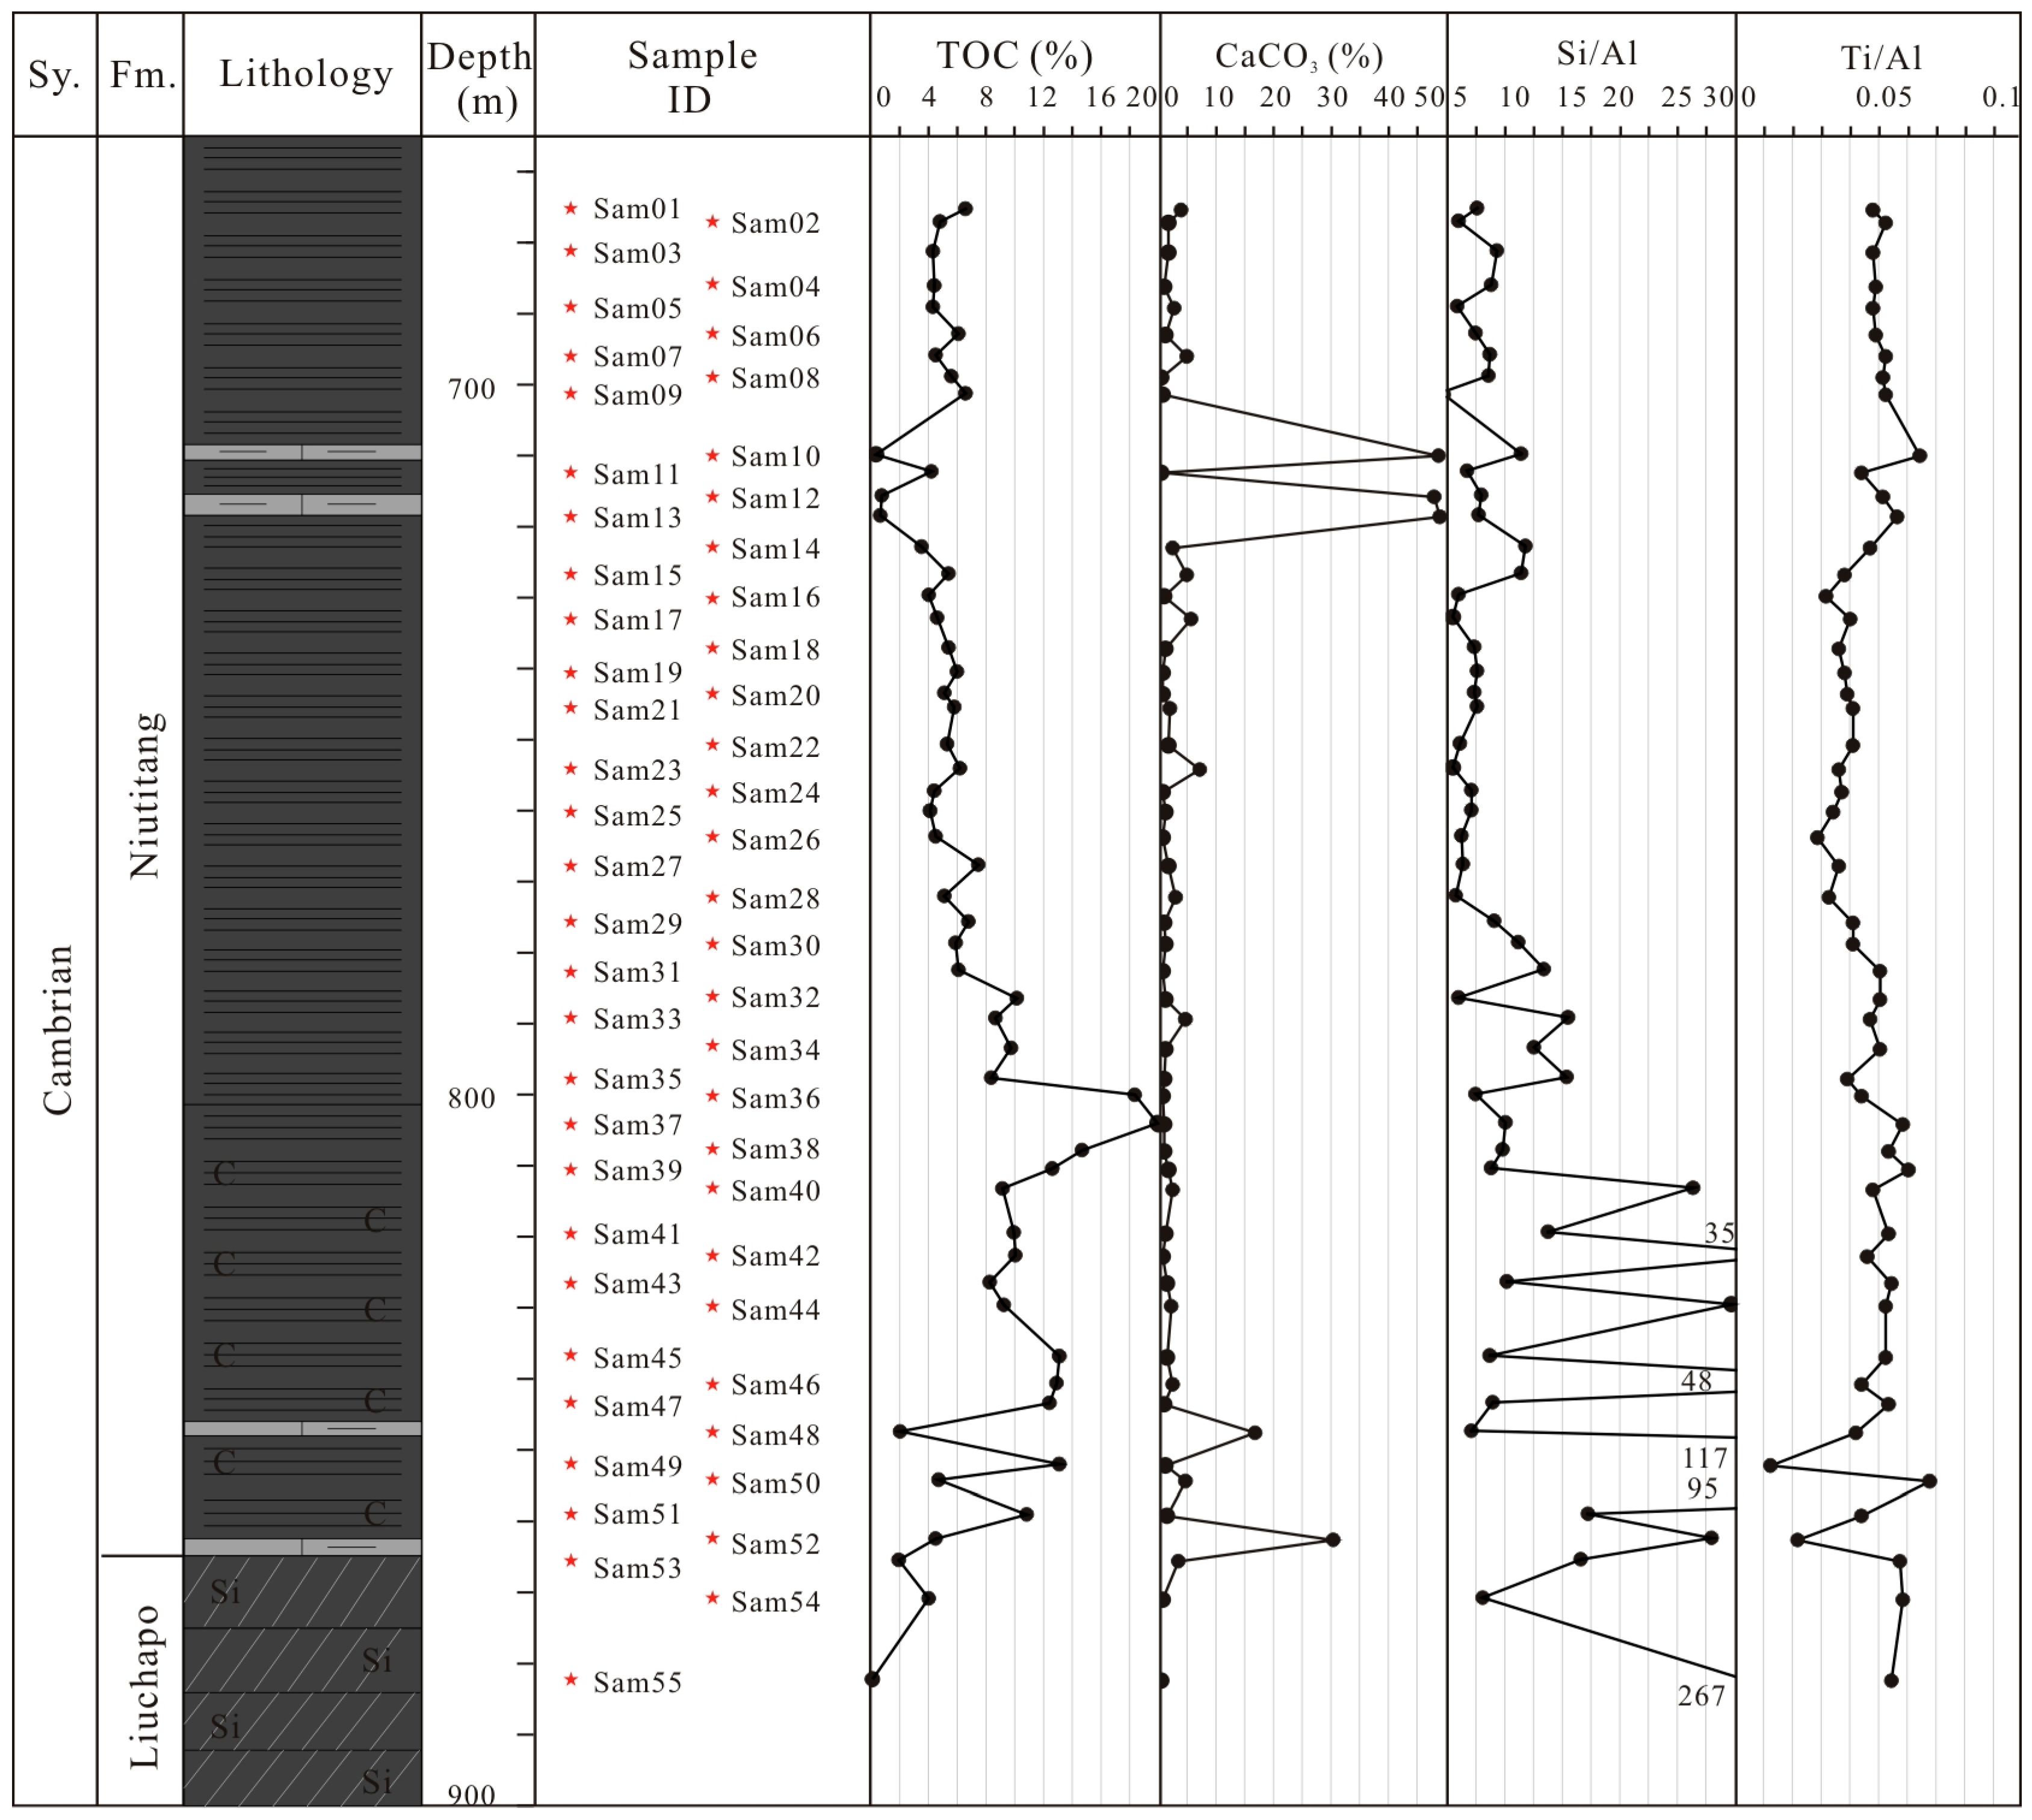
4.2. Clastic Influx
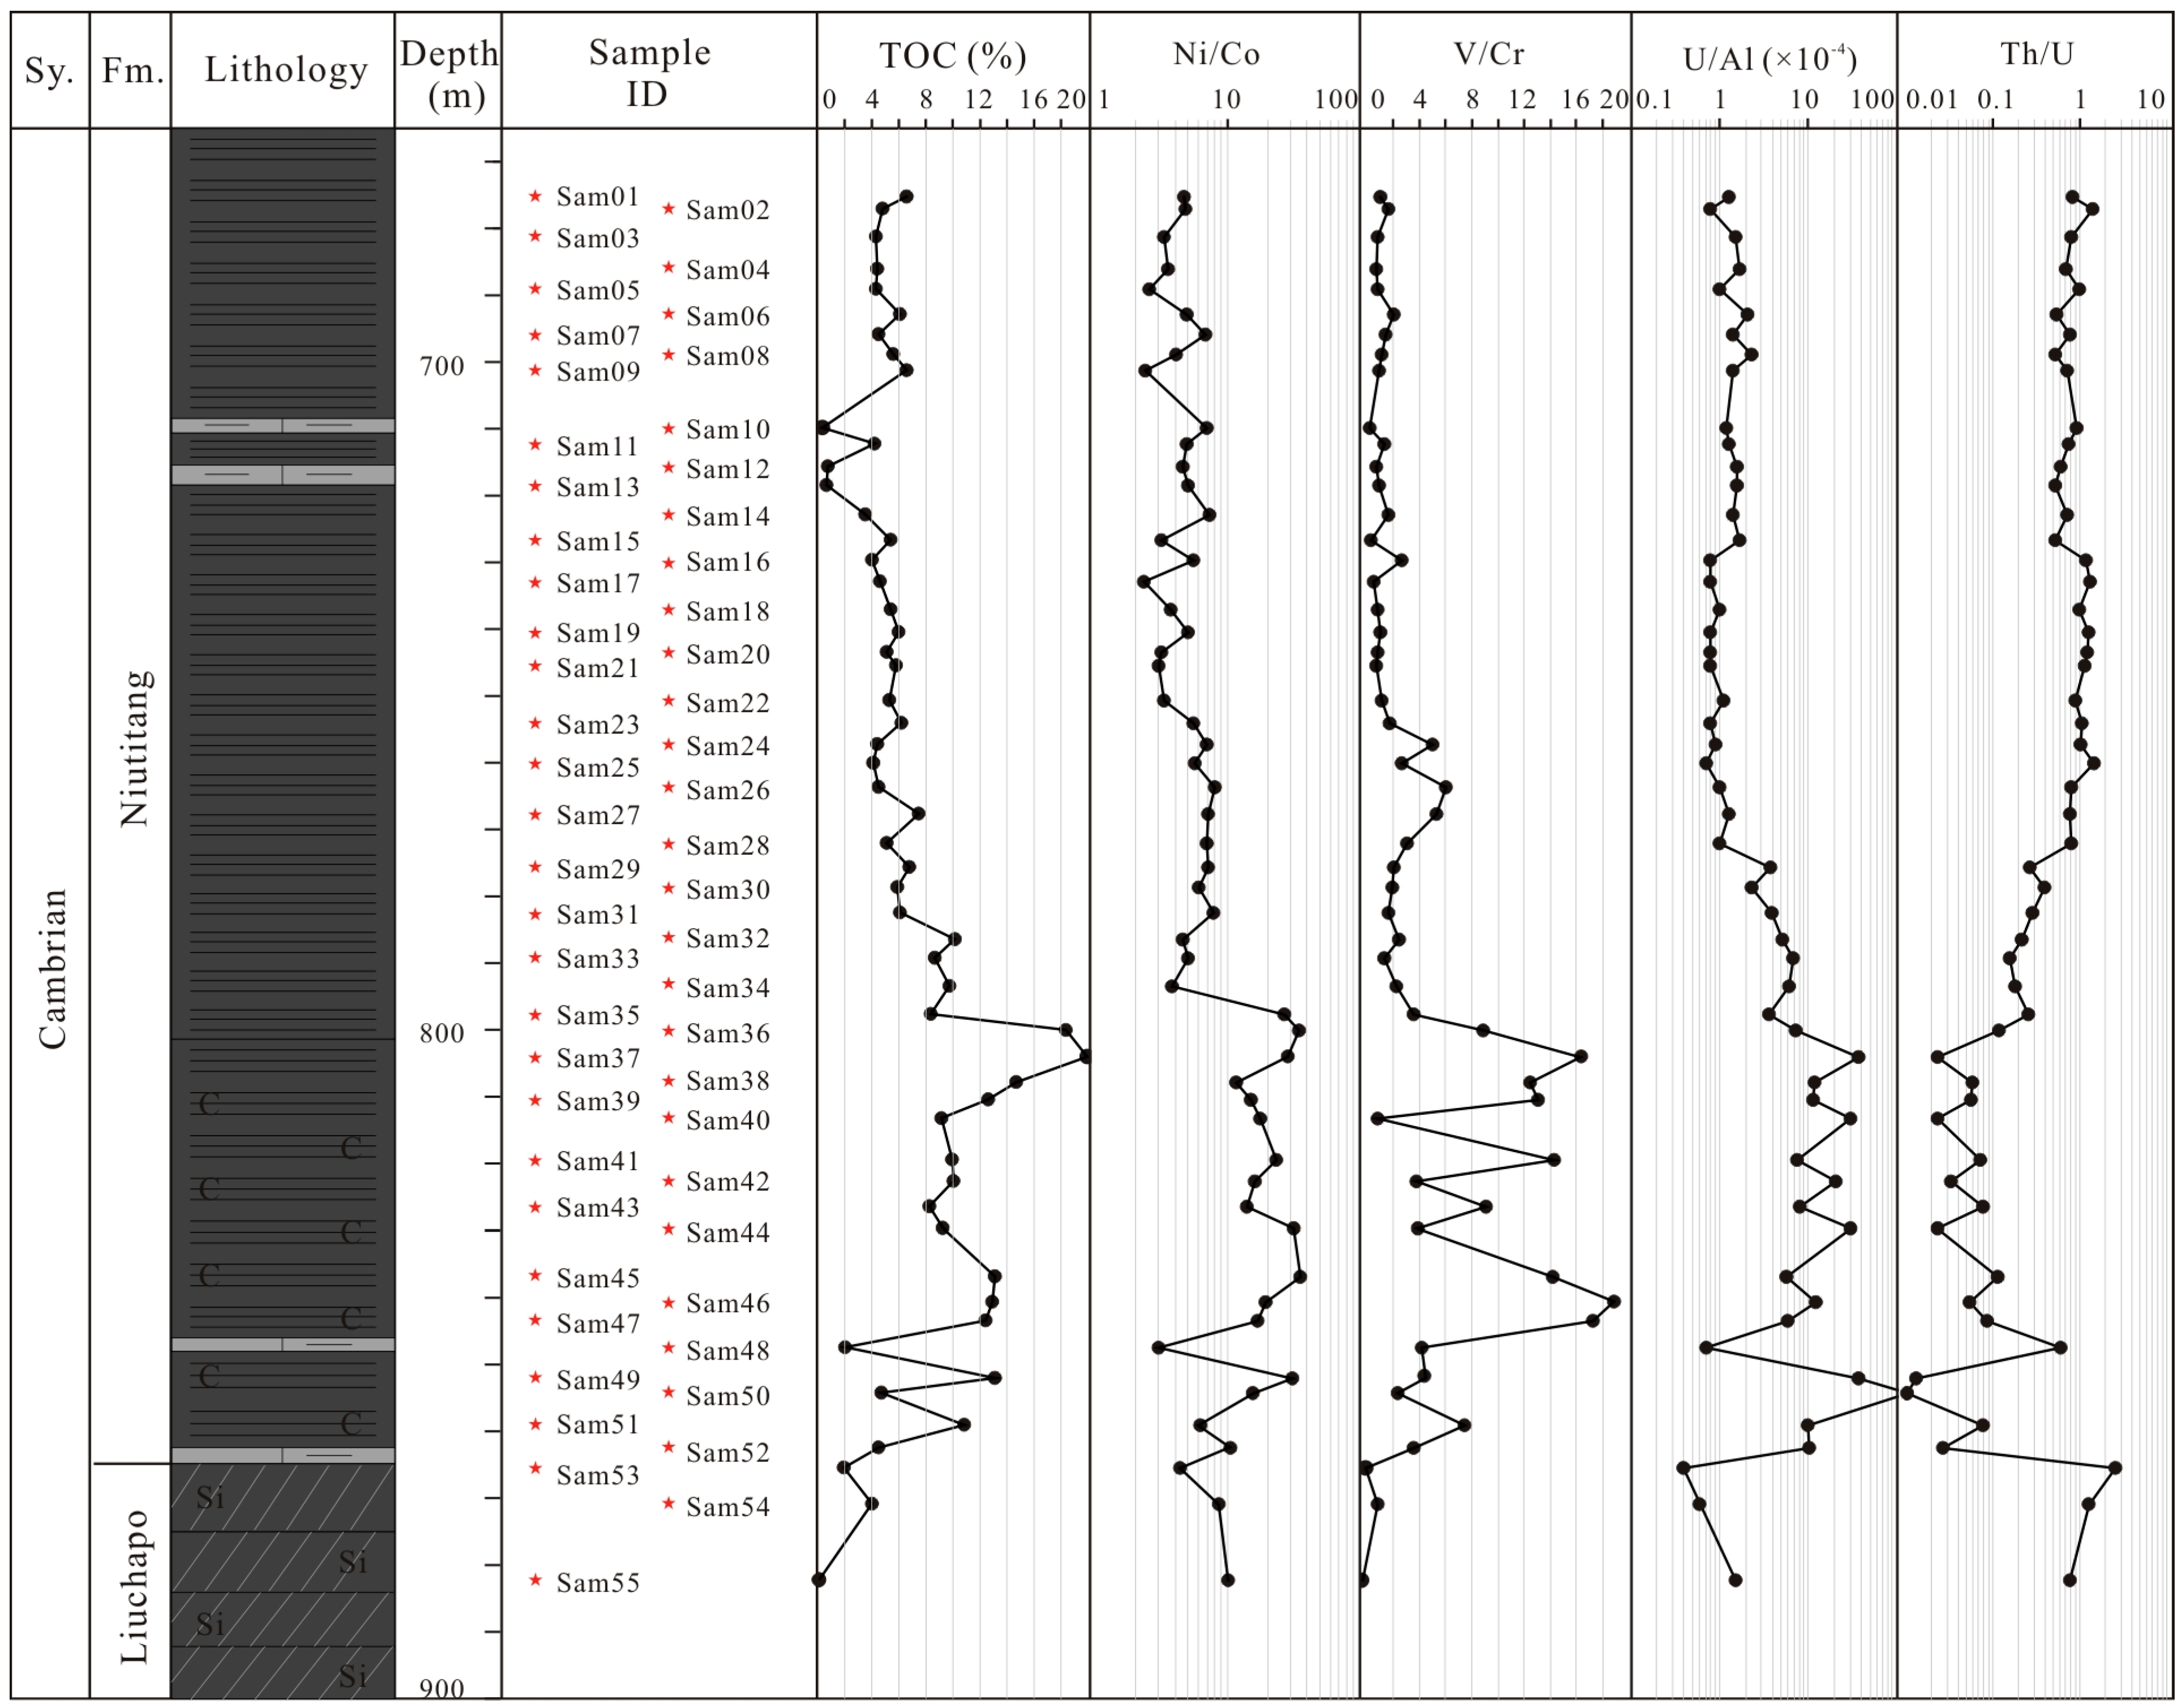
4.3. Redox Conditions
4.4. Organic Matter Accumulation Mechanism of Organic-Rich Shales
5. Conclusions
- Redox and primary productivity proxies suggest that the black, organic-rich shales in the Niutitang Formation were deposited in anoxic–euxinic conditions during periods of high primary productivity;
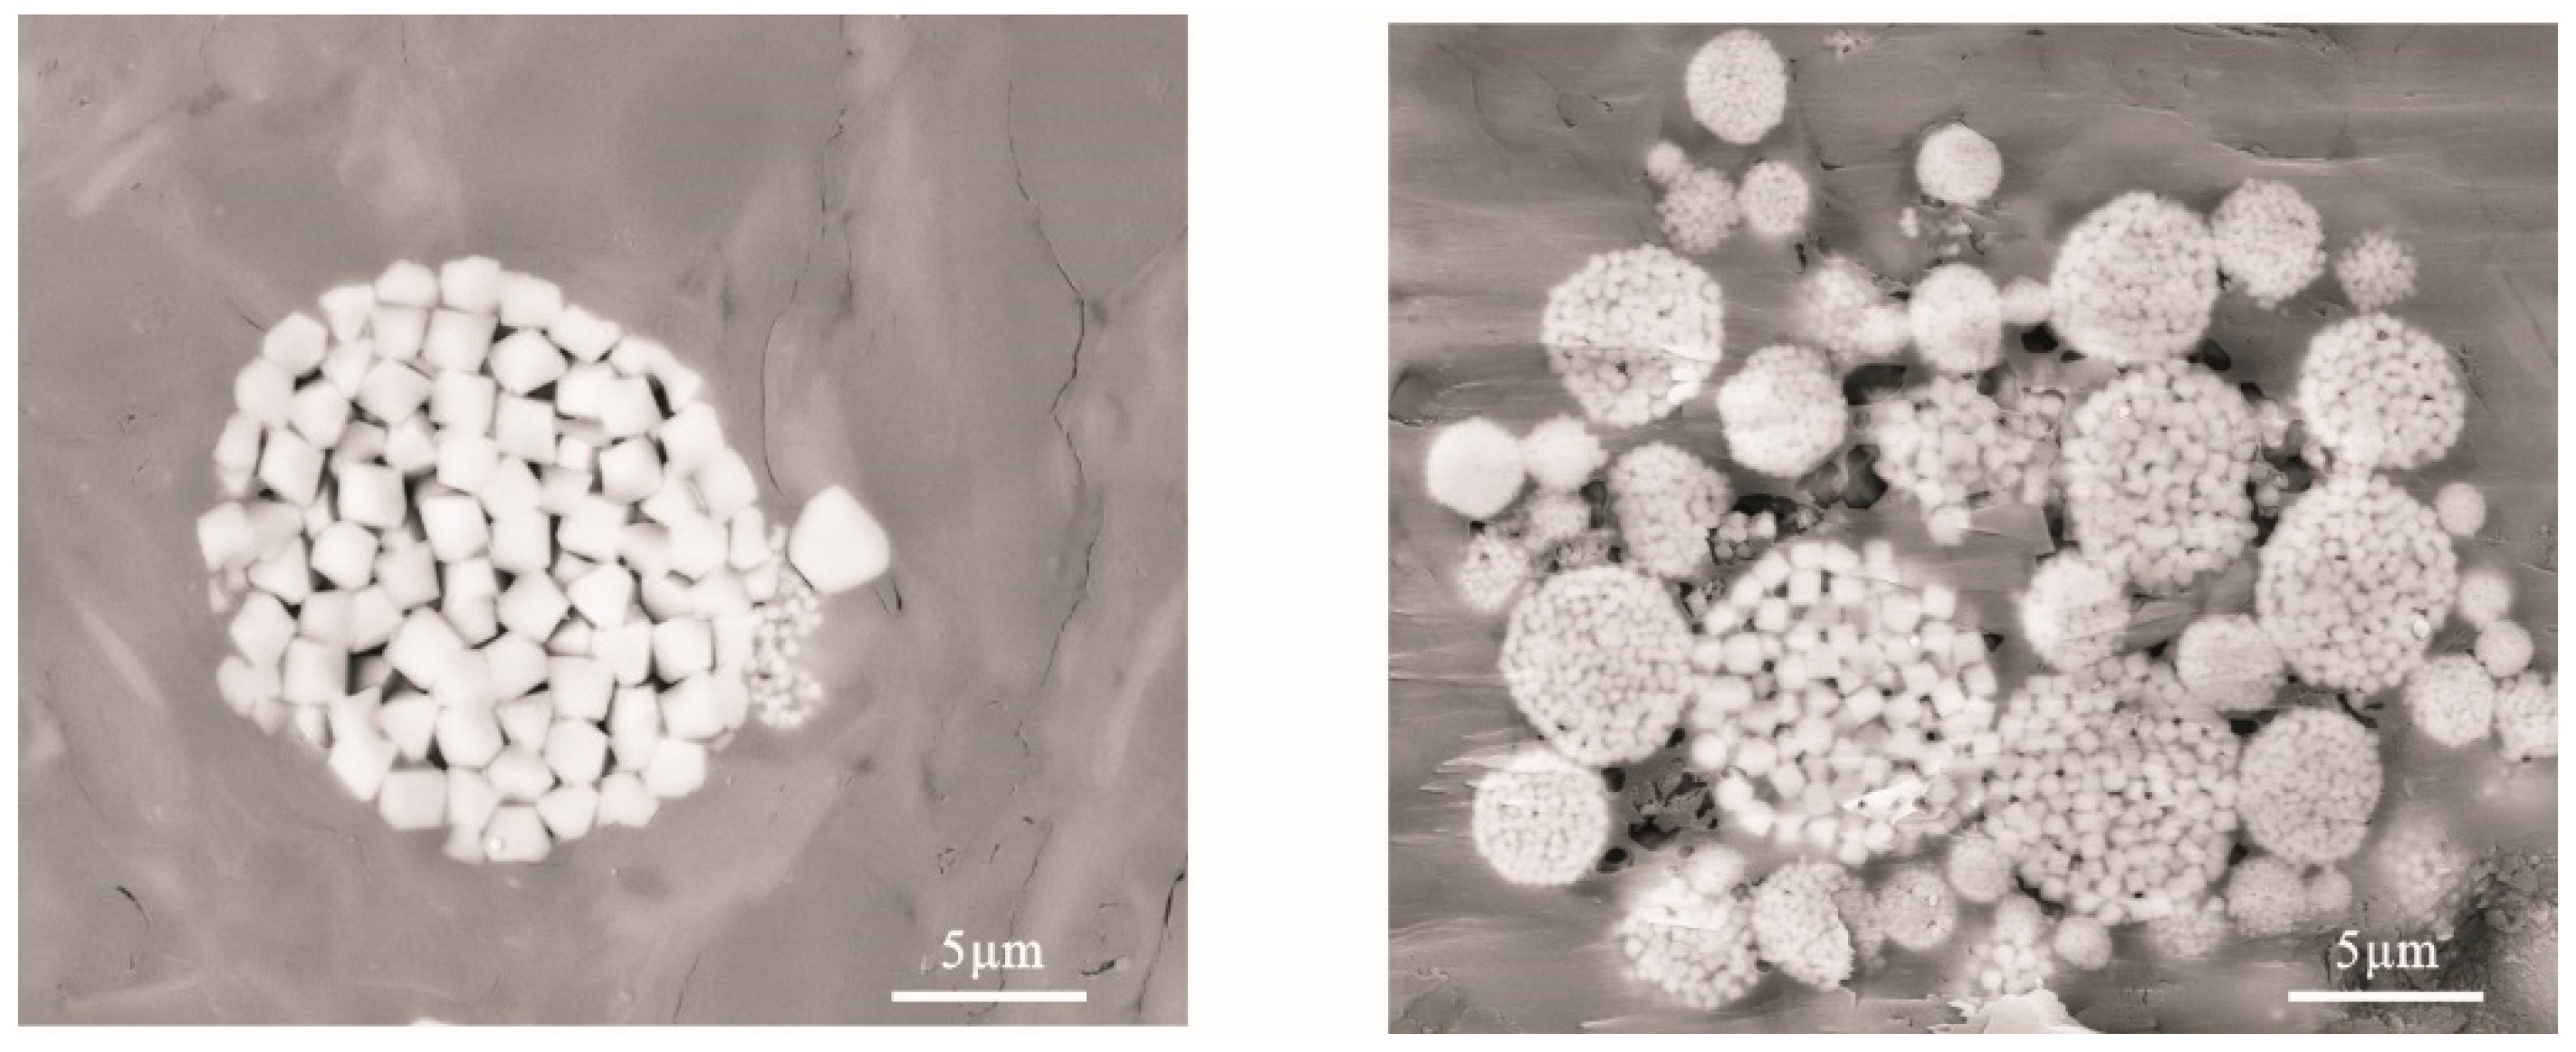
- Framboidal pyrite indicates that anoxic bottom waters existed during organic matter deposition. The high primary productivity enhanced the organic C flux into the thermocline layer and bottom waters, which formed the O2-depleted bottom waters;
- Ti/Al ratios correlate with TOC contents throughout the Niutitang Formation, indicating the clastic input enhanced the burial rate and prevented organic matter degradation during deposition of the Niutitang Formation.
Author Contributions
Funding
Data Availability Statement
Acknowledgments
Conflicts of Interest
References
- Bohacs, K.M.; Grawbowski, G.J.; Carroll, A.R.; Mankeiwitz, P.J.; Miskell-Gerhardt, K.J.; Schwalbach, J.R.; Wegner, M.B.; Simo, J.A. Production, and dilution—The many paths to source-rock development. In Deposition of Organic-Carbonrich Sediments: Models, Mechanisms and Consequences; SEPM Special Publication: Tulsa, OK, USA, 2005; pp. 61–101. [Google Scholar]
- Passey, Q.R.; Bohacs, K.M.; Esch, W.L.; Klimentidis, R.; Sinha, S. From oil-prone source rock to gas-producing shale reservoir-geologic and petophysical characterization of unconventional shale gas reservoirs. In Proceedings of the SPE 131350, SPE International Oil & Gas Conference and Exhibition, Beijing, China, 8–10 June 2010. [Google Scholar]
- Wang, Z.W.; Wang, J.; Fu, X.G.; Zhan, W.Z.; Yu, F.; Feng, X.L.; Song, C.Y.; Chen, W.B.; Zeng, S.Q. Organic material accumulation of Carnian mudstones in the North Qiangtang Depression, eastern Tethys: Controlled by the paleoclimate, paleo- environment, and provenance. Mar. Petrol. Geol. 2017, 88, 440–457. [Google Scholar] [CrossRef]
- Calvert, S.E.; Pedersen, T.F. Geochemistry of recent oxic and anoxic marine sediments: Implications for the geological record. Mar. Geol. 1993, 113, 67–88. [Google Scholar] [CrossRef]
- Sageman, B.B.; Murphy, A.E.; Werne, J.P.; Ver Straeten, C.A.; Hollander, D.J.; Lyons, T.W. A tale of shales: The relative roles of production, decomposition, and dilution in the accumulation of organic-rich strata, Middle–Upper Devonian, Appalachian basin. Chem. Geol. 2003, 195, 229–273. [Google Scholar] [CrossRef]
- Wei, H.Y.; Chen, D.Z.; Wang, J.G.; Yu, H.; Tucker, M.E. Organic accumulation in the lower Chihsia Formation (Middle Permian) of South China: Constraints from pyrite morphology and multiple geochemical proxies. Paleogeoger. Palaeocl. 2012, 353–355, 73–86. [Google Scholar] [CrossRef]
- Algeo, T.J.; Henderson, C.M.; Tong, J.N.; Feng, Q.L.; Yin, H.F.; Tyson, R.V. Plankton and productivity during the Permian–Triassic boundary crisis: An analysis of organic carbon fluxes. Glob. Planet. Chang. 2013, 105, 52–67. [Google Scholar] [CrossRef]
- Creaney, S.; Passey, Q.R. Recurring patterns of total organic carbon and source rock quality within a sequence stratigraphic framework. AAPG Bull. 1993, 77, 386–401. [Google Scholar]
- Tyson, R.V. Sedimentation rate, dilution, preservation and total organic carbon: Some results of a modelling study. Org. Geochem. 2001, 32, 333–339. [Google Scholar] [CrossRef]
- Henrichs, S.M.; Reeburgh, W.S. Anaerobic mineralization of marine sediment organic matter: Rates and the role of anaerobic processes in the oceanic carbon economy. Geomicrobiol. J. 1987, 5, 191–238. [Google Scholar] [CrossRef]
- Demaison, G.J.; Moore, G.T. Anoxic environments and oil source bed genesis. Org. Geochem. 1980, 2, 9–31. [Google Scholar] [CrossRef]
- Calvert, S.E.; Bustin, R.M.; Ingall, E.D. Influence of water column anoxia and sediment supply on the burial and preservation of organic carbon in marine shales. Geochim. Cosmochim. Acta 1996, 60, 1577–1593. [Google Scholar] [CrossRef]
- Yan, D.T.; Wang, H.; Fu, Q.L.; Chen, Z.H.; He, J.; Gao, Z. Geochemical characteristics in the Longmaxi Formation (Early Silurian) of South China: Implications for organic matter accumulation. Mar. Petrol. Geol. 2015, 65, 290–301. [Google Scholar] [CrossRef]
- Peng, J. What besides redox conditions? Impact of sea-level fluctuations on redoxsensitive trace-element enrichment patterns in marine sediments. Sci. China Earth Sci. 2022, 65, 1985–2004. [Google Scholar] [CrossRef]
- Peng, J.W.; Larson, T. A novel integrated approach for chemofacies characterization of organic-rich mudrocks. AAPG Bull. 2022, 106, 437–460. [Google Scholar] [CrossRef]
- Liang, C.; Jiang, Z.X.; Guo, L.; Yang, Y.T. Characteristics of black shale, sedimentary evolution and shale gas exploration prospect of shelf face taking Wengan and Yongye profile of the Niutitang Formation as an example. J. Daqing Petrol. Inst. 2011, 35, 13–21. [Google Scholar]
- Mei, M.X.; Zhang, H.; Meng, X.Q.; Chen, Y.H. Sequence stratigraphic division and framework of the Lower Cambrian in the Upper Yangte region. Geol. China 2006, 33, 1292–1304. [Google Scholar]
- Wu, Y.; Fan, T.L.; Jiang, S.; Yang, X.Q. Lithofacies and sedimentary sequence of the lower Cambrian Niutitang shale in the upper Yangtze platform, South China. J. Nat. Gas Sci. Eng. 2017, 43, 124–136. [Google Scholar] [CrossRef]
- Wu, Y.; Fan, T.L.; Ding, H.Y. Lithofacies and Sedimentary Model of the Lower Cambrian Marine Shale in the Upper Yangtze Platform. Geoscience 2017, 31, 1222–1232. [Google Scholar]
- Arthur, M.A.; Sageman, B.B. Marine black shales: Depositional mechanisms and environments of ancient deposits. Annu. Rev. Earth Planet Sci. 1994, 22, 499–551. [Google Scholar] [CrossRef]
- Jones, B.; Manning, D.A.C. Comparison of geochemical indices used for the interpretation of palaeoredox conditions in ancient mudstones. Chem. Geol. 1994, 111, 111–129. [Google Scholar] [CrossRef]
- Tribovillard, N.; Algeo, T.J.; Lyons, T.; Riboulleau, A. Trace metals as paleoredox and paleoproductivity proxies: An update. Chem. Geol. 2006, 232, 12–32. [Google Scholar] [CrossRef]
- Ross, D.J.K.; Bustin, R.M. Investigating the use of sedimentary geochemical proxies for paleoenvironment interpretation of thermally mature organic-rich strata: Examples from the Devonian–Mississippian shales, Western Canadian Sedimentary Basin. Chem. Geol. 2009, 200, 1–19. [Google Scholar] [CrossRef]
- Shields, G.; Stille, P. Diagenetic constraints on the use of cerium anomalies as palaeoseawater redox proxies: An isotopic and REE study of Cambrian phosphorites. Chem. Geol. 2001, 175, 29–48. [Google Scholar] [CrossRef]
- Li, Y.F.; Fan, T.L.; Zhang, J.C.; Zhang, J.P.; Wei, X.J.; Hu, X.L.; Zeng, W.T.; Fu, W. Geochemical changes in the Early Cambrian interval of the Yangtze Platform, South China: Implications for hydrothermal influences and paleocean redox conditions. J. Asian Earth Sci. 2015, 109, 100–123. [Google Scholar] [CrossRef]
- Zhou, L.; Kang, Z.H.; Wang, Z.X.; Peng, Y.Y.; Xiao, H.F. Sedimentary geochemical investigation for paleoenvironment of the Lower Cambrian Niutitang Formation shales in the Yangtze Platform. J. Petrol. Sci. Eng. 2017, 159, 376–386. [Google Scholar] [CrossRef]
- Mao, J.W.; Lehmann, B.; Du, A.D.; Zhang, G.D.; Ma, D.S.; Wang, Y.T.; Zeng, M.G.; Kerrich, R. Re-Os dating of polymetallic Ni-Mo-PGE-Au mineralization in Lower Cambrian black shales of South China and its geologic significance. Econ. Geol. 2002, 97, 1051–1061. [Google Scholar] [CrossRef]
- Jiang, S.Y.; Yang, J.H.; Ling, H.F.; Chen, Y.Q. Extreme enrichment of polymetallic Ni–Mo–PGE–Au in lower Cambrian black shales of South China: An Os isotope and PGE geochemical investigation. Paleogeogr. Paleocl. 2007, 254, 217–228. [Google Scholar] [CrossRef]
- Xu, L.G.; Lehmann, B.; Mao, J.W. Seawater contribution to polymetallic Ni–Mo–PGE–Au mineralization in Early Cambrian black shales of South China: Evidence from Mo isotope, PGE, trace element, and REE geochemistry. Ore Geol. Rev. 2013, 52, 66–84. [Google Scholar] [CrossRef]
- Liu, Z.H.; Zhuang, X.G.; Teng, G.E.; Xie, X.M.; Yin, L.M.; Bian, L.Z.; Feng, Q.L.; Algeo, T.J. The Lower Cambrian Niutitang Formation at Yangtiao (Guizhou, SW China): Organic matter enrichment, source rock potential, and hydrothermal influences. J. Petrol. Geol. 2015, 38, 411–432. [Google Scholar] [CrossRef]
- Wedepohl, K.H. Environmental influences on the chemical composition of shales and clays. In Physics and Chemistry of the Earth; Ahrens, L.H., Press, F., Runcorn, S.K., Urey, H.C., Eds.; Pergamon: Oxford, UK, 1971; Volume 8, pp. 307–331. [Google Scholar]
- Chen, D.; Wang, J.; Qing, H.; Yan, D.; Li, R. Hydrothermal venting activities in the Early Cambrian, south China: Petrological, geochronological and stable isotopic constraints. Chem. Geol. 2009, 258, 168–181. [Google Scholar] [CrossRef]
- Schoepfer, S.D.; Shen, J.; Wei, H.Y.; Tyson, R.V.; Ingall, E.; Algeo, T.J. Total organic carbon, organic phosphorus, and biogenic barium fluxes as proxies for paleomarine productivity. Earth-Sci. Rev. 2014, 149, 23–52. [Google Scholar] [CrossRef]
- Hedges, J.I.; Keil, R.G. Sedimentary organic matter preservation: An assessment and speculative synthesis. Mar. Chem. 1995, 49, 81–115. [Google Scholar] [CrossRef]
- Helz, G.R.; Miller, C.V.; Charnock, J.M.; Mosselmans, J.L.W.; Pattrick, R.A.D.; Garner, C.D.; Vaughan, D.J. Mechanisms of molybdenum removal from the sea and its concentration in black shales: EXAFS evidences. Geochim. Cosmochim. Acta 1996, 60, 3631–3642. [Google Scholar] [CrossRef]
- Adelson, J.M.; Helz, G.R.; Miller, C.V. Reconstructing the rise of recent coastal anoxia; molybdenum in Chesapeake Bay sediments. Geochim. Cosmochim. Acta 2001, 65, 237–252. [Google Scholar] [CrossRef]
- Bertine, K.K. The deposition of molybdenum in anoxic waters. Mar. Chem. 1972, 1, 43–53. [Google Scholar] [CrossRef]
- Ripley, E.M.; Shaffer, N.R.; Gilstrap, M.S. Distribution and geochemical characteristics of metal enrichment in the New Albany Shale (Devonian–Mississippian), Indiana. Econ. Geol. 1990, 85, 1790–1807. [Google Scholar] [CrossRef]
- Werne, J.P.; Sageman, B.B.; Lyons, T.W.; Hollander, D.J. An integrated assessment of a “type euxinic” deposit: Evidence for multiple controls on black shale deposition in the Middle Devonian Oatka Creek Formation. Am. J. Sci. 2002, 302, 110–143. [Google Scholar] [CrossRef]
- Paytan, A.; McLaughlin, K. The oceanic phosphorus cycle. Chem. Rev. 2007, 107, 563–576. [Google Scholar] [CrossRef] [PubMed]
- Ingall, E.D.; Kolowith, L.; Lyons, T.; Hurtgen, M. Sediment carbon, nitrogen and phosphorus cycling in an anoxic fjord, Effingham Inlet, British Columbia. Am. J. Sci. 2005, 305, 240–258. [Google Scholar] [CrossRef]
- Ingall, E.R.; Bustin, M.; Cappellen, P.V. Influence of water column anoxia on the burial and preservation of carbon and phosphorus in marine shales. Geochim. Cosmochim. Acta 1993, 57, 303–316. [Google Scholar] [CrossRef]
- Bertram, M.A.; Cowen, J.P. Morphological and compositional evidence for biotic precipitation of marine barite. J. Mar. Res. 1997, 55, 577–593. [Google Scholar] [CrossRef]
- Ganeshram, R.S.; François, R.; Commeau, J.; Brown-Leger, S.L. An experimental investigation of barite formation in seawater. Geochim. Cosmochim. Acta 2003, 67, 2599–2605. [Google Scholar] [CrossRef]
- Dymond, J.; Suess, E.; Lyle, M. Barium in deep-sea sediment: A geochemical proxy for paleoproductivity. Paleoceanography 1992, 7, 163–181. [Google Scholar] [CrossRef]
- Bertrand, P.; Shimmield, G.; Martinez, P.; Grousset, F.; Jorissen, F.; Paterne, M.; Pujol, C.; Bouloubassi, I.; Buat Menard, P.; Peypouquet, J.P.; et al. The glacial ocean productivity hypothesis: The importance of regional temporal and spatial studies. Mar. Geol. 1996, 130, 1–9. [Google Scholar] [CrossRef]
- Ibach, L.E.J. Relationship between sedimentation rate and total organic carbon content in ancient marine sediments. AAPG Bull. 1982, 66, 170–188. [Google Scholar]
- Zeng, S.Q.; Wang, J.; Fu, X.G.; Chen, W.B.; Feng, X.L.; Wang, D.; Song, C.Y.; Wang, Z.W. Geochemical characteristics, redox conditions, and organic matter accumulation of marine oil shale from the Changliang Mountain area, northern Tibet, China. Mar. Petrol. Geol. 2015, 64, 203–221. [Google Scholar] [CrossRef]
- Algeo, T.J.; Maynard, J.B. Trace-element behavior and redox facies in core shales of Upper Pennsylvanian Kansas-type cyclothems. Chem. Geol. 2004, 206, 289–318. [Google Scholar] [CrossRef]
- McManus, J.; Berelson, W.M.; Klinkhammer, G.P.; Hammond, D.E.; Holm, C. Authigenic uranium: Relationship to oxygen penetration depth and organic carbon rain. Geochim. Cosmochim. Acta 2005, 69, 95–108. [Google Scholar] [CrossRef]
- Kimura, H.; Watanabe, Y. Oceanic anoxia at the Precambrian-Cambrian boundary. Geology 2001, 29, 995–998. [Google Scholar] [CrossRef]
- Wignall, P.B.; Twitchett, R.J. Oceanic anoxia and the end Permian mass extinction. Science 1996, 272, 1155–1158. [Google Scholar] [CrossRef]
- Khan, D.; Qiu, L.W.; Liang, C.; Mirza, K.; Rehman, S.U.; Han, Y.; Hannan, A.; Kashif, M.; Kra, K.L. Genesis and distribution of pyrite in the lacustrine shale: Evidence from the Es3x shale of the Eocene Shahejie Formation, Zhanhua Sag, East China. ACS Omega 2022, 7, 1244–1258. [Google Scholar] [CrossRef]
- Zhao, J.; Liang, J.L.; Long, X.P.; Li, J.; Xiang, Q.R.; Zhang, J.C.; Hao, J.L. Genesis and evolution of framboidal pyrite and its implications for the oreforming process of Carlin-style gold deposits, southwestern China. Ore Geol. Rev. 2018, 102, 426–436. [Google Scholar] [CrossRef]
- Chang, J.Y.; Li, Y.Y.; Lu, H.L. The morphological characteristics of authigenic pyrite formed in marine sediments. J. Mar. Sci. Eng. 2022, 10, 1533. [Google Scholar] [CrossRef]


| Samples ID | Depth /m | SiO2 | Al2O3 | TFe2O3 | MgO | CaO | Na2O | K2O | MnO | TiO2 | P2O5 |
|---|---|---|---|---|---|---|---|---|---|---|---|
| Sam.01 | 675.3 | 61.95 | 8.08 | 9.72 | 2.26 | 3.70 | 0.46 | 2.69 | 0.02 | 0.39 | 0.052 |
| Sam.02 | 677.1 | 68.53 | 11.35 | 3.43 | 2.01 | 1.30 | 0.68 | 3.96 | 0.01 | 0.59 | 0.066 |
| Sam.03 | 681.2 | 74.41 | 7.91 | 3.44 | 2.32 | 1.40 | 0.57 | 2.56 | 0.01 | 0.38 | 0.051 |
| Sam.04 | 686 | 76.14 | 8.55 | 3.03 | 1.48 | 0.56 | 0.39 | 2.95 | <0.01 | 0.42 | 0.068 |
| Sam.05 | 689 | 66.97 | 11.28 | 4.66 | 1.55 | 2.41 | 0.60 | 3.86 | 0.02 | 0.54 | 0.094 |
| Sam.06 | 692.8 | 71.89 | 9.58 | 3.97 | 1.41 | 0.81 | 0.39 | 3.33 | <0.01 | 0.47 | 0.062 |
| Sam.07 | 695.9 | 67.60 | 7.72 | 2.93 | 2.47 | 4.68 | 0.07 | 2.63 | 0.01 | 0.40 | 0.07 |
| Sam.08 | 698.9 | 73.76 | 8.62 | 3.73 | 1.21 | 0.16 | 0.05 | 2.89 | <0.01 | 0.44 | 0.056 |
| Sam.09 | 701.2 | 63.12 | 13.69 | 5.54 | 2.52 | 0.36 | 0.07 | 4.33 | 0.01 | 0.71 | 0.10 |
| Sam.10 | 709.8 | 5.41 | 0.47 | 0.73 | 3.02 | 48.34 | 0.13 | 0.07 | 0.03 | 0.03 | 0.036 |
| Sam.11 | 712.3 | 73.09 | 10.71 | 3.69 | 1.41 | 0.16 | 0.62 | 3.06 | <0.01 | 0.47 | 0.074 |
| Sam.12 | 715.6 | 6.32 | 0.79 | 1.15 | 2.61 | 47.57 | 0.16 | 0.09 | 0.04 | 0.04 | 0.044 |
| Sam.13 | 718.5 | 5.62 | 0.72 | 0.81 | 2.49 | 48.52 | <0.05 | 0.10 | 0.03 | 0.04 | 0.035 |
| Sam.14 | 722.8 | 78.31 | 6.62 | 2.30 | 1.09 | 2.09 | 0.14 | 1.97 | <0.01 | 0.31 | 0.06 |
| Sam.15 | 726.6 | 66.4 | 5.78 | 6.09 | 4.72 | 4.58 | 0.06 | 0.95 | 0.03 | 0.22 | 0.082 |
| Sam.16 | 729.6 | 70.62 | 11.5 | 3.72 | 1.59 | 0.72 | 0.06 | 3.52 | <0.01 | 0.37 | 0.063 |
| Sam.17 | 732.9 | 54.49 | 9.74 | 5.98 | 9.18 | 5.35 | 0.06 | 1.47 | 0.06 | 0.39 | 0.071 |
| Sam.18 | 737 | 72.04 | 9.79 | 3.16 | 1.24 | 0.89 | 0.11 | 2.89 | 0.02 | 0.35 | 0.093 |
| Sam.19 | 740.5 | 72.22 | 9.44 | 4 | 1 | 0.27 | 0.18 | 2.73 | <0.01 | 0.36 | 0.074 |
| Sam.20 | 743.4 | 73.37 | 9.87 | 2.96 | 1.17 | 0.43 | 0.11 | 2.97 | <0.01 | 0.38 | 0.069 |
| Sam.21 | 745.4 | 71.32 | 9.29 | 4.42 | 1.06 | 1.62 | 0.36 | 2.9 | 0.02 | 0.38 | 0.073 |
| Sam.22 | 750.6 | 69.3 | 11.15 | 4.13 | 1.37 | 1.45 | 0.13 | 3.32 | 0.02 | 0.46 | 0.082 |
| Sam.23 | 754.1 | 59.14 | 10.72 | 5.7 | 1.28 | 6.75 | 0.38 | 3.02 | 0.05 | 0.39 | 0.081 |
| Sam.24 | 757.2 | 73.91 | 10.43 | 2.79 | 1.14 | 0.41 | 0.16 | 3.04 | <0.01 | 0.39 | 0.057 |
| Sam.25 | 760 | 74.79 | 10.4 | 2.84 | 1.26 | 0.8 | 0.08 | 3.12 | 0.02 | 0.35 | 0.079 |
| Sam.26 | 763.6 | 71.44 | 11.41 | 3.11 | 1.29 | 0.36 | 0.2 | 3.25 | 0.01 | 0.33 | 0.086 |
| Sam.27 | 767.6 | 67.11 | 10.54 | 5.26 | 1.32 | 1.34 | 0.18 | 3.14 | 0.02 | 0.38 | 0.105 |
| Sam.28 | 772 | 65.66 | 11.35 | 5.32 | 2.38 | 2.62 | 0.11 | 3.29 | 0.04 | 0.37 | 0.101 |
| Sam.29 | 775.6 | 74.79 | 8.22 | 3.01 | 1.21 | 0.59 | 0.06 | 2.44 | 0.01 | 0.34 | 0.102 |
| Sam.30 | 778.6 | 78.73 | 7.04 | 2.01 | 0.89 | 0.83 | 0.07 | 2.04 | 0.02 | 0.29 | 0.094 |
| Sam.31 | 782.4 | 78.2 | 5.85 | 2.6 | 1.25 | 0.45 | <0.05 | 1.62 | <0.01 | 0.29 | 0.061 |
| Sam.32 | 786.4 | 64.42 | 10.71 | 4.53 | 1.99 | 0.88 | 0.05 | 2.85 | 0.02 | 0.54 | 0.148 |
| Sam.33 | 789.3 | 72.4 | 4.67 | 2.13 | 1.44 | 4.26 | <0.05 | 1.06 | 0.03 | 0.22 | 0.158 |
| Sam.34 | 793.4 | 73.4 | 5.82 | 3.71 | 1.33 | 0.8 | <0.05 | 1.55 | 0.01 | 0.29 | 0.108 |
| Sam.35 | 797.6 | 78.1 | 5.08 | 2.66 | 0.77 | 0.72 | <0.05 | 1.41 | <0.01 | 0.2 | 0.147 |
| Sam.36 | 800 | 59.9 | 8.01 | 4.89 | 1.26 | 0.29 | <0.05 | 2.17 | <0.01 | 0.35 | 0.153 |
| Sam.37 | 804 | 58.86 | 5.84 | 4.53 | 2.64 | 0.73 | 0.08 | 1.7 | 0.01 | 0.34 | 0.466 |
| Sam.38 | 807.8 | 64.98 | 6.59 | 4.86 | 0.63 | 0.71 | 0.23 | 2.11 | <0.01 | 0.35 | 0.297 |
| Sam.39 | 810.5 | 62.29 | 7.03 | 4.22 | 1.63 | 1.44 | 0.34 | 2.13 | 0.01 | 0.42 | 0.221 |
| Sam.40 | 813.3 | 77.56 | 2.94 | 1.15 | 1.16 | 2.18 | 0.18 | 0.74 | 0.01 | 0.14 | 0.076 |
| Sam.41 | 819.35 | 69.74 | 5.06 | 1.75 | 1.87 | 0.98 | 0.1 | 1.26 | 0.01 | 0.27 | 0.15 |
| Sam.42 | 822.6 | 83.66 | 2.38 | 1.04 | 0.35 | 0.34 | 0.1 | 0.65 | <0.01 | 0.11 | 0.166 |
| Sam.43 | 826.5 | 71.41 | 6.98 | 2.25 | 0.94 | 1.02 | 0.21 | 2.07 | 0.01 | 0.38 | 0.316 |
| Sam.44 | 829.7 | 79.77 | 2.69 | 1.18 | 0.83 | 1.84 | 0.06 | 0.72 | 0.01 | 0.14 | 0.138 |
| Sam.45 | 836.8 | 62.84 | 7.11 | 4.79 | 1.05 | 1.01 | 0.07 | 2.12 | <0.01 | 0.37 | 0.563 |
| Sam.46 | 840.6 | 76.59 | 1.59 | 0.91 | 0.78 | 2.15 | <0.05 | 0.29 | 0.01 | 0.07 | 0.344 |
| Sam.47 | 843.4 | 65.94 | 7.29 | 3.61 | 0.74 | 0.74 | 0.07 | 2.04 | <0.01 | 0.39 | 0.30 |
| Sam.48 | 847.5 | 35.34 | 4.99 | 3.36 | 16.93 | 16.36 | <0.05 | 0.76 | 0.08 | 0.21 | 0.10 |
| Sam.49 | 852 | 94.12 | 0.8 | 0.44 | 0.08 | 0.85 | <0.05 | 0.05 | <0.01 | 0.01 | 0.25 |
| Sam.50 | 854.3 | 84.89 | 0.89 | 0.9 | 0.5 | 4.38 | <0.05 | 0.16 | <0.01 | 0.06 | 0.082 |
| Sam.51 | 859 | 74.56 | 4.3 | 2.25 | 1.23 | 1.13 | <0.05 | 1.42 | <0.01 | 0.19 | 0.174 |
| Sam.52 | 862.5 | 25.24 | 0.9 | 0.18 | 2.65 | 30.03 | <0.05 | 0.17 | 0.04 | 0.02 | 0.445 |
| Sam.53 | 865.5 | 79.01 | 4.77 | 2.82 | 2.67 | 3.1 | 0.16 | 1.46 | 0.03 | 0.27 | 0.035 |
| Sam.54 | 870.8 | 76.08 | 9.32 | 3.82 | 2.06 | 0.38 | <0.05 | 2.96 | <0.01 | 0.54 | 0.022 |
| Sam.55 | 882.3 | 98.82 | 0.37 | 0.3 | 0.08 | 0.1 | <0.05 | 0.13 | <0.01 | 0.02 | 0.012 |
| Samples ID | Depth /m | TOC | Mo | Ba | Cu | Ni | Co | V | Cr | U | Th |
|---|---|---|---|---|---|---|---|---|---|---|---|
| Sam.01 | 675.3 | 6.57 | 35.8 | 1033 | 117 | 80 | 17.1 | 110 | 74.8 | 10.4 | 9.27 |
| Sam.02 | 677.1 | 4.85 | 49.5 | 1257 | 64.1 | 79.7 | 16.3 | 182 | 84.9 | 9.1 | 13.5 |
| Sam.03 | 681.2 | 4.33 | 29.4 | 1031 | 49.3 | 48 | 14.3 | 86.8 | 67.8 | 11.5 | 9.89 |
| Sam.04 | 686 | 4.42 | 30.5 | 1166 | 52.8 | 49.2 | 13.9 | 92.6 | 76.5 | 14.2 | 10.6 |
| Sam.05 | 689 | 4.39 | 36.4 | 1394 | 73.4 | 53 | 20.4 | 100 | 77.3 | 11.7 | 12.4 |
| Sam.06 | 692.8 | 6.1 | 87.8 | 1307 | 98 | 81.3 | 16.5 | 178 | 72.4 | 19.7 | 11.2 |
| Sam.07 | 695.9 | 4.52 | 45.5 | 979 | 73.9 | 75 | 10.9 | 157 | 82.6 | 10.5 | 8.69 |
| Sam.08 | 698.9 | 5.68 | 80.2 | 919 | 116 | 73.8 | 18 | 121 | 77.2 | 19.4 | 10.8 |
| Sam.09 | 701.2 | 6.58 | 57.9 | 1081 | 96.4 | 54.2 | 22.4 | 129 | 95.1 | 19.5 | 14.9 |
| Sam.10 | 709.8 | 0.48 | 0.44 | 175 | 2.6 | 9.08 | 1.3 | 5.71 | 8.05 | 0.58 | 0.56 |
| Sam.11 | 712.3 | 4.28 | 48.8 | 1266 | 106 | 79.1 | 15.8 | 133 | 74.1 | 14 | 11.2 |
| Sam.12 | 715.6 | 0.84 | 2.27 | 175 | 8.97 | 9.02 | 1.95 | 12.5 | 10.4 | 1.3 | 0.82 |
| Sam.13 | 718.5 | 0.69 | 0.65 | 213 | 3.55 | 8.5 | 1.66 | 11.1 | 7.84 | 1.15 | 0.65 |
| Sam.14 | 722.8 | 3.54 | 32.3 | 843 | 113 | 74.4 | 9.97 | 186 | 86.9 | 9.49 | 7.34 |
| Sam.15 | 726.6 | 5.41 | 5.1 | 390 | 72.4 | 26.2 | 8.24 | 61.9 | 86.2 | 9.79 | 5.43 |
| Sam.16 | 729.6 | 4.06 | 33.9 | 1407 | 72.8 | 90.6 | 16.2 | 221 | 71 | 9.38 | 12 |
| Sam.17 | 732.9 | 4.64 | 19.8 | 662 | 66.7 | 40.8 | 17.2 | 78.5 | 78.4 | 7.64 | 10.7 |
| Sam.18 | 737 | 5.43 | 40 | 1333 | 71.6 | 53.5 | 14.3 | 95.6 | 75.4 | 10.2 | 10.8 |
| Sam.19 | 740.5 | 6.01 | 28.4 | 1449 | 55.2 | 68.3 | 13.4 | 104 | 67.8 | 7.21 | 9.91 |
| Sam.20 | 743.4 | 5.19 | 33 | 1547 | 70.8 | 43.4 | 13.6 | 82.8 | 66.7 | 7.76 | 10.1 |
| Sam.21 | 745.4 | 5.79 | 30.6 | 1413 | 64.3 | 43.1 | 14.2 | 82.3 | 67.8 | 7.82 | 9.53 |
| Sam.22 | 750.6 | 5.33 | 50.9 | 1633 | 81.4 | 58.3 | 17.5 | 119 | 75.6 | 11.9 | 11.3 |
| Sam.23 | 754.1 | 6.22 | 49.8 | 1436 | 69.4 | 82.1 | 14.9 | 154 | 70.9 | 8.88 | 9.91 |
| Sam.24 | 757.2 | 4.44 | 33.8 | 1737 | 56.4 | 95.3 | 13.5 | 391 | 71.5 | 9.01 | 9.92 |
| Sam.25 | 760 | 4.18 | 26.4 | 1690 | 50.5 | 78.7 | 13.8 | 226 | 73.6 | 6.85 | 10.5 |
| Sam.26 | 763.6 | 4.59 | 62.7 | 1987 | 65.9 | 123 | 15.3 | 571 | 87.9 | 11.9 | 10.3 |
| Sam.27 | 767.6 | 7.48 | 63.5 | 1830 | 69.9 | 99.3 | 13.8 | 512 | 89.1 | 13.6 | 11.1 |
| Sam.28 | 772 | 5.14 | 36.6 | 1685 | 84.7 | 122 | 17.5 | 344 | 98.4 | 11.3 | 9.53 |
| Sam.29 | 775.6 | 6.78 | 69.1 | 1633 | 52 | 92.2 | 12.9 | 185 | 75 | 31.5 | 8.88 |
| Sam.30 | 778.6 | 5.9 | 29.6 | 2121 | 35.9 | 58.4 | 9.64 | 150 | 62.2 | 15.9 | 6.56 |
| Sam.31 | 782.4 | 6.1 | 49.7 | 1508 | 60 | 82.4 | 10.3 | 149 | 70.5 | 22.6 | 6.9 |
| Sam.32 | 786.4 | 10.1 | 110 | 2524 | 108 | 88.5 | 19.1 | 253 | 88.4 | 54.9 | 12.5 |
| Sam.33 | 789.3 | 8.63 | 88.4 | 1149 | 55.3 | 42.9 | 8.5 | 135 | 77.1 | 32.3 | 5.36 |
| Sam.34 | 793.4 | 9.74 | 45.6 | 2278 | 88.5 | 65.5 | 17.2 | 161 | 59.7 | 35.9 | 7.05 |
| Sam.35 | 797.6 | 8.4 | 107 | 2511 | 496 | 278 | 10.1 | 2479 | 617 | 18.3 | 4.96 |
| Sam.36 | 800 | 18.24 | 270 | 3474 | 155 | 617 | 17.6 | 4500 | 480 | 59 | 7.5 |
| Sam.37 | 804 | 19.89 | 437 | 11,801 | 74.2 | 493 | 17.6 | 1272 | 78.2 | 214 | 5.26 |
| Sam.38 | 807.8 | 14.63 | 249 | 14,222 | 174 | 147 | 12.4 | 1635 | 127 | 79 | 4.81 |
| Sam.39 | 810.5 | 12.61 | 185 | 17,789 | 56.2 | 181 | 11.8 | 1148 | 84.6 | 79.6 | 4.72 |
| Sam.40 | 813.3 | 9.13 | 34.1 | 9041 | 30.3 | 66.3 | 3.71 | 130 | 102 | 87.5 | 2.22 |
| Sam.41 | 819.35 | 9.92 | 91.9 | 15,631 | 1386 | 155 | 6.59 | 2538 | 172 | 38.6 | 2.92 |
| Sam.42 | 822.6 | 10 | 32.6 | 7731 | 15.3 | 67.2 | 4.16 | 425 | 101 | 49.7 | 1.75 |
| Sam.43 | 826.5 | 8.27 | 151 | 17,055 | 111 | 173 | 12.1 | 1841 | 193 | 56.4 | 4.68 |
| Sam.44 | 829.7 | 9.25 | 98.9 | 9030 | 34.1 | 151 | 4.7 | 605 | 139 | 82.6 | 2.04 |
| Sam.45 | 836.8 | 13.09 | 172 | 16,876 | 467 | 516 | 14.2 | 7585 | 517 | 40.9 | 5.01 |
| Sam.46 | 840.6 | 12.92 | 22.8 | 8938 | 172 | 71.8 | 3.62 | 3483 | 182 | 19.3 | 1.11 |
| Sam.47 | 843.4 | 12.42 | 154 | 40,781 | 125 | 227 | 13.3 | 3349 | 189 | 43.6 | 3.96 |
| Sam.48 | 847.5 | 2.1 | 10.8 | 27,475 | 35.4 | 29.5 | 9.73 | 652 | 141 | 3.52 | 2.24 |
| Sam.49 | 852 | 13.12 | 6.43 | 9941 | 268 | 29.2 | 0.92 | 1215 | 265 | 29.6 | 0.4 |
| Sam.50 | 854.3 | 4.76 | 182 | 6632 | 169 | 51 | 3.23 | 1234 | 445 | 118 | 1.33 |
| Sam.51 | 859 | 10.88 | 144 | 3584 | 93.4 | 94.9 | 14.6 | 6880 | 871 | 42.5 | 3.43 |
| Sam.52 | 862.5 | 4.54 | 33.9 | 56,893 | 97.4 | 49.4 | 4.74 | 539 | 133 | 9.15 | 0.26 |
| Sam.53 | 865.5 | 2.01 | 4.65 | 4331 | 16.1 | 15.1 | 3.4 | 58.4 | 175 | 1.97 | 5.5 |
| Sam.54 | 870.8 | 4.05 | 0.98 | 2198 | 27 | 45.9 | 5.31 | 134 | 108 | 5.14 | 6.9 |
| Sam.55 | 882.3 | 0.13 | 0.7 | 265 | 2.83 | 4.89 | 0.48 | 12.3 | 157 | 0.55 | 0.45 |
Disclaimer/Publisher’s Note: The statements, opinions and data contained in all publications are solely those of the individual author(s) and contributor(s) and not of MDPI and/or the editor(s). MDPI and/or the editor(s) disclaim responsibility for any injury to people or property resulting from any ideas, methods, instructions or products referred to in the content. |
© 2023 by the authors. Licensee MDPI, Basel, Switzerland. This article is an open access article distributed under the terms and conditions of the Creative Commons Attribution (CC BY) license (https://creativecommons.org/licenses/by/4.0/).
Share and Cite
Zhou, L.; Feng, X.; Zhang, L.; Wu, L. Organic Matter Enrichment Mechanisms in the Lower Cambrian Shale: A Case Study from Xiangandi #1 Well. Minerals 2024, 14, 183. https://doi.org/10.3390/min14020183
Zhou L, Feng X, Zhang L, Wu L. Organic Matter Enrichment Mechanisms in the Lower Cambrian Shale: A Case Study from Xiangandi #1 Well. Minerals. 2024; 14(2):183. https://doi.org/10.3390/min14020183
Chicago/Turabian StyleZhou, Lei, Xingqiang Feng, Linyan Zhang, and Lin Wu. 2024. "Organic Matter Enrichment Mechanisms in the Lower Cambrian Shale: A Case Study from Xiangandi #1 Well" Minerals 14, no. 2: 183. https://doi.org/10.3390/min14020183