Article

CoDA-Based Geo-Electrochemical Prospecting Prediction of Uranium Orebodies in Changjiang Area, Guangdong Province, China

1
Geomathematics Key Laboratory of Sichuan Province, Chengdu University of Technology, Chengdu 610059, China
2
SinoProbe Laboratory, Institute of Mineral Resources, Chinese Academy of Geological Sciences, Beijing 100037, China
3
Research Institute of Prediction of Hidden Deposits, Guilin University of Technology, Guilin 541006, China
*
Author to whom correspondence should be addressed.
Minerals 2024, 14(1), 15; https://doi.org/10.3390/min14010015
Submission received: 13 September 2023 / Revised: 13 December 2023 / Accepted: 19 December 2023 / Published: 21 December 2023
(This article belongs to the Special Issue Digital Geosciences and Mineral Exploration)

Abstract

:
In order to achieve a breakthrough in the exploration of uranium orebodies in the Changjiang area of Guangdong province in China, the geo-electrochemical exploration method is used for mineral resource prediction. The logarithmically and isometric log-ratio (ilr) transformations are applied to the geo-electrochemical data in this study area to extract geochemical anomalies. The relationship between element associations and mineralization is revealed through descriptive statistical analysis and further biplot analysis. Then, the energy spectrum density–area fractal model (S-A model) is used to identify geochemical backgrounds and anomalies. The results show that: (i) the logarithmically and ilr-transformed data are more uniform, and they more or less obey the rules of normal distribution; (ii) the biplot shows that the ilr-transformed data eliminates the closure effect, and the robust principal component analysis (RPCA) has a better indicative significance for element associations—PC1 reveals the mineralization element association dominated by U and the multiple periods of hydrothermal activity; (iii) the S-A method could extract the local anomalies from different geochemical backgrounds, which indicates mineralization is more reliable. Finally, four favorable prospecting targets are delineated based on the geological and geochemical indicators.

1. Introduction

Uranium mineral resources, which are important strategic resources and energy minerals, have always been crucial in ensuring the strategic development of various countries. China’s breakthroughs in uranium exploration are currently under close scrutiny. The confirmed mineral resources are facing depletion, necessitating urgent exploration in deeper or peripheral areas for mineral resources. Geo-electrochemical methods are forms of exploration techniques that use deep penetration, and they exhibit characteristics such as greater detection depth and the ability to identify weak anomalies compared to traditional soil geochemical methods [1,2,3]. Using this method allows for a more significant emphasis on potential anomalies present in deeper regions.
The geo-electrochemical technique was introduced to China from the former Soviet Union by Chinese scientists Fei Xiquan, Xu Bangliang, and Deng Kangle in the 1980s. Since then, it has stimulated significant research work in China [1,2]. Luo [3,4,5,6,7,8] used the geo-electrochemical method to analyze over 30 different types of mineral deposits with overburden layers of varying thicknesses. The team repeatedly adjusted the technical parameters of the method and conducted comparative studies to summarize technical parameters suitable for different buried mineral resources, including independent power supply and fast positioning. This research has achieved good results in the exploration of precious metals, non-ferrous metals, and radioactive metal deposits in China, involving more than ten types of ores, such as gold, lead, zinc, tungsten, arsenic, silver, copper, antimony, and uranium. This method has also been widely used in the United States, Canada, the United Kingdom, Australia, India, and Southeast Asia, and is one of the most important methods for searching and exploring buried mineral resources in the world [9,10,11,12,13,14,15].
However, despite the numerous successful applications of the geo-electrochemical extraction method for prospecting hidden metallic ores, there remains significant room for further development. For instance, Liu [7] highlighted that, although there have been nearly 200 articles on the geo-electrochemical extraction method indexed in CNKI, only a mere 3% pertain to articles focusing on data processing. With the advancement of geochemical exploration, data processing methodologies have rapidly evolved from univariate to multivariate analyses and from linear to nonlinear analyses. The traditional approach of averaging values with standard deviations no longer holds a competitive edge and fails to capture the essence of the underlying data. As a deep penetration method, geo-electrochemical extraction warrants a comprehensive data analysis to unearth more insightful information, thus serving the prospecting of mineral resources more effectively.
As a type of compositional data, geo-electrochemical data is subject to the “closure effect”, where the increase or decrease in the content of one element in a sample of the results changes the content of other elements, which may lead to a reverse change in the correlation between elements (positive correlation to negative correlation) when processing geo-electrochemical data. To address this problem, Aitchison [16] proposed the logarithmic ratio transformation method after studying compositional data. This method represents Aitchison’s space data in a logarithmic ratio coordinate system and transforms it into Euclidean space in order to overcome the closure effect of compositional data, making it possible to analyze the data using multivariate statistical methods [17]. This method has been proven effective in numerous research examples [18,19,20,21,22,23,24,25,26,27,28,29]. Scholars generally believe that data transformed by this method can better reflect the true distribution patterns of data in space, accurately identifying the background and anomalous information of elements.
The geo-electrochemical methods have the capability to identify deep-seated anomaly information. However, due to various factors, such as geological activities and natural influences, and including the superimposition effect of multi-phase geological movements and the differential mobility of elements along fault migration, the geochemical patterns of elements remain ambiguous [3,7]. As a result, identifying weak anomalies becomes challenging because they are often masked by high background values [30,31,32], leading to the misclassification of actual anomalies as background data. This misclassification can then affect the accurate delineation of the target areas. To address these issues, Cheng [33,34] has developed fractal and multi-fractal analysis methods to process geochemical data in order to differentiate geochemical elements as “anomaly” and “background”. These methods can quickly and effectively extract information regarding mineral exploration, pollution, or other abnormal sources, while also facilitating a better understanding of the elements’ geochemical distribution patterns.
Therefore, this study aims to analyze the compositional data of geo-electrochemical data in the study area through feasibility experiments in order to explore more potential meanings of the data through comparison with the raw data features. At the same time, in consideration of the multiple episodes of hydrothermal activity and the prolonged period of geological evolution in the study area, the overlapping of various geological processes has led to a complex and heterogeneous distribution of geochemical elements. In order to address this issue, this study intends to employ the S-A model to separate anomalies from the background, with the aim of better highlighting weak anomalies and determining the location of the target area.

2. Geological Background

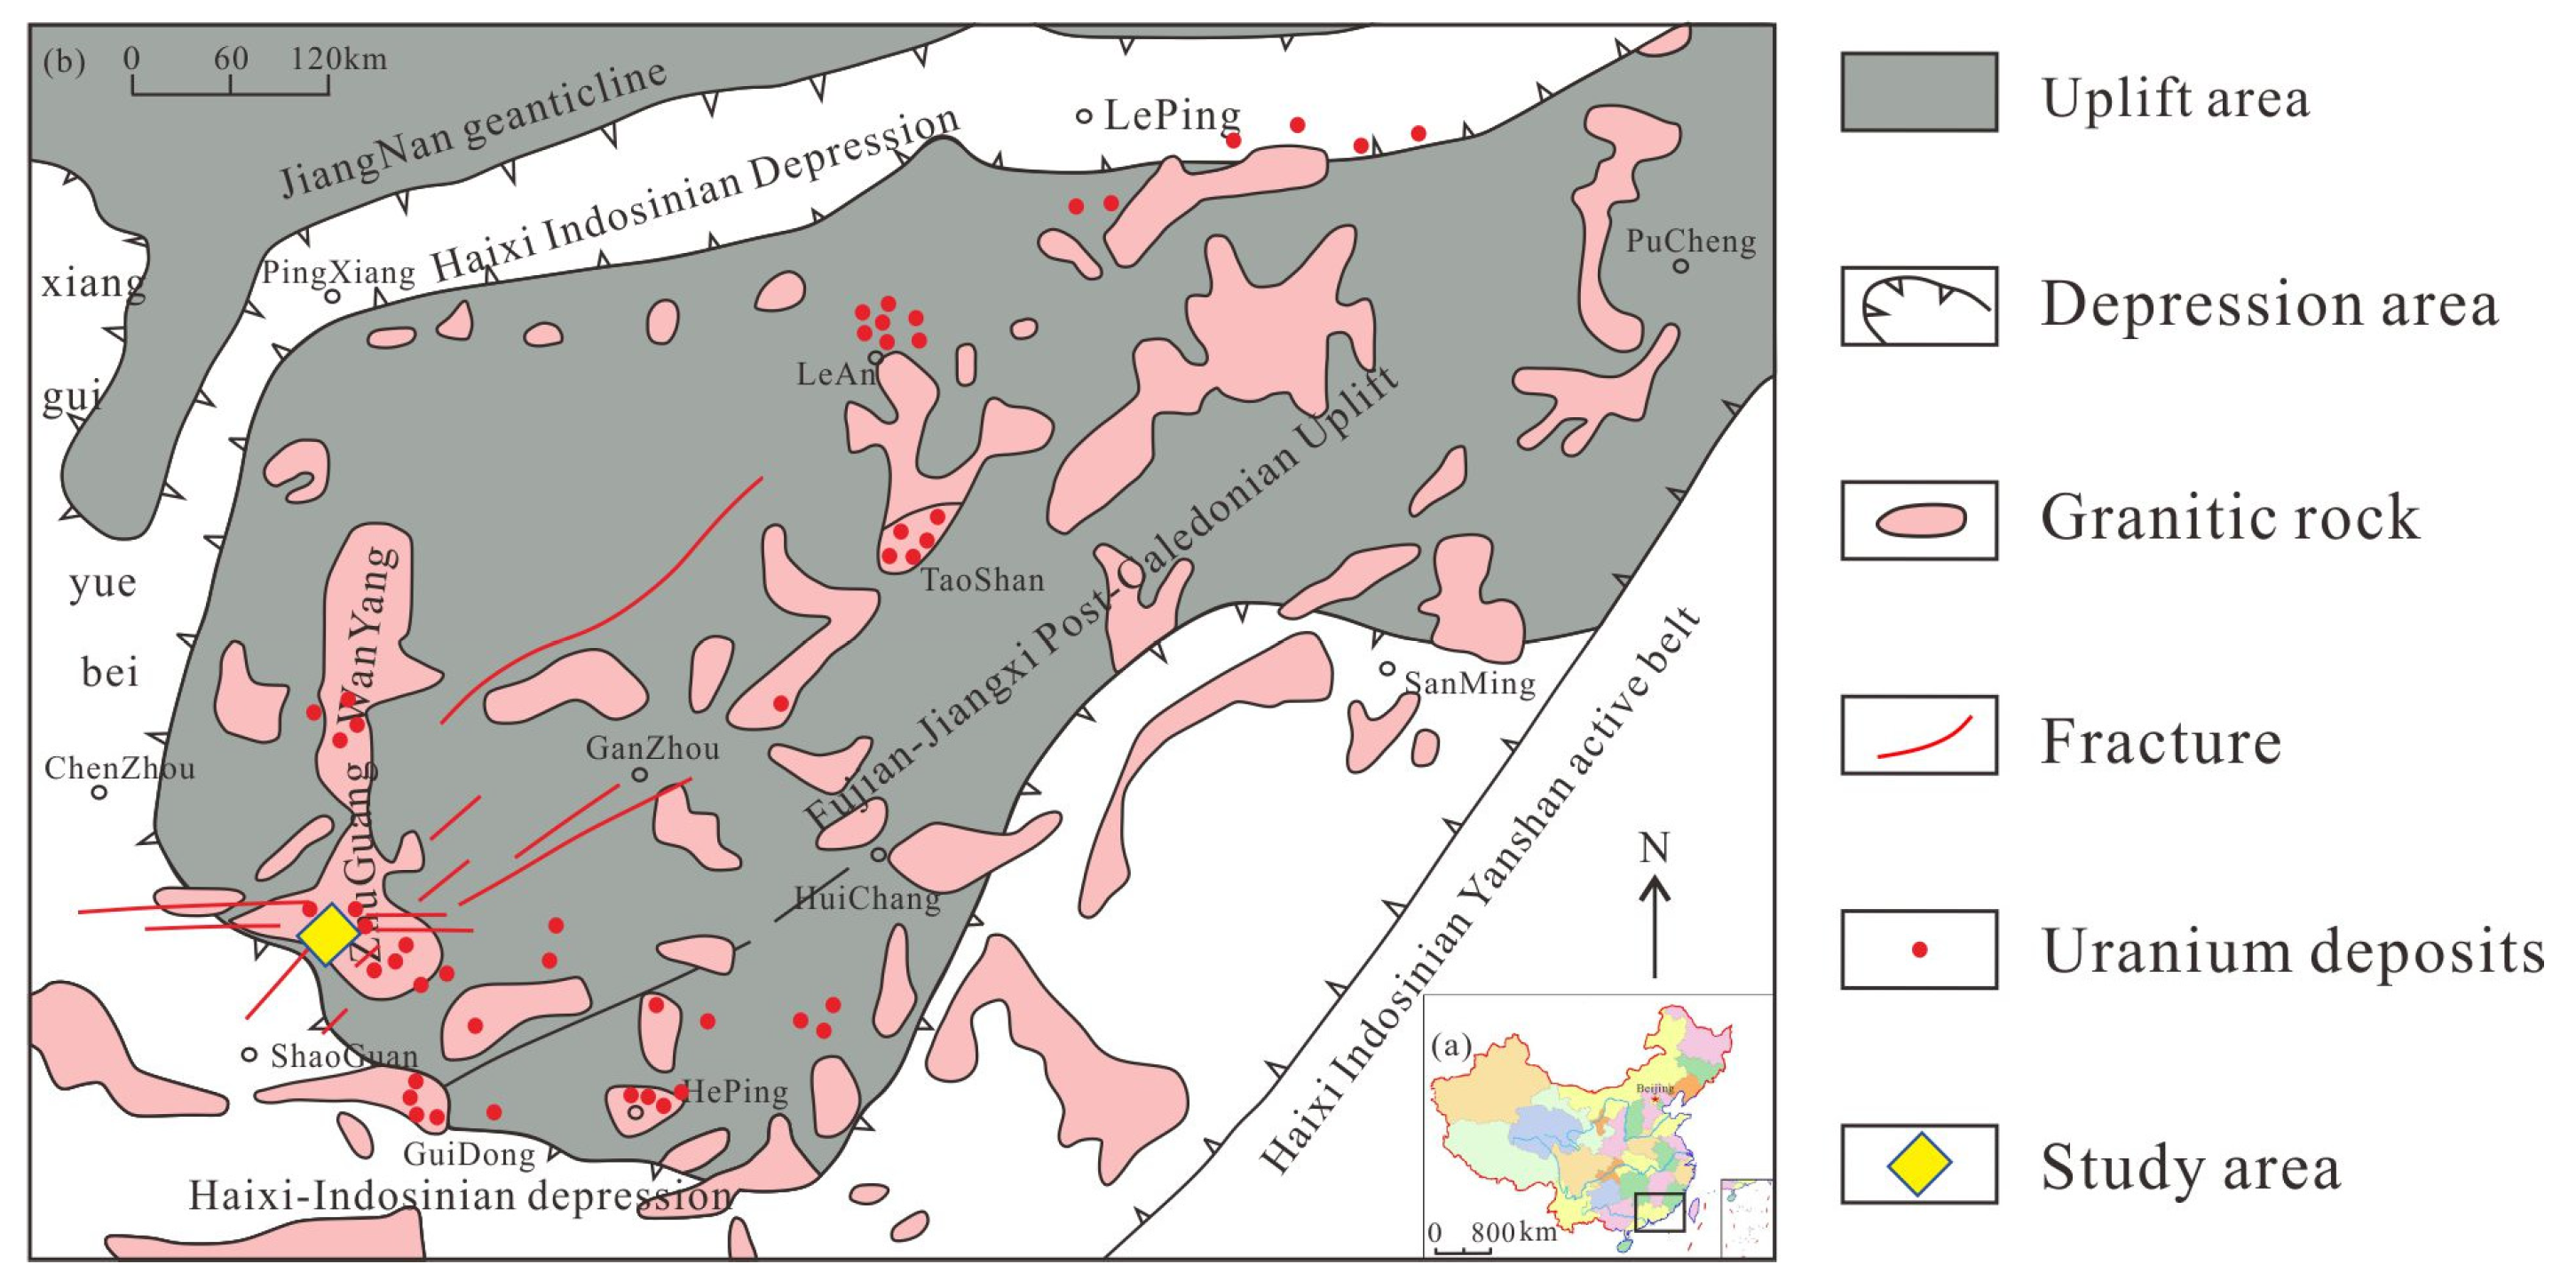
2.1. Regional Geological Conditions

The Changjiang uranium ore field is situated south of the Zhuguang–Wanyang granitic rock (Figure 1). It occupies a geotectonic position at the junction of the post-Caledonian uplift in Fujian and Jiangxi provinces and the Hercynian–Indosinian depression in Hunan, Guangxi, and Guangdong provinces [35]. The area is also located at the intersection of three uplift belts: Wanchangshan, Dayu–Jiufeng, and Zhuguang–Wanyang. During the Mesozoic era, the area experienced significant magmatic activity, leading to the formation of various intrusive rock bodies. The prominent ones include the intrusive rocks of the Zhuguangshan complex granite and the Guidong complex granite.
The study area is primarily composed of granite, supplemented by well-developed strata, with the exception of the Silurian. The Zhuguangshan intrusive complex is a multi-phase and multi-stage intrusive body. Magmatism during the Indosinian period constitutes the primary component of this complex, exhibiting a north–south distribution at the surface. The magmatite includes fine-grained, spotted biotite granite from the Indosinian period, medium-grained, black biotite granite from the Yanshanian period, and some later intermediate basaltic dykes which are also exposed in the region [36].
The overall magmatic activity in the area was relatively frequent, mainly dominated by acidic magmatic activity, with accompanying intermediate-basic magmatic activity [37]. The rocks were initially formed in the Caledonian and were influenced by large-scale tectonic magmatic intrusion activity during the Indosinian–Yanshan periods, resulting in widespread occurrences of muscovite–biotite granite, black mica granite, and black mica monzogranite. During the Yanshan period, there were also intrusions of diabase dikes. In addition, there were also alkali metasomatic rocks formed by late-stage alkali fluid activities [36]. The uranium deposits and occurrences in the area are influenced by multiple periods and stages of magmatic intrusion and tectonic activity, often exhibiting obvious multi-period characteristics.

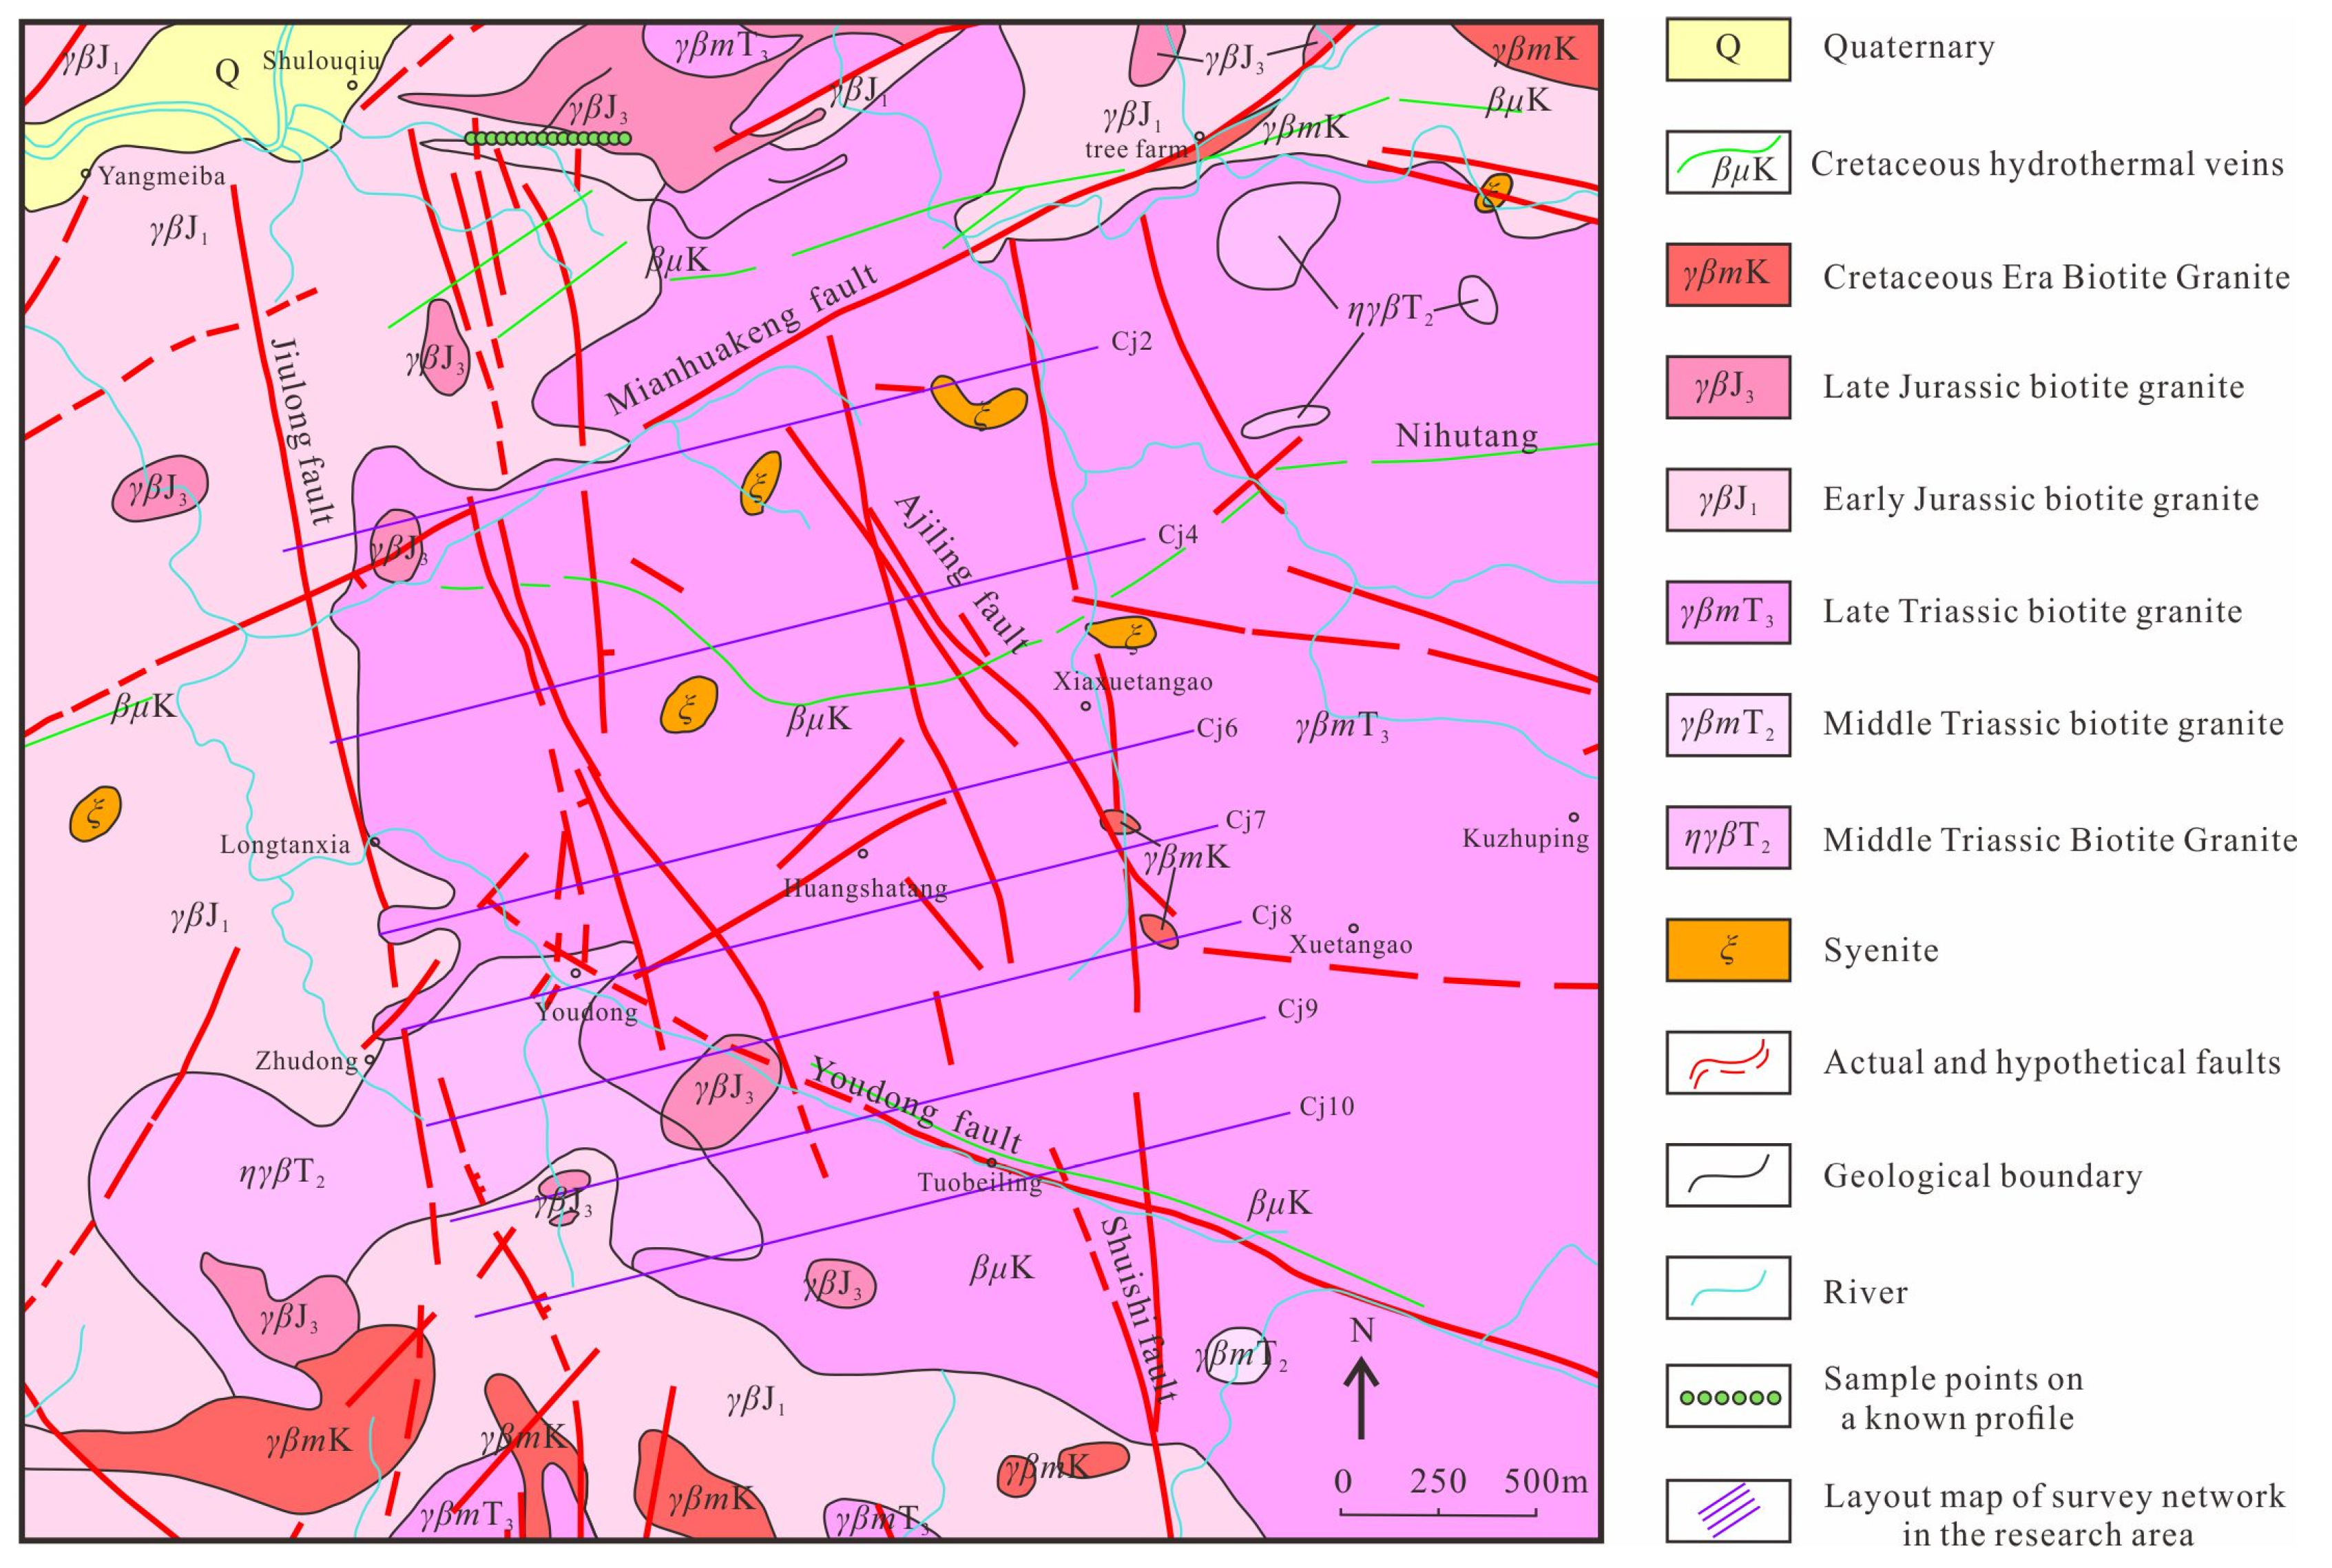
2.2. Geological Features of Study Area

The study area is situated in the southern region of the Zhu-Guang area, specifically within the Changjiang Uranium ore field. In terms of tectonic position, it is located at the intersection of the Fujian-Jiangxi fold belt, which formed after the Caledonian orogeny, and the Hercynian–Indosinian depression area in Hunan, Guangxi, and Guangdong provinces.
The geological history of the study area is characterized by significant tectonic and magmatic intrusions during the Indochina and Yanshan periods. Granite rocks, formed during these two periods, play a prominent role in the geological composition of the region. The overall magmatic activity within the area exhibits relatively frequent occurrences, predominantly characterized by acidic magmatic activity, concomitant with episodes of intermediate-basic magmatic events. The formation of the rock masses initially occurred during the Caledonian period, influenced by extensive tectonic–magmatic intrusion activities during the Indochina–Yanshan periods. This resulted in the widespread occurrence of diorite granite, biotite granite, and biotite–diorite granite, with intrusive occurrences of Yanshan period diabase veins. Additionally, there were later formations of alkali-altered rocks due to late-stage alkali metasomatism [36]. The study area is situated at the intersection of the early Yanshan Changjiang rock mass and the Indochina Youdong granite body. The major rock types in the study area include Late Triassic two-mica granite and Middle Triassic two-mica granite. Additionally, there are several minor intrusion rocks and veins present. During the Yanshan period, intrusive diabase veins were also formed in the area (Figure 2).
The region has well-developed faults, including the NNE-trending Mianhuakeng Fault, the NW-trending Youdong Fault, the NNW-trending Ajiling Fault, the near NS-trending Jiulongyan Fault, and the Shuishi Fault. In addition, there are various secondary faults in different directions. Among them, the NNE-trending Mianhuakeng Fault and the NW-trending Youdong Fault are two larger-scale faults in the region. The former is the main ore-controlling structure in the area, located on the northwest side of the survey area, and is often associated with mylonites, lamprophyres, and siliceous veins, commonly accompanied by silicification, sericitization, and chloritization; the latter is in the southern part of the study area, mainly composed of lamprophyre and silicified cataclastic rock. The junctions and compounds of the two faults have important control significance for uranium mineralization in the southern Zhuguang granitic rock area.
The Shulouqiu uranium deposit is a typical granite-type uranium deposit, which is located in the northern part of the Changjiang area and belongs to the southern part of the Zhuguangshan complex rock mass. This deposit has magmatic and tectonic environments similar to the Shulouqiu uranium deposit. The ore type of the Shulouqiu deposit is relatively uniform, primarily composed of porphyritic microcrystalline quartz (or varicolored microcrystalline quartz) and fluorite–uraninite–pyrite-type ores. Uraninite stands as the primary ore mineral in the Shulouqiu deposit, often presenting spherical or annular characteristics [35,36]. The surrounding rock alterations have experienced multiple episodes of hydrothermal activity. Alterations associated with mineralization manifest as illitization, potassic alteration, sodic plagioclase alteration, hematization, chloritization, and carbonatization, among others. Among alterations related to mineralization, the most prominent include fluoritization, silicification, hematization, and clay mineralization.

3. Method and Technology

3.1. Geo-Electrochemical Technology and Test Analysis

3.1.1. The Geo-Electrochemical Method

The geo-electrochemical method, also known as the “Partial Metal Extraction Method” [3], originated in the former Soviet Union. It was initially proposed by Ryss in the 1960s and corresponding field equipment was developed for its application in mineral exploration. In the book “Geo-electrochemical Exploration Method”, published in 1983 [38], Ryss comprehensively discusses the theory, method, and application of this method and refers to a series of related methods, such as the geo-electrochemical method, elemental occurrence form method, and diffusion extraction method, collectively as the geo-electrochemical method.
The geo-electrochemical method breaks the dynamic balance of ions in underground rocks under the influence of an artificial electric field, causing anions and cations associated with mineralization to migrate towards the extraction electrode and eventually adsorb onto specific geo-electrochemical devices (foams) (Figure 3). By quantitatively analyzing the element content in the foam, the distribution pattern and geo-electrochemical characteristics can be determined, and the location of buried ore bodies can be inferred based on a comprehensive analysis of geological conditions, thereby achieving the goal of prospecting for mineral deposits [3,4,13].

3.1.2. Measuring Line, Measuring Point Layout, and Device

According to the research objectives of the National Key Research and Development Program of China (2017YFC0602600), a total of seven northeast to southwest geo-electrochemical survey lines were completed in the Changjiang area, with a total area of 13.57 km2, using a sampling interval of 800 × 100 m (Cj2, 4, 6) and 400 × 100 m (Cj7, 8, 9, 10), and a total of 241 samples were collected (Figure 2).
The piece of equipment used in this study is an independent power supply dipole geo-electrochemical device developed and improved by the Buried Ore Deposit Prediction Research Institute of the Guilin University of Technology. The device consists of a constant voltage and current-controlled power supply, refined carbon rods, polyurethane foam, and filter paper bands. After being connected by wires, the device can be used in the field. The extraction electrode is composed of highly conductive, refined carbon rods and pre-treated foam to eliminate the testing error that may be caused by the background value of the foam. All foams were pre-treated for normalization [3,4] with a mixture of 20% HCl and 0.5% (NH2)2CS and a soaking time of 12 h. The geo-electrochemical technical parameters for this study are as follows: the power supply voltage was 9 V, the extraction pole spacing was 1 m, the extraction liquid was 10% diluted nitric acid (500 mL poured into each borehole), the power supply time was 24 h, and the depth of the extraction electrode buried in the soil horizon B was 30 cm.
Following the principle of “from known to unknown”, this study conducted a feasibility test of the method and technique by setting sampling points on the known profile of the No. 2 exploration line of the Shulouqiu uranium deposit and conducted a comparative analysis by plotting the element content extracted using the geo-electrochemical method.

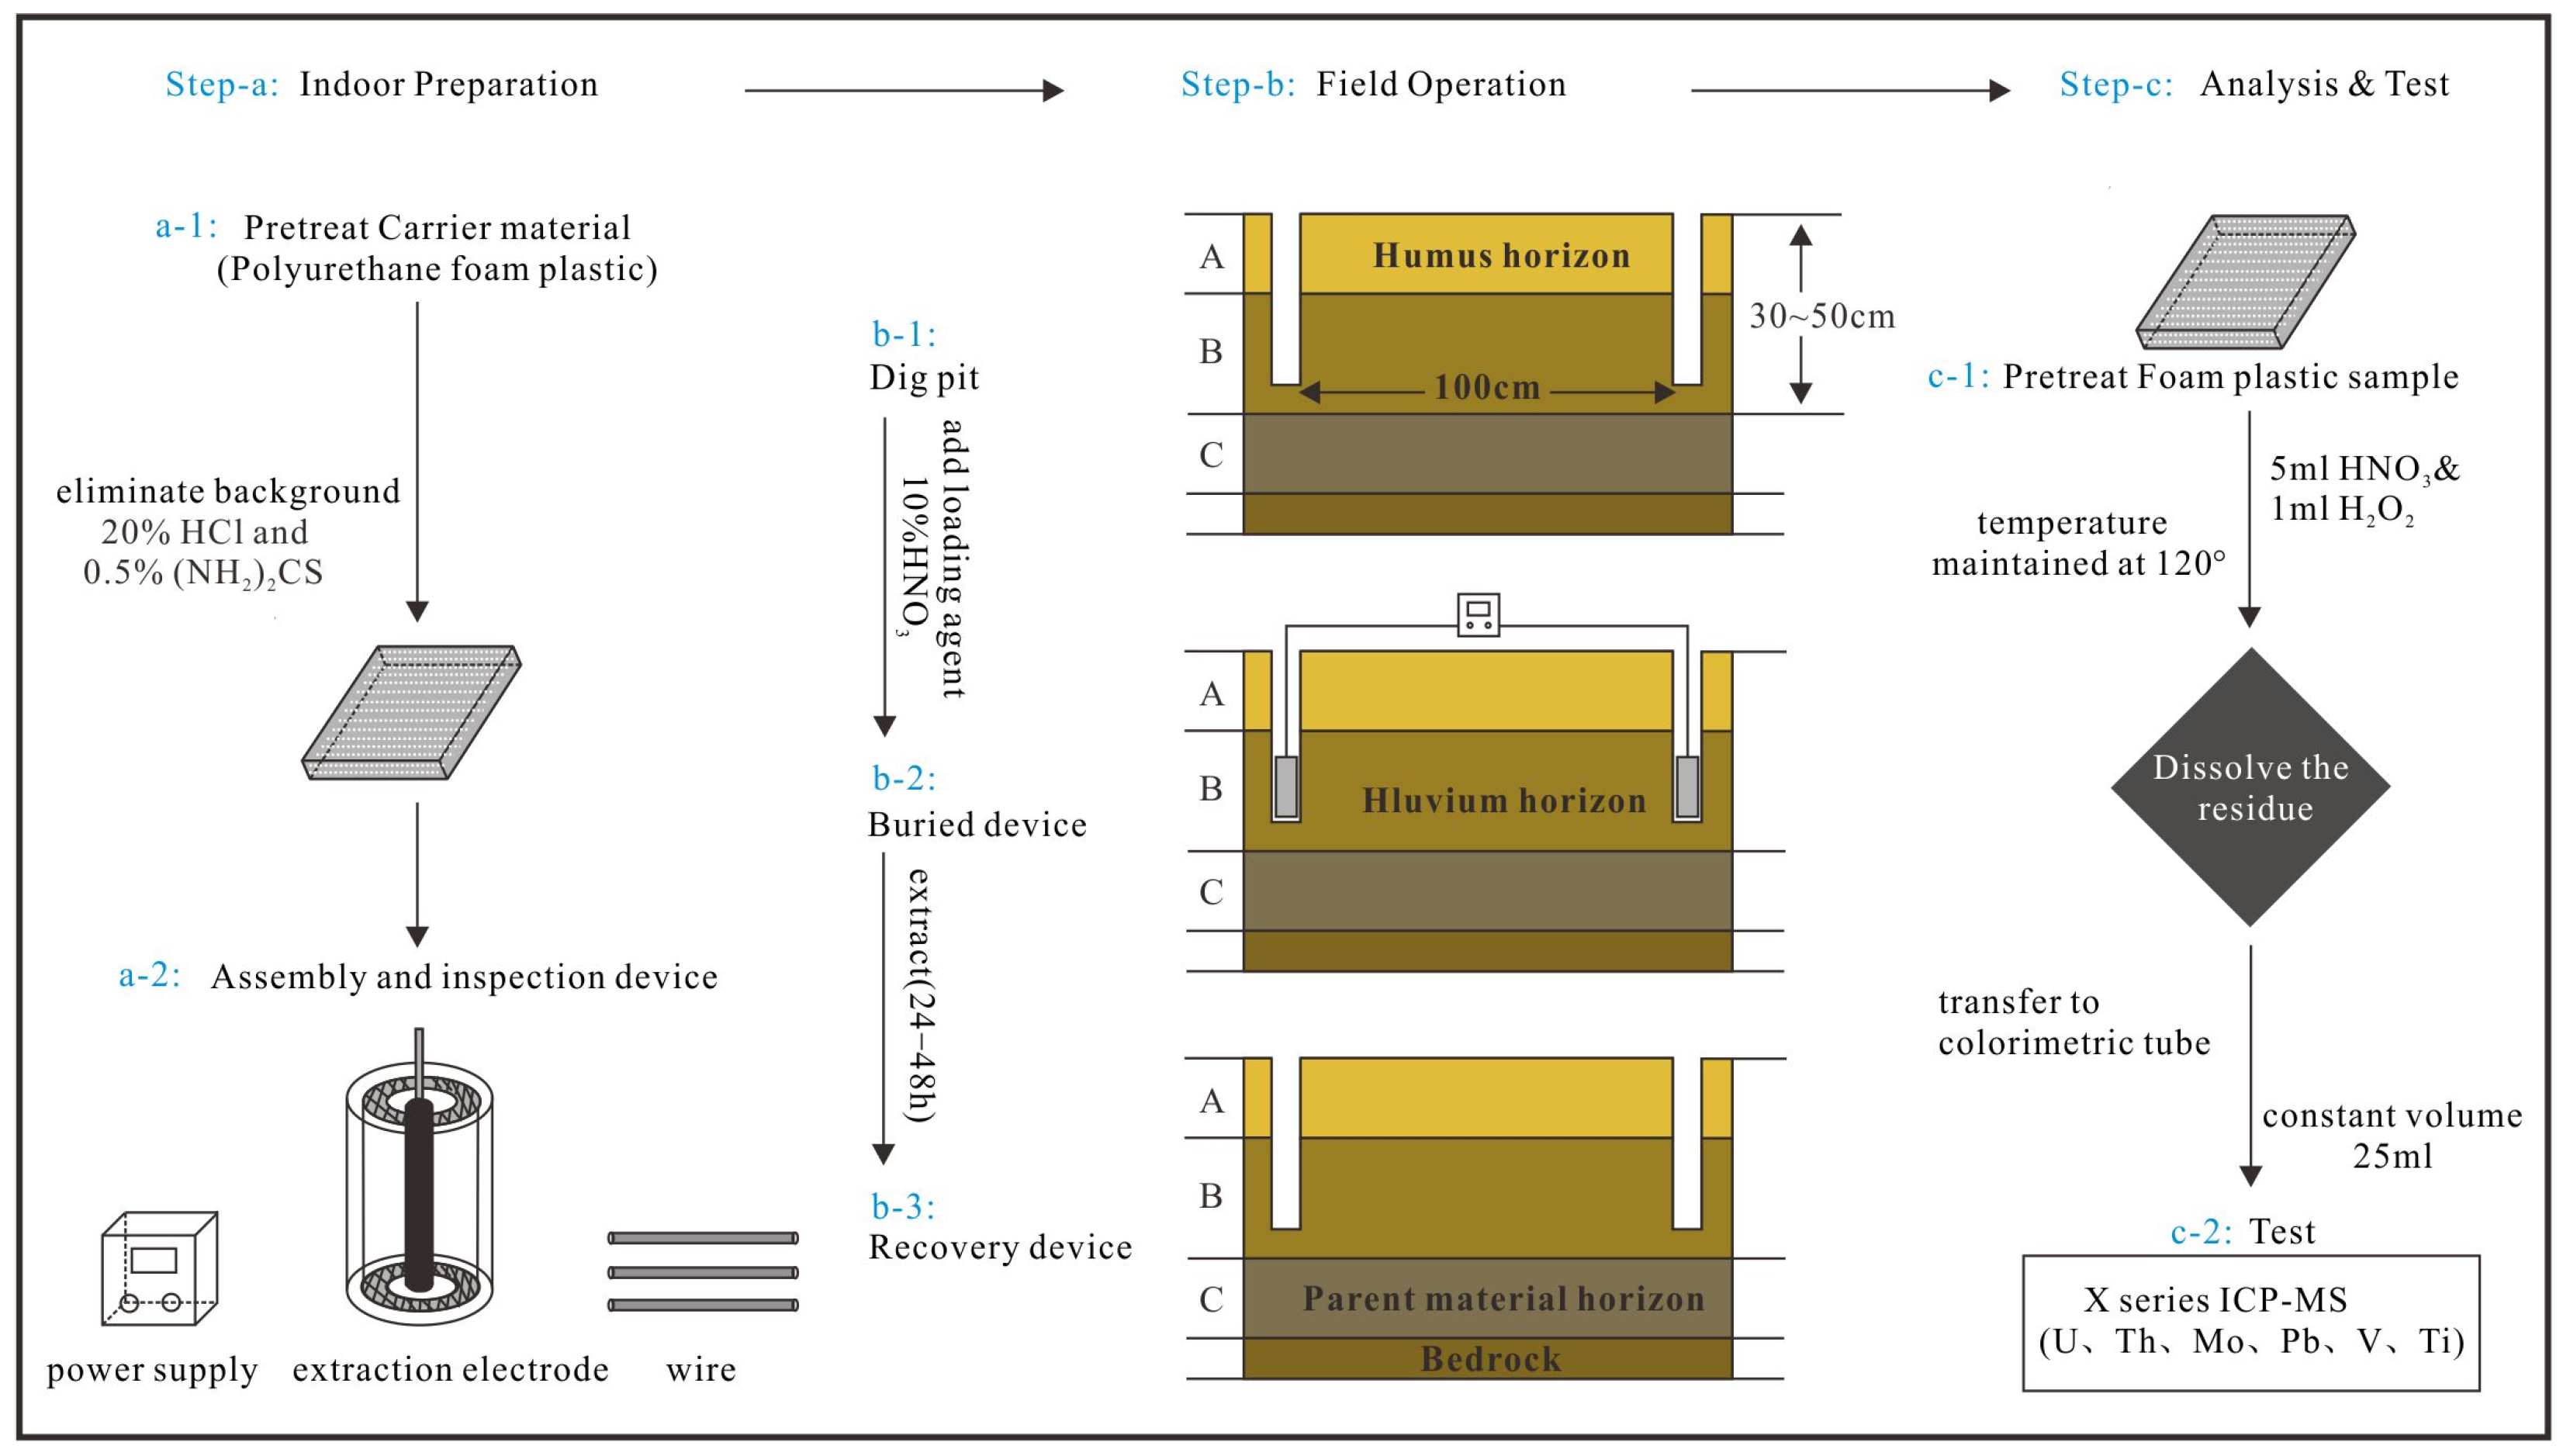
3.1.3. Fieldwork Process

The sampling work in this study is strictly in accordance with the technical specifications of geo-electrochemical extraction [3]. Two cylindrical pits with a spacing of 1 m and a depth of approximately 30 cm on either side of a vertical measurement line in the field were excavated. Subsequently, 500 mL of extraction liquid was measured twice using a measuring cup, and the extraction electrodes were immersed in the liquid to ensure full contact with moisture. The electrodes were then buried in the excavated pits, parallel with each other, and the pits were sequentially backfilled in the order of soil extraction. The external power supply was connected, and the device was left to supply power continuously for 24 h. After retrieving the device, the foam samples were moved to the laboratory, individually packaged at each sampling point, and then sent for testing and analysis.

3.1.4. Sample Analysis and Testing

A total of 241 samples were collected for geo-electrochemical extraction in this study, including 241 low-voltage dipole extraction anode and cathode samples. Sample analysis was completed by the Nonferrous Metals Guilin Mineral Geological Testing Center of the Guilin Mineral Geological Research Institute, using the ICP-MS (Inductively Coupled Plasma Mass Spectrometry) analysis method. Ten elements were analyzed, including Ti, V, Co, Ni, As, Mo, Sb, Pb, Th, and U. Previous studies have shown that acid treatment can effectively reduce the background value of solid adsorbents in geoelectric extraction [39], which is much lower than the adsorbed element content in the sample. Therefore, the background value does not cause significant interference in the analysis of the elements. The samples are pretreated by wet digestion for analysis. Specifically, 0.2500 g of foam sample collected in the field was weighed and placed in a polyethylene beaker, and an appropriate amount of HNO3-H2O2 was added. After being left overnight, it was heated on a 120 °C constant-temperature heating plate until it was dried, and then the residue was dissolved in aqua regia after cooling in the laboratory. The detailed testing procedures can be found in the related literature by Shi [39].

3.2. Geo-Electrochemical Technology and Test Analysis

Geochemical data, like other typical compositional data, exhibit a distinct characteristic known as the “closure effect” [40,41,42,43]. Generally, the sum of different element contents in geochemical samples is a constant value, and the closure effect results in pseudo-correlations among geochemical elements, making the analysis results uncertain. To eliminate the negative effects caused by this effect, appropriate methods are usually applied to transform the data involved in the experiment [44,45]. The transformed data are usually more interpretable in the application of classical statistical methods than the untransformed data [44,46,47].
Additive log-ratio transformation (alr), centered log-ratio transformation (clr), and isometric log-ratio transformation (ilr) are the three commonly used transformations for compositional data [16,17]. However, each of the three transformation methods has its advantages and disadvantages. After the raw data are transformed by the alr or ilr method, one variable is reduced. The clr-transformed data have the same number of variables as the raw data, but the sum of the variables is zero.
Considering the advantages and disadvantages of the three transformation methods mentioned above, Filzmoser [44] proposed using the ilr transformation to open the closure effect of the data and then expressing the loadings of the ilr transformation in the clr space using a standard orthogonal basis. This overcomes the closure effect of the geochemical data and ensures the consistency of the number of variables before and after the transformation, which is more conducive to geochemists making reasonable interpretations. In addition, Filzmoser [44] also proposed the Robust Principal Component Analysis (RPCA) method to deal with outliers in the data, which can effectively avoid biased covariance matrix estimates due to the existence of outliers when using Principal Component Analysis (PCA). The theoretical formulas for each transformation method are presented below.
(1)
Taking an original data matrix Xij (m × n, where m represents the number of samples and n denotes the number of types of elements) as an example, two distinct transformations will be presented. clr transformation:
c l r ( X ) = l n [ x 1 j g ( x 1 ) , x 2 j g ( x 2 ) ,   , x m j g ( x m ) ]
x is the elemental content at that point; j = 1,2,…,n; g(xi) is the geometric mean value of the “i”-th sample.
(2)
ilr transformation:
The ilr transformation is derived based on the clr transformation and the standard orthonormal basis vectors “vj” [44].
ν j = j j + 1 ( 1 j ,   , 1 j , 1,0 ,   , 0 )
i l r ( X j ) = j j + 1 ln k = 1 j x k j x j + 1
j = 1 , 2 , , n 1
Therefore, the clr transformation and the ilr transformation can be connected through the standard orthonormal basis.
c l r ( X ) = V × i l r ( X ) , i l r ( X ) = c l r ( X ) × V
V = [ v 1 , v 2 ,   , v n 1 ]

3.3. Multi-Fractal S-A Model

The spatial distribution of geochemical elements is affected by changes in geological history, making the geochemical field an unsteady field [33]. The complexity of the geochemical field is the result of the superposition of various geological processes over a long period of geological evolution. A large amount of geochemical data has shown that most geochemical anomalies exhibit fractal characteristics [48,49,50,51]. In recent years, geologists have proposed various methods using fractal techniques to extract information on geochemical anomalies. Among these methods, the three methods proposed by Cheng, namely the element content–area fractal model (C-A model), energy spectrum density–area fractal model (S-A model), and the local singularity analysis method [31,52,53,54,55,56,57,58], have been extensively employed and have produced substantial outcomes.
The S-A method can measure the general self-similarity of the anisotropy corresponding to the geochemical anomaly in the energy spectrum space, achieving the goal of separating anomalies [31,59]. Currently, the S-A method has become one of the standard methods for anomaly decomposition. Extracting anomaly information using the S-A method exhibits a diversity of forms and demonstrates self-similarity characteristics in the frequency domain. This self-similarity can be characterized by an exponential model.
A ( S ) S β
In Equation (5), S represents the spectrum energy density, A (≥S) represents the unit area greater than a certain threshold (S), β is the multi-dimensional fractal index of anisotropy, also known as the fractal dimension, which can be obtained on a log–log plot, and ∝ indicates proportionality. With the increase of the S value, the corresponding A will decrease, and the change rule mainly depends on the β fractal dimension.
To identify the background values and anomalies in the study area, this study employs ilr data transformation and compares the performance of elements on PCA and RPCA. This requires the selection of suitable principal components as the geochemical associations and using the S-A model to extract geochemical association anomalies and backgrounds in the study area. The software used in this study is the Arcfractal plugin within ArcGIS [60], developed by Zuo’s team at the GPMR State Key Laboratory of China University of Geosciences (Wuhan, China).

4. Results and Discussion

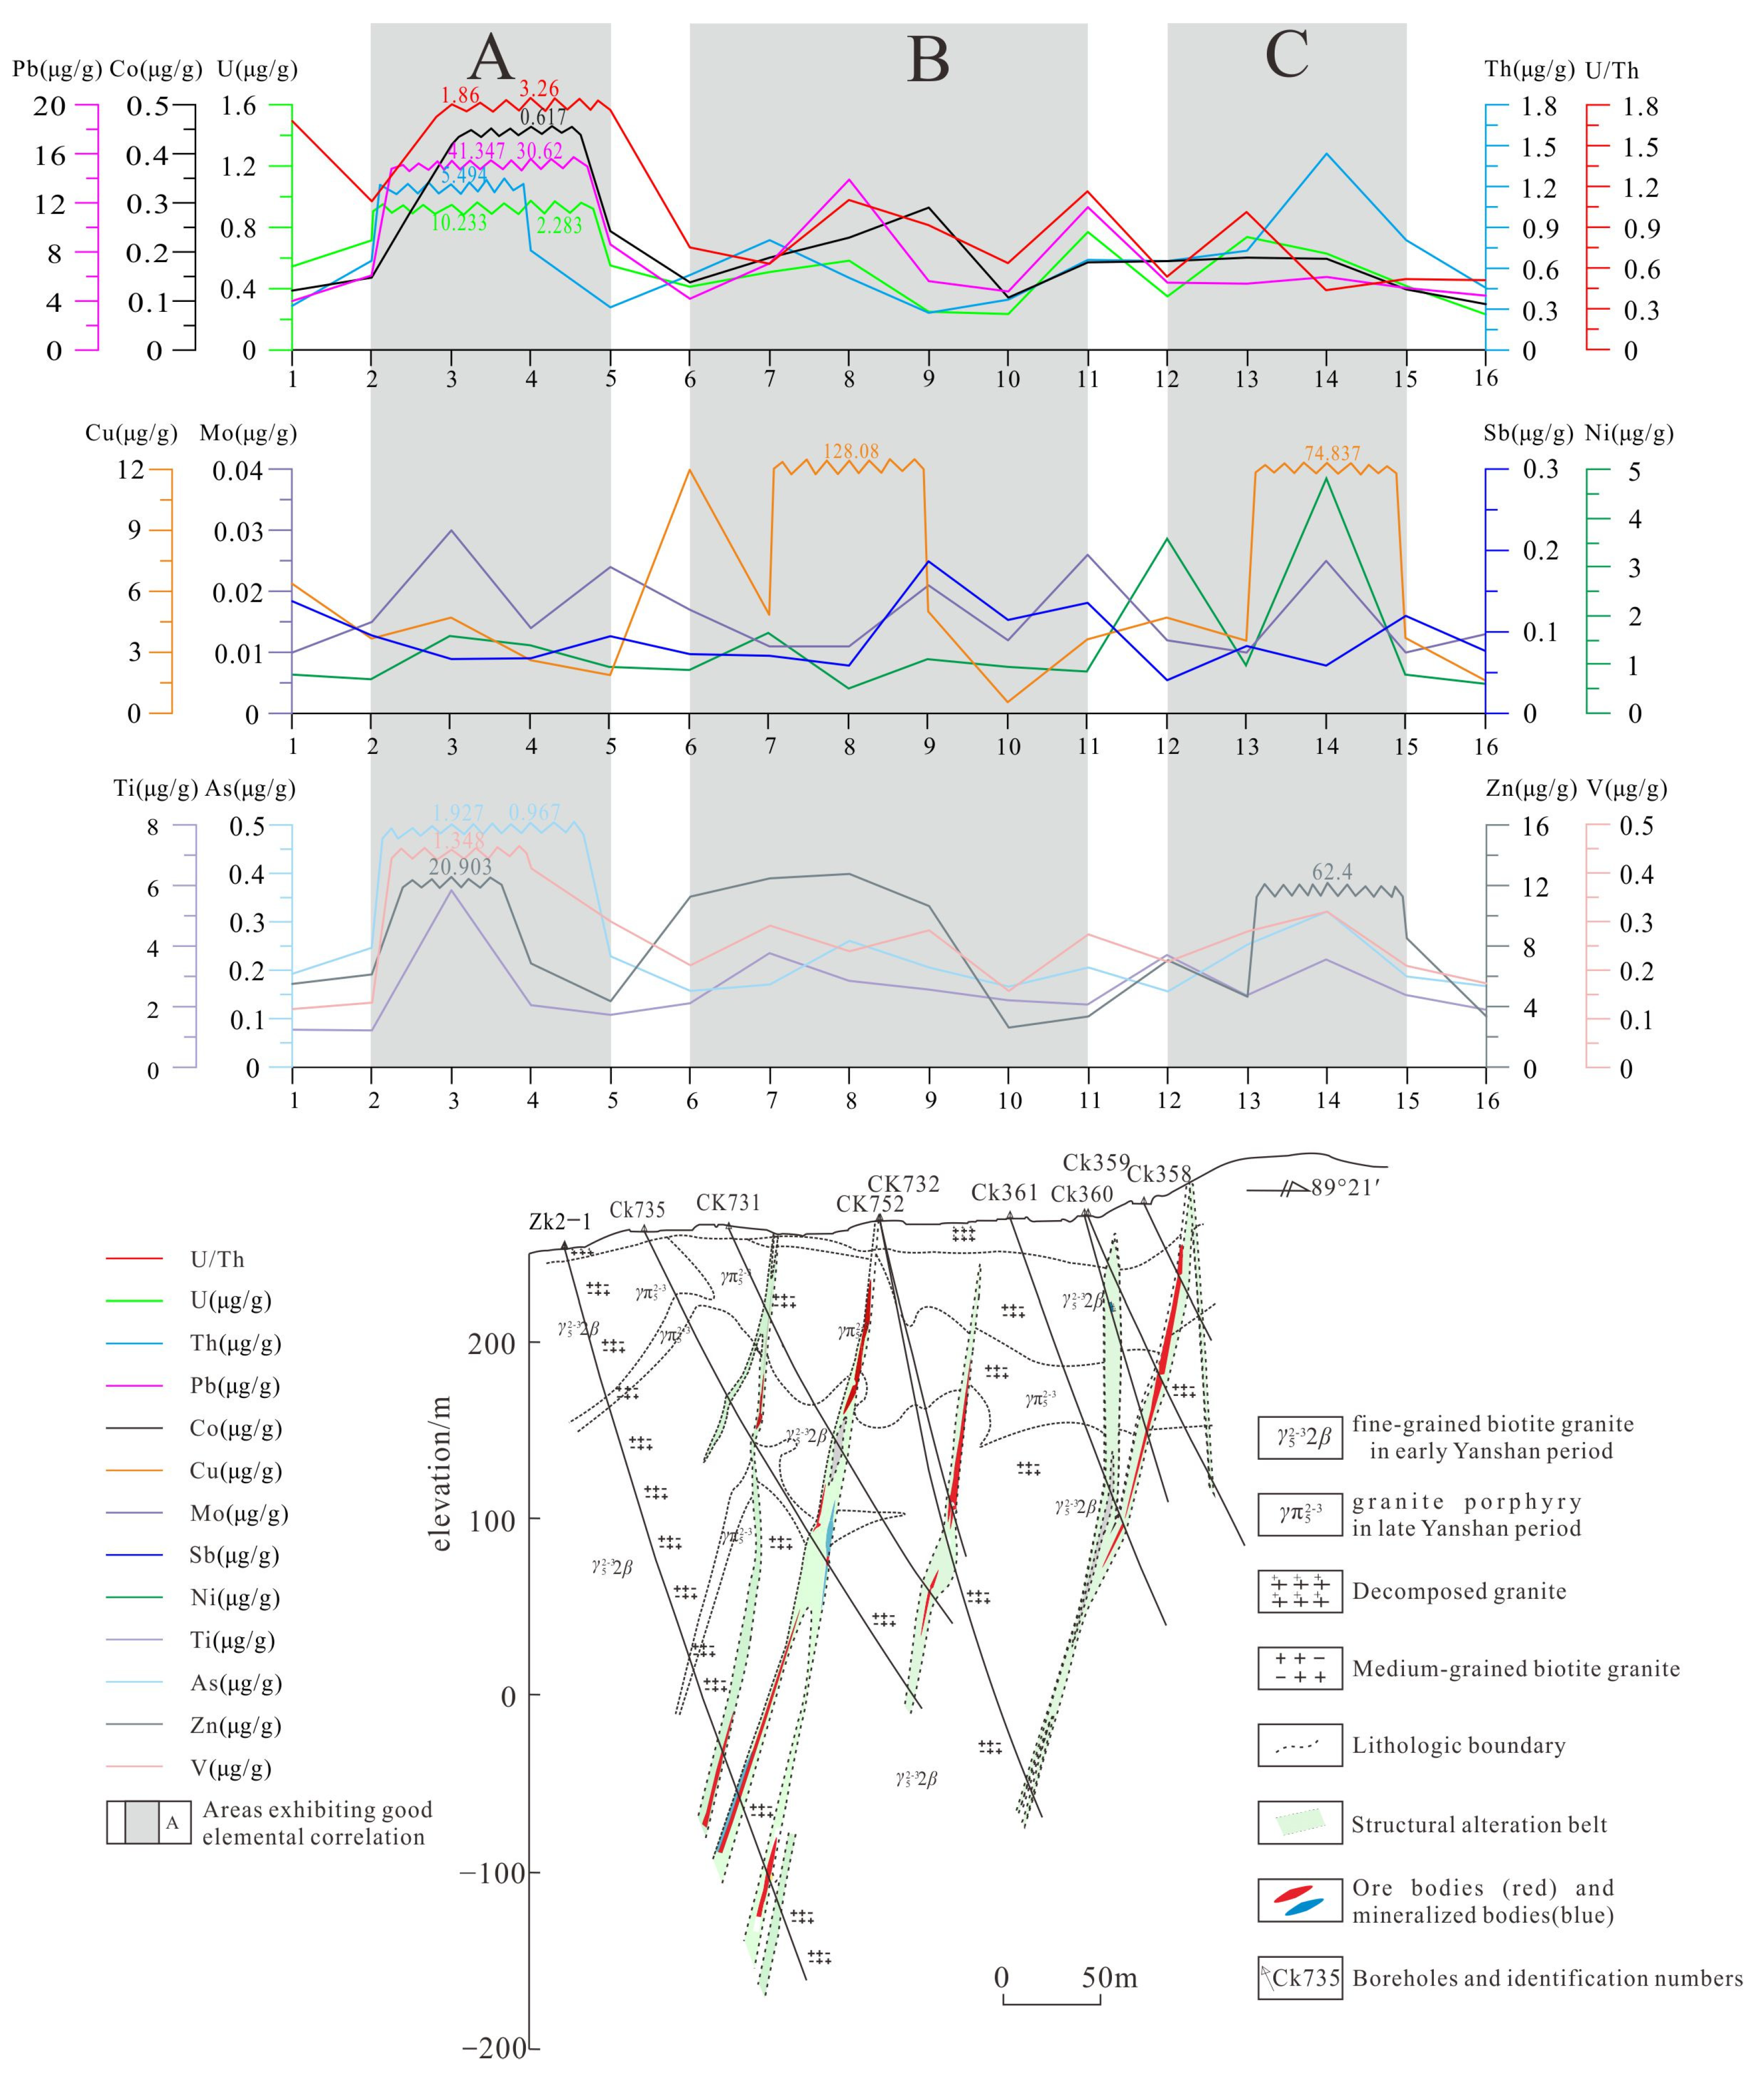
4.1. Feasibility Analysis

The Shulouqiu deposit is situated in the upper left area of the study region (Figure 2). The deposit’s host rocks consist of the Youdong and Changjiang rock mass. The Youdong rock mass is of the Indosinian granite variety, while the Changjiang rock body belongs to the Yanshan granite, mostly intruding the Youdong rock mass and primarily composed of medium-grained biotite granite. Ore-bearing faults within and surrounding the area are highly developed, mainly dominated by the NNW-trending ductile shear zones. The central section of the ore-bearing fault zone comprises silicified breccias, quartz veins, and other siliceous frameworks, while the sides exhibit successive hydrothermal alterations, including silicification, sericitization, and chloritization.
The experimental research carried out on the known profile can be found in Figure 4.
As can be seen from Figure 4, the anomalies of the main ore-forming elements U, Th, and Pb, which are highly correlated with U, extracted by geo-electrochemical are mostly reflected between the 6th and 12th measuring points (dashed line part in Figure 4) within the range of the verified drilling exploration work. The peak points are at the 8th and 11th measuring points. Meanwhile, multi-elements such as Co, Ni, V, and Ti also show different degrees of anomalies, which have a high degree of coincidence with the range of the concealed ore body, indicating good ore prospectivity. (Ore bodies and mineralized bodies are distinguished based on the minimum industrial grade and the minimum mining thickness. Anything meeting or exceeding the minimum industrial utilization criteria for each ore type is regarded as an ore body, while anything below is considered a mineralized body.)
According to previous studies, the geochemical indicator w(Th)/w(U) value can be used as a reference in the exploration of Granite uranium deposits [61]. Scholars [62] tend to believe that the w(Th)/w(U) value could reflect the degree of uranium activation. Granite with w(U)/w(Th) > 1/3 is in favor of uranium mineralization. Figure 4 shows that the anomaly range of the w(U)/w(Th) value corresponds well to the range of the known orebodies at depth, as well as element U. In summary, the geo-electrochemical method is feasible and effective for exploring granite-type uranium deposits and can be used in the exploration of concealed uranium orebodies in the Changjiang area.

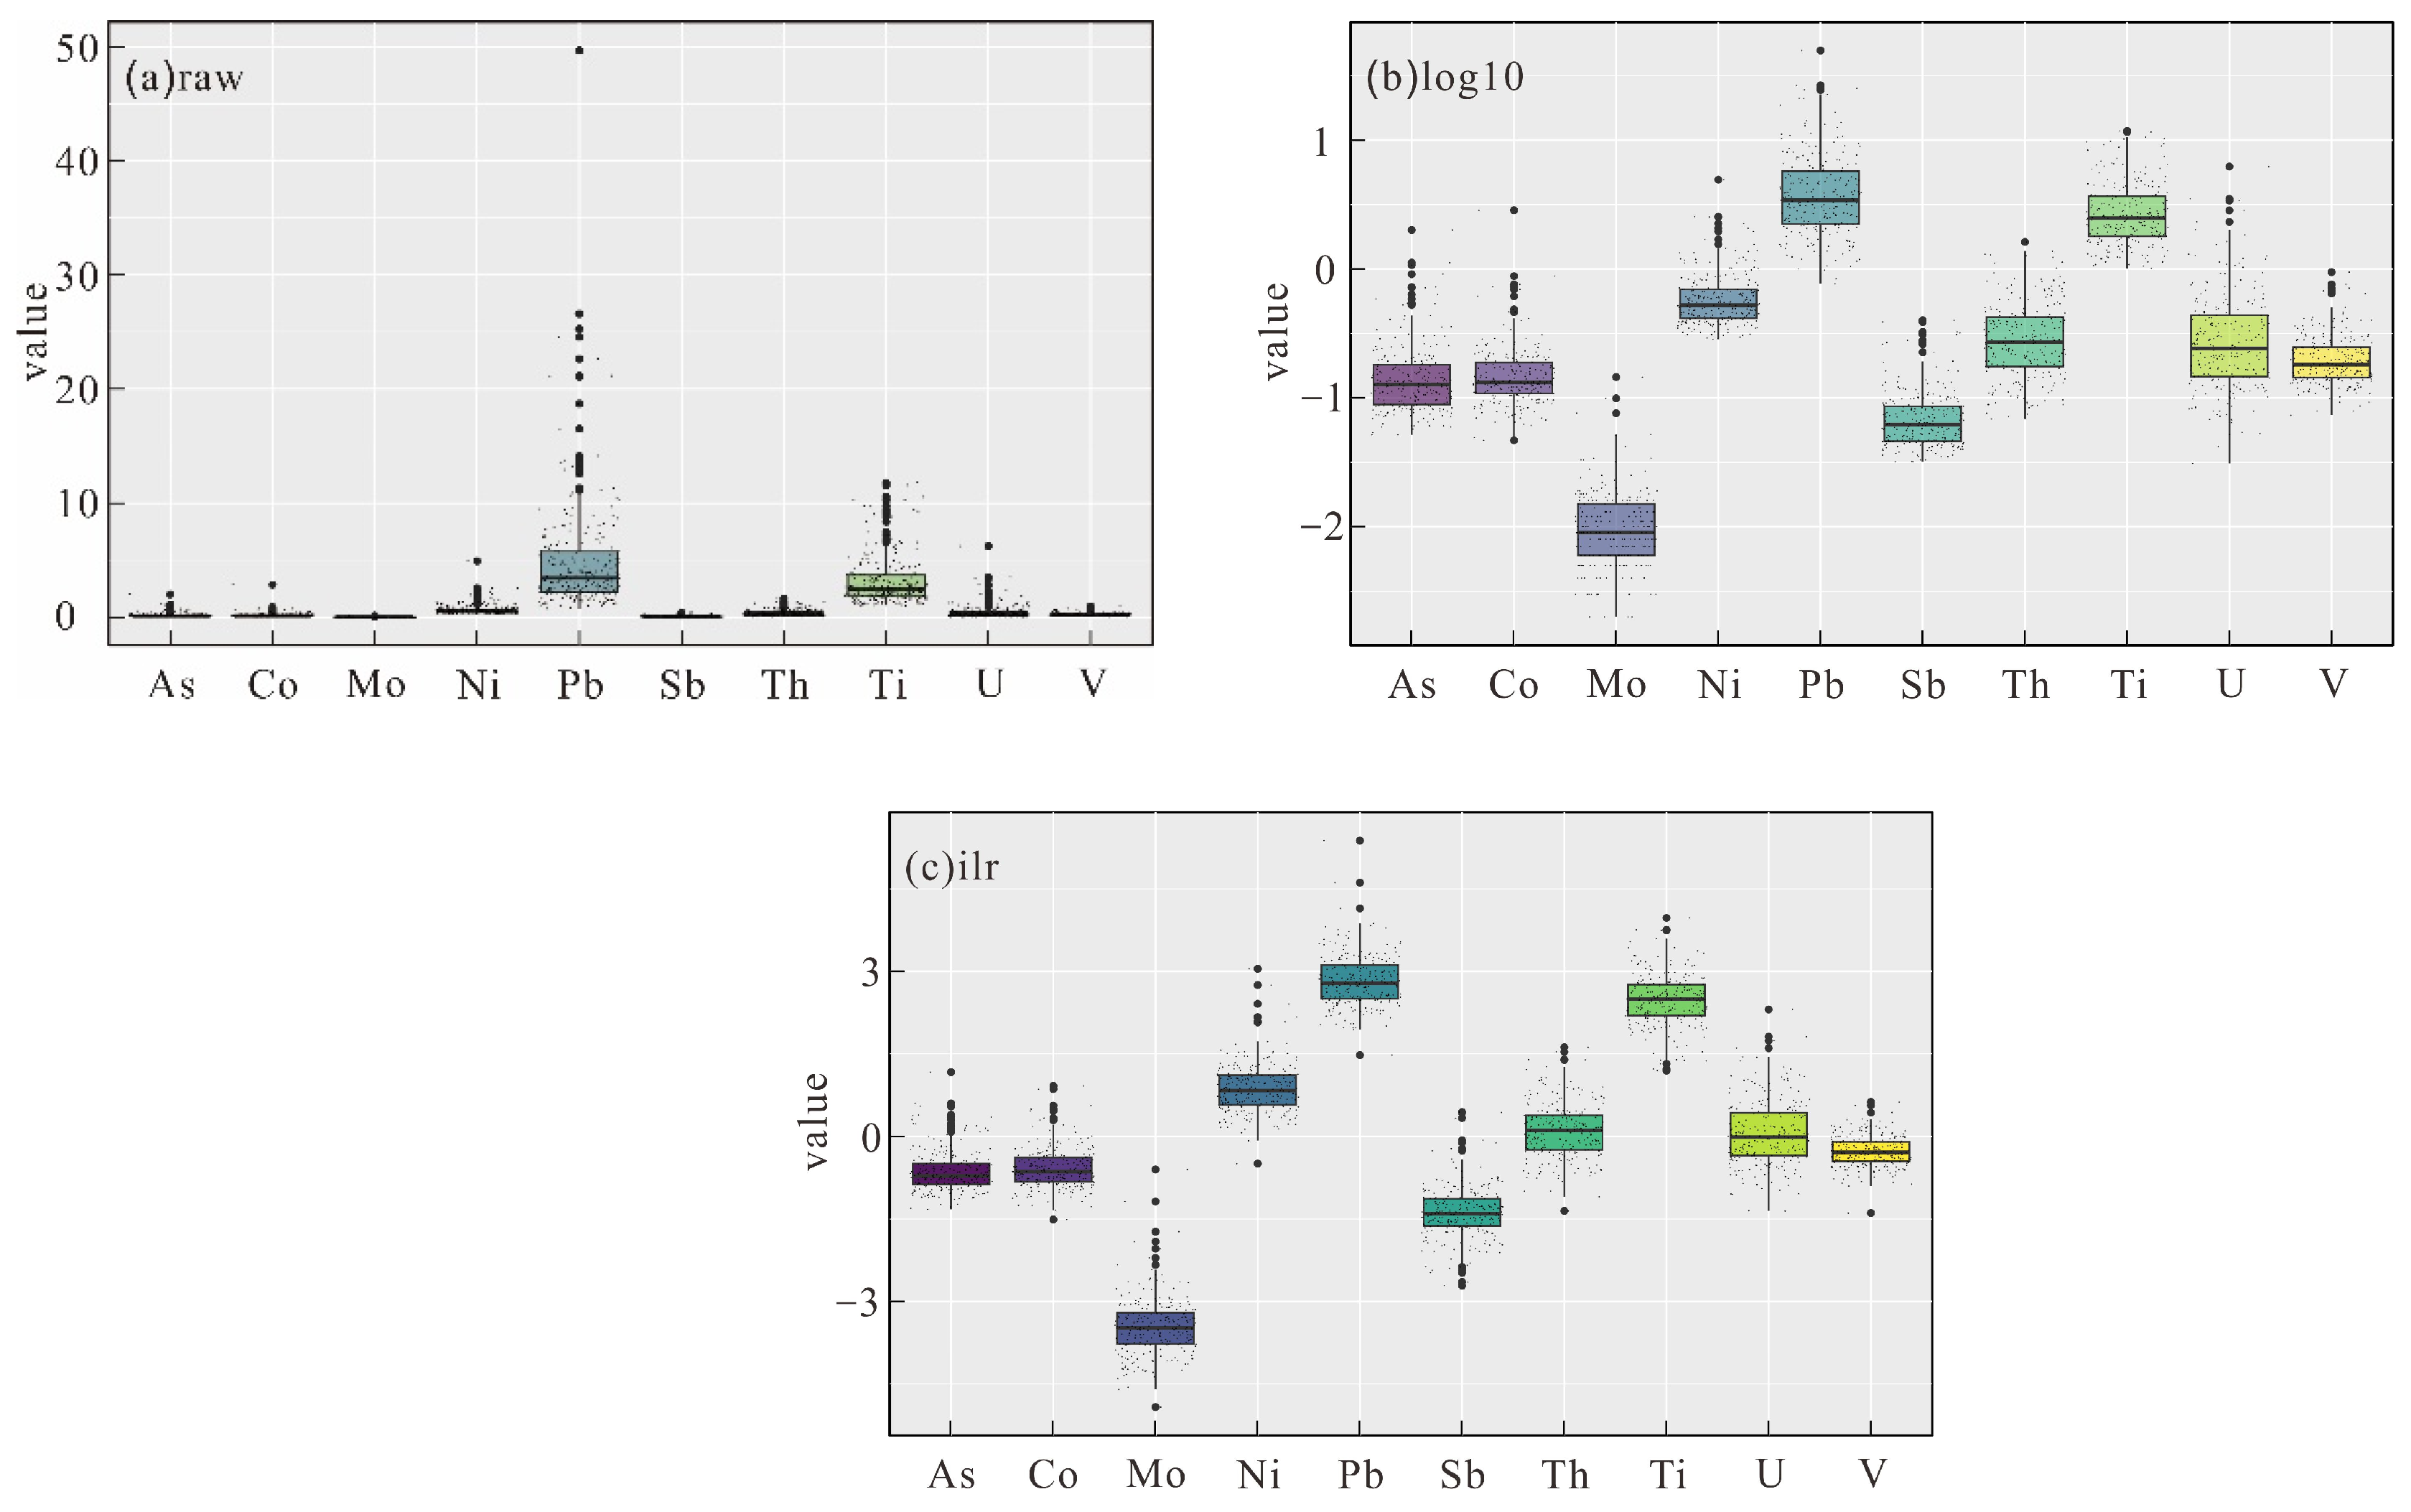
4.2. Descriptive Statistical Analysis

In order to further explore the intrinsic connections among 10 elements in the study area, this study analyzed the statistical parameters of the raw data, logarithmically transformed data, and ilr-transformed data (Table 1). Obviously, from the coefficient of variation, the 10 elements all have large dispersion. U is the largest, followed by Co, Pb, As, and Mo. Indicating these elements may be enriched or depleted in local areas.
Based on the kurtosis and skewness of the raw data, it can be seen that all elements do not follow the normal distribution, causing the classical statistical analyses to produce erroneous results [44]. By comparing the data characteristics after logarithmic and ilr transformation, it can be clearly seen that each element no longer has significantly high kurtosis or skewness, and the transformed data approximates the normal distribution.
Meanwhile, the Box plots and density curves (Figure 5 and Figure 6) indicate the Pb, Ti, and U elements have a large number of high-value outlier points, which may suppress the anomalies of these elements in other areas of the study. The density curves of the data after logarithmic and ilr transformation are approximates of the normal distribution.
In summary, from the statistical parameters and the statistical figures, the logarithmically and ilr-transformed data are approximates of the normal distribution. Comparatively speaking, the ilr transformation has the more powerful effect in this case, because of the lower values of skewness and kurtosis, and a more concentrated tendency in the frequency distribution.

4.3. CoDA Results

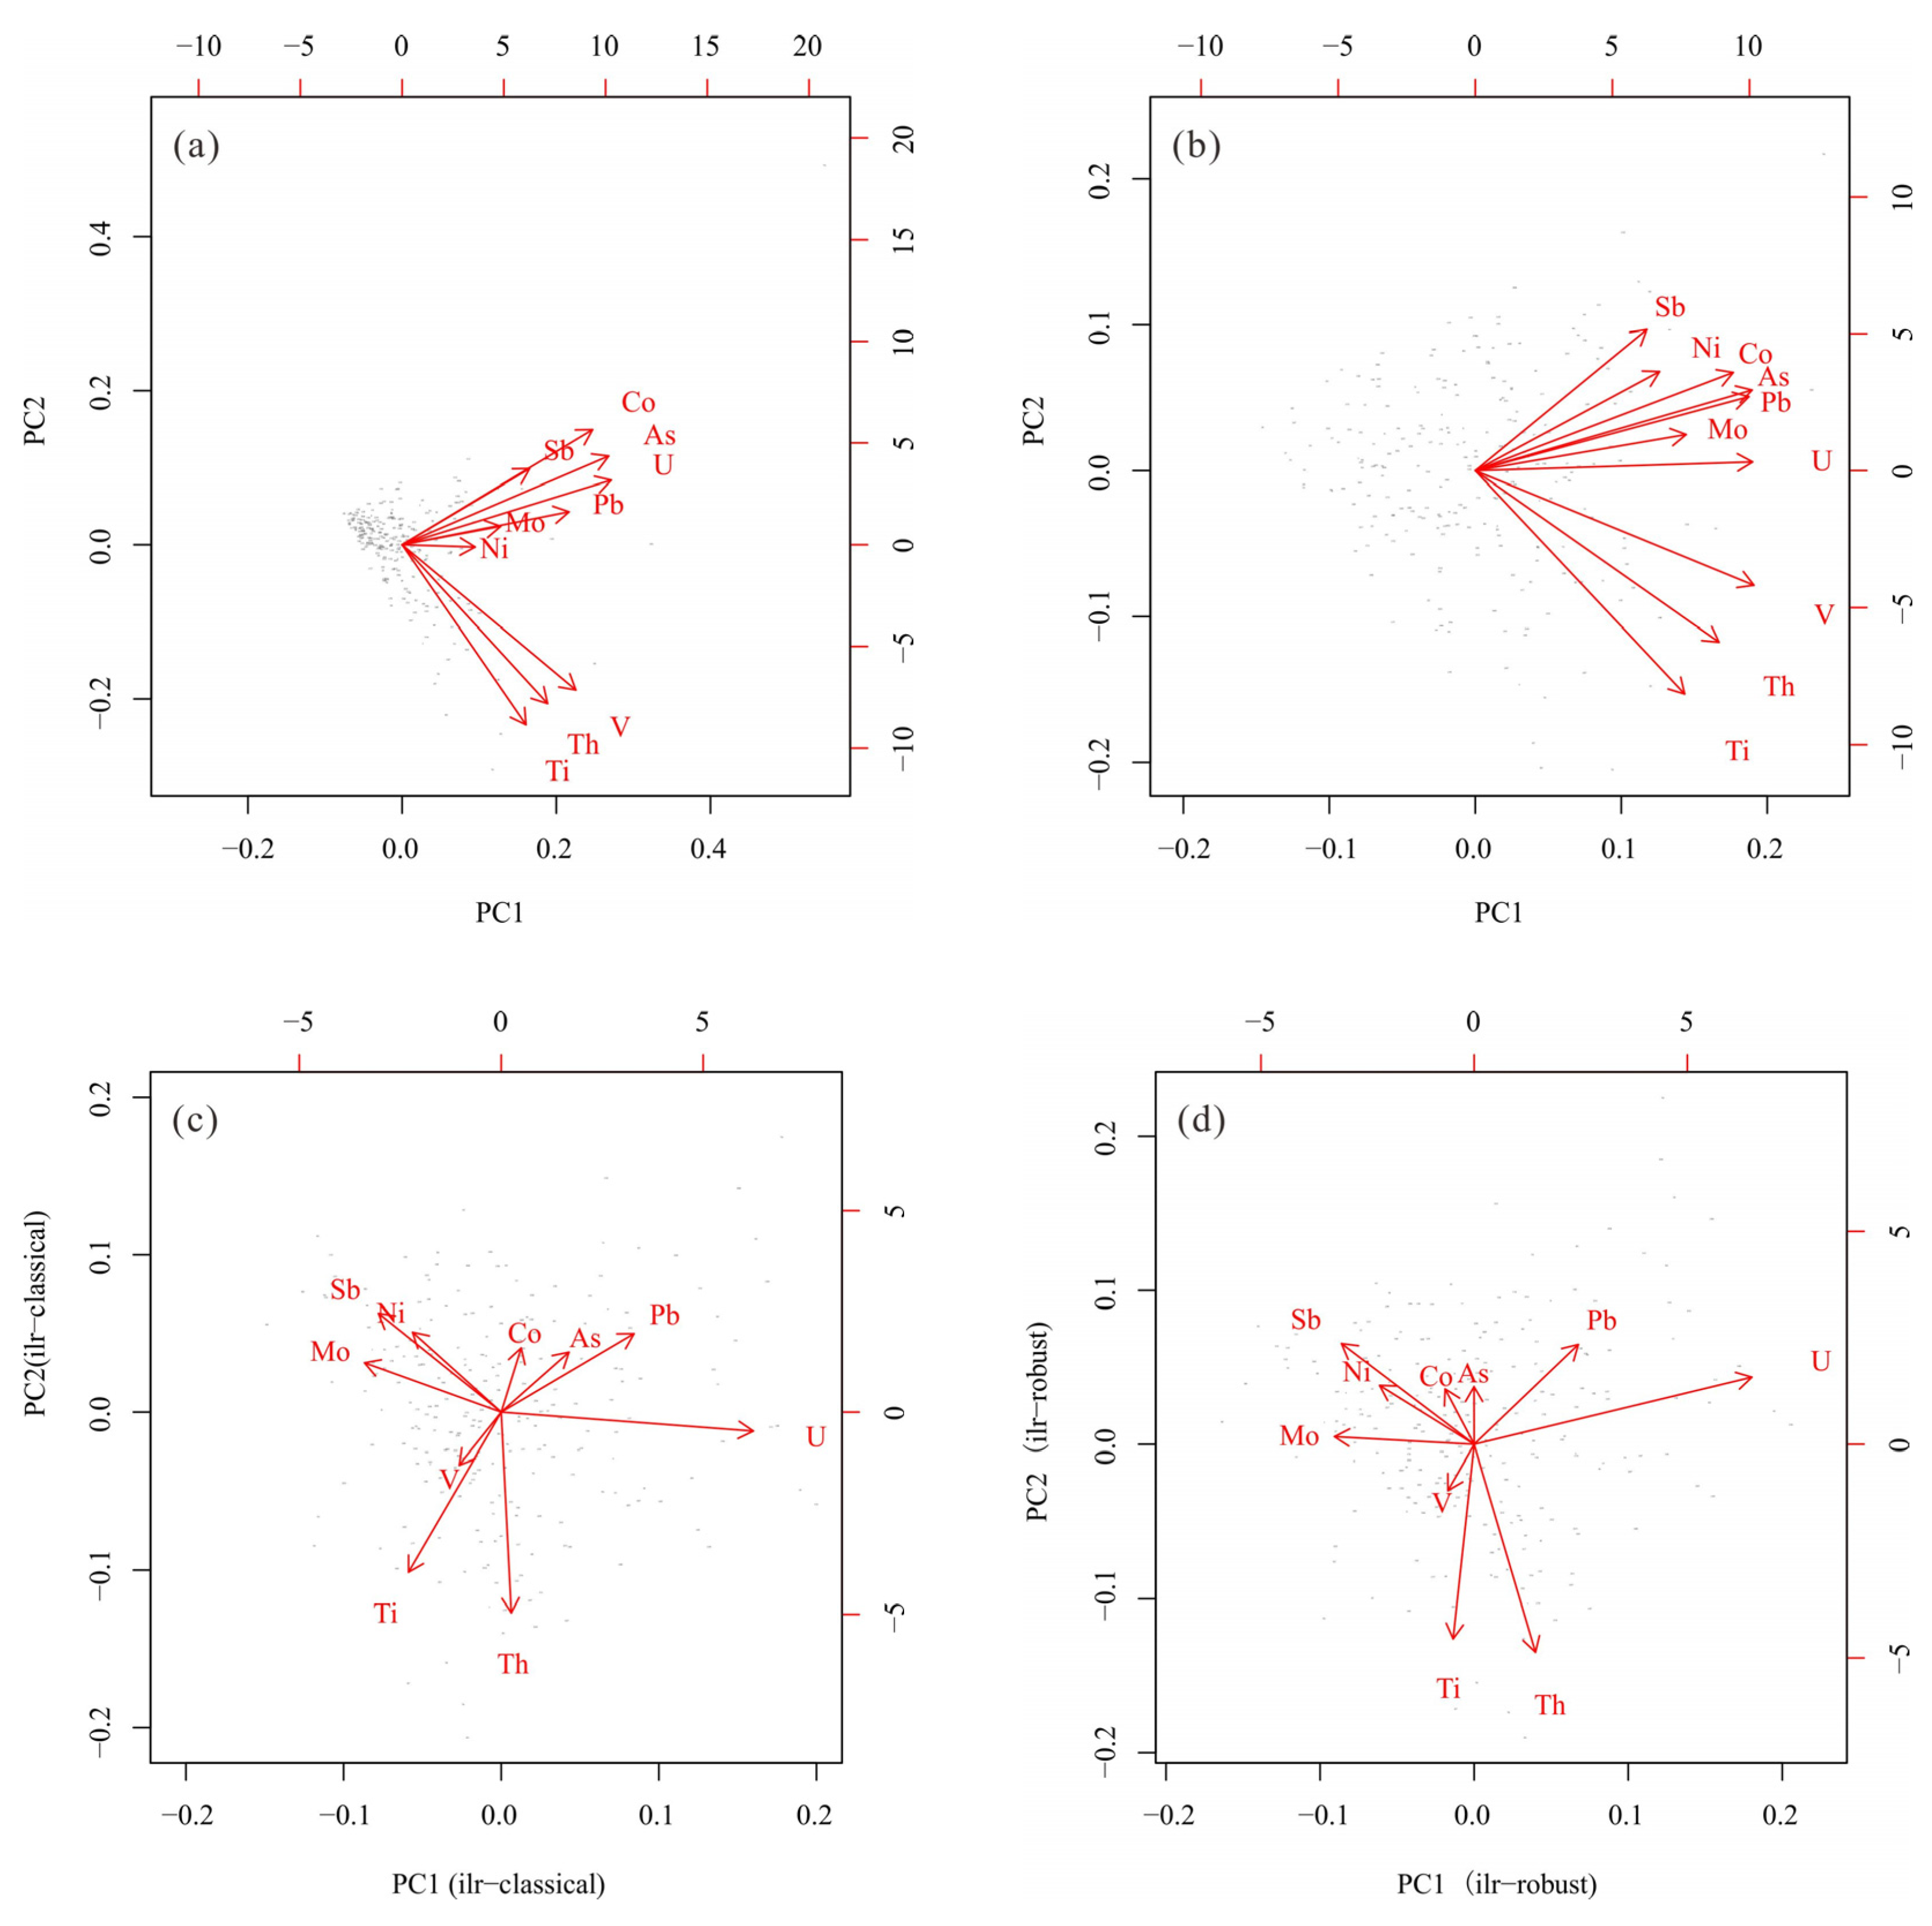
4.3.1. Principal Component Biplot

Figure 7 presents the biplots of the first two principal components (PC1 and PC2) obtained from PCA and RPCA analyses of the raw data, logarithmically transformed data, and ilr-transformed data. As shown in Figure 7a,b, the biplots of the raw data and logarithmically transformed data exhibit a strong “one-sided” trend, indicating the presence of closure effects [58]. However, after applying the ilr transformation, the biplot of the transformed data shows a radial pattern, and the closure effect is eliminated.
Specifically, the biplots of the raw data and logarithmically transformed data (Figure 7a,b) show similar distributions, with all elements having positive loadings on PC1 and Ti, Th, and V having negative loadings on PC2. In contrast, the biplots of the ilr-transformed data (Figure 7c,d) exhibit a completely different distribution pattern, with a more dispersed variable distribution, indicating that the closure effect has been eliminated.
The biplot of PCA and RPCA is quite similar, with all ten elements evenly distributed in the four quadrants. However, there are still subtle differences; for example, the Th, U, Pb, As, and Co have positive loadings on PC1 in classical PCA, while Th, U, and Pb have positive loadings on PC1 in RPCA. Based on the geochemistry, Pb is a decay product of U, and their geochemical behavior should be more similar. The primary ore mineral in the study area is pitchblende uranium ore, comprising mainly UO2, ThO2 + REE2O3, PbO, SiO2, and CaO [35]. Therefore, the elements U and Pb exhibit a closer relationship in this region.
Geochemical association of Th-U-Pb is a very important indicator for uranium deposit exploration [35], pointing to the fact that the RPCA can gain more reliable results in this case (Figure 7).
Accordingly, based on the biplot of RPCA, 10 elements can be divided into two distinct element groups: Th-U-Pb and Ti-V-Co-Ni-Mo-Sb-As; the former is a mineralization geochemical association [61], and the latter is a geological background element association, which are the primary ore-forming elements. U is the dominant ore-forming element in the study area, while Th is typically a companion element to uranium mineralization.

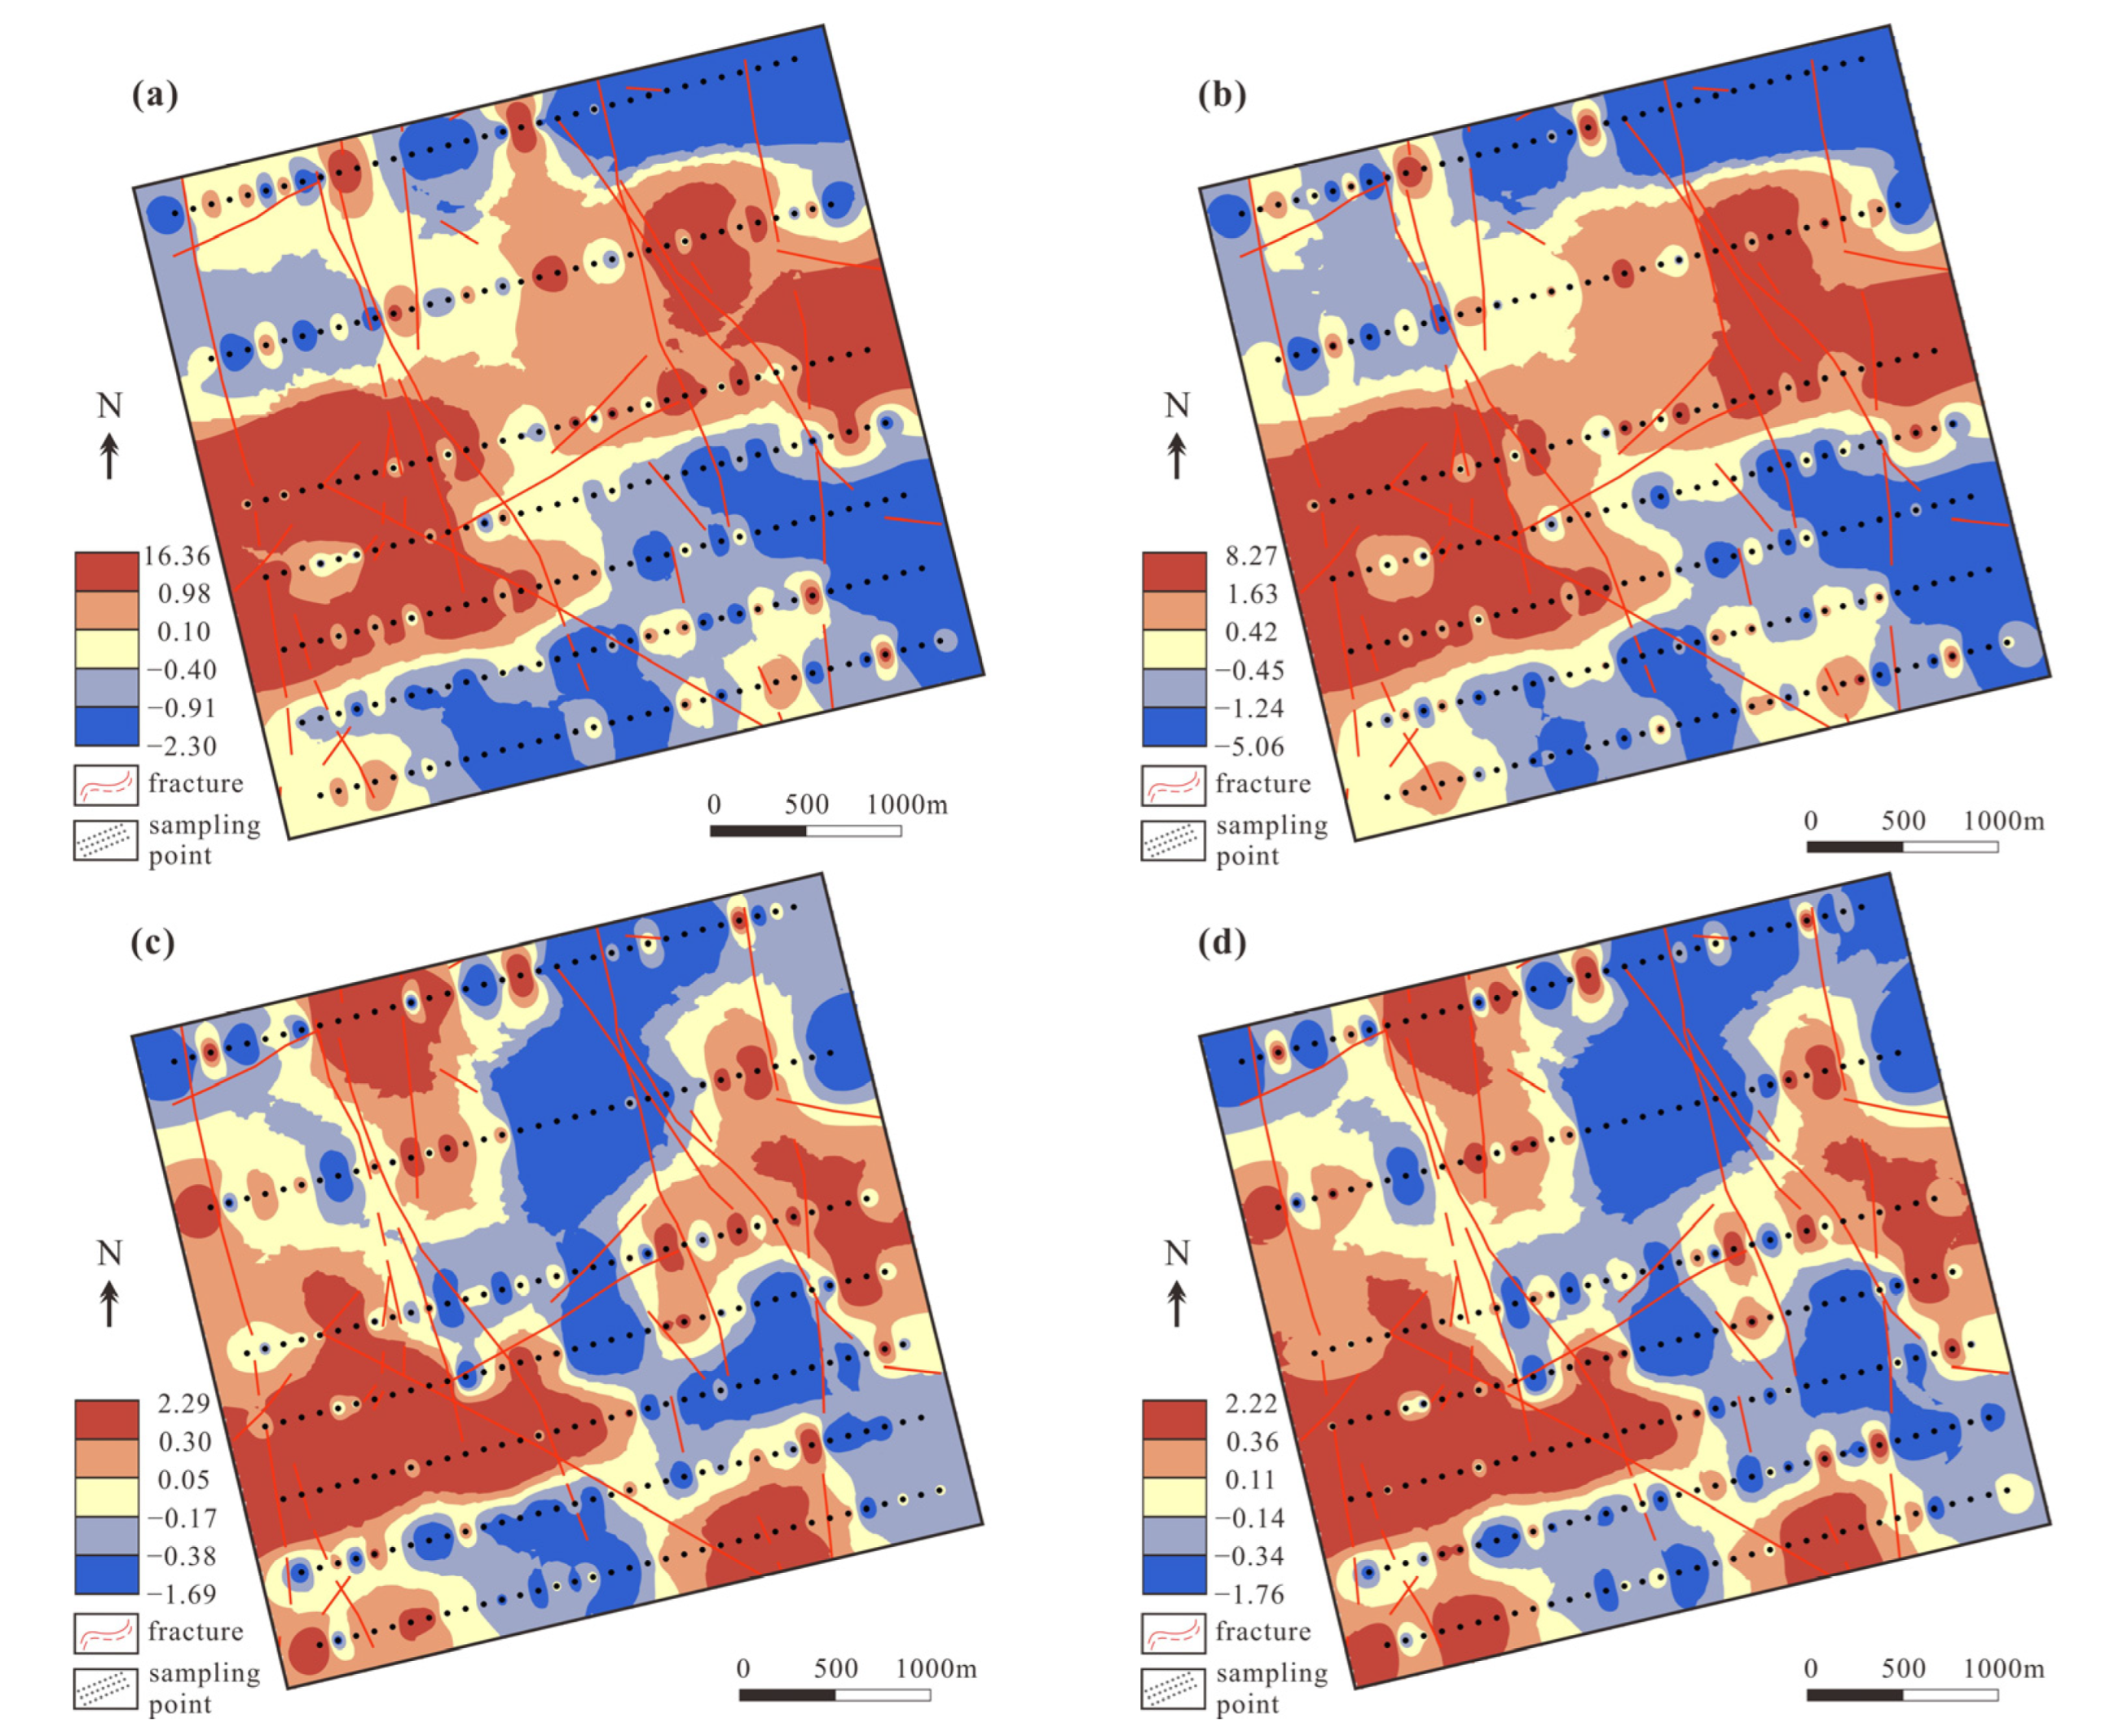
4.3.2. Geochemical Association Mapping

For further comparison, the geochemical association mapping of PC1 from PCA and RPCA are carried out. The used interpolation method is Inverse Distance Weighting (IDW). Obviously, the geochemical association maps of PC1 from PCA using raw data and logarithmically transformed data are relatively similar (Figure 8a,b). They both exhibit high-value anomalies that occupy almost half of the study area, with the anomalies distributed in two main blocks in the east and west. In contrast, after applying the ilr transformation, the PC1 for classical and robust methods are relatively similar (Figure 8c,d). This transformation better highlights the anomalies in the north and south that were previously suppressed.
Based on the geological map (Figure 2), the large anomalous area on the west of ilr-transformed PC1 (Figure 8c,d) may be due to the intersection of the Late Triassic two-mica granite, Middle Triassic two-mica granite, and Early Jurassic biotite granite. Intrusive rocks of the Yanshan and Indosinian periods converge in this area, and the anomalous shape is distributed mainly along the contact boundary. The small anomalous area on the north is located at the contact point between Middle Triassic two-mica granite and Early Jurassic biotite granite. The small anomalous area on the east is also related to the intrusion of the Cretaceous two-mica granite. Additionally, the anomalous area on the south side is associated with the faults. Overall, the anomalous distribution areas of ilr-transformed PC1 are controlled by the complex secondary faults, the Yanshan–Indosinian intrusive granite, and the contact zone of different granite (Figure 8c,d).

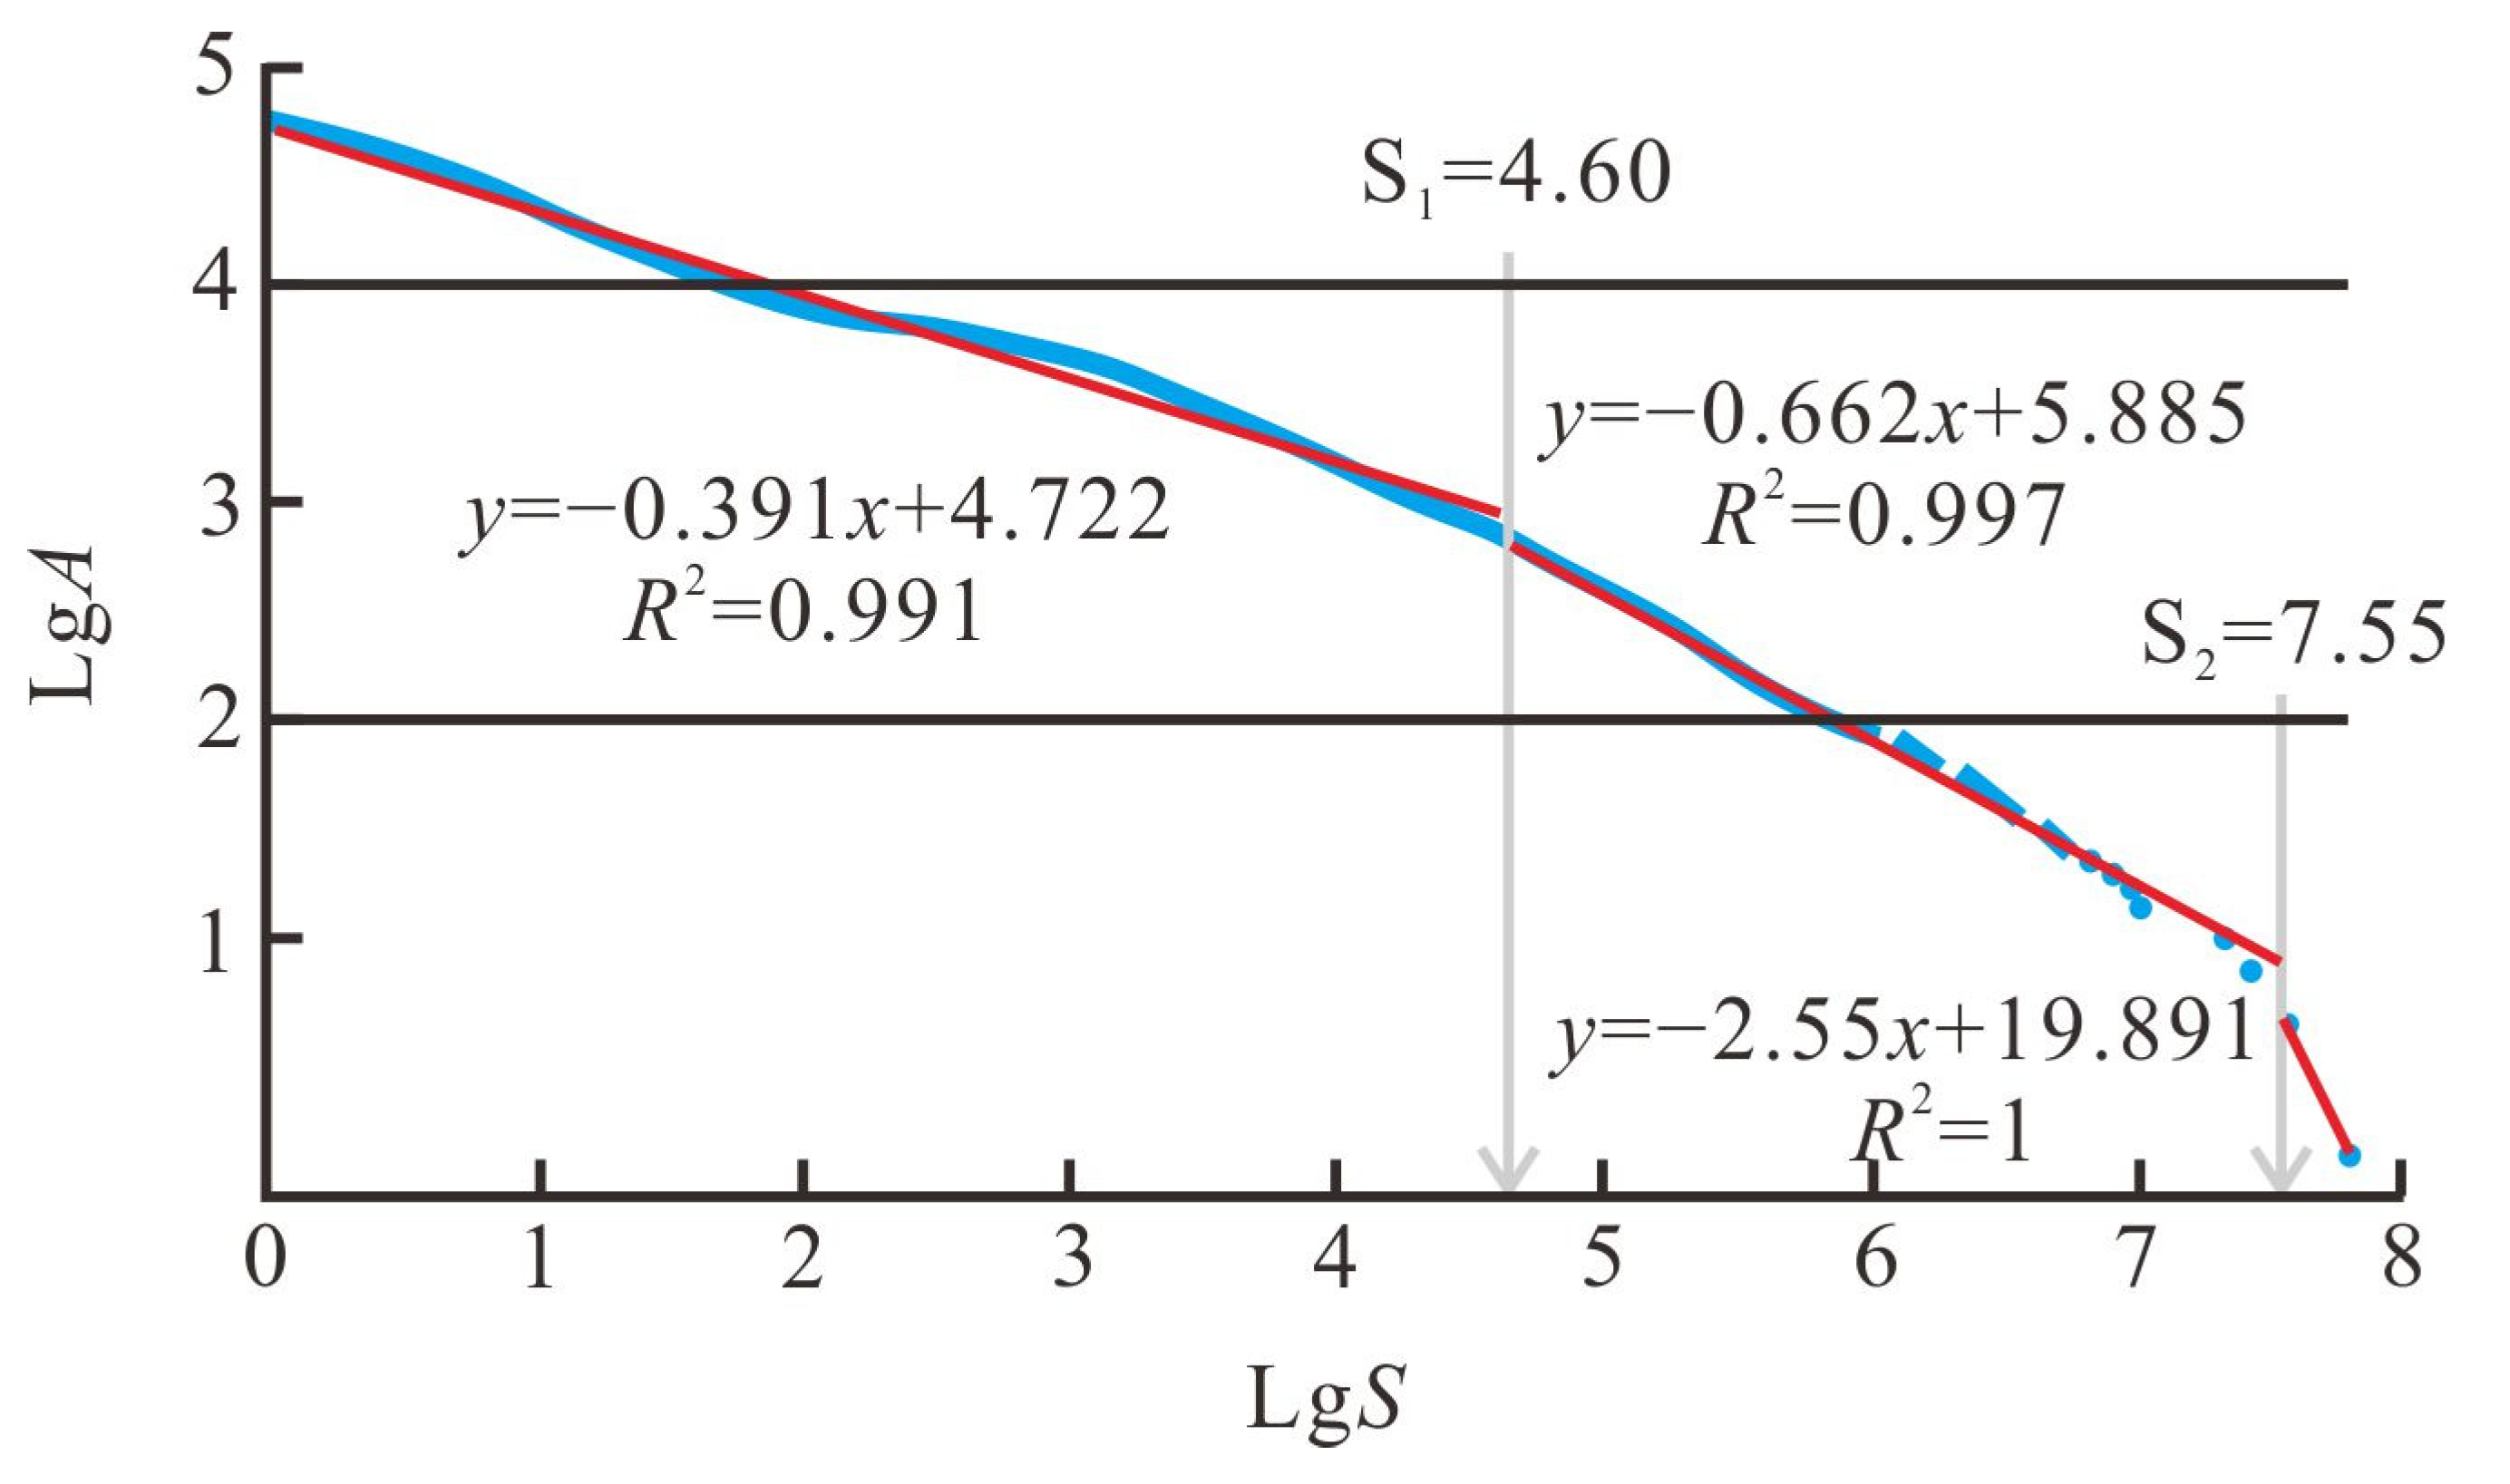
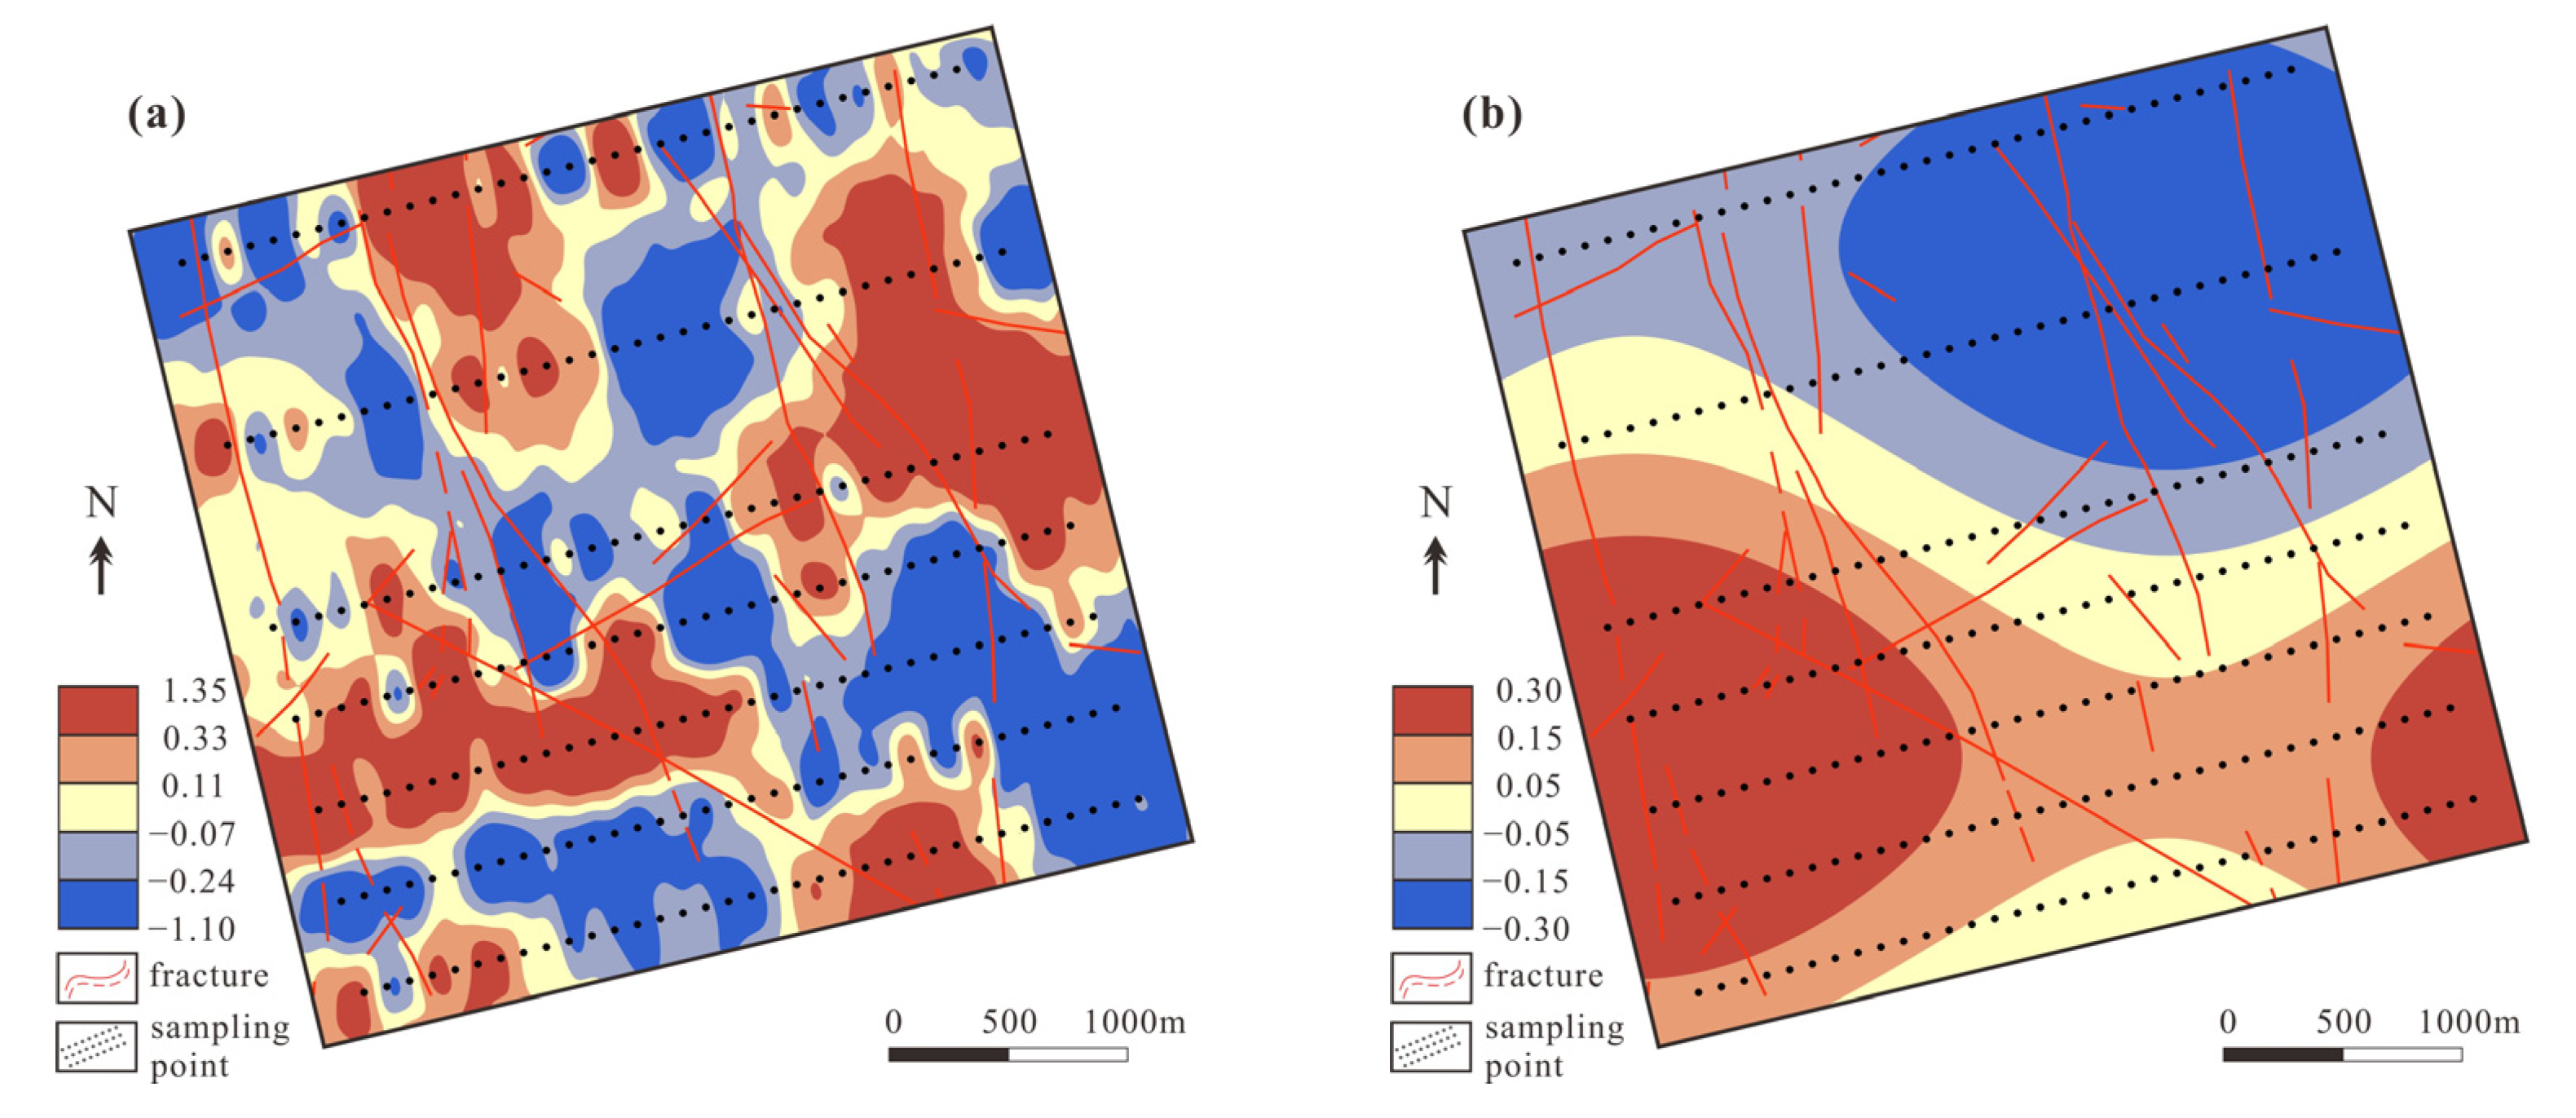
4.4. Multifractal S-A Model Results

Based on the results above, the PC1 from RPCA is used to further determine the geochemical association anomalies in this study area. The S-A model is used to separate the geochemical background and anomalies. The filtering values are determined based on the spectrum energy density (S) and area (A) plot (Figure 9).
The inflection point values were determined by the curve segment fitting (specifically, refer to Figure 9, where “lg” denotes the logarithm with a base of 10). Three straight lines are derived through the lgS-lgA plot and are separated with the inflection points S1 = 4.60 and S2 = 7.55 (“lg” represents the logarithm with a base of 10). The background and anomaly maps are obtained using the inflection value and inverse Fourier transformation. In these maps, S < S1 represents noise, S > S2 represents backgrounds, and S1 < S < S2 represents anomalies (Figure 9 and Figure 10).
By comparing Figure 10a with Figure 8d, it can be observed that the anomalies in the western part are weakened and the anomalies in the eastern part are strengthened after the S-A anomaly decomposition. At the same time, the background area can be divided into one low background and one high background area, where the blue low-background part is mainly distributed in the Middle Triassic two-mica granite, and the red high-background part is almost distributed around the contact surface of different periods of the granite.

4.5. Discussion and Target Delineation

4.5.1. Mineral Prospectivity Analysis

The uranium mineralization in the southern Zhuguang region is closely associated with mantle–crust magmatic processes, fault tectonics, and hydrothermal activities. Under the influence of mantle fluids, pre-Cambrian uranium-bearing metamorphic basement rocks underwent re-melting, resulting in the Indosinian and early Yanshan uranium-rich granite intrusion. Various metamorphic events subsequently activated uranium within these rock bodies. Intense late Yanshan tectonic activities facilitated the upward movement of mantle alkaline fluids, causing the intrusion of acidic magmas from crustal or crust–mantle hybrid sources and mafic magmas from the mantle. This further transformed and activated uranium within the rock bodies, providing abundant thermal energy, hydrothermal fluids, and mineralizers for uranium mineralization. Residual magma or other fluids during this period, influenced by fault tectonics, extracted uranium from within and surrounding granitic rocks, preferentially precipitating and enriching ores under favorable conditions [36].
The area exhibits highly developed ore-controlling structures. The occurrence and scale of uranium deposits are often controlled by tectonic alteration zones. They are primarily distributed within the fracture zones of the granitic intrusions, with some located in the outer zones of the granitic intrusions, under the influence of fault structures and the intrusion boundaries of the granites.
The main uranium-enriched rock mass in the study area is the Late Triassic biotite granite, particularly its conjunction with other rock masses, which favors mineralization. The NNW and NE trending faults serve as primary channels for hydrothermal migration, thereby facilitating mineralization. The positions of intersection and combination of faults in various directions are of particular interest. Additionally, the Yanshan period intrusion of the Cretaceous hydrothermal veins also plays a proactive role in uranium enrichment and mineralization.
Based on the processed RPCA1 anomaly map obtained through the S-A model, the high anomaly areas align well with the aforementioned favorable geological characteristics for mineralization. It is considered that this method effectively identifies the enrichment of uranium and associated elements, providing indicative significance in delineating target areas.

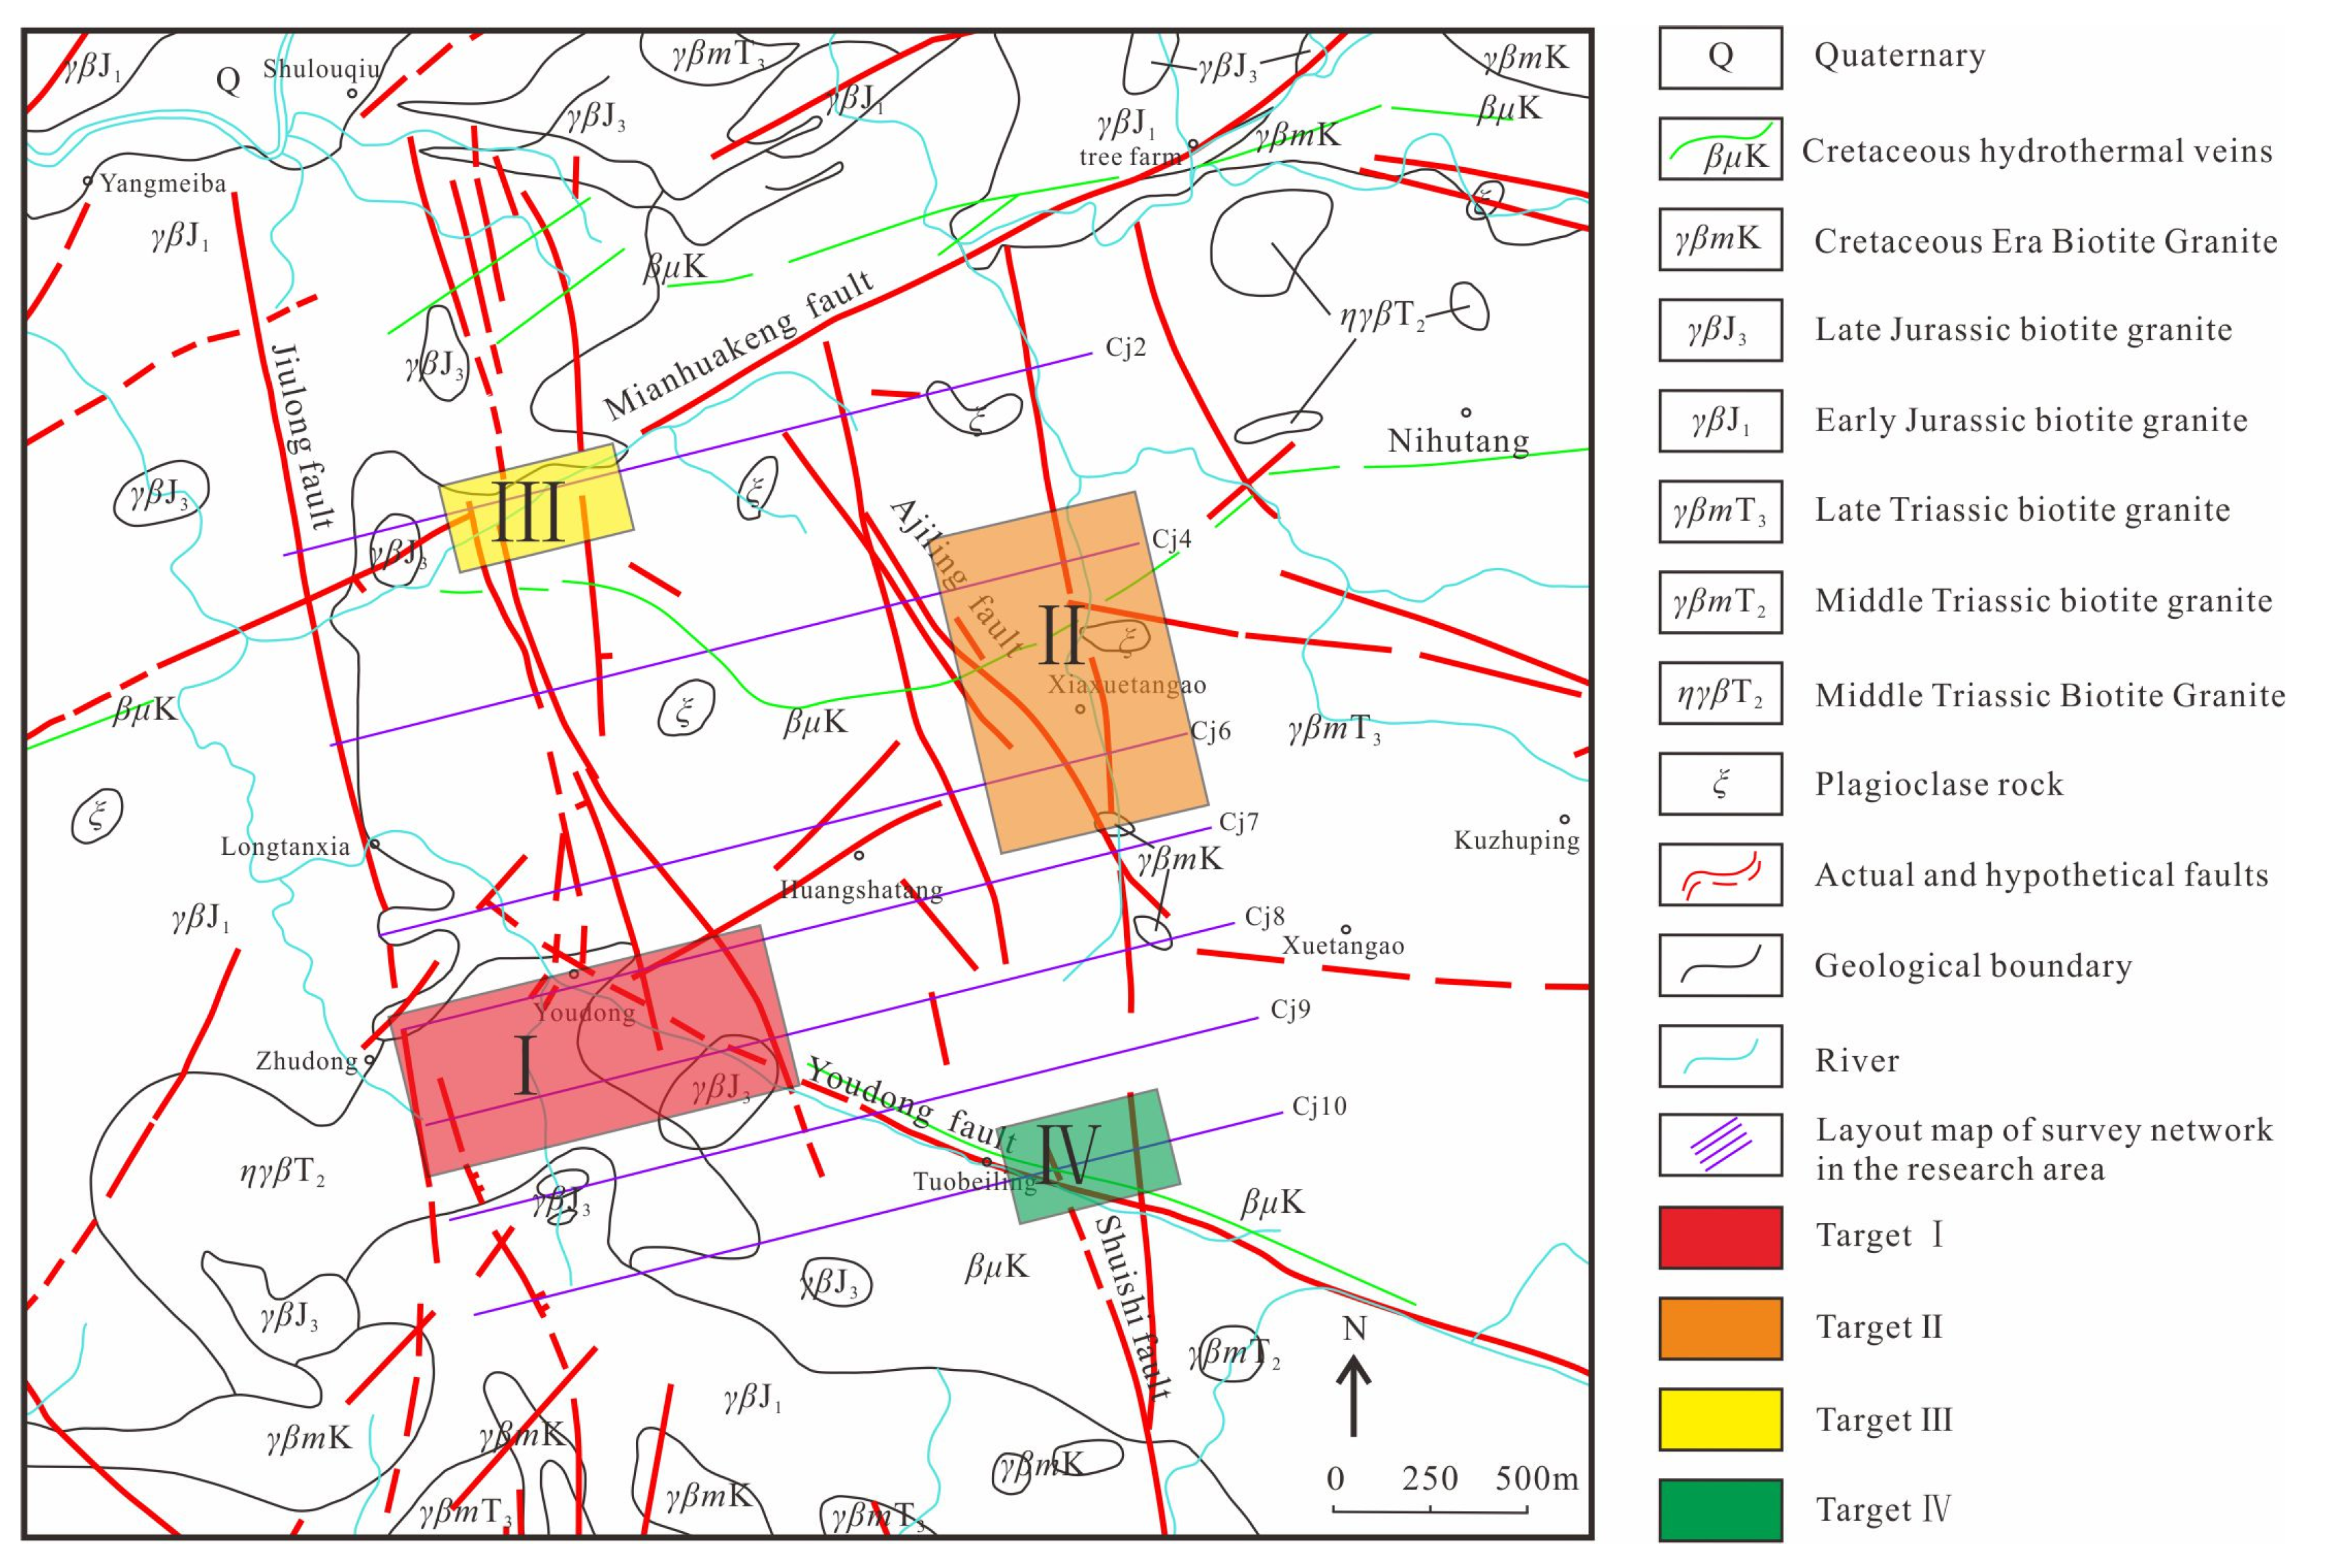
4.5.2. Target Division

The favorable prospecting geological features are closely related to the distribution of faults, contact surfaces of granite, and intrusions of basic veins in the research area. Combining the geochemical indicators with geological background, the distribution of the PC1 from RPCA are significantly important indicators for mineral prospectivity mapping. Finally, based on this understanding, four prospecting prediction targets were identified in the study area (Figure 11).

Target I

This target spans two survey lines, with an area of approximately 1.06 km2 (Figure 11). PC1 displays a high-value anomaly in this area (Figure 10). The NW-oriented Youdong fault and two faults-oriented NNW jointly control this target. Meanwhile, a diabase vein passes through the center of the anomaly along the Youdong fault, and the NE side of the anomaly is the boundary of Early Jurassic two-mica granite and Late Triassic two-mica granite, with a complex boundary shape, which is conducive to the enrichment of U mineralization. Therefore, it is classified as the target I.

Target II

This target area is located near the Ajiling faults, spanning two survey lines (Cj4 and Cj6), with an area of approximately 1.148 km2. After S-A decomposition, the anomaly is significantly strengthened, the center of the anomaly is located at the intersection of the NNW-oriented and near-NS-oriented faults. Meanwhile, a basalt vein passes through the target. Therefore, it is classified as the target II.

Target III

This target lies in the northern part of the study area, near the Mianhuakeng fault, and covers an area of approximately 0.266 km2. The III target lies at the intersection of the Mianhuakeng fault and the NNW-oriented fault, a basalt vein of passes through the southern side, and the contact zone of Late Triassic two-mica granite and Early Jurassic biotite granite appear in this target.

Target IV

This target area is situated close to the Tuobeiling, with a smaller area of approximately 0.271 km2. The IV target is mainly located on the Youdong fault, and a basaltic dyke also passes through this area. The intersection of the NNW-oriented fault and the Youdong fault is located on the east side.

5. Conclusions

This study presents an application of CoDA and multifractal S-A methods for extracting geochemical association anomalies, which achieves the mineral prediction in the Changjiang area of Guangdong Province, China. The following conclusions were drawn:
(1)
The ilr-transformed data can eliminate the closure problem of geo-electrochemical data, which can be better used for classical statistical analysis.
(2)
Using the ilr-transformed data, classical principal component analysis (PCA) and robust principal component analysis (RPCA) were performed to better reflect the interrelationships between the elements. From a metallogenic background, RPCA identified two different element associations: the first group represented by Th-U-Pb-As as the main ore-forming element association, and the second group represented by Ti-V-Co-Ni-Mo-Sb as the metallogenic background.
(3)
By using the S-A model, the background and anomalies of geo-electrochemical data are identified, combined with the geological background, and four mineral exploration targets are delineated.
In summary, geo-electrochemistry is an effective method for detecting deeply buried elements. The application of CoDA and S-A methods can effectively extract and enhance the mineralization information of geo-electrochemistry, and the predicted targets can provide direction for further prospecting in the study area.

Author Contributions

Conceptualization, R.T. and L.S.; methodology, R.T., C.L., Y.K. and L.S.; software, R.T. and C.L.; validation, M.X., Y.W. and C.L.; formal analysis, Y.K.; investigation, R.T.; resources, K.X.; data curation, Y.G.; writing—original draft preparation, R.T.; writing—review and editing, L.S.; visualization, R.T; supervision, L.S.; project administration, F.O.; funding acquisition, L.S. and F.O. All authors have read and agreed to the published version of the manuscript.

Funding

This work was supported by the National Key R&D Program of China (Grants 2023YFC2906403), the National Natural Science Foundation of China (42072322), the Sichuan Science and Technology Program (2023NSFSC0277), and the China Geological Survey Program (DD20230055).

Data Availability Statement

All data and materials are available on request from the corresponding author. The data are not publicly available due to ongoing researches using a part of the data.

Acknowledgments

The authors thank the anonymous reviewers and the editors for their hard work on this paper. We would like to extend our heartfelt gratitude to Fei Ouyang for providing invaluable data support, and to the Geomathematics Key Laboratory of Sichuan Province for their invaluable technical assistance.

Conflicts of Interest

The authors declare no conflicts of interest.

References

  1. Fei, X.Q. The result of experiment with method of partial metal extraction in several mining areas. Geophys. Geochem. Explor. 1984, 8, 162–166, (In Chinese with English Abstract). [Google Scholar]
  2. Xu, B.L.; Fei, X.Q.; Wang, H.P. Electrogeochemical extraction technique in the prospecting of buried gold deposits. J. Geochem. Explor. 1989, 33, 99–108. [Google Scholar]
  3. Luo, X.R. The Mechanism of Electrogeochemical Halo-Formation and the Application of Electrogeochemical Method to Exploration of Metallic ore Deposits. Ph.D. Thesis, Hefei University of Technology, Hefei, China, 2005. (In Chinese with English Abstract). [Google Scholar]
  4. Liu, P.F.; Luo, X.R.; Wen, M.L.; Zhang, J.L.; Zheng, C.J.; Gao, W.; Ouyang, F. Geoelectrochemical anomaly prospecting for uranium deposits in southeastern China. Appl. Geochem. 2018, 97, 226–237. [Google Scholar] [CrossRef]
  5. Liu, P.F.; Luo, X.R.; Wen, M.L.; Zhang, J.L.; Gao, W.; Ouyang, F.; Duan, X.C. Using electrogeochemical approach to explore buried gold deposits in an alpine meadow-covered area. Acta Geochim. 2018, 37, 402–413. [Google Scholar] [CrossRef]
  6. Liu, P.F.; Luo, X.R.; Wen, M.L.; Anand, R.; Thorne, R.; Zhang, J.L.; Zhang, J.L. Application of the geoelectrochemical extraction method to the Xiyi Pb-Zn deposit in southwestern China. J. Geochem. Explor. 2019, 203, 1–26. [Google Scholar] [CrossRef]
  7. Liu, P.F.; Luo, X.R.; Wen, M.L.; Zhang, J.L.; Zheng, C.J.; Yang, L.K.; Wei, X.J. Retrospect and prospect for geo-electrochemical technology research in the past three decades of China. J. Guilin Univ. Technol. 2018, 38, 47–55, (In Chinese with English Abstract). [Google Scholar]
  8. Liu, P.F.; Luo, X.R.; Wen, M.L.; Zheng, C.J.; Ouyang, F.; Shan, J.T.; Gao, W. Main study progress and prospect of geo-electrochemistry technology in China. Met. Mine 2022, 11, 10–22, (In Chinese with English Abstract). [Google Scholar] [CrossRef]
  9. Ryss, Y.S.; Antropova, L.V.; Goldberg, I.S. Using of electrochemical method for search, evaluation and determination of reserves of deep-seated deposits. Sov. Geol. 1977, 6, 139–144. [Google Scholar]
  10. Shmakin, B.M. The method of partial extraction of metals in a constant current electrical field for geochemical exploration. J. Geochem. Explor. 1985, 23, 27–33. [Google Scholar] [CrossRef]
  11. Talapatra, A.K.; Talakdar, R.C.; De, P.K. Electrochemical technique for exploration of base-metal sulphides. J. Geochm. Explor. 1986, 25, 389–396. [Google Scholar] [CrossRef]
  12. Smith, D.B.; Hoover, D.B.; Sanzolone, R.F. Development and testing of the CHIM electrogeochemical exploration method. In USGS Research on Mineral Resources, Program and Abstracts; U.S. Geological Survey Circular 1062; U.S. Geological Survey: Reston, VA, USA, 1991; pp. 74–75. [Google Scholar]
  13. Leinz, R.W.; Hoover, D.B.; Fey, D.L.; Smith, D.B. Electrogeochemical sampling with NEOCHIM—Results of tests over buried gold deposits. J. Geochem. Explor. 1998, 61, 57–86. [Google Scholar] [CrossRef]
  14. Leinz, R.W.; Hoover, D.B. The Russian CHIM method—Electrically or diffussion-driven collection of ions? Explore 1993, 79, 5–9. [Google Scholar]
  15. Alekseev, S.G.; Dukhanin, A.S.; Veshev, S.A.; Voroshilov, N.A. Some aspects of practical use of electrogeochemical methods of exploration for deep-seated mineralization. J. Geochem. Explor. 1996, 56, 79–86. [Google Scholar] [CrossRef]
  16. Aitchison, J. The statistical analysis of compositional data. J. R. Stat. Soc. Ser. B (Stat. Methodol.) 1982, 44, 139–177. [Google Scholar] [CrossRef]
  17. Aitchison, J. The Statistical Analysis of Compositional Data; Chapman and Hall Ltd.: London, UK, 1986; pp. 1–416. [Google Scholar]
  18. Liu, Y.; Cheng, Q.M.; Zhou, K.F.; Xia, Q.L.; Wang, X.Q. Multivariate analysis for geochemical process identification using stream sediment geochemical data: A perspective from compositional data. Geochem. J. 2016, 50, 293–314. [Google Scholar] [CrossRef]
  19. Wang, Z.; Shi, W.J.; Zhou, W.; Li, X.Y.; Yue, T.X. Comparison of additive and isometric log-ratio transformations combined with machine learning and regression kriging models for mapping soil particle size fractions. Geoderma 2020, 365, 114–214. [Google Scholar] [CrossRef]
  20. Wang, L.; Liu, B.L.; Jennifer, M.M.; Mark, R.C.; Li, C.; Kong, Y.H.; Shan, M.X. Compositional data analysis of regional geochemical data in the Lhasa area of Tibet, China. Appl. Geochem. 2018, 135, 105108. [Google Scholar] [CrossRef]
  21. Zheng, C.J.; Liu, P.F.; Luo, X.R.; Wen, M.L.; Huang, W.B.; Liu, G.; Wu, X.G.; Chen, Z.S.; Albanese, S. Application of compositional data analysis in geochemical exploration for concealed deposits: A case study of Ashele copper-zinc deposit, Xinjiang, China. Appl. Geochem. 2021, 130, 104997. [Google Scholar] [CrossRef]
  22. Pingitore, N.E., Jr.; Engle, M.A. Compositional Closure—Its Origin Lies Not in Mathematics but Rather in Nature Itself. Minerals 2022, 12, 74. [Google Scholar] [CrossRef]
  23. Tolosana-Delgado, R.; Mueller, U.; van den Boogaart, K.G. Geostatistics for Compositional Data: An Overview. Math. Geosci. 2019, 51, 485–526. [Google Scholar] [CrossRef]
  24. Allard, D.; Marchant, T. Means and Covariance Functions for Geostatistical Compositional Data: An Axiomatic Approach. Math. Geosci. 2018, 50, 299–315. [Google Scholar] [CrossRef]
  25. Zuo, R.G.; Xia, Q.L.; Wang, H.C. Compositional data analysis in the study of integrated geochemical anomalies associated with mineralization. Appl. Geochem. 2013, 28, 202–211. [Google Scholar] [CrossRef]
  26. Graffelman, J.; Pawlowsky-Glahn, V.; Egozcue, J.J.; Buccianti, A. Exploration of geochemical data with compositional canonical biplots. J. Geochm. Explor. 2018, 194, 120–133. [Google Scholar] [CrossRef] [PubMed]
  27. Nishio, I.; Morishita, T.; Tamura, A.; Itano, K.; Takamizawa, S.; Ichiyama, Y.; Arai, S.; Barrett, N.; Szilas, K. Formation of Ultra-Depleted Mantle Peridotites and Their Relationship with Boninitic Melts: An Example From the Kamuikotan Unit, Hokkaido, Japan. J. Geophys. Res. Solid Earth 2023, 128. [Google Scholar] [CrossRef]
  28. Cicchella, D.; Ambrosino, M.; Gramazio, A.; Coraggio, F.; Musto, M.A.; Caputi, A.; Avagliano, D.; Albanese, S. Using multivariate compositional data analysis (CoDA) and clustering to establish geochemical backgrounds in stream sediments of an onshore oil deposits area. The Agri River basin (Italy) case study. J. Geochm. Explor. 2022, 238, 107012. [Google Scholar] [CrossRef]
  29. Zheng, W.B.; Liu, B.L.; Tang, J.X.; Jennifer, M.M.; Mark, R.R.; Tang, P.; Lin, B.; Li, C.; Wang, L.; Zhang, D. Exploration indicators of the Jiama porphyry–skarn deposit, southern Tibet, China. J. Geochem. Explor. 2022, 236, 106982. [Google Scholar] [CrossRef]
  30. Zuo, R.G.; Carranza, E.J.M.; Wang, J. Spatial analysis and visualization of exploration geochemical data. Earth-Sci. Rev. 2016, 158, 9–18. [Google Scholar] [CrossRef]
  31. Zuo, R.G.; Xia, Q.L.; Zhang, D.J. A comparison study of the C–A and S–A models with singularity analysis to identify geochemical anomalies in covered areas. Appl. Geochem. 2013, 33, 165–172. [Google Scholar] [CrossRef]
  32. Zuo, R.G.; Wang, J. Fractal/multifractal modeling of geochemical data: A review. J. Geochem. Explor. 2016, 164, 33–41. [Google Scholar] [CrossRef]
  33. Cheng, Q.M.; Agterberg, F.P.; Ballantyne, S.B. The separation of geochemical anomalies from background by fractal methods. J. Geochem. Explor. 1994, 51, 109–130. [Google Scholar] [CrossRef]
  34. Cheng, Q.M.; Agterberg, F.P. Multifractal modeling and spatial statistics. Math. Geol. 1996, 28, 1–16. [Google Scholar] [CrossRef]
  35. Liu, J.G.; Li, Z.Y.; Nie, J.T.; Jin, N.X.; Zhao, Y.T.; Tao, Y. Study on Structural Properties and Prospecting Significance of Youdong Fault in Changjiang Uranium Orefield, South Zhuguang. Uranium Geol. 2019, 35, 199–205, (In Chinese with English Abstract). [Google Scholar]
  36. Zou, D.F. Geochemical study of the Uranium ore in Xiazhuang Uranium ore Fields, Northern Guangdong Province. Master’s Thesis, China University of Geosciences, Wuhan, China, 2012. (In Chinese with English Abstract). [Google Scholar]
  37. Chen, X.; Wen, C.H.; Meng, D.B.; Li, B.; Jiang, B.G.; Qin, J.N. Implications of Major and Trace Element Migration in Altered Granites for Hydrothermal Alteration and Granite-Related Uranium Mineralization in the Sanjiu Ore Field, South China. Minerals 2022, 12, 144. [Google Scholar] [CrossRef]
  38. Sun, B.B. Study on the Formation Mechanism of Geoelectrochemical Anomaly and the Standardization of Prospecting Technology. Master’s Thesis, China University of Geosciences (Beijing), Beijing, China, 2017. (In Chinese with English Abstract). [Google Scholar]
  39. Shi, Y.H.; Yang, Z.P.; Huang, J.H.; Zhou, Q.M.; Xiong, C.X. Determination of Trace Elements in Electrical Absorption Prospecting Polyform Sample by Coupled Plasma Mass Spectrometry. Spectrosc. Spectr. Anal. 2009, 29, 1687–1690, (In Chinese with English Abstract). [Google Scholar]
  40. Lloyd, C.D.; Pawlowsky-Glahn, V.; Egozcue, J.J. Compositional data analysis in population studies. Ann. Am. Assoc. Geogr. 2012, 102, 1251–1266. [Google Scholar] [CrossRef]
  41. Filzmoser, P.; Hron, K.; Templ, M. Applied Compositional Data Analysis; Springer International Publishing: Cham, Switzerland, 2018; p. 288. [Google Scholar] [CrossRef]
  42. Liu, Y.; Cheng, Q.M.; Xia, Q.L.; Wang, X.Q. Application of singularity analysis for mineral potential identification using geochemical data—A case study: Nanling W-Sn-Mo polymetallic metallogenic belt, South China. J. Geochem. Explor. 2013, 134, 61–72. [Google Scholar] [CrossRef]
  43. Zuo, R.G. Identification of geochemical anomalies associated with mineralization in the Fanshan district, Fujian, China. J. Geochem. Explor. 2014, 139, 170–176. [Google Scholar] [CrossRef]
  44. Filzmoser, P.; Hron, K.; Reimann, C. Principal component analysis for compositional data with outliers. Environmetrics 2009, 20, 621–632. [Google Scholar] [CrossRef]
  45. Zuo, R.G. Identification of weak geochemical anomalies using robust neighborhood statistics coupled with GIS in covered areas. J. Geochem. Explor. 2014, 136, 93–101. [Google Scholar] [CrossRef]
  46. Aitchison, J.; Greenacre, M. Biplots of compositional data. J. R. Stat. Soc. 2002, 51, 375–392. [Google Scholar] [CrossRef]
  47. Carranza, E.J.M. Analysis and mapping of geochemical anomalies using logratio-transformed stream sediment data with censored values. J. Geochem. Explor. 2011, 110, 167–185. [Google Scholar] [CrossRef]
  48. Zuo, R.G.; Wang, J.; Xiong, Y.H.; Wang, Z.Y. The processing methods of geochemical exploration data: Past, present, and future. Appl. Geochem. 2021, 132, 105072. [Google Scholar] [CrossRef]
  49. Nazarpour, A.; Omran, N.R.; Paydar, G.R.; Sadeghi, B.; Matroud, F.; Nejad, A.M. Application of classical statistics, logratio transformation and multifractal approaches to delineate geochemical anomalies in the Zarshuran gold district, NW Iran. Geochemistry 2015, 75, 117–132. [Google Scholar] [CrossRef]
  50. Parsa, M.; Maghsoudi, A.; Ghezelbash, R. Decomposition of anomaly patterns of multi-element geochemical signatures in Ahar area, NW Iran: A comparison of U-spatial statistics and fractal models. Arab. J. Geosci. 2016, 9, 1–16. [Google Scholar] [CrossRef]
  51. Bølviken, B.; Stokke, P.R.; Feder, J.; Jössang, T. The fractal nature of geochemical landscapes. J. Geochem. Explor. 1992, 43, 91–109. [Google Scholar] [CrossRef]
  52. Ghasemzadeh, S.; Maghsoudi, A.; Yousefi, M.; Mihalasky, M.J. Stream sediment geochemical data analysis for district-scale mineral exploration targeting: Measuring the performance of the spatial U-statistic and CA fractal modeling. Ore Geol. Rev. 2019, 113, 103115. [Google Scholar] [CrossRef]
  53. Afzal, P.; Alghalandis, Y.F.; Khakzad, A.; Moarefvand, P.; Omran, N.R. Delineation of mineralization zones in porphyry Cu deposits by fractal concentration–volume modeling. J. Geochem. Explor. 2011, 108, 220–232. [Google Scholar] [CrossRef]
  54. Cheng, Q.M. Mapping singularities with stream sediment geochemical data for prediction of undiscovered mineral deposits in Gejiu, Yunnan Province, China. Ore Geol. Rev. 2007, 32, 314–324. [Google Scholar] [CrossRef]
  55. Cheng, Q.M. Multifractal distribution of eigenvalues and eigenvectors from 2D multiplicative cascade multifractal fields. Math. Geol. 2005, 37, 915–927. [Google Scholar] [CrossRef]
  56. Chen, G.X.; Cheng, Q.M. Singularity analysis based on wavelet transform of fractal measures for identifying geochemical anomaly in mineral exploration. Comput. Geosci. 2016, 87, 56–66. [Google Scholar] [CrossRef]
  57. Daya, A.A.; Afzal, P. A comparative study of concentration-area (CA) and spectrum-area (SA) fractal models for separating geochemical anomalies in Shorabhaji region, NW Iran. Arab. J. Geosci. 2015, 8, 8263–8275. [Google Scholar] [CrossRef]
  58. Liu, B.L.; Guo, K.; Li, C.; Zhou, J.; Liu, X.M.; Wang, X.Q.; Wang, L. Copper prospectivity in Tibet, China: Based on the identification of geochemical anomalies. Ore Geol. Rev. 2020, 120, 102632. [Google Scholar] [CrossRef]
  59. Zhao, Z.H.; Qiao, K.; Liu, Y.W.; Chen, J.; Li, C.L. Geochemical Data Mining by Integrated Multivariate Component Data Analysis: The Heilongjiang Duobaoshan Area (China) Case Study. Minerals 2022, 12, 1035. [Google Scholar] [CrossRef]
  60. Zuo, R.G.; Wang, J.L. ArcFractal: An ArcGIS add-in for processing geoscience data using fractal/multifractal models. Nat. Resour. Res. 2020, 29, 3–12. [Google Scholar] [CrossRef]
  61. Hu, P.; Yan, Q.S.; Ye, S.X.; Cao, H.J.; Ruan, K.; Long, Z.Q. Characteristics of Remobilization, Migration and Enrichment of Uranium Related to Intersection-Type Uranium Deposits: A case Study of the Hesi Area, Guangdong Province. Geol. Explor. 2020, 56, 478–490, (In Chinese with English Abstract). [Google Scholar]
  62. Cuney, M. Felsic magmatism and uranium deposits. Bull. De La Société Géologique De Fr. 2014, 185, 75–92. [Google Scholar] [CrossRef]
Figure 1. (a) Map of China (b) Geotectonic map of the Zhuguangshan granitic rock [36].
Minerals 14 00015 g001
Figure 2. Geological map of the study area.
Minerals 14 00015 g002
Figure 3. Workflow chart of the geo-electrochemical probe method [4].
Minerals 14 00015 g003
Figure 4. Known exploration line of the Shulouqiu uranium deposit.
Minerals 14 00015 g004
Figure 5. Box plots of (a) raw, (b) logarithmically transformed, and (c) ilr-transformed data sets of metallogenetic elements.
Minerals 14 00015 g005
Figure 6. Density curves of (a) logarithmically transformed and (b) ilr-transformed datasets of metallogenetic elements.
Minerals 14 00015 g006
Figure 7. Biplots of the PC1 and PC2 were obtained by the raw dataset with PCA (a) and logarithmically transformed dataset with PCA (b) and ILR-transformed dataset with PCA (c) and ILR-transformed dataset with RPCA (d).
Minerals 14 00015 g007
Figure 8. Geochemical association maps of the PC1 (a) using the raw data, (b) using logarithmically transformed data, (c) using ilr-transformed data PCA, and (d) RPCA using ilr-transformed data.
Minerals 14 00015 g008
Figure 9. Spectrum energy density (S) and area (A) plot.
Minerals 14 00015 g009
Figure 10. Geochemical association anomaly (a) and background (b) obtained by S-A model.
Minerals 14 00015 g010
Figure 11. Proposed prospecting prediction targets in the study area.
Minerals 14 00015 g011
Table 1. Statistical parameters of geo-electric chemistry element content (num = 241).
ParametersUThCoNiPbVTiMoAsSb
Raw dataMean value0.420.350.170.654.950.223.110.0120.170.08
Median0.240.270.130.523.420.182.480.0090.130.06
Mode0.080.090.120.351.500.161.080.0050.090.05
Min value0.030.070.050.280.770.071.010.0020.050.03
Max value6.231.622.864.9349.670.9511.790.1452.010.40
Coefficient of variation1.450.751.180.691.040.530.671.091.080.71
Skewness5.511.929.874.794.192.682.035.9545.613.26
Kurtosis41.704.41122.8935.8726.5410.844.2948.37843.3012.87
Standard deviation0.600.260.210.455.150.112.080.0130.190.06
Lg-dataSkewness0.610.191.561.270.590.710.660.501.341.16
Kurtosis0.67−0.425.642.380.440.850.041.332.741.66
Standard deviation0.370.290.220.200.310.180.240.290.260.21
Ilr-dataSkewness0.520.131.270.790.94−0.170.061.041.100.65
Kurtosis0.580.362.912.832.880.890.644.192.132.11
Standard deviation0.630.540.360.380.480.290.490.560.410.50
Note: The coefficient of variation is the ratio of the standard deviation to the mean value of the raw data; the mass fraction unit for all elements is 10−6.
Disclaimer/Publisher’s Note: The statements, opinions and data contained in all publications are solely those of the individual author(s) and contributor(s) and not of MDPI and/or the editor(s). MDPI and/or the editor(s) disclaim responsibility for any injury to people or property resulting from any ideas, methods, instructions or products referred to in the content.

