Article

Effects of Sec-Octanol and Terpineol on Froth Properties and Flotation Selectivity Index for Microcrystalline Graphite

1
Department of Mining Engineering, Shanxi Institute of Technology, Yangquan 045000, China
2
Shandong Polytechnic College, Jining 272067, China
3
Department of Mining Engineering, Balochistan University of Information Technology, Engineering and Management Sciences (BUITEMS), Quetta 87300, Pakistan
4
Key Laboratory of Coal Processing and Efficient Utilization (Ministry of Education), School of Chemical Engineering and Technology, China University of Mining and Technology, Xuzhou 221116, China
*
Authors to whom correspondence should be addressed.
Minerals 2023, 13(9), 1231; https://doi.org/10.3390/min13091231
Submission received: 22 August 2023 / Revised: 17 September 2023 / Accepted: 19 September 2023 / Published: 20 September 2023
(This article belongs to the Special Issue Recent Advances in Flotation Process)

Abstract

:
Microcrystalline graphite is a valuable non-metallic mineral that can be separated by flotation, a physico-chemical processing method that uses air bubbles to capture mineral particles. The size and stability of the bubbles, which depend on the type and amount of frother added, affect the flotation performance and the recovery of water from the froth layer. However, the effects of different types of frother on the froth properties and water recovery of microcrystalline graphite flotation are not well understood. In this study, two common frothers, sec-octanol and terpineol, were compared in terms of their effects on the bubble size, froth layer height, water recovery, and flotation selectivity index (SI) of microcrystalline graphite flotation. It was found that sec-octanol produced smaller bubbles than terpineol, but also a slightly lower froth layer height. The water recovery was higher with sec-octanol than with terpineol. The SI values were similar for both frothers, indicating comparable flotation performance. This study revealed the differences between sec-octanol and terpineol in terms of their effects on the froth properties and water recovery of microcrystalline graphite flotation. These findings can help optimize the choice and dosage of frother for this important mineral processing method.

1. Introduction

As a strategic non-metallic mineral resource, graphite is widely used in high-end manufacturing, emerging energy technologies (nuclear energy, solar batteries), new energy vehicles (batteries), advanced materials (heat conduction materials, heat radiation materials, graphene), and environmental applications [1,2]. In recent years, several nations, including China, Japan, the European Union, India, the United Kingdom, and Australia, have developed industrial policies aimed at graphite development, designating it a “strategic mineral” or a “key mineral” because of its critical importance. The United States has also categorized graphite as a “crisis mineral”. In addition, graphite is considered indispensable to the development of new energy vehicles worldwide [3]. Graphite consumption has increased significantly due to the rapid advancement of emerging industries that utilize graphite as a primary resource, escalating from 599.4 thousand tons in 2012 to 1125.8 thousand tons in 2022. By 2030, the proportion of graphite consumption is predicted to reach approximately 50% in the new energy sector. Thus, it is imperative to intensify efforts to explore graphite reserves and improve mining management practices, given the rapid escalation in demand for premium graphite. Furthermore, the rapid development of graphite’s deep processing technology should be actively promoted, aiming to meet the demands of emerging industries. This holds significant importance in improving the sustainable growth of the graphite industry.
Natural graphite is commonly divided into two categories: crystalline graphite, often referred to as flake graphite, and microcrystalline graphite, also known as earthy graphite. With the continuous progress of science and technology, as well as the increasing consumption of large flake graphite resources, the demand for micro-fine graphite resources has increased. Flotation is one of the most common methods of processing microcrystalline graphite because it is naturally floatable [4,5].
Flotation, a separation method, is, in essence, the use of hydrophobic minerals to adhere to a bubble’s surface; then, the formation of mineralized bubbles rises up to the surface of the liquid, aggregated into a mineralized froth layer, from which the froth products (hydrophobic minerals) and tailings (hydrophilic minerals) can be obtained [6]. The flotation process occurs within a three-phase system, comprising gas, liquid, and solid components, as is evident from its definition. In this method, the air bubble serves as a carrier for hydrophobic mineral particles, as well as an interface for the selective separation of minerals. Thus, the characteristics of the air bubble play a significant role in mineral flotation process execution and separation efficiency. After being treated with a regulator and collector, the minerals’ surface properties meet flotation requirements. If a large number of bubbles with strong performance are present in the slurry at this stage, it allows for the smooth flotation of hydrophobic minerals. Therefore, the quality of flotation is closely connected to the characteristics of the bubbles and the performance of the frother. In the evolution of mineral processing history, the recognition and utilization of the frother and its role are synchronized with the collector. The frother, however, has received comparatively less attention than the collector.
Bubble size is an important factor that affects the flotation performance of mineral particles [7]. It influences the probability of collision between the mineral particles and bubbles, the flotation rate, the recovery of floatable mineral, the carrying capacity of bubbles, the flotation selectivity, and the processing capacity of the flotation system [7]. Frothers are added to the flotation system to reduce the surface tension at the air-liquid interface and facilitate the generation of air bubbles in the slurry. The air bubbles are dispersed into small sizes by the agitation and turbulence of the slurry [8,9]. Frothers are essential reagents in flotation processes because they stabilize the gas-liquid interface and produce a large amount of medium-sized froth, forming the three-phase froth that consists of gas, liquid, and solid components. For mineral flotation, flotation mineralization froth is formed [10]. Frothers have a strong adsorption capacity at the air-water interface. An excellent frother generally does not adsorb onto the mineral surface. Most frothers can greatly reduce the surface tension of water, increase the dispersion of air in the slurry, and alter the size of the bubbles in the slurry [11].
The structure and chemical properties of frothers can cause them to combine with varying numbers of water molecules within bubbles, resulting in different levels of water recovery with the froth. The primary reason for water recovery with the froth is the hydration between the polar group of the frother molecule and the surrounding water dipoles, which attracts water molecules to the surface of the bubble to form a liquid film. Furthermore, the surface activity of frothers, froth stability, and water recovery are all interrelated [12]. In the flotation tests, the bubble size is much larger when the frother concentration is lower, and the bubble coalescence is an important factor in determining the bubble size. The phenomenon of bubble coalescence is prevented when the frother concentration exceeds the critical coalescence concentration. Therefore, under dynamic conditions, foam stability is determined by bubble coalescence [13,14]. The coalescence behavior of two adjacent air bubbles in aqueous solutions was recorded using a high-speed video imaging system. It was concluded that there was a positive correlation between the bubble coalescence time and the surface activity and concentration of the frother [15]. In a two-phase system, foam stability is determined by the stability of the thin film separating the bubbles. However, in a three-phase system, the presence and surface properties of solid particles also play a role in determining froth stability [16]. The majority of froth stability studies have been conducted on two-phase systems, with comparatively few investigations on three-phase systems.
In graphite flotation, sec-octanol and terpineol are commonly used as frothers [17]. Sec-octanol, an alcohol-type frother, is characterized by its hydroxyl (-OH) functional group. Terpineol, also known as 2# oil, contains α, β, and γ-terpene alcohol as its active components. Industrial applications have demonstrated that terpineol exhibits superior flotation performance compared to natural pine oil, leading to its widespread use. In view of the considerable influence of a frother on the froth properties, previous studies have shown that frother concentration is extremely important in effecting the froth properties. Therefore, the effects of sec-octanol and terpineol on the froth properties and water recovery of microcrystalline graphite flotation have yet to be investigated.
Generally, the flotation rate of hydrophobic particles is determined by the frother, the effect of which should be thought of with the kinetic response of the flotation process [9]. In batch flotation processes, cumulative recovery, as a function of flotation time, is used to describe the flotation kinetic results. The classical first-order kinetic model is frequently employed to assess the effects of various factors, such as flotation operation parameters and emulsified reagents, on mineral flotation performance [18]. The flotation reaction rate constant (K) and ultimate recovery (R) can be obtained by fitting the first-order kinetic model with the flotation test data. These two parameters are used to evaluate the effect of variables on the flotation process [19]. However, it is difficult to compare model parameters between experiments or to establish a trend in K and R under different conditions by this method. Thus, the modified rate constant (Km), defined as the product of K and R, is proposed. The selectivity index (SI) can be defined as the ratio of Km between mineral I and mineral II [20]. K and R were considered comprehensively in the calculation of SI, so it is a useful index for comparative evaluations of the effects of various factors on the flotation process. The SI index has been widely employed to evaluate the flotation performance [21,22]. Thus, SI is well employed to analyze the effect of the frother on the graphite flotation process in this work.
This study investigates the impact of two types of frothers, sec-octanol and terpineol, on the flotation froth properties of graphite, including bubble size, froth layer height, water recovery, and SI. The study also explores the differences in how these two frothers affect graphite flotation.

2. Materials and Methods

2.1. Materials and Reagents

Graphite ore with an ash content of 14.31% was acquired from Hunan Province, China. The graphite was homogenized and riffled, and then the graphite was mixed and divided to prepare the sample for subsequent tests. Kerosene (with a density of 0.8 g·cm−3) was obtained from a local petrol station, while sec-octanol (AR, with a density of 0.83 g·cm−3) and terpineol (the density of 0.94 g·cm−3) were procured from the Sinopharm Group.

2.2. Characterization Methods

The graphite was characterized using X-Ray diffraction (D8 Advance, Bruker Company, Karlsruhe, Germany). The XRD measurement was performed with a Cu Kα radiation source at 40 kV and 40 mA, a wide-angle diffraction scanning range of 5°–85°, and a scanning rate of 8°/min. The surface morphology and element distribution of graphite were examined using an SEM (FIB-SEM, Helios G4 CX, Thermo Fisher Scientific, Hillsboro, OR, USA), operated at an accelerating voltage of 10.0 kV and a current of 5.5 nA.

2.3. Flotation Tests

Graphite flotation rate experiments were carried out using a 0.5 L flotation machine (RK/FD II-0.5, Wuhan Rock Grinding Equipment Manufacturing Co., Ltd., Wuhan, China). Kerosene was used as the collector, while sec-octanol and terpineol were used as the frothers. The flotation experiments were performed with a slurry concentration of 60 g/L, an impeller speed of 2000 r/min, and an aeration rate of 250 L/h. The flotation rate experiments were conducted as follows: First, 30 g of graphite and a certain amount of tap water were put into the beaker, and then mixed with a glass rod. The slurry was then poured into the flotation cell, and some extra tap water was added to reach the first marking line (at a volume of 0.3 L) of the flotation cell. The flotation machine was turned on, and the slurry was stirred for 3 min. After this, 4800 g/t of kerosene was added, and the slurry was mixed for 2 min. The frother was then added, and the slurry was stirred for an additional 20 s. More tap water was added to reach the second marking line (at a volume of 0.5 L), and, after stirring for 10 s, the aeration switch was opened. After 10 s of aeration, the froth concentrate was collected. At the same time, the bubble size, from the top of the froth, and froth layer height, from the side of the froth, were immediately photographed. The concentrates J1, J2, and J3 were collected at different time intervals (0–1 min, 1–3 min, 3–6 min). At the end of the experiment, all collected concentrates and tailings were filtered, dried, weighed, and then their grades, i.e., their ash contents, were analyzed. Tap water was added during each experiment to maintain a constant liquid level in the flotation cell.

2.4. Flotation Calculations

2.4.1. Bubble Size

ImageJ 1.46r (National Institute of Mental Health, Bethesda, MD, USA) was used to measure the bubble size. Four froth images were taken for each different product of every test condition, and the bubble size was determined by randomly counting either 100 bubbles (J1, J2) or 50 bubbles (J3) in each image. A cumulative distribution curve of bubble sizes was then constructed, from which the bubble size d50 was derived. This d50 value was used to compare the bubble sizes of various products for each test condition.

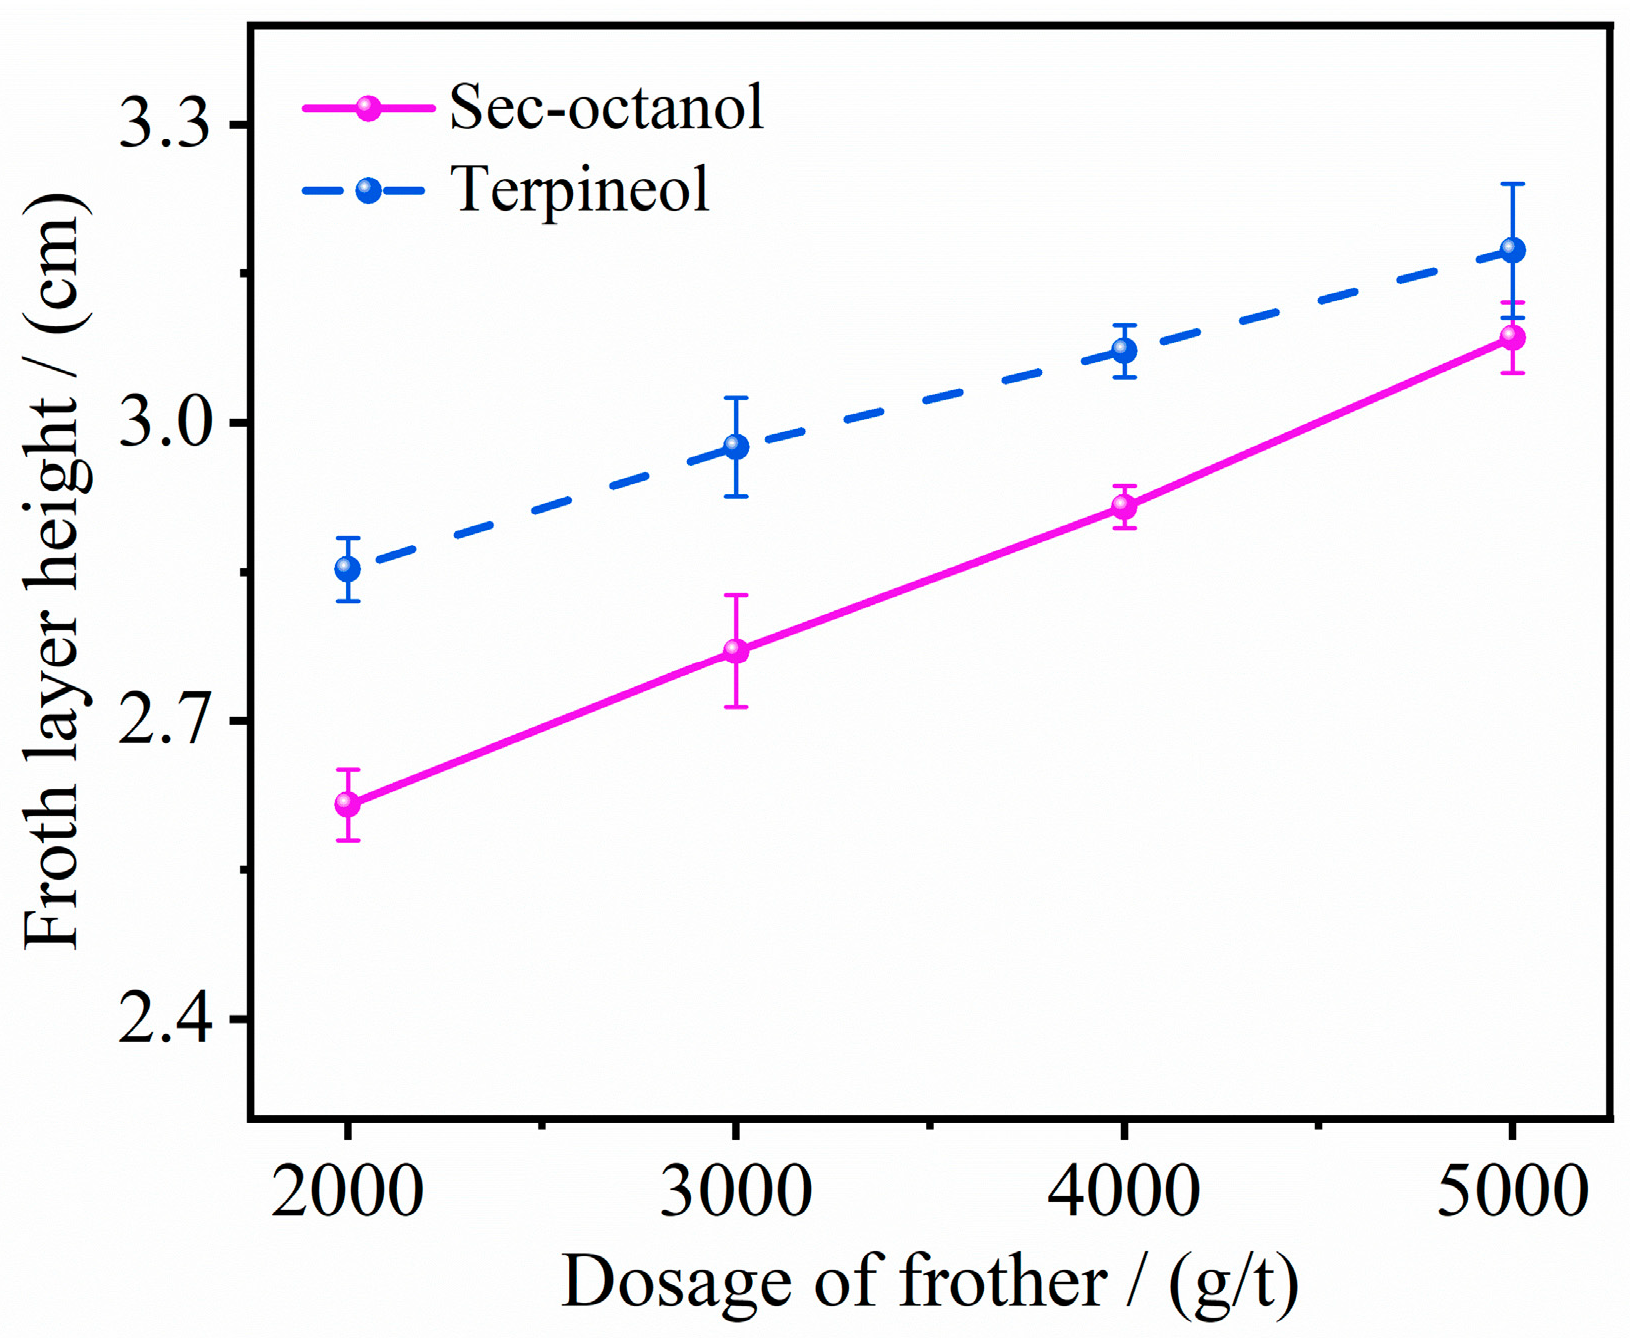
2.4.2. Froth Layer Height

To distinguish between the flotation level and the froth layer easily, the brightness/contrast of the images of the photographed froth layer heights was adjusted using ImageJ software. The froth layer height under each test condition was measured proportionally based on the scale line on the flotation tank.

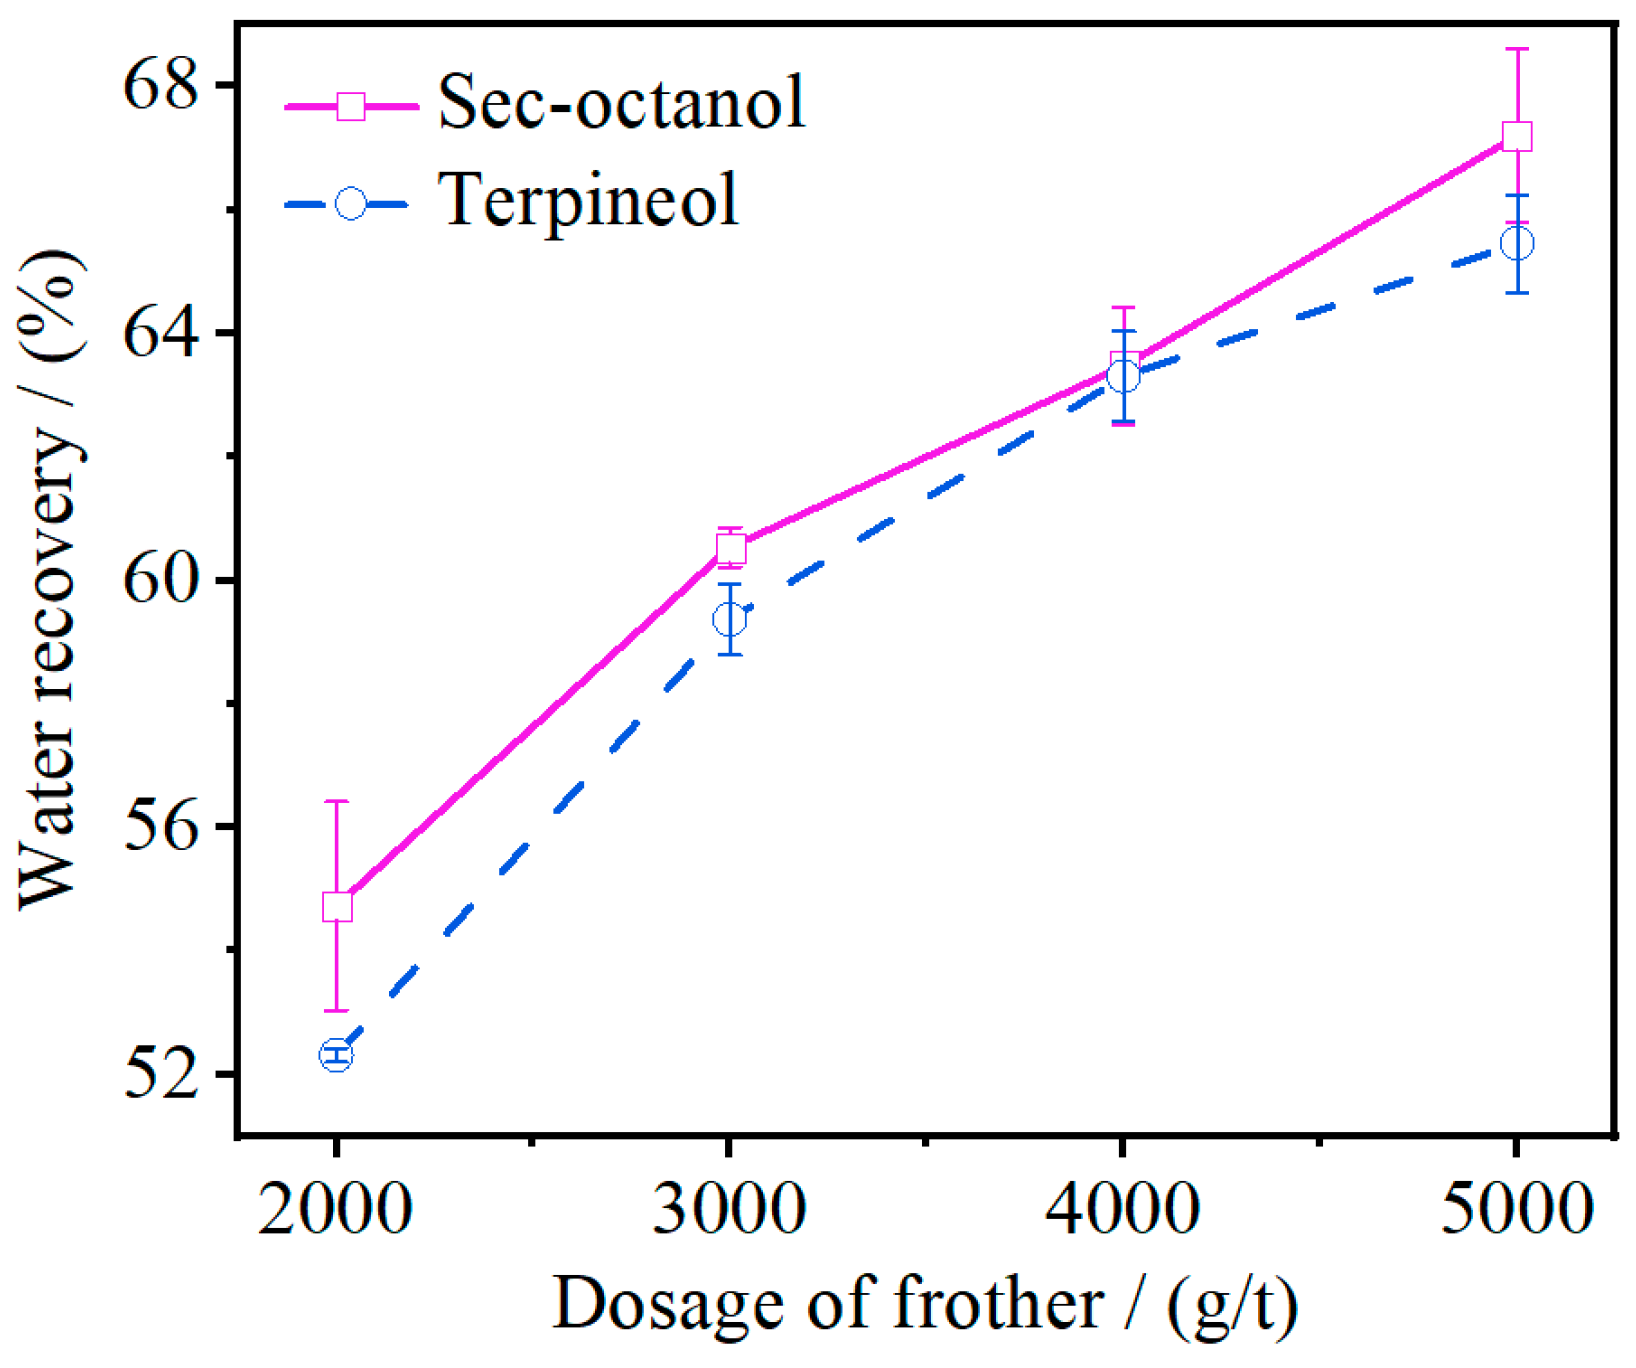
2.4.3. Water Recovery Calculation

To determine the water recovery (Rw, %), the mass of an empty basin (m1) and the mass of a basin containing the froth product (m2) were measured. The mass of a washing bottle filled with water before and after use was also recorded, denoted as m3 and m4, respectively. The froth product was then dried, and the dry concentrate was weighed to obtain its mass (m5). The water recovery was then calculated as given in Equation (1):
R w = m 2 m 1 ( m 3 m 4 ) m 5 500 × 100

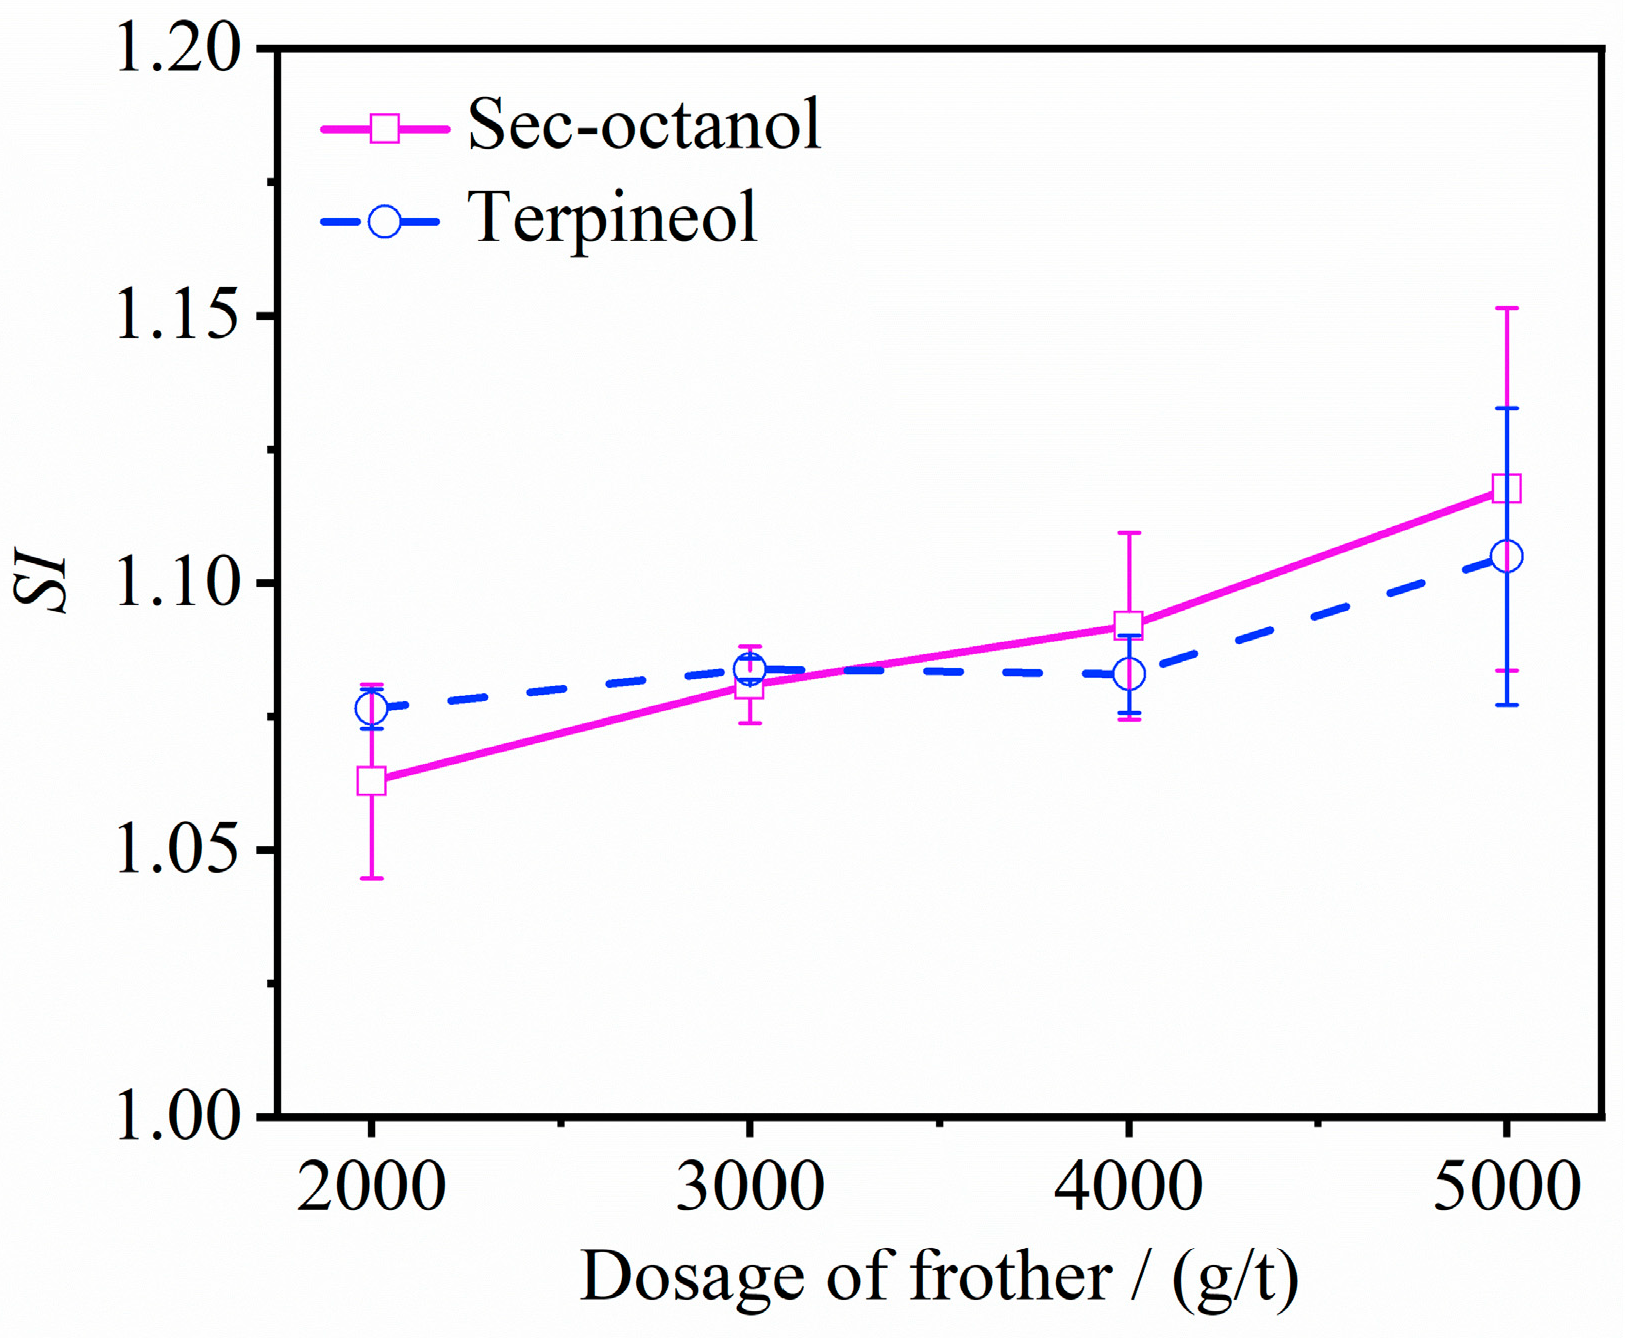
2.4.4. SI Calculation

The expression of the classical first-order kinetic model is provided in Equation (2) [23]:
R = R ( 1 e K t )
where R is the recovery of combustible materials or ash materials (%), R denotes the ultimate recovery of combustible materials or ash materials (%), t is the cumulative flotation time (min), and K refers to the first-order rate constant (min−1). MATLAB R2022a (Mathworks, Natick, MA, USA) was used to obtain R and K by fitting a first-order kinetic model to the flotation experiment results, with the accuracy of the fitted results evaluated using the coefficient of determination (R2). An R2 value greater than 0.8 indicated that Equation (2) was suitable for fitting the flotation results.
Km was calculated as given in Equation (3) [20]:
K m = ( R K ) / 100
The value of SI was calculated using Equation (4) [20]:
S I ( Ι / Ι Ι ) = K m   of   mineral   Ι K m   of   mineral   Ι Ι
where mineral Ι and ΙΙ denote the combustible materials and the ash materials in the flotation concentrate, respectively. A higher value of SI indicates a better flotation selectivity.
The recovery of combustible materials (Rc) and ash materials (Ra) for flotation concentrate were calculated using Equations (5) and (6), respectively:
R c = γ c ( 100 A c ) 100 A f
R a = γ c A c A f
where γc is the yield of flotation concentrate (%), and Af and Ac refer to the ash content of the feed material and flotation concentrate, respectively (%).

3. Results and Discussion

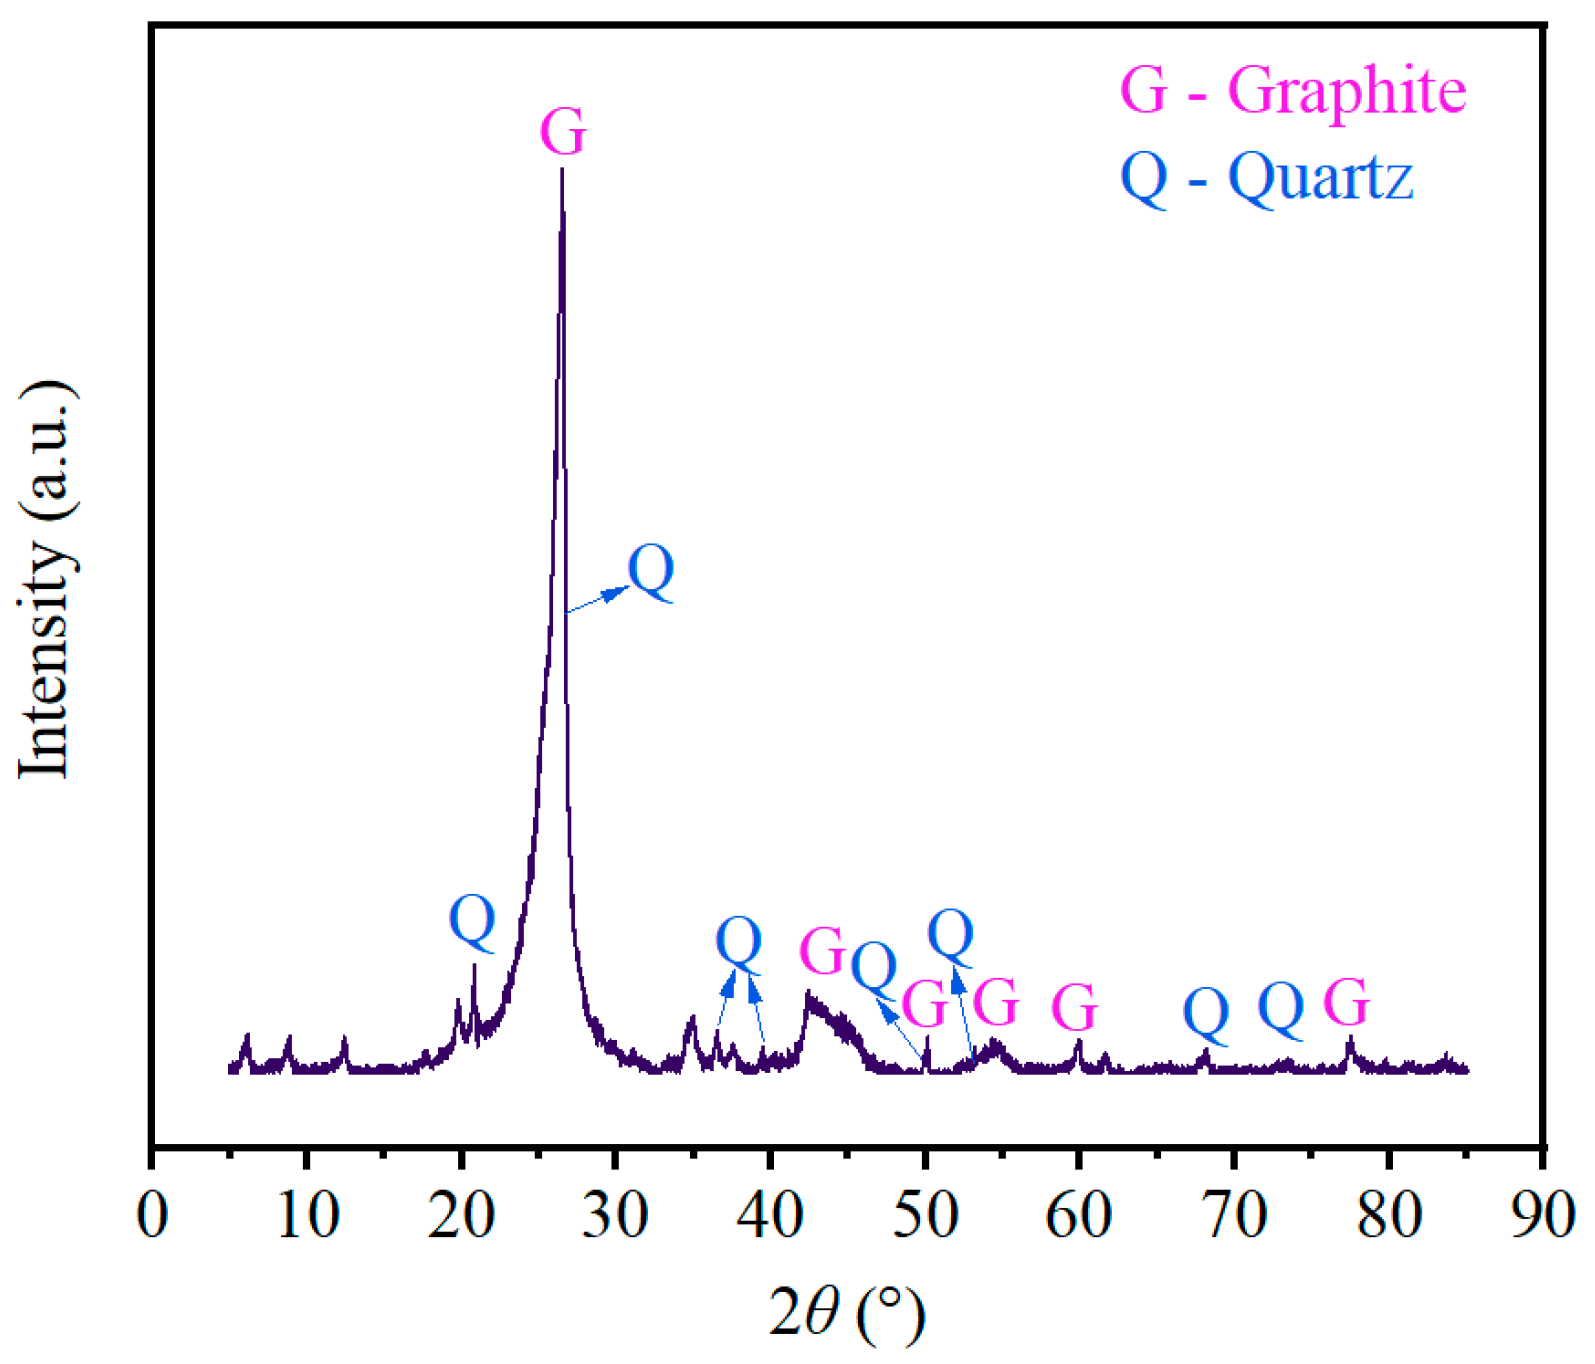
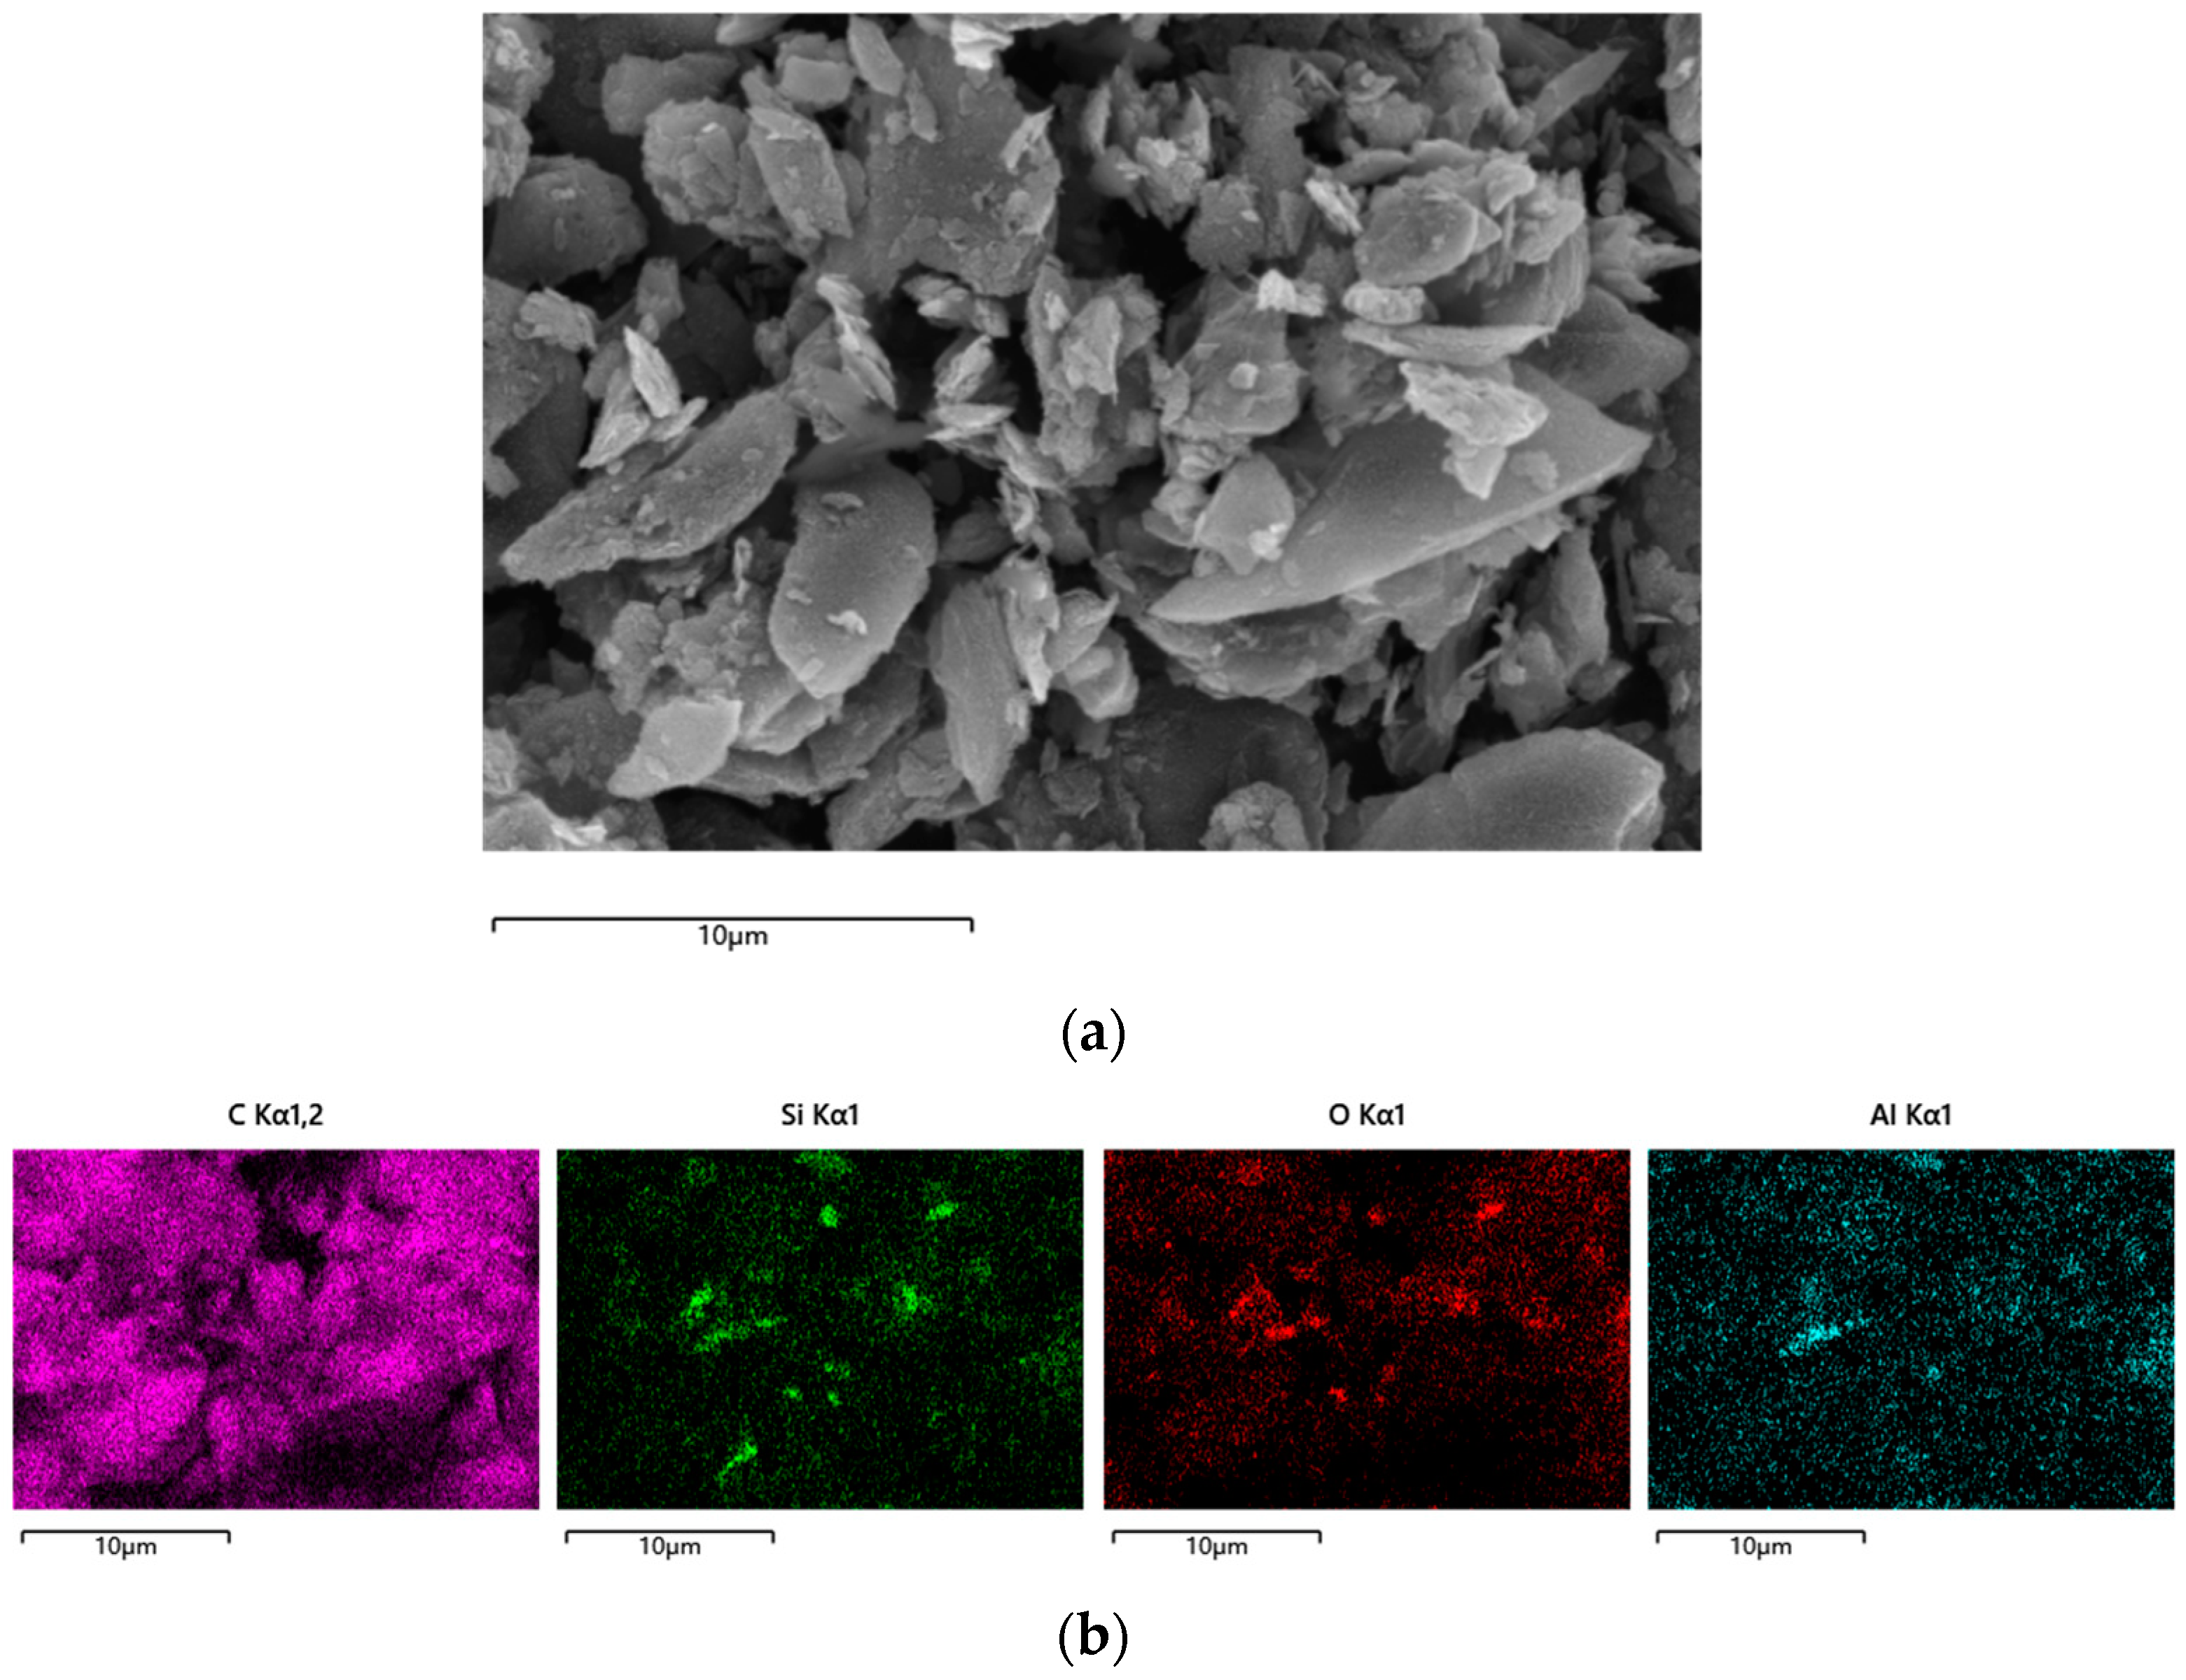
3.1. Characterization of Raw Graphite

The XRD pattern of raw graphite is shown in Figure 1. It shows that quartz was the predominant gangue mineral in the graphite. Figure 2b shows an EDS image, which revealed the presence of Si, Al, O, and C elements, indicating that the gangue minerals consisted of quartz and some clay minerals with an Al element. This graphite sample and the graphite used in the published paper were taken from the same mining area, so the elemental composition of the impurity minerals in the graphite was consistent. From the published paper, it can be found that the main impurity minerals were SiO2 and Al2O3 [24]. Figure 2 also illustrates that the gangue minerals had an ultrafine size and were embedded in the graphite.

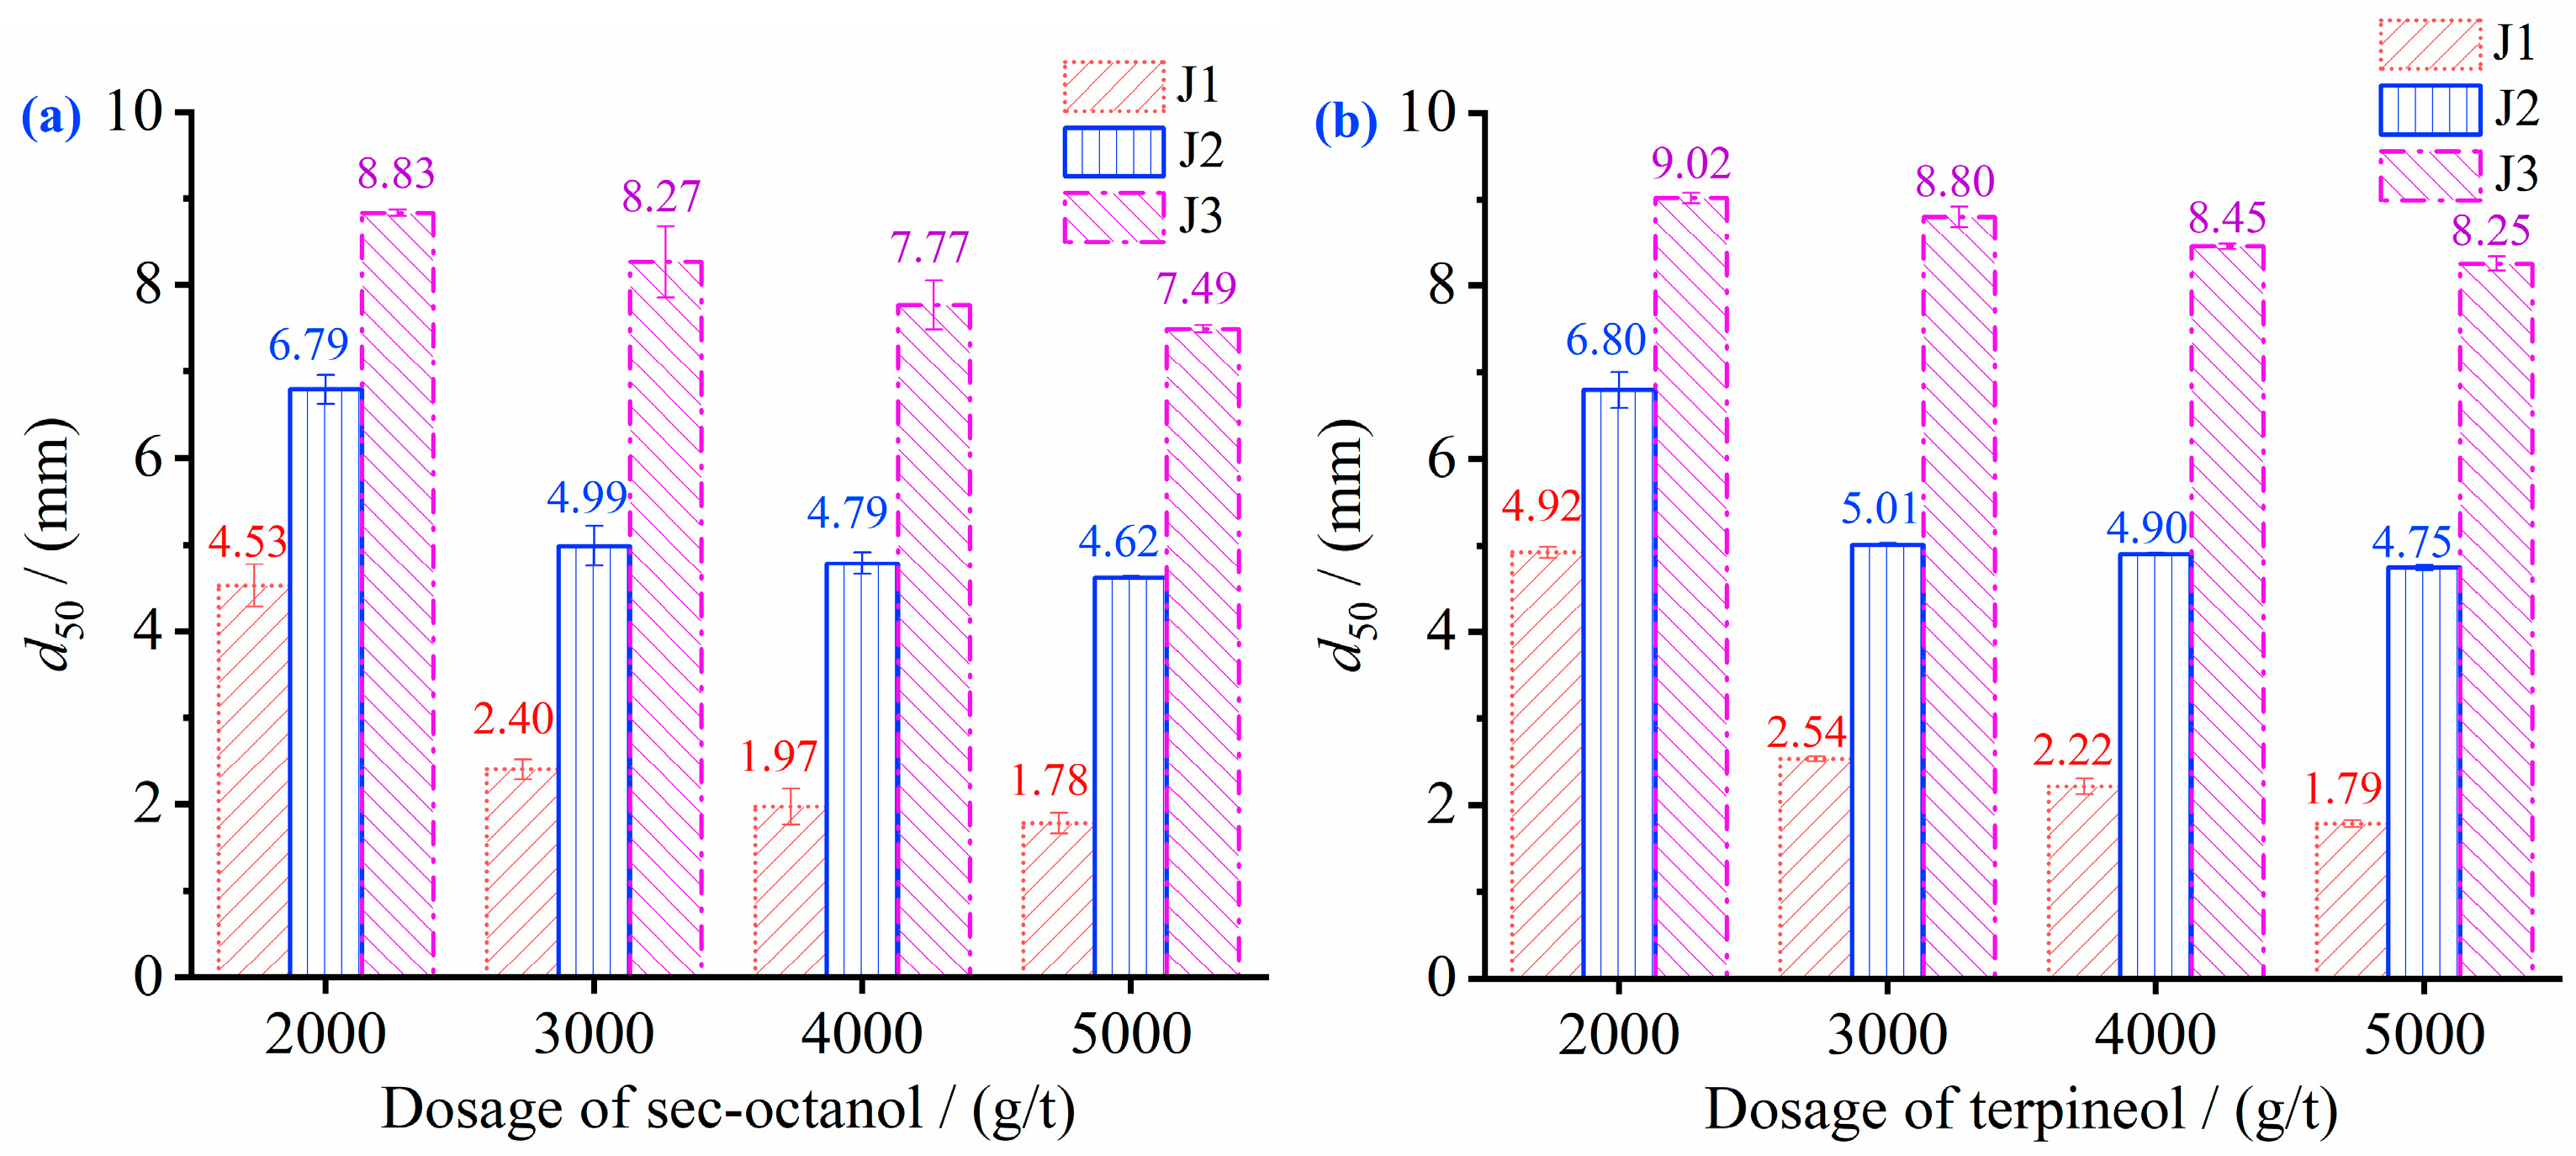
3.2. Effect of Frother on the Bubble Size and Froth Layer Height

The bubble sizes (d50) of the three froth concentrate products (J1, J2, and J3) under different amounts of frother are shown in Figure 3. As can be seen in Figure 3a, the d50 of J1, J2, and J3 demonstrated a decreasing trend with increasing sec-octanol dosages. At a sec-octanol dosage of 2000 g/t, the d50 values of J1, J2, and J3 were much higher than at other dosages. When the dosage of sec-octanol increased from 2000 g/t to 3000 g/t, the d50 values of J1, J2, and J3 decreased sharply. When the dosage of sec-octanol increased from 3000 g/t to 5000 g/t, the d50 values of J1, J2, and J3 decreased slightly. This implied that the bubble size of the froth concentrate would not change significantly with a further increase in the dosage of sec-octanol. From Figure 3b, it is observed that the d50 values of J1, J2, and J3 decreased as the dosage of terpineol increased. The overall trend was similar to that of sec-octanol, which also indicated that the bubble size of the froth concentrate would not reduce significantly with a further increase of terpineol dosage.
One possible reason for the smaller bubble size of the froth concentrate with a higher dosage of frother was that frother, as a surfactant, lowered the surface tension of the liquid and facilitated small bubble formation [25]. Another possible reason for the smaller bubble size of the froth concentrate with a higher dosage of frother was that the frother stabilized the bubbles and prevented them from coalescing. This resulted in a mineralized froth layer on the surface of the slurry and a reduced bubble size [26].
When frother concentration is higher than the critical coalescence concentration, bubble coalescence can be prevented; with a continued increase of the frother concentration, the prevention action was not enhanced, so the bubble size did not decrease further, as shown by the results of the two-phase foam [13]. For three-phase froth, the prevention action of bubble coalescence was not enhanced by the increased frother concentration with a further increase of the frother dosage. This resulted in a smaller decrease in the bubble size.
From the comparison of Figure 3a,b, it is found that the d50 values of the froth concentrate products with sec-octanol were smaller than those with the terpineol. The molecular structure of the frother mainly affects its foaming properties. The polar group of the frother determines its solubility, and the non-polar group is pushed out by the water molecules’ cohesion in the water. This makes the frother quickly enriched at the gas-liquid interface, exhibiting its foaming ability. For the frother with chain structures, adding one carbon atom to the non-polar group can increase the surface activity by 3.14 times [16]. The molecular structures of sec-octanol (C8H18O) and terpineol (C10H18O) used in the study are shown In Figure 4. From Figure 4, it can be seen that sec-octanol contains 8 carbon atoms, and its non-polar group is a chain structure, while terpineol has 10 carbon atoms, but its molecular structure contains a six-membered ring, which makes its surface activity lower than that of sec-octanol. This suggests that the foaming properties of sec-octanol are better than that of terpineol. This explains why the d50 values of the froth concentrate products with sec-octanol were smaller than those with terpineol.
In addition, from Figure 3a,b, it can also be found that, under the same dosage of frother, the size relationship of d50 of J1, J2, and J3 was J1 < J2 < J3. This is because the floated minerals became denser with the extension of the flotation time; when the density of the floated minerals increases, the size of the air bubbles should increase as well [11].
The relationship between the froth layer height of the froth concentrate product J1 and the dosage of the frother is given in Figure 5. As can be seen from Figure 5, the froth layer height increased with the increase of the frother dosage (sec-octanol and terpineol). This suggested that more bubbles were produced, and a thicker froth layer was formed in the flotation cell with a higher frother dosage under the same aeration, capturing more minerals in the froth layer and report to the froth concentrate. The froth layer height of J1 was slightly different when the amounts of sec-octanol and terpineol were the same; terpineol had a slightly higher froth layer height than sec-octanol. This might be due to the slightly larger bubble size of terpineol, as shown in Figure 3, which resulted in a slightly higher froth layer height of J1 in the graphite flotation process with terpineol.

3.3. Effect of Frother on the Flotation Performance of Graphite

3.3.1. Water Recovery

The variation of water recovery versus different dosages of frother throughout the graphite flotation process is shown in Figure 6. As shown in Figure 6, the water recovery increased with the increase of frother dosage. This was consistent with the conclusion of Wiese et al., who studied the effect of frother type and dosage on flotation performance in the presence of high-depressant concentrations [27]. The increase in water recovery could be explained by the bubbles’ size. As the amount of frother increased, the bubble size decreased, thereby increasing the number of bubbles that could fit in the cross-section of the flotation tank, making the froth more stable. This increased the amount of water that was carried between the bubbles that entered the froth layer, leading to an increase in the water recovery during the flotation process [12]. Moreover, the frother dosage also affected the volume of froth, which increased with the increase of the frother dosage. As the flotation process continued, the frother concentration in the slurry decreased, and the excess frother produced more froth. However, less minerals were floated in the later stages of flotation, while most of the froth with water was scraped out, resulting in an increase in the water recovery. The water recovery with sec-octanol was slightly higher than that with terpineol, because sec-octanol produced smaller bubbles in the froth layer, which carried slightly more water than terpineol.
It can also be observed from Figure 6 that the water recovery increased significantly when the frother dosage was increased from 2000 g/t to 3000 g/t. This was because the increase in frother dosage made the froth volume in the froth layer grow considerably during the effective flotation stage. However, the water recovery increased less when the frother dosage increased from 3000 g/t to 4000 g/t, and then to 5000 g/t. The reason was that the flotation time was fixed under different test conditions, and most of the flotation concentrates were floated out during the effective flotation stage. After that, the water recovery was only related to the residual frother in the slurry and the flotation time.

3.3.2. Selectivity Index (SI)

The variation rule of SI value with the amount of frother is shown in Figure 7. As shown in Figure 7, with the increase of the amount of frother, the overall SI values under the conditions of both sec-octanol and terpineol illustrated an increasing trend, while the increase was not significant. Moreover, the difference in SI values between sec-octanol and terpineol was negligible. This could be attributed to the presence of micro-fine gangue minerals embedded in the raw graphite, as revealed by the SEM-EDS analysis in Figure 2. As the graphite ore was not ground before the flotation in this study, the graphite ore was not fully liberated. Hence, the improvement or variation in the flotation selectivity for graphite under the different types and dosages of frother were shown less during the direct flotation process. To address this issue, and considering the physical properties of the graphite ore, it is suggested that the graphite ore, embedded with micro-fine gangue minerals, should be processed by grinding or deep-grinding before flotation, in order to liberate the minerals from one another, thereby enhancing the flotation selectivity of the target minerals [28,29,30].
The results of Rc, Ra, K,and R of sec-octanol and terpineol were provided in the Supplementary Materials.

4. Conclusions

This study focused on the effects of sec-octanol and terpineol on the bubble size, froth layer height, water recovery, and SI during the flotation of graphite. The main findings drawn from this study are as follows.
(1) The d50 values of J1, J2, and J3 tended to decrease as the amount of frother increased. When the amount of frother was larger than 3000 g/t and the amount continued to increase, the decrease in the d50 of J1, J2, and J3 became slower. The d50 values of J1, J2, and J3 obtained using sec-octanol were smaller than those obtained using terpineol.
(2) The froth layer height showed a tendency to increase with the increase of the frother dosage. In the case of equivalent dosages of reagents, terpineol produced a slightly higher froth layer height than sec-octanol.
(3) As the amount of frother increased, the water recovery gradually rose. Terpineol resulted in a lower water recovery than sec-octanol.
(4) The SI value increased slightly with the increase of frother dosage, but the difference between sec-octanol and terpineol was negligible. To improve this situation, grinding or deep-grinding the graphite ore could be used to achieve the liberation of target minerals and gangue minerals, which would enhance the flotation selectivity of target minerals.

Supplementary Materials

The following supporting information can be downloaded at: https://www.mdpi.com/article/10.3390/min13091231/s1, Table S1: The results of Rc, Ra, K, and R for sec-octanol; Table S2: The results of repeated tests of Rc, Ra, K, and R for sec-octanol; Table S3: The results of Rc, Ra, K, and R for terpineol; Table S4: The results of repeated tests of Rc, Ra, K, and R for terpineol.

Author Contributions

Conceptualization, methodology, software, investigation, resources, X.B.; validation, formal analysis, data curation, writing—original draft preparation, X.W. and Y.W.; writing—review and editing, J.Z. and M.B.; visualization, supervision, project administration, funding acquisition, X.W. All authors have read and agreed to the published version of the manuscript.

Funding

This work was supported by the Science and technology project of Shanxi Institute of Technology (No. 2022QD-05).

Data Availability Statement

Not applicable.

Acknowledgments

The authors wish to sincerely thank Xinnan Hu for his valuable contributions to this work.

Conflicts of Interest

The authors declare no conflict of interest.

References

  1. Rui, X.; Geng, Y.; Sun, X.; Hao, H.; Xiao, S. Dynamic material flow analysis of natural graphite in China for 2001–2018. Resour. Conserv. Recycl. 2021, 173, 105732. [Google Scholar] [CrossRef]
  2. Natarajan, S.; Divya, M.L.; Aravindan, V. Should we recycle the graphite from spent lithium-ion batteries? The untold story of graphite with the importance of recycling. J. Energy Chem. 2022, 71, 351–369. [Google Scholar] [CrossRef]
  3. Vasumathi, N.; Sarjekar, A.; Chandrayan, H.; Chennakesavulu, K.; Reddy, G.R.; Vijaya Kumar, T.V.; El-Gendy, N.S.; Gopalkrishna, S.J.; Meshram, P. A Mini Review on Flotation Techniques and Reagents Used in Graphite Beneficiation. Int. J. Chem. Eng. 2023, 2023, 1–15. [Google Scholar] [CrossRef]
  4. Xie, W.; Zhu, X.; Yi, S.; Kuang, J.; Cheng, H.; Tang, W.; Deng, Y. Electromagnetic absorption properties of natural microcrystalline graphite. Mater. Des. 2016, 90, 38–46. [Google Scholar] [CrossRef]
  5. Jin, M.; Xie, G.; Xia, W.; Peng, Y. Flotation Optimization of Ultrafine Microcrystalline Graphite Using a Box-Behnken Design. Int. J. Coal Prep. Util. 2016, 38, 281–289. [Google Scholar] [CrossRef]
  6. Gao, J.; Tong, Z.; Bu, X.; Bilal, M.; Hu, Y.; Ni, C.; Xie, G. Effect of water-in-oil and oil-in-water with Span 80 on coal flotation. Fuel 2023, 337, 127145. [Google Scholar] [CrossRef]
  7. Wang, H.; Yang, W.; Yan, X.; Wang, L.; Wang, Y.; Zhang, H. Regulation of bubble size in flotation: A review. J. Environ. Chem. Eng. 2020, 8, 104070. [Google Scholar] [CrossRef]
  8. Gupta, A.K.; Banerjee, P.K.; Mishra, A.; Satish, P. Effect of alcohol and polyglycol ether frothers on foam stability, bubble size and coal flotation. Int. J. Miner. Process. 2007, 82, 126–137. [Google Scholar] [CrossRef]
  9. Saavedra Moreno, Y.; Bournival, G.; Ata, S. Classification of flotation frothers—A statistical approach. Chem. Eng. Sci. 2022, 248, 117252. [Google Scholar] [CrossRef]
  10. Huang, Q.; Yang, X.; Honaker, R.Q. Evaluation of Frother Types for Improved Flotation Recovery and Selectivity. Minerals 2019, 9, 590. [Google Scholar] [CrossRef]
  11. Zhang, J.; Que, X. Mining Reagents; Metallurgical Industry Press: Beijing, China, 2008. [Google Scholar]
  12. Khoshdast, H.; Hassanzadeh, A.; Kowalczuk, P.B.; Farrokhpay, S. Characterization Techniques of Flotation Frothers—A Review. Miner. Process. Extr. Metall. Rev. 2022, 44, 77–101. [Google Scholar] [CrossRef]
  13. Cho, Y.-S.; Laskowski, J. Effect of flotation frothers on bubble size and foam stability. Int. J. Miner. Process. 2002, 64, 69–80. [Google Scholar] [CrossRef]
  14. Grau, R.A.; Laskowski, J.S.; Heiskanen, K. Effect of frothers on bubble size. Int. J. Miner. Process. 2005, 76, 225–233. [Google Scholar] [CrossRef]
  15. Deng, l.; Li, G.; Cao, Y.; Wang, J.; Ran, J. Effect of flotation frothers on bubbles coalescence behavior. J. China Univ. Min. Technol. 2017, 46, 410–414. [Google Scholar]
  16. Laskowski, J.S. Frothers and Flotation Froth. Miner. Process. Extr. Metall. Rev. 1993, 12, 61–89. [Google Scholar] [CrossRef]
  17. Qiu, Y.; Mao, Z.; Sun, K.; Zhang, L.; Qian, Y.; Lei, T.; Liang, W.; An, Y. Understanding the Entrainment Behavior of Gangue Minerals in Flake Graphite Flotation. Minerals 2022, 12, 1068. [Google Scholar] [CrossRef]
  18. Wang, Y.; Wang, X.; Bilal, M. Recovery of carbon and cryolite from spent carbon anode slag of electrolytic aluminum by flotation based on the evaluation of selectivity index. Front. Chem. 2022, 10, 1025990. [Google Scholar] [CrossRef]
  19. Lynch, A.J.; Johnson, N.; Manlapig, E.; Thorne, C. Mineral and Coal Flotation Circuits: Their Simulation and Control; Elsevier: Amsterdam, The Netherlands, 1981. [Google Scholar]
  20. Xu, M. Modified flotation rate constant and selectivity index. Miner. Eng. 1998, 11, 271–278. [Google Scholar] [CrossRef]
  21. Vapur, H.; Bayat, O.; Uçurum, M. Coal flotation optimization using modified flotation parameters and combustible recovery in a Jameson cell. Energy Convers. Manag. 2010, 51, 1891–1897. [Google Scholar] [CrossRef]
  22. Marion, C.; Jordens, A.; Li, R.; Rudolph, M.; Waters, K.E. An evaluation of hydroxamate collectors for malachite flotation. Sep. Purif. Technol. 2017, 183, 258–269. [Google Scholar] [CrossRef]
  23. Sokolović, J.; Miskovic, S. The effect of particle size on coal flotation kinetics: A review. Physicochem. Probl. Miner. Process. 2018, 54, 1172–1190. [Google Scholar]
  24. Bu, X.; Tong, Z.; Bilal, M.; Ren, X.; Ni, M.; Ni, C.; Xie, G. Effect of ultrasound power on HCl leaching kinetics of impurity removal of aphanitic graphite. Ultrason. Sonochemistry 2023, 95, 106415. [Google Scholar] [CrossRef] [PubMed]
  25. Shijie, Z.; Wenli, L.; Shukai, Z.; Zongyi, Y. Bubble size distribution rules in flotation cell. J. China Coal Soc. 2015, 40, 445–449. [Google Scholar]
  26. Grau, R.A.; Heiskanen, K. Bubble size distribution in laboratory scale flotation cells. Miner. Eng. 2005, 18, 1164–1172. [Google Scholar] [CrossRef]
  27. Wiese, J.; Harris, P. The effect of frother type and dosage on flotation performance in the presence of high depressant concentrations. Miner. Eng. 2012, 36–38, 204–210. [Google Scholar] [CrossRef]
  28. Lu, X.; Forssberg, E. Flotation selectivity and upgrading of woxna fine graphite concentrate. Miner. Eng. 2001, 14, 1541–1543. [Google Scholar] [CrossRef]
  29. Aslan, N.; Cifci, F.; Yan, D. Optimization of process parameters for producing graphite concentrate using response surface methodology. Sep. Purif. Technol. 2008, 59, 9–16. [Google Scholar] [CrossRef]
  30. Wang, X.; Bu, X.; Alheshibri, M.; Bilal, M.; Zhou, S.; Ni, C.; Peng, Y.; Xie, G. Effect of scrubbing medium’s particle size distribution and scrubbing time on scrubbing flotation performance and entrainment of microcrystalline graphite. Int. J. Coal Prep. Util. 2022, 42, 3032–3053. [Google Scholar] [CrossRef]
Figure 1. XRD pattern of raw graphite.
Minerals 13 01231 g001
Figure 2. Images of SEM-EDS, (a) surface morphology, and (b) element distribution in raw graphite.
Minerals 13 01231 g002
Figure 3. The dosage of the frother vs. the bubble size (d50) of different froth concentrate products, (a) sec-octanol; (b) terpineol.
Minerals 13 01231 g003
Figure 4. The molecular structures of (a) sec-octanol and (b) terpineol.
Minerals 13 01231 g004
Figure 5. The froth layer height of flotation concentrate J1 obtained under the varying dosages of frother.
Minerals 13 01231 g005
Figure 6. The total water recovery during the whole flotation process versus the different dosages of frother.
Minerals 13 01231 g006
Figure 7. The values of SI versus the varying dosages of frother.
Minerals 13 01231 g007
Disclaimer/Publisher’s Note: The statements, opinions and data contained in all publications are solely those of the individual author(s) and contributor(s) and not of MDPI and/or the editor(s). MDPI and/or the editor(s) disclaim responsibility for any injury to people or property resulting from any ideas, methods, instructions or products referred to in the content.

