

Simulating the Impact of Ore and Water Quality on Flotation Recovery during the Life of a Mine
 , and
, and
Abstract
:1. Introduction
2. Materials and Methods
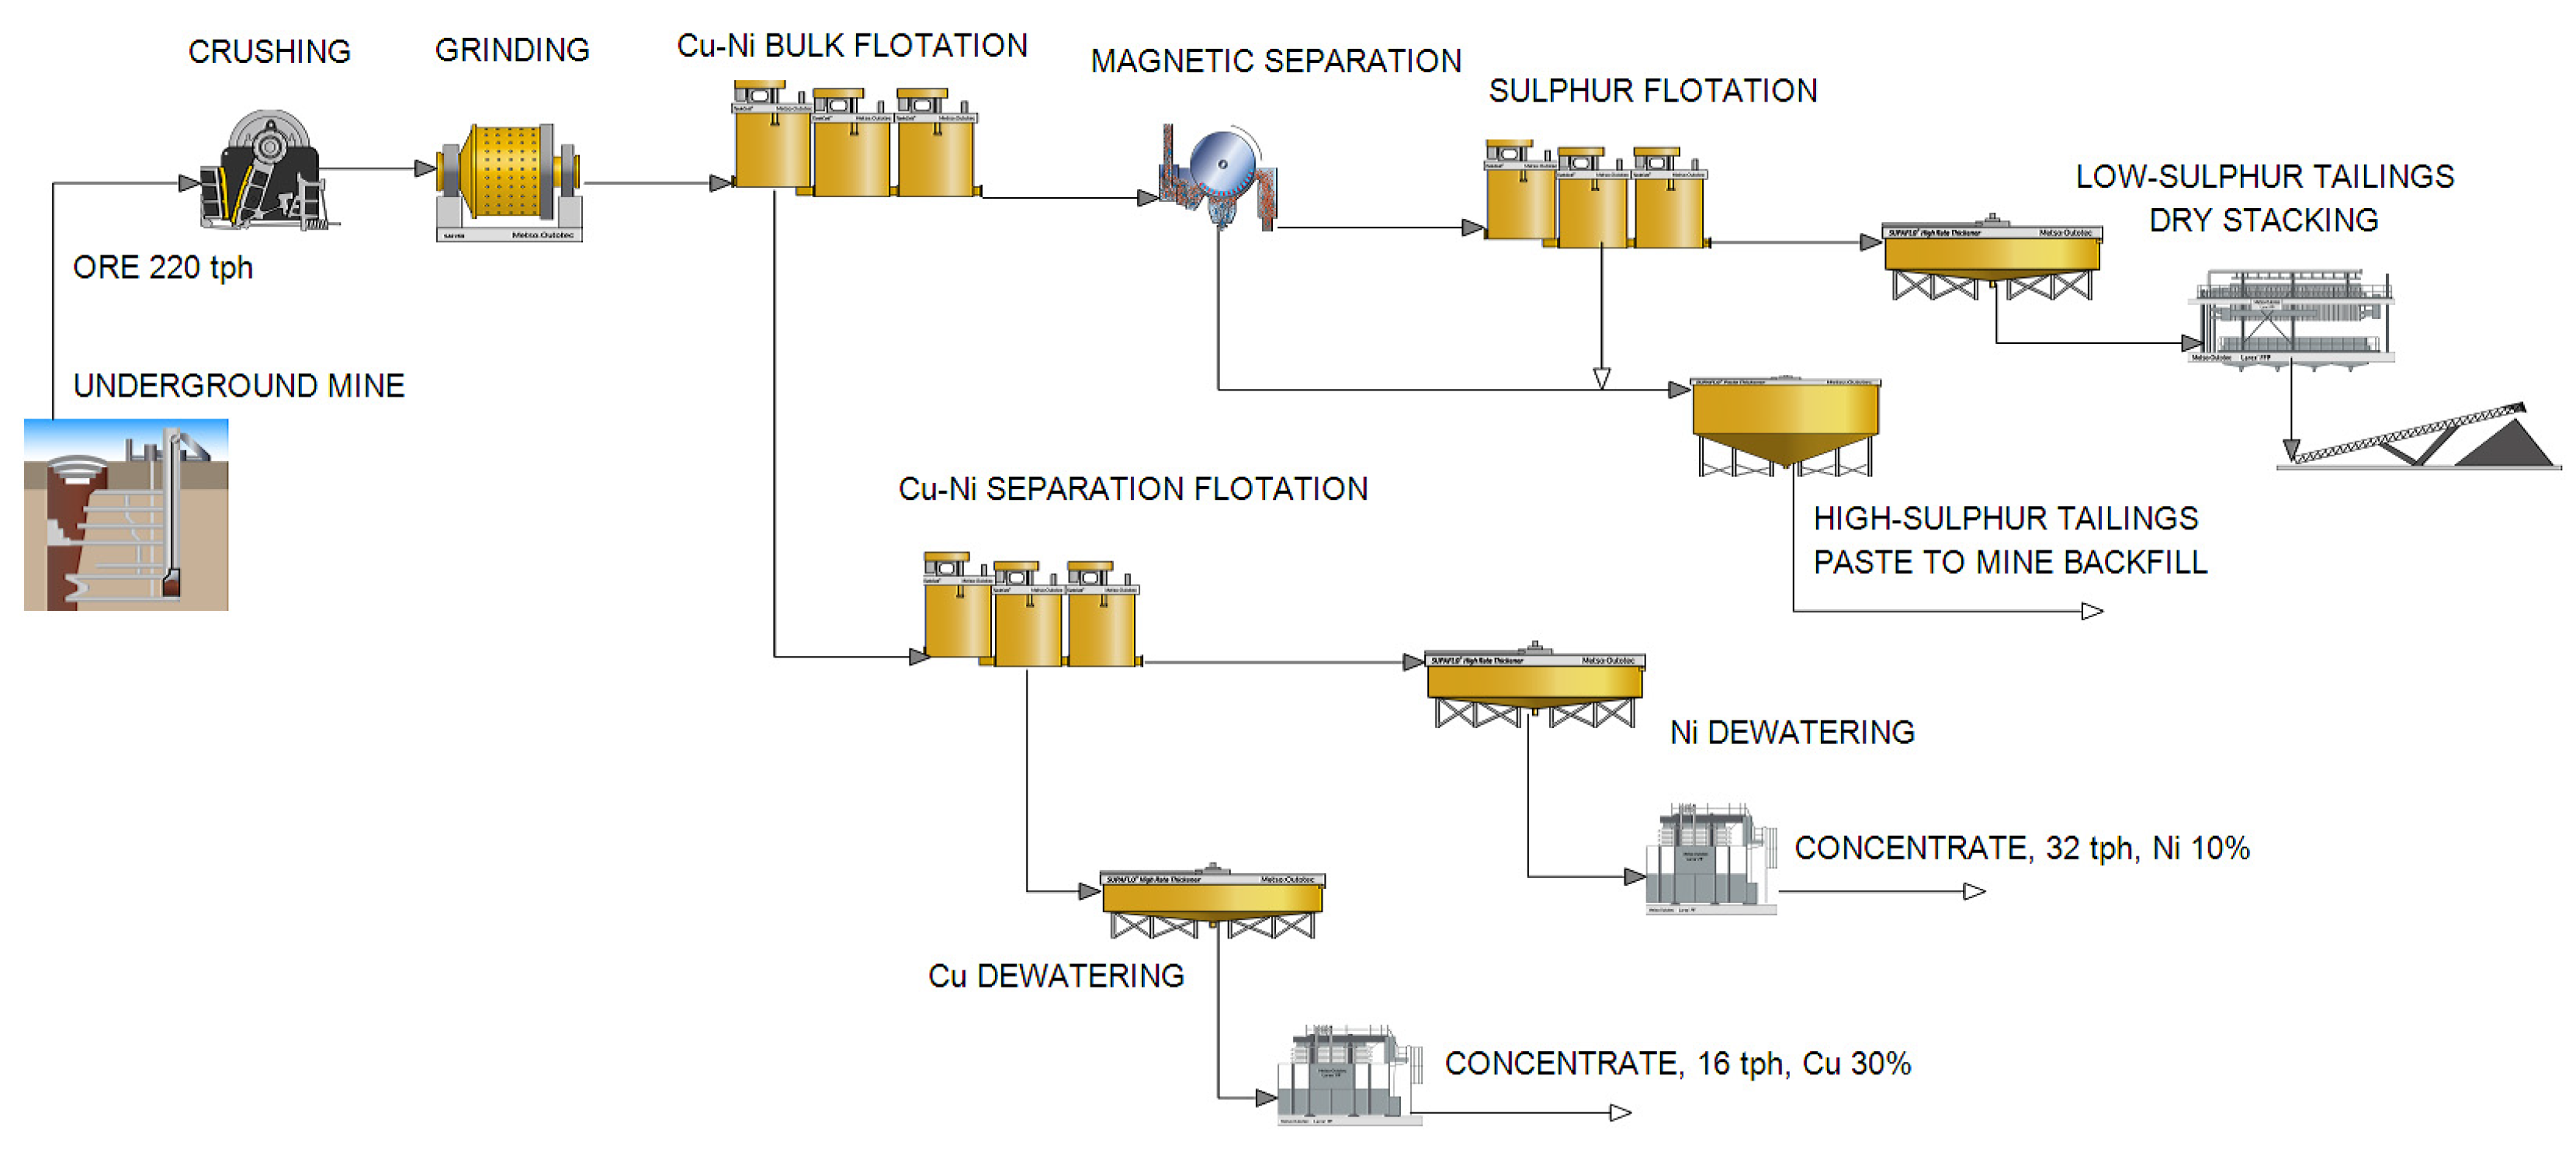
2.1. Case Study
2.2. Ore and Water Samples
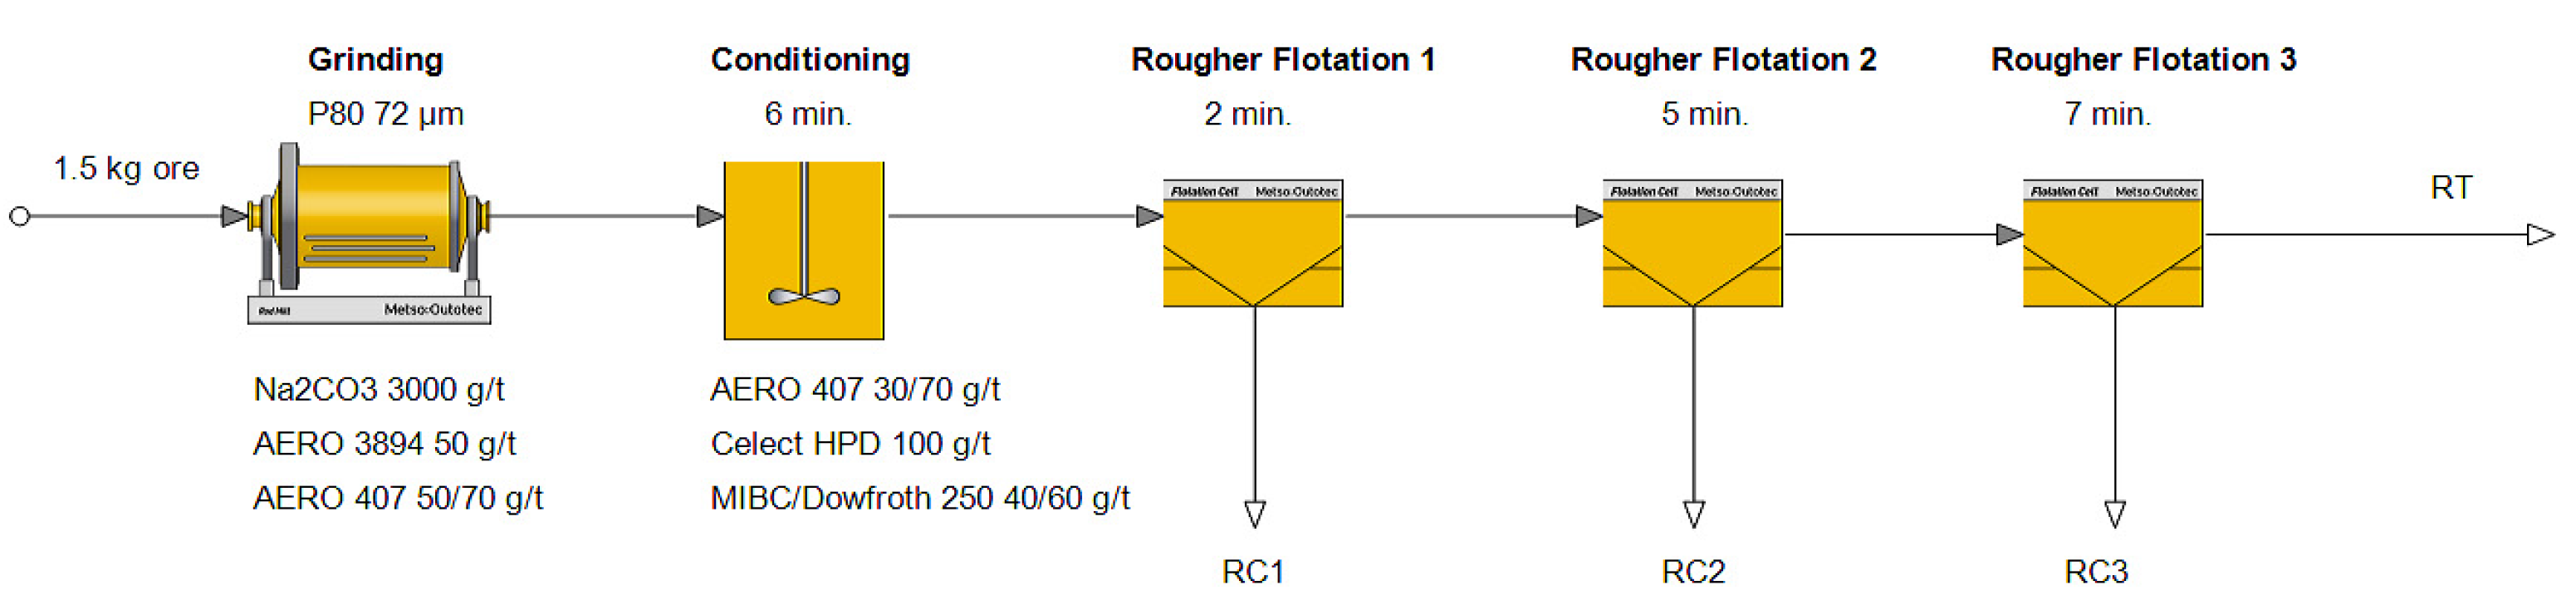
2.3. Laboratory Flotation Tests
2.4. Simulations
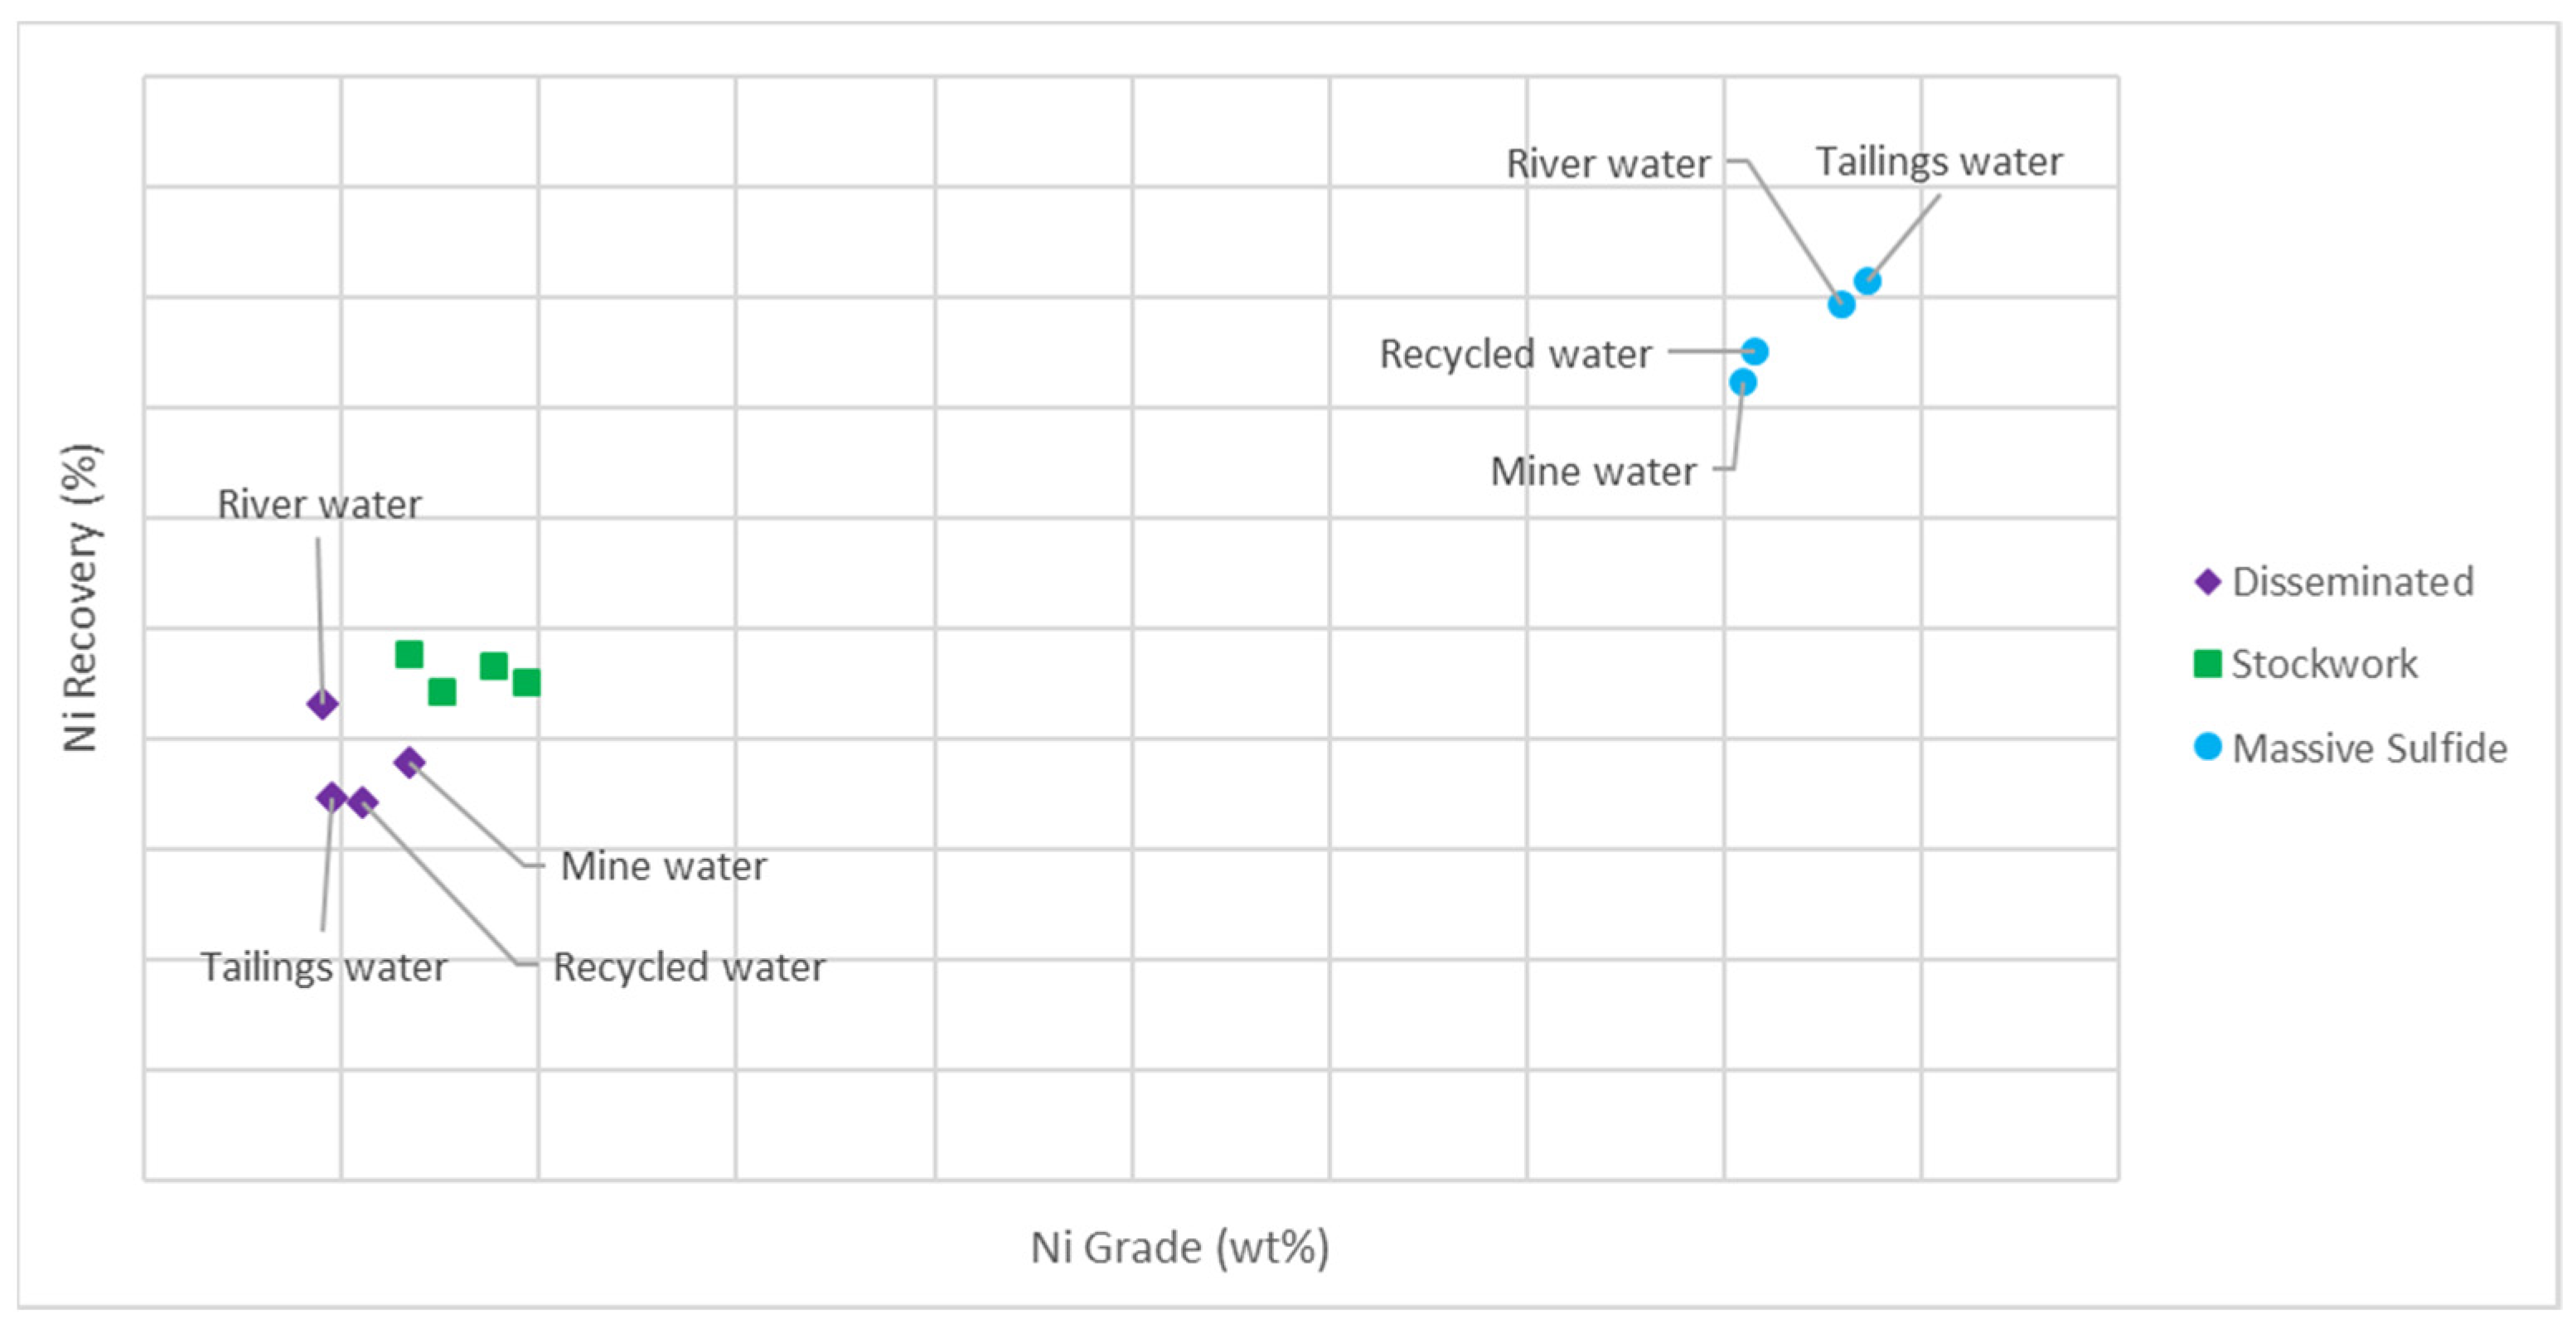
3. Results and Discussion
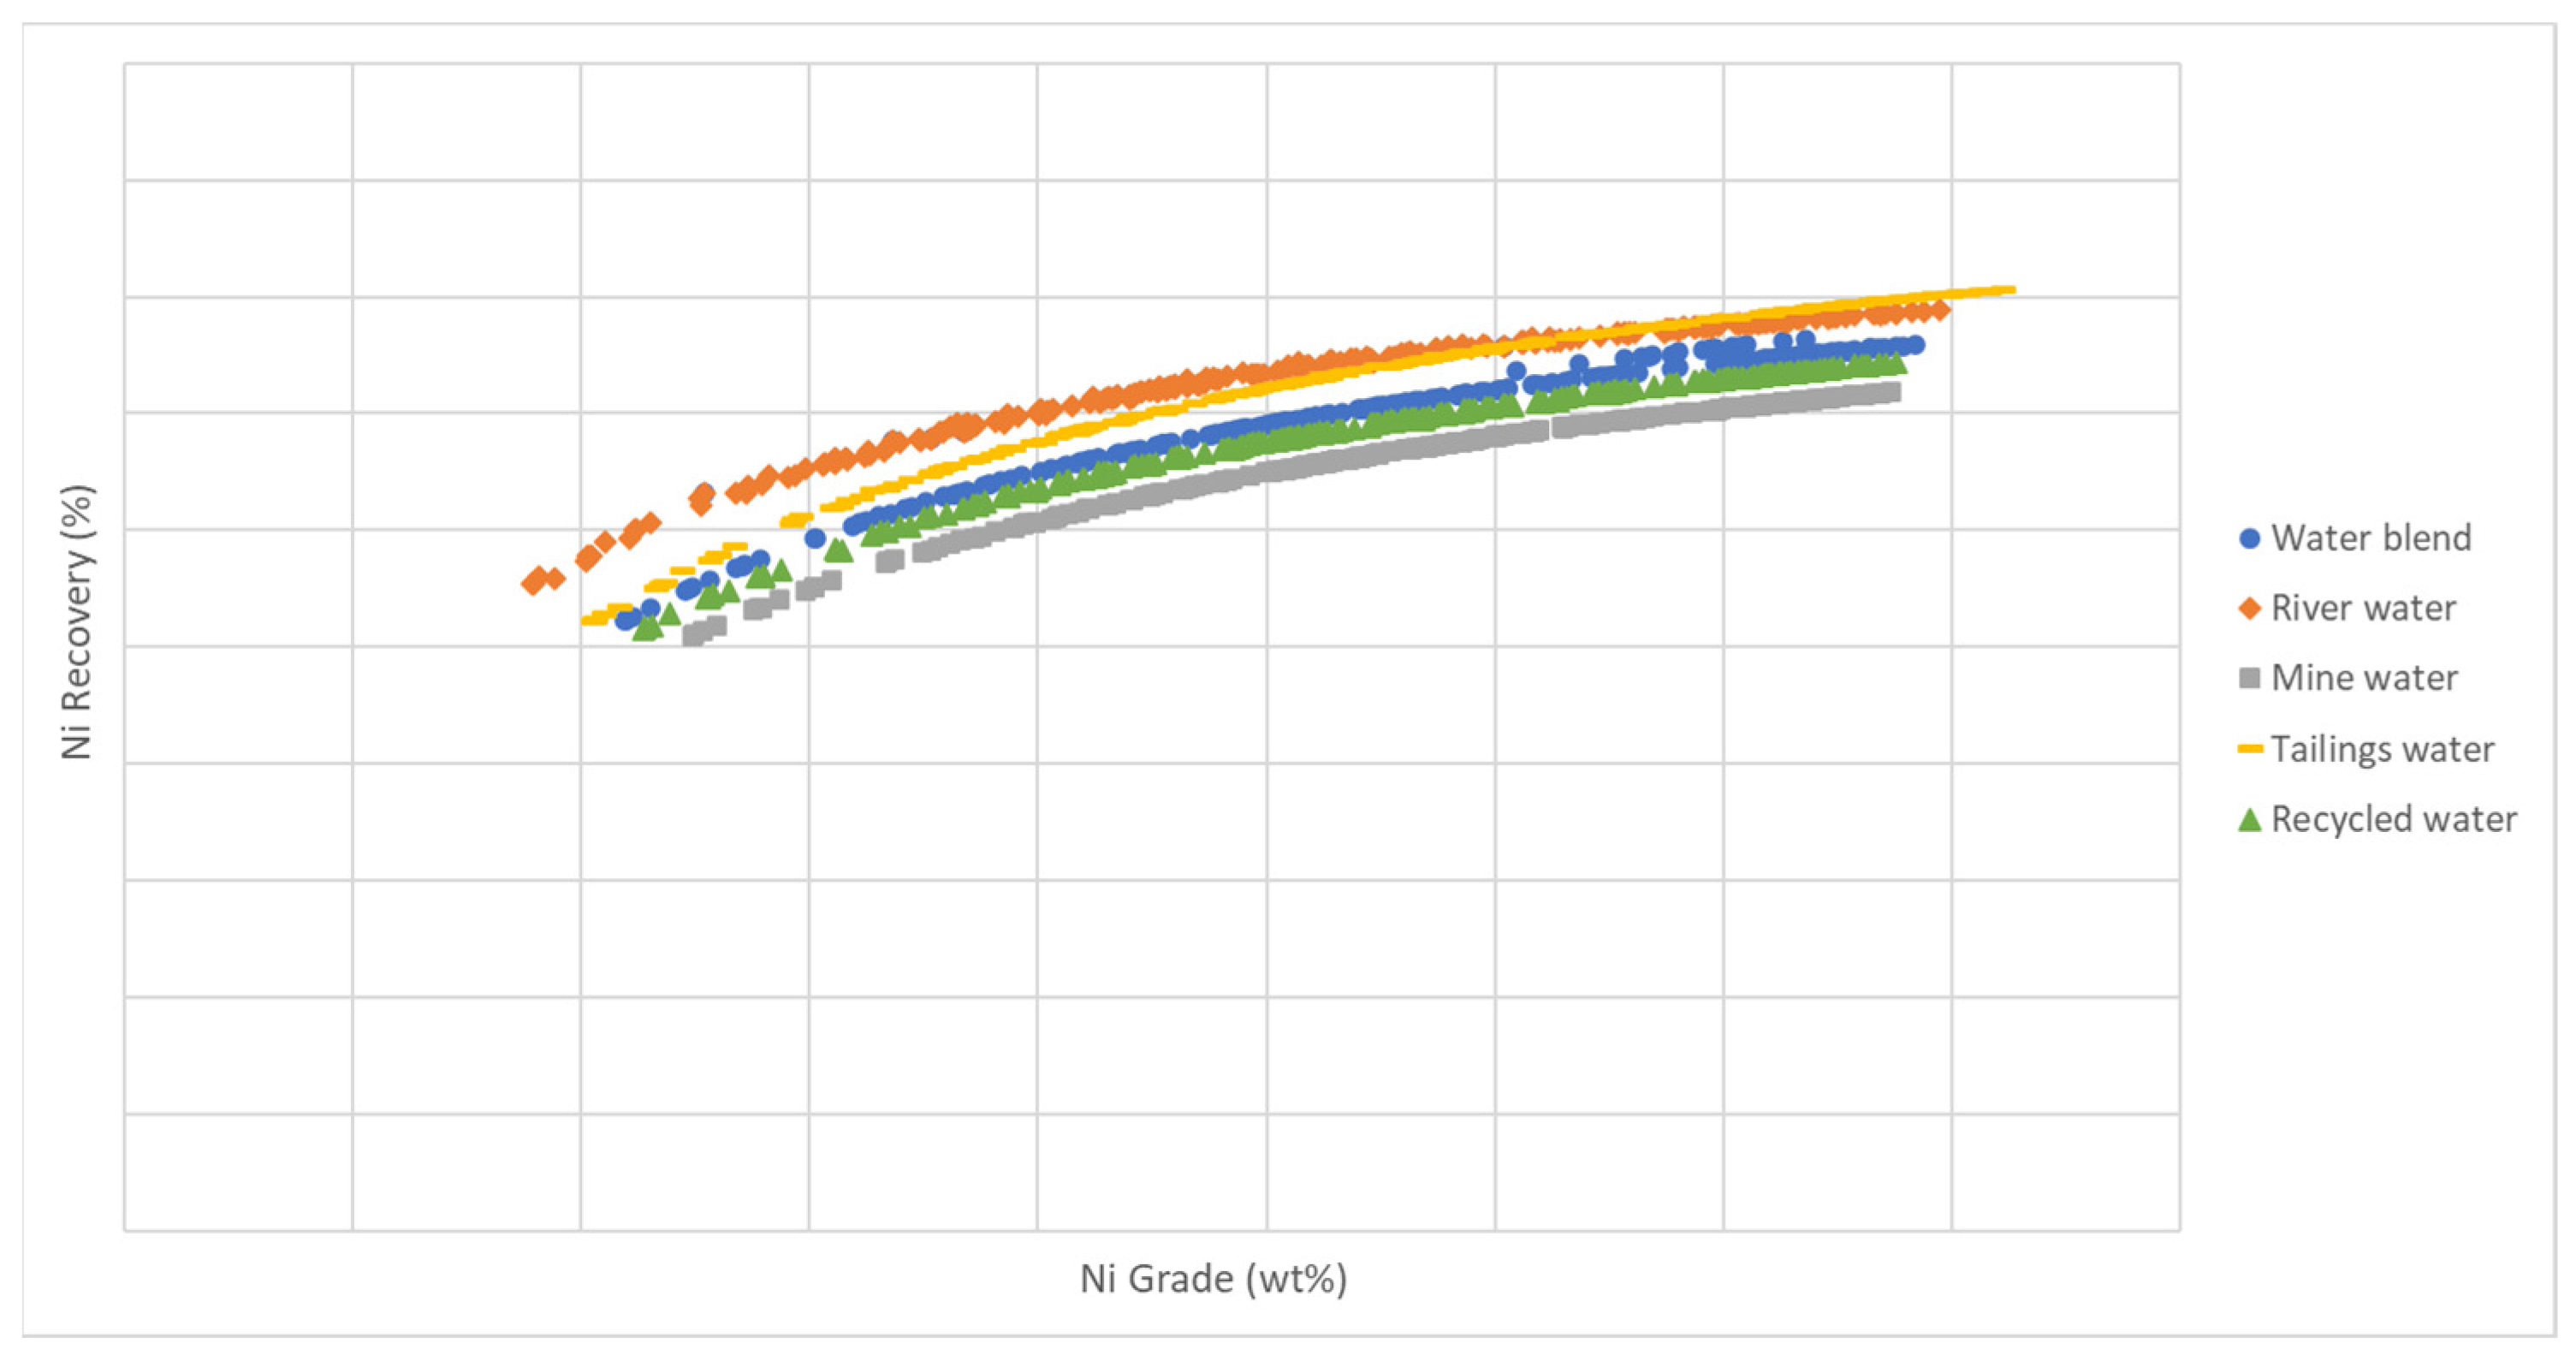
3.1. Simulation Results
3.2. Discussion
4. Conclusions
Author Contributions
Funding
Data Availability Statement
Acknowledgments
Conflicts of Interest
References
- Mu, Y.; Salas, J.C. Data-Driven Synthesis of a Geometallurgical Model for a Copper Deposit. Processes 2023, 11, 1775. [Google Scholar] [CrossRef]
- Williams, S.R. A historical perspective of the application and success of geometallurgical methodologies. In Proceedings of the Second AusIMM International Geometallurgy Conference, Brisbane, QLD, Australia, 30 September–2 October 2013; The Australasian Institute of Mining and Metallurgy: Melbourne, Australia, 2013; pp. 37–47. [Google Scholar]
- Lishchuk, V.; Koch, P.H.; Ghorbani, Y.; Butcher, A.R. Towards integrated geometallurgical approach: Critical review of current practices and future trends. Miner. Eng. 2020, 145, 106072. [Google Scholar] [CrossRef]
- Dominy, S.C.; O’Connor, L. Geometallurgy–Beyond Conception. In Proceedings of the Third AusIMM International Geometallurgy Conference, Perth, Australia, 15–16 June 2016; pp. 3–12. [Google Scholar]
- Käyhkö, T.; Sinche-Gonzalez, M.; Khizanishvili, S.; Liipo, J. Validation of predictive flotation models in blended ores for concentrator process design. Miner. Eng. 2022, 185, 107685. [Google Scholar] [CrossRef]
- Kinnunen, P.; Obenaus-Emler, R.; Raatikainen, J.; Guignot, S.; Guimera, J.; Ciroth, A.; Heiskanen, K. Review of closed water loops with ore sorting and tailings valorisation for a more sustainable mining industry. J. Clean. Prod. 2021, 278, 123237. [Google Scholar] [CrossRef]
- Ihle, C.F.; Kracht, W. The relevance of water recirculation in large scale mineral processing plants with a remote water supply. J. Clean. Prod. 2018, 177, 34–51. [Google Scholar] [CrossRef]
- Northey, S.A.; Mudd, G.M.; Saarivuori, E.; Wessman-Jääskeläinen, H.; Haque, N. Water footprinting and mining: Where are the limitations and opportunities? J. Clean. Prod. 2016, 135, 1098–1116. [Google Scholar] [CrossRef]
- Aaltonen, A.; Le, T.M.K.; Saari, E.; Dahl, O.; Musuku, B.; Lang, A.; Hiidenheimo, S.; Dixon, R. Improving Nickel Recovery in Froth Flotation by Purifying Concentrators Process Water Using Dissolved Air Flotation. Minerals 2023, 13, 319. [Google Scholar] [CrossRef]
- Liu, W.; Moran, C.J.; Vink, S. A review of the effect of water quality on flotation. Miner. Eng. 2013, 53, 91–100. [Google Scholar] [CrossRef]
- Levay, G.; Smart, R.S.C.; Skinner, W.M. The impact of water quality on flotation performance. J. S. Afr. Inst. Min. Metall. 2001, 101, 69–75. [Google Scholar]
- Musuku, B.; Kasymova, D.; Saari, E.; Dahl, O. Influence of Water Quality on Sulphide Ore Oxidation and Speciation of Sulphur Anions during Autogenous Milling. Minerals 2023, 13, 277. [Google Scholar] [CrossRef]
- Beylich, A.A.; Schmidt, K.H.; Neuvonen, S.; Forbrich, I.; Schildt, A. Solute fluxes in the Kidisjoki catchment, subarctic Finnish Lapland. Géomorphologie Relief Process. Environ. 2006, 12, 3. [Google Scholar] [CrossRef]
- Edwards, C.R.; Kipkie, W.B.; Agar, G.E. The effect of slime coatings of the serpentine minerals, chrysotile and lizardite, on pentlandite flotation. Int. J. Miner. Process. 1980, 7, 33–42. [Google Scholar] [CrossRef]
- Pietrobon, M.C.; Grano, S.R.; Sorbieraj, S.; Ralston, J. Recovery mechanisms for pentlandite and MgO-bearing gangue minerals in nickel ores from Western Australia. Miner. Eng. 1997, 10, 775–786. [Google Scholar] [CrossRef]
- Alvarez-Silva, M.; Uribe-Salas, A.; Waters, K.E.; Finch, J.A. Zeta potential study of pentlandite in the presence of serpentine and dissolved mineral species. Miner. Eng. 2016, 85, 66–71. [Google Scholar] [CrossRef]
- Öztürk, Y.; Bıçak, Ö.; Özdemir, E.; Ekmekçi, Z. Mitigation negative effects of thiosulfate on flotation performance of a Cu-Pb-Zn sulfide ore. Miner. Eng. 2018, 122, 142–147. [Google Scholar] [CrossRef]
- Mhonde, N.; Schreithofer, N.; Corin, K.; Mäkelä, M. Assessing the Combined Effect of Water Temperature and Complex Water Matrices on Xanthate Adsorption Using Multiple Linear Regression. Minerals 2020, 10, 733. [Google Scholar] [CrossRef]
- Shackleton, N.J.; Malysiak, V.; De Vaux, D.; Plint, N. Water quality—A comparative study between moncheite and pentlandite in mixture with pyroxene. Miner. Eng. 2012, 36, 53–64. [Google Scholar] [CrossRef]
- Takalo, V.-P.; Käyhkö, T.; Bilal, D.; Remes, A.; Liipo, J. Predicting the metallurgical response of ore blends. In Proceedings of the 55th Annual Meeting of the Canadian Mineral Processors, Ottawa, ON, Canada, 17–19 January 2023; Cameron, R., Simonian, B., Eds.; Canadian Mineral Processors: Ottawa, ON, Canada, 2023; pp. 12–21. [Google Scholar]
- Penttinen, U.; Palosaari, V.; Siura, T. Selective dissolution and determination of sulphides in nickel ores by the bromine-methanol method. Bull. Geol. Soc. Finl. 1977, 49, 79–84. [Google Scholar] [CrossRef]
- Klock, P.R.; Czamanske, G.K.; Foose, M.; Pesek, J. Selective chemical dissolution of sulfides: An evaluation of six methods applicable to assaying sulfide-bound nickel. Chem. Geol. 1986, 54, 157–163. [Google Scholar] [CrossRef]
- FCG Suunnittelu ja Tekniikka Oy. Sakatin Monimetalliesiintymän Kaivoshanke, Ympäristövaikutusten Arviointiselostus. Available online: https://www.ymparisto.fi/sites/default/files/documents/LAPPI_Arviointiselostus_Sakatti_30112020_FINAL_pieni.pdf (accessed on 19 July 2023).
- Moraga, C.; Kracht, W.; Ortiz, J.M. Process simulation to determine blending and residence time distribution in mineral processing plants. Miner. Eng. 2022, 187, 107807. [Google Scholar] [CrossRef]


| Massive Sulfide | Stockwork | Disseminated | ||
|---|---|---|---|---|
| Ag | ppm | 11.0 | 4.70 | 1.70 |
| As | % | <0.02 | <0.02 | <0.02 |
| Cd | % | <0.01 | <0.01 | <0.01 |
| Co | % | 0.14 | 0.019 | 0.013 |
| Cu | % | 5.00 | 1.10 | 0.37 |
| Fe | % | 43.4 | 10.7 | 7.8 |
| Fe BM * | % | 33.2 | 2.20 | 0.54 |
| Ni | % | 3.80 | 0.36 | 0.24 |
| Ni BM * | % | 3.70 | 0.27 | 0.12 |
| Pb | % | <0.02 | <0.02 | <0.02 |
| Zn | % | <0.05 | <0.05 | <0.05 |
| C | % | 0.23 | 0.22 | 0.17 |
| S | % | 28.8 | 2.90 | 0.80 |
| Al2O3 | % | 1.00 | 4.53 | 2.83 |
| CaO | % | 1.18 | 3.36 | 1.96 |
| Cr2O3 | % | 0.102 | 0.614 | 0.789 |
| MgO | % | 4.64 | 25.9 | 33.0 |
| MnO | % | 0.044 | 0.129 | 0.129 |
| Na2O | % | 0.148 | 0.580 | 0.229 |
| SiO2 | % | 6.14 | 35.3 | 36.5 |
| TiO2 | % | 0.061 | 0.190 | 0.130 |
| Mineral | Amount (wt %) | ||
|---|---|---|---|
| Massive Sulfide | Stockwork | Disseminated | |
| Pentlandite | 11.3 | 0.73 | 0.26 |
| Chalcopyrite | 15.0 | 3.25 | 1.07 |
| Pyrrhotite | 35.7 | 1.39 | 0.27 |
| Pyrite | 9.34 | 1.65 | 0.55 |
| Olivine and serpentine | 6.01 | 50.3 | 68.9 |
| Amphibole | 7.36 | 26.2 | 14.2 |
| Chlorite | 3.68 | 10.4 | 9.16 |
| Plagioclase | 1.19 | 2.40 | 1.49 |
| Chromite | - | 1.67 | 2.13 |
| Magnetite | 10.3 | 1.00 | 1.45 |
| Other | - | 1.00 | 0.55 |
| River Water | Mine Water | Recycled Water | Tailings Water | ||
|---|---|---|---|---|---|
| Na | mg/L | 1.5 | 224 | 628 | 389 |
| Mg | mg/L | 1.1 | 384 | 175 | 1.0 |
| S | mg/L | 1.1 | 88 | 117 | 81 |
| K | mg/L | 1.0 | 27 | 27 | 2.0 |
| Ca | mg/L | 3.2 | 46 | 34 | 2.0 |
| Fe | mg/L | 0.6 | 0.2 | 0.2 | 0.2 |
| Ni | mg/L | 0.5 | 0.6 | 0.2 | 0.2 |
| Cu | mg/L | 0.2 | 0.2 | 0.2 | 0.2 |
| Cl− | mg/L | 0.9 | 1280 | 1300 | 0.6 |
| HCO3− | mg/L | 10 | 170 | 290 | 720 |
| SO42+ | mg/L | 2.9 | 280 | 340 | 240 |
| Alkalinity | mmol/L | 0.2 | 2.8 | 4.7 | 12 |
| DOC | mg/L | 7.3 | 3.6 | 4.5 | 9.5 |
| pH | 7.3 | 10.2 | 10.0 | 10.8 | |
| Conductivity | µS/cm | 31.2 | 4379 | 4207 | 1756 |
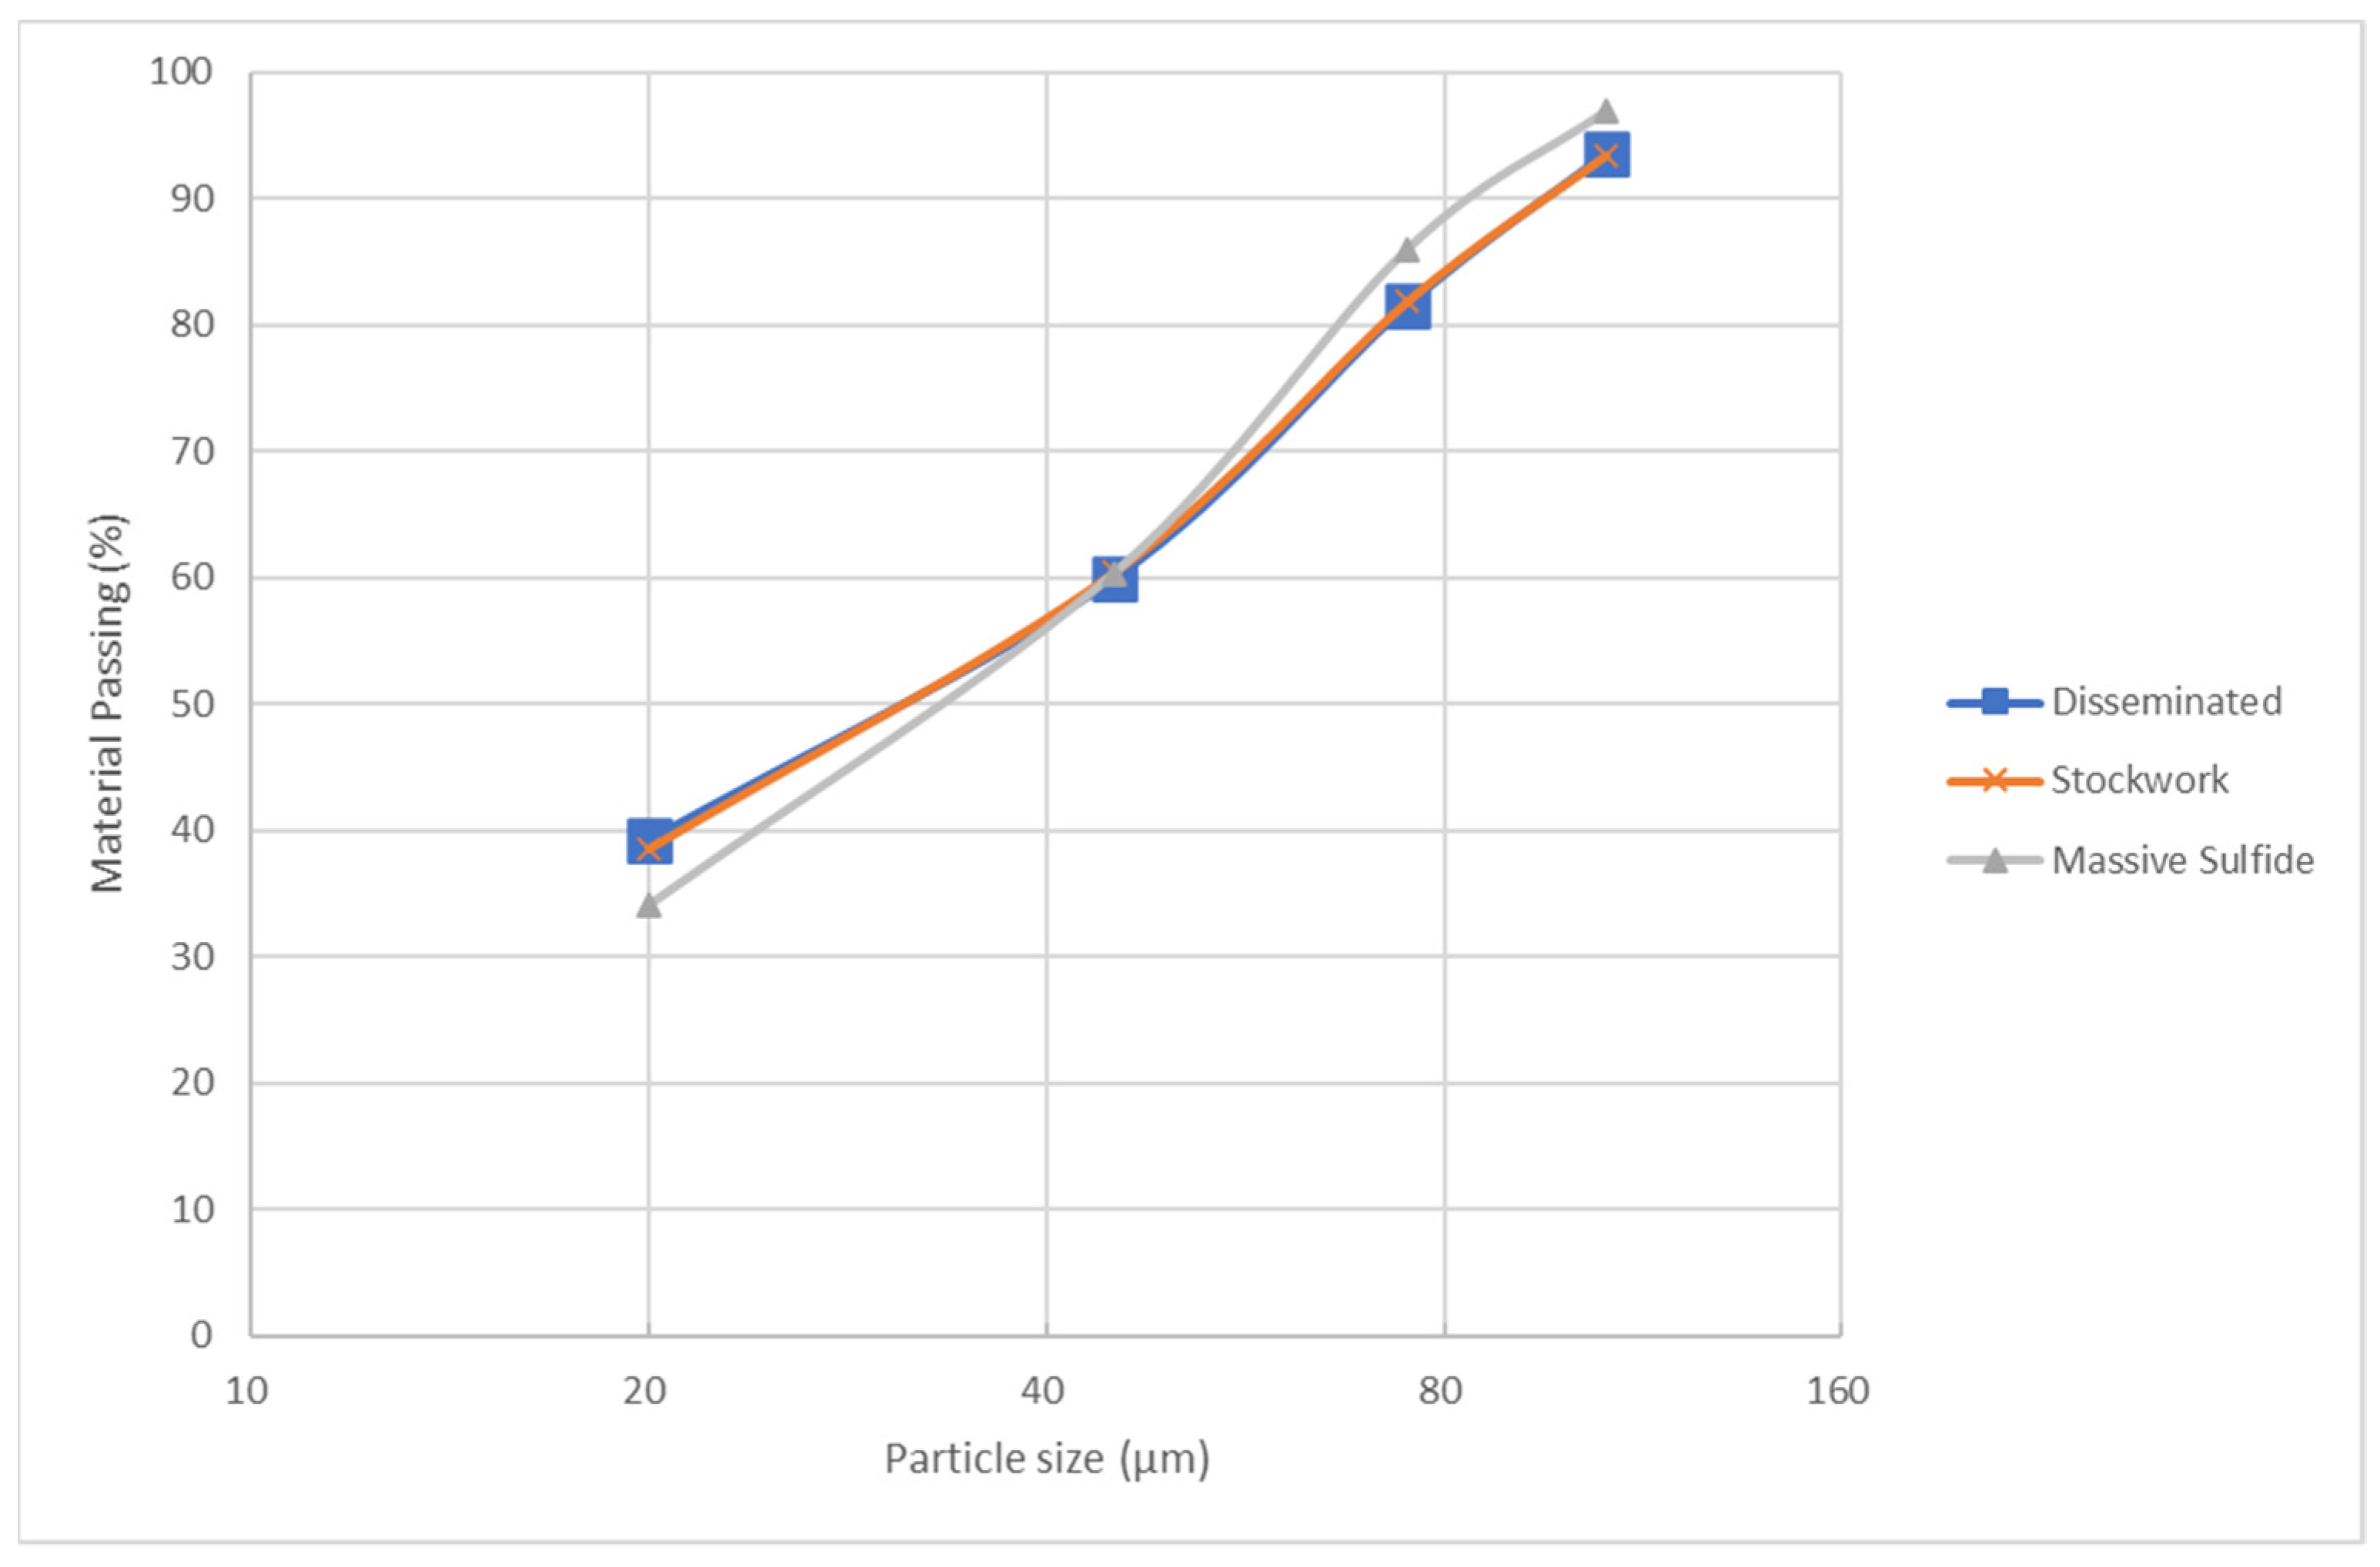
| Sieve Opening (µm) | Material Passing (%) | ||
|---|---|---|---|
| Massive Sulfide | Stockwork | Disseminated | |
| 106 | 96.9 | 93.4 | 93.6 |
| 75 | 86.0 | 81.8 | 81.6 |
| 45 | 60.4 | 60.4 | 59.9 |
| 20 | 34.1 | 38.6 | 39.1 |
| Ore and Water Type | Ccp | Pn | Po | NSG | |
|---|---|---|---|---|---|
| MS *, river water | Rinf(l) | 97.0 | 89.0 | 27.5 | 9.80 |
| kmax(l) | 2.22 | 0.377 | 0.266 | 0.129 | |
| DISS **, river water | Rinf(l) | 94.2 | 70.1 | 39.0 | 10.0 |
| kmax(l) | 2.46 | 0.645 | 0.43 | 0.265 | |
| STW ***, river water | Rinf(l) | 97.4 | 75.0 | 55.0 | 13.0 |
| kmax(l) | 1.55 | 0.243 | 0.067 | 0.172 | |
| MS, mine water | Rinf(l) | 97.9 | 84.1 | 25.4 | 15.0 |
| kmax(l) | 2.27 | 0.297 | 0.316 | 0.074 | |
| STW, mine water | Rinf(l) | 95.7 | 75.0 | 54.0 | 6.25 |
| kmax(l) | 2.02 | 0.222 | 0.047 | 0.234 | |
| DISS, mine water | Rinf(l) | 90.7 | 68.4 | 54.0 | 4.90 |
| kmax(l) | 1.60 | 0.324 | 0.178 | 0.378 | |
| MS, recycled water | Rinf(l) | 98.5 | 82.0 | 25.7 | 9.70 |
| kmax(l) | 4.12 | 0.463 | 0.452 | 0.188 | |
| DISS, recycled water | Rinf(l) | 92.0 | 59.0 | 41.0 | 5.80 |
| kmax(l) | 1.84 | 0.407 | 0.201 | 0.298 | |
| STW, recycled water | Rinf(l) | 97.0 | 70.5 | 30.3 | 8.14 |
| kmax(l) | 1.62 | 0.344 | 0.153 | 0.184 | |
| STW, tailings water | Rinf(l) | 96.6 | 68.0 | 30.0 | 9.5 |
| kmax(l) | 2.04 | 0.296 | 0.151 | 0.2 | |
| DISS, tailings water | Rinf(l) | 90.9 | 58.0 | 33.8 | 7.3 |
| kmax(l) | 2.66 | 0.473 | 0.244 | 0.286 | |
| MS, tailings water | Rinf(l) | 98.7 | 90.0 | 28.9 | 8.2 |
| kmax(l) | 3.18 | 0.42 | 0.348 | 0.055 |
Disclaimer/Publisher’s Note: The statements, opinions and data contained in all publications are solely those of the individual author(s) and contributor(s) and not of MDPI and/or the editor(s). MDPI and/or the editor(s) disclaim responsibility for any injury to people or property resulting from any ideas, methods, instructions or products referred to in the content. |
© 2023 by the authors. Licensee MDPI, Basel, Switzerland. This article is an open access article distributed under the terms and conditions of the Creative Commons Attribution (CC BY) license (https://creativecommons.org/licenses/by/4.0/).
Share and Cite
Aaltonen, A.; Izart, C.; Lyyra, M.; Lang, A.; Saari, E.; Dahl, O. Simulating the Impact of Ore and Water Quality on Flotation Recovery during the Life of a Mine. Minerals 2023, 13, 1230. https://doi.org/10.3390/min13091230
Aaltonen A, Izart C, Lyyra M, Lang A, Saari E, Dahl O. Simulating the Impact of Ore and Water Quality on Flotation Recovery during the Life of a Mine. Minerals. 2023; 13(9):1230. https://doi.org/10.3390/min13091230
Chicago/Turabian StyleAaltonen, Annukka, Caroline Izart, Mikko Lyyra, Aleksandra Lang, Eija Saari, and Olli Dahl. 2023. "Simulating the Impact of Ore and Water Quality on Flotation Recovery during the Life of a Mine" Minerals 13, no. 9: 1230. https://doi.org/10.3390/min13091230