1. Introduction
Mining is a cornerstone industry of the national economy, providing 90% of China’s energy and raw materials [
1,
2]. The development of mineral resources at the same time was accompanied by the generation of a large number of tailings [
3]. A significant accumulation of stockpiled tailings occupies valuable land resources, resulting not only in pollution of the surrounding surface environment [
4], but also posing risks of landslides, dam failures, and other accidents [
5,
6]. Furthermore, prolonged and intensive mining of mineral resources has led to the creation of voids within the layers of the underground ore body, resulting in the formation of mined-out areas. The existence of mined-out areas makes the safe production of mines face great safety problems [
7]. Mined-out areas and tailing ponds have become important problems restricting the development of mines [
8], and the development of resources and the protection of the environment have become a development paradox.
Paste-filling materials consist of components such as binders, aggregates, and chemical additives [
9]. As a form of environmentally friendly tailings treatment [
10], the paste filling mining method [
11] transforms tailings of various particle sizes (unclassified tailings) into a toothpaste-like, non-segregating paste slurry for stockpiling and filling. This method effectively mitigates adverse factors such as surface subsidence and perimeter rock instability caused by mined-out areas [
12]. Simultaneously, it enhances resource recovery rates, reduces environmental and safety hazards posed by mine waste, eases the strain on existing tailings dams, and achieves the “one waste to cure two hazards” principle [
13].
With the depletion of shallow resources in China, deep resource extraction has become the future [
14]. In the face of more complex underground environments, the filling material must enhance its strength to manage the intricate stress challenges encountered in deep mining, encompassing both static and dynamic loads [
15,
16]. The filling material inherently possesses weaknesses such as low strength and susceptibility to failure [
17]. In complex environments, when the structural integrity of the filling material is compromised, internal cracks can rapidly expand and extend, leading to swift deterioration. As a consequence, the strength of the filling material fails to meet the demands of quarry filling. Presently, enhancing the strength of filler materials has emerged as a prominent research focus within both academic and industrial circles [
18,
19,
20].
Research has demonstrated that the incorporation of fibers [
21,
22] into the filling process can effectively retard the degradation of the filling material [
23,
24]. Moreover, the bridging effect of fibers within the filling material [
25,
26,
27] significantly enhances the mechanical properties of the cemented filling [
28,
29]. Following laboratory tests, Li [
30] concluded that the unconfined compressive strength of fiber-reinforced cemented tailings backfill (FRCTB) increased with the increase in polypropylene (PP) fiber dosage, and the peak strain also increased from 0.39% to 1.45%. These findings indicate that the fibers effectively assume a bridging role during the failure of the tailings filling material. Xue [
31] studied FRCTB using acoustic emission technology and an electronic universal testing machine and concluded that when the fiber dosage was 0.6% and the fiber length was 12 mm, the fiber exhibited the best enhancement performance. Xu [
32] analyzed the backfill performance of fiber-reinforced cemented tailings at the microstructure level. The study revealed that fibers can retard crack propagation and constrain deformation, thereby enhancing structural strength and shifting the sample’s failure mode from brittleness to toughness.
The distribution of fibers in the internal structure of the filler has been studied in detail using many methods [
33,
34]. From a microscopic perspective [
35,
36], fibers enhance the internal structural density of the filling material [
37] by occupying pores and retarding crack propagation, thereby bolstering the filling material’s strength [
38,
39,
40]. Xue [
41] carried out microscopic experiments on the fiber-reinforced coarse aggregate cement backfill. The study revealed that the addition of polypropylene fiber (PPF) resulted in a backfill that exhibited cracking resistance. An increase in the compactness of the interface transition zone and a reduction in pores were observed. Chen [
42] performed scanning electron microscope (SEM) and nuclear magnetic resonance (NMR) microscopic tests, confirming that high-tensile-strength PP fibers enhance the tensile strength and ductility of the filling material while decreasing specimen porosity. The study concludes that the fibers can effectively integrate with cementitious materials, and the residual strength remains intact even after specimen fracture. Cao [
43] studied cement-fiber-tailing matrix composites (CFMC) using industrial CT scanning and SEM. The addition of fiber dosage can effectively improve the compressive strength and toughness of tailings backfill specimens. From a microscopic perspective, the internal structure exhibits a marked reduction in pores, decreased interconnections, and increased particle packing density.
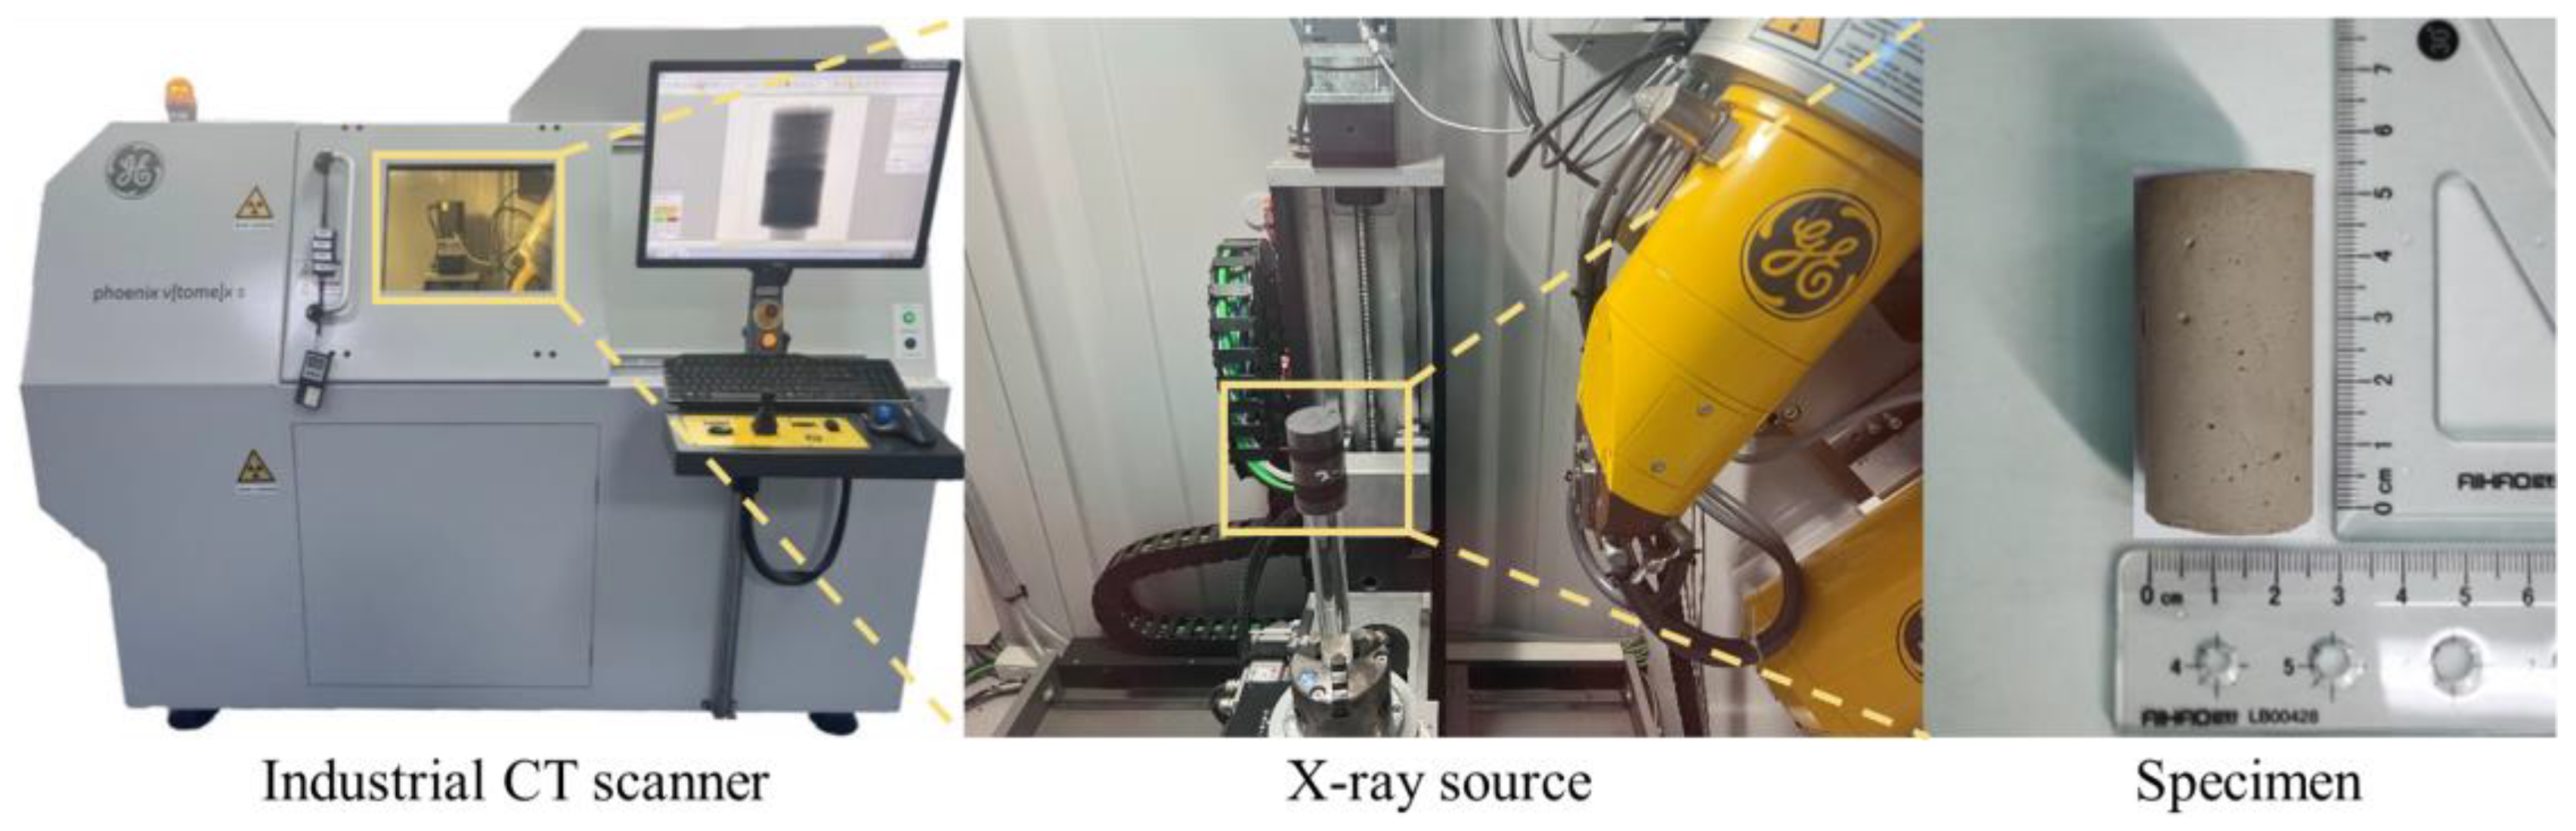
The previous research results are fruitful and representative. However, due to the similar densities of the fiber and the matrix, it is impossible to directly obtain a clear gray image of the internal structure when slicing, resulting in the inability to accurately identify the fiber in the three-dimensional reconstruction. This is the difficulty of realizing fiber visualization. Therefore, the distribution of the internal structure of the filler material is still a challenging problem in microscopic research. This study designed a multi-scale basic mechanical performance test for (basalt fiber) BF mixing, obtained uniaxial compressive and flexural laboratory test results of tailings cemented filling, and studied the changes in mechanical properties under the influence of multi-scale. Industrial CT scanning technology is employed to construct an internal microstructure model and characterize fiber distribution. This information is then integrated with a discrete element program to analyze the distribution of microcracks in cemented tailings backfill, elucidating the reinforcing and toughening effects of BF on the backfill. A targeted study was conducted on the mechanical properties of mixed fibers in the filling body, obtaining the distribution of fiber structure inside the filling body, exploring the bridging effect of fibers in the filling body, and the toughening performance of the filling body. These findings serve to advance the application of fiber reinforcement technology in mining filling.
4. Results and Discussion
4.1. Mechanical Performance Test
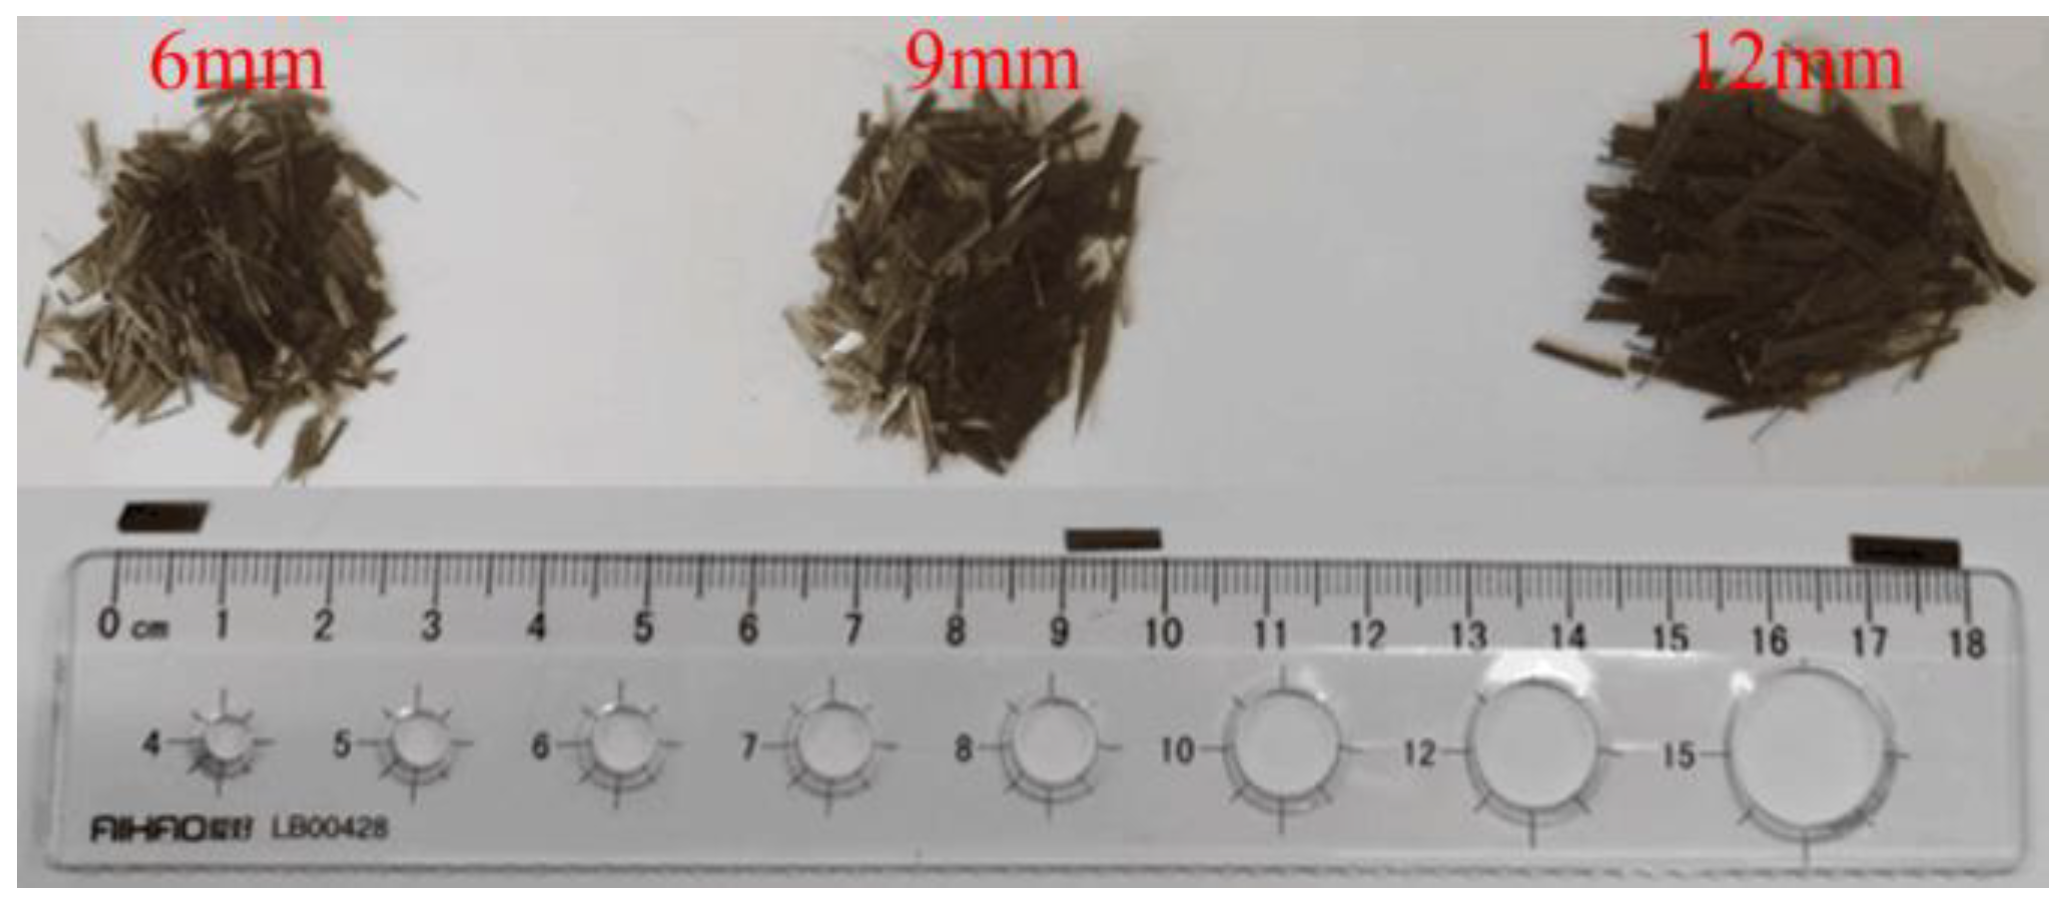
The influence of different lengths of BF on the filling body varies, and longer BF tends to form a surrounding state. Under the same dosage, the number of effective fibers per unit area decreases and the connection effect weakens. However, shorter BF is easily pulled out due to the tensile effect of the filling material cracking, and it cannot exert its function. Therefore, the research analysis only considers the interaction between three different sizes of BF with fiber lengths of 6 mm, 9 mm, and 12 mm and conducts uniaxial compression and splitting tensile tests. Based on the test results, the influence of multi-scale BF mixing conditions on the mechanical properties of the filling body is analyzed. The measured strength results are shown in
Table 4 and
Figure 10.
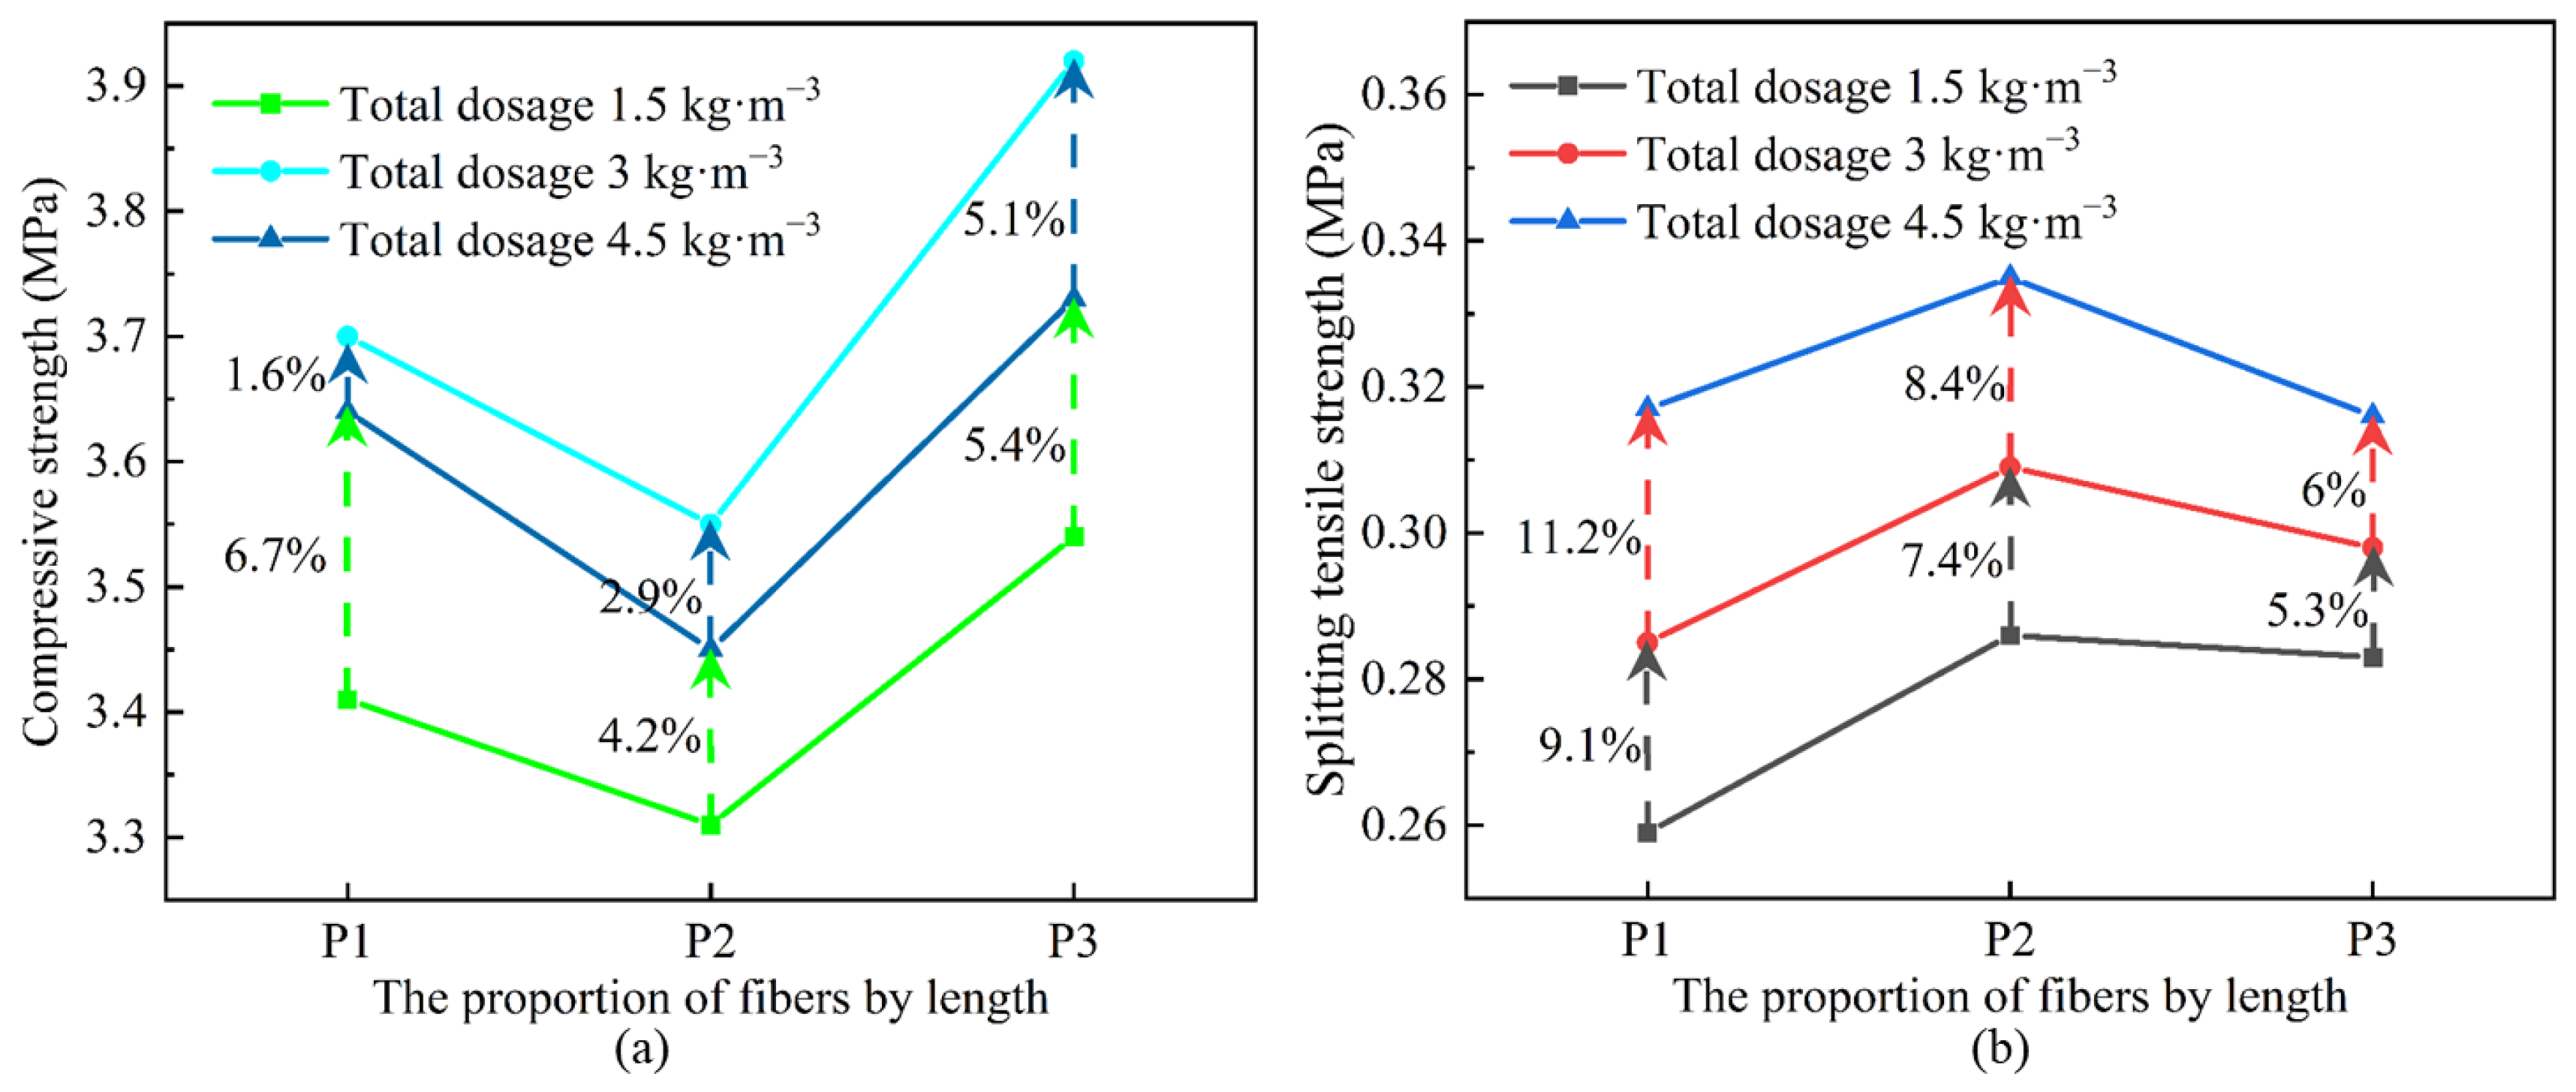
P1, P2, and P3 represent the proportion of BF content in each length (6 mm:9 mm:12 mm), which is 1:1:1, 1:0:2, and 2:1:0 in sequence. We conducted uniaxial compressive tests on samples mixed with multiple sizes of BF, and the compressive strength results of the filling body are shown in the
Figure 10. With the increase in BF dosage, the uniaxial compressive strength of the filling body shows a trend of first increasing and then decreasing. The optimal BF dosage is 3.0 kg·m
−3, which increases the compressive strength by 10.7% compared to the other two BF dosage groups, and the other two groups increase by 8.5% and 7.2%, respectively. Analysis shows that under the condition of constant total dosage, the compressive strength of the filling decreases when the proportion of BF of 12 mm increases.
The splitting tensile test results of the filling body under the condition of multi-scale BF mixing are shown in
Table 3. Overall, the splitting tensile strength increases with the increase in BF content. When the proportion of BF content in each length is 1:1:1, the splitting tensile strength is the highest. When the BF content increases from 1.5 kg·m
−3 to 3 kg·m
−3, the tensile strength increases by 9.1%. When the BF content is 4.5 kg·m
−3, the tensile strength increases by 11.2% compared to 3 kg·m
−3.
4.2. Interaction Effects Analysis of Multi-Size Fibers
The multi-scale BF mixing experiment is based on the results of orthogonal experiments with a polymer dosage of 3%. The proportions of 6 mm, 9 mm, and 12 mm BF are adjusted while maintaining the total dosage of 1.5 kg·m−3, 3 kg·m−3, and 4.5 kg·m−3. Therefore, the research analysis only considers the interaction between three different sizes of BF.
Due to the fact that when the total BF dosage is constant, the dosage of each length of BF is not uniform, it is not possible to study the effect of factor interaction from the perspective of BF length difference using SPSS. Therefore, we consider conducting a statistical analysis of variance results from the perspectives of total BF dosage (D) and the proportion of BF in each length (E). The analysis results are shown in
Table 5.
The effects of single factor D, E response, and second-order interaction on each intensity are extremely significant (p < 0.01). The strength analysis results under single factor response show that FD > FE, indicating that the total BF dosage has the greatest impact on strength among the two factors. Compared with the single-factor response results, the second-order interaction results showed FD > FE > FD×E for compressive and splitting tensile strength, indicating that the first-order interaction had a secondary impact on compressive and splitting tensile strength.
The trend of changes in flexural strength under the interaction of three lengths of BF shows that the interaction between 6 mm and 12 mm BF is more significant. When the dosage of 6 mm BF remains unchanged, the flexural strength increases with the increase in 12 mm BF dosage. When the dosage of 12 mm BF remains unchanged, the flexural strength increases with the increase in 6 mm BF dosage. When the content of 9 mm length BF remains unchanged, the flexural strength increases with the increase in 12 mm length BF content. However, when the content of 12 mm length BF remains unchanged, the flexural strength increases with the increase in 9 mm length BF content.
Based on the test results of the mechanical properties of a multi-size BF mixture, the effects of various strength distributions are compared and analyzed. Since the BF content is the main influencing factor of mechanical properties, and considering that the polymer content is set at 3% in the multi-size BF mixing test, after comprehensive analysis, single-mixed and mixed samples with 3% of the polymer content, 1.5 kg·m
−3, 3.0 kg·m
−3 and 4.5 kg·m
−3 of fiber content are selected for strength distribution comparative analysis, as shown in
Figure 9. The filling body under the condition of multi-scale BF mixing has significant advantages in improving compressive strength; however, the improvement effect in splitting tensile strength is not significant.
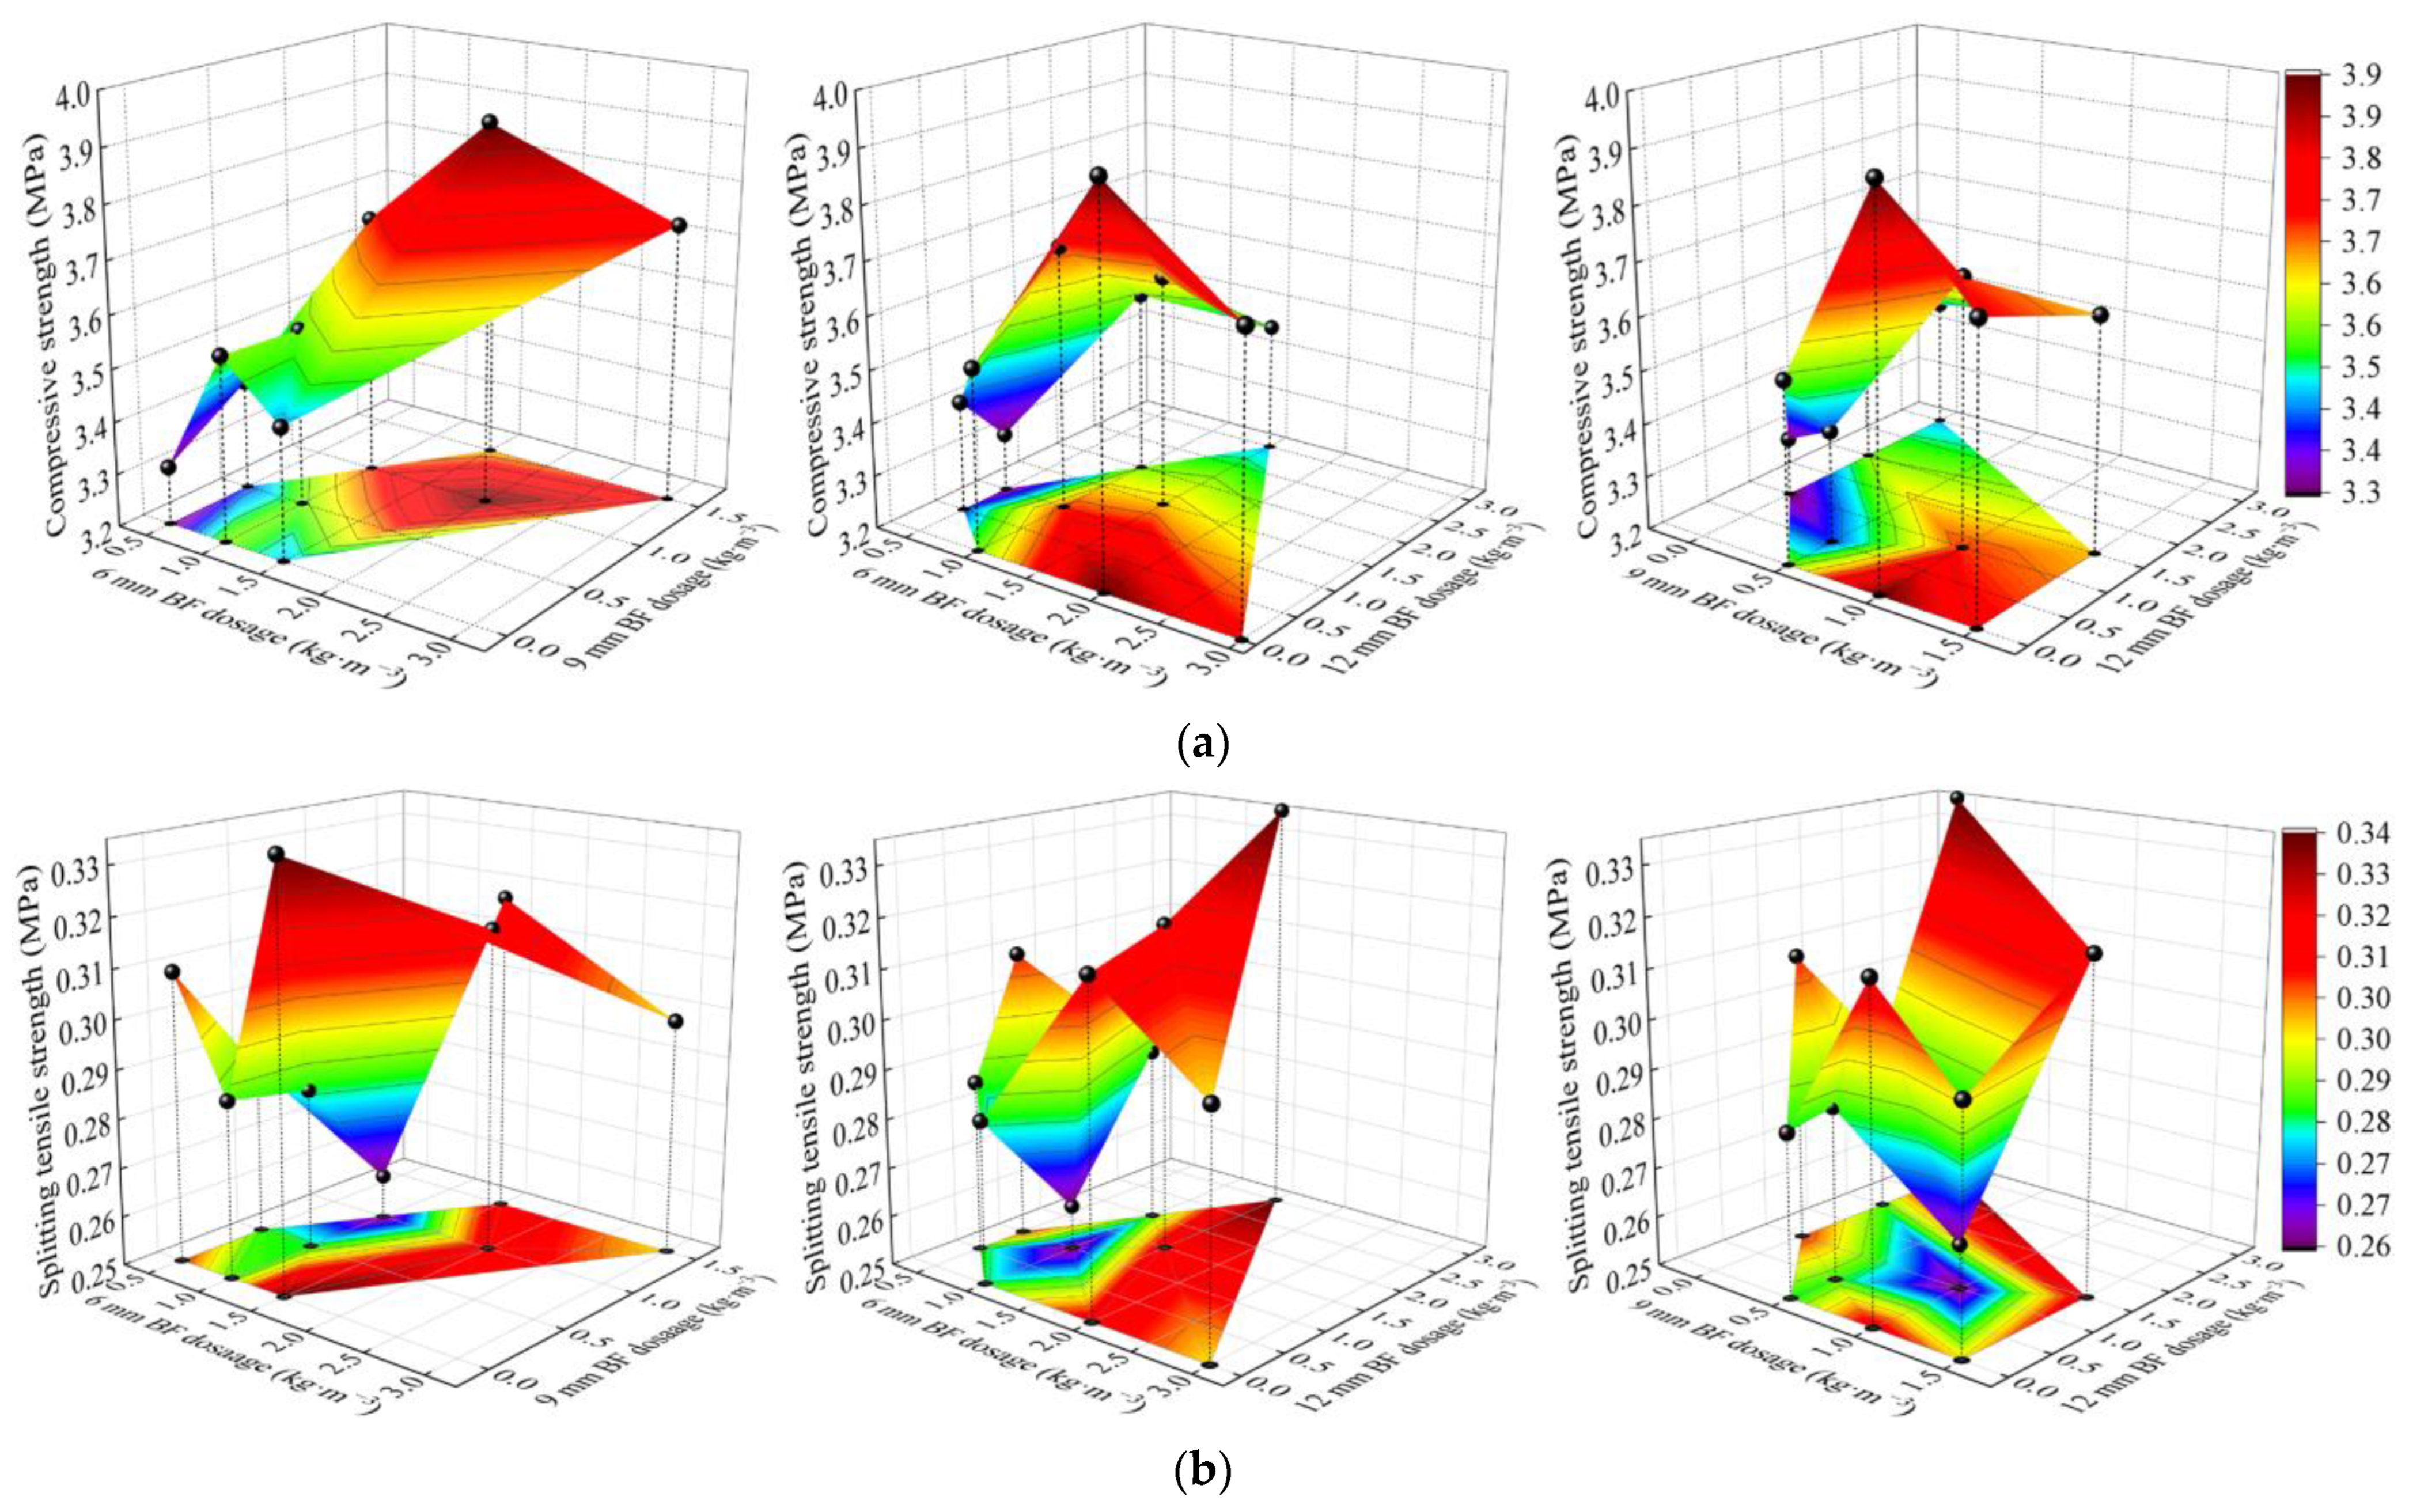
The trends in the compressive strength of the filler for the interaction of the three sizes of BF are shown in
Figure 11. The interaction between 6 mm and 9 mm has a significant impact on compressive strength. The dosage of BF with a length of 6 mm remains unchanged, while the dosage of BF with a length of 9 mm increases. The compressive strength first increases and then decreases. When the dosage of BF with a length of 9 mm remains unchanged, the compressive strength also shows the same trend as when the dosage of BF with a length of 6 mm increases. Under the interaction of 12 mm, 6 mm, and 9 mm lengths of BF, the compressive strength decreases with an increase in the addition of 6 mm and 9 mm lengths of BF, while the amount of BF remains unchanged.
It can be seen that the interaction between 6 mm and 12 mm BF is significant for the splitting tensile strength of the filling. When the content of 6 mm BF remains unchanged, the splitting tensile strength increases with the increase in 12 mm BF content. However, when the content of 12 mm BF remains unchanged, the splitting tensile strength first increases and then decreases with the increase in 6 mm BF content, indicating that the high content of long BF effectively improves the splitting tensile strength of the filling body. It shows the same trend of change in splitting tensile strength. When the content of 9 mm-long BF remains unchanged, the splitting tensile strength increases with the increase in 12 mm-long BF content. However, when the content of 12 mm-long BF remains unchanged, the splitting tensile strength first increases and then decreases with the increase in 9 mm-long BF content.
4.3. Backfill Mesoporous Structure
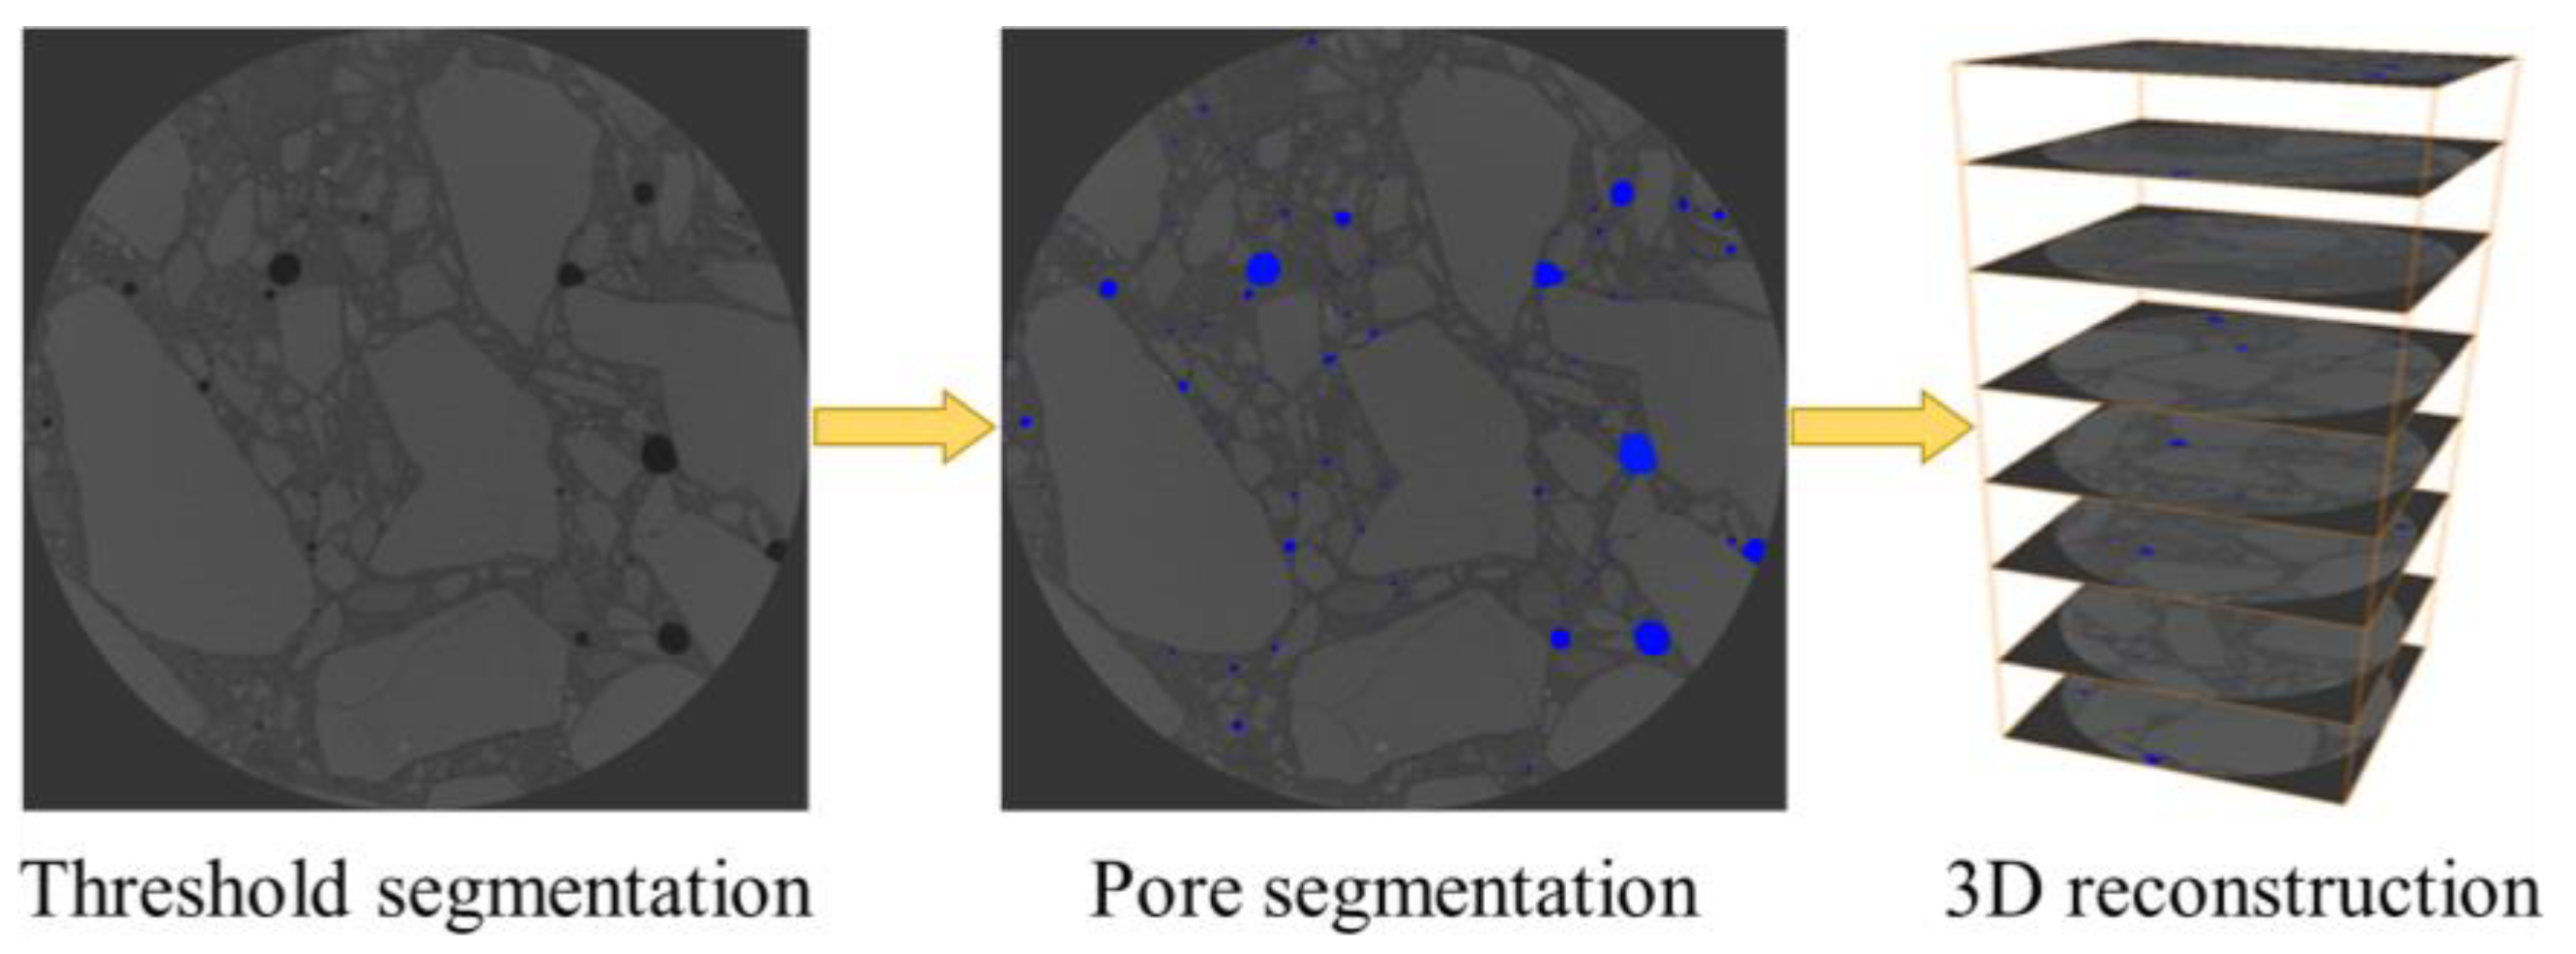
As the main defect inside the filling body, the distribution of pores in the filling body matrix has a significant impact on the mechanical properties of the filling body. Perform threshold segmentation on CT scan images, extract pores from 2D slices, and reconstruct 3D pores through stacking of slices, as shown in
Figure 12.
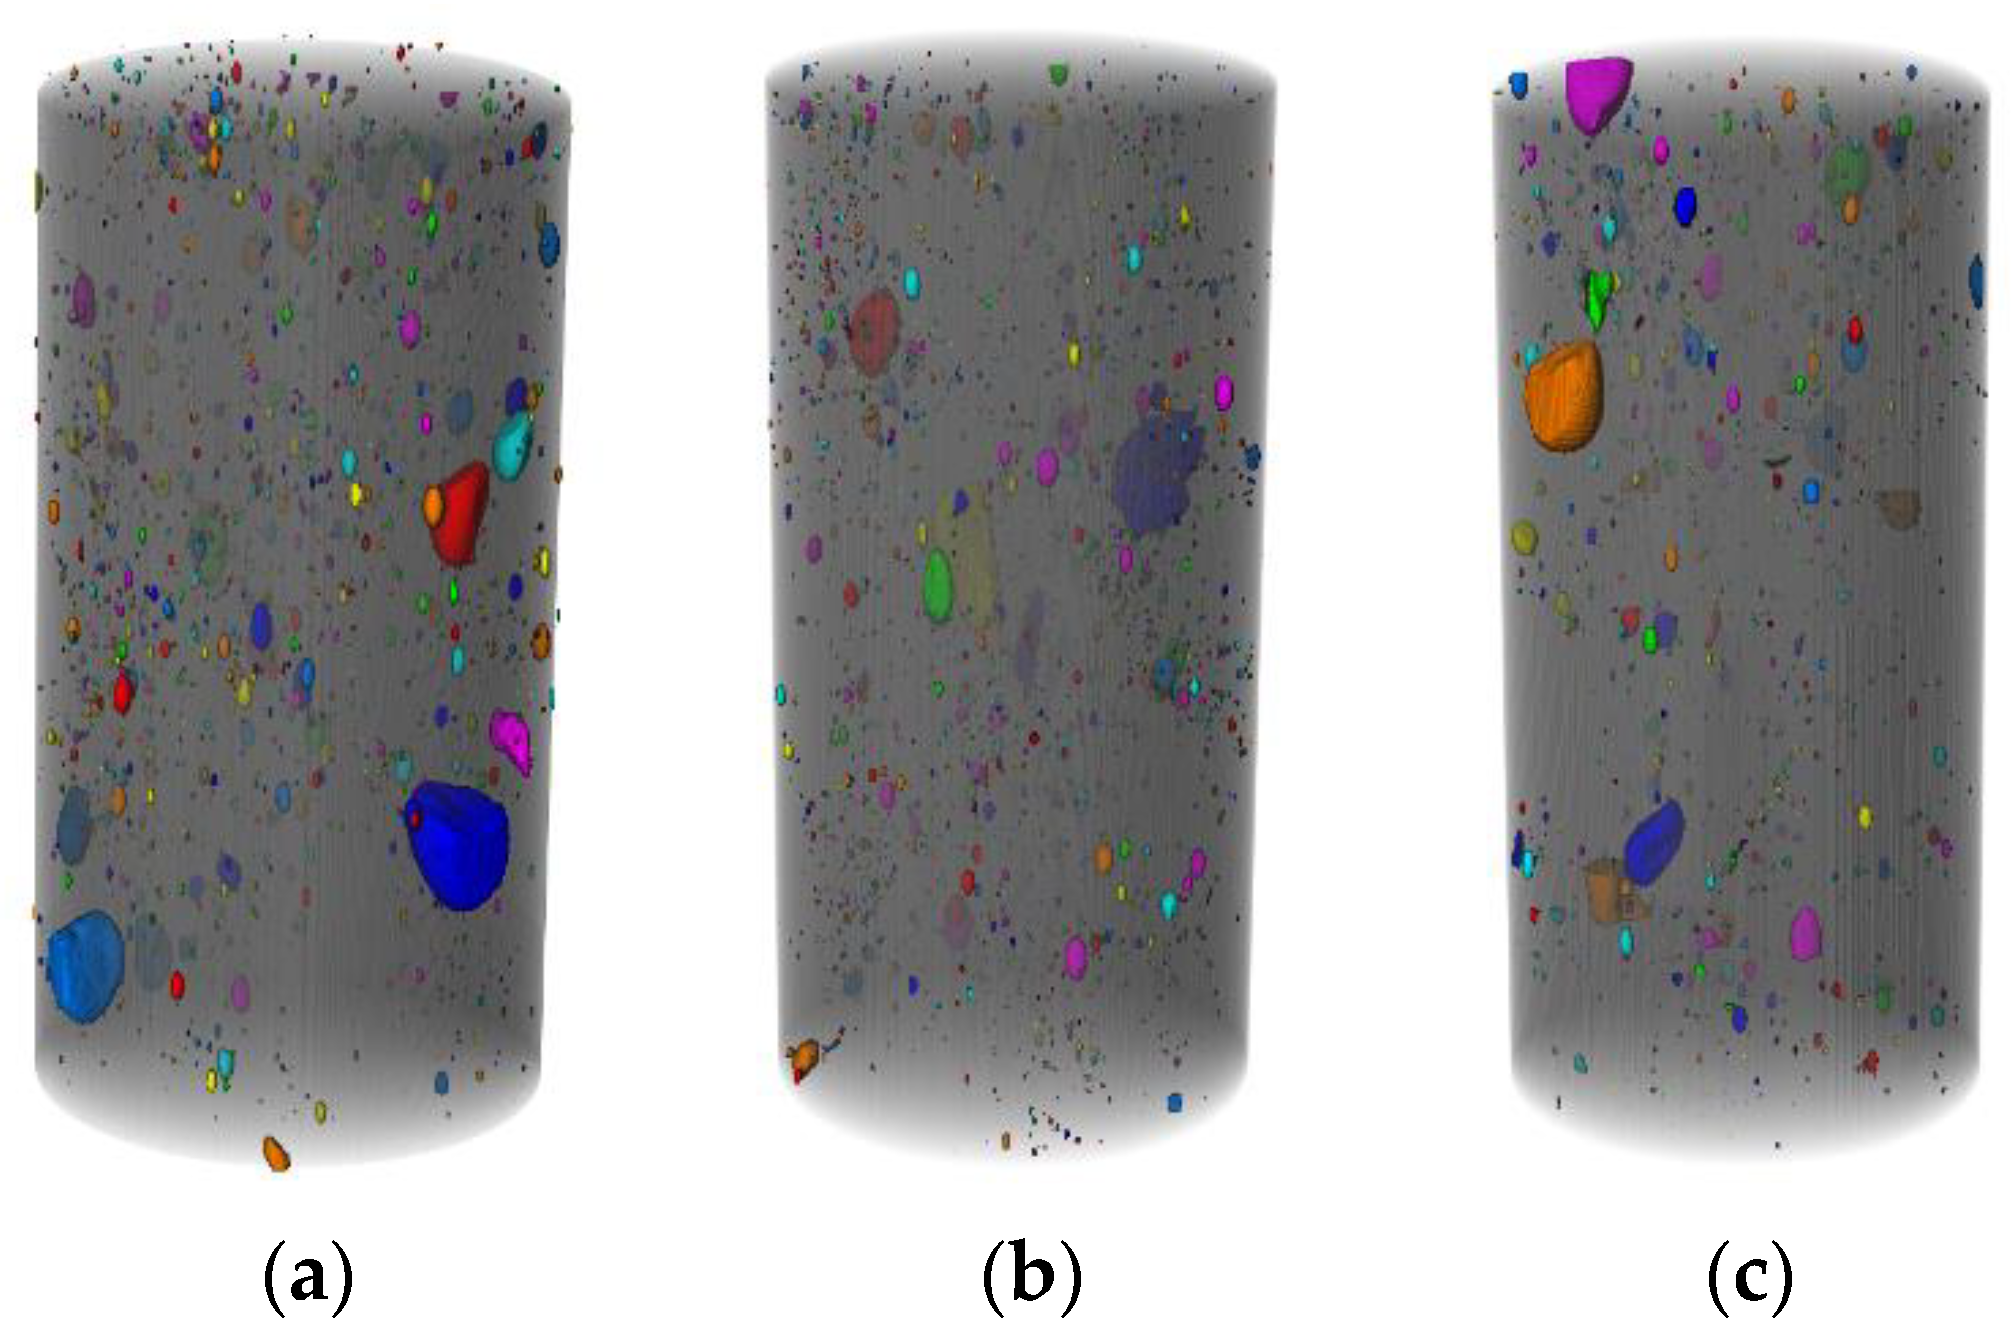
The scanning results of the H2, H5, and H8 groups of samples were processed, and the three-dimensional pore distribution characteristics inside each group of samples are shown in
Figure 13. The porosity changes of the H2, H5, and H8 specimens under the condition of multi-scale fiber mixing are the same as those of the orthogonal experimental group. With the increase in fiber content, the porosity first decreases and then increases, showing a range of 35.9% and 22%, respectively.
As shown in
Table 6, when the same fiber content is added, the porosity of the sample is relatively small and the number of pores is small; however, the average pore diameter is relatively large under the condition of multi-scale fiber mixing. Under the condition of multi-scale fiber mixing, the porosity of the H2, H5, and H8 samples decreased first and then increased with the increase in BF content, showing changes of 35.9% and 22%, respectively.
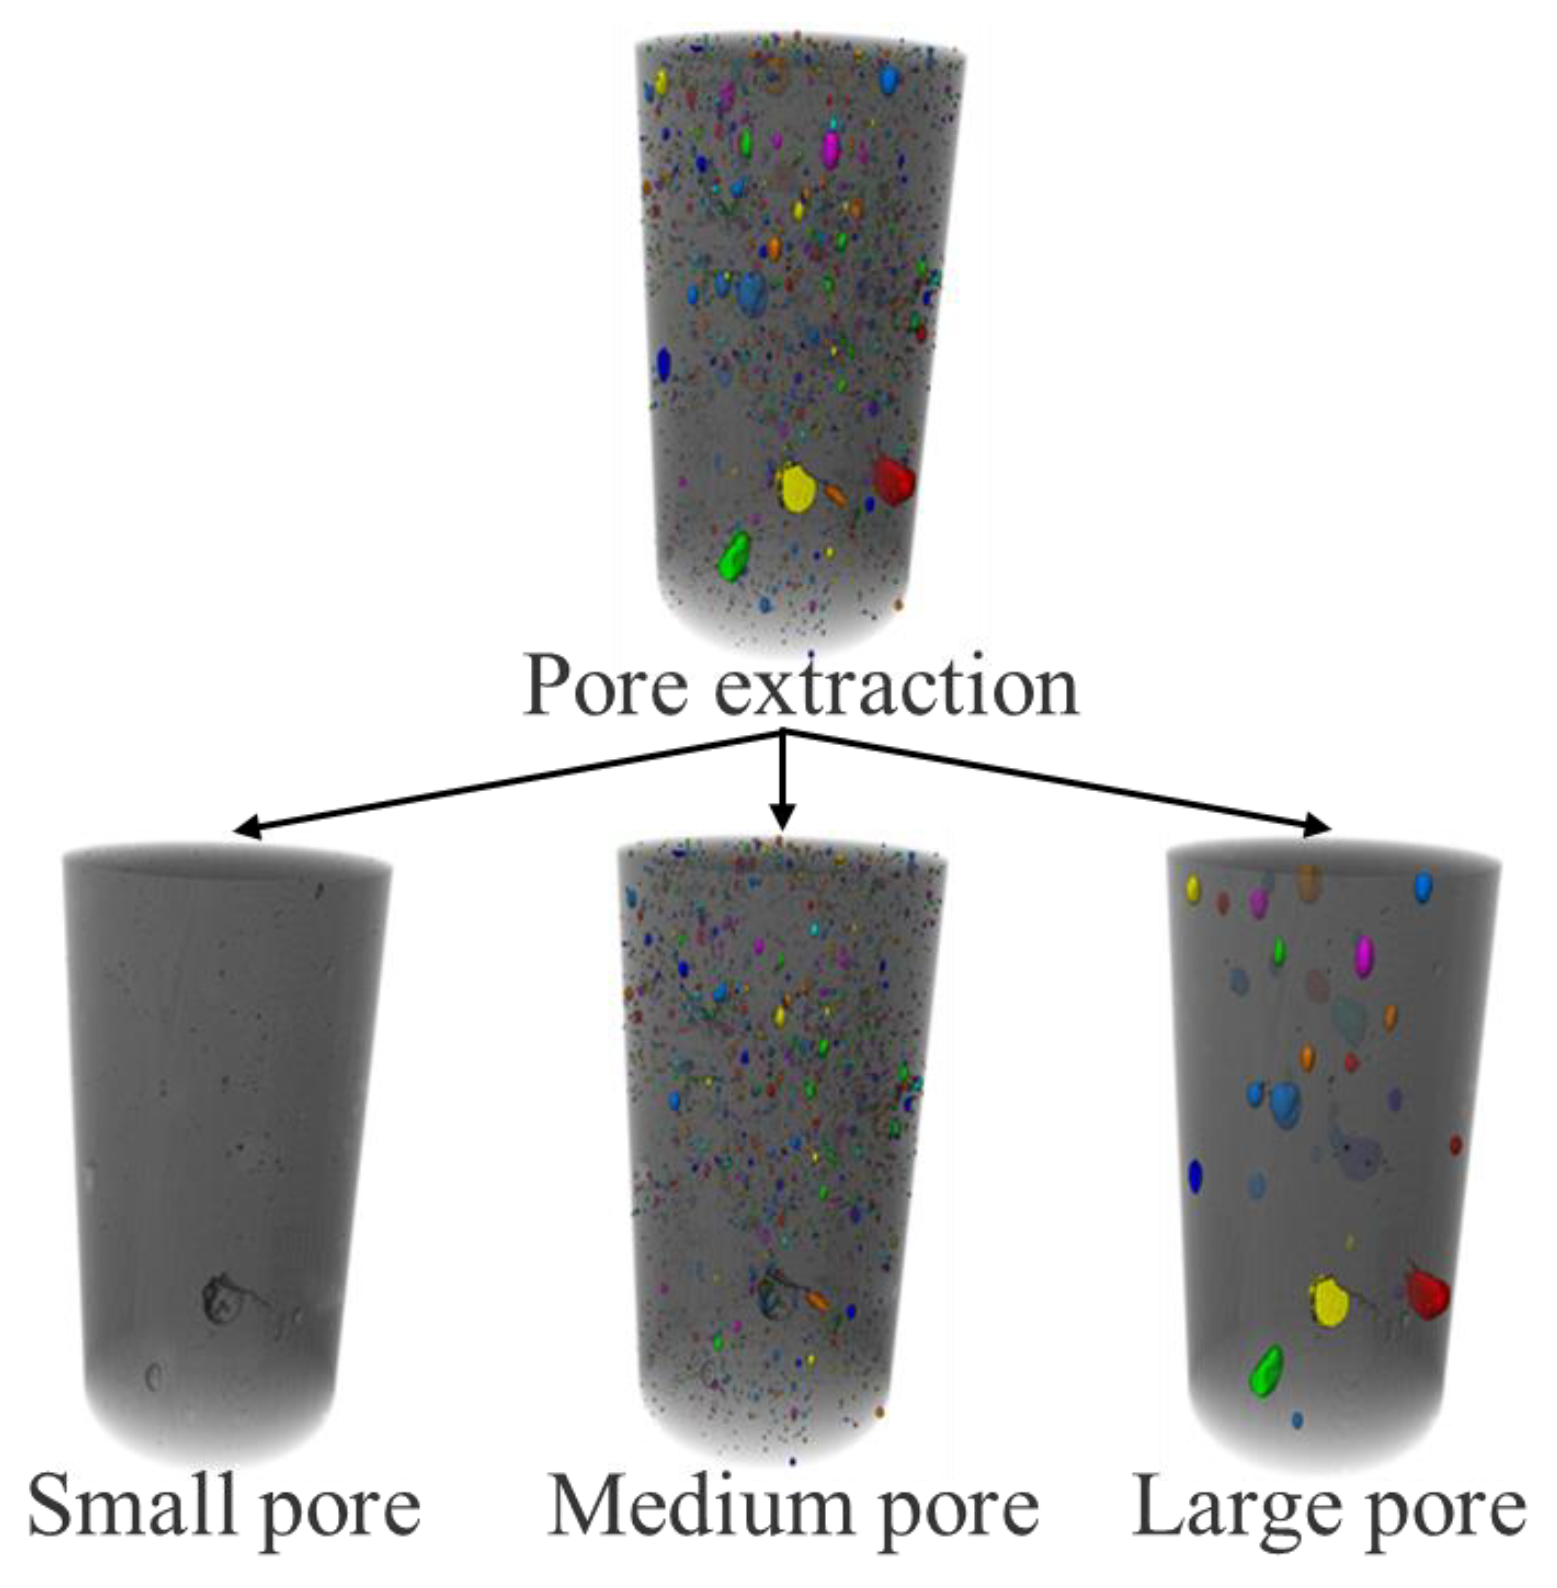
In the pore model, according to the equivalent diameter of pores, they can be divided into macropores, mesopores, and micropores. The equivalent diameter is greater than 1000 μm, which is called a macropore. Pores with a diameter between 100 μm and 1000 μm are called mesopores, while pores with a diameter less than 100 μm are called micropores, as shown in
Figure 14.
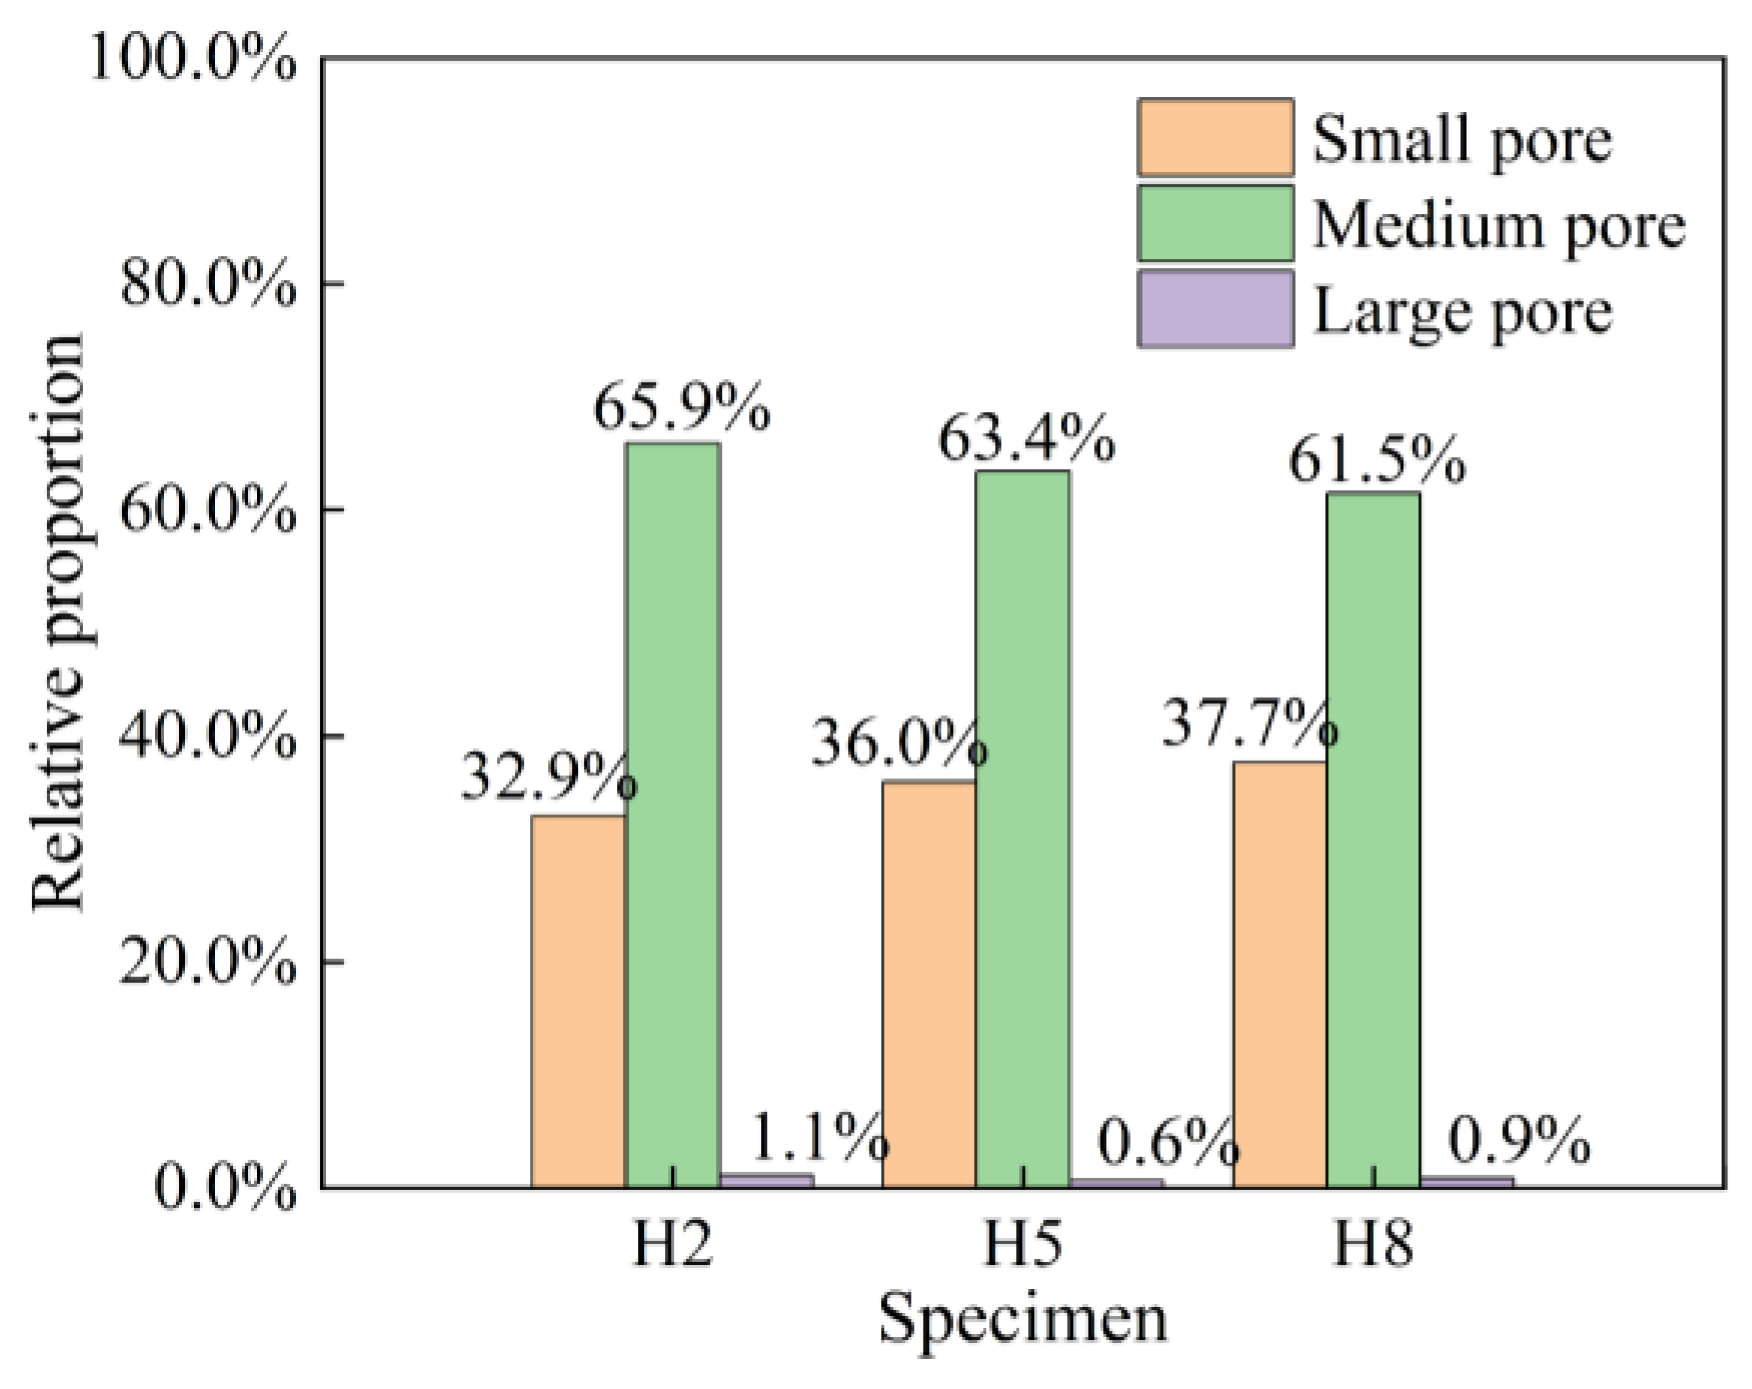
Figure 15 shows the proportion of the number of pore types within the sample.
It can be seen that the pores of each sample are mainly composed of medium pores, followed by a proportion of small pores. The improvement effect of internal pores in the sample is more significant under the mixing of multi-scale BF. As the BF content increases, the proportion of pores in the filling body gradually decreases, the proportion of small pores gradually increases, and the proportion of large pores also shows a trend of first decreasing and then increasing. Comprehensive analysis shows that the best improvement effect of BF on the internal pore structure of the filling body is achieved during the mixing of multi-scale BF.
4.4. Backfill Fiber Distribution
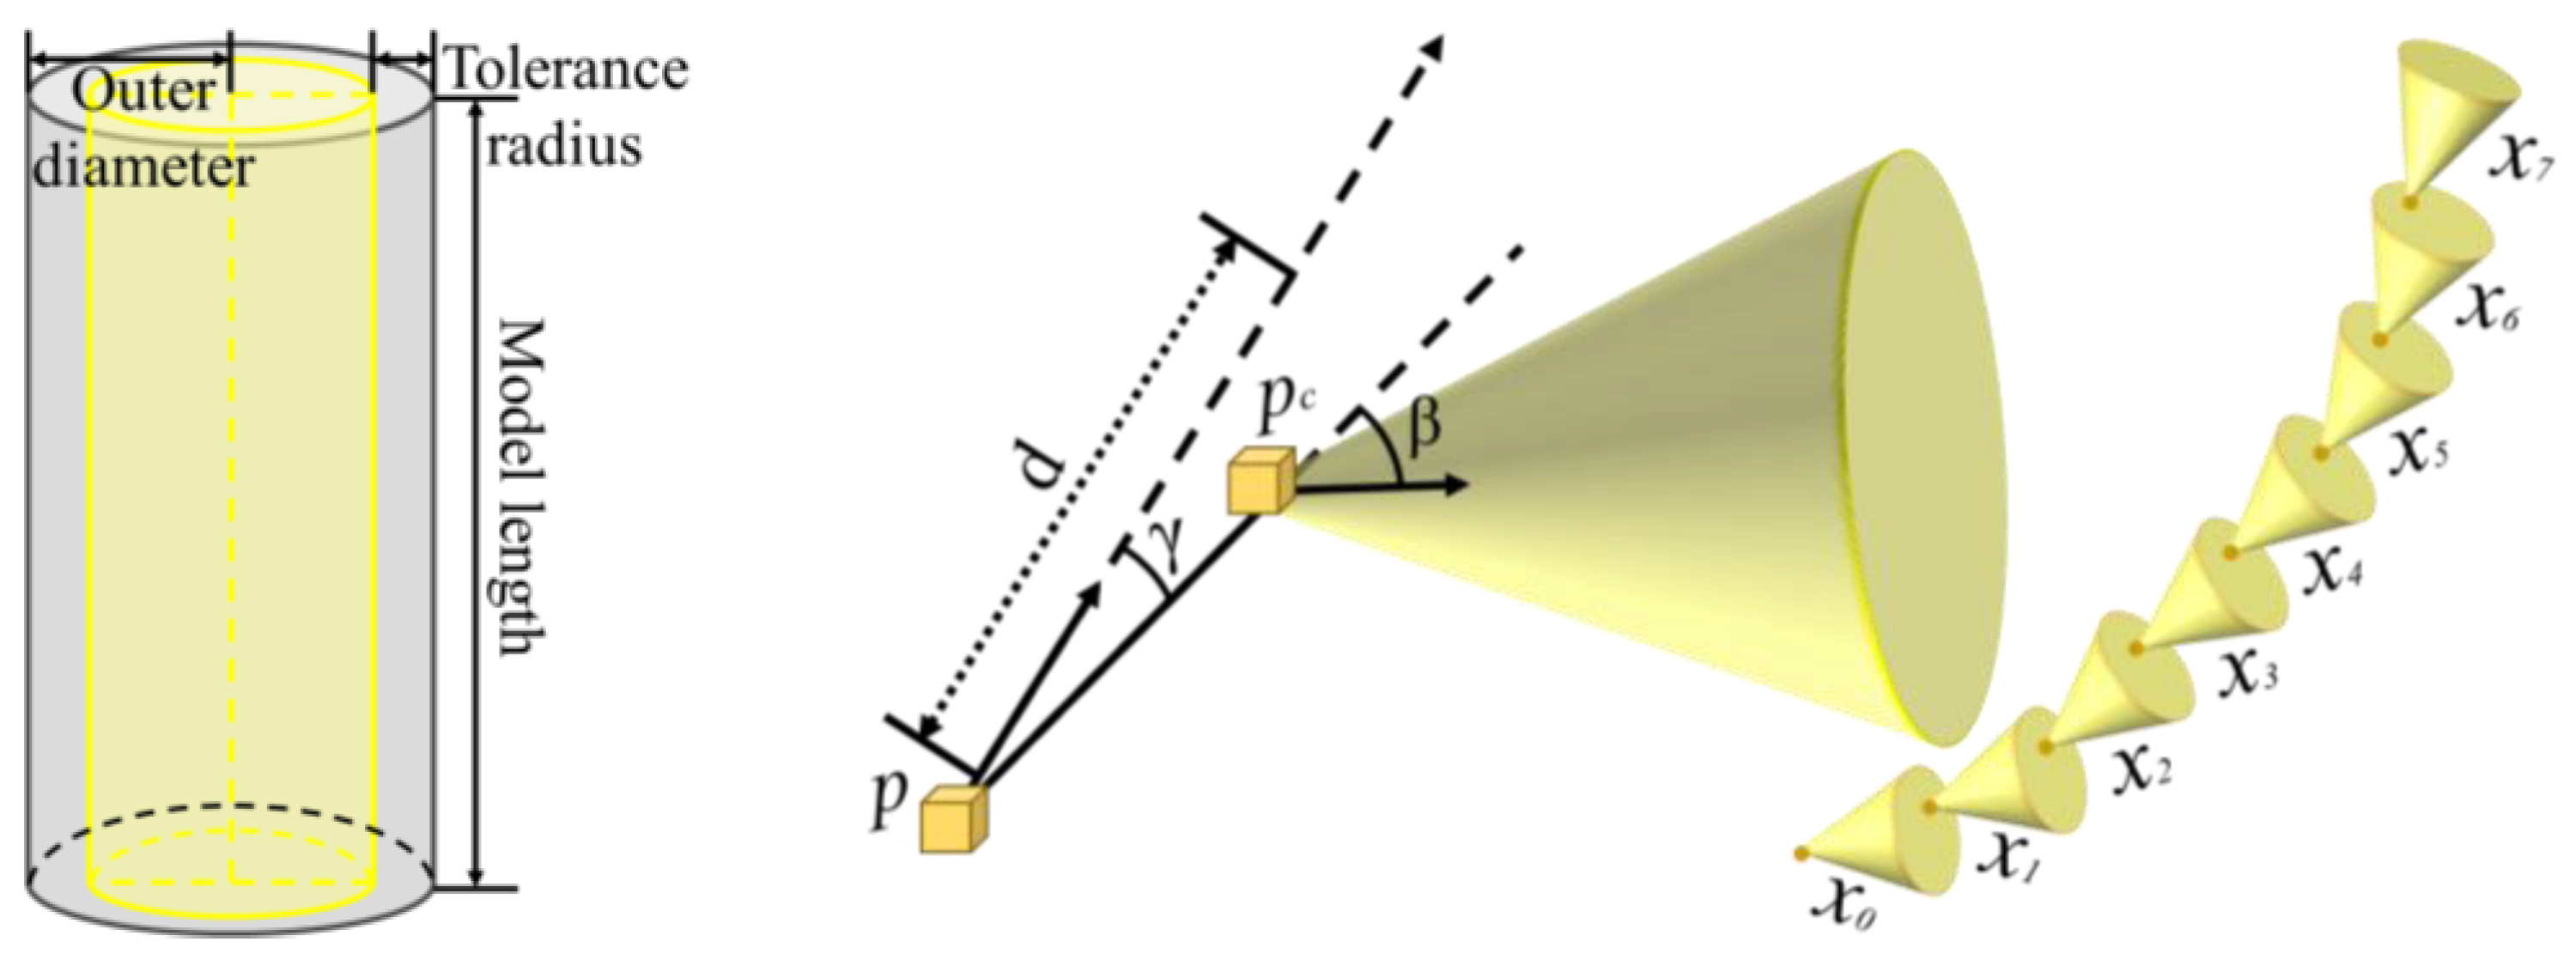
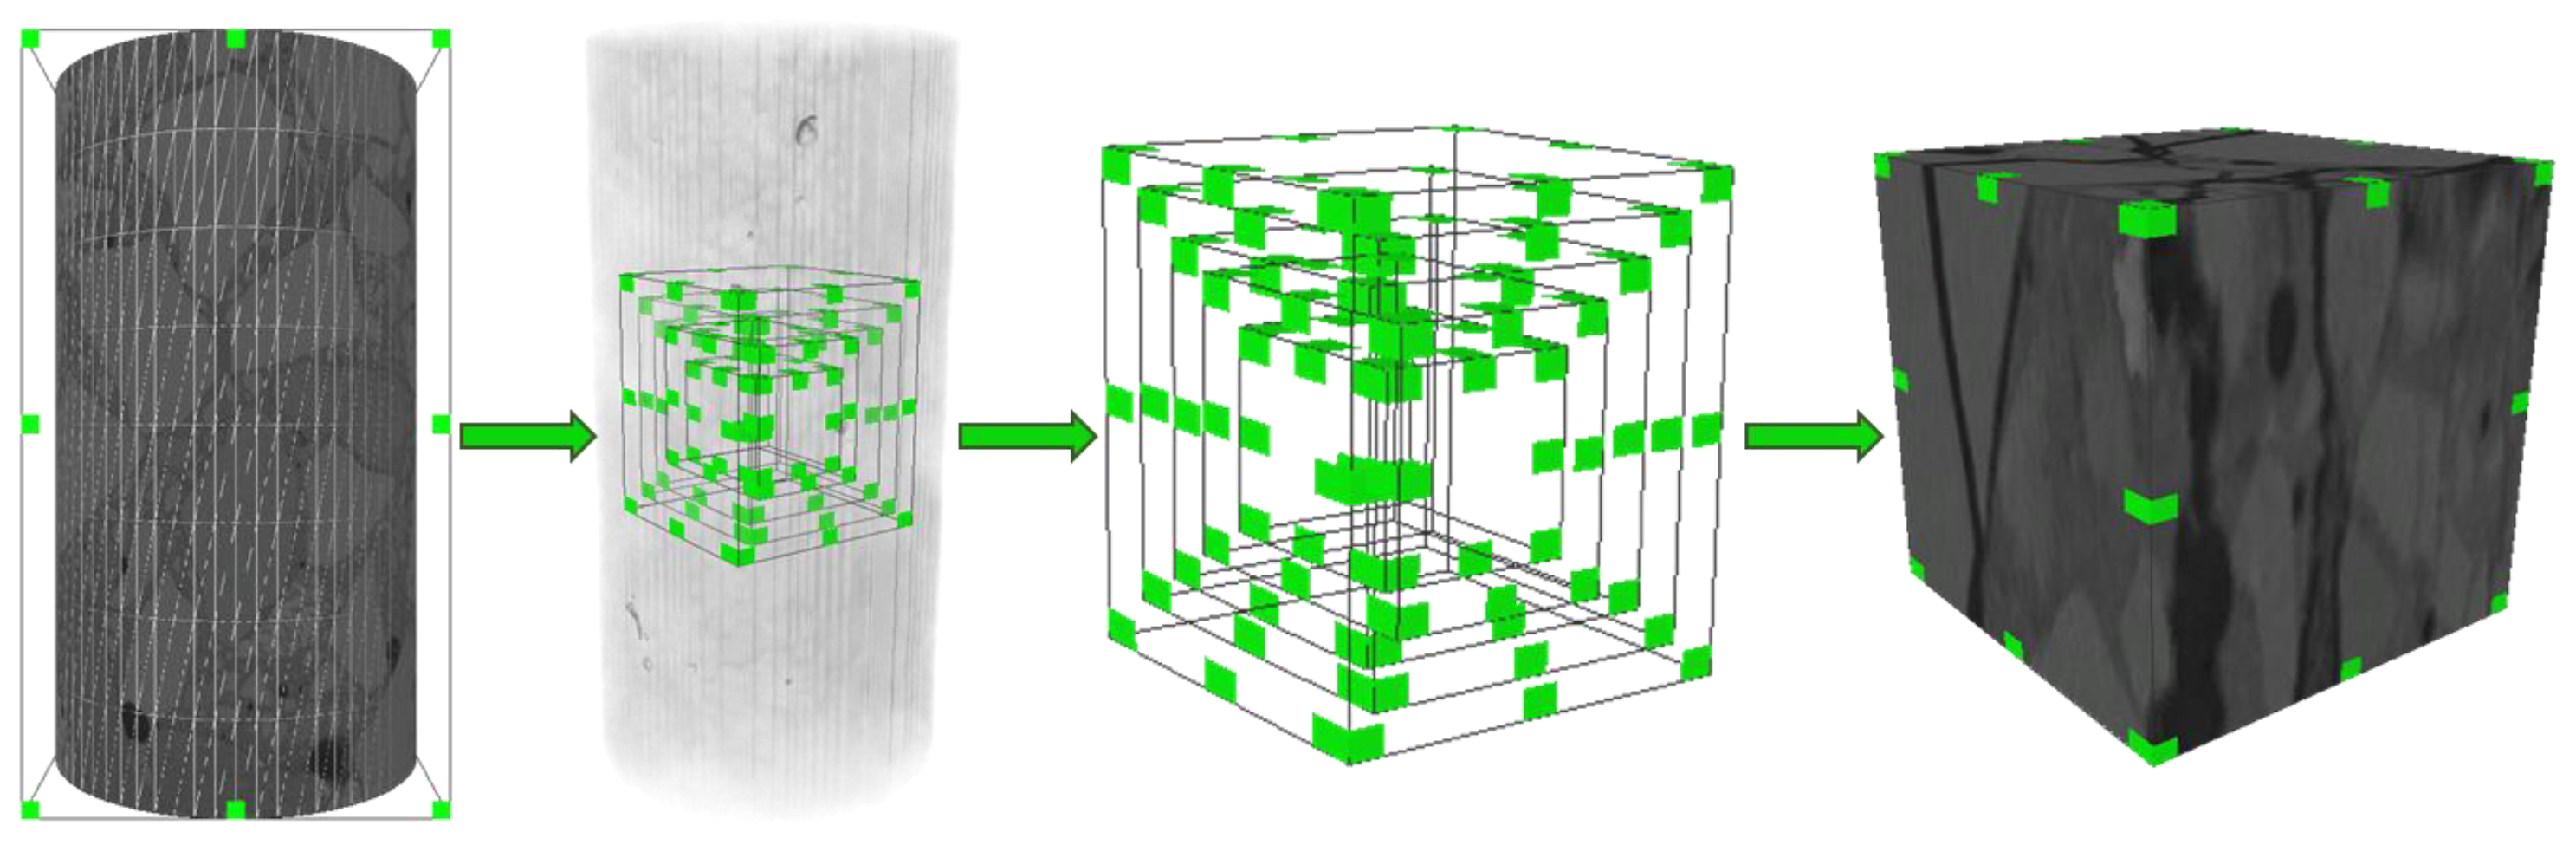
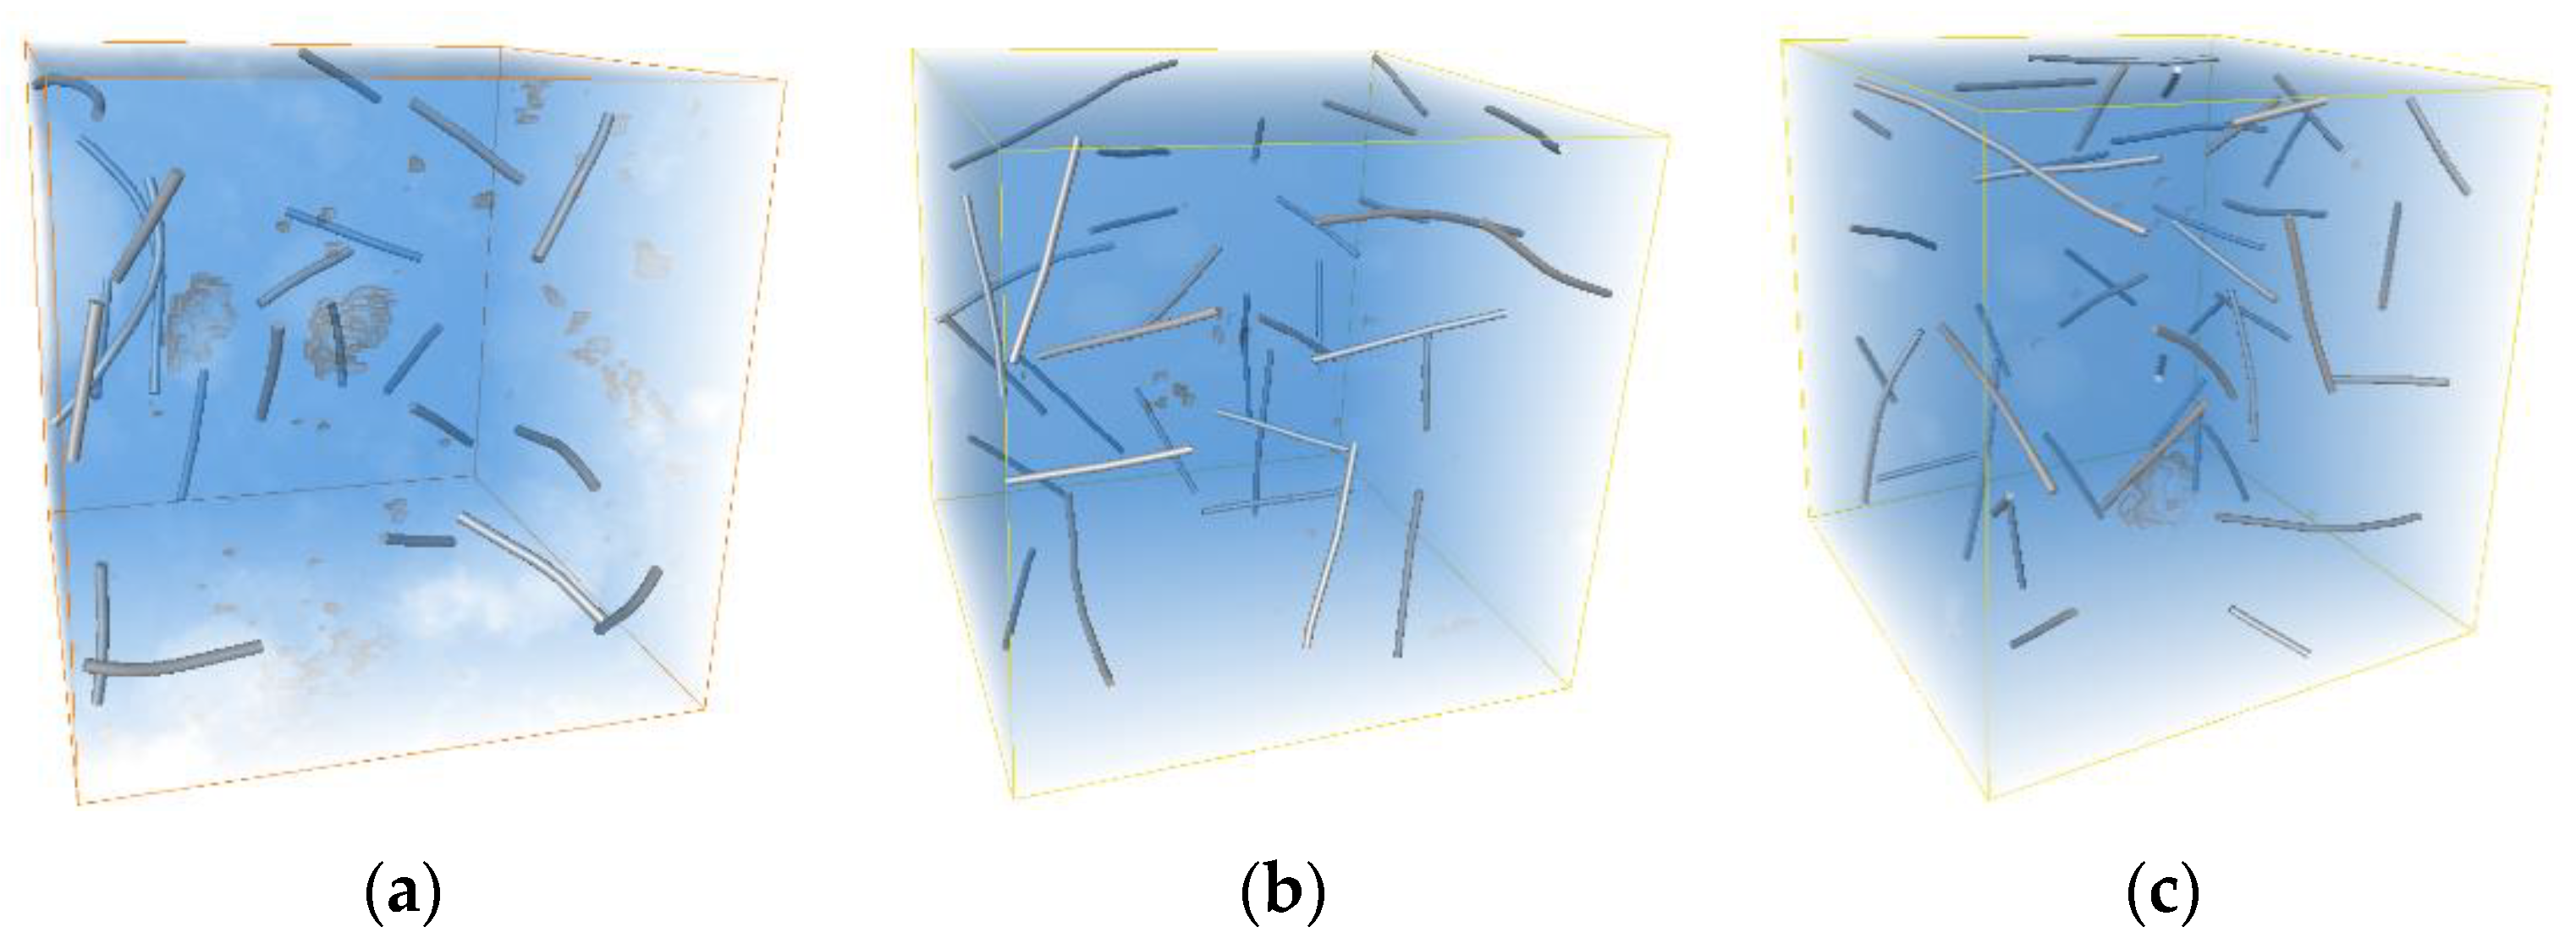
Due to the large size obtained from CT scanning, fiber tracking of the entire sample area requires too much memory and is not easy to calculate. Therefore, after considering the memory size and computing power of the computer, the cube area at the center of the sample was selected for fiber tracking reconstruction processing, as shown in
Figure 16.
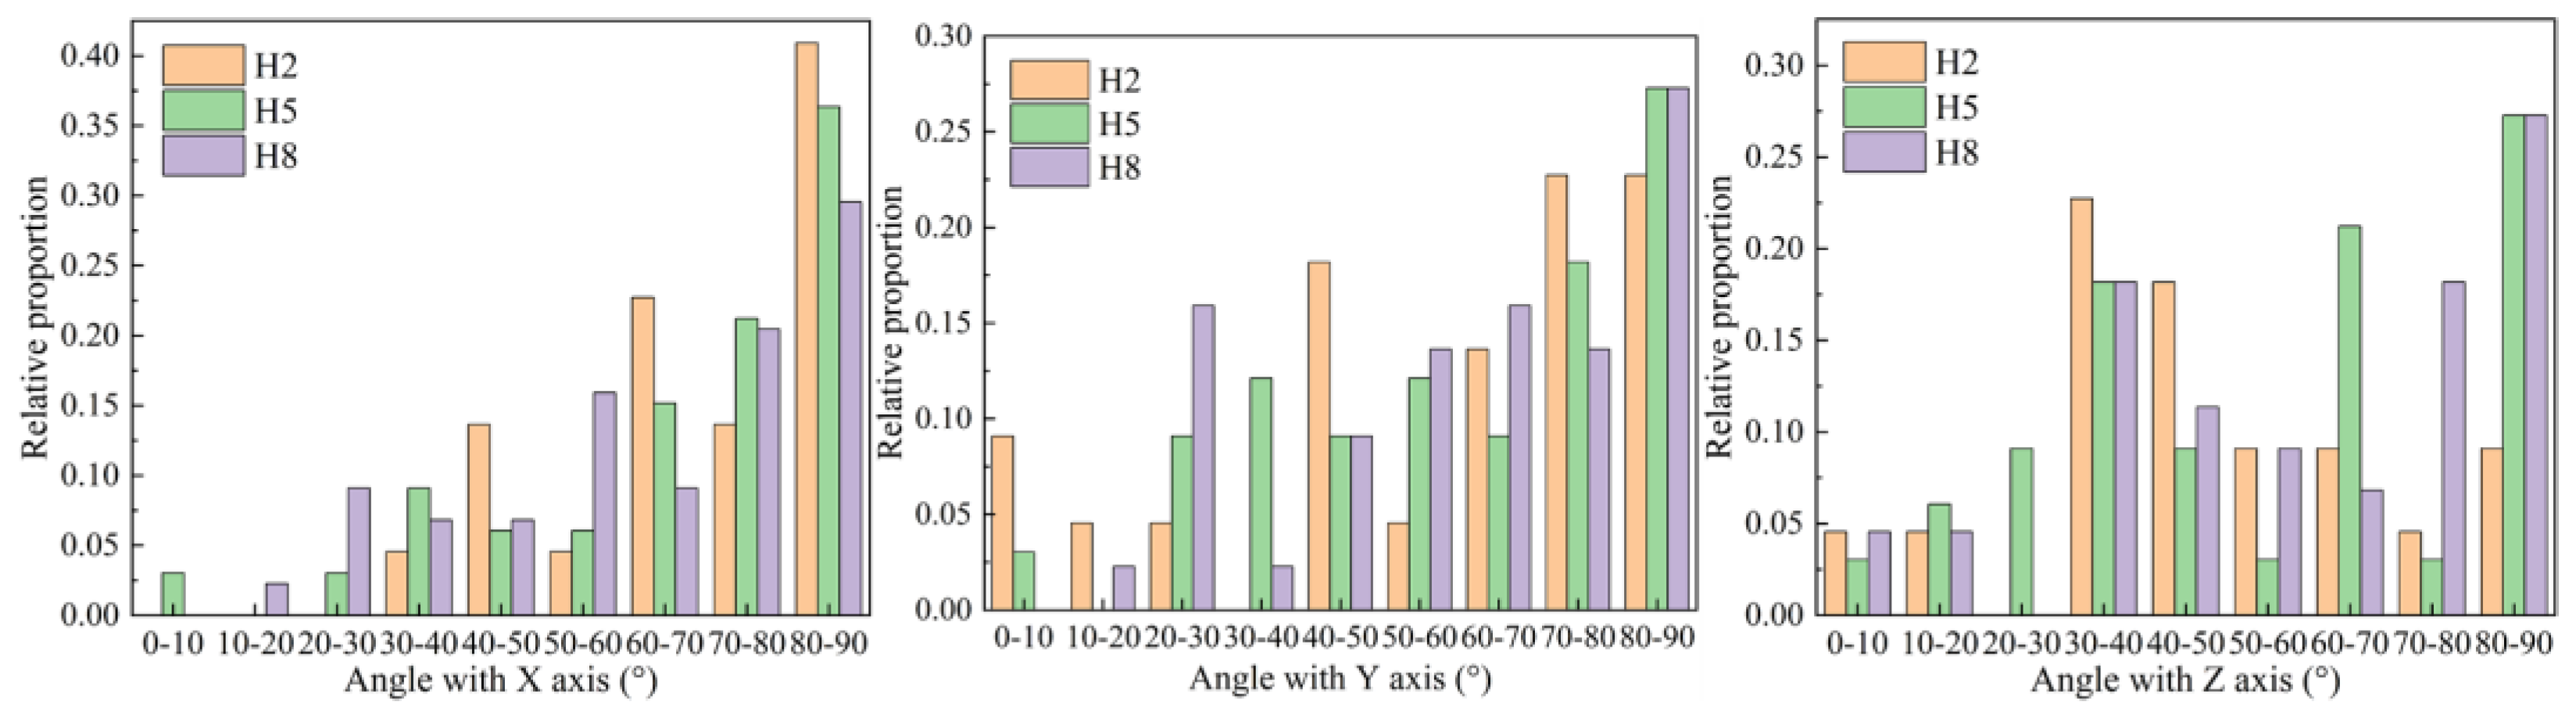
In
Figure 17, in the H2, H5, and H8 groups, the relative frequencies of BF and
X-axis in the range of 80°~90° are the largest, which are 0.41, 0.38, and 0.3, respectively. Compared to the other two groups, the H2 group has a lead angle distribution ranging from 40° to 90°. The angles between the three groups and the
Y-axis are relatively evenly distributed within 0° to 90°, and there are no significant features. The angle between BF and
Z-axis in the H2, H5, and H8 groups is concentrated within 30° to 90°, while the BF distribution angle in the H2 group shows a gradually decreasing trend within 30° to 90°.
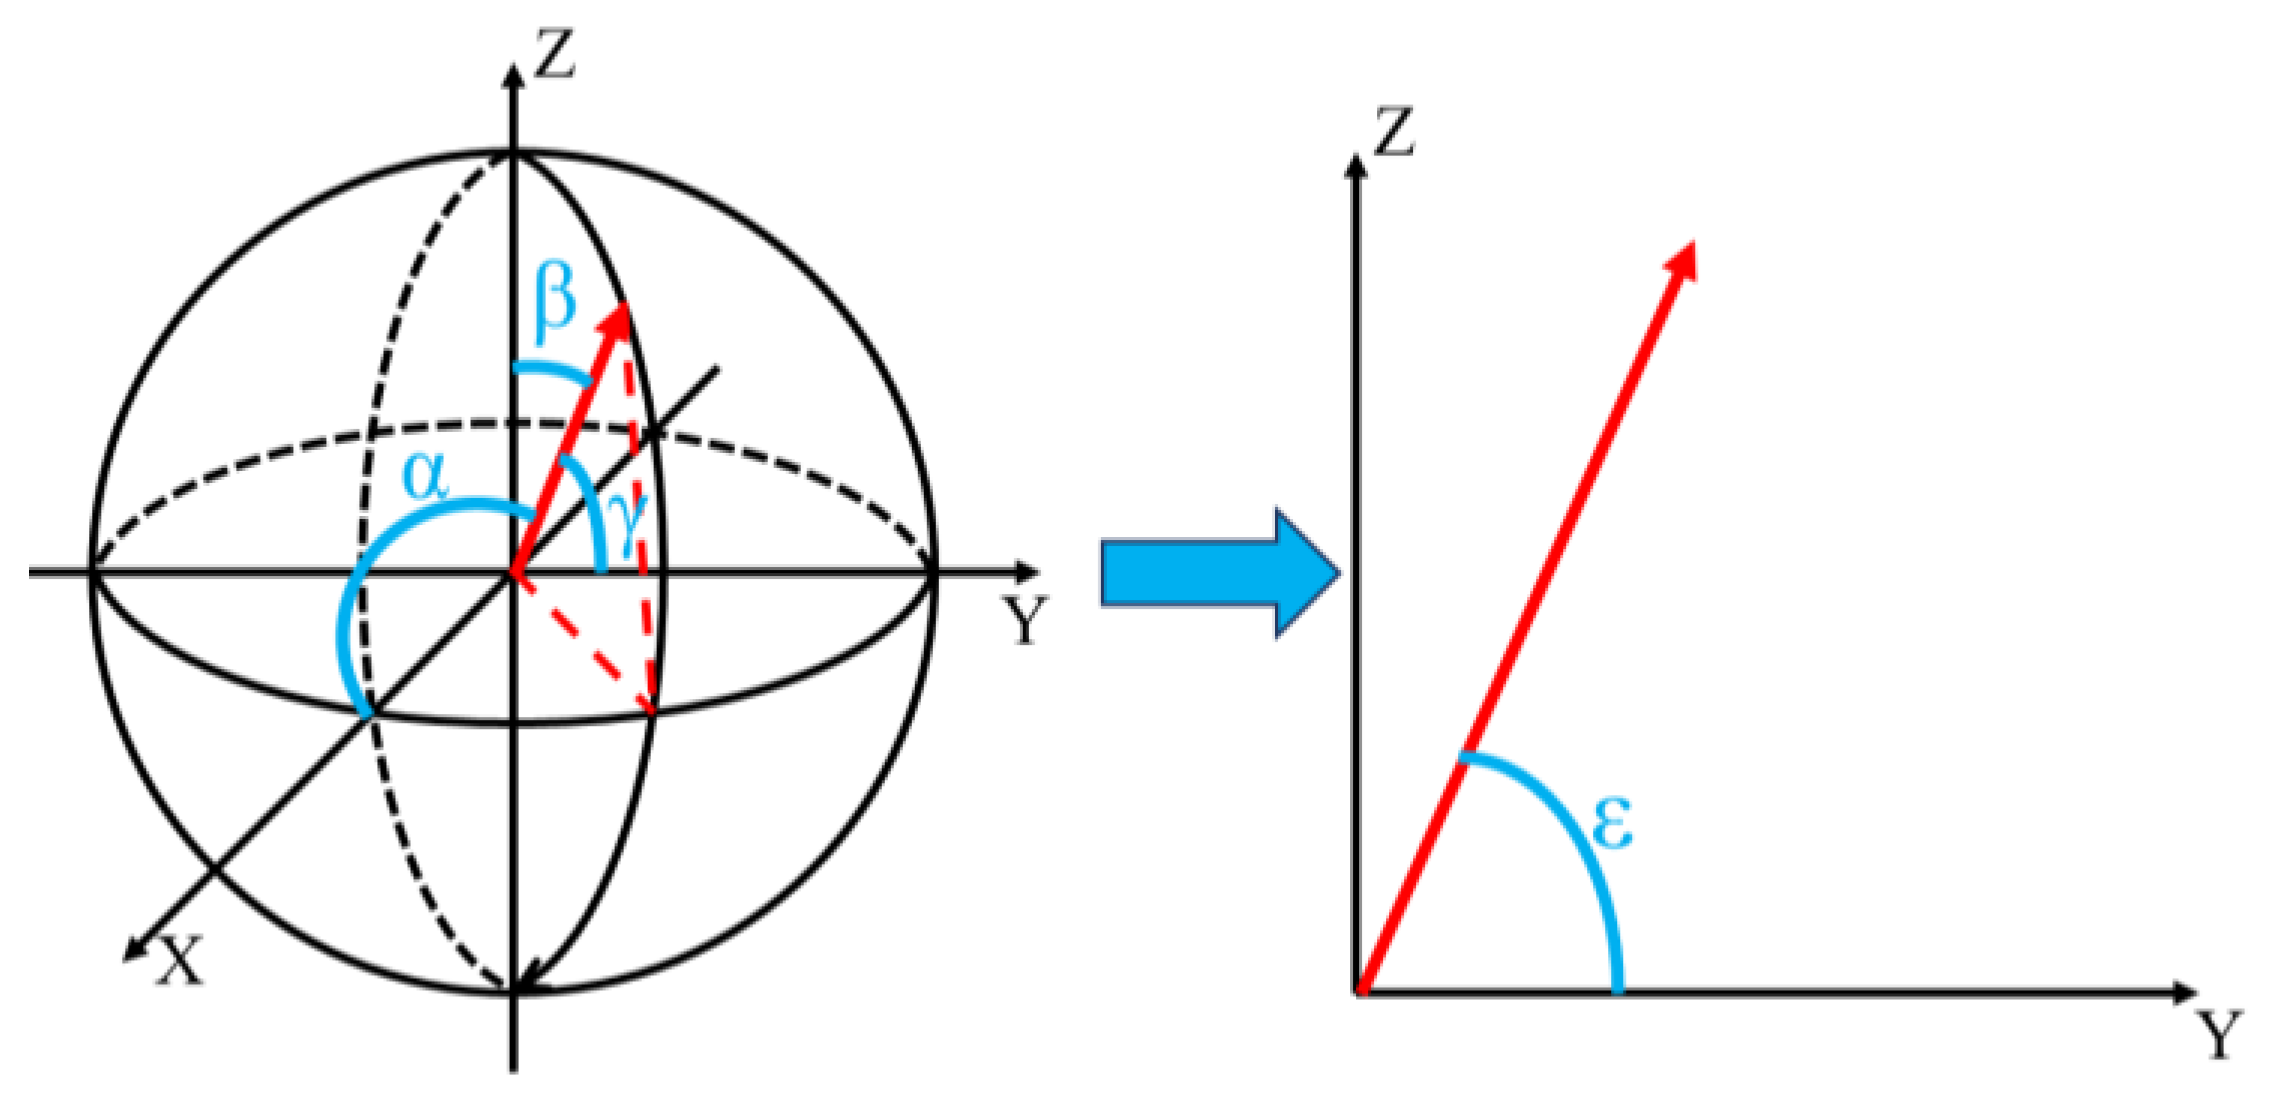
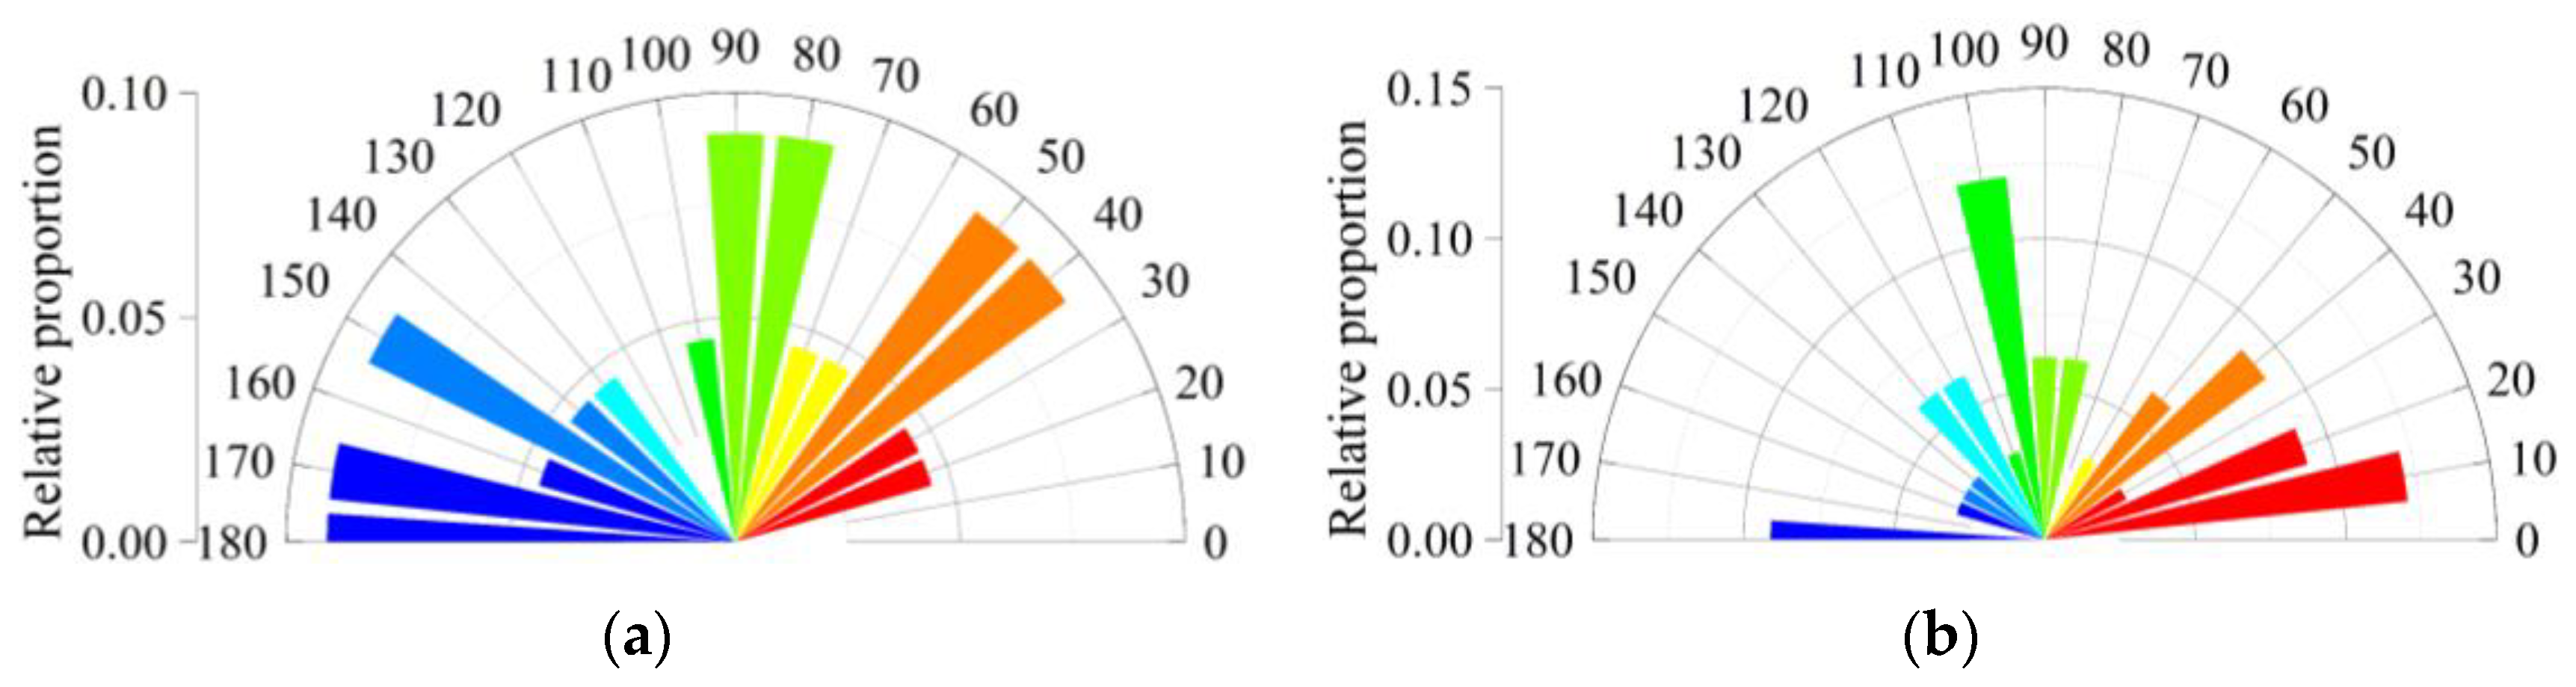
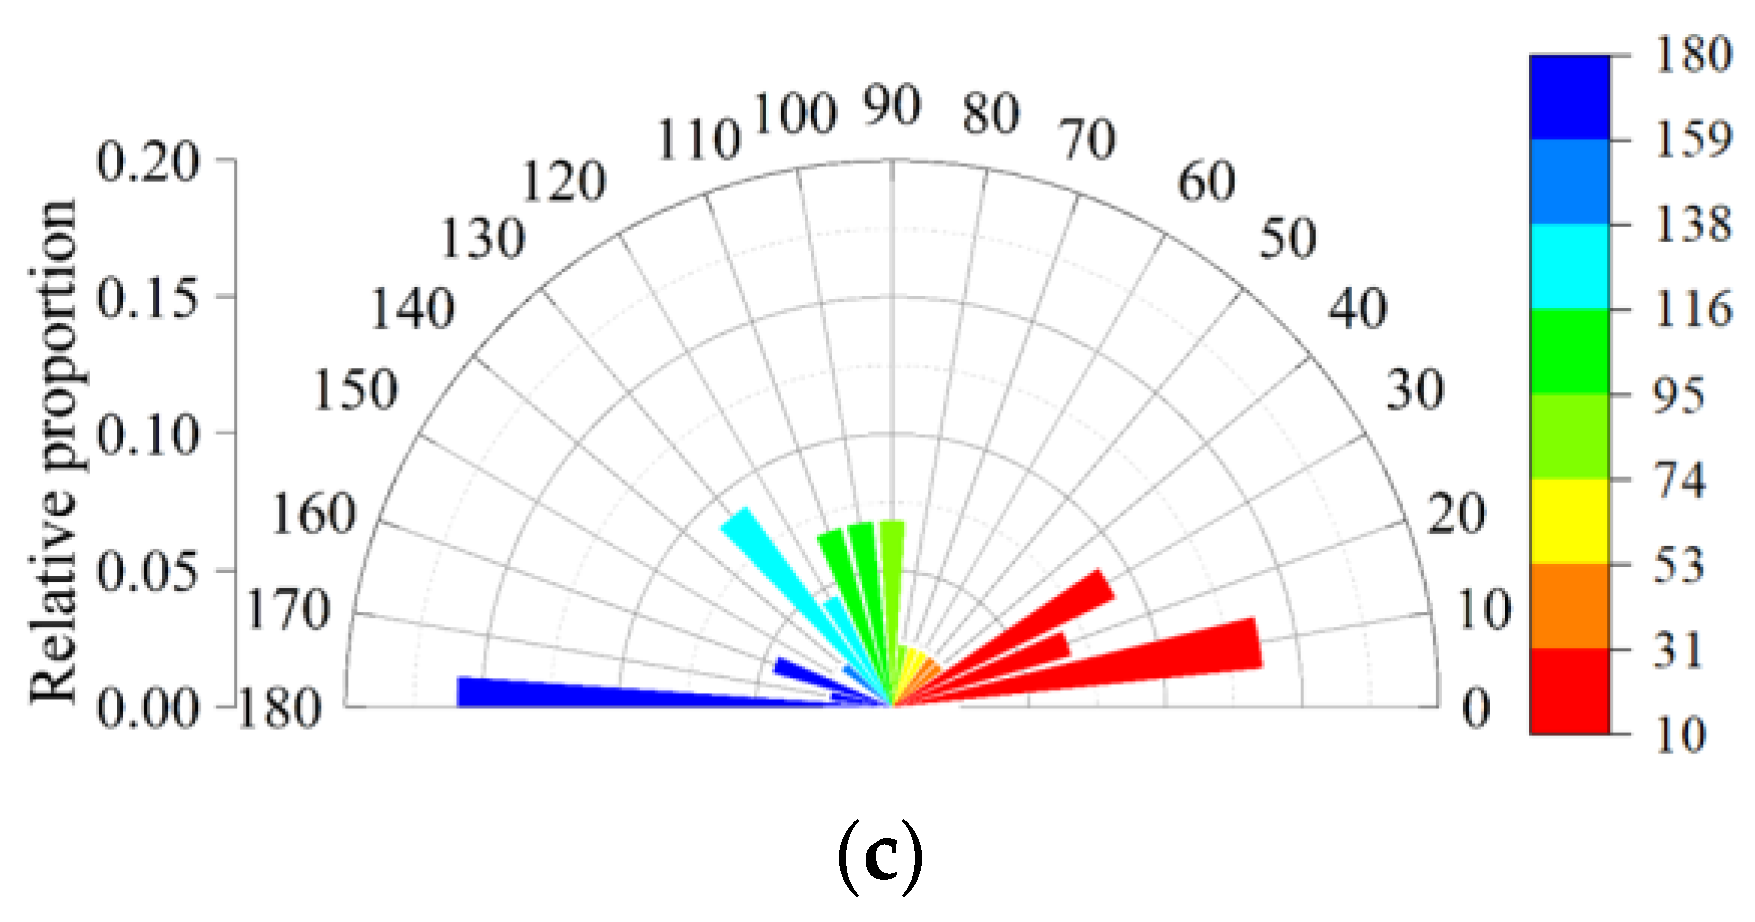
Convert the three-dimensional Cartesian coordinate angle of BF into a two-dimensional plane angle, and the relative frequency of BF distribution under the plane angle in each group of samples is shown in
Figure 18. The angle distribution range of BF in the H2 group sample mixed with multi-size BF is wider, and its main distribution range is 40°~50°, 80°~90° and 150°~180°. When the BF content increases to 3.0 kg·m
−3 and 4.5 kg·m
−3, the BF angle distribution range becomes more concentrated and tends in the horizontal direction. The distribution characteristics of BF in the H8 group are particularly significant, and the relative frequencies of BF angle distribution at 10° and 180° reach 0.136 and 0.159, respectively.
4.5. Backfill Mesoscopic Discrete Element
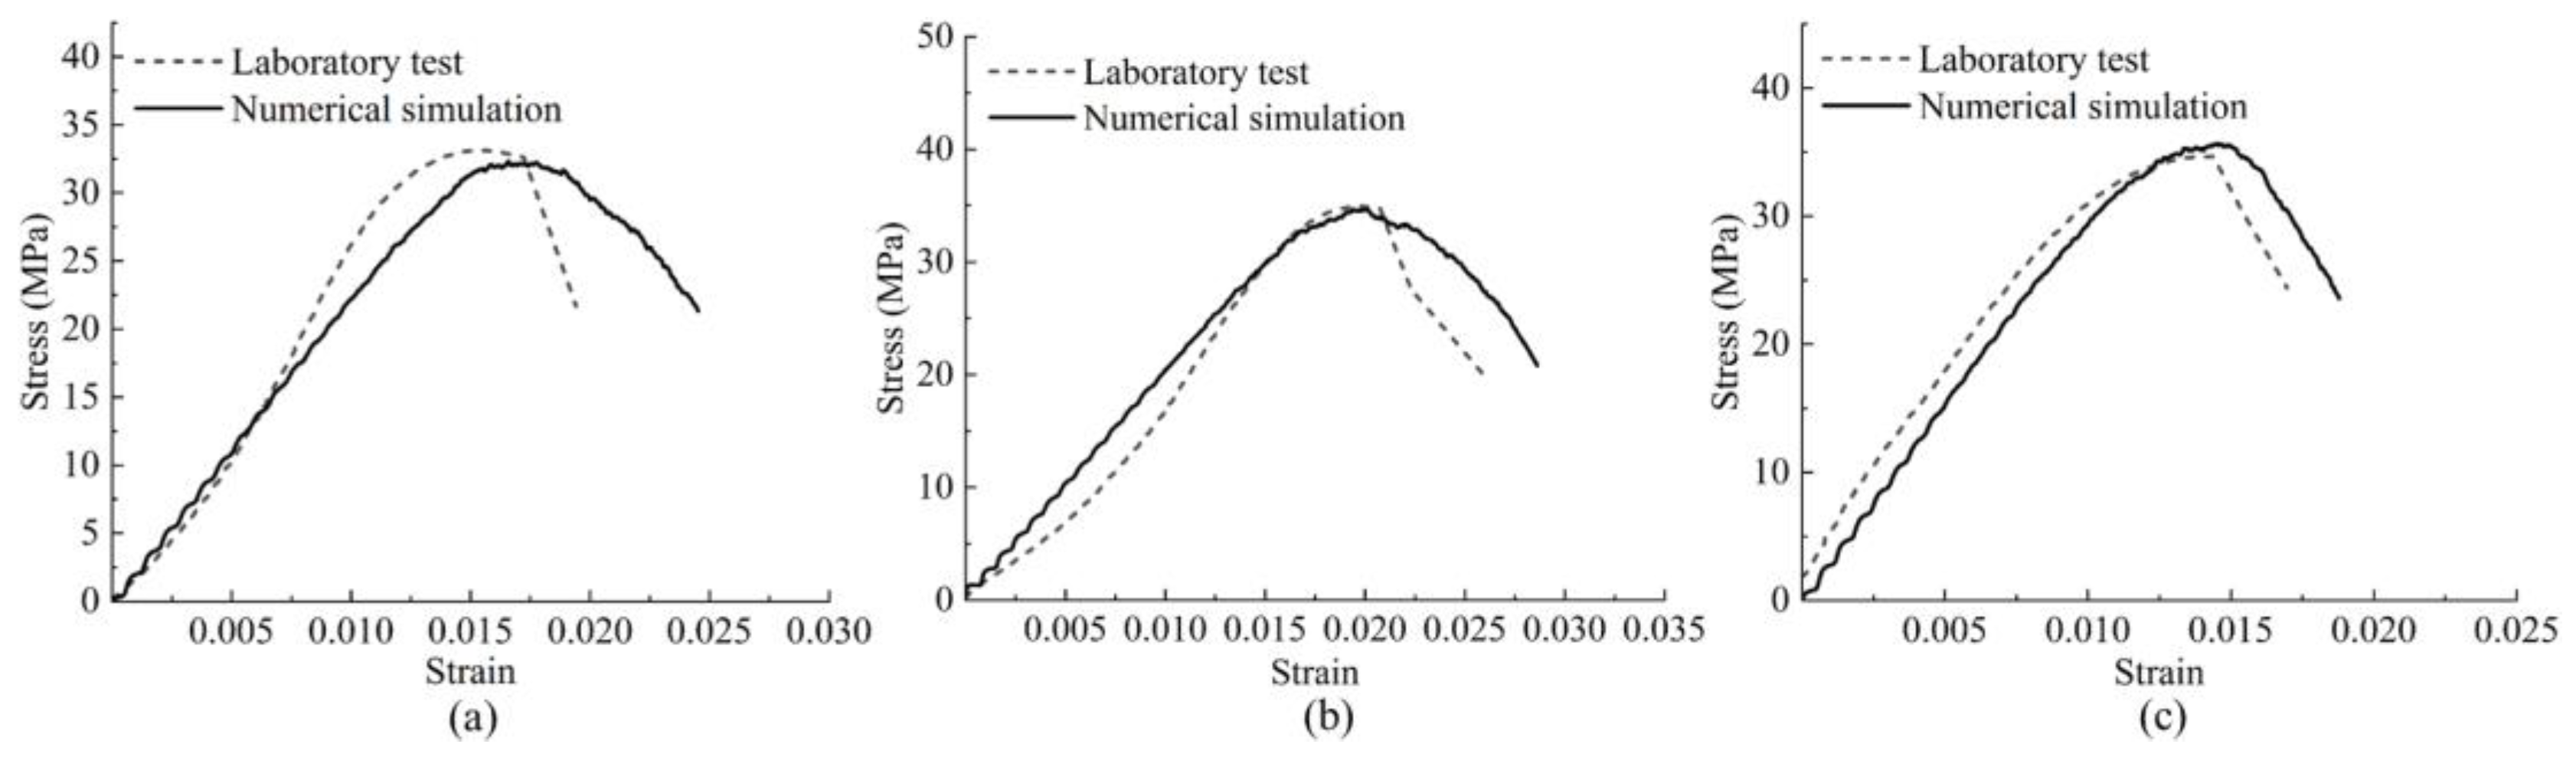
In order to make the backfill compression test model fully correspond to the laboratory test process in the loading process, the calibration of the microscopic parameters of the backfill compression test model is completed by comparing the stress–strain curve of the numerical simulation process and the laboratory test. The calibration process is shown in
Figure 19. By adjusting the values of pb_emod, pb_coh, and pb_ten in the model micromechanical parameters to match the stress–strain curve of the laboratory test and simulation test, the final adjusted micromechanical parameters based on the curve calibration results in
Figure 19 are shown in
Table 7.
Due to the irregularity of the force-displacement curve obtained from the splitting tensile test simulation and the difficulty in matching the curve obtained from the laboratory test process, it was chosen to control the elastic modulus of the model by keeping the values of ball_emod and pb_emod unchanged on the basis of the microscopic parameters of the compressive test model. By adjusting the sizes of pb_coh and pb_ten, the loading force at the time of model failure was similar to that of the laboratory test. The final parameter calibration results are shown in
Table 8.
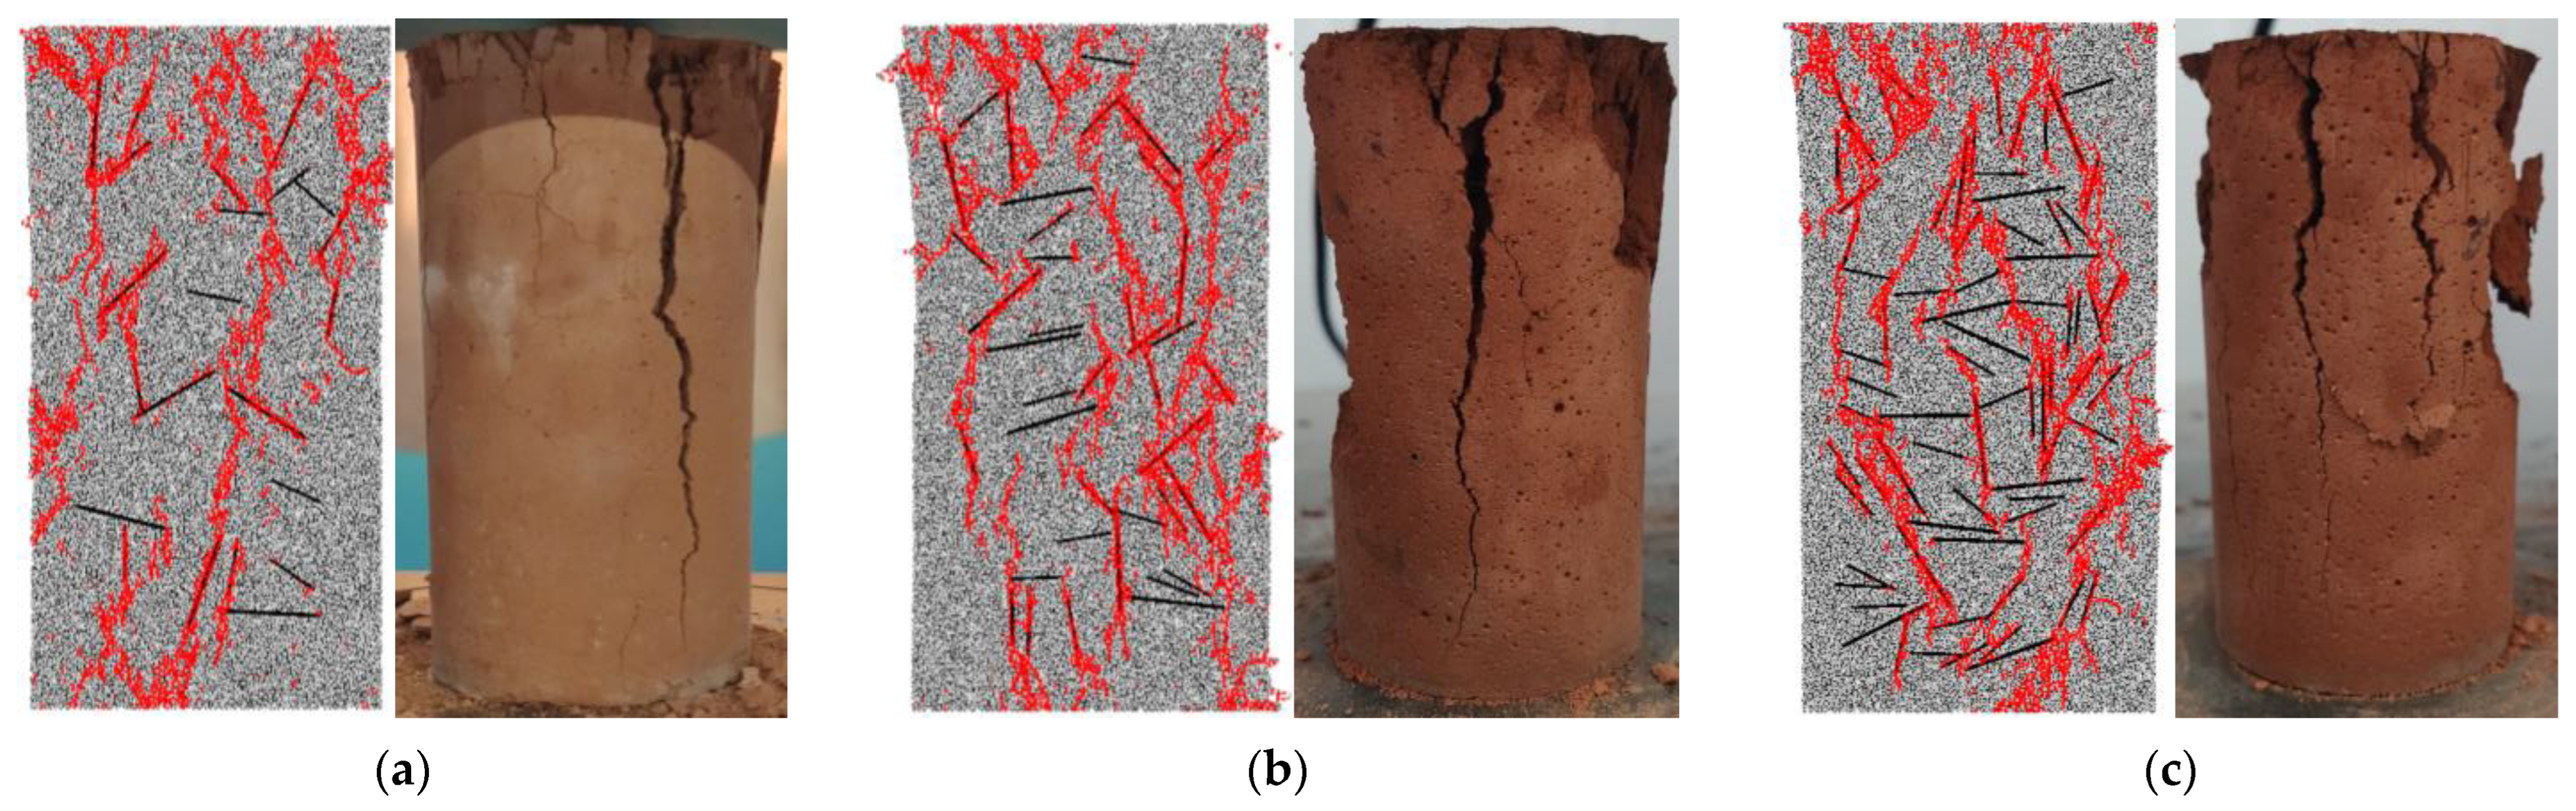
The failure mode of the discrete element model of the filling body under parameter calibration is similar to the laboratory test results, indicating the feasibility of conducting a discrete element simulation of the filling body. As shown in
Figure 20, the fracture characteristics of the compressive model in the multi-scale BF mixing test are shown in red lines. Moreover, the comparison of the damage situation of the laboratory test samples shows that there is a small difference between the damage characteristics of the discrete element model of the filling body and the laboratory test. The main reason for the analysis is the randomness of the distribution of coarse aggregate and BF within the sample. Due to the mixing of multi-scale BF, the H2, H5, and H8 models exhibit high residual strength in terms of failure. On the one hand, due to the randomness of the shape and distribution of aggregates within the model, there is no significant change in the failure patterns of each group of models. On the other hand, although the compressive failure characteristics of the numerical model are similar to those of laboratory experiments, the construction of the two-dimensional model cannot fully reflect the failure characteristics of backfill.
The data obtained in the discrete element simulation (
Figure 21) show that the angle distribution range of BF of the H2 group sample mixed with multi-size BF is wider, and its main distribution range is 40°~50°, 80°~90° and 150°~180°; When the BF content increases to 3.0 kg·m
−3 and 4.5 kg·m
−3, the BF angle distribution range becomes more concentrated and tends to the horizontal direction. The distribution characteristics of BF in the H8 group are particularly significant, and the relative frequencies of BF angle distribution at 10° and 180° reach 0.136 and 0.159, respectively. Overall, the orientation of BF in space is mostly close to the horizontal direction, and the conclusions obtained are consistent with those in the reconstruction model, confirming the feasibility of discrete element simulation of filling bodies.


 ,
, 


