Article

Source and Migration of Fluids in a Meso-Tethyan Subduction Zone: Fluid Inclusion Study of Syn-Mélange Veins from the Mugagangri Accretionary Complex

1
College of Earth Sciences, Chengdu University of Technology, Chengdu 610059, China
2
School of Earth Sciences, Yunnan University, Kunming 650500, China
*
Author to whom correspondence should be addressed.
Minerals 2023, 13(9), 1196; https://doi.org/10.3390/min13091196
Submission received: 14 July 2023 / Revised: 5 September 2023 / Accepted: 7 September 2023 / Published: 12 September 2023

Abstract

:
The Mugagangri Group (MG), located at the southern margin of the Qiangtang terrane in Tibet, is a crucial research target for understanding the subduction and accretion history of the Meso-Tethys Ocean. Extensional crack-seal veins restricted within sandstone blocks from the broken formation in the MG (Gaize) formed synchronously in the mélange formation. The primary inclusions trapped in the veins recorded multiple pieces of information during the formation of the accretionary wedge. To precisely constrain the MG subduction–accretion processes, we investigated the trapping temperature, salinity, density, and composition of the fluid inclusions within the crack-seal veins derived from the broken formation in the MG (Gaize). The primary inclusions indicate that the crack was sealed at ~151–178 °C. The salinity of the primary inclusions exhibited a well-defined average of 3.3 ± 0.7 wt% NaCl equivalent, slightly lower than the average of seawater (3.5 wt%). There were no nonpolar gases, and only H2O (low salinity) was detectable in the primary inclusions. These characteristics suggest that the syn-mélange fluids were a type of pore fluid in the shallow subduction zone, with the principal source being pore water from sediments overlying the oceanic crust. Because of mineral dehydration and compaction, the pore fluids became more diluted with H2O and fluid overpressure owing to a pore fluid pressure that was greater than the hydrostatic pressure. Subsequently, the creation of cracks through hydraulic fracturing provided a novel pathway for the flow of fluids which, in turn, contributed to the décollement step-down and underthrusting processes. These fractures acted as conduits for fluid movement and played a crucial role in facilitating these peculiar occurrences of quartz veins. The depth (~5 km) and temperature estimates of the fluid expulsion align with the conditions of the décollement step-down, thereby leading to the trapping of fluids within the sandstone blocks and their subsequent underplating to the accretionary complex. In our preferred model, such syn-mélange fluids have the potential to provide valuable constraints on the subduction–accretion processes occurring in other accretionary complexes.

Graphical Abstract

1. Introduction

Fluids often play a pivotal role in subduction zones because of their potent transport capacity. Throughout the subduction process, these fluids significantly impact on rock–fluid interactions, accretive wedge structure, diagenesis, and seismogenic behavior along the subduction interface [1,2,3,4,5]. In subduction zones, obtaining accurate information about the depths and pressure–temperature (P–T) conditions of the subduction environment is of the utmost importance [1,6,7,8,9] (Table 1). Various methods have been developed for controlling the pressure–temperature (P–T) conditions and depths of subduction zones, including microthermometry, vitrinite reflectance, and illite crystallinity. Therein, vitrinite reflectance, as a classic method for determining the evolution of regional thermal history, is usually combined with other methods [9,10,11,12] (Table 1). Other methods of thermometry, such as Raman spectroscopy of carbonaceous materials (RSCMs), thermobarometry, and pseudosection modeling, are also widely used with metamorphic rocks of high-pressure (HP) metamorphic belts from paleo-subduction zones [13,14,15,16,17,18,19] (Table 1). Fluid inclusion is a carrier of paleo-geofluids, which directly provide the specific pressure–temperature (P–T) conditions of the fluids in capture [20]. Therefore, the microthermometry of fluid inclusions is widely applicable to the constraints of subduction environments and in the deduction of subduction–accretion processes [1,8,21,22,23,24,25,26,27,28] (Table 1).
Accretionary orogens typically represent a type of orogenic belt formed in an oceanic environment or the margins of a continental crust. As the trench recedes, the material of the upper oceanic crust is eroded by subduction and accretes to the continental margin [29,30,31,32]. Accretionary wedges are usually formed by trench fillings and fragments of the oceanic crust on the upper part of the subduction channel, referred to as accretionary complexes because of the material source’s complex composition, structure, and metamorphism [33,34]. Therefore, accretionary complexes systematically record plate subduction and accretionary growth and provide crucial and compelling evidence for the evolution of accretionary orogens [35,36,37,38].
The Bangong–Nujiang suture zone (BNSZ), located between the south margin of the Qiangtang terrane and the north margin of the Lhasa terrane, spans the central Tibetan Plateau (Figure 1). It is very important for understanding the accretion and evolution of the subduction zone, as well as the evolution of the Meso-Tethyan Ocean and the north margin of the Gondwana continent, and it has garnered widespread attention from geologists globally in recent decades [33,39,40,41]. The MG, an important accretionary complex, emerges from the west of the BNSZ and is generally denoted as an assemblage of flysch sediments, and it has been used as a marker of the BNSZ in prior studies [33,39,40,41].
Our previous study suggests that broken formations and tectonic mélanges in the Mugagangri accretionary complex (MAC) were subducted into a shallow seismogenic zone (>5 km, 150–200 °C). On this basis, the nature of the fluids in the subduction zone needs further study, which will contribute to an understanding of the rock–fluid interactions and fluid behavior, as well as provide referential values for other accretionary complexes. Thus, the characteristics, compositions, and origins of the subduction zone fluids are integral to studying the accretion of the MAC within the BNSZ.
This study explored the distribution of crack-seal veins and mélanges in the MAC of the Gaize area (Figure 1). We systematically analyzed the fluid inclusions from the broken formation and present the characteristics of these fluids. Based on a new data set for the broken formation, we aimed at constraining the source of these fluids and determining how these fluids affected the subduction–accretion processes of the Meso-Tethyan Ocean in migration. These syn-mélange fluids may contribute to an understanding of the accretion of the MAC and the evolution of the Meso-Tethyan Ocean.
Figure 1. Tectonic framework of the Tibetan Plateau showing the major tectonic subdivisions and distribution of the suture zones (modified from [42]).
Minerals 13 01196 g001
Table 1. Summary of information about the P–T conditions and depths of the subduction zones [1,6,7,8,9,10,11,12,13,14,15,16,17,18,19,21,22,23,24,25,26,27,28].
LocalityDepth (km)T (°C)P (Mpa)MethodData References
Shimanto BeltMugi mélange>3 Cementation of sandstone blocks[43]
Shimanto BeltMugi mélange4–6125–24592–149Microthermometry of fluid inclusion[6]
Shimanto BeltMugi mélange4–6130–180 Microthermometry of fluid inclusion[27]
Shimanto BeltMugi mélange4–6185–260 Chlorite geothermometry[44]
Shimanto BeltMugi mélange6–7150–200 Vitrinite reflectance; microthermometry of fluid inclusion[11]
Shimanto BeltHyuga tectonic mélange 312–372 Raman spectroscopy of carbonaceous materials[45]
Shimanto BeltHyuga tectonic mélange6–10140–250150–210Vitrinite reflectance; microthermometry of fluid inclusion[25]
Shimanto BeltHyuga tectonic mélange8.6–14.4260–340235–250Microthermometry of fluid inclusion[25]
Shimanto BeltMakimine mélange10–15150–340 Microthermometry of fluid inclusion[8]
Shimanto BeltMiyama assemblage 190–312140–304Microthermometry of fluid inclusion[23]
Shimanto BeltMiyama assemblage 125–25181–253Microthermometry of fluid inclusion[22]
Shimanto BeltYokonami mélange 175–225143–215Microthermometry of fluid inclusion[1]
Shimanto BeltOtaki Group 270–300140–190Microthermometry of fluid inclusion[46]
Kodiak accretionary complexTectonic mélange10–14215–290 Microthermometry of fluid inclusion[28]
Sanbagawa BeltChlorize zone10–20320–450370–650Microthermometry of fluid inclusion[7]
Nacimiento block of Central CaliforniaFranciscan complex~20180–360 Raman spectroscopy of carbonaceous materials[47]
Nacimiento block of Central CaliforniaFranciscan complex 100–250200–800Metamorphic mineral assemblages[48]
Hellenides–Taurides beltCycladic blueschist unit10–30440–540300–1000Microthermometry of fluid inclusion[21]
Southwest JapanShikoku30–35~425 Thermal model[9]
Southwest JapanKii Peninsula30–40~325 Thermal model[9]
Rio San Juan complexJagua Clara serpentinite mélange30–50360–500 Microthermometry of fluid inclusion[24]
Sistan suture zoneRatuk complex65–80 1900–2300Thermobarometry[12]
Indus suture zoneShergol ophiolitic mélange ~470~1900Microthermometry of fluid inclusion[26]
Northern ThailandInthanon zone 246–295 Illite crystallinity[10]
Western AlpsSesia-Lanzo Zone3.5–7700–750 Thermobarometry[19]
Western AlpsZermatt Saas
unit
~75 Zr-in-rutile thermometry[13]
Eastern AlpsAustroalpine nappes 800–850≥3500Microthermometry of fluid inclusion[15]
New CaledoniaEclogite-facies mélange belt 400–650
~800
Oxygen and carbon isotope[16]
New CaledoniaNorthern metamorphic belt~35300–550800–2400Raman spectroscopy of carbonaceous materials; thermobarometry[17]
West KunlunKangxiwar khondalite 700680Electron microprobe[18]
NordfjordWestern gneiss 550–6502000–2600Pseudosection modelling[14]

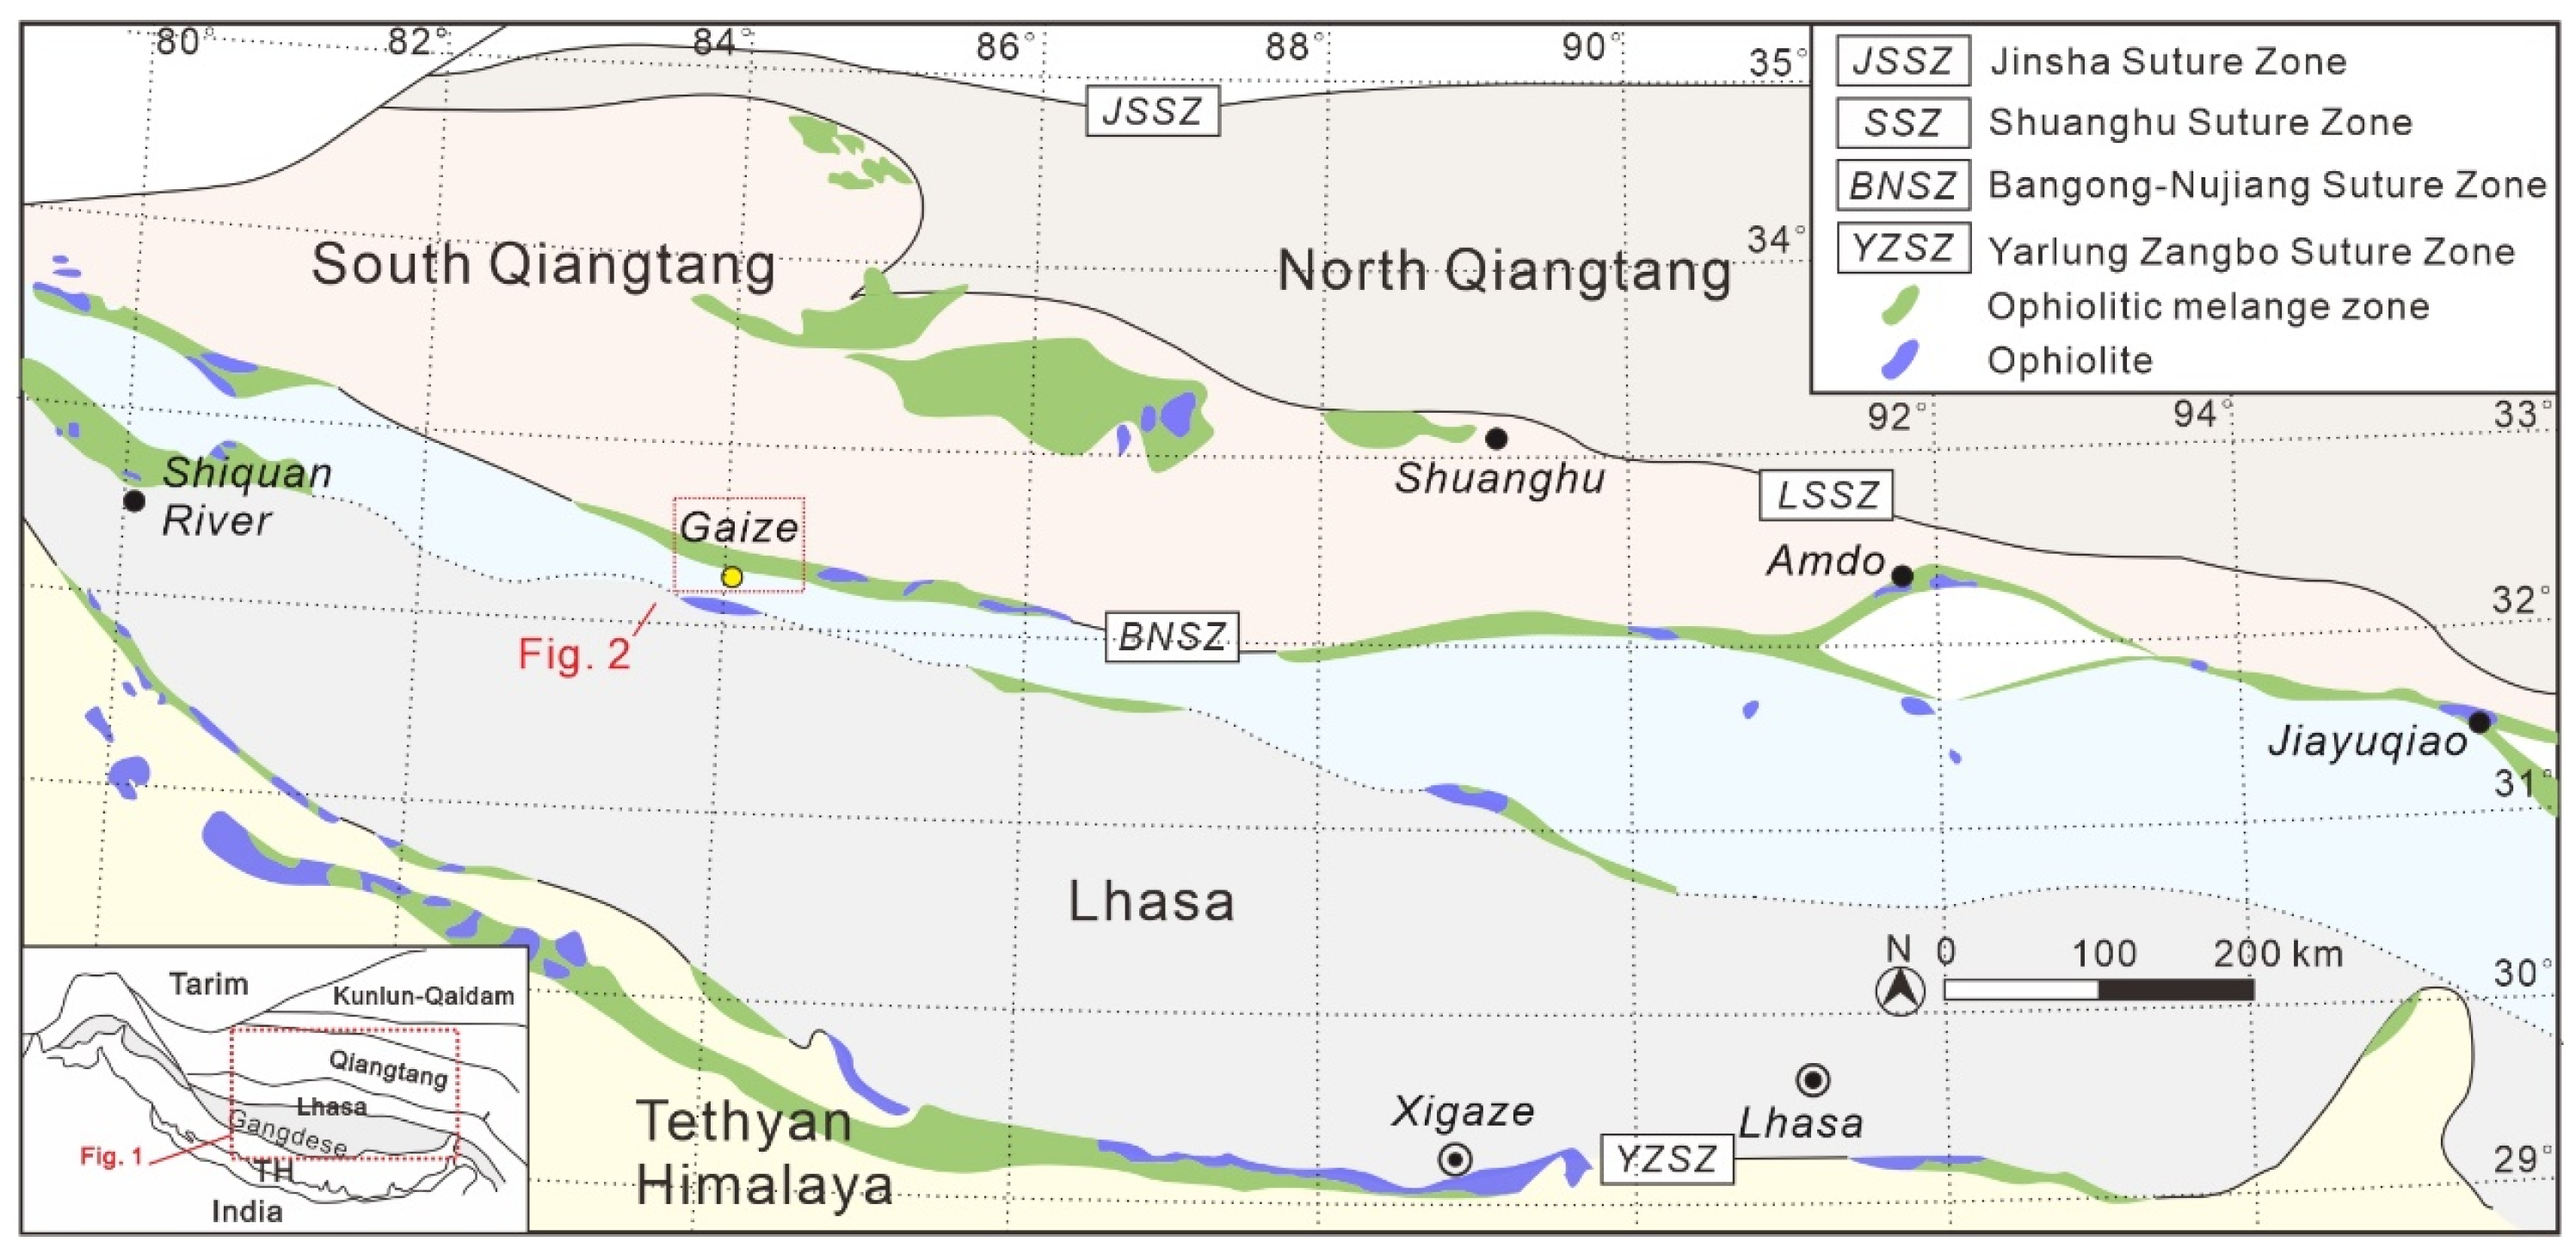
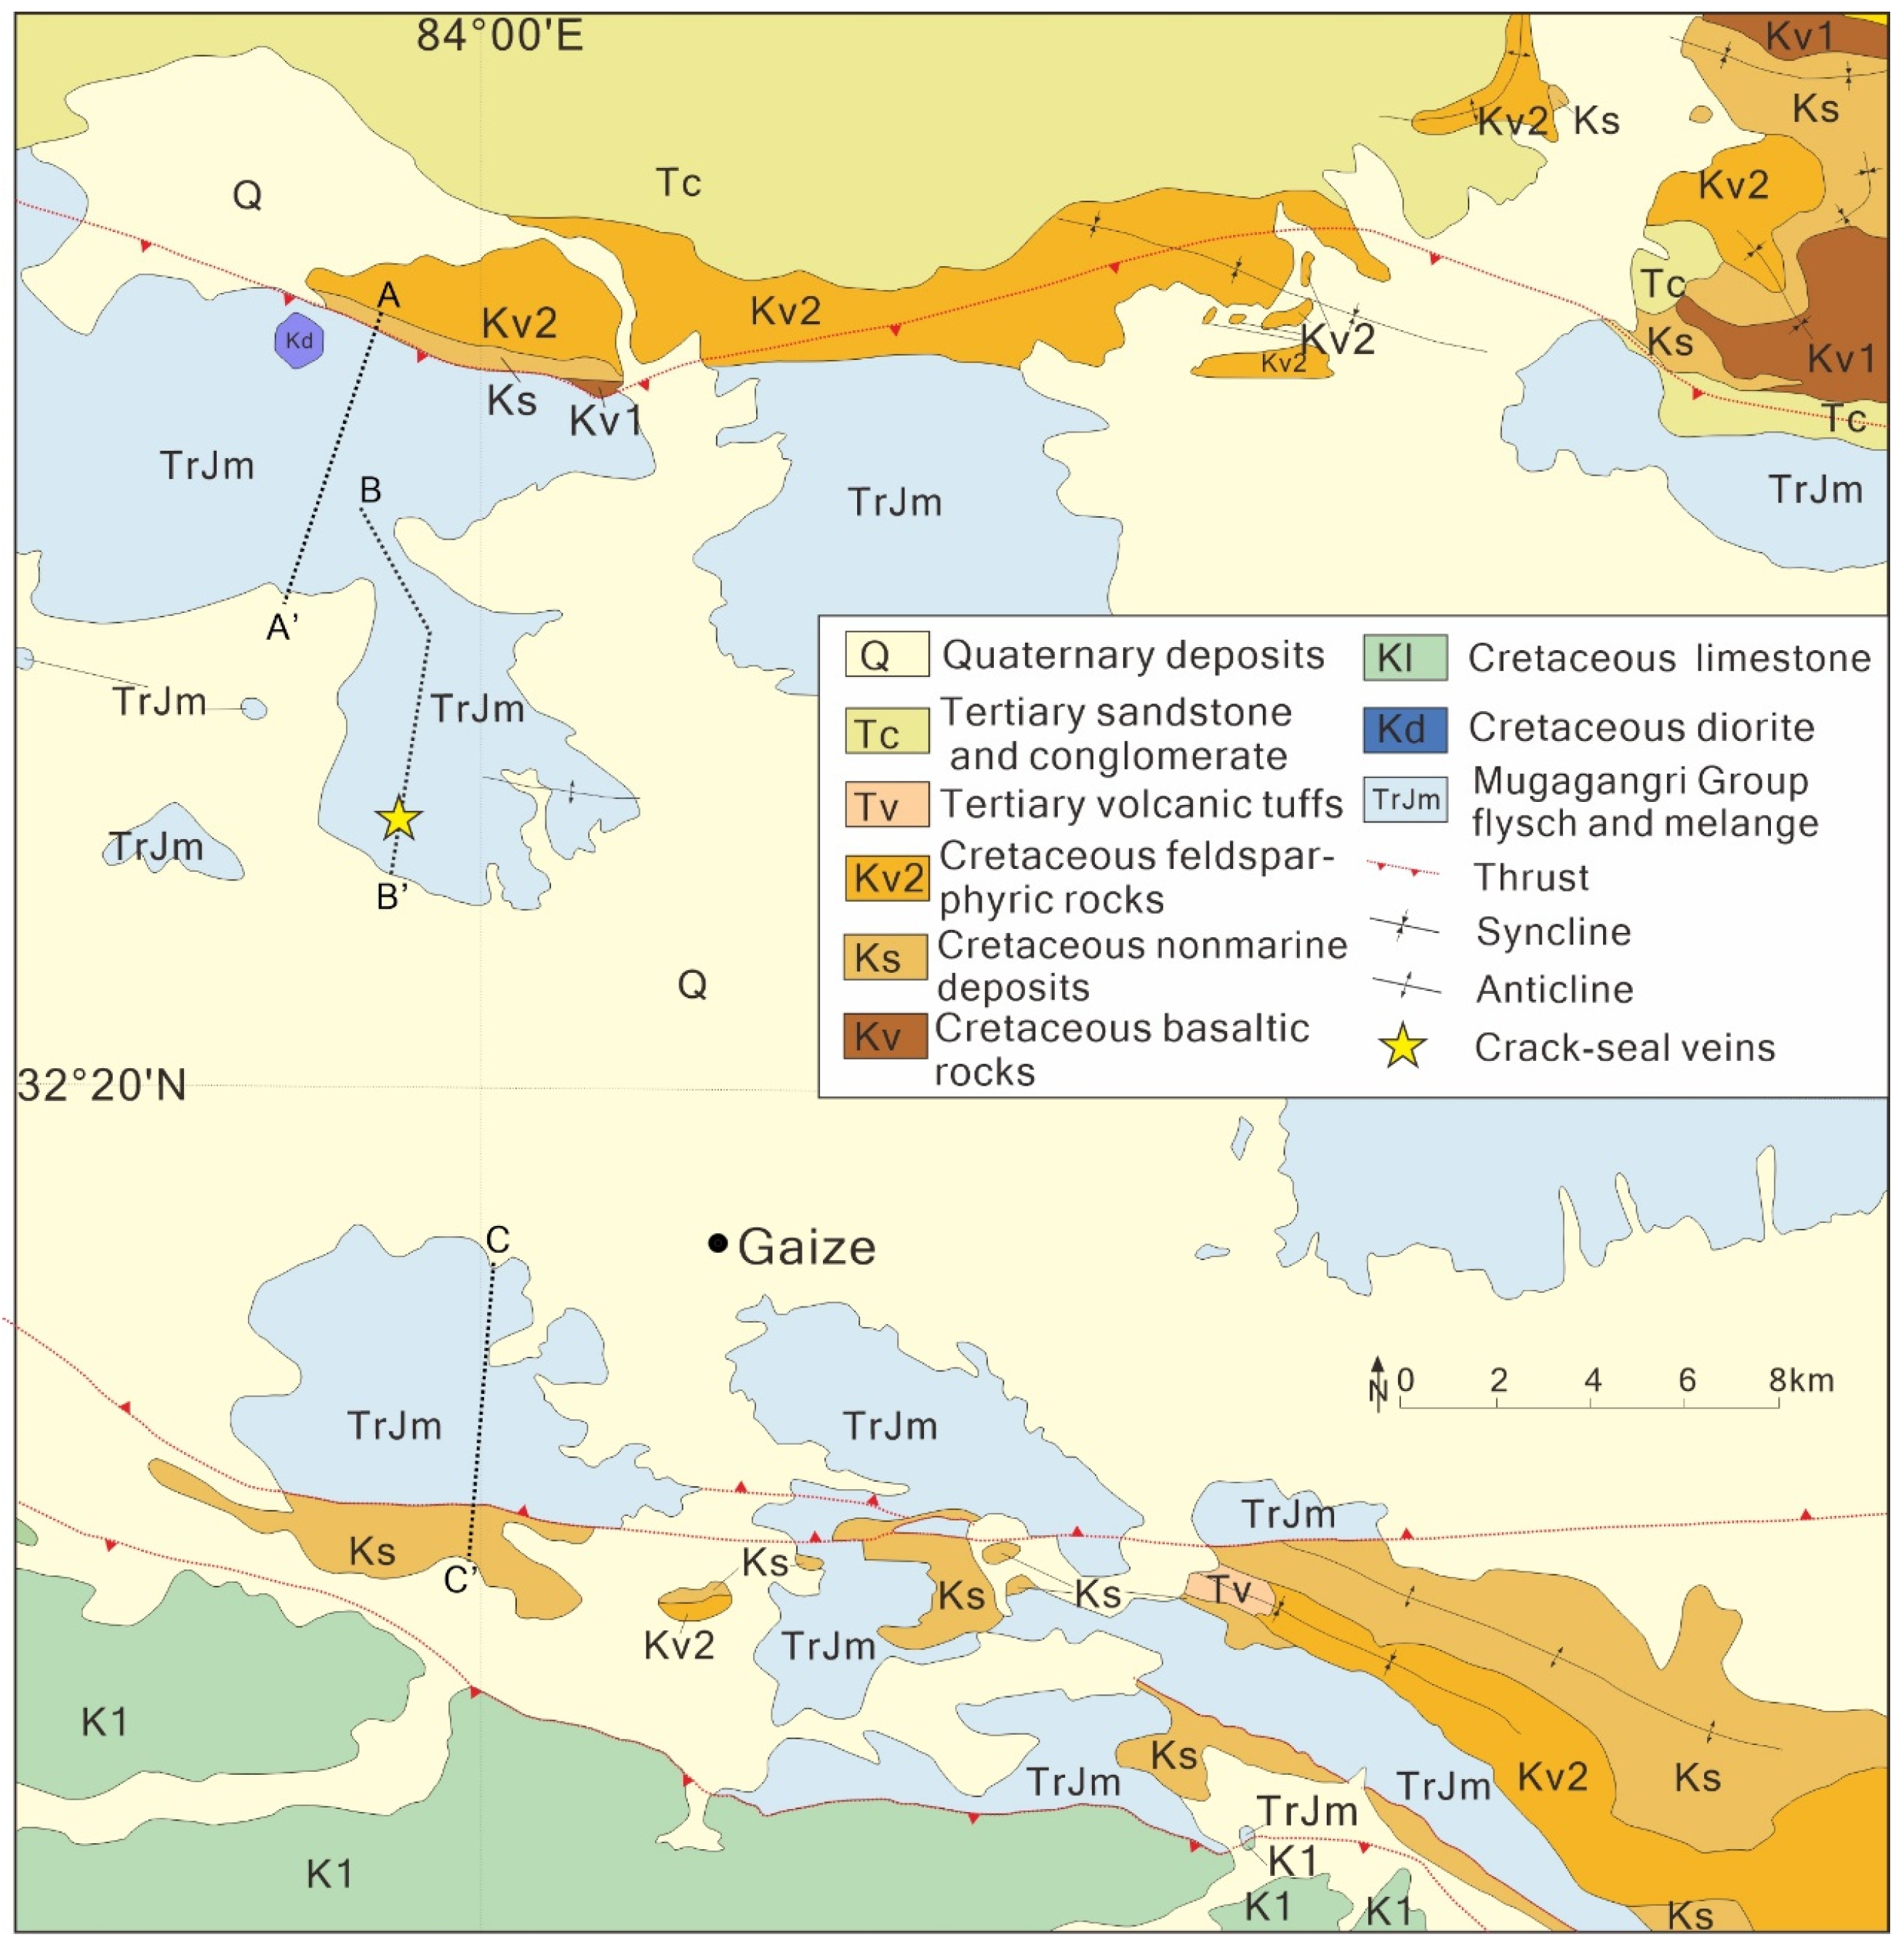
2. Geological Setting

The BNSZ is located in central Tibet and has an east–west strike with a width of 10~200 km. The structural elements within the zone exhibit significant changes along its strike [39,49,50,51]. The formation of the BNSZ experienced the process of the opening and the closing of the Meso-Tethyan Ocean [42,52,53], recording the collision and amalgamation of the Qiangtang and Lhasa terranes. Consequently, there is ongoing debate regarding the evolution of the Wilson cycle of the Meso-Tethyan Ocean, including the time, nature, and tectonic processes involved in the different stages [42,54,55,56]. The northward subduction initiation of the Meso-Tethyan Ocean occurred in the Late Triassic (~220 Ma) [42,56,57], while the timing of the initial collision between the Lhasa and Qiangtang terranes is hotly debated [58,59,60].
Along the BNSZ, there are extensive outcrops of discontinuous ophiolitic mélanges (Figure 1). In the Gaize area, the Mugagangri Group (MG) is a distinctive unit characterized by well-ordered sedimentary strata and packages of ophiolitic mélange that form a series of south-vergent thrust sheets (Figure 2) [57]. Based on studies of sedimentology, structure, and provenance, the MG was interpreted as an accretionary complex that was accreted to the Qiangtang terrane during the northward Meso-Tethyan subduction [32,61]. The well-ordered strata are mainly characterized by well-bedded coherent flysch sequences, partially intermixed with olistostrome, conglomerate, and mudstone [62]. The area of provenance of these sediments is located in the Qiangtang terrane, north of the BNSZ [61]. In contrast, the mélanges exhibit a typical block-in-matrix fabric, with the blocks comprising sandstone, limestone, siliceous rock, and basalt [32]. The matrix among the blocks is predominantly composed of sandstone, mudstone, and volcanic rock (grain size < 1 cm), formed through mechanical fragmentation during the mélange formation [57].

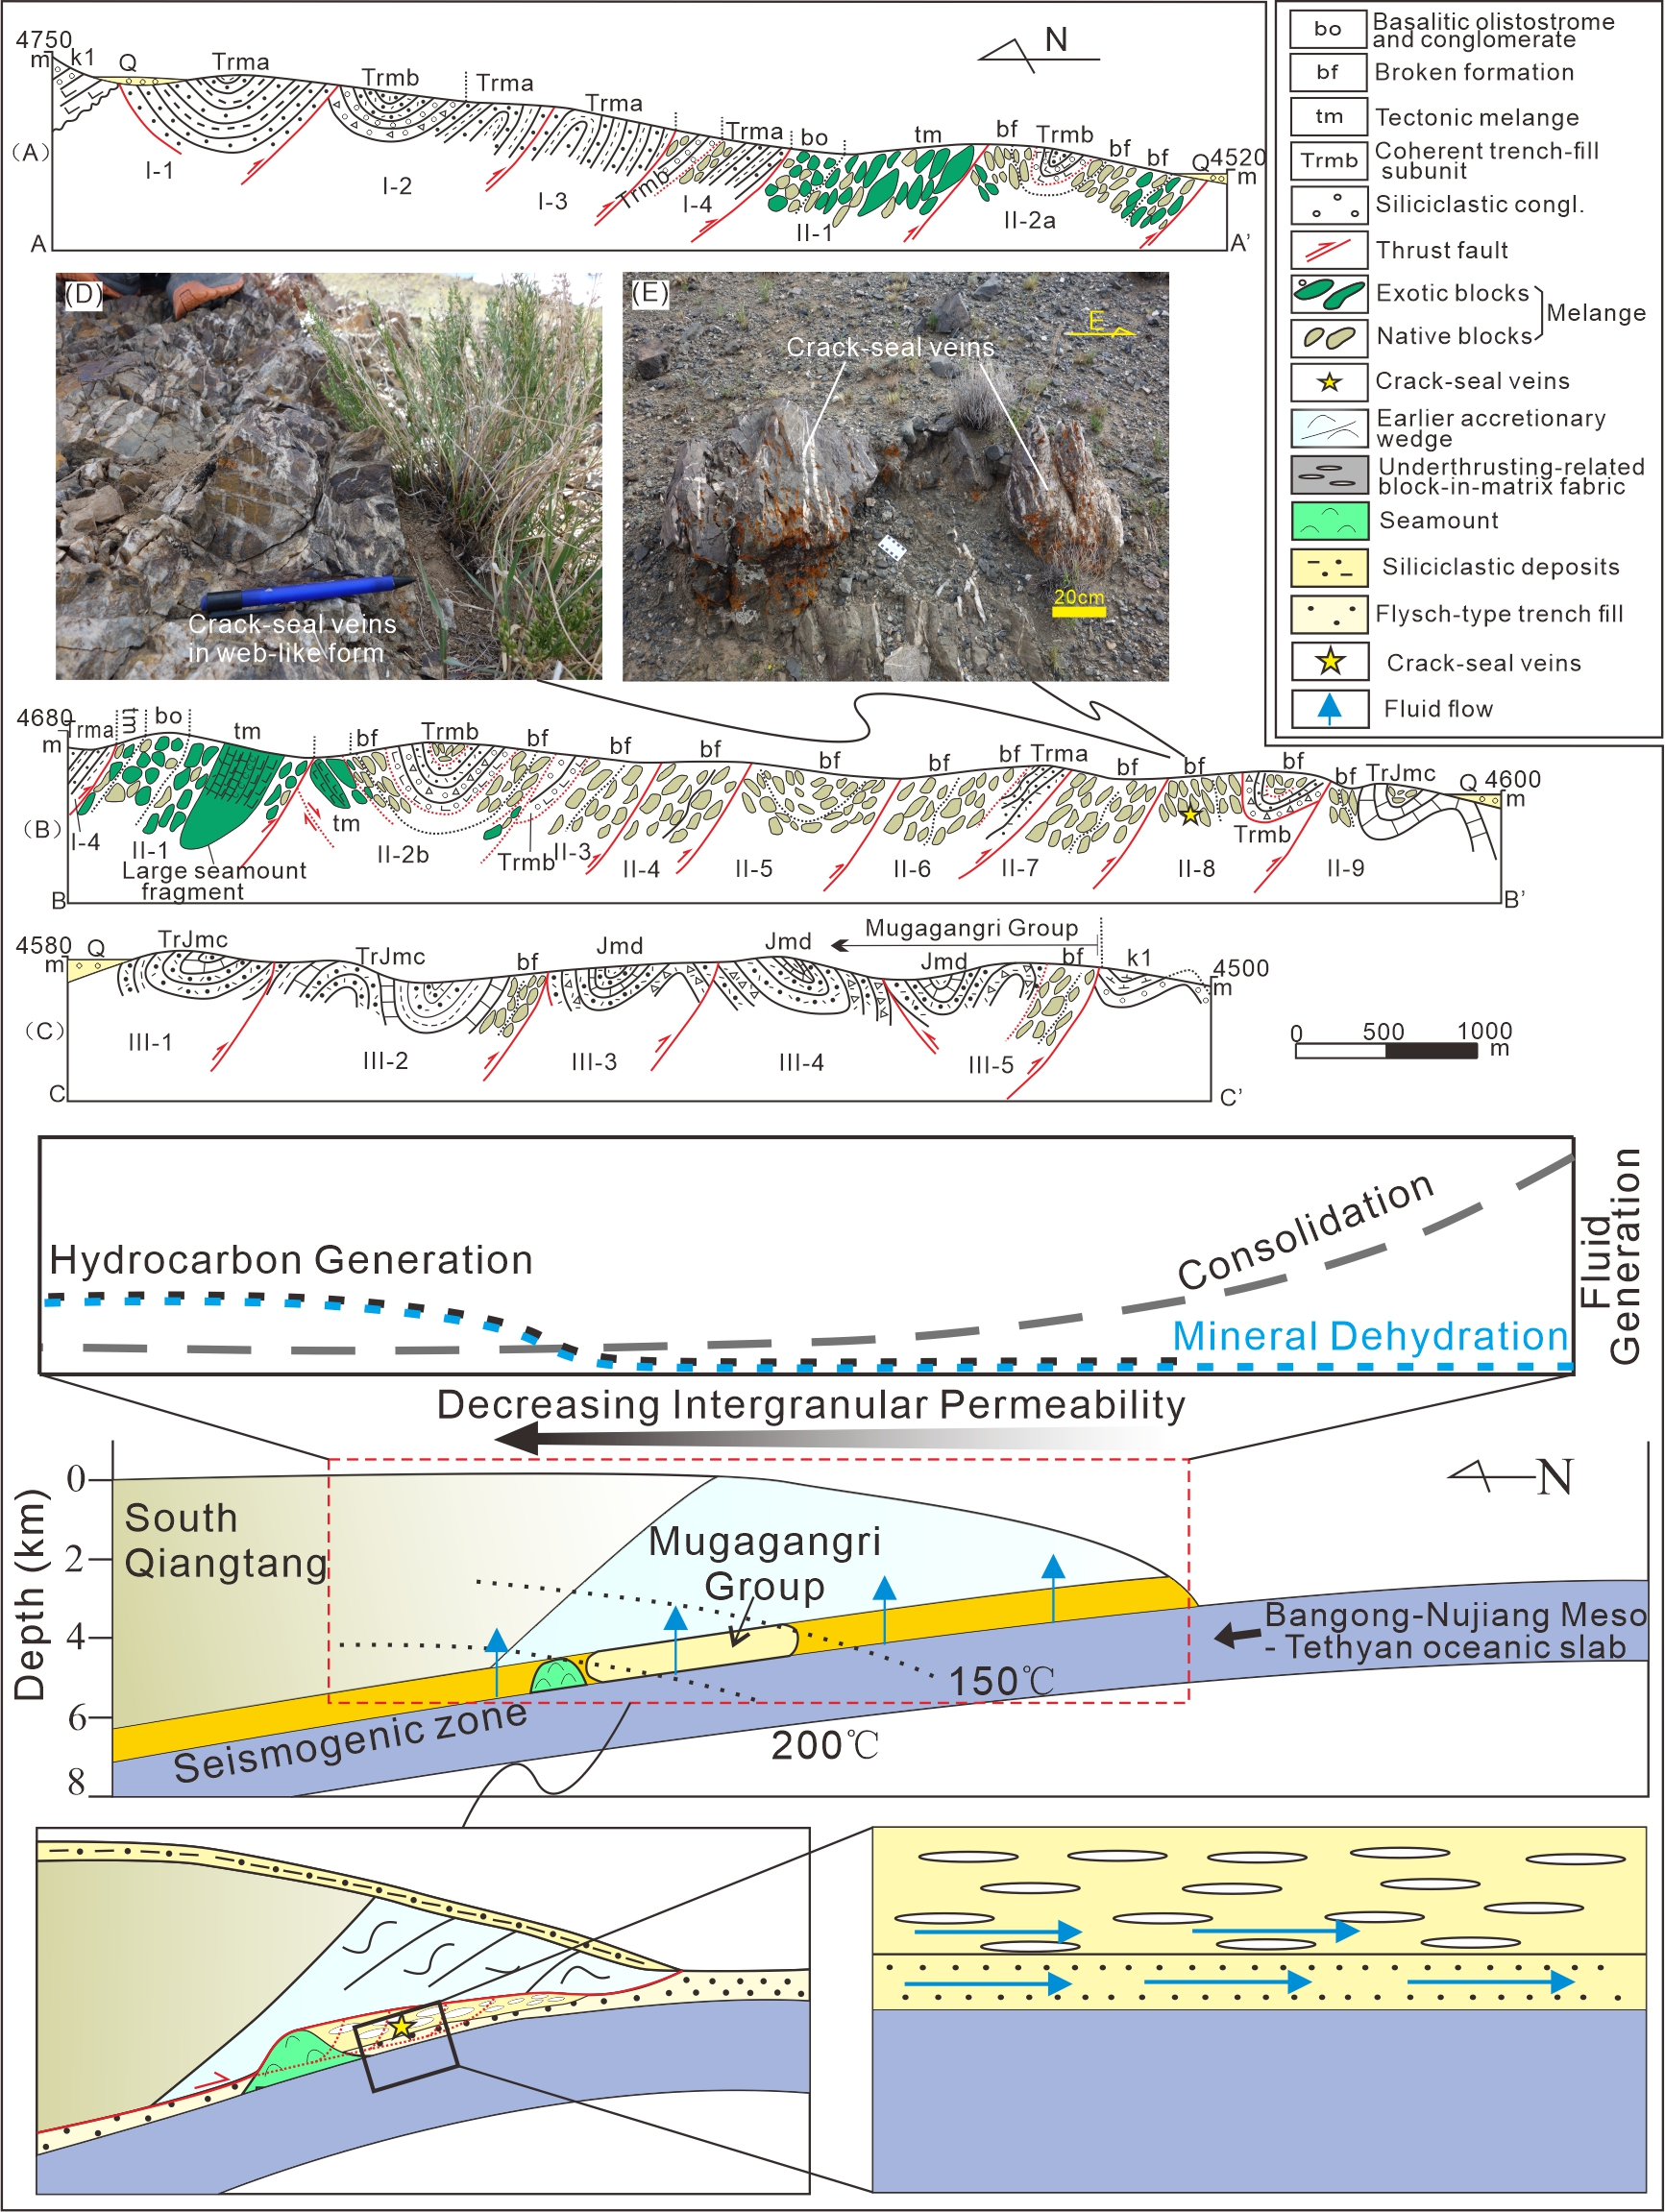
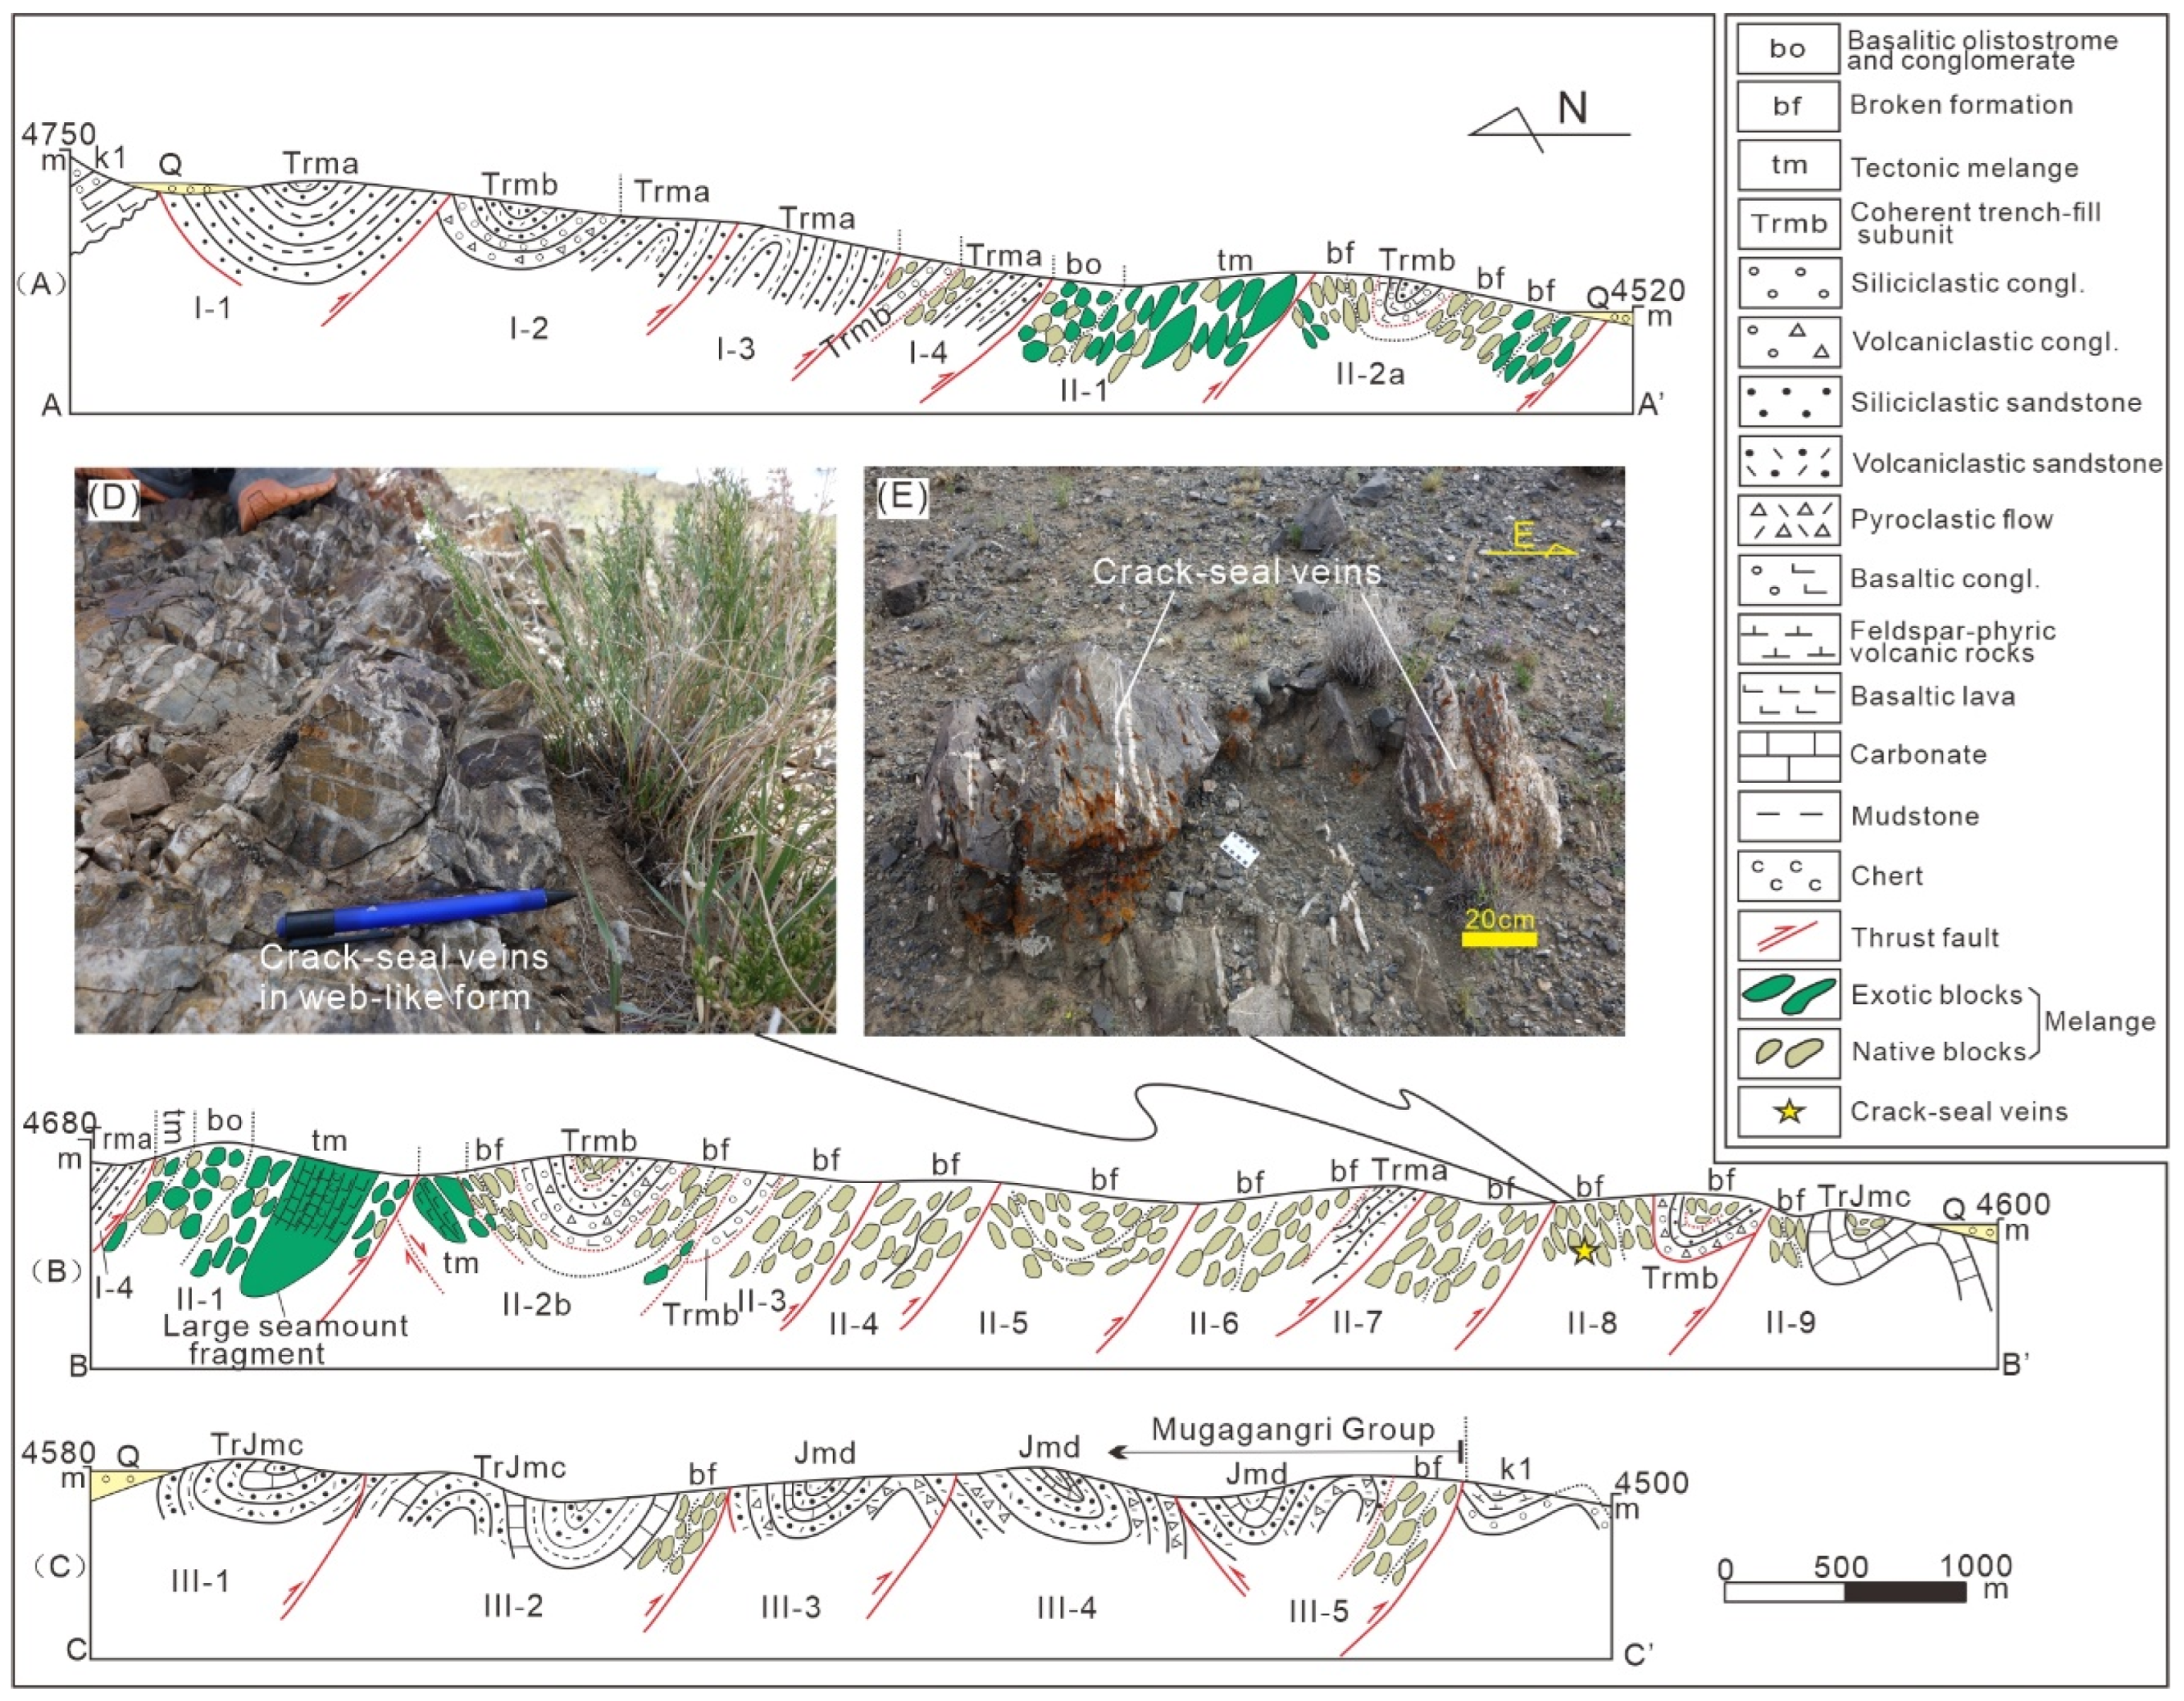
3. Occurrences of Mélanges and Veins

The MG (Gaize) is characterized in strata that are deformed into fold nappes bounded by south-vergent thrust faults (Figure 3A–C). Therein, the stratigraphic order of four subunits was identified, termed as Trma, Trmb, TrJmc, and Jmd in ascending order, which overlie the mélanges structurally [61,63].
Based on the field geological observation and section measurement, the MG (Gaize) is subdivided into three deformation domains (Figure 3A–C): (1) Domains I and III consist mainly of thrust sheets with coherent bedding that have not undergone mélange formation. These domains exhibit numerous paleo-flow markers, such as inclined bedding and groove casts, indicating a north to south sediment source from the Qiangtang terrane [64]; (2) Domain II is predominantly mélange and underlies Domains I and III. It exhibits a block-in-matrix fabric, with the blocks often wrapped within the matrix in a lens-like type [32].
The mélanges can be classified into three types based on the lithology and genesis: (1) Broken formation, which constitutes a major portion of the mélanges, primarily composed of “native blocks” and consisting of sandstone, symbolizing tectonically disrupted trench fills [64]. (2) Tectonic mélanges, containing oceanic crust materials (exotic blocks) [65], which are mainly volcanic rocks, such as siliceous rock and basalt below the broken formation, only occurring in Domains II-1 and -2 (Figure 3A,B) [32]. The mélanges mentioned above, were initially developed in the subduction and can be used to restore the ocean-plate stratigraphy. (3) Mélanges (olistostrome), which have a sedimentary origin and are differentiated by poorly developed shear fabric [66], blocks with low aspect ratios, and local transition to conglomerate, and they cannot be restored for the olistostromes [64].
A large number of crack-seal veins can be observed in the broken formation of Domain II-8, primarily within the sandstone blocks (Figure 3D,E). These veins become more abundant toward the boundary faults between the thrust sheets. The presence of these veins in association with the thrust faults suggests that they developed through hydraulic fracturing [67]. Additionally, these veins fill extension cracks that are oriented subperpendicular to the long axes of the blocks or in a web-like pattern, similar to the syn-mélange veins observed in the Shimanto Belt, SW Japan [68]. Matsumura et al. [6] propose that these veins developed synchronously with the mélange formation and slightly prior to the underplating of the mélange. Therefore, the fluid characteristics of these veins can provide insight into the condition of the mélange formation and underplating.

4. Materials and Methods

In this study, six crack-seal vein samples were collected from the broken formation of Domain II-8 in the MAC. The samples were prepared into double-polished sections with a thickness of about 300 µm [69] for further analysis through petrography, mineralogy, microthermometry, and Raman spectroscopy of fluid inclusions.

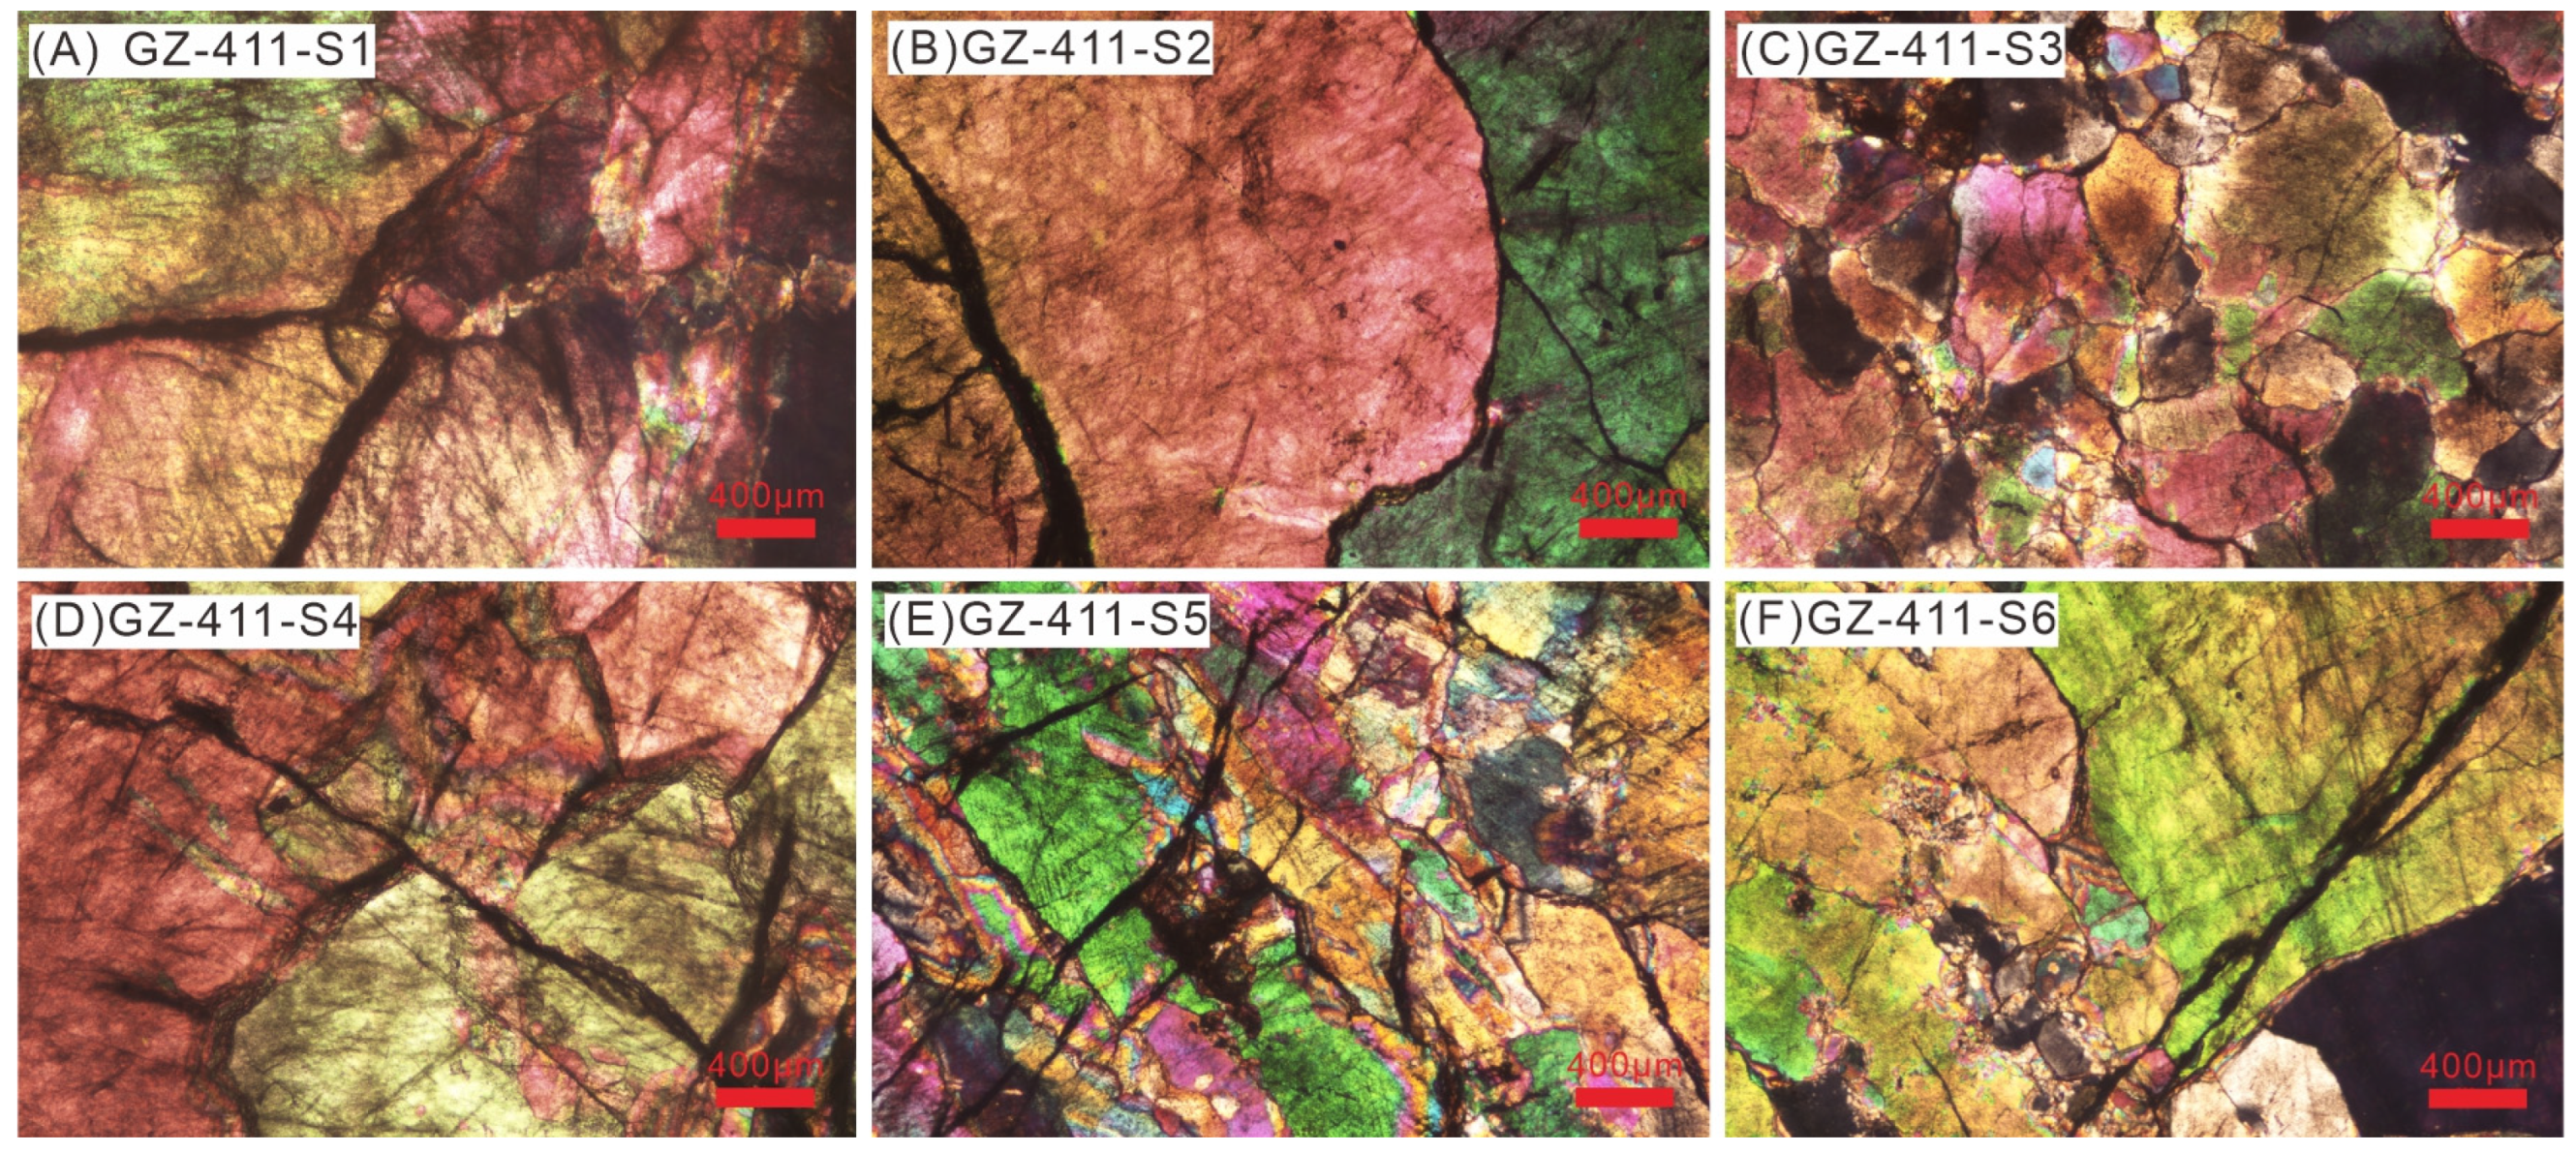
4.1. Petrography and Mineralogy

Mineralogic analysis can be conducted to identify the various host minerals. The petrographic analysis can record the petrographic characteristics of fluid inclusions, including size, abundance, and distribution [70]. Moreover, the types of fluid inclusions were identified, and primary inclusions of appropriate size were selected for microthermometry.

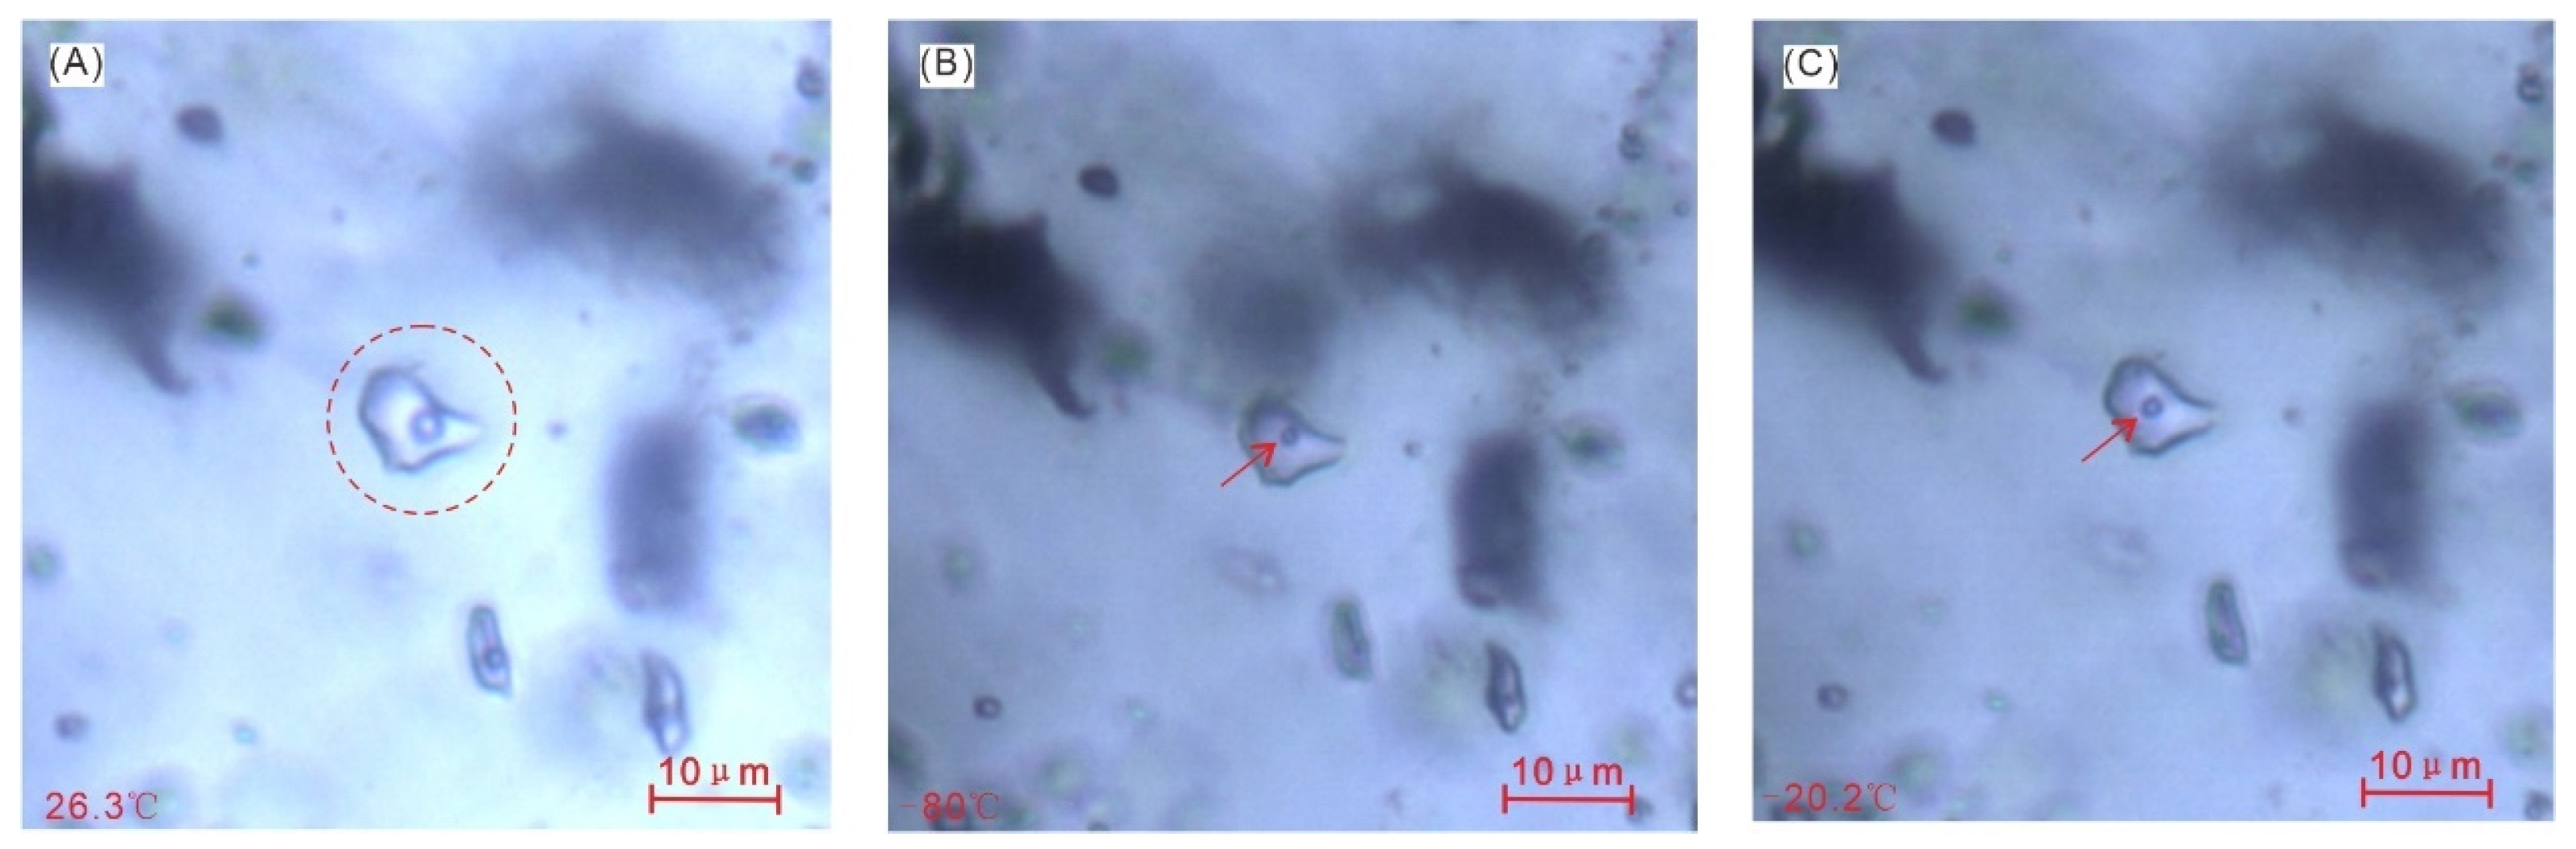
4.2. Microthermometry

Microthermometric measurements of fluid inclusions were performed with the British-made instrument, Linkam THMS600, at the Laboratory of Fluid Inclusion, Chengdu University of Technology. The cooling–heating stage had a temperature range of −196 °C to 600 °C, with an analysis accuracy of ±0.5 °C for the temperature range of −196 °C to 0 °C and ±2 °C for 0 °C to 600 °C. All experiments were performed following the correction of the synthetic inclusion standard sample. The rate of the temperature change was maintained at 10 °C/min until it approached the phase change, and then the rate was controlled at approximately 1~5 °C/min. Observing the phase change is challenging, given the instantaneous transition of fluid inclusions from liquid to solid, which exhibits metastable equilibrium characteristics. We adopted the method of cooling before heating to measure the temperature of the fluid inclusions [71].

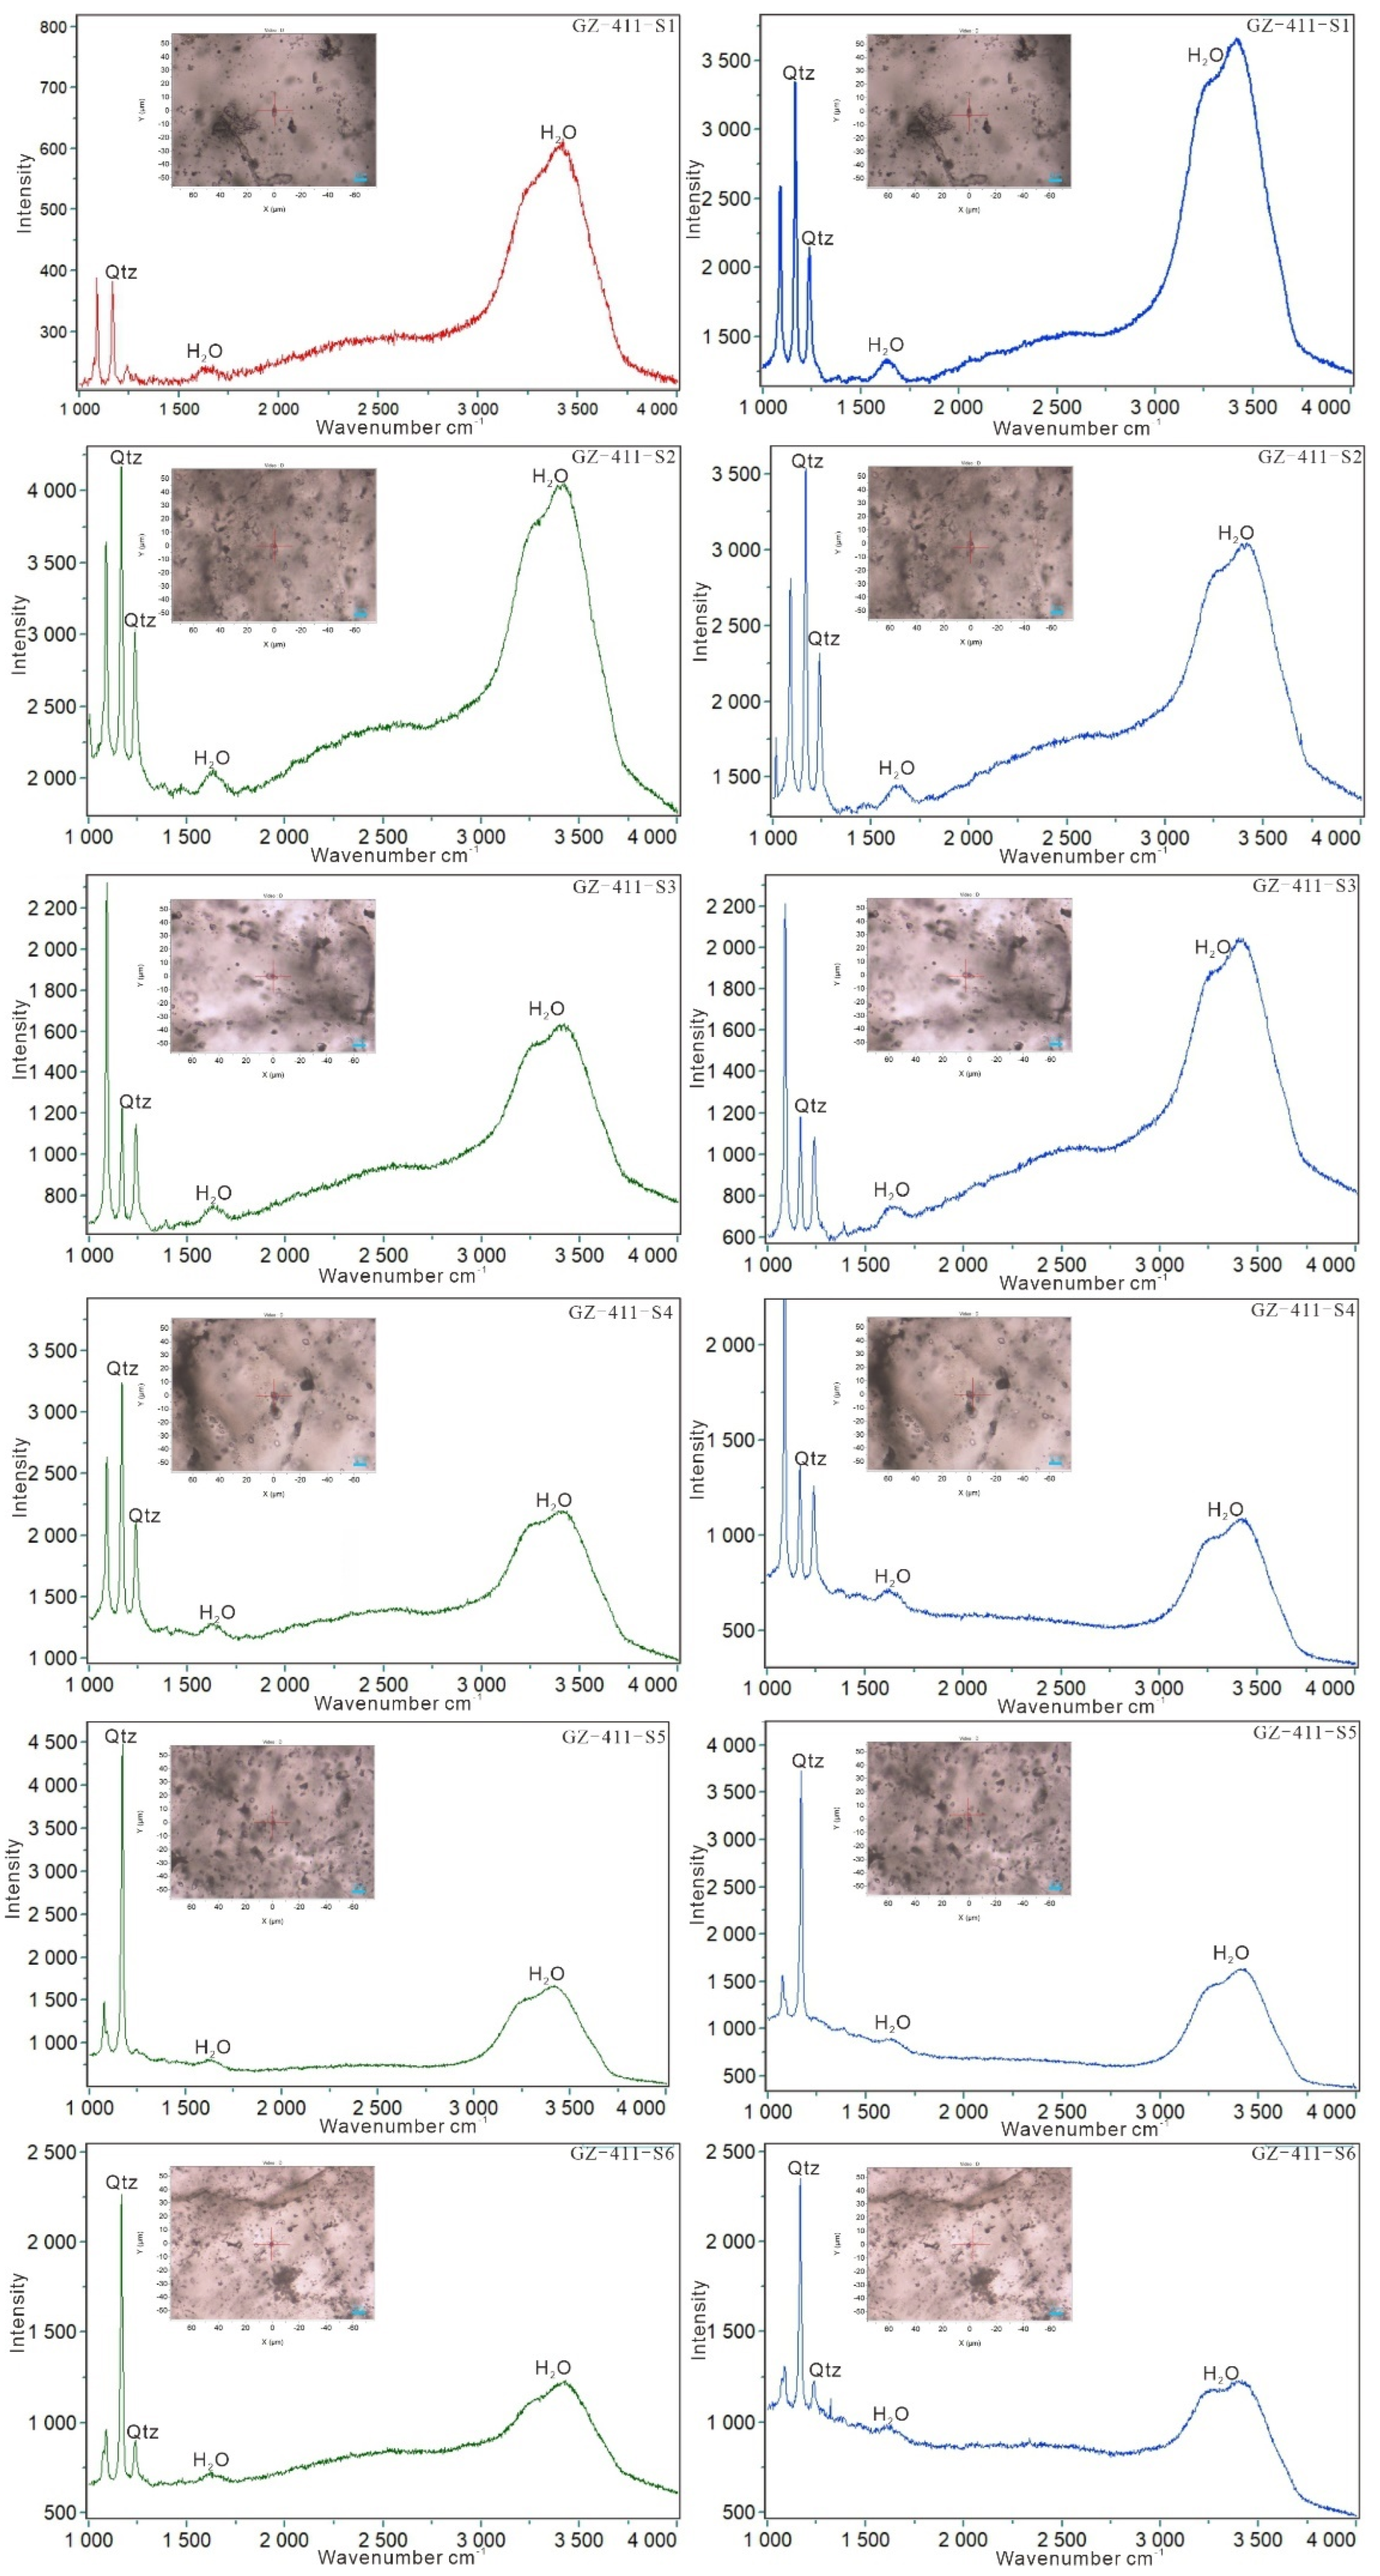
4.3. Raman Spectroscopy

The Raman spectroscopic analysis was performed at the Chengdu Institute of Multipurpose Utilization of Mineral Resources using an XploRA PLUS Raman Spectrometer (HORIBA France SAS, Palaiseau, France). According to the type of sample, the instrument was calibrated using a standard sample before the experiment. To enhance the reliability of the data and accurately capture the spectrum characteristic, fluid inclusions were selected from the uppermost layer of the section. This aimed to minimize the potential influence of the host on the overall characteristics [72].

5. Results

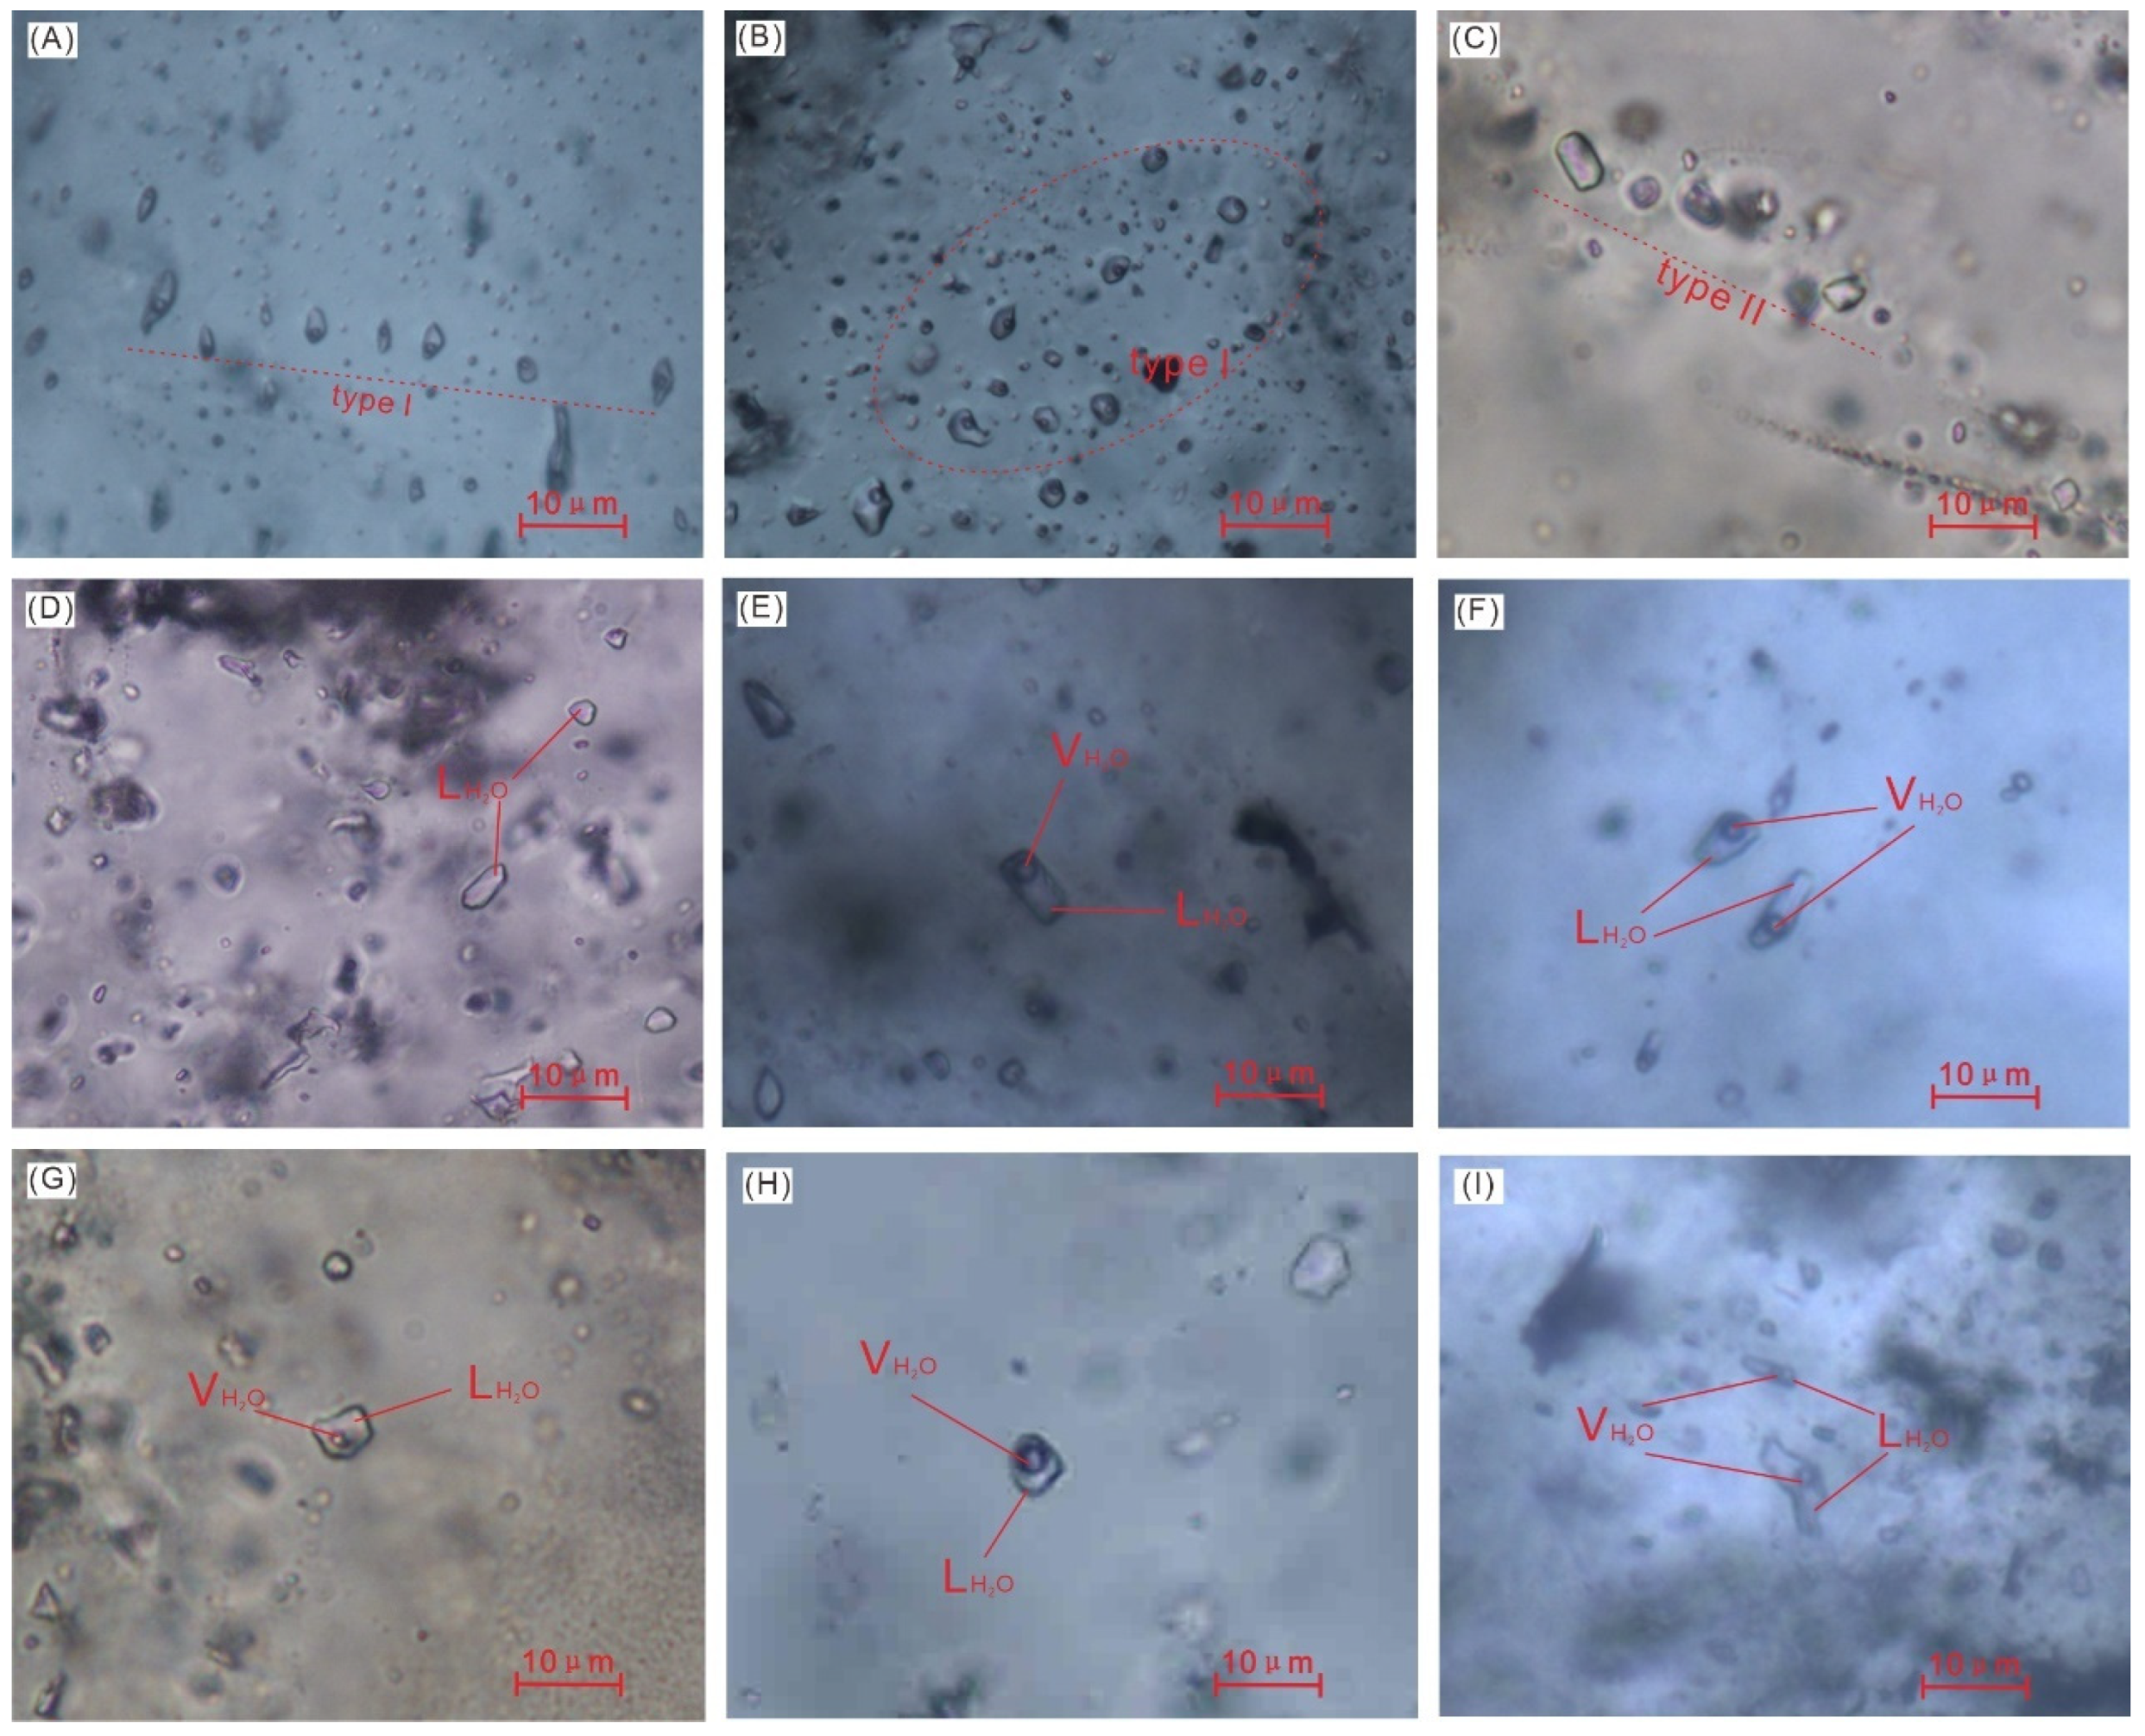
5.1. Fluid Inclusion Characteristics

The quartz minerals in the six samples contained abundant fluid inclusions at room temperature (Figure 4 and Figure 5), with sizes ranging from 5 to 15 μm and gas-to-liquid ratios of 5%~40%. Fluid inclusions typically exhibit irregular, elongated columnar and oval shapes. They are often isolated, clumped, or linearly distributed in the mineral’s interior. The majority are primary and secondary inclusions, with pseudosecondary inclusions rarely linearly distributed along the mineral’s interior fractures [73]. Based on the petrographic characteristics at room temperature, they can be divided into two types: biphase (type I) and monophase (type II) inclusions.
The biphase inclusions (type I) predominantly consisted of water, with the gas phase comprising a smaller proportion compared to the liquid phase. Specifically, the gas phase accounted for approximately 5% to 30% of the inclusions. These biphase inclusions, which were mostly ~5–15 μm in size, constituted 70% of the total fluid inclusions. They exhibited irregular and oval shapes, occasionally appearing as elongated columnar and negative-crystal formations. The primary inclusions were often randomly dispersed within the quartz or linearly distributed on the quartz growth surfaces [74]. The gas and liquid phases in the inclusions were colorless and translucent, exhibiting no discernible dark or other colors, and their boundaries were sharply defined.
The monophase inclusions (type II) shared a similar composition, consisting solely of a colorless and translucent liquid phase. These inclusions were typically smaller, ranging from approximately 2 to 10 μm in size, and constituting around 30% of the total inclusions. They commonly exhibited elongated columnar and oval shapes, and they were often found in isolated formations or linearly distributed on the growth surface of the quartz.

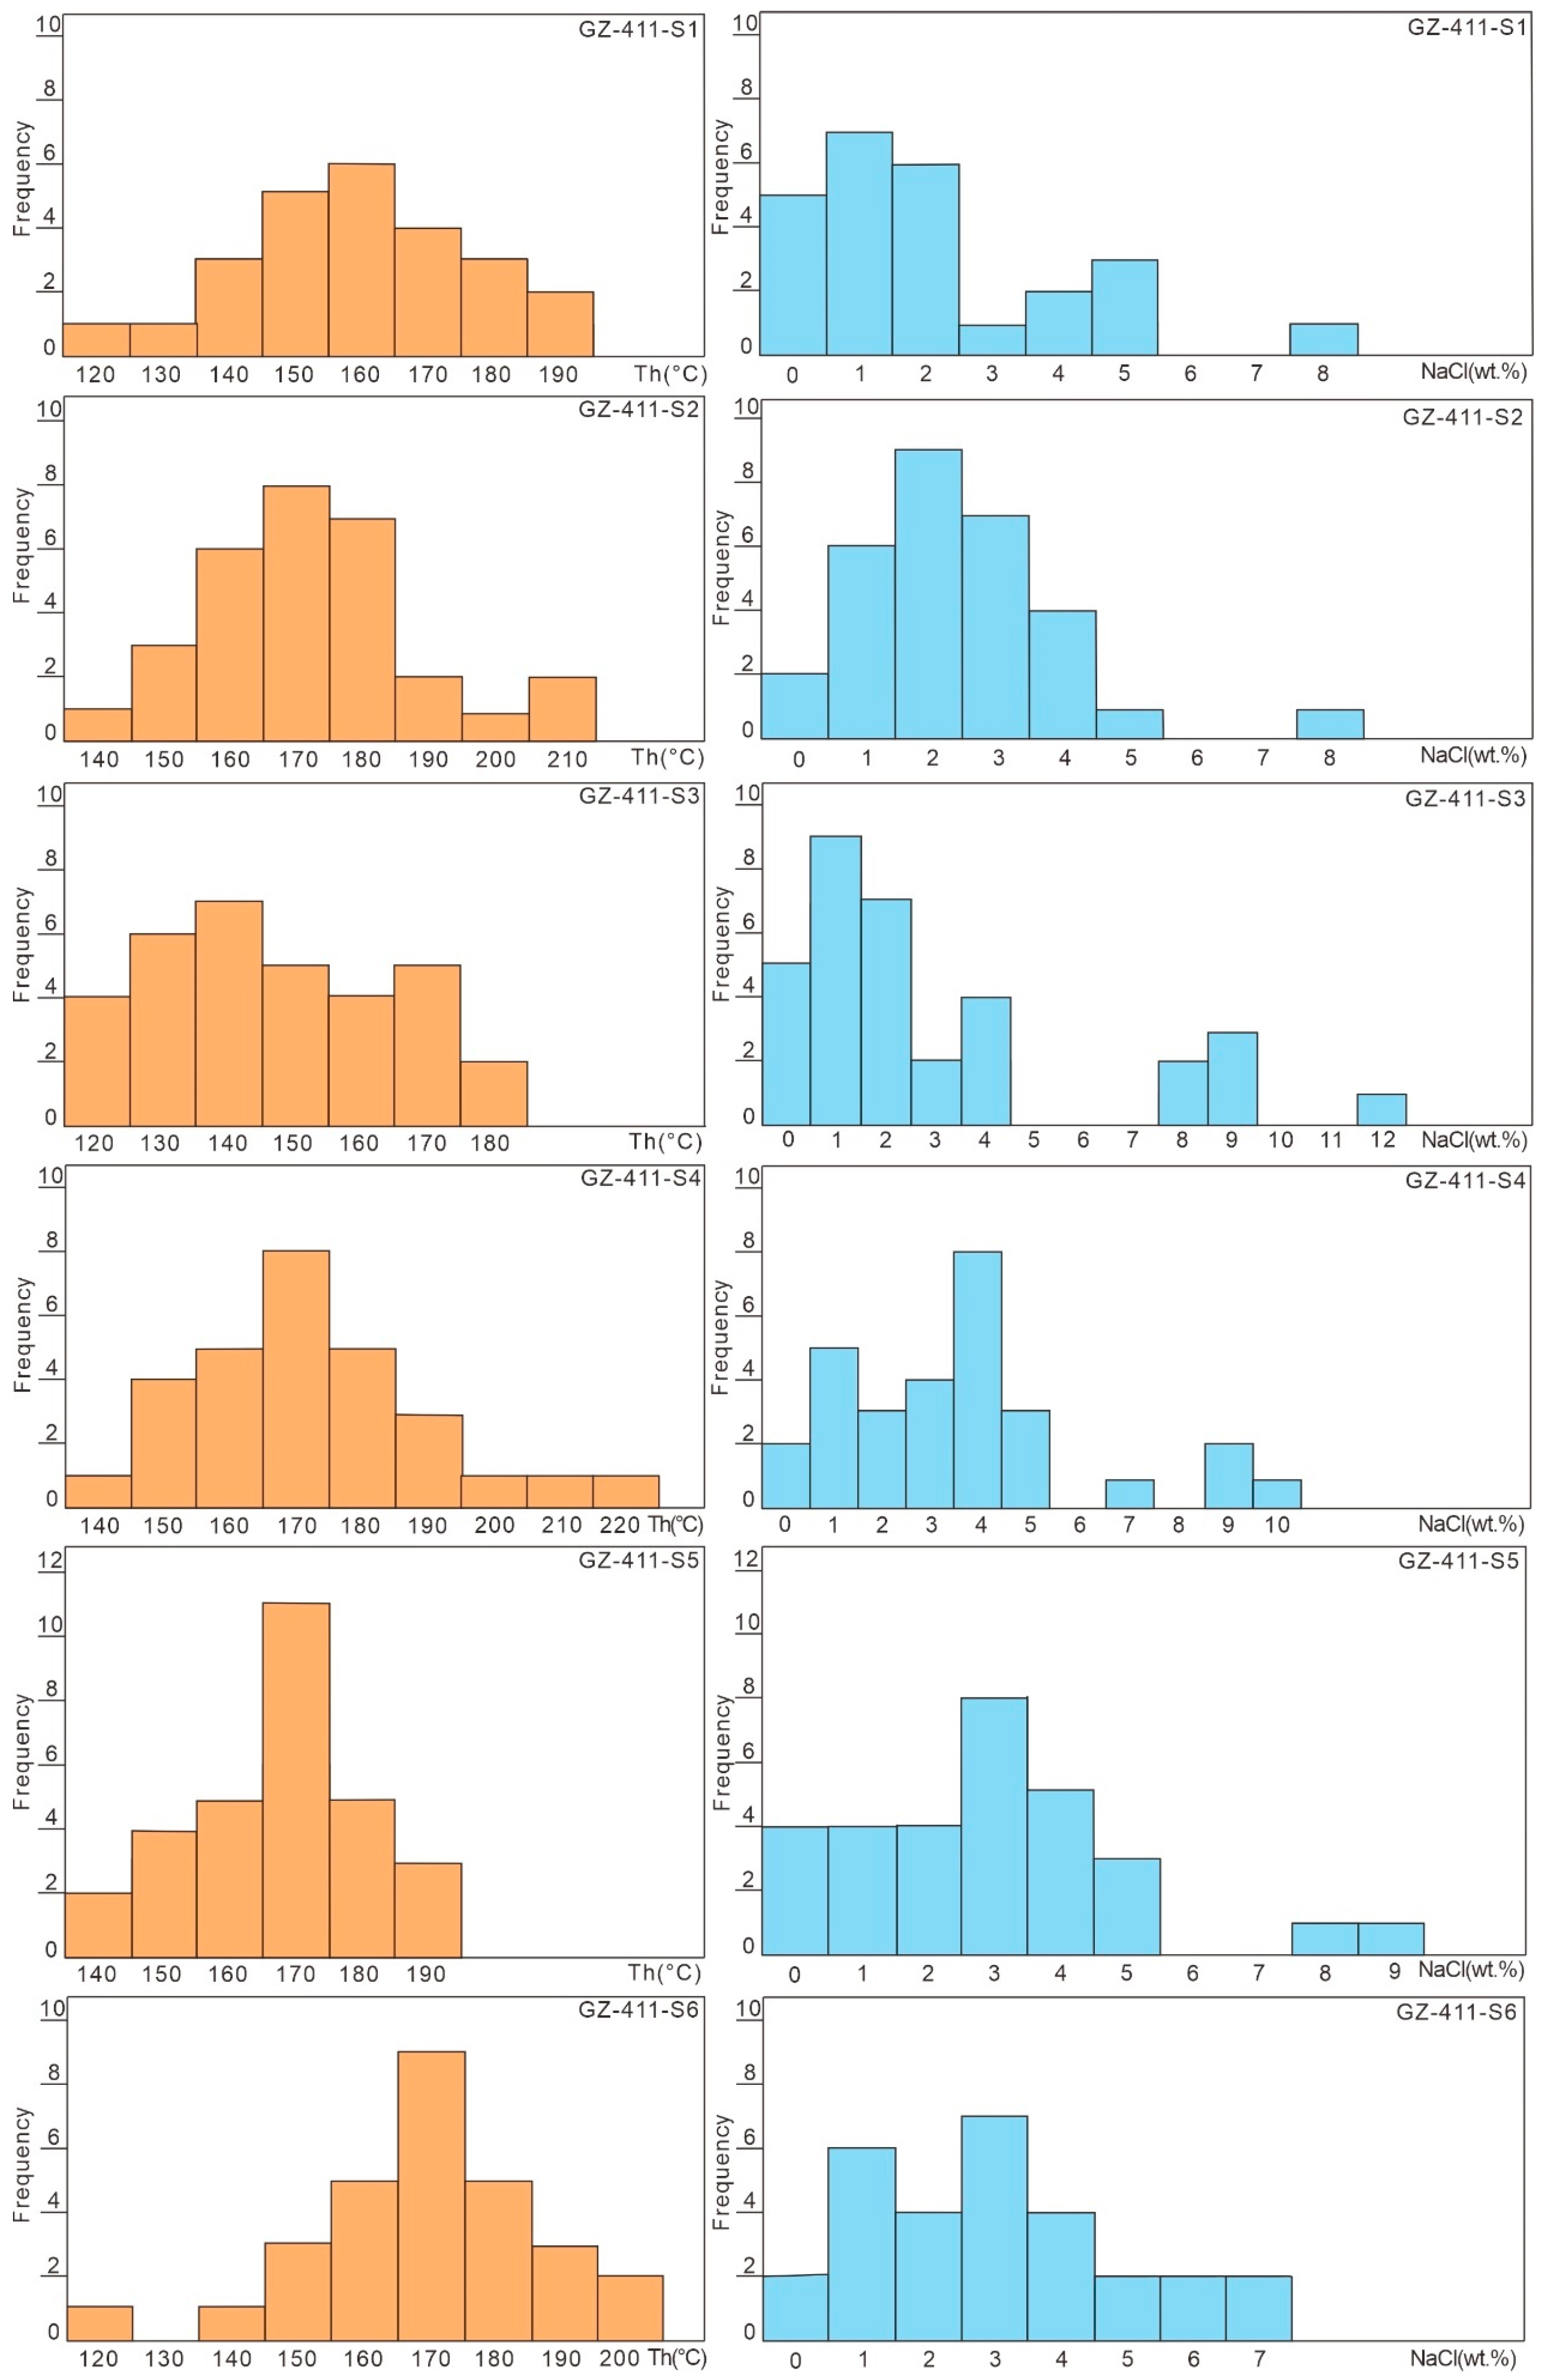
5.2. Microthermometry of Fluid Inclusions

Based on the petrographic studies, we mainly conducted microthermometric measurements on the biphase-aqueous fluid inclusions (type I) in quartz veins. To preliminarily determine the composition and system of fluid inclusions, we carefully selected representative primary inclusions from the samples and measured the initial melting temperature [75]. The biphase-aqueous fluid inclusions at room temperature were cooled to below the eutectic temperature (−80 °C) and then slowly warmed up. The biphase-aqueous fluid inclusions were cooled below the eutectic temperature (−80 °C) and then slowly warmed up. At −20.2 °C, a bubble in the inclusion appeared, indicating the melting of ice crystals. These changes in the inclusion were observed during the microthermometric measurement process (Figure 6). The initial melting temperature range of the fluid inclusions in the six samples was approximately −21.5~−19.1 °C, indicating that they belonged to the NaCl-H2O system [75].
The salinity of the biphase-aqueous fluid inclusions can be determined by calculating the freezing point temperature (Tm) [76,77,78]. Additionally, the density of the inclusions can be obtained from the formula of the NaCl-H2O system using the salinity and homogenization temperature (Th) [78].
The results are shown in Table 2 and Figure 7. The average homogenization temperatures of the biphase-aqueous fluid inclusions in the six samples were as follows: 163 °C, 178 °C, 151 °C, 178 °C, 173 °C, and 174 °C. This shows that the homogenization temperature of the six samples in the broken formation was concentrated in the range of 150~200 °C. The average salinity of the six samples was measured as 2.64 wt%, 2.86 wt%, 3.48 wt%, 4.05 wt%, 3.43 wt%, and 3.43 wt%, corresponding to densities of 0.85~1.03 g/cm3.

5.3. Composition of Fluid Inclusions

We selected large and well-formed primary inclusions (type I) from six samples for Raman spectroscopic analysis and processed the data into Raman spectra. To accurately identify the peak of the host mineral and fluid inclusion components, we set the Raman shifts between 1000 and 4000 cm−1.
The Raman spectroscopic analysis revealed distinct features of the gas and liquid components inside the inclusions, as shown in Figure 8. Strong Raman peaks were observed at 1160 cm−1 and 1230 cm−1, which are attributed to the quartz [79]. Weak peaks were also observed in the range of 1595~1630 cm−1, which are typically associated with a weak band of H2O [72]. Furthermore, wide and distinct peaks were observed in the range of 2750~3900 cm−1, indicating the presence of a strong H2O band (low salinity) consisting of several large overlapping bands [72,80]. No nonpolar gases, such as CO2 and CH4, were observed in the spectra. CH4 was found in some but not all fluid inclusions reported from the mélanges. For example, only H2O but no CH4 was reported from the fluid inclusions in the Makimine mélange from the Shimanto accretionary complex [8,24]. CH4 can be formed in reducing conditions if there is carbon available. As depicted in Figure 8, the local weak peaks were not clearly visible. This is a common occurrence where the fluorescence from the sample overwhelms the weak Raman features of the fluid inclusions during analysis [72]. However, this does not affect the overall data obtained from the samples. Therefore, based on the Raman spectroscopic analysis of the inclusions in the broken formation of the MG, it can be concluded that fluid inclusions primarily consist of H2O (low salinity), indicating the absence of carbon.

6. Discussion

6.1. Characteristics of Shallow Fluids

The characterization of fluid inclusions is crucial for understanding the migration of fluids in the subduction zone. However, the interpretation of salinity data for fluid inclusions requires caution, as it is essential to differentiate between “primary inclusions” and “secondary inclusions” [24]. Bakker [81] conducted numerous experiments under controlled external conditions, such as temperature and pressure, and pointed out that water-rich fluid inclusions can sometimes leak or absorb water through host mineral crystals. Here, the salinity data ranges of the six samples presented in Table 2 were relatively concentrated and consistent, indicating NaCl was, indeed, preserved in the primary fluid inclusions and can be considered as valid salinity data [24].
Based on the analysis of the fluid inclusions using microthermometry and Raman spectroscopy, the fluids in the broken formation predominantly consist of the NaCl-H2O system. No nonpolar gases, such as CO2 and CH4, were detected, and the fluids exhibited low temperature (151~178 °C) and low salinity (3.3 ± 0.7 wt%). The average fluid density (0.94 ± 0.09 g/cm3) was similar to that of pure water (1 g/cm3) (Table 2; Figure 7). This type of fluid, characterized by low temperature, low salinity, and the absence of nonpolar gases, such as CO2 and CH4, is commonly found in subduction zone environments [8,24]. The lack of nonpolar gases, including CO2 and CH4, in the crack-seal veins within the broken formation may be attributed to their origin, which is typically associated with (1) the decomposition of organic matter and (2) the decarbonization of carbonate [82].
The former is known to occur through thermal cracking, which typically initiates within the temperature range of 100–150 °C. This process is commonly observed in the décollement zone at a depth domain exceeding 10 km [83]. The latter is related to the decarbonization of limestone in subduction zones. These limestone formations are typically found at the base of sedimentary sequences, just above the oceanic crust, and serve as a significant source of CO2 [84].
The temperature required for decarbonization in the deep subduction zone will be reduced by fluids [84]. Although these limestones often have the potential for decarbonization, the reactions are not expected to occur until depths of 85~100 km [85]. Herein, the crack-seal veins with low temperature (151–178 °C) only developed in the sandstone blocks, which were dragged down by low-relief seamount to the updip limit of the seismogenic depth (>5 km) [64] (Figure 9B). These features suggest that CH4 was not significantly expelled, because the thermal cracking had just begun. The concentration of CH4 in the fluids is not expected to exceed the fluid saturation, indicating that it does not exist as an independent phase in the fluids [86]. It is also worth noting that, the low-relief seamount may have hindered the migration of deep fluids along the subduction channel toward the trench.
At shallow levels in subduction zones (<20 km), a large volume of pore fluids is expelled by diagenesis and mineral dehydration [87]. At greater depths, the presence of fluids in subduction zones is relatively lower compared to those observed in accretionary complexes at relatively shallower depths [87]. Increases in burial depth and P–T conditions drive metamorphic devolatilization reactions, which provide the primary source of fluids in subduction zones [84]. These reactions result in a transition of the fluid from being dilute and water rich to having higher concentrations of rock components, salts, and nonpolar gases [87,88]. Herein, the characteristics of the fluid inclusions indicate that these fluids belonged to the NaCl-H2O system and were dilute in nature. Typically, these fluids are expelled at low temperatures and shallower depths compared to pure H2O or CO2-H2O fluids [89]. Therefore, these features suggest that syn-mélange fluids are more likely a type of pore fluid present at shallow depths.

6.2. Sources of Fluids Associated with Low Salinity

Generally, there are two sources of fluids in subduction zones. The first source is the pore water contained in the sediments that lie on top of the oceanic crust. The second source is the bound water released by the dehydration reaction of water-bearing minerals [9].
Fluid-rich sediments that lie above the subduction plate can either be scraped off to form an accretionary wedge or be underthrusted beneath the upper plate. As these sediments are buried and heated, both pore water and bound water are expelled by compaction and dehydration [90]. Sediments carried on the subducting plate gradually increase in hardness, and become more compacted, leading to a decrease in porosity and a slower rate of compaction-driven dewatering [91] (Figure 9A). With the lithification of sediments, the expulsion rate of pore water reaches a maximum depth of ~3–7 km [92,93]. It can be commonly observed that pore water from sediments overlying the oceanic crust is commonly expelled at a shallow depth of ~5 km (e.g., [94,95]).
In contrast, the dehydration reaction of clay minerals typically occurs at temperatures ranging from 60 to 150 °C, resulting in the formation of hydrocarbons as the primary source of fluids [96]. As the subduction depth increases, the overlying sediments are gradually exposed to higher temperature and pressure conditions, causing the bound water released from the dehydration of clay minerals to become the dominant fluid source [91]. However, the trapping temperature (151~178 °C) estimated from the fluid inclusions indicates that only a small amount of bound water has been produced.
The pore water expelled through compaction processes often has a composition similar to seawater. However, the bound water released from the dehydration of clay minerals tends to have unique characteristics, such as a higher hydrocarbon content [91,97,98]. As a result, the pore water in the subduction zone tends to undergo freshening due to the addition of this distinct bound water, which is usually used to explain the pore water anomaly at the convergent plate boundary [3,99,100,101]. In the Cascadia subduction zone, pore fluids have been observed to contain additional freshwater as a result of mineral dehydration reactions, which has led to a dilution of chloride concentrations to approximately 62% of seawater [102]. Herein, fluids present in the fractured formation exhibited distinct characteristics, including low temperature and salinity levels (3.3 ± 0.7 wt%), which were lower than that of seawater (~3.5 wt% [103]). Furthermore, the absence of hydrocarbons suggests that the primary source of these fluids is the pore water within the water-rich sediments located above the subduction plate. Additionally, the slightly lower salinity of the pore water compared to average seawater can be attributed to the addition of freshwater resulting from mineral dehydration reactions.

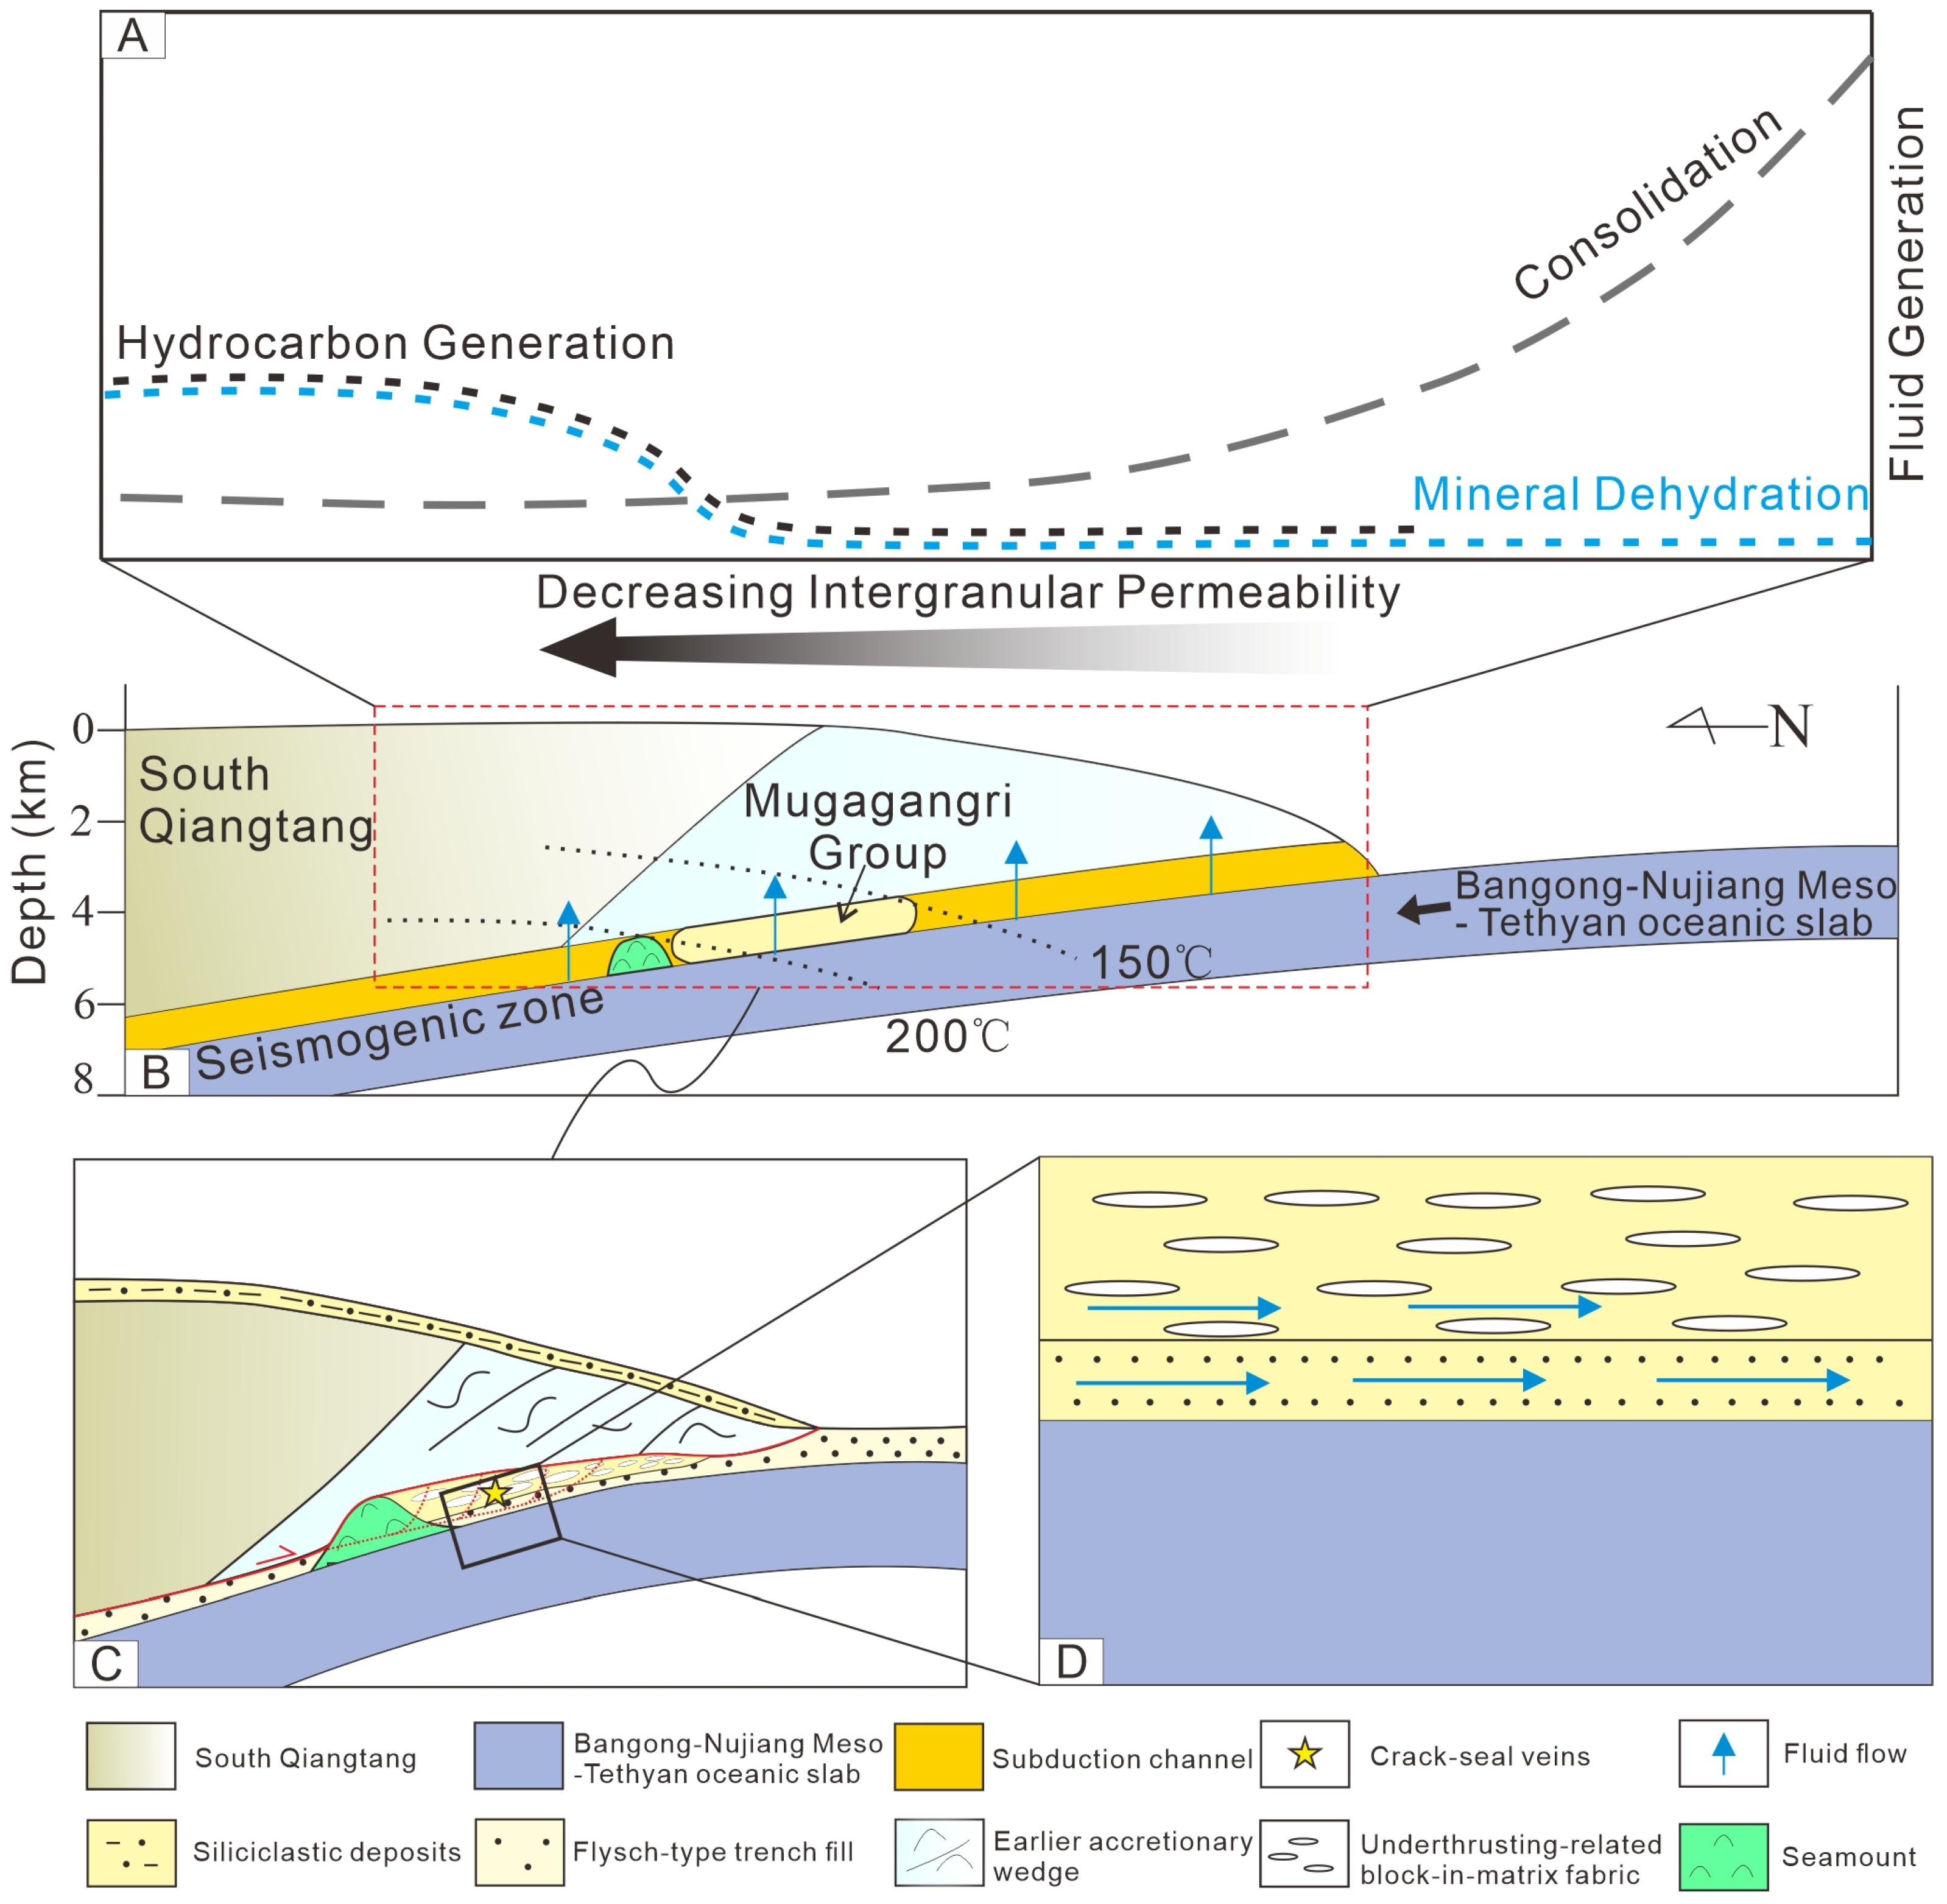
6.3. Migration of Fluids in the Broken Formation

The transport of halogen element (chlorine) in the subduction zone primarily occurs through plate dehydration. This element is subsequently transferred through the generated fluids, acting as carriers for their transportation [104]. The characteristics of fluid inclusions suggest that the average salinity of fluids in broken formation is 3.3 ± 0.7 wt%, slightly lower than seawater (~3.5 wt% [103]). Generally, chlorine concentrations in the pore water are often close to the seawater, more than 50% [98,105]. If not replenished for a long time, chlorine anomalies typically undergo gradual diffusion and eventually disappear within several hundred thousand years. To maintain the concentration levels, fluids often flow along the sedimentary layers [82] (Figure 9D).
The temperature condition estimated for the crack-seal veins in the broken formation of Domain II ranges from approximately 151 to 178 °C, and these veins are mainly filled with extension cracks developed in the sandstone blocks. These characteristics suggest that the broken formation experienced the ductile–brittle transition zone in the shallower subduction zone (<5 km), which is comparable in the Mugi mélange of the Shimanto Belt (southwest Japan) (e.g., [6,106]). Furthermore, the transition observed in the shallow subduction zones is likely associated with lithification, and compaction plays a significant role in the lithification of sandstone [22]. This suggests that the lithification of sandstone blocks is likely completed prior to mélange formation [43]. In addition, the broken formations in Domain II have the deformation features of the brittle–ductile transition zone (>5 km) that is characterized by the cataclasis and pressure solution of sandstone blocks and phyllitic matrixes. These matrixes have a typical scaly cleavage and are pervasively overprinted by post-phyllitic cleavage. These features indicate that the broken formations reach the maximum lithification at ~5 km [64].
The characteristic of the crack-seal veins had an increased abundance toward the boundary faults between the thrust sheets. These crack-seal textures within the veins in the exhumed fault zones provide evidence of repeated hydraulic fracturing [91]. Pore fluid overpressure can be driven by mechanical loading or mineral dehydration during subduction. Because of overpressure, the fluid flow is expected to occur wherever sufficiently permeable pathways exist, which contributes to the production of fracture networks via hydraulic fracturing [67]. The ability of rocks to undergo cracking is also significantly affected by progressive diagenesis [107]. Additionally, the fracture networks usually develop near the thrust faults and do not simply develop near continuous planar sheets in the décollement zone for accretionary wedge stability [108].
Accordingly, pore fluids are expelled by the lithification of sandstone blocks because of mechanical compaction. At a depth of approximately 5 km, the sandstone becomes sufficiently lithified, resulting in pore fluids overpressure and the development of extension cracks. This process contributes to the development of quartz veins [106]. The MAC exhibits a characteristic pattern of south-vergent, indicating that the mélange has undergone décollement steps down and subsequent underplating [64] (Figure 3A–C and Figure 9C). The depth of the oceanic crust underplating is similar to the depth at which the décollement step-down occurs in the modern Nankai subduction zone [6]. Pore fluid overpressure causes cracks to develop near thrust faults, which weakens the interplate thrust faults and potentially contributes to the décollement step-down and underthrusting [109]. Pseudotachylite, a type of rock formed during earthquakes, is typically observed in seismogenic faults within accretionary complexes [106]. However, the absence of pseudotachylite in the broken formation suggests that it may accrete without experiencing significant subduction-zone earthquakes, likely due to the cracks that relieve the pressure.

7. Conclusions

  • The analysis of fluid inclusions in the broken formation of the MG revealed two types: biphase (type I) and monophase (type II) aqueous fluid inclusions. These fluid inclusions primarily consisted of H2O and did not contain nonpolar gases such as CO2 or CH4.
  • The characteristics of the fluid inclusions in the crack-seal veins suggest the fluids trapped in the mélange formation are pore fluids with low temperature, low salinity, and low density. The presence of a salinity anomaly suggests clay mineral dehydration, which leads to freshening of the pore fluids.
  • The pore water in sediment over the oceanic crust is a major fluid source in the broken formation, flowing along the sediment layer during subduction. Compaction and dehydration expel pore fluids, relieving excess pressure and creating cracks via hydraulic fracturing. Crack-seal textures weaken interplate thrust faults, promoting décollement step-down and underthrusting. Pore fluids become trapped in veins within sandstone cracks at ~5 km depth. The décollement can subsequently break through and step-down, with veins underplating as pervasive broken formation within block-in-matrix fabrics.

Supplementary Materials

The following supporting information can be downloaded at: https://www.mdpi.com/article/10.3390/min13091196/s1, Table S1: Results of the fluid inclusion analysis.

Author Contributions

Conceptualization, X.L. and M.Z.; methodology, X.L. and S.C.; formal analysis, X.L. and T.L.; investigation, X.L.; writing—review and editing, C.L. and M.Z.; funding acquisition, M.Z. All authors have read and agreed to the published version of the manuscript.

Funding

This study was co-supported by funds from the National Natural Science Foundation of China (No. 41102065; No. 41872110; and No. 42172118), Sichuan Science and Technology Program (No. 2018JY0465; No. 2020YJ0427), Everest Scientific Research Program of Chengdu University of Technology (2020ZF11407), Chengdu University of Technology (1080018Z0102; 0912-KYQD2022-09847), and Yunnan University (C1762101030017).

Data Availability Statement

The experimental data used to support the conclusions of this study can be found in the Supplementary Materials of Table S1.

Conflicts of Interest

The authors declare no conflict of interest.

References

  1. Hashimoto, Y.; Eida, M.; Kirikawa, T.; Iida, R.; Takagi, M.; Furuya, N.; Nikaizo, A.; Kikuchi, T.; Yoshimitsu, T. Large amount of fluid migration around shallow seismogenic depth preserved in tectonic mélange: Yokonami mélange, the Cretaceous Shimanto Belt, Kochi, Southwest Japan. Isl. Arc 2012, 21, 53–64. [Google Scholar] [CrossRef]
  2. Saffer, D.M. Pore Pressure within underthrust sediment in subduction zones. In The Seismogenic Zone of Subduction Thrust Faults; Columbia University Press: New York, NY, USA, 2007; pp. 171–209. ISBN 0231512015. [Google Scholar]
  3. Saffer, D.M.; Underwood, M.B.; McKiernan, A.W. Evaluation of factors controlling smectite transformation and fluid production in subduction zones: Application to the Nankai Trough. Isl. Arc 2008, 17, 208–230. [Google Scholar] [CrossRef]
  4. Spinelli, G.A.; Wang, K. Effects of fluid circulation in subducting crust on Nankai margin seismogenic zone temperatures. Geology 2008, 36, 887–890. [Google Scholar] [CrossRef]
  5. Tobin, H.J.; Saffer, D.M. Elevated fluid pressure and extreme mechanical weakness of a plate boundary thrust, Nankai Trough subduction zone. Geology 2009, 37, 679–682. [Google Scholar] [CrossRef]
  6. Matsumura, M.; Hashimoto, Y.; Kimura, G.; Ohmori-Ikehara, K.; Enjohji, M.; Ikesawa, E. Depth of oceanic-crust underplating in a subduction zone: Inferences from fluid-inclusion analyses of crack-seal veins. Geology 2003, 31, 1005–1008. [Google Scholar] [CrossRef]
  7. Nishimura, K.; Amita, K.; Ohsawa, S.; Kobayashi, T.; Hirajima, T. Chemical characteristics and trapping PT conditions of fluid inclusions in quartz veins from the Sanbagawa metamorphic belt, SW Japan. J. Mineral. Petrol. Sci. 2008, 103, 94–99. [Google Scholar] [CrossRef]
  8. Nishiyama, N.; Sumino, H.; Ujiie, K. Fluid overpressure in subduction plate boundary caused by mantle-derived fluids. Earth Planet. Sci. Lett. 2020, 538, 116199. [Google Scholar] [CrossRef]
  9. Peacock, S.M. Thermal and metamorphic environment of subduction zone episodic tremor and slip. J. Geophys. Res. Solid Earth 2009, 114, B00A07. [Google Scholar] [CrossRef]
  10. Hara, H.; Wakita, K.; Ueno, K.; Kamata, Y.; Hisada, K.-I.; Charusiri, P.; Charoentitirat, T.; Chaodumrong, P. Nature of accretion related to Paleo-Tethys subduction recorded in northern Thailand: Constraints from mélange kinematics and illite crystallinity. Gondwana Res. 2009, 16, 310–320. [Google Scholar] [CrossRef]
  11. Ikesawa, E.; Kimura, G.; Sato, K.; Ikehara-Ohmori, K.; Kitamura, Y.; Yamaguchi, A.; Ujiie, K.; Hashimoto, Y. Tectonic incorporation of the upper part of oceanic crust to overriding plate of a convergent margin: An example from the Cretaceous–early Tertiary Mugi Mélange, the Shimanto Belt, Japan. Tectonophysics 2005, 401, 217–230. [Google Scholar] [CrossRef]
  12. Rad, G.F.; Droop, G.T.; Amini, S.; Moazzen, M. Eclogites and blueschists of the Sistan Suture Zone, eastern Iran: A comparison of P–T histories from a subduction mélange. Lithos 2005, 84, 1–24. [Google Scholar] [CrossRef]
  13. Dragovic, B.; Angiboust, S.; Tappa, M.J. Petrochronological close-up on the thermal structure of a paleo-subduction zone (W. Alps). Earth Planet. Sci. Lett. 2020, 547, 116446. [Google Scholar] [CrossRef]
  14. Faryad, S.W.; Ježek, J.; Kulhánek, J. Constraining the P–T path of (U) HP rocks with reaction overstepping during subduction; example from the Western Gneiss Region (Norway). J. Metamorph. Geol. 2022, 40, 1427–1446. [Google Scholar] [CrossRef]
  15. Janák, M.; Froitzheim, N.; Yoshida, K.; Sasinková, V.; Nosko, M.; Kobayashi, T.; Hirajima, T.; Vrabec, M. Diamond in metasedimentary crustal rocks from Pohorje, Eastern Alps: A window to deep continental subduction. J. Metamorph. Geol. 2015, 33, 495–512. [Google Scholar] [CrossRef]
  16. Spandler, C.; Hermann, J.; Faure, K.; Mavrogenes, J.A.; Arculus, R.J. The importance of talc and chlorite “hybrid” rocks for volatile recycling through subduction zones; evidence from the high-pressure subduction mélange of New Caledonia. Contrib. Mineral. Petrol. 2008, 155, 181–198. [Google Scholar] [CrossRef]
  17. Vitale Brovarone, A.; Agard, P. True metamorphic isograds or tectonically sliced metamorphic sequence? New high-spatial resolution petrological data for the New Caledonia case study. Contrib. Mineral. Petrol. 2013, 166, 451–469. [Google Scholar] [CrossRef]
  18. Xu, Z.; Qi, X.; Liu, F.; Yang, J.; Zeng, L.; Wu, C. A new Caledonian Khondalite series in West Kunlun, China: Age constraints and tectonic significance. Int. Geol. Rev. 2005, 47, 986–998. [Google Scholar] [CrossRef]
  19. Zanoni, D.; Iole Spalla, M.; Gosso, G. Structure and PT estimates across late-collisional plutons: Constraints on the exhumation of western Alpine continental HP units. Int. Geol. Rev. 2010, 52, 1244–1267. [Google Scholar] [CrossRef]
  20. Chi, G.; Diamond, L.W.; Lu, H.; Lai, J.; Chu, H. Common problems and pitfalls in fluid inclusion study: A review and discussion. Minerals 2020, 11, 7. [Google Scholar] [CrossRef]
  21. Brooks, H.L.; Dragovic, B.; Lamadrid, H.M.; Caddick, M.J.; Bodnar, R.J. Fluid capture during exhumation of subducted lithologies: A fluid inclusion study from Sifnos, Greece. Lithos 2019, 332, 120–134. [Google Scholar] [CrossRef]
  22. Hashimoto, Y.; Enjoji, M.; Sakaguchi, A.; Kimura, G. In situ pressure-temperature conditions of a tectonic mélange: Constraints from fluid inclusion analysis of syn-mélange veins. Isl. Arc 2003, 12, 357–365. [Google Scholar] [CrossRef]
  23. Hashimoto, Y.; Enjoji, M.; Sakaguchi, A.; Kimura, G. PT conditions of cataclastic deformation associated with underplating: An example from the Cretaceous Shimanto complex, Kii Peninsula, SW Japan. Earth Planets Space 2002, 54, 1133–1138. [Google Scholar] [CrossRef]
  24. Kawamoto, T.; Hertwig, A.; Schertl, H.-P.; Maresch, W.V. Fluid inclusions in jadeitite and jadeite-rich rock from serpentinite mélanges in northern Hispaniola: Trapped ambient fluids in a cold subduction channel. Lithos 2018, 308, 227–241. [Google Scholar] [CrossRef]
  25. Kondo, H.; Kimura, G.; Masago, H.; Ohmori-Ikehara, K.; Kitamura, Y.; Ikesawa, E.; Sakaguchi, A.; Yamaguchi, A.; Okamoto, S. Deformation and fluid flow of a major out-of-sequence thrust located at seismogenic depth in an accretionary complex: Nobeoka Thrust in the Shimanto Belt, Kyushu, Japan. Tectonics 2005, 24, TC6008. [Google Scholar] [CrossRef]
  26. Sachan, H.K.; Kharya, A.; Singh, P.C.; Rolfo, F.; Groppo, C.; Tiwari, S.K. A fluid inclusion study of blueschist-facies lithologies from the Indus suture zone, Ladakh (India): Implications for the exhumation of the subduction related Sapi-Shergol ophiolitic mélange. J. Asian Earth Sci. 2017, 146, 185–195. [Google Scholar] [CrossRef]
  27. Ujiie, K.; Yamaguchi, A.; Taguchi, S. Stretching of fluid inclusions in calcite as an indicator of frictional heating on faults. Geology 2008, 36, 111–114. [Google Scholar] [CrossRef]
  28. Vrolijk, P.; Myers, G.; Moore, J.C. Warm fluid migration along tectonic melanges in the Kodiak accretionary complex, Alaska. J. Geophys. Res. Solid Earth 1988, 93, 10313–10324. [Google Scholar] [CrossRef]
  29. Li, J.L. Basic characteristics of accretion-type orogens. Geol. Bull. China 2004, 23, 947–951. [Google Scholar]
  30. Yuan, S.; Pan, G.; Wang, L.; Jiang, X.; Yin, F.; Zhang, W.; Zhuo, J. Accretionary orogenesis in the active continental margins. Earth Sci. Front. 2009, 16, 31–48. [Google Scholar] [CrossRef]
  31. Xiao, W.; Santosh, M. The western Central Asian Orogenic Belt: A window to accretionary orogenesis and continental growth. Gondwana Res. 2014, 25, 1429–1444. [Google Scholar] [CrossRef]
  32. Zeng, M.; Chen, J.P.; Wei, C.C. The Mugagangri Group is an accretionary complex accreted onto the south margin of Qiangtang. Earth Sci. Front. 2017, 24, 207–217. [Google Scholar] [CrossRef]
  33. Pan, G.T.; Xiao, Q.H.; Zhang, K.X.; Yin, F.G.; Ren, F.; Peng, Z.M.; Wang, J.X. Recognition of the oceanic subduction-accretion zones from the orogenic belt in continents and its important scientific significance. Earth Sci. 2019, 44, 1544–1561. [Google Scholar]
  34. Žák, J.; Svojtka, M.; Hajná, J.; Ackerman, L. Detrital zircon geochronology and processes in accretionary wedges. Earth-Sci. Rev. 2020, 207, 103214. [Google Scholar] [CrossRef]
  35. Bangs, N.L.; Gulick, S.P.; Shipley, T.H. Seamount subduction erosion in the Nankai Trough and its potential impact on the seismogenic zone. Geology 2006, 34, 701–704. [Google Scholar] [CrossRef]
  36. Brown, D.T.; Spadea, P. Processes of forearc and accretionary complex formation during arc-continent collision in the southern Ural Mountains. Geology 1999, 27, 649–652. [Google Scholar] [CrossRef]
  37. Cawood, P.A.; Kröner, A.; Collins, W.J.; Kusky, T.M.; Mooney, W.D.; Windley, B.F. Accretionary orogens through Earth history. Geol. Soc. Lond. Spec. Publ. 2009, 318, 1–36. [Google Scholar] [CrossRef]
  38. Hayman, N.W.; Toshiya, K. Structural evolution of an inner accretionary wedge and forearc basin initiation, Nankai margin, Japan. Earth Planet. Sci. Lett. 2012, 353, 163–172. [Google Scholar] [CrossRef]
  39. Girardeau, J.; Marcoux, J.; Allègre, C.J.; Bassoullet, J.P.; Youking, T.; Xuchang, X.; Yougong, Z.; Xibin, W. Tectonic environment and geodynamic significance of the Neo-Cimmerian Donqiao ophiolite, Bangong-Nujiang suture zone, Tibet. Nature 1984, 307, 27–31. [Google Scholar] [CrossRef]
  40. Pan, G.; Zhu, D.; Wang, L. Bangong Lake-Nu River suture zone-the northern boundary of Gondwanaland: Evidence from geology and geophysics. Earth Sci. Front. 2004, 11, 371–382. [Google Scholar]
  41. Wang, B.-D.; Wang, L.-Q.; Chung, S.-L.; Chen, J.-L.; Yin, F.-G.; Liu, H.; Li, X.-B.; Chen, L.-K. Evolution of the Bangong–Nujiang Tethyan ocean: Insights from the geochronology and geochemistry of mafic rocks within ophiolites. Lithos 2016, 245, 18–33. [Google Scholar] [CrossRef]
  42. Zhu, D.-C.; Zhao, Z.-D.; Niu, Y.; Dilek, Y.; Hou, Z.-Q.; Mo, X.-X. The origin and pre-Cenozoic evolution of the Tibetan Plateau. Gondwana Res. 2013, 23, 1429–1454. [Google Scholar] [CrossRef]
  43. Hashimoto, Y.; Nakaya, T.; Ito, M.; Kimura, G. Tectonolithification of sandstone prior to the onset of seismogenic subduction zone: Evidence from tectonic mélange of the Shimanto Belt, Japan. Geochem. Geophys. Geosyst. 2006, 7, Q06013. [Google Scholar] [CrossRef]
  44. Kameda, J.; Ujiie, K.; Yamaguchi, A.; Kimura, G. Smectite to chlorite conversion by frictional heating along a subduction thrust. Earth Planet. Sci. Lett. 2011, 305, 161–170. [Google Scholar] [CrossRef]
  45. Palazzin, G.; Raimbourg, H.; Famin, V.; Jolivet, L.; Kusaba, Y.; Yamaguchi, A. Deformation processes at the down-dip limit of the seismogenic zone: The example of Shimanto accretionary complex. Tectonophysics 2016, 687, 28–43. [Google Scholar] [CrossRef]
  46. Hara, H.; Hisada, K.I. Tectono-metamorphic evolution of the Cretaceous Shimanto accretionary complex, central Japan: Constraints from a fluid inclusion analysis of syn-tectonic veins. Isl. Arc 2007, 16, 57–68. [Google Scholar] [CrossRef]
  47. Lacroix, B.; Lahfid, A.; Ward, C.; Niemi, N.A.; Chapman, A.D.; Jarvis, W.; Kempton, P.D. Raman thermometry and (U-Th)/He thermochronometry reveal Neogene transpressional exhumation in the Nacimiento block of central California, USA. Geology 2022, 50, 1421–1426. [Google Scholar] [CrossRef]
  48. Cloos, M. Flow melanges: Numerical modeling and geologic constraints on their origin in the Franciscan subduction complex, California. Geol. Soc. Am. Bull. 1982, 93, 330–345. [Google Scholar] [CrossRef]
  49. Guynn, J.H.; Kapp, P.; Pullen, A.; Heizler, M.; Gehrels, G.; Ding, L. Tibetan basement rocks near Amdo reveal “missing” Mesozoic tectonism along the Bangong suture, central Tibet. Geology 2006, 34, 505–508. [Google Scholar] [CrossRef]
  50. Kapp, P.; Murphy, M.A.; Yin, A.; Harrison, T.M.; Ding, L.; Guo, J. Mesozoic and Cenozoic tectonic evolution of the Shiquanhe area of western Tibet. Tectonics 2003, 22, 1029. [Google Scholar] [CrossRef]
  51. Kapp, P.; Yin, A.; Harrison, T.M.; Ding, L. Cretaceous-Tertiary shortening, basin development, and volcanism in central Tibet. Geol. Soc. Am. Bull. 2005, 117, 865–878. [Google Scholar] [CrossRef]
  52. Dilek, Y.; Furnes, H. Structure and geochemistry of Tethyan ophiolites and their petrogenesis in subduction rollback systems. Lithos 2009, 113, 1–20. [Google Scholar] [CrossRef]
  53. Metcalfe, I. Gondwana dispersion and Asian accretion: Tectonic and palaeogeographic evolution of eastern Tethys. J. Asian Earth Sci. 2013, 66, 1–33. [Google Scholar] [CrossRef]
  54. Liu, D.; Shi, R.; Ding, L.; Huang, Q.; Zhang, X.; Yue, Y.; Zhang, L. Zircon U–Pb age and Hf isotopic compositions of Mesozoic granitoids in southern Qiangtang, Tibet: Implications for the subduction of the Bangong–Nujiang Tethyan Ocean. Gondwana Res. 2017, 41, 157–172. [Google Scholar] [CrossRef]
  55. Yin, A.; Harrison, T.M. Geologic evolution of the Himalayan-Tibetan orogen. Annu. Rev. Earth Planet. Sci. 2000, 28, 211–280. [Google Scholar] [CrossRef]
  56. Zhu, D.-C.; Li, S.-M.; Cawood, P.A.; Wang, Q.; Zhao, Z.-D.; Liu, S.-A.; Wang, L.-Q. Assembly of the Lhasa and Qiangtang terranes in central Tibet by divergent double subduction. Lithos 2016, 245, 7–17. [Google Scholar] [CrossRef]
  57. Li, C.; Zeng, M.; Chen, S.; Jin, X.; Cheng, W. Provenance evolution during passive-to active-margin transition unraveled from an accretionary complex from the Bangong-Nujiang suture zone: Insights into Early Mesozoic Meso-Tethys subduction and source-area tectonics. Gondwana Res. 2021, 98, 191–211. [Google Scholar] [CrossRef]
  58. Li, S.; Yin, C.; Guilmette, C.; Ding, L.; Zhang, J. Birth and demise of the Bangong-Nujiang Tethyan Ocean: A review from the Gerze area of central Tibet. Earth-Sci. Rev. 2019, 198, 102907. [Google Scholar] [CrossRef]
  59. Ma, Y.; Yang, T.; Bian, W.; Jin, J.; Wang, Q.; Zhang, S.; Wu, H.; Li, H.; Cao, L.; Yuan, H.; et al. Paleomagnetic and geochronologic results of latest Cretaceous lava flows from the Lhasa terrane and their tectonic implications. J. Geophys. Res. Solid Earth 2017, 122, 8786–8809. [Google Scholar] [CrossRef]
  60. Shi, L.; Huang, J.; Chen, W. Birth and demise of the Bangong–Nujiang Tethyan Ocean: A review from the Gerze area of Central Tibet: Comment. Earth-Sci. Rev. 2020, 208, 103209. [Google Scholar] [CrossRef]
  61. Zeng, M.; Zhang, X.; Cao, H.; Ettensohn, F.R.; Cheng, W.; Lang, X. Late Triassic initial subduction of the Bangong-Nujiang Ocean beneath Qiangtang revealed: Stratigraphic and geochronological evidence from Gaize, Tibet. Basin Res. 2016, 28, 147–157. [Google Scholar] [CrossRef]
  62. Cao, S.H.; Xiao, X.L.; Ouyang, K.G. Renew-establishment of the jurassic mugagangri groups and its geological significance on the western side of the Bangong Co-Nujiang junction zone. Acta Sedimentol. Sin. 2008, 26, 559–564. [Google Scholar]
  63. Zhang, R.; Zeng, M. Mapping lithologic components of ophiolitic mélanges based on ASTER spectral analysis: A case study from the Bangong-Nujiang Suture Zone (Tibet, China). ISPRS Int. J. Geo-Inf. 2018, 7, 34. [Google Scholar] [CrossRef]
  64. Zeng, M.; Zhang, R.; Chen, S.; Liu, X.; Li, C.; Ettensohn, F.R.; Bie, L. Reconstructing Ocean-Plate Stratigraphy (OPS) to Understand Accretionary Style and Mélange Fabric: Insights From the Bangong-Nujiang Suture (Tibet, China). Geophys. Res. Lett. 2021, 48, e2021GL094457. [Google Scholar] [CrossRef]
  65. Festa, A.; Ogata, K.; Pini, G.A.; Dilek, Y.; Alonso, J.L. Origin and significance of olistostromes in the evolution of orogenic belts: A global synthesis. Gondwana Res. 2016, 39, 180–203. [Google Scholar] [CrossRef]
  66. Festa, A.; Pini, G.A.; Ogata, K.; Dilek, Y. Diagnostic features and field-criteria in recognition of tectonic, sedimentary and diapiric mélanges in orogenic belts and exhumed subduction-accretion complexes. Gondwana Res. 2019, 74, 7–30. [Google Scholar] [CrossRef]
  67. Zuhlsdorff, L.; Spieß, V. Three-dimensional seismic characterization of a venting site reveals compelling indications of natural hydraulic fracturing. Geology 2004, 32, 101–104. [Google Scholar] [CrossRef]
  68. Yamaguchi, A.; Ujiie, K.; Nakai, S.; Kimura, G. Sources and physicochemical characteristics of fluids along a subduction-zone megathrust: A geochemical approach using syn-tectonic mineral veins in the Mugi mélange, Shimanto accretionary complex. Geochem. Geophys. Geosyst. 2012, 13, Q0AD24. [Google Scholar] [CrossRef]
  69. Van den Kerkhof, A.M.; Hein, U.F. Fluid inclusion petrography. Lithos 2001, 55, 27–47. [Google Scholar] [CrossRef]
  70. Goldstein, R.H.; Samson, I.; Anderson, A.; Marshall, D. Petrographic analysis of fluid inclusions. Fluid Incl. Anal. Interpret. 2003, 32, 9–53. [Google Scholar]
  71. Roedder, E. Studies of fluid inclusions; Part 1, Low temperature application of a dual-purpose freezing and heating stage. Econ. Geol. 1962, 57, 1045–1061. [Google Scholar] [CrossRef]
  72. Frezzotti, M.L.; Tecce, F.; Casagli, A. Raman spectroscopy for fluid inclusion analysis. J. Geochem. Explor. 2012, 112, 1–20. [Google Scholar] [CrossRef]
  73. Roedder, E. Volume 12: Fluid inclusions. Rev. Mineral. 1984, 12, 644. [Google Scholar]
  74. Huanzhang, L.U. Fluid inclusion petrography: A discussion. Geol. J. China Univ. 2014, 20, 177. [Google Scholar]
  75. Davis, D.W.; Lowenstein, T.K.; Spencer, R.J. Melting behavior of fluid inclusions in laboratory-grown halite crystals in the systems NaCl H2O, NaCl KCl H2O, NaCl MgCl2 H2O, and NaCl CaCl2 H2O. Geochim. Cosmochim. Acta 1990, 54, 591–601. [Google Scholar] [CrossRef]
  76. Bodnar, R.J. Revised equation and table for determining the freezing point depression of H2O-NaCl solutions. Geochim. Cosmochim. Acta 1993, 57, 683–684. [Google Scholar] [CrossRef]
  77. Hall, D.L.; Sterner, S.M.; Bodnar, R.J. Freezing point depression of NaCl-KCl-H2O solutions. Econ. Geol. 1988, 83, 197–202. [Google Scholar] [CrossRef]
  78. Potter, I.I. Pressure corrections for fluid-inclusion homogenization temperatures based on the volumetric properties of the system NaCl–H2O. J. Res. US Geol. Surv. 1977, 5, 603–607. [Google Scholar]
  79. Burke, E.A. Raman microspectrometry of fluid inclusions. Lithos 2001, 55, 139–158. [Google Scholar] [CrossRef]
  80. Walrafen, G.E. Raman spectral studies of the effects of temperature on water structure. J. Chem. Phys. 1967, 47, 114–126. [Google Scholar] [CrossRef]
  81. Bakker, R.J. Re-equilibration processes in fluid inclusion assemblages. Minerals 2017, 7, 117. [Google Scholar] [CrossRef]
  82. Moore, J.C.; Vrolijk, P. Fluids in accretionary prisms. Rev. Geophys. 1992, 30, 113–135. [Google Scholar] [CrossRef]
  83. Raimbourg, H.; Thiéry, R.; Vacelet, M.; Famin, V.; Ramboz, C.; Boussafir, M.; Disnar, J.-R.; Yamaguchi, A. Organic matter cracking; a source of fluid overpressure in subducting sediments. Tectonophysics 2017, 721, 254–274. [Google Scholar] [CrossRef]
  84. Peacock, S.M. Numerical simulation of subduction zone pressure-temperature-time paths: Constraints on fluid production and arc magmatism. Philos. Trans. R. Soc. Lond. Ser. A Phys. Eng. Sci. 1991, 335, 341–353. [Google Scholar] [CrossRef]
  85. Gorman, P.J.; Kerrick, D.M.; Connolly, J. Modeling open system metamorphic decarbonation of subducting slabs. Geochem. Geophys. Geosyst. 2006, 7, Q04007. [Google Scholar] [CrossRef]
  86. Vrolijk, P. Tectonically driven fluid flow in the Kodiak accretionary complex, Alaska. Geology 1987, 15, 466–469. [Google Scholar] [CrossRef]
  87. Manning, C.E.; Frezzotti, M.L. Subduction-zone fluids. Elem. Int. Mag. Mineral. Geochem. Petrol. 2020, 16, 395–400. [Google Scholar] [CrossRef]
  88. Manning, C.E. Fluids of the lower crust: Deep is different. Annu. Rev. Earth Planet. Sci. 2018, 46, 67–97. [Google Scholar] [CrossRef]
  89. Barnes, J.D.; Manning, C.E.; Scambelluri, M.; Selverstone, J. The behavior of halogens during subduction-zone processes. In The Role of Halogens in Terrestrial and Extraterrestrial Geochemical Processes; Springer: Berlin/Heidelberg, Germany, 2018; pp. 545–590. [Google Scholar]
  90. Saffer, D.M.; Bekins, B.A. An evaluation of factors influencing pore pressure in accretionary complexes: Implications for taper angle and wedge mechanics. J. Geophys. Res. Solid Earth 2006, 111, B04101. [Google Scholar] [CrossRef]
  91. Saffer, D.M.; Tobin, H.J. Hydrogeology and mechanics of subduction zone forearcs: Fluid flow and pore pressure. Annu. Rev. Earth Planet. Sci. 2011, 39, 157–186. [Google Scholar] [CrossRef]
  92. Bekins, B.A.; Dreiss, S.J. A simplified analysis of parameters controlling dewatering in accretionary prisms. Earth Planet. Sci. Lett. 1992, 109, 275–287. [Google Scholar] [CrossRef]
  93. Bray, C.J.; Karig, D.E. Porosity of sediments in accretionary prisms and some implications for dewatering processes. J. Geophys. Res. Solid Earth 1985, 90, 768–778. [Google Scholar] [CrossRef]
  94. Jarrard, R.D. Subduction fluxes of water, carbon dioxide, chlorine, and potassium. Geochem. Geophys. Geosyst. 2003, 4, 8905. [Google Scholar] [CrossRef]
  95. van Keken, P.E.; Hacker, B.R.; Syracuse, E.M.; Abers, G.A. Subduction factory: 4. Depth-dependent flux of H2O from subducting slabs worldwide. J. Geophys. Res. Solid Earth 2011, 116, B01401. [Google Scholar] [CrossRef]
  96. Peacock, S.A. Fluid processes in subduction zones. Science 1990, 248, 329–337. [Google Scholar] [CrossRef]
  97. Hensen, C.; Wallmann, K.; Schmidt, M.; Ranero, C.; Suess, E. Fluid expulsion related to mud extrusion off Costa Rica—A window to the subducting slab. Geology 2004, 32, 201–204. [Google Scholar] [CrossRef]
  98. Kastner, M.; Elderfield, H.; Martin, J.B. Fluids in convergent margins: What do we know about their composition, origin, role in diagenesis and importance for oceanic chemical fluxes? Philos. Trans. R. Soc. Lond. Ser. A Phys. Eng. Sci. 1991, 335, 243–259. [Google Scholar] [CrossRef]
  99. Brown, K.M.; Saffer, D.M.; Bekins, B.A. Smectite diagenesis, pore-water freshening, and fluid flow at the toe of the Nankai wedge. Earth Planet. Sci. Lett. 2001, 194, 97–109. [Google Scholar] [CrossRef]
  100. Hüpers, A.; Kopf, A.J. Effect of smectite dehydration on pore water geochemistry in the shallow subduction zone: An experimental approach. Geochem. Geophys. Geosyst. 2012, 13, Q0AD26. [Google Scholar] [CrossRef]
  101. Moore, G.F.; Taira, A.; Klaus, A.; Becker, L.; Boeckel, B.; Cragg, B.A.; Dean, A.; Fergusson, C.L.; Henry, P.; Hirano, S.; et al. New insights into deformation and fluid flow processes in the Nankai Trough accretionary prism: Results of Ocean Drilling Program Leg 190. Geochem. Geophys. Geosyst. 2001, 2, 1058. [Google Scholar] [CrossRef]
  102. Philip, B.T.; Solomon, E.A.; Kelley, D.S.; Tréhu, A.M.; Whorley, T.L.; Roland, E.; Tominaga, M.; Collier, R.W. Fluid sources and overpressures within the central Cascadia Subduction Zone revealed by a warm, high-flux seafloor seep. Sci. Adv. 2023, 9, eadd6688. [Google Scholar] [CrossRef]
  103. Millero, F.J.; Feistel, R.; Wright, D.G.; McDougall, T.J. The composition of Standard Seawater and the definition of the Reference-Composition Salinity Scale. Deep Sea Res. Part I Oceanogr. Res. Pap. 2008, 55, 50–72. [Google Scholar] [CrossRef]
  104. Manning, C.E. The chemistry of subduction-zone fluids. Earth Planet. Sci. Lett. 2004, 223, 1–16. [Google Scholar] [CrossRef]
  105. Mottl, M.J.; Wheat, C.G.; Fryer, P.; Gharib, J.; Martin, J.B. Chemistry of springs across the Mariana forearc shows progressive devolatilization of the subducting plate. Geochim. Cosmochim. Acta 2004, 68, 4915–4933. [Google Scholar] [CrossRef]
  106. Hashimoto, Y.; Yamano, N. Geological evidence for shallow ductile-brittle transition zones along subduction interfaces: Example from the Shimanto Belt, SW Japan. Earth Planets Space 2014, 66, 141. [Google Scholar] [CrossRef]
  107. Behrmann, J.H. Conditions for hydrofracture and the fluid permeability of accretionary wedges. Earth Planet. Sci. Lett. 1991, 107, 550–558. [Google Scholar] [CrossRef]
  108. Brown, K.M.; Bekins, B.; Clennell, B.; Dewhurst, D.; Westbrook, G. Heterogeneous hydrofracture development and accretionary fault dynamics. Geology 1994, 22, 259–262. [Google Scholar] [CrossRef]
  109. Magee, M.E.; Zoback, M.D. Evidence for a weak interplate thrust fault along the northern Japan subduction zone and implications for the mechanics of thrust faulting and fluid expulsion. Geology 1993, 21, 809–812. [Google Scholar] [CrossRef]
Figure 2. Geological map of the Gaize area (modified from [32]). MG is unconformably overlain by younger, Late Jurassic to Early Cretaceous strata. Sections A-A’ to C-C’ were measured in the field, through the MAC in the Gaize area.
Minerals 13 01196 g002
Figure 3. (AC) Cross-sections through the MAC (Gaize) showing prominent lithological and structural features. Trma, Trmb, TrJmc, and Jmd denote the four lithological subunits. Note that folds and thrusts are mainly south-vergent, subdivided into three deformation domains (modified from [64]). Three type of mélanges: broken formation, tectonic mélange, and mélange (olistostrome). (D,E) The quartz veins in Domain II-8 fill extension cracks that are subperpendicular to the long axes of the blocks or in a web-like pattern.
Minerals 13 01196 g003
Figure 4. Photomicrographs of thin sections of veins from this study: (AF) inclusion-rich quartz of six crack-seal veins (crossed polars). The sections of fluid inclusion are too thick, causing the anomaly of interference colors. Minerals in the crossed polars are characterized by no cleavage, conchoidal fracture, and protuberances on top of the quartz grains, indicating only quartz grains in the samples.
Minerals 13 01196 g004
Figure 5. Photomicrographs of fluid inclusions: (A) biphase inclusions (type I) distributed linearly in the quartz; (B) finely discriminated group of inclusions (type I); (C,D) monophase inclusions (type II) distributed randomly or linearly in the quartz; (EI) biphase inclusions (type I) were typically irregular, long-columnar, and oval in shape.
Minerals 13 01196 g005
Figure 6. Characteristics of the fluid inclusion at the first melt temperature: (A) fluid inclusion at room temperature with the gas bubble at a normal size; (B) fluid inclusion below the eutectic temperature; (C) the first melting temperature was at −20.2 °C.
Minerals 13 01196 g006
Figure 7. Histograms showing the variation in the homogenization temperature and salinity in the fluid inclusions.
Minerals 13 01196 g007
Figure 8. Raman spectra of biphase-aqueous fluid inclusions in crack-seal veins. Raman spectra of gas and liquid are shown on the left and right, respectively.
Minerals 13 01196 g008
Figure 9. Schematic diagrams showing the fluid migration processes and the tectonic setting of the MG: (A) major sources of fluid with decreasing intergranular permeability during subduction; (B) schematic profile of the MG; (C) lower-relief seamount subducted into the shallow seismogenic zone (~5 km) until décollement stepped down; (D) fluids flow pathways in the sediments overlying the oceanic crust.
Minerals 13 01196 g009
Table 2. Results of the fluid inclusion analysis.
SampleHost
Mineral
TypeDiameterGas–LiquidThTmSalinityDensity
(μm)Ratio (%)(°C)(°C)(NaCl wt%)(g/cm3)
GZ-411-S1QuartzI5.2~12.35~30124.9~192.4−5.8~−0.20.35~8.950.88~0.97
GZ-411-S2QuartzI5.5~12.75~40143.8~216.3−5.8~−0.40.7~8.950.85~0.95
GZ-411-S3QuartzI5.5~12.75~20122.7~187.2−8.7~−0.20.35~12.510.92~1.03
GZ-411-S4QuartzI5.5~10.55~20142.5~220.3−7.1~−0.50.88~10.610.88~0.95
GZ-411-S5QuartzI5.4~10.75~30142.6~199.5−6.4~−0.50.88~9.730.88~1.00
GZ-411-S6QuartzI5.4~11.25~15128.7~201.5−4.5~−0.20.35~7.170.89~0.95
Disclaimer/Publisher’s Note: The statements, opinions and data contained in all publications are solely those of the individual author(s) and contributor(s) and not of MDPI and/or the editor(s). MDPI and/or the editor(s) disclaim responsibility for any injury to people or property resulting from any ideas, methods, instructions or products referred to in the content.

