Article

Characterizing Archaeological Rhyolites in the Nenana Valley, Interior Alaska

1
SWCA Environmental Consultants, 1800 NW Upshur St., Suite 100, Portland, OR 97209, USA
2
Department of Anthropology, Kansas State University, 617 Fraser Hall, 1415 Jayhawk Blvd., Lawrence, KS 66045, USA
3
Department of Behavioral Sciences, Arkansas Tech University, Witherspoon Hall 349, 407 West Q. St., Russellville, AR 72801, USA
*
Author to whom correspondence should be addressed.
Minerals 2023, 13(9), 1146; https://doi.org/10.3390/min13091146
Submission received: 28 June 2023 / Revised: 8 August 2023 / Accepted: 10 August 2023 / Published: 30 August 2023
(This article belongs to the Special Issue Archaeological Mineralogy)

Abstract

:
Portable X-ray fluorescence (pXRF) is a useful geochemical technique employed to explore toolstone procurement strategies in the lithic record, commonly utilized in sourcing obsidians. Non-obsidian volcanic toolstones (e.g., dacites, rhyolites, basalts, and andesites) are abundant in interior Alaskan assemblages yet understudied compared to obsidian. Geochemical analyses of these non-obsidian materials offer the potential to gain new insights into ancient toolstone provisioning behaviors. This paper presents a synthesis of geochemical (pXRF) analyses of rhyolite artifacts, systematic regional raw material surveys, and lithic technological analyses collected from nineteen late Pleistocene and Holocene assemblages from the Nenana valley, interior Alaska. Previous research studies on archaeological rhyolites from the region are replicated, new rhyolite artifact groups are identified, and one new rhyolite source is reported and described here. Ultimately, this paper contributes to a growing body of geochemical research seeking to provide a more nuanced look at the complex late Pleistocene and Holocene record of eastern Beringia.

1. Introduction

The archaeological record of human dispersal and settlement in Beringia is becoming increasingly complex. New paleogenomic studies confirm ancient Beringians arose from an Asian population, but specifics regarding the timing and dispersal of these populations leave us with more questions than answers when reconciling the archaeological and genetic records [1,2,3,4,5,6,7,8,9,10,11,12,13]. The earliest known well-accepted archaeological sites in eastern Beringia post-date the hypothetical arrival of first Beringians predicted by geneticists. These sites, dating from about 14.2–12 thousand years ago (ka), express a complicated, highly variable lithic record. This complexity persists throughout the Holocene. Explanations of the variability are just as complicated, ranging from distinct human groups to site-function differences to changing responses to fluctuating climate and resource availability from the late Pleistocene through Holocene [14,15,16,17,18,19,20,21,22,23,24,25,26]. Agreement on the most plausible explanations, however, still eludes us [3,15]. How did the earliest Beringians adapt to their surroundings as they arrived in interior Alaska and learned the landscape, and how did they respond to fluctuations in climatic regimes as they settled in?
Because there is a rich record of archaeological sites in the Nenana River valley (herein referred to simply as the Nenana valley), this region provides an excellent case study for examining initial human dispersal and landscape learning in interior Alaska. The valley’s site assemblages consist of lithic artifacts; therefore, one of the best ways to address landscape learning behaviors in this context is to reconstruct the local lithic landscape by characterizing lithic raw material (toolstone) availability so that inferences about procurement can be made. This paper maps the rhyolite lithic landscape in the Nenana valley by presenting results of a detailed lithic raw material survey, geochemically characterizing samples from both rhyolite outcrops and dozens of alluvial collection locations and comparing these natural occurrences to rhyolite artifacts from several local sites to assess if, and to what degree, any of these potential source materials were used. The main objective is to map the rhyolite lithic landscape in the Nenana valley with the goal of explaining how humans used this resource when technologically provisioning, landscape learning, and settling into the uplands of interior Alaska.

2. Background

2.1. Settlement of Beringia

Interior Alaska preserves the earliest unequivocal sites with well-stratified cultural components thought to be representative of the arrival of humans in eastern Beringia [3,19,27,28,29,30]. Many Eastern Beringian sites preserve cultural components spanning the Allerød, Younger Dryas (YD), Holocene Thermal Maximum (HTM) chronozones, and beyond into the middle Holocene, though Holocene-aged components in eastern Beringia are often underreported and understudied [14,31].
The oldest Eastern Beringian site occurs at Swan Point [19,32,33,34]. Here in central Alaska, a late Upper Paleolithic occupation found in the lowest cultural zone, CZ4, dates to 14.2 ka and preserves wedge-shaped microblade cores and microblades [19,35,36]. Following the climatic amelioration of the late glacial, humans began to widely re-settle Beringia, this time extending into Alaska. The sites of Berelekh, Nikita Lake, and Ushki Lake in northwestern and western Beringia have bifaces, blades, and distinctive teardrop-shaped and waisted bifacial points dating to 14.2–13 ka in their lowest layers. In several Tanana and Nenana valley sites the lowest archaeological layers contain teardrop and triangular-shaped projectile points similar to those found in western Beringia and not found with the microblade-bearing composite tool technology observed at Swan Point [16,17,24,27,28,36,37,38,39,40,41,42,43]. These often-diminutive bifacial points are manufactured on flakes, sometimes with minimal bifacial retouch, distinguishing them technologically from other bifacial projectile points of terminal Pleistocene Beringia [37], and perhaps suggesting their use was not always as weapons but also as processing tools [44,45,46].
At the onset of the YD at 12.8 ka [47] and thereafter, a change in technological variability is evident across Beringia. In the Tanana valley lowlands of Alaska, sites exhibit biface-based assemblages consistent with those in the previous Allerød interval, while sites along the Alaska Range uplands in the Nenana, Tanana, and Susitna valleys, as well as at Ushki Lake in Kamchatka have a combined lanceolate bifacial projectile and wedge-shaped microblade-core industry, not unlike Diuktai during the late glacial in northeastern Siberia [48] that also includes burins, side scrapers, and notches as part of the toolkit [16,17,27,28,37,38,39,41,49]. Less than a millennium after the onset of the YD, fluted bifaces associated with other Paleoindian projectile point technologies appear across eastern Beringia from the Seward Peninsula to the Brooks Range [50,51,52,53]. Sites in interior Alaska dating to the HTM, 11.7 ka, contain only biface or flake-based toolkits (e.g., Carlo Creek), only microblade technologies (e.g., Little Panguingue Creek), or both microblades and bifaces (e.g., Dry Creek, Moose Creek, Owl Ridge) [28,54,55,56].
The early-to-middle Holocene record of eastern Beringia is as complex as the late glacial, with the emergence of notched projectile points across Alaska at sites like Onion Portage, Palisades, Tuktu, Landmark Gap, and others, found variably alongside burins, tci-tho scrapers, knives, microblade technologies, and stemmed, concave-based, and lanceolate bifacial points [57,58,59]. Much like industries from previous millennia, middle Holocene sites preserve little fauna and are largely lithic except for the Agiak Lake and Pond sites that preserve caribou bones and drive lines [14,22,23,60,61,62,63,64,65,66]. Broadly, major shifts and patterns in adaptive strategies, mobility, land use, and technological choices that accompanied humans as they continued to make their living during the Holocene remain poorly understood [14,22,23,31].
The archaeological record of interior Alaska is largely lithic, and studies of technological organization, such as raw material use, must be undertaken to investigate past human behaviors [16,67,68,69,70]. While raw material procurement was likely embedded within other resource-specific tasks to reduce risk and energy costs [71,72], quality toolstone was a valuable and important economic resource to ancient humans significantly shaping life decisions [73,74,75,76,77,78].
Toolstone procurement strategies are influenced by a complex array of variables such as technological goals (e.g., portable cores, planned and curated or expedient tools), mobility levels, raw material availability and accessibility, nodule size, knappability, distance to source, ease of embedding into larger resource-use strategies, and social and political factors (e.g., exchange and territoriality) [72,73,74,75,78,79,80,81,82,83,84,85]. Because acquiring raw materials for toolkit use likely played a large role in hunter-gatherer lifeways, understanding the distribution, abundance, and properties of toolstones on a landscape is important in reconstructing overall adaptive strategies [67,73,86].

2.2. Establishing the Nenana River Valley Lithic Landscape

As humans settle into unknown environments, they must discover and familiarize themselves with resource patches to exploit them. How did initial inhabitants of the Nenana valley provision themselves on the “lithic landscape,” and how did behavioral strategies change as humans adapted to this landscape? Identification of potential sources of known lithic materials in the region, to map the lithic landscape of this key area, is essential to answering these questions. A lithic landscape may be defined as the physical distribution of available and usable materials in a given area [77]. Effectively defining the layout of the Nenana valley’s lithic landscape provides a baseline of the availability of local toolstones. With this baseline established, both qualitative and quantitative analyses are employed to deduce which toolstones are local or exotic to comprehensively describe past toolstone procurement and selection strategies [67,83]. The overarching goal of this paper is to contribute to building lithic landscape knowledge through a focus on archaeological rhyolites, an important toolstone used in the region.
Advances in understanding Beringian raw material procurement have been made mostly through regional obsidian studies [87,88,89,90,91,92,93,94]; however, obsidian artifacts are rare in assemblages across the interior, especially within the Nenana valley. Efforts focused only on one type of a rare toolstone provide a limited view of the range of raw material activities represented in an entire lithic assemblage. The archaeological record shows that once arriving in the valley, humans relied upon fine-grained volcanic materials (FGVs) such as basalt, andesite, dacite, rhyolite, and obsidian as well as other rock types (e.g., cherts, chalcedonies, and quartzites) to make their toolkits [16,41,54,55,56,67,95,96]. Cherts have been investigated in the Brooks Range [97] and southeastern Alaska [98], but aside from these studies, relatively few specific source regions are known and described in detail [67,96].
Artifacts produced on FGV toolstones are amenable to geochemical sourcing analysis, making them useful proxies in studies of procurement and mobility [99,100,101,102]. The application of non-destructive geochemical methods such as pXRF has long been employed to investigate the movement of obsidians in Beringia [88,91], but geochemical analysis of other archaeologically abundant materials is still in its infancy, especially in interior Alaska [95,96,98]. Knowledge of non-obsidian FGV toolstones has been limited, with intermediate and mafic volcanics minimally considered [16], despite their prevalence in the record of interior Alaska and potential to inform on prehistoric landscape use within the region [27,28,67,95]. Important first steps at characterizing the distribution and nature of rhyolite artifacts in the interior were recently undertaken by Coffman and Rasic [95], who were the first to characterize rhyolites present in interior Alaskan archaeological assemblages using pXRF geochemistry. Here, a rhyolite group is defined as a geochemically similar grouping of artifacts in which specimens share similar trace-element signatures, and therefore, presumably originate from the same toolstone source.
Coffman and Rasic [95] identified 10 geochemically distinct groups and called for an increase in additional raw materials survey and geochemical studies to locate geographic sources for rhyolite groups. This paper builds upon Coffman and Rasic’s previous study [95] by replicating rhyolite groups present in a region-specific context and goes beyond this study by adding new groups to the list and quantitatively linking geographic source locations to some of these novel rhyolite groups through geochemical analysis. Consideration of rhyolite transport can potentially explain hunter-gatherer provisioning and landscape learning behaviors in the region.
As climate fluctuated from the late glacial to Holocene and eastern Beringian landscapes changed, humans had to respond to shifting resource availability (e.g., water, toolstones, and animals). Climate warmed and precipitation increased during the HTM, and the encroaching boreal forest may have obscured or otherwise hindered access to previously important toolstone resources such as rhyolite, and/or significantly affected land-use strategies by re-organizing or redistributing food resources impacting access to lithic resources.

3. Materials

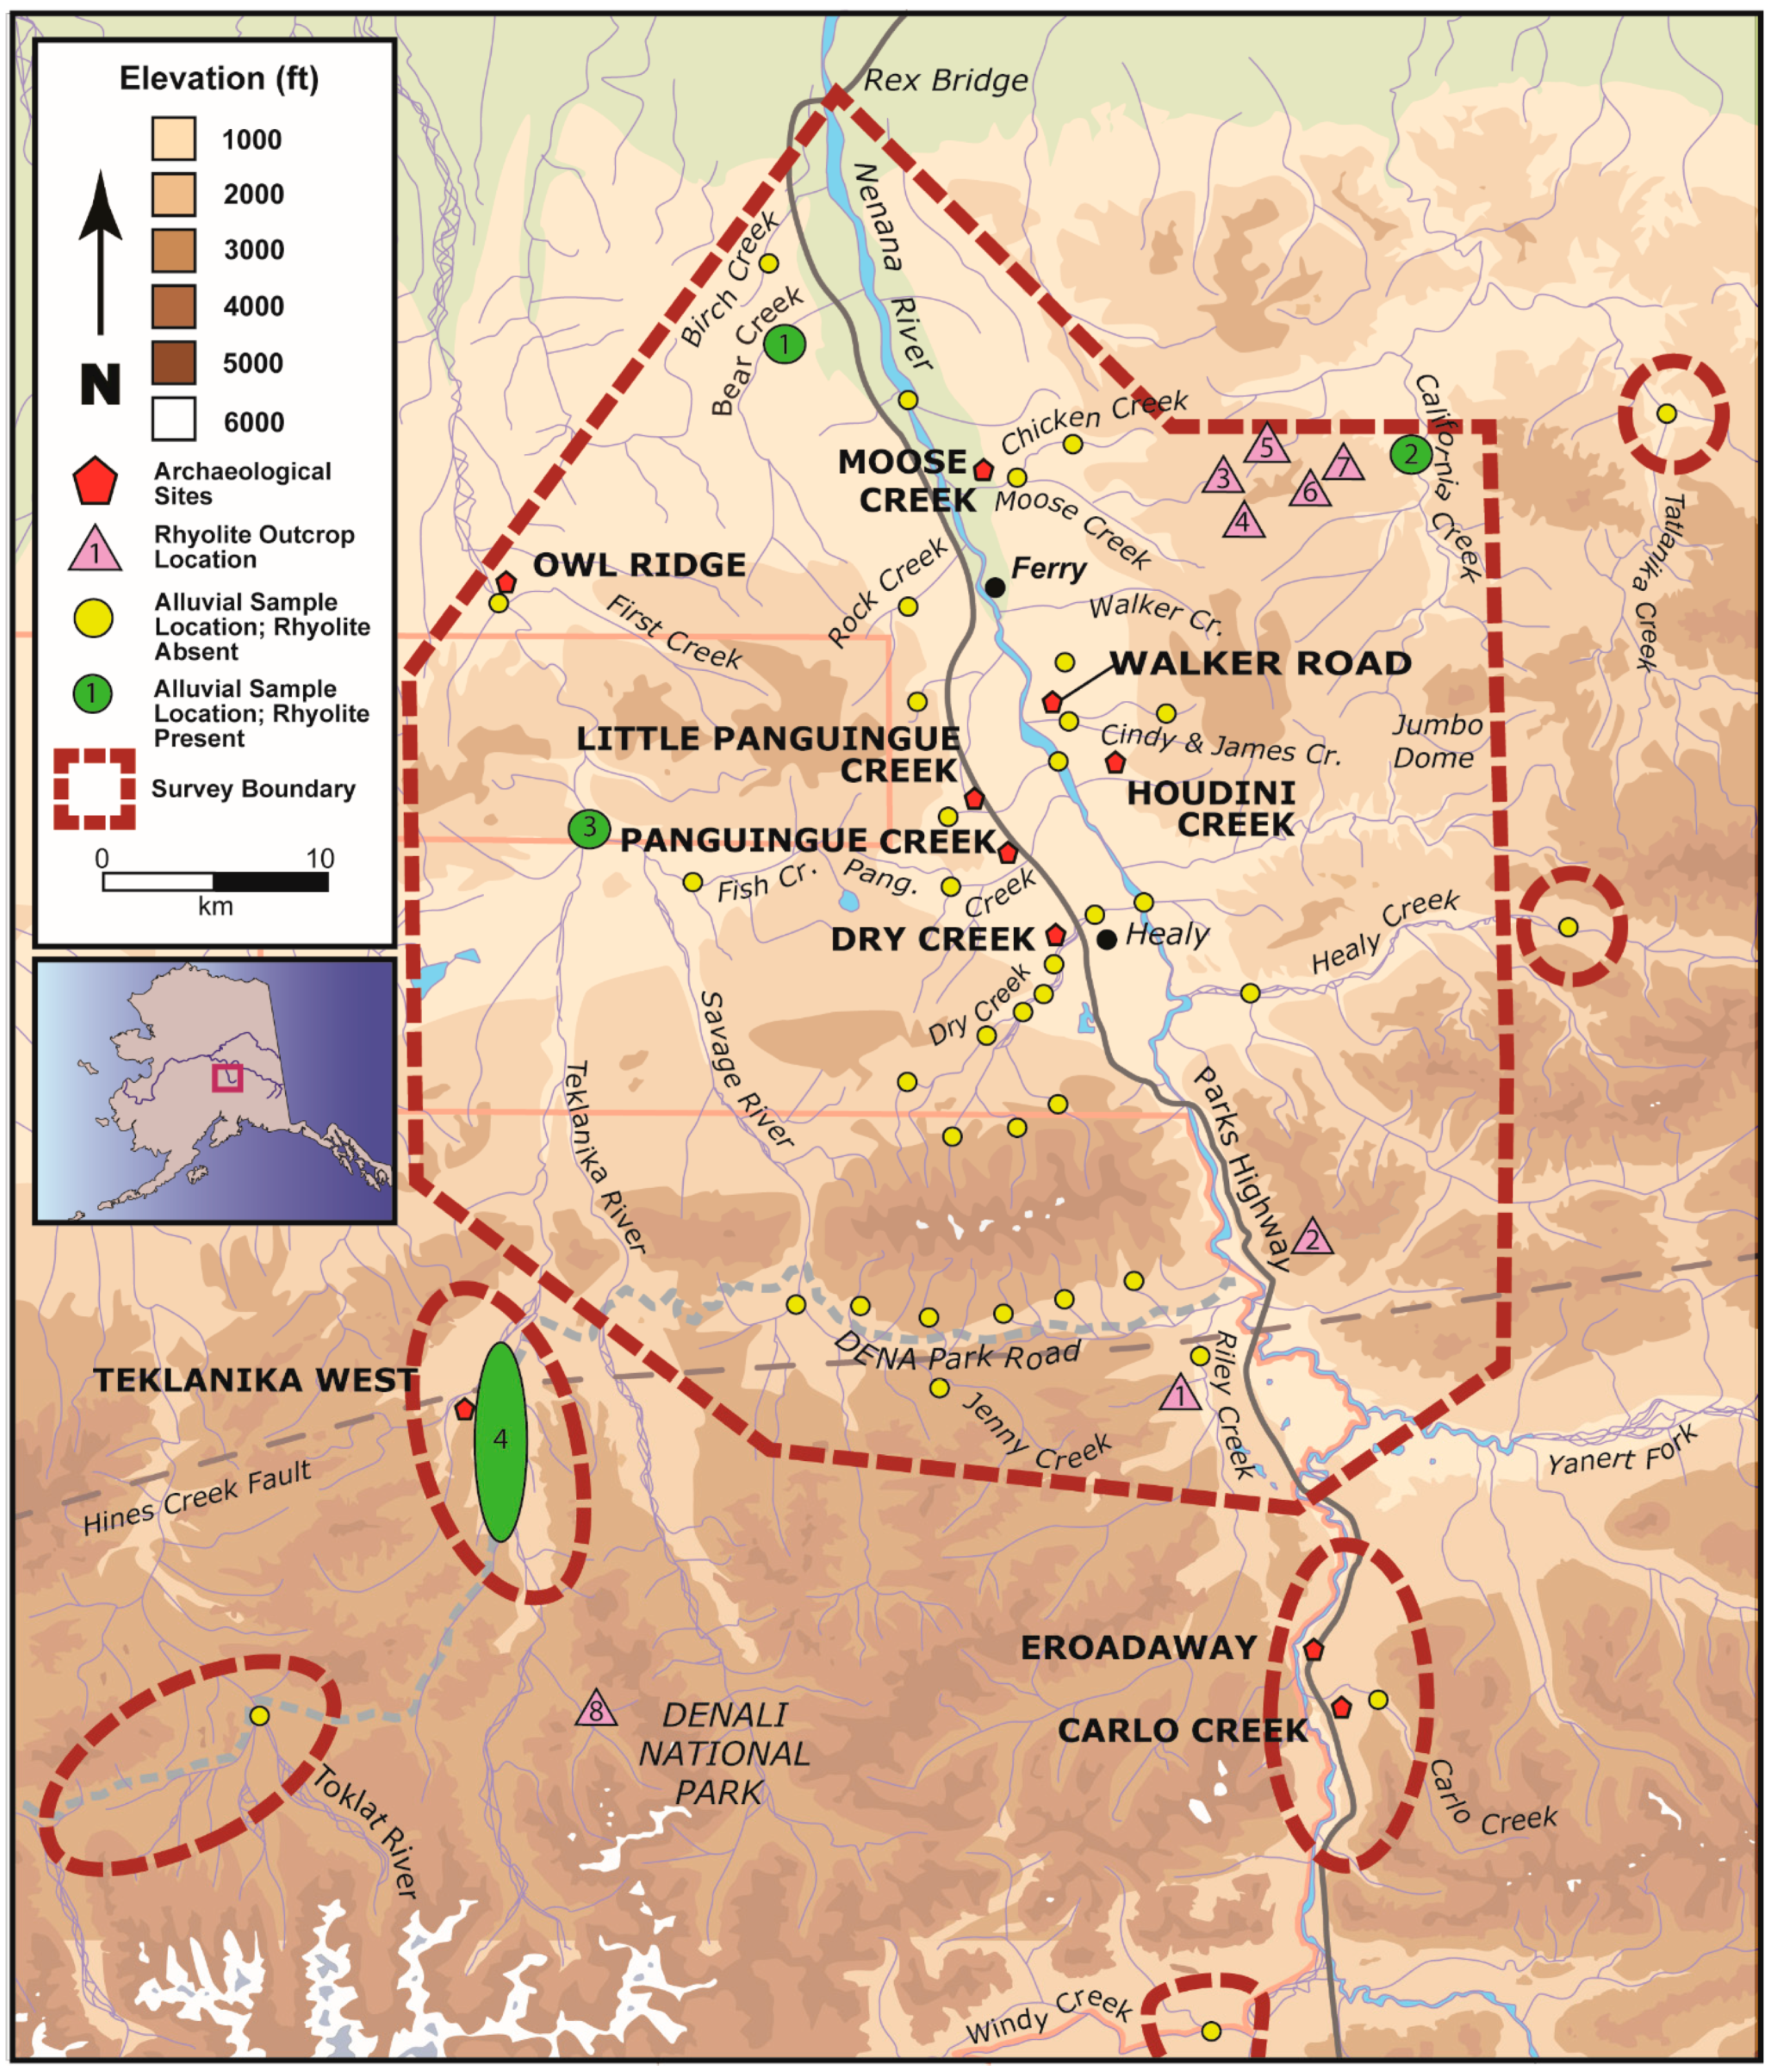
3.1. The Nenana River Valley and Its Geology

The Nenana River is a northward-flowing tributary of the Tanana River, bisecting the Alaska Range before flowing through foothills and flats into the Tanana. Here, the extent of the Nenana valley encompasses the Nenana River watershed, bounded by Broad Pass and the Reindeer Hills to the south, the Teklanika River basin to the west, the Wood River basin to the east, and the confluence of the Nenana and Tanana rivers near the city of Nenana to the north. Apart from a handful of sites located within the Alaska Range, known archaeological sites in the Nenana valley are concentrated within the northern foothill zone extending approximately 30 km beyond the front of the Alaska Range and situated within a series of loess sequences and aeolian deposits atop glacial outwash terraces [103,104,105,106].
The hard-rock geology of the valley, located in the central Alaska Range as well as surrounding foothills, is complex and diverse [106,107,108,109,110,111] and has been studied since the mid-20th century because of mining activities and railroad construction. As such, areas beyond the railroad corridor and outside of the mines are largely generalized and limited to non-specific formation descriptions [107,108,109,110,111,112,113,114,115].
Rocks in the valley downstream from the mountain and foothill slopes are found as cobbles and boulders in Pleistocene-aged glaciofluvial outwash terraces and Holocene-aged alluvium and floodplain deposits of the Nenana River and its tributaries. Bedrock formations include the early Pleistocene-aged Nenana Gravel primarily composed of sandstones, conglomerates, granites, schist, and other intrusive rocks abundant in the Alaska Range [106,111,116]. To the north, the main formation is the Middle Devonian-aged Totatlanika Schist consisting of metavolcanics, schists, and gneisses [107,117]. Running east to west, the Paleozoic-aged Keevy Peak formation is composed of meta-sedimentary and meta-igneous rocks including quartzites, quartzes, schists, slates, and interbedded marble [111,117,118,119]. Running east to west in the southern portion of the valley, the Cantwell formation is a Paleocene to Late Cretaceous sequence of mudstones, sandstones, conglomerates, coals, andesites, basalts, and rhyolites [107,117,120,121]. To the south, west, and north, portions of the Paleozoic Birch Creek Schist formation are mapped [108,109,110,115,117]; this formation extends to the Yukon-Tanana uplands north of the Tanana River and comprises of schists, quartz-sericite schists, and quartzites [108,109,110,113,117].
Surface geography of the valley is diverse in igneous formations and intrusions [107,108,109,110,111,113,117,122,123,124] Igneous rock types, from hornblende andesites, basaltic lapilli, cinders, and bombs to diabase and rhyolite outcrops, have been recorded in the valley over the past several decades [115,119,125]; however, most are only generally described and not mapped in geological detail [113,117,125,126]. Despite this, several specific rhyolite outcrops are known within the Alaska Range including in the headwaters of Eva Creek, on Sugarloaf Mountain, and inside Denali National Park and Preserve (DENA) [107,108,109,110,111,113,120,123,127].

3.2. Archaeological Sites in the Nenana Valley

The Nenana valley has an abundance of well-stratified sites with preserved lithic assemblages whose occupations date from the late glacial through the Holocene, providing an appropriate area to investigate questions regarding shifts in lithic resource procurement and land-use strategies in response to landscape learning and climate change. Most archaeological sites in the valley are situated on top of the Pleistocene-aged Healy glacial-outwash terrace overlooking waterways, and many contain multiple cultural occupations with dates ranging from the late Pleistocene to the late Holocene [25,103,128,129]. Lithic artifact assemblages from the Nenana River valley were analyzed comparing materials encountered during raw material survey to identify toolstone sources utilized in prehistory. Nineteen lithic assemblages come from ten archaeological sites: Owl Ridge, Dry Creek, Walker Road, Moose Creek, Panguingue Creek, Eroadaway, Carlo Creek, Little Panguingue Creek, Teklanika West, and Houdini Creek (Figure 1). The ages of each archaeological component (e.g., Dry Creek C1) are presented in Table 1. Most of these site components are well-dated, though some (e.g., Moose Creek C4 and Carlo Creek C2) have no radiometric dates. These were assigned age estimates based on stratigraphic position to dated stratigraphy and cultural occupations, volcanic tephras, and regional valley stratigraphy [41,54]. Seven assemblages (Owl Ridge C1, C2, C3; Dry Creek C1, C2, C4 materials from 2011 excavations; Little Panguingue Creek) were analyzed at the Center for the Study of the First Americans, Texas A&M University and fourteen assemblages (Dry Creek C1, C2, C4 materials from 1970’s–80’s excavations; Panguingue Creek C1, C2, C3; Houdini Creek; Teklanika West C3; Walker Road; Moose Creek C1, C2, C3, C4; Carlo Creek C2; and Eroadaway) were analyzed at the University of Alaska Museum of the North.

4. Methodology

4.1. Rock Survey and Collection of Geological and Archaeological Samples

4.1.1. Field Survey

This study draws upon data from an extensive, multi-year raw material survey conducted from 2014–2017 to derive the presence and extent of both outcrop and alluvial locations of knappable lithic materials and their proximity to known archaeological sites in the valley (Figure 1). The survey area extends from Rex Bridge in the north to Windy Creek in the south and from the Teklanika River in the west to California Creek in the east, including several focused areas of survey. Rhyolite outcrops within the valley and the rhyolite makeup of all accessible alluvial waterways (creeks, drainages, and rivers) within the survey boundaries were recorded identifying potential sources for rhyolite artifacts found within archaeological assemblages in the valley. Outcrop collection locations include lithic deposits occurring as in situ outcrops from bedrock, previous lava flows, or intrusive sills, while alluvial collection deposits include reworked, erosional, and/or redeposited lithic materials such as glacial till and streambed gravels [139]. At each alluvial collection location, a one square-meter unit was laid out, and each rock found within the square and measuring > 1 cm in maximum linear dimension was counted, recording total makeup of alluvium represented at that location. All rhyolite materials within the square were collected for geochemical analysis. Each alluvial location was further subjected to pedestrian survey of an area of no less than 500 m both downstream and upstream of the collection square. Supplementary toolstones were recorded to provide an additional means of characterizing available toolstones in each waterway.
Selection of sampling locations was directly informed by extant geologic maps of the valley and locations of known archaeological sites. All in situ outcrops sampled were located using geologic maps, and at least 20 samples were collected from each outcrop for geochemical pXRF analysis following [101,139]. In alluvial locations, 20 samples of rhyolite were collected if present, though the rarity of these rocks in some locations limited the number of collected specimens to <20.

4.1.2. Artifact Sample Selection

The rhyolite artifact sample selected for geochemical comparison with geological samples numbered 675 specimens. Prior to selection, all artifact assemblages were subjected to basic lithic technological analysis in which artifact class and type, raw material class and type, cortex amount, and artifact size class were scored. This analysis facilitated the selection of an artifact sample from each assemblage expected to capture the full range of rhyolite procurement strategies and lithic reduction sequences present [140]. A minimum of 20 samples for each assemblage was attempted, though sample numbers vary per site due to low rhyolite density in the assemblage (e.g., Moose Creek C2 and C3 [41]) or absence of secure provenance information of an assemblage (e.g., Panguingue Creek C1 and C3 [134]).

4.2. Geochemical Analysis

4.2.1. Collecting the Geochemical Data

Geochemical analyses were conducted at the Center for the Study of the First Americans, Texas A&M University using a portable Bruker Tracer III-V energy dispersive X-ray fluorescence spectrometer equipped with a rhodium (Rh) tube and a silicon PIN diode detector operating at 40 kV and 40 μA from an external power source. All selected samples exceeded 3 mm in thickness and were placed with the flattest, cleanest surface directly in front of the instrument window to allow full exposure to X-rays during sampling [141]. Each sample was run for 180 live count seconds, the minimum amount necessary for accurate elemental counts for FGV materials [142]. Bruker’s 6-mil Cu (copper), 1-mil Ti (titanium) and 12-mil Al (aluminum) filter was placed in the beam path to concentrate on mid-range elements well-suited for the characterization of obsidian, rhyolites, and other fine-grained volcanics [90,95,143,144,145]. Nine elements were measured, including Manganese (Mn), Iron (Fe), Gallium (Ga), Thorium (Th), Rubidium (Rb), Strontium (Sr), Yttrium (Y), Zirconium (Zr), and Niobium (Nb). X-ray counts were processed using the S1PXRF program provided by Bruker, and peak intensities of these elements were calculated as ratios to the Compton peak of Rhodium (Rh) and converted to parts per million (ppm) counts using Bruker’s S1CalProcess. This program converts measurements to elemental concentrations derived from known values of forty obsidian and other FGV standards, cross-checked by neutron-activation analysis (NAA) and inductively-coupled mass-spectrometry (ICP-MS) conducted at the University of Missouri Nuclear Reactor (MURR) [143,146].

4.2.2. Analyzing the Geochemical Data

Geochemically based rhyolite groups of both geological samples and archaeological samples were identified using exploratory approaches (e.g., multivariate principal components analysis, scatter plot matrices, and elemental biplots) following Glascock et al. [139]. These approaches were performed using MURRAP statistical routines and Gauss software, an open-source program available from the University of Missouri Archaeometry Laboratory (https://archaeometry.missouri.edu/gauss.html, accessed on 1 March 2021). Before analysis of the data was performed, elemental measurements with zero values were replaced with a constant value 65% of the detection limit of the given element, then all elemental measurement values were log transformed (base 10) to control for variability in magnitude between measurements of elements [139,147,148]. Statistical operations relied on the use of mid-Z elements commonly employed in obsidian and FGV sourcing studies (Sr, Rb, Y, Zr, and Nb) to define initial clusters because they are appropriate for sourcing volcanic materials and accurately measured by pXRF instruments [139,149].
Examination of the geochemical data was conducted in four parts. First, outcrops were examined to determine the degree to which they could be differentiated from each other. Second, outcrops were compared to alluvial rhyolite samples to determine geochemical relatedness (i.e., whether rhyolite visible in the alluvium today originated from these outcrops). Third, artifact samples were analyzed to assess if rhyolite groups (i.e., geochemically related rhyolite artifacts likely originating from the same source) exist, following Coffman and Rasic [95]. Fourth, rhyolite artifact groups were compared to the outcrop and alluvial geological samples to determine if there are any matches, thereby identifying likely sources. In this study, a “source” represents a geochemically characterized rhyolite from a known geographic location (e.g., outcrop or alluvium) that shares geochemical similarity with artifacts [101,150].
Formation of rhyolite groups and subsequent comparisons of these groups with geological samples were conducted in two stages. First, groups were explored by performing a principal components analysis (PCA) on the variance-covariance matrix of the data helping to define initial clusters, then values for the first five principal components were plotted in bivariate and trivariate plots to identify discrete clusters of artifacts. These were initially placed together in groups. Confidence ellipses for each preliminary group were calculated at 90%, representing probability intervals surrounding each group, drawn at a constant Mahalanobis distance (MD) from each group centroid. Unassigned artifacts were then plotted against these preliminary groups, and those that fell within a 90% confidence ellipse around a given group were included in that group. With each artifact addition or removal, a new group centroid was calculated, producing a new confidence ellipse for comparison with the data. This process was repeated until no additional samples could be added or removed from artifact groups. Second, provisional artifact groups based on the PCA results were then re-examined under the same analytical protocol using bivariate plots of logged raw compositional data (ppm) to verify specimen inclusion within artifact groups. Artifacts were added to or removed from identified groups if necessary. If group membership for a sample was ambiguous even after examining bivariate plots of principal components and logged elemental concentrations, the group membership probabilities for that specimen were calculated. This calculation is based on the MD distance of each sample to the constructed reference groups, with samples jackknifed from each reference group before distance and probability calculations were made. The artifact in question was removed or added to the group based on this calculation. The observation and construction of geochemical groups matching those previously identified by Coffman and Rasic [95] was aided by the inclusion of 16 artifacts also analyzed in their study.

4.3. Rhyolite Transport, Provisioning Strategies, and Landscape Learning

The goal of this study is twofold: first, to geochemically identify the rhyolite lithic landscape using the methodology detailed above; and second, to use this data to investigate human use of the rhyolite landscape through time. Established theoretical framework focusing on toolstone transport, technological provisioning strategies, and landscape learning, can be applied to the Nenana valley archaeological record and lithic landscape to inform on human behaviors and technological adaptation through time (Table 2). To consider diachronic changes in rhyolite use, site assemblages are grouped into time periods corresponding to global paleoclimatic events so that comparisons can be made. Sites dating between 13.5 ka and 12.8 ka are grouped together as “Allerød” sites, those dating between 12.5 ka and 11.7 ka are termed “YD” sites, sites dating between 11.7 ka and 9 ka are “early Holocene” sites, and those dating between 8–3.5 ka are “middle Holocene” sites [17]. Finally, comparative statistics on variables outlined in this sub-section were performed in IBM SPSS and the open-source program R v. 3.5.0 [151] using the pgirmess package version 1.7 [152].

4.3.1. Rhyolite Transport

Toolstone transport is defined in terms of distance and direction an artifact was carried between its source discard locations. Distance and direction can only be precisely measured when both locations are known. When a rhyolite source was identified and matched with rhyolite artifacts in this study, then transport distance was measured, and direction noted. Here, a local raw material source is defined as one positioned within 20 linear km of a site. Therefore, nonlocal sources are those exceeding 20 linear km from a site. Ethnographic studies suggest this distance is an appropriate estimate of the average maximum distance a forager will travel in one day [78].
Often, precise locations are unknown and relative measures of distance and direction are used. In cases when rhyolite groups are identified, but their locations are unknown, it is assumed the cost of procuring and transporting that toolstone increases as distance traveled between site and toolstone source increases. Therefore, nonlocal rhyolite toolstone is expected to occur in lower frequencies in archaeological assemblages based on assumed costs of long-distance transport. Inversely, local rhyolite toolstones are expected to occur in higher frequencies within assemblages because the cost of transport is low.
Identifying cortex amount within geochemical groups of rhyolite artifacts is used to establish relative “localness” of rhyolite artifact groups with geographically unknown sources [16,67]. This study assumes that cortex frequencies will decrease as distance to source increases. Therefore, if rhyolite groups contain many cortical pieces, then they are relatively local and represent intraregional sources, whereas rhyolite groups with few or no instances of cortex represent nonlocal, extra-regional sources [16,67]. This model suggests the main source(s) of rhyolite in the valley would have been alluvial given the ubiquity of alluvial cobbles present in Pleistocene glaciofluvial deposits.
Therefore, total frequency of rhyolite groups in the valley, relative frequency of rhyolite groups within each site, total frequency of cortex presence within rhyolite groups across the valley and within individual site assemblages can describe transport patterns.

4.3.2. Provisioning Strategies

Interpretations of the lithic record are guided by the expectation that lithic technologies reflect a spectrum of behaviors indicative of provisioning strategies [68]. The two ends of that spectrum are provisioning place versus provisioning individuals. Foragers provisioning place locate their sites at or near resources, whereas “gearing up” or equipping individuals with toolkits that maximize efficiency and curation in the event lithic resources are unknown or in short supply is representative of provisioning individuals [64,71,153,154,155,156,157]. The largely lithic record of Alaska has the potential to inform on past foraging and land-use strategies through this lens.
In the context of this rhyolite study, a pattern of reliance on local rhyolites is expected to reflect a strategy based on provisioning place, whereas reliance on nonlocal rhyolites represents a strategy based on provisioning individuals (Table 2). Mobility strategies likely involve varying degrees of rhyolite transport. If the overall strategy of a foraging group is to provision place at a base camp, yet some members regularly participate in long-distance forays, those traveling long distances are expected to provision individuals for tasks performed at distant foray locations. Both local and nonlocal rhyolites are expected to be present in associated assemblages, but with local materials dominating. Conversely, if the foraging group is practicing a provisioning-individuals strategy, then mostly nonlocal rhyolites are expected in assemblages; however, some local material could be present if some of the sites in the foraging system are located at or near rhyolite sources. This study uses the variable of rhyolite transport to understand provisioning strategies.

4.3.3. Landscape Learners

When humans are new to a region, they will not know where to find all, or the best resources, including toolstones. They learn as they forage in this new location, however, this process takes time [16,67,85,158,159,160,161,162]. With regards to rhyolite procurement, landscape learners should be expected to bring more diverse raw materials with them because they do not know where to find local raw materials. As they learn the rhyolite landscape, they discover, test, and gradually include more local rhyolite sources into their toolkits and become less reliant on nonlocal rhyolites. Therefore, if an assemblage contains a high diversity of rhyolite groups, in other words, more groups to the total groups expressed in the valley, then this is expected to represent landscape novices. If an assemblage contains a low diversity of rhyolite groups, then it likely represents landscape experts. Rhyolite group diversity is used as a variable to determine landscape learning [158]. Linear relationships and the coefficient of determination (R2) are used to estimate diversity values for total artifacts sampled compared with total number of rhyolite groups. Data are log transformed (base 10) to control for varied sample sizes. Because R2 reflects the goodness of fit between the regression line and the data variables ranging from zero to one with a value of zero indicating the dependent and independent have no relationship, position above the best-fit line indicates higher-than-expected diversity and position below the best-fit line indicates less-than-expected diversity [163].
Rhyolite transport and provisioning strategies are used to further assess landscape learning. If rhyolite transport is mostly nonlocal, then this pattern reflects landscape learners who had yet to identify sources of high-quality local rhyolites. If, however, rhyolite transport is mostly local, then this pattern likely reflects more comprehensive knowledge of the local lithic landscape. To minimize risks of foraging in an unknown location and being unprepared, newcomers are expected to have used a provisioning-individuals strategy. As humans settle in and learn where to find local rhyolites, they may begin to shift strategies toward more place-oriented rhyolite provisioning. Therefore, learners in new landscapes are expected to have provisioned individuals with mostly nonlocal rhyolites while foragers with extensive landscape knowledge are expected to provision place with local rhyolites (Table 3).

5. Results

5.1. Raw Material Survey

Survey of 42 river and creek drainages for materials available in alluvium deposits found the primary rock types in these drainages to be low-quality, non-knappable rocks including schist, schistose, quartz, and quartzites (Supplementary Table S1). Geologists previously mapped rhyolite at several localities in the Nenana valley, including in the Cantwell Formation in the vicinity of Riley Creek and the road entrance into DENA and in the foothills east of the river near the village of Ferry at the headwaters of Eva Creek [17,118,127,164]. During survey, seven outcrops of rhyolite were identified and sampled from these mapped locations (Figure 1). Details of these rhyolites are presented below.

5.1.1. Sugarloaf Mountain Rhyolite

The Sugarloaf Mountain rhyolite is located ~16 km southeast of the town of Healy. There are multiple exposures of rhyolite on the mountain, though not all are easily accessible. Samples reported in this study were obtained from an exposure on the south side of the mountain accessed by following animal trails to the top. Rhyolite at this ~500-m long exposure is weathered and actively eroding. Nodules are available as fragmented, angular scree deposits mostly ranging in size from <5–30 cm in maximum linear dimension with few larger nodules. These materials are low quality, chalky in texture, and range from light grey to light tan in color.

5.1.2. Triple Lakes Rhyolite

The Triple Lakes rhyolite is located on a ridge upslope of Riley Creek in DENA along a popular hiking trail, ~5 km south of the park entrance. The exposure is ~50 m wide on top of the ridge and extends westward downslope to a creek tributary where it is largely obscured by boreal forest and scrub vegetation. Nodules are weathered, fragmented, and exhibit angular structure, ranging in size from <5–20 cm in maximum linear dimension. This rhyolite is chalky in texture and light tan in color.

5.1.3. Ferry Group Rhyolites

The remaining five rhyolite outcrops are in the foothills 14 km east of the village of Ferry, near the active Liberty Bell Mine, and produced from Oligocene-aged intrusive sills into schist bedrock [117]. The Ferry 1 rhyolite outcrop is 2 km southwest of the Liberty Bell mine. Recent bulldozer activity created a 30–40 m exposure. Ferry 2 rhyolite outcrop is located 1.5 km northwest of Ferry 1 rhyolite. This exposure is small, approximately 10–20 m wide. Three more exposures, Ferry 3, Ferry 4, and Ferry 5 are present on the high ridge 1–2 km north of Eva Creek at the Liberty Bell Mine. These three exposures trend north to south and are spaced ~300 m apart. Each exposed area of rock ranges from 300–400 m in length. Rhyolites from these outcrops tend to range in color from white to light tan, have platy structure, and are chalky in texture. Rock can be extracted in 10–30 cm nodules, but this material is very brittle and prone to platy breakage.

5.2. Geochemical Analyses of Rhyolite Outcrops and Alluvial Sample Locations

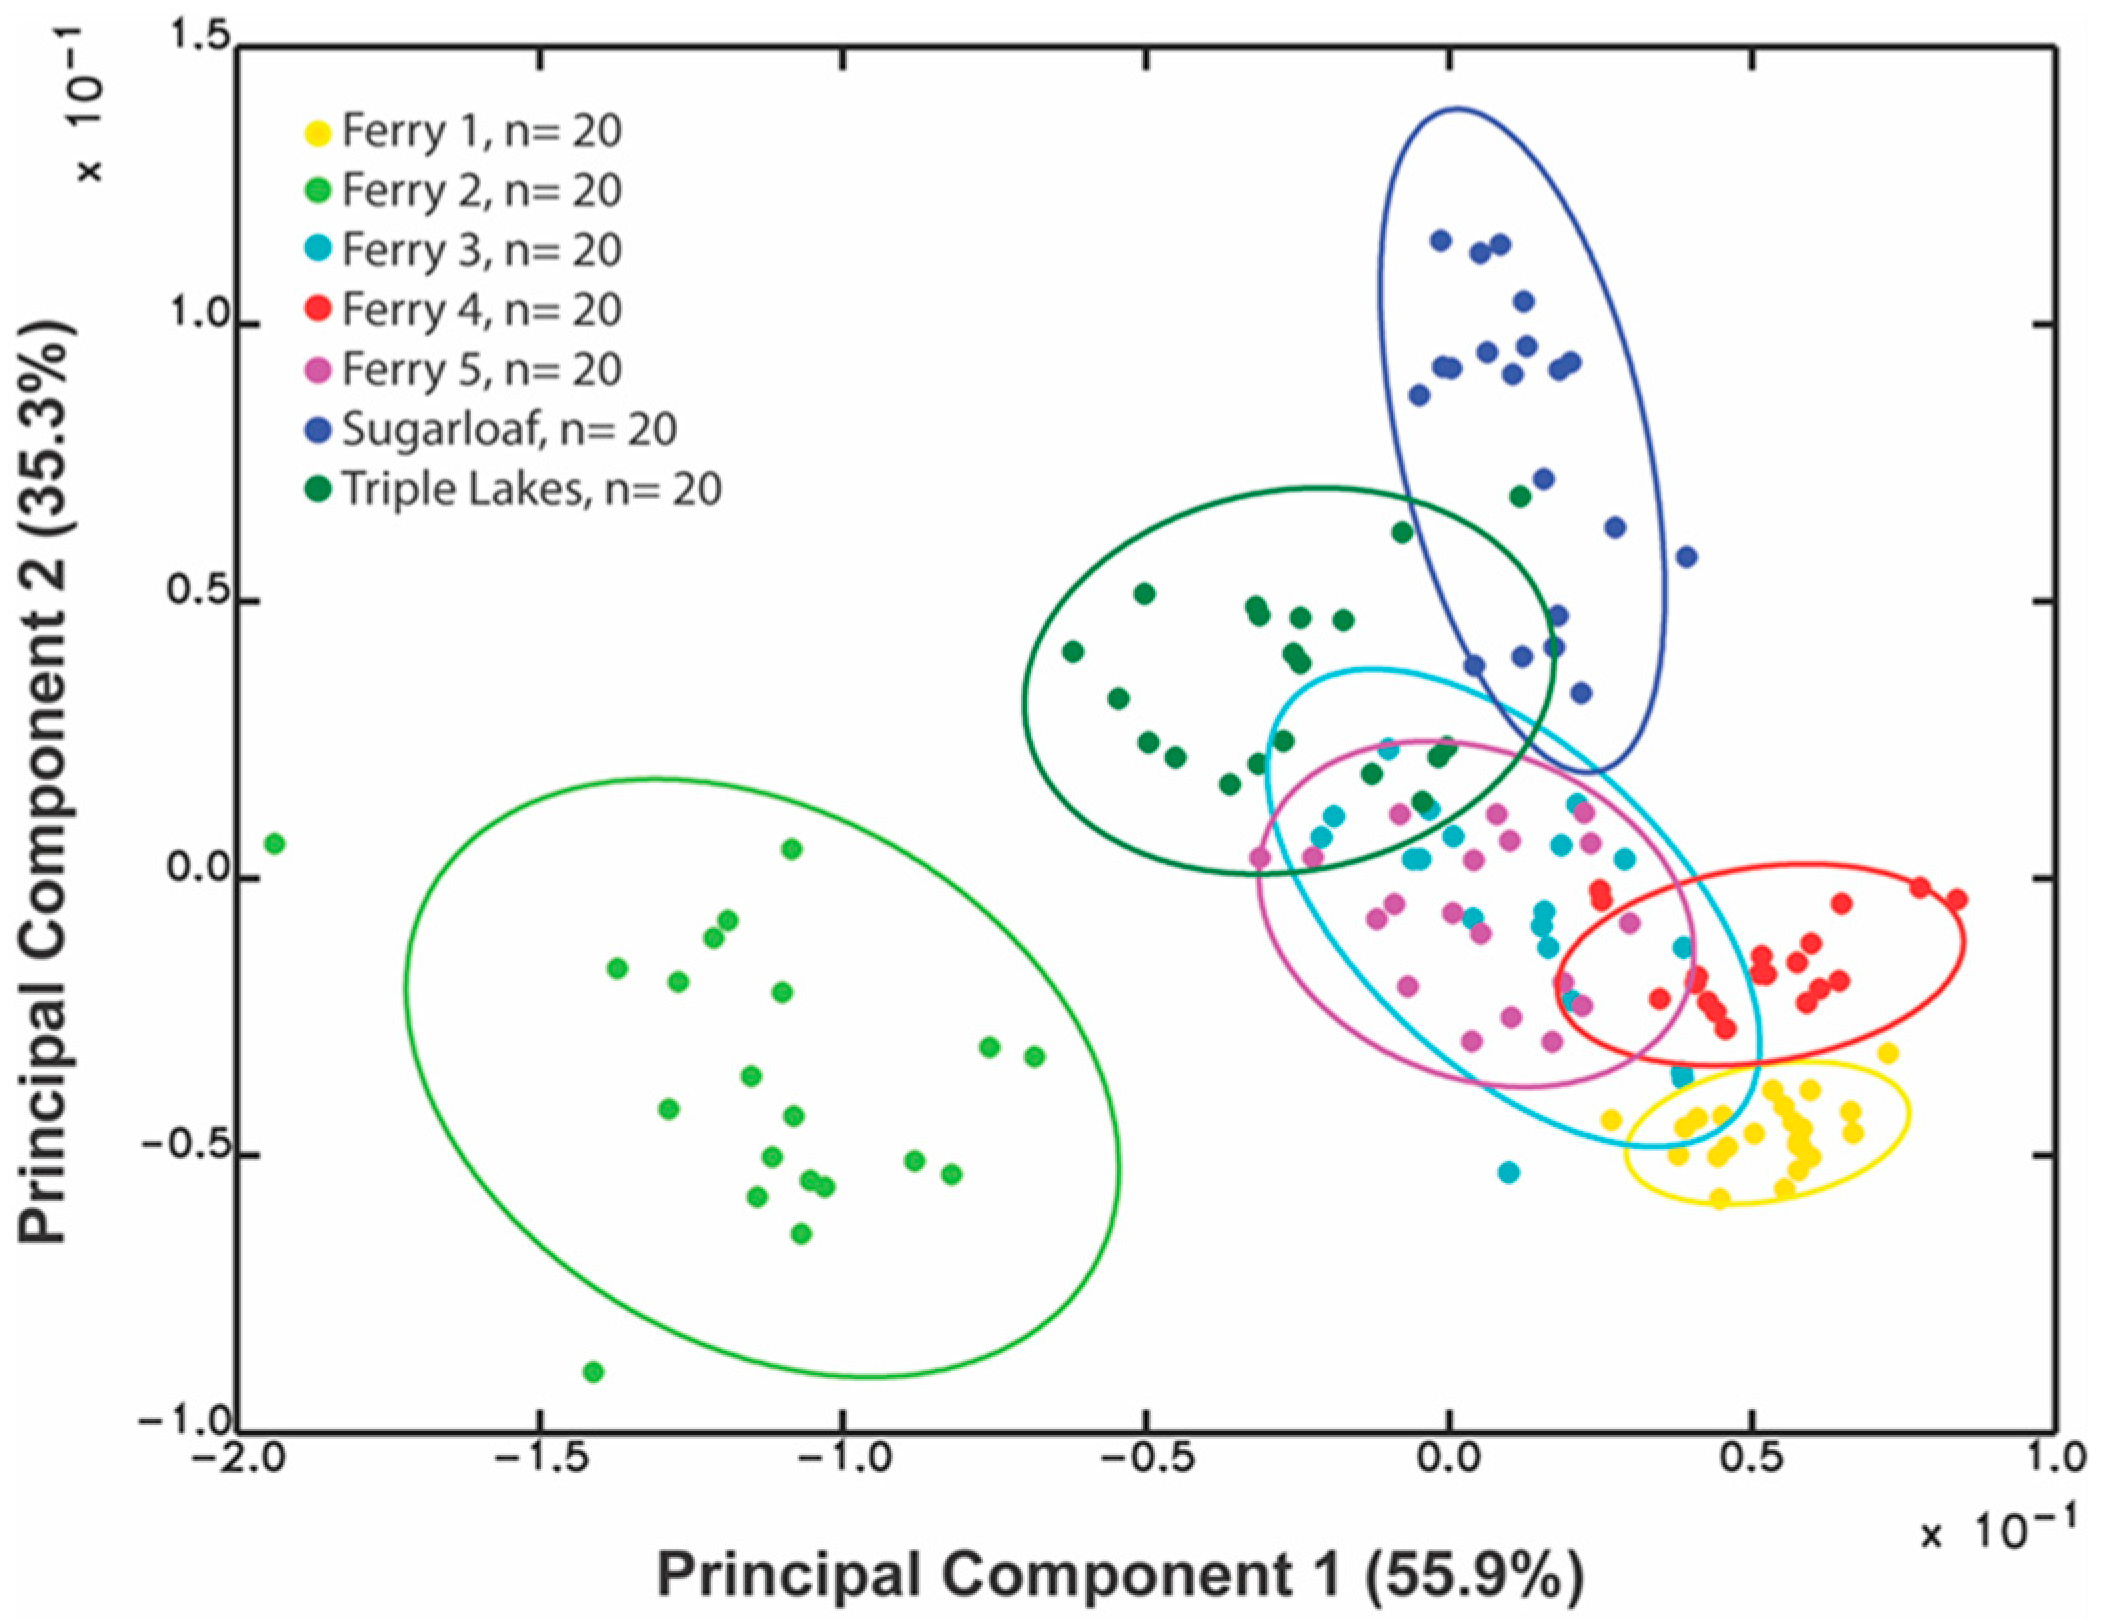
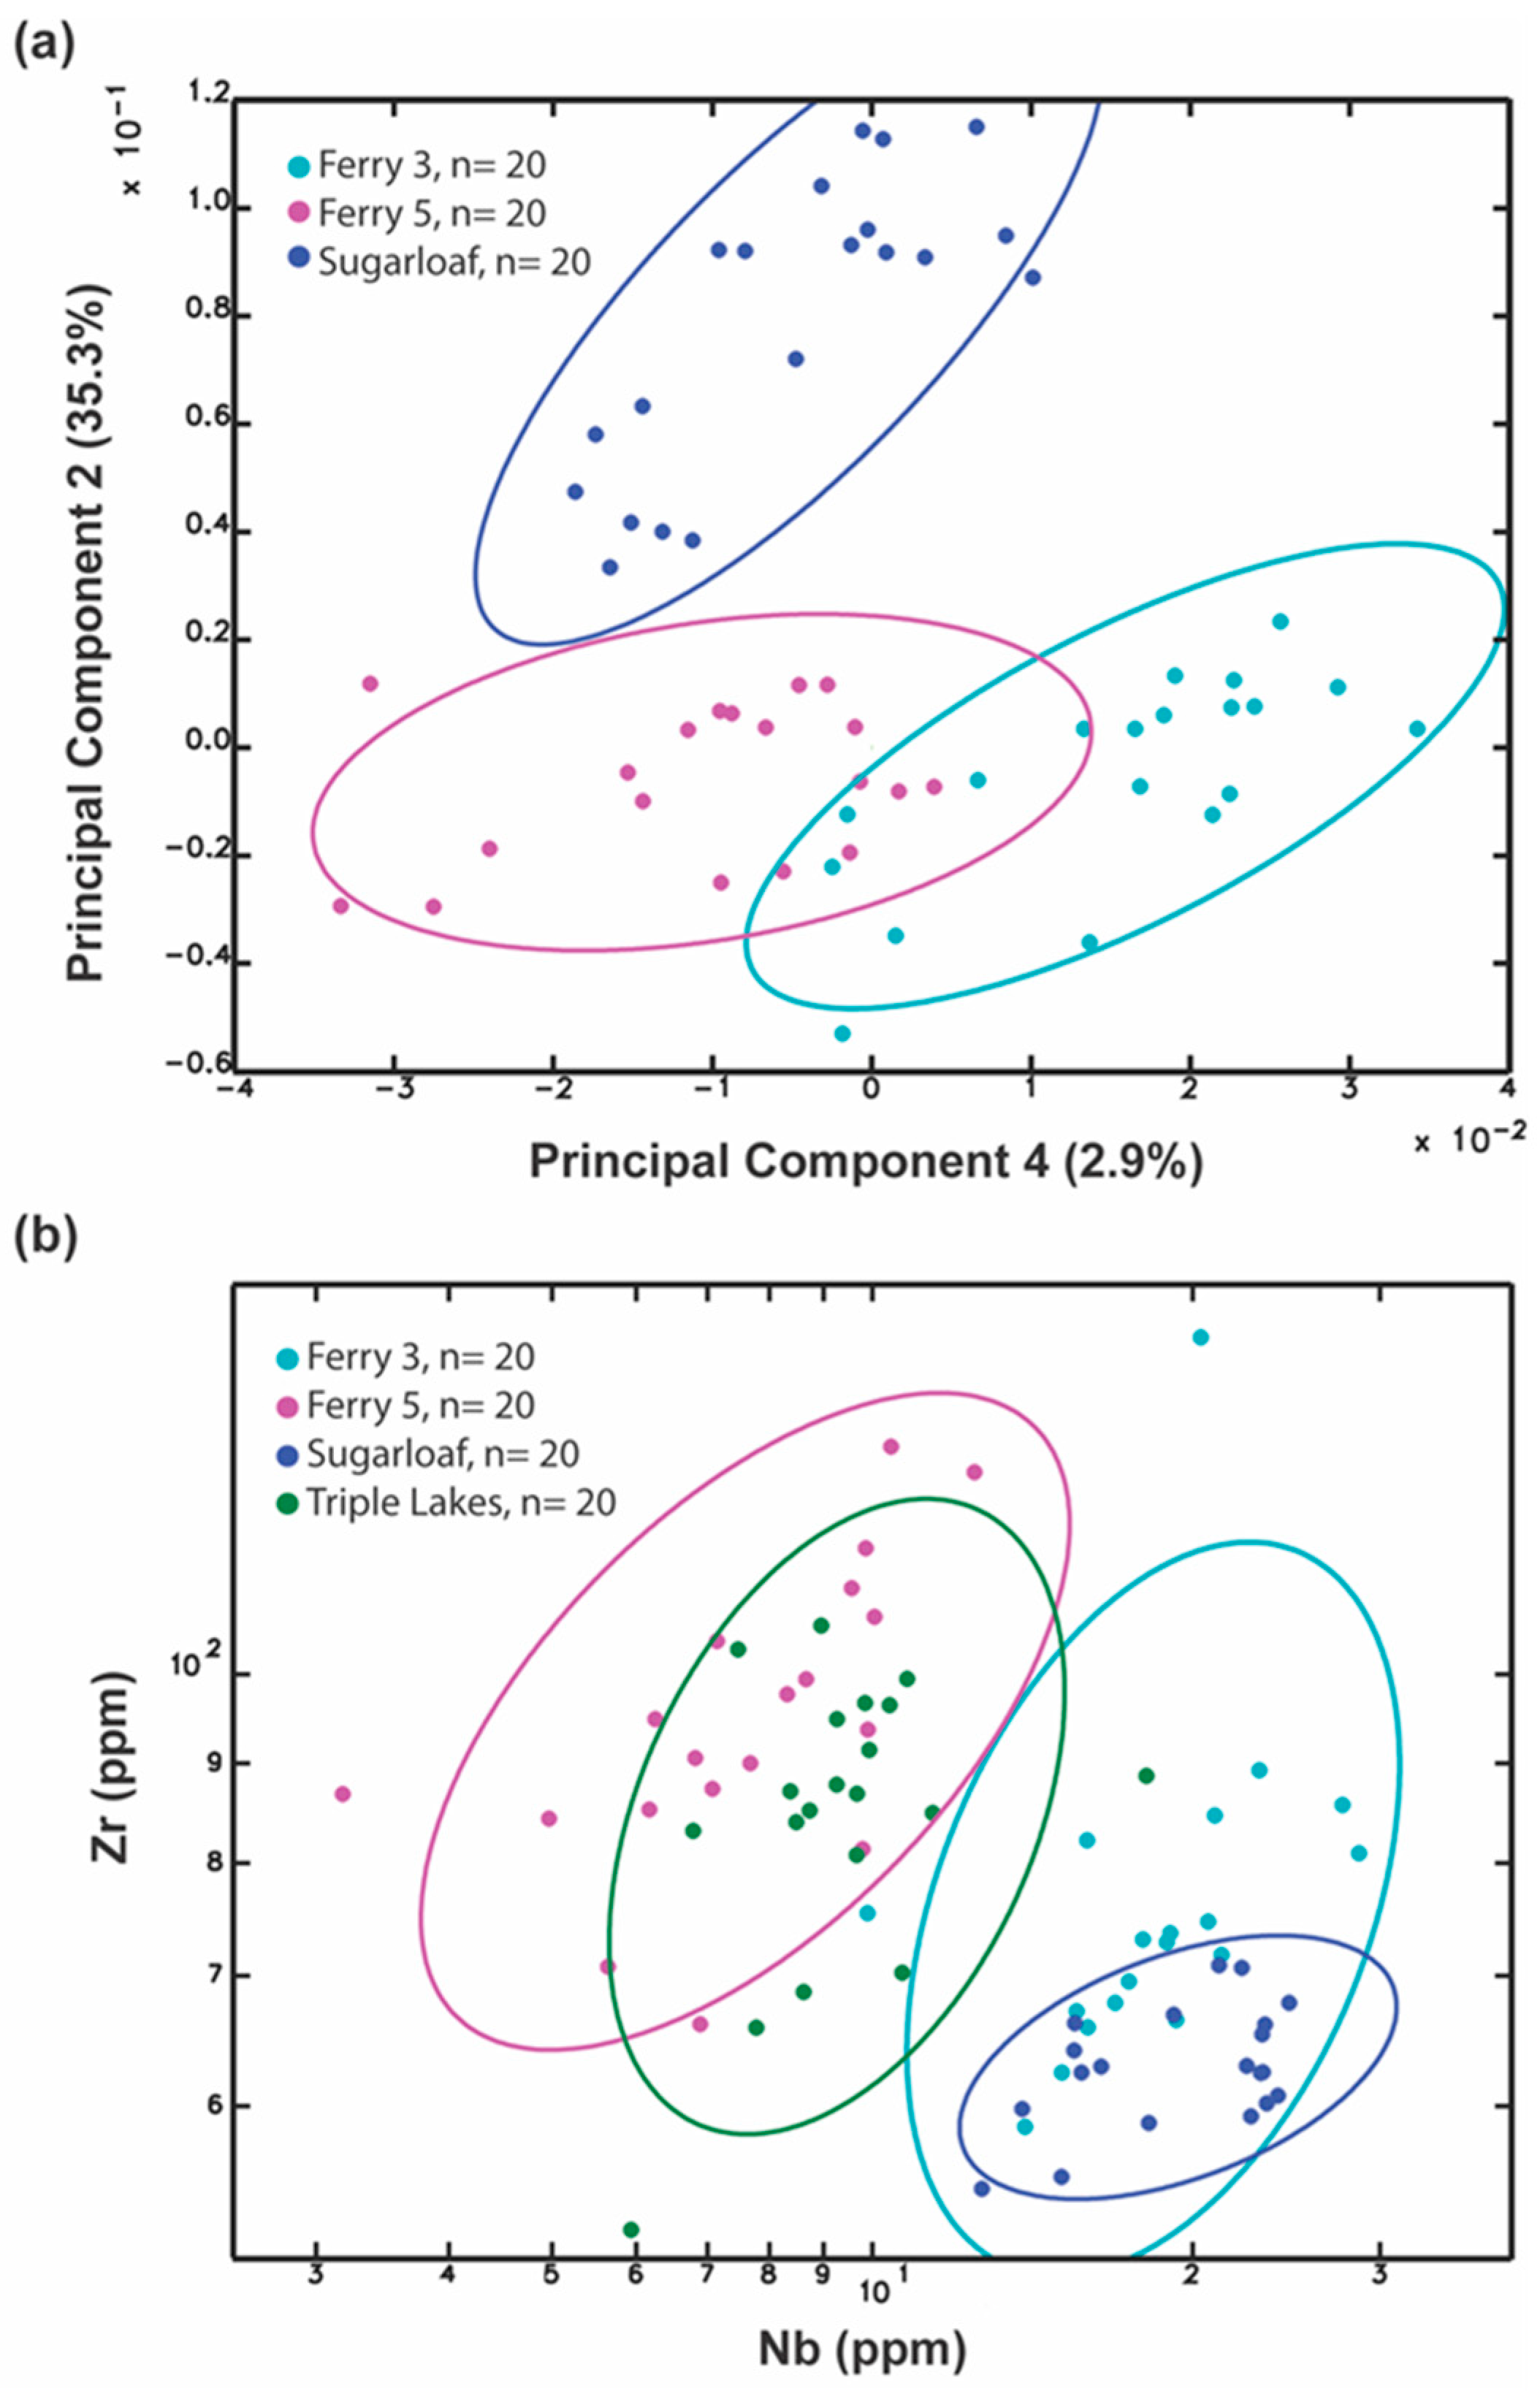
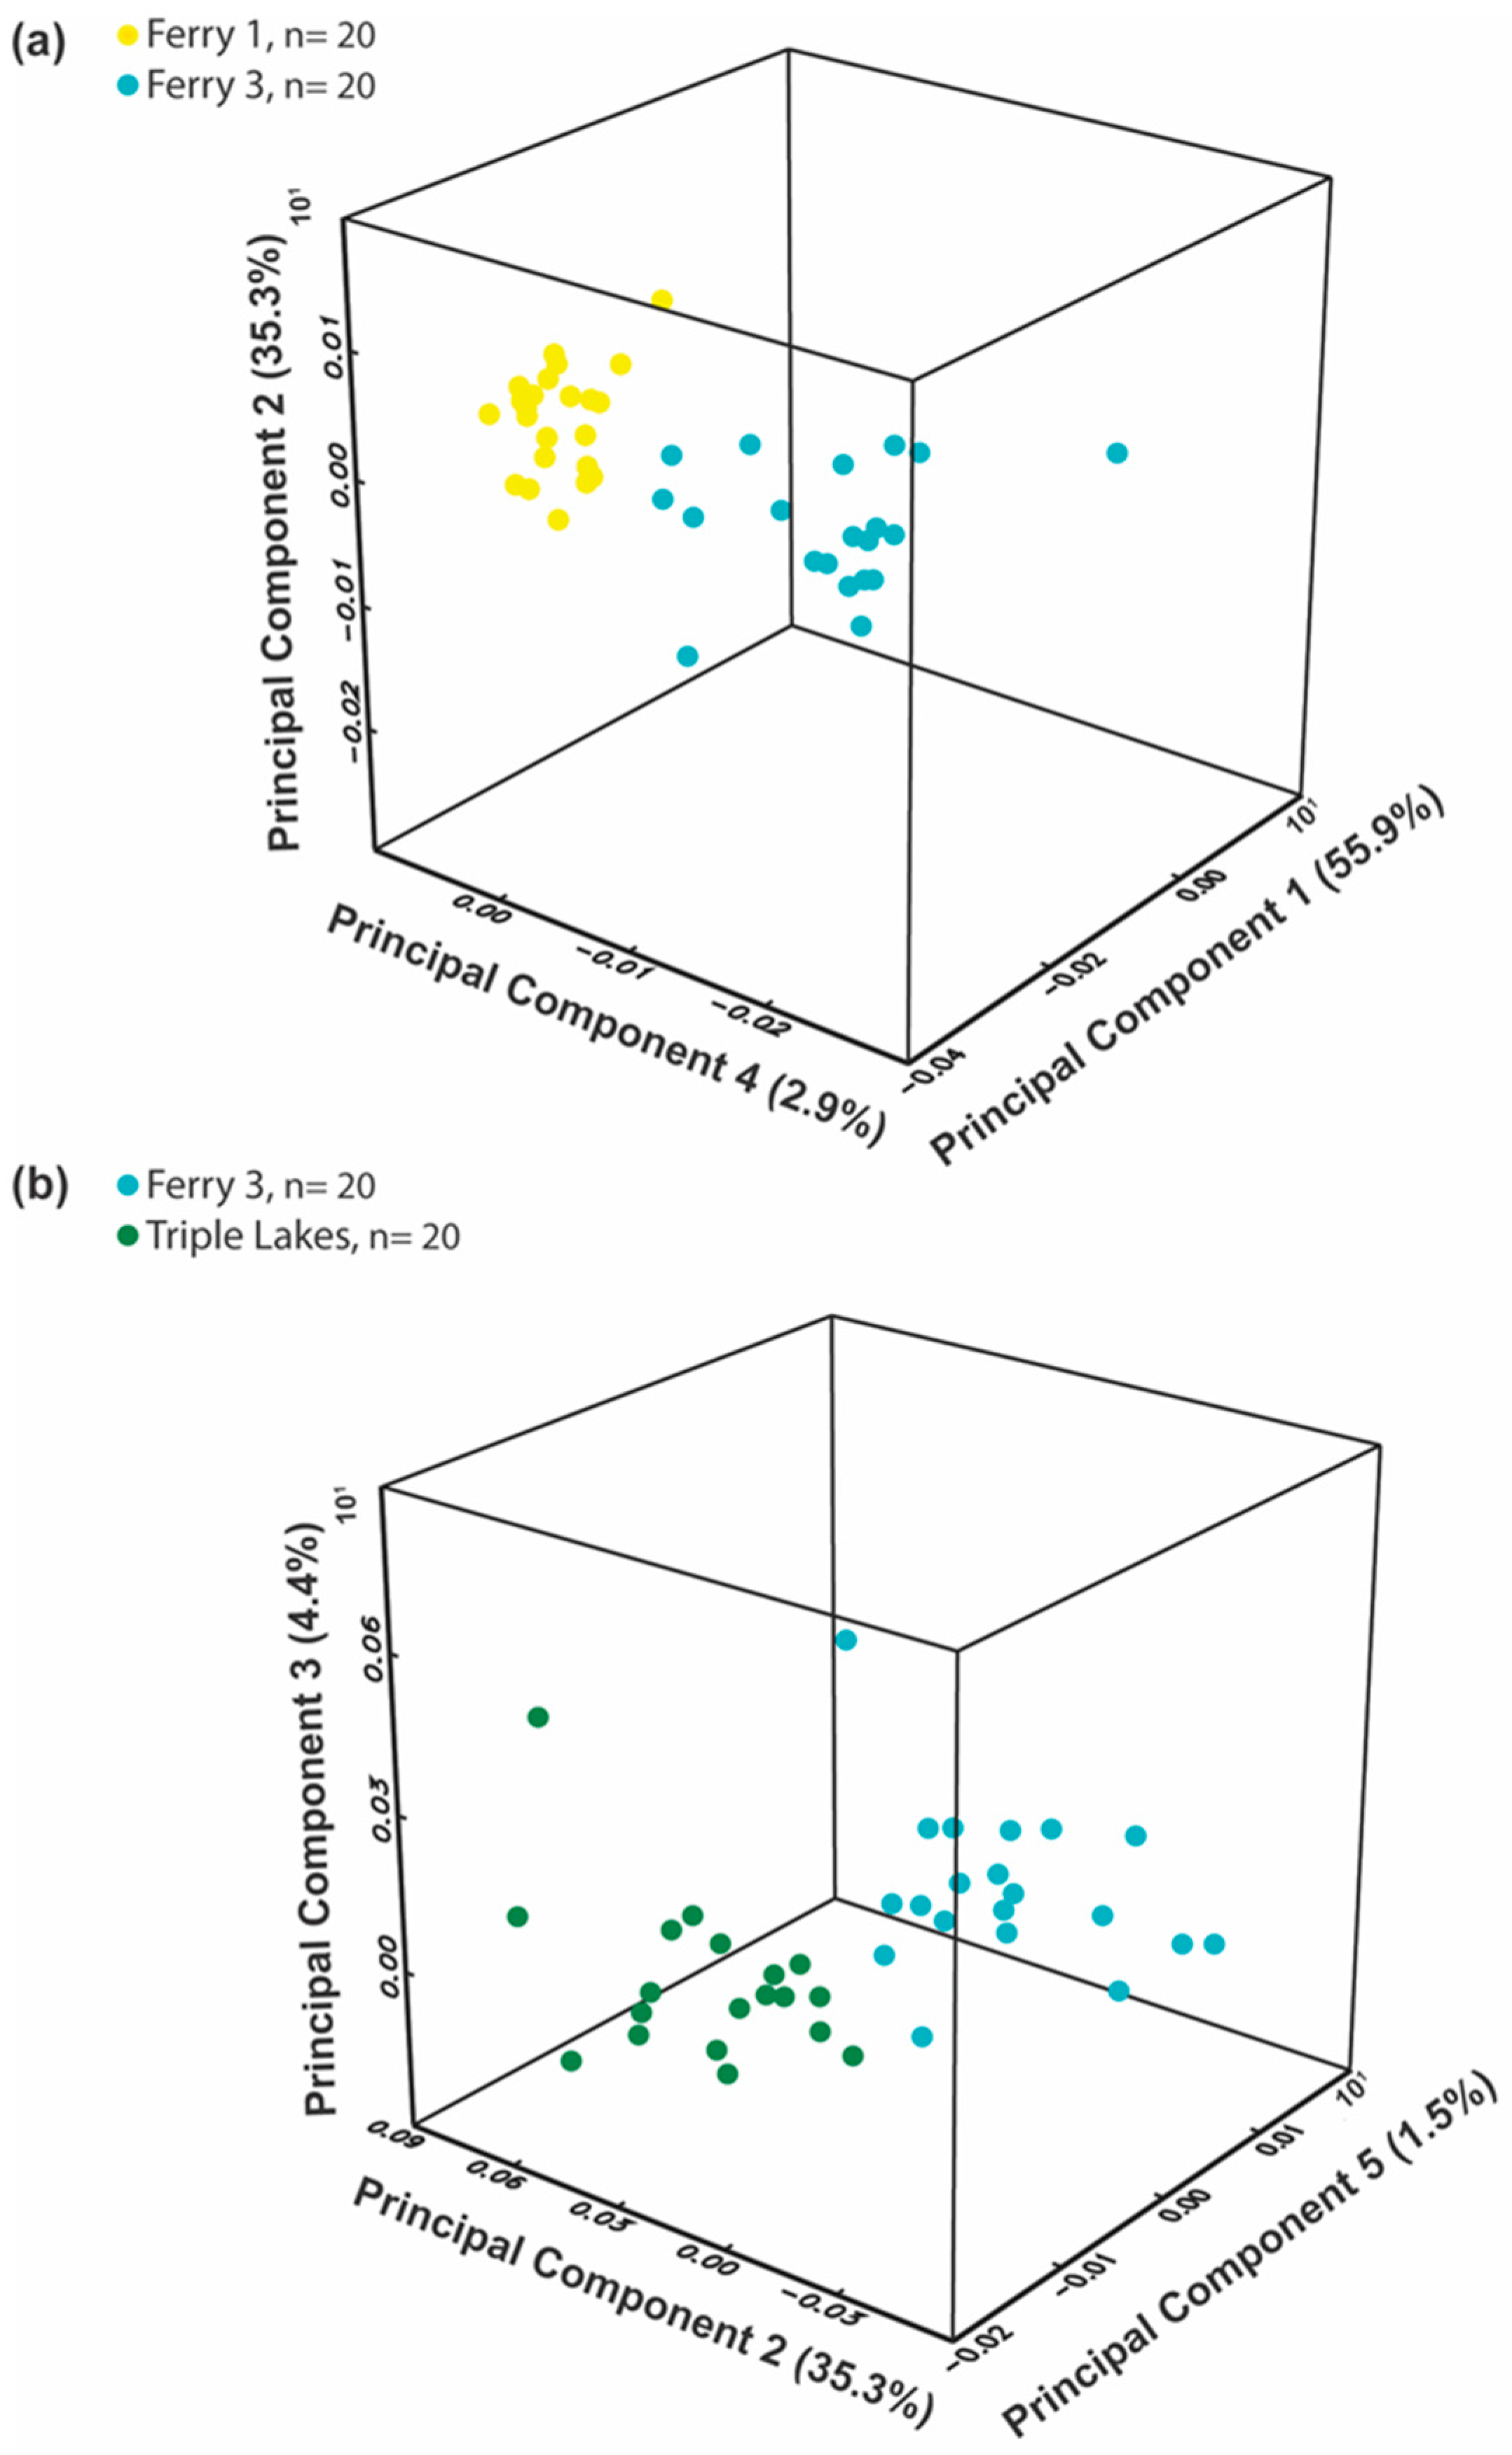
5.2.1. Rhyolite Outcrops

The seven outcrop-location rhyolites identified and collected in this study were evaluated to assess inter-outcrop variability. Basic statistical summaries of each outcrop’s geochemical data are listed in Table 4, and results of a principal components analysis are shown in Figure 2 and Table S2. Confidence ellipses of the first two principal components (Figure 2), with a cumulative variance of 91.2%, show slight overlap between Ferry 1, 3, 4, 5, and Sugarloaf; between Ferry 4 and 5; and between Triple Lakes, Ferry 3, 5, and Sugarloaf rhyolites. The Ferry 2 sample does not overlap with any of the other outcrops in this comparison. Plots of additional PCs and logged elemental concentration data, however, help to differentiate most overlapping groups. PCs 2 and 4 (38.2% cumulative variance) differentiate Ferry 3 and 5 from Sugarloaf (Figure 3a). The elements Zr and Nb differentiate Ferry 3 from Ferry 5, and Triple Lakes from Sugarloaf (Figure 3b). Three-dimensional plots of PCs 1, 2, and 4 (94.1% combined variance) differentiate Ferry 1 and 3 (Figure 4a); and PCs 2, 3, and 5 (41.4% cumulative variance) differentiate Ferry 3 from Triple Lakes (Figure 4b). Ferry 5 could not be confidently differentiated from Ferry 3 or Triple Lakes rhyolite in any of the analyses. These slight overlaps between sample locations may be due to shared parent material contributing to each rhyolite flow during its genesis. Otherwise, the overall geochemical results suggest that most of these regional rhyolite outcrops are geochemically distinct from one another.

5.2.2. Alluvial Samples

Although rhyolites are present in and around the Nenana valley, they were found at only four alluvial sample localities: Bear Creek, California Creek, Teklanika River, and the confluence of the Savage River with the Teklanika River. At all four findspots, the rhyolite comprises less than 10% of the bed load makeup (Table S1). Table 5 lists statistical summaries of elemental concentrations for each sample location.
The alluvial samples were compared to rhyolites collected from outcrop contexts. Figure 5a shows the first two PCs, summarizing 83.9% of total variance (Table S3). Most alluvium is discriminated from outcrop samples. Some alluvial samples appear to fall within the 90% confidence interval of Sugarloaf Mountain, Triple Lakes, and Ferry 3, 4, and 5 rhyolites, including 10 samples from the Teklanika River and three samples from the Savage and Teklanika confluence (Figure 5a); however, these alluvial pieces are separated from the outcrop locations by the third PC (Figure 5b). Comparisons of alluvial rhyolites to outcrops suggest they are not derived from the outcrops sampled in this study. These results are expected given none of the sampled outcrops is located near headwaters of major tributaries within the vicinity of the alluvium sampled. Alluvial samples reported here likely originated from rhyolite outcrops that either no longer exist because they were completely eroded away, or their locations remain undiscovered.

5.3. Geochemical Analyses of Rhyolite Artifacts

A total of 675 rhyolite artifacts were analyzed for their geochemical signature using pXRF analysis. Six hundred and sixty three artifacts were assigned to 14 distinct geochemical groups. Forty two artifacts could not be assigned to any geochemical group (Table 6). Table 7 and Table S4 present geochemical summary data for each group and associated principal components analysis. Ten groups reported here, A, B, C, D, E, F, G, H, I, and J, replicate those previously reported by Coffman and Rasic [95]; however, groups K, L, M, and N are newly identified. Biplots in Figure 6 visualize these 14 groups, with PCs 1 and 2 comprising 88.2% of the total variance (Figure 6a). Biplots of both PCs 1 and 3 and PCs 1 and 4 show groups A, I, L, and N are discrete (Figure 6b,c). When considering PCs 1 and 5, groups M and N are discrete and groups F and K are virtually separate from the others (Figure 6d). A description of each artifact group is presented below.

5.3.1. Previously-Reported Groups

Of the 10 groups identified by Coffman and Rasic [95], G and H were given approximate geographical locations by these authors. Group G is thought to come from the Talkeetna Mountains near the headwaters of the Talkeetna River, as reported by the United States Geological Service (USGS). Group H is thought to come from an area near Calico Creek in the upper Teklanika drainage (Figure 1). Nevertheless, artifacts assigned to groups G and H may have come from the Talkeetna Mountains area and upper Teklanika drainage; therefore, from here these are referred to as the Talkeetna Mountains source area and the Calico Creek source area to highlight their potential as known sources. Coffman and Rasic [95] did not report comparative geochemical data to establish if groups G and H artifacts match geochemical signatures from Talkeetna and Teklanika samples, or fully characterize these source localities. A single rhyolite sample that matches Group H was encountered as an alluvial cobble in the upper Teklanika drainage, but the exact nature of the outcrop contributing to this alluvium is unknown (Coffman, personal comm. 2021). Additional work is needed to establish these locations as toolstone sources tied to group G and H artifacts.
Group A represents the largest group membership (39.4%) of all sampled rhyolite artifacts (Table 6), replicating the high numbers of this grouping observed by Coffman and Rasic [95] in their analysis that reached outside the Nenana valley. Group A is characterized by high Rb, very low Sr, high Y, moderate Zr, and moderate Nb compared to other groups (Table 7). Group B rhyolite comprises 6.2% of sampled artifacts and is characterized by moderately high Rb, low Sr, moderately low Y, low Zr, and moderate Nb relative to other groups. Seventeen artifacts, 2.5% of the total, are assigned to Group C. Group C is characterized by moderate Rb, moderate Sr, high Y, high Zr, and moderate Nb. Group D, representing 1.2% of the total, is characterized by very low Rb, moderate Sr, high Y, high Zr, and moderate Nb. Group E consists of 2.2% of the total, and is characterized by moderate Rb, high Sr, moderate Y, moderate Zr, and moderate Nb. Group F comprises 1.7% of sampled artifacts and is characterized by moderately low Rb, high Sr, high Y, high Zr and moderate Nb. Talkeetna Mountains rhyolite makes up 2.9% of sampled artifacts, reflecting moderately low Rb, moderate Sr, low Y, very low Zr, and low Nb. Rhyolite artifacts belonging to Calico Creek, 3.1% of the total analyzed, are characterized by moderate Rb, moderately low Sr, and moderate Y, Zr, and Nb. Group I makes up 13.0% of analyzed artifacts and is characterized by moderately high Rb, low Sr, low Y, high Zr, and moderately low Nb compared to other groups. Group J rhyolites, 7.8% of the total, are characterized by very high Rb, low Sr, very high Y, low Zr, and high Nb (Figure 6; Table 7 and Table S4).

5.3.2. New Reported Groups

This study identifies four new rhyolite groups: K, L, M, and N. Group K rhyolite comprises 3.7% of sampled artifacts, and is characterized by low Rb, high Sr, moderate Y, very high Zr, and high Nb compared to other groups. Group L (1.5% of total) is characterized by high Rb, very low Sr, very high Y, very high Zr, and high Nb. Group M makes up 4.4% of sampled artifacts and is characterized by low Rb, very high Sr, moderately low Y, moderate Zr, and very low Nb. Group N comprises 3.8% of the artifact sample and is characterized by very low Rb, very high Sr, and low Y, Zr, and Nb compared to other groups (Figure 6; Table 7 and Table S4). More sampling will be needed to further corroborate these results.
There are, at minimum, 14 rhyolite groups represented in the Nenana valley archaeological assemblages, increasing the diversity of rhyolites coming from potentially different sources by at least 40% beyond Coffman and Rasic’s [95] initial assessment.

5.4. Combining Geochemical Analyses of Geological and Archaeological Samples to Define Sources

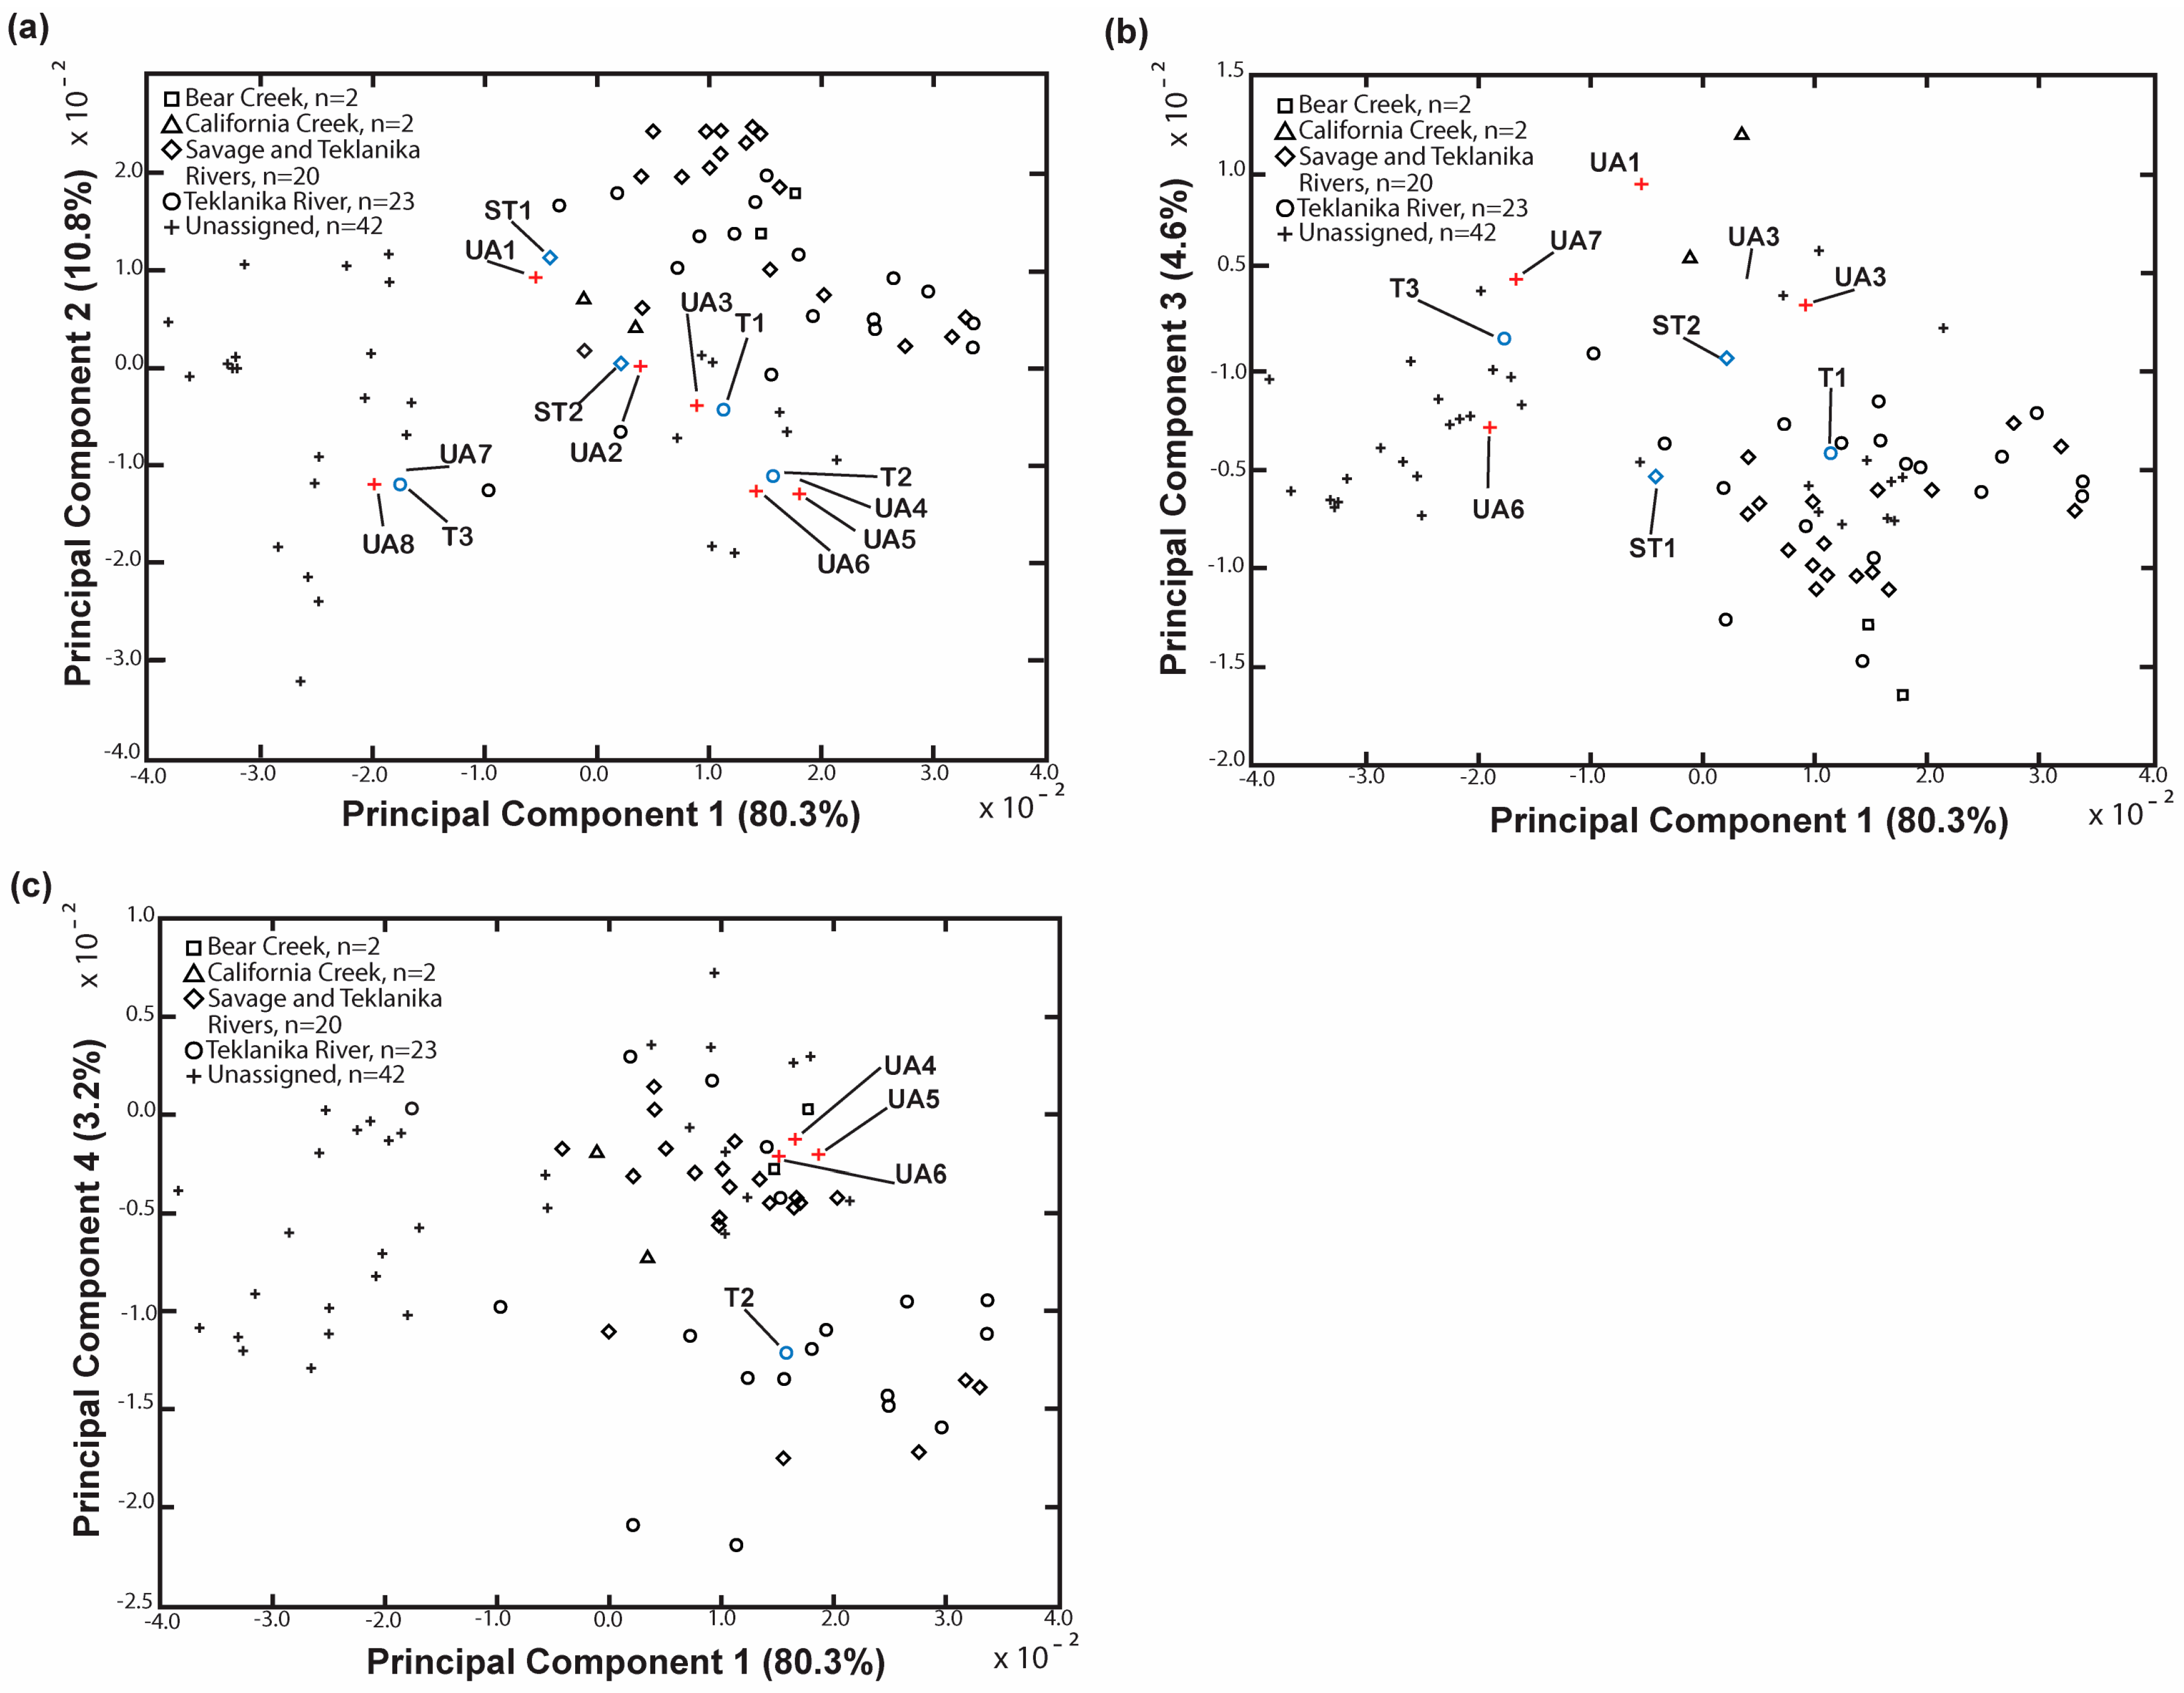
5.4.1. Rhyolite Artifacts and Rhyolite Alluvium

Comparison of rhyolite artifact groups A–N (including Talkeetna Mountains and Calico Creek) with the four alluvial sample sets by PCs 1 and 2 (91.1% of the total variance) indicates separation of groups B, C, D, E, F, K, M, N, and Talkeetna Mountains rhyolite from the alluvial samples; however, five groups, A, I, J, L, and Calico Creek, overlap with several alluvial sample locations (Figure 7; Table S5). By examining just these five artifact groups and alluvial samples by PCs 1 and 3, only one California Creek sample overlapped with the Group J ellipse (Figure 8a). When isolating just Group J and the alluvium against PCs 3 and 5, the California Creek sample no longer falls within the Group J ellipse (Figure 8b). Therefore, none of the alluvial samples collected in this study clearly pairs with the artifact groups.
Considering only unassigned artifacts and alluvium in a comparison of PCs 1 and 2, only eight artifacts appear close to any alluvium sample (Figure 9a), but examination of PCs 1 and 3 show five of these eight artifacts plot away from their respective alluvium sample (Figure 9b), and PCs 1 and 4 show separation of the remaining three artifacts from the alluvium sample (Figure 9c). Thus, no unassigned rhyolite artifacts were paired with alluvium samples.

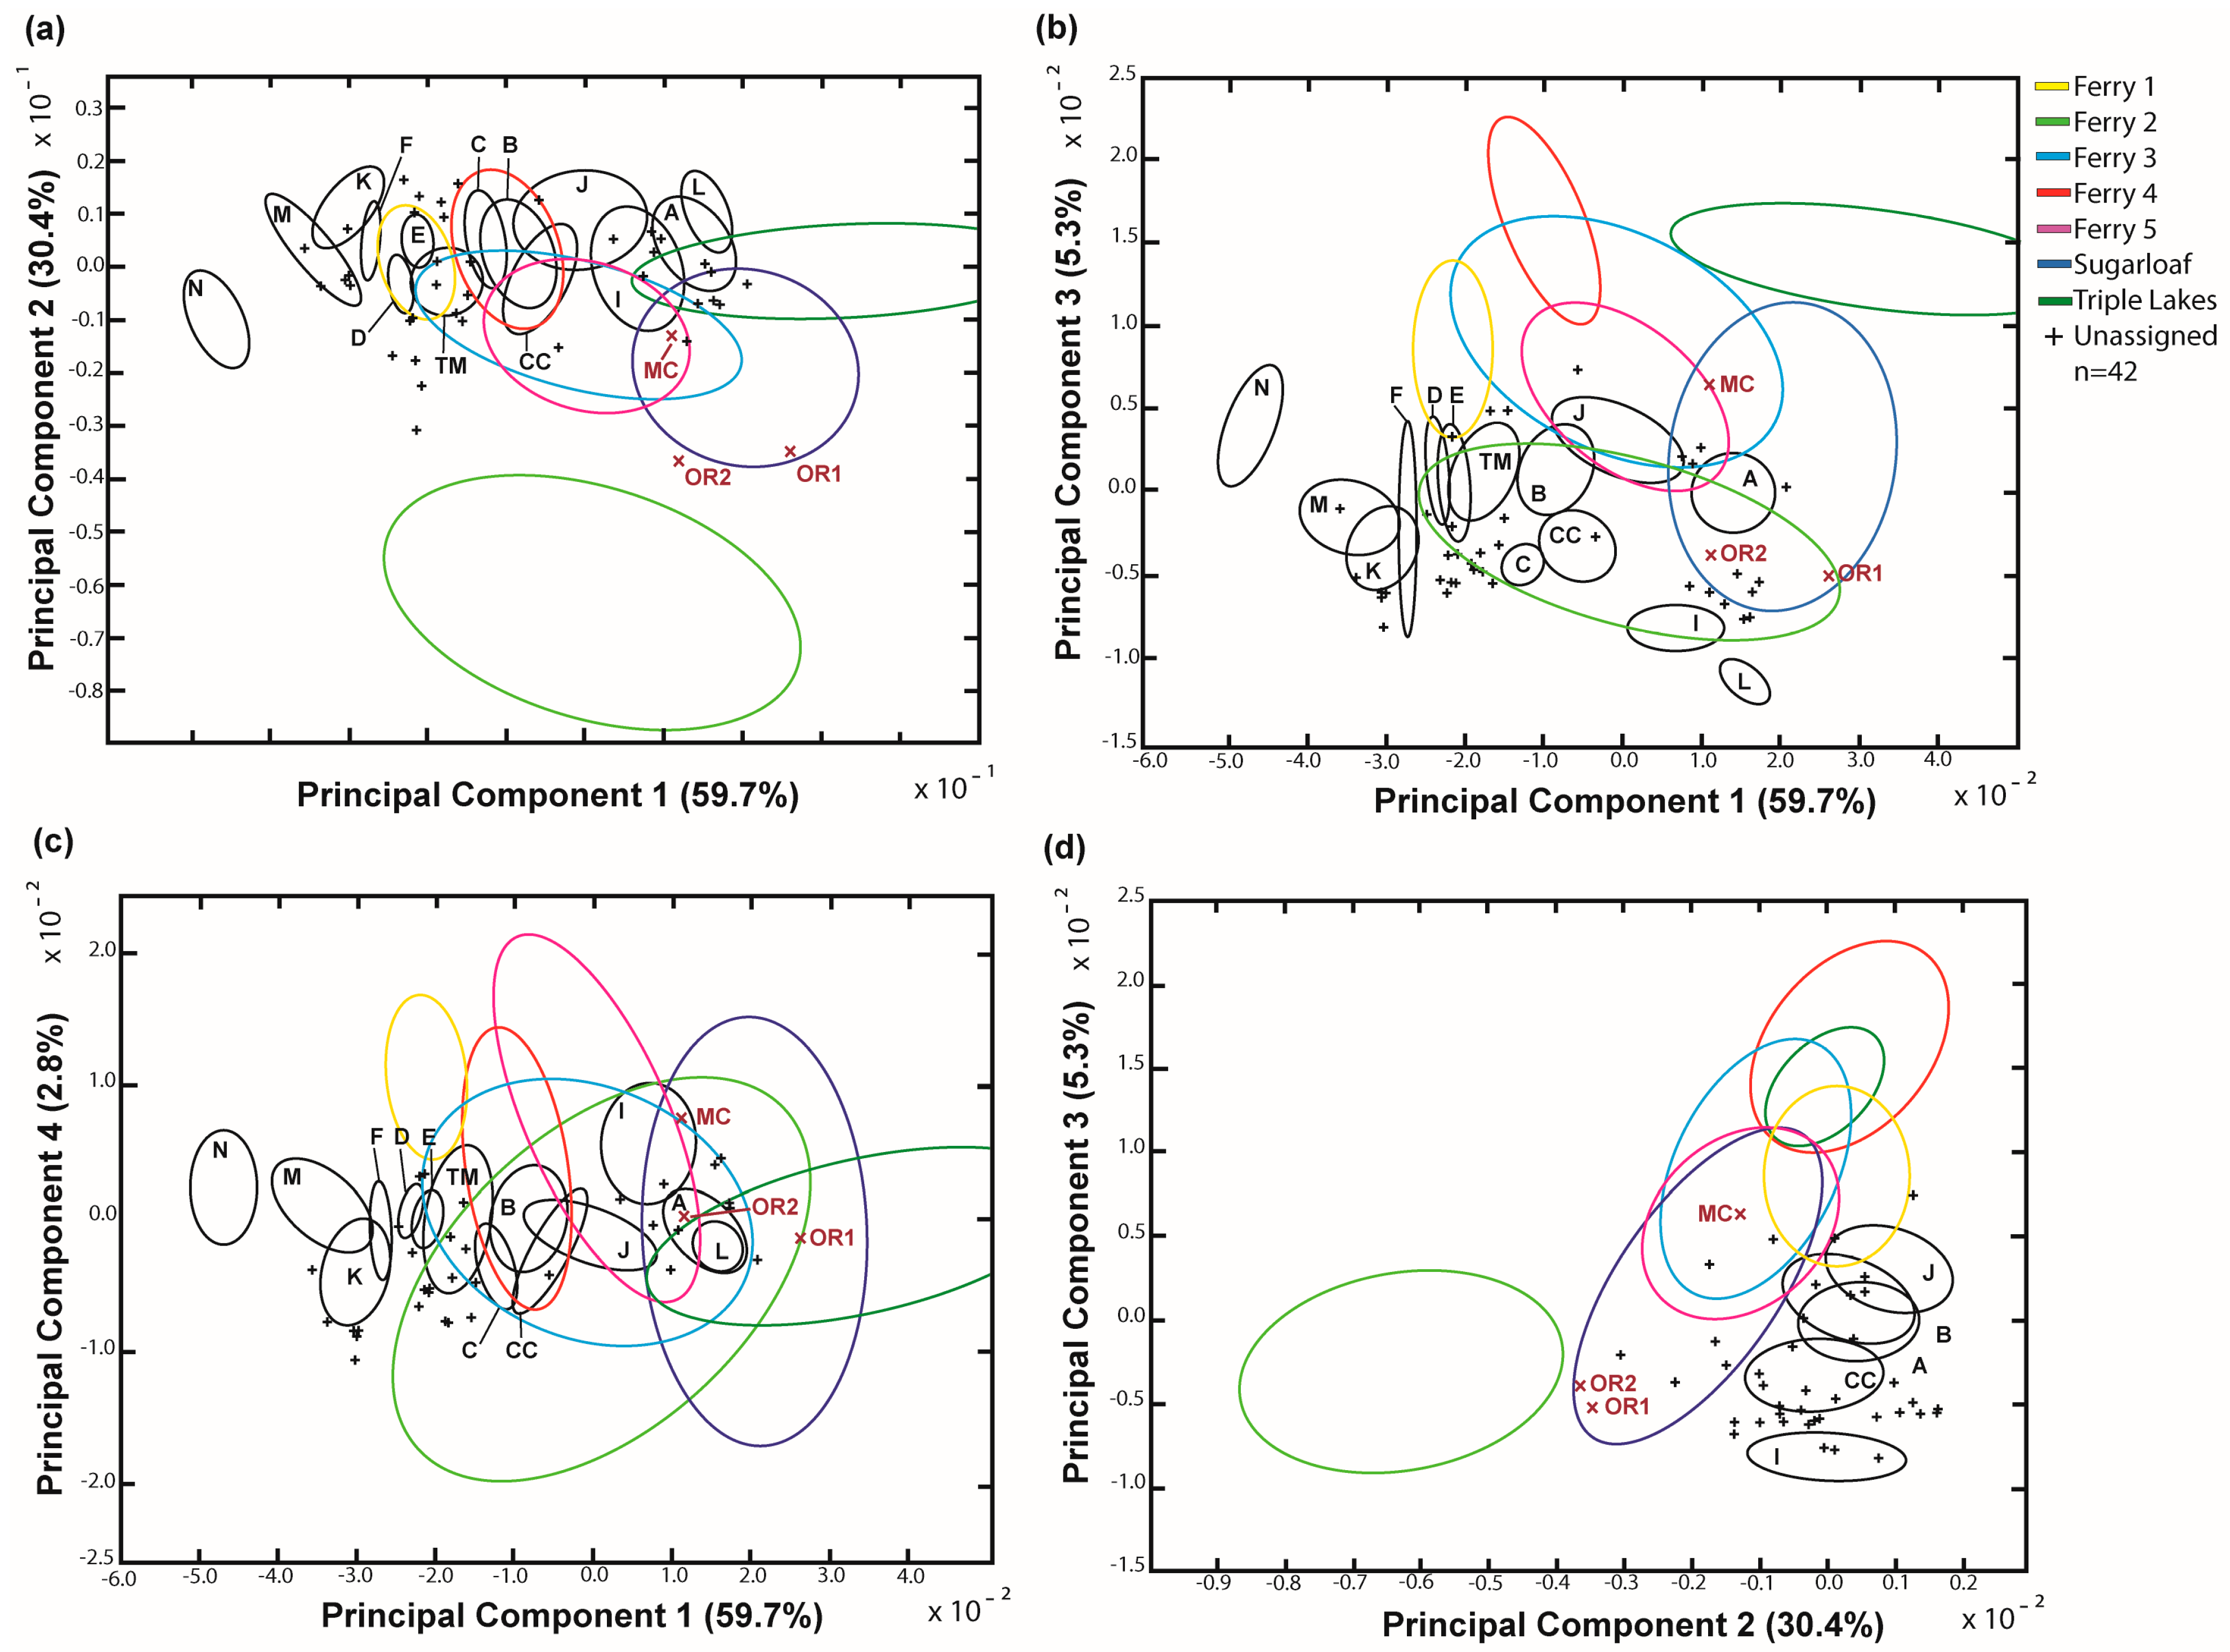
5.4.2. Rhyolite Artifacts and Outcrops

When comparing rhyolite artifact groups and unassigned rhyolite artifacts with rhyolite outcrops, PCs 1 and 2, comprising 90.1% of the total variance, illustrate groups K, M, and N separate from the outcrop ellipses (Figure 10a; Table S6). PCs 1 and 3 show Talkeetna rhyolite removed from Ferry 1; groups C, I, Talkeetna, and Calico Creek rhyolites removed from Ferry 3; groups B, C, J, Talkeetna, and Calico Creek rhyolites removed from Ferry 4; groups I and Calico Creek rhyolites removed from Ferry 5; and groups I and L removed from both Sugarloaf and Triple Lakes outcrops (Figure 10b). Additional rhyolite artifact groups separated from outcrops by PCs 1 and 4 are D and E removed from Ferry 1 (Figure 10c), and artifact groups separated by PCs 2 and 3 are groups B and J from Ferry 3; Group J from Ferry 5; and Group A from Triple Lakes (Figure 10d). Although artifact Group B appears to overlap slightly with the Ferry 5 outcrop, a 3D plot of artifacts and outcrop samples show they are clearly separate (Figure 11). To summarize, no artifact groups can be unequivocally linked with known rhyolite outcrops in the Nenana valley.

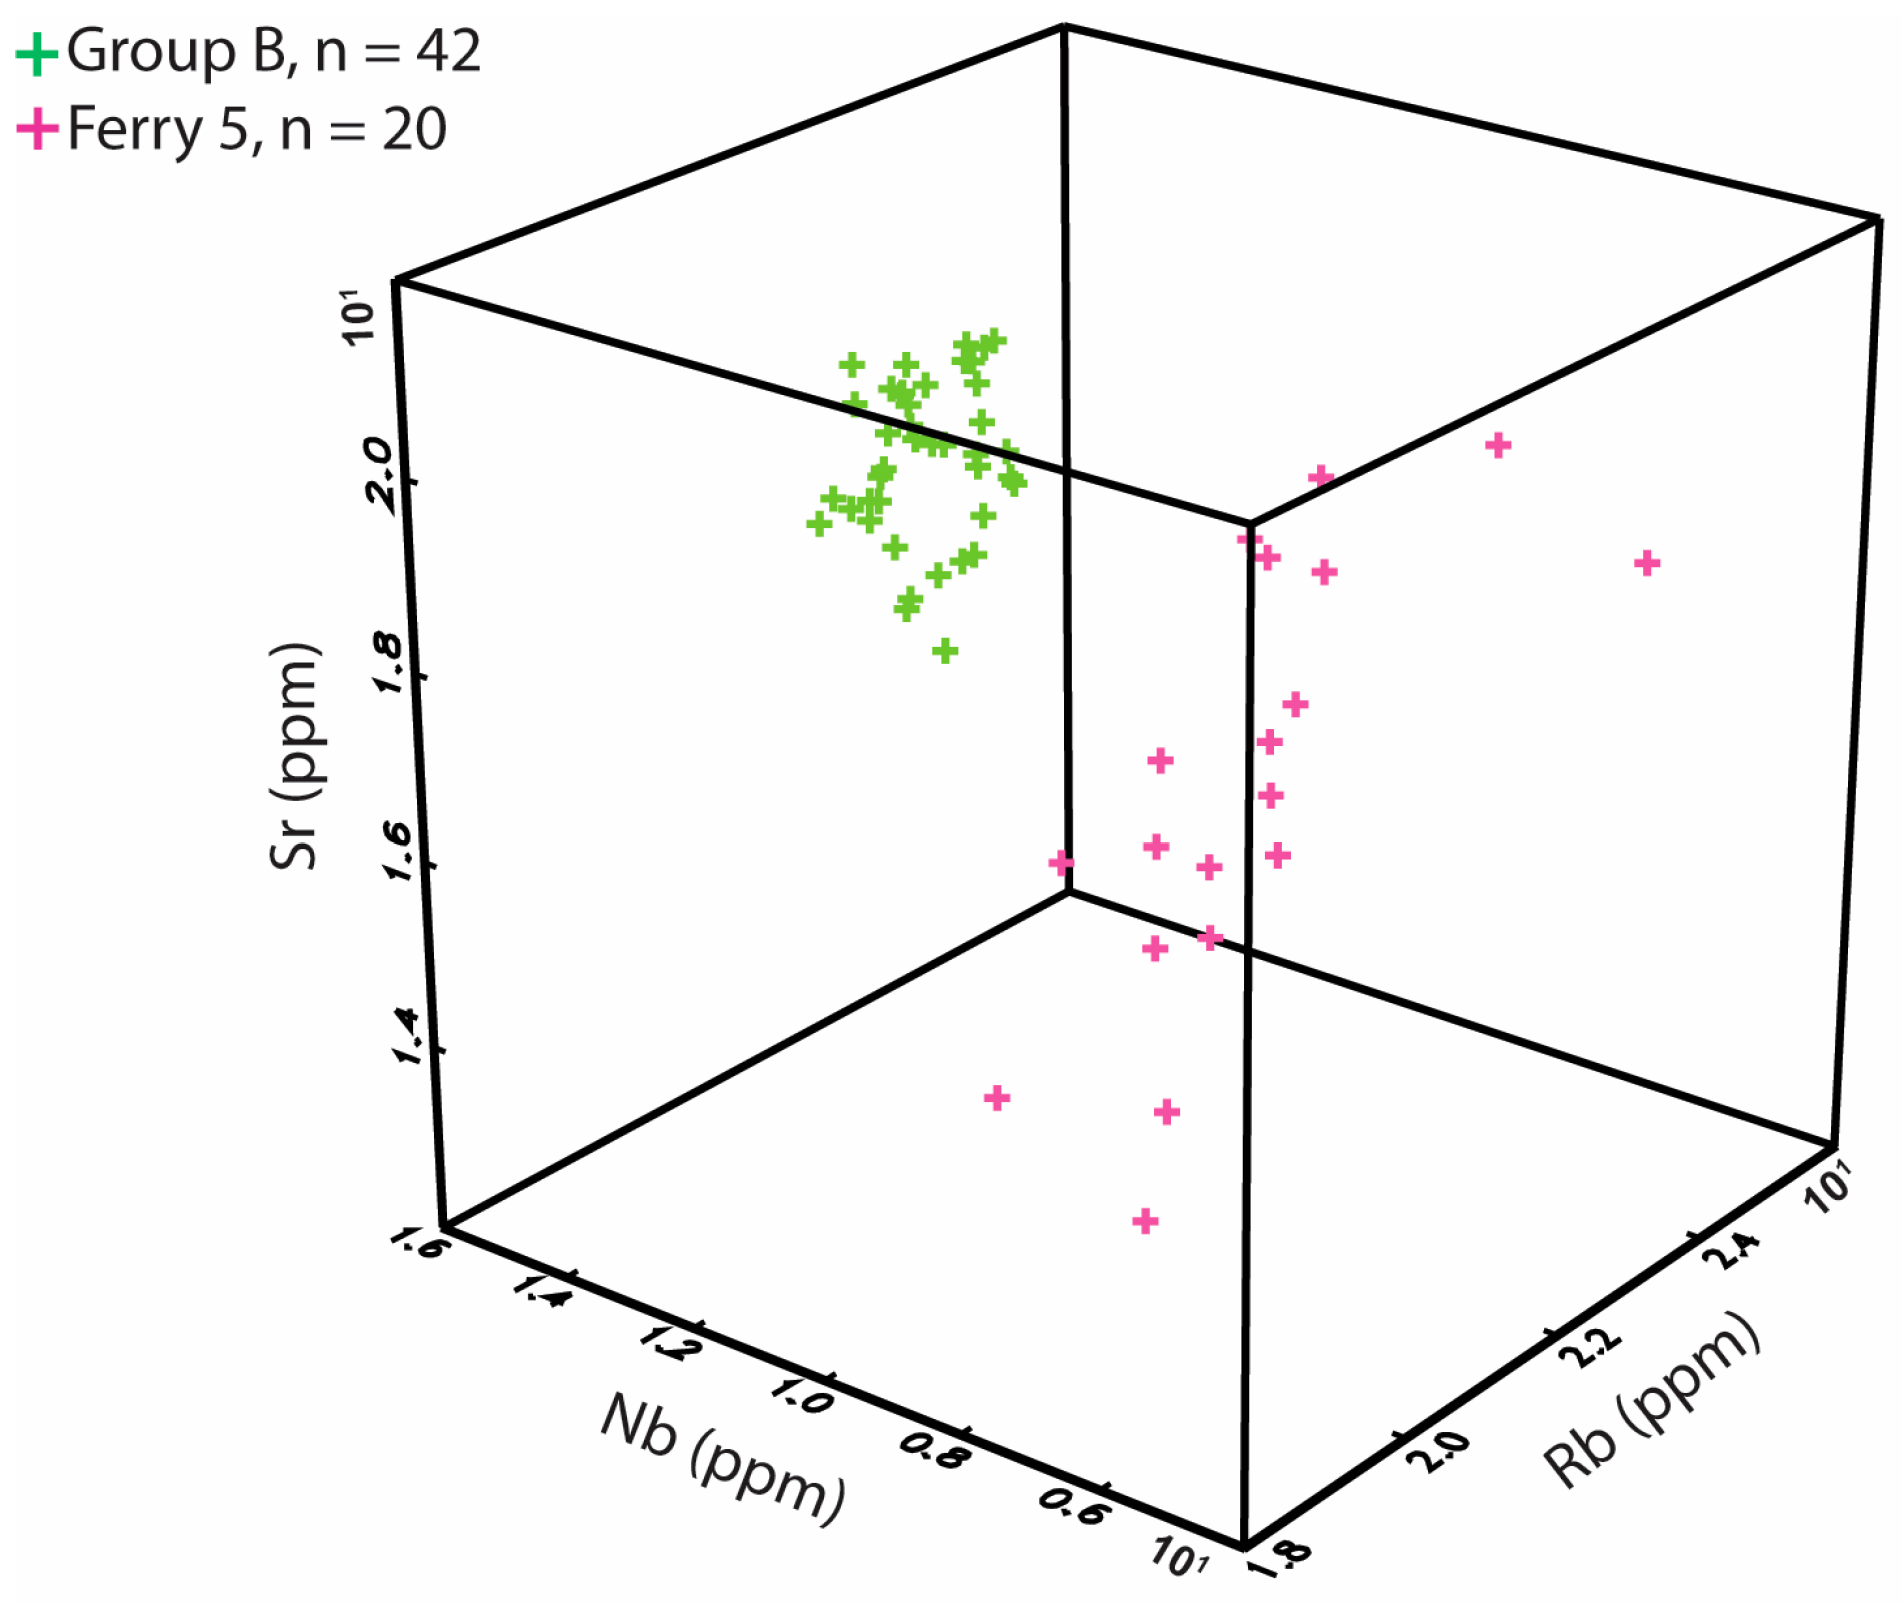
5.4.3. Triple Lakes: A New Source

Three of the 42 rhyolite artifacts unassignable to an artifact group appear to match one of the outcrops presented above, Triple Lakes. These three artifacts are labeled OR1, OR2, and MC in Figure 10a–d, where they repeatedly fall within (or adjacent to) the space of the same confidence ellipse representing that source’s variation. These artifacts consist of one flake fragment and one secondary cortical spall from Owl Ridge C3 (~11.3–11.2 ka) and a lanceolate bifacial point from Moose Creek C3 (~6.5 ka). The Moose Creek C3 biface falls within the 90% confidence interval ellipses of the Triple Lakes outcrop sample when comparing the first four PCs in this analysis. It also, however, lies within the ellipses of the Ferry 3 outcrop sample when comparing these same PCs, and within the ellipses of the Ferry 5 outcrop sample when comparing PCs 1–3 (Figure 10a–d). Group membership probabilities based on MD calculations predict this biface belongs to the Triple Lakes sample at 68% probability versus 0.006% probability it belongs to Ferry 3 and 32% probability of it belonging to Ferry 5 (Table S7). Given these probabilities and lack of overlap between this artifact and the Ferry 5 ellipses in two of the four PC comparisons, this artifact is assigned to Triple Lakes. The two artifacts from Owl Ridge C3, a flake (OR1) and cortical spall (OR2), are consistently positioned within Triple Lakes (Figure 10a–d). Artifact OR2, however, lies just outside the confidence ellipse for Triple Lakes rhyolite in the biplot comparing PC 1 and PC 2. MD calculations predict this piece belongs to Triple Lakes at 31% probability, but because it is from the same site and cultural component as the other Owl Ridge sample (OR1), assignment to Triple Lakes cannot be confidently ruled out. Increased sampling of rhyolites from Nenana valley assemblages and outcrop sources are needed to confirm these results.
None of the remaining outcrop or alluvium geological samples presented here match the artifact groups. As mentioned above, however, artifact groups G and H have tentatively been attributed to the Talkeetna Mountains and upper Teklanika River drainage, respectively, and 41 artifacts in the archaeological sample have been attributed to these sources. Though the exact locations of these two groups are unknown and more work needs to be conducted to confirm that general locations given for them are appropriate, artifacts of groups G and H are attributed to these areas in discussion below. This leaves a minimum of 12 geographically unknown rhyolite groups used by prehistoric peoples from the Nenana valley: A, B, C, D, E, F, I, J, K, L, M, and N.

5.5. Rhyolite Transport, Provisioning Strategies, and Diversity

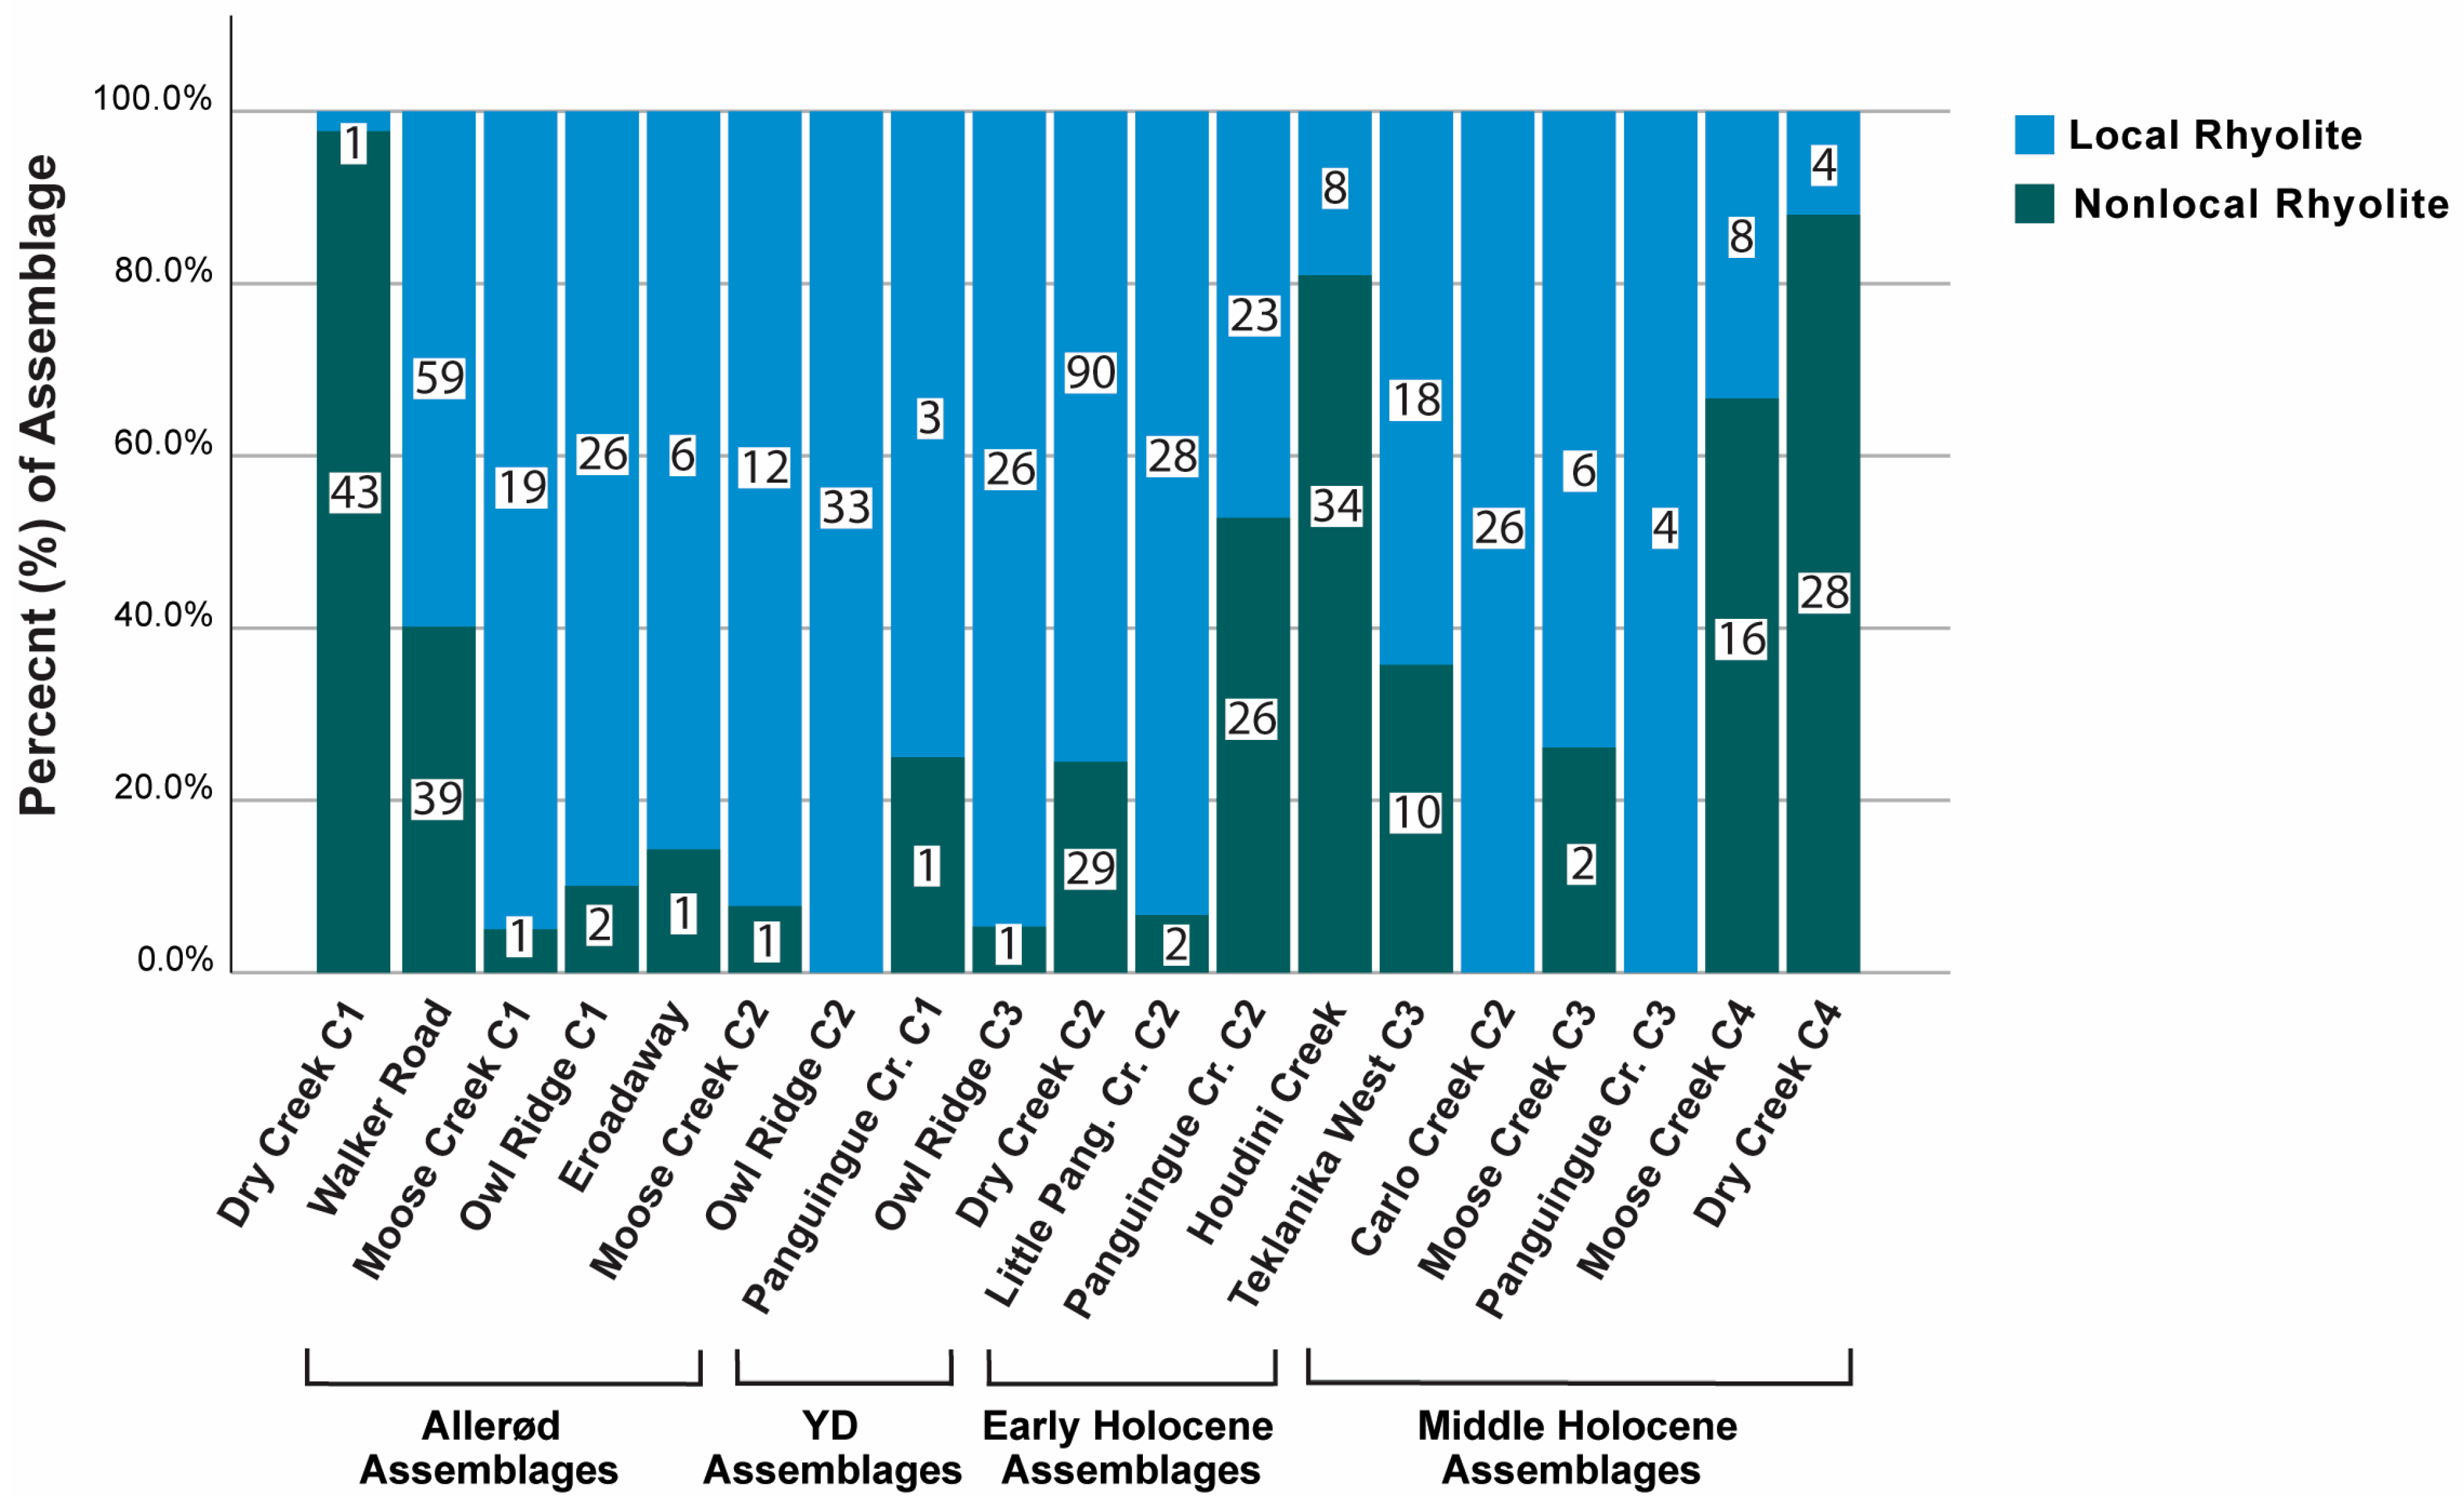
5.5.1. Rhyolite Transport

Based on the geochemical results presented above, there are 44 artifacts that can be tied to on-the-ground source locations for which a specific transport distance can be ascertained. A new known source, Triple Lakes, is defined above and accounts for three artifacts. In addition, there are 20 artifacts tied to the Talkeetna Mountains source area and 21 artifacts from the Calico Creek source area. Artifacts from Triple Lakes moved 47 km from southeast to northwest when taken to the Owl Ridge site and 41 km from south to north when taken to Moose Creek (Figure 1). Artifacts from the Talkeetna source area moved from south to north over 200 km into the Nenana valley and were discarded at Dry Creek (200 km), Panguingue Creek (202 km), Houdini Creek (205 km), Little Panguingue Creek (206 km), Walker Road (210 km), and Moose Creek (220 km). Rhyolite from the Calico Creek area moved as much as 41 km from southwest to northeast to Panguingue Creek, 42 km to Dry Creek, and 50 km to Walker Road. Keeping in mind that these are all straight-line distances between source areas and sites, it is important to note that at distances >40 km, these would all be considered nonlocal raw materials.
Another, more indirect means of measuring rhyolite transport is to consider frequencies of artifact groups and cortex present in each artifact group through time. A total of 207 artifacts came from Allerød assemblages, 51 from YD assemblages, 242 from early Holocene assemblages, and 175 from middle Holocene assemblages (Table 6). The total number of rhyolite groups varies within each time period: there are a minimum of 12 groups present during the Allerød, five during the YD, 13 during the early Holocene, and 12 during the middle Holocene (Table 8). Humans in the Nenana valley maintained the use of at least five varieties of rhyolite from the late Pleistocene through the middle Holocene. A Kruskal-Wallis test showed that use of specific rhyolite groups in each period differs significantly: H (3) = 18.96, p < 0.001 (Table 8). A post hoc multiple comparison test revealed significant differences between the Allerød and YD, the YD and middle Holocene, and the early and middle Holocene. However, there was no significant difference between the Allerød and early Holocene, Allerød and middle Holocene, or YD and early Holocene (Kruskal-Wallis multiple comparison testing, p ≥ 0.05). Several rhyolite groups have high frequencies among the total sampled population and site occurrence. Group A rhyolite comprises 39.4% of all artifacts and is present in 95% of all site assemblages in the valley (Table 6; Figure 12). This rhyolite was continuously used through time (Figure 13a). Group I is the second-most common rhyolite group sampled in both total sample number (13%) and assemblage frequency (68.4%), being present at nearly every site in the valley (Table 9; Figure 12). Group I rhyolite is represented in all time periods (Figure 13a). Two other rhyolite groups have high total sample frequencies but are distributed variably in site assemblages, site locations, and time periods. For example, Group J is third-most common in total sample number (7.8%) and occurs in six assemblages (31.5% of total) at four site locations and in all time periods except the early Holocene (Table 6; Figure 12 and Figure 13a). Artifacts from Group B are 6.2% of the total sample and occur in 11 assemblages (57.7% of total) at four site locations in all time periods (Table 6; Figure 12 and Figure 13a). These four groups are the most widely used in the Nenana valley.
By contrast, most of the other rhyolite groups, C, D, E, F, K, L, M, N and Calico Creek rhyolite, were found in very low overall frequencies (≤4.4%) and/or in few sites (≤5) and site assemblages (≤26.5%) (Table 6; Figure 12 and Figure 13a). Further, these low-incident rhyolite groups occur sporadically through time (Table 6). The Triple Lakes source is also a low-occurrence rhyolite, represented by only three artifacts (0.4%) from two sites, three site assemblages (10.5%), and in only two time periods (early-middle Holocene). Talkeetna rhyolite is exceptional because though it is also present in low total sample frequencies (2.9%), it occurs in more assemblages (42.1%), site locations (eight), and in all time periods compared to other low-frequency rhyolite groups (Table 6; Figure 12 and Figure 13).
Cortex amount varies among rhyolite groups (Table 9; Figure 13b). Group A possesses the most cortical pieces out of all groups (23.1%). These pieces are present in every time period in nine assemblages (47.7%). Group B exhibits the second-highest incidence of cortex (19.2%) distributed among four site assemblages (21%) and three time periods (Allerød-early Holocene), and Group I exhibits the third-highest incidence of cortex (15.4%), present in three site assemblages (15.8% of total) and three time periods (Allerød, YD, and middle Holocene).
Talkeetna, Group J, and Calico Creek rhyolites have moderately low amounts of cortex, 9.6%, 7.7%, and 5.8% of total, respectively. These groups occur in a handful of assemblages, 21.1%, 15.8%, and 5.3%, respectively, and are represented in three time periods (Allerød and early-middle Holocene for Group J and Talkeetna rhyolite, and only the early Holocene for Calico Creek rhyolite). Very low cortex amounts are observed in the D, E, F, K, and N rhyolite groups, each containing just one artifact with cortex (1.9% each) in the Allerød (groups D and N), early Holocene (Group F), and middle Holocene (groups E and K). Cortical pieces are completely absent in rhyolite groups C, L, and M (Table 9; Figure 13b).
Unknown artifact groups A, I, and B are found in high sample and assemblage frequencies with moderate-to-high amounts of cortex. Conversely, unknown groups C, D, E, F, K, L, M, and N exhibit low sample frequencies, low assemblage distribution, sporadic use through time, and low-to-absent cortex frequencies. Learning from the cortical piece of Triple Lakes rhyolite found at Owl Ridge, small amounts of artifacts with cortex can travel significant distances (>40 km) so that the simple use of presence or absence of cortex cannot be used as a reliable determinant of transport distance. Instead, relative amounts of cortex are used to infer degrees of transport. Although Group J rhyolite is present in high total sample frequency, over half (60%) of the total group sample is located at just one Allerød site, Walker Road (7.9% of total) with low assemblage distribution and low cortex amounts. Sample frequency, assemblage distribution, and cortex frequencies indicate unknown groups A, B, and I are probably local to the Nenana valley, while unknown groups C, D, E, F, J, K, L, M, and N represent rhyolites likely procured from nonlocal sources, perhaps outside the study area.

5.5.2. Rhyolite Provisioning Strategies

Figure 14 presents proportions of local and nonlocal rhyolites within each assemblage based on the transport determinations determined from presence/absence of cortex and transport distances presented above. Allerød assemblages Walker Road, Moose Creek C1, Owl Ridge C1, and Eroadaway are dominated by local rhyolites (60%, 95%, 98%, and 86%, respectively), but Dry Creek C1 rhyolites are nearly all nonlocal rhyolites (98%). All YD assemblages are dominated by local rhyolites (92% at Moose Creek C2, 100% at Owl Ridge C2, and 75% at Panguingue Creek C1). During the early Holocene, Owl Ridge C3, Dry Creek C2, and Little Panguingue Creek were dominated by local rhyolite (96%, 76%, and 93%, respectively), while Panguingue Creek C2 has more nonlocal rhyolite (53%). Four middle Holocene assemblages are dominated by local rhyolite (Teklanika West C3 (64%), Carlo Creek C2 (100%), Moose Creek C3 (75%), and Panguingue Creek C3 (100%)), with three assemblages dominated by nonlocal rhyolites (Houdini Creek (81%), Moose Creek C4 (67%), and Dry Creek C4 (87%)) (Figure 14; Table 10).
In sum, among the Allerød-aged assemblages, these data suggest people provisioned individuals with nonlocal rhyolites at Dry Creek C1 but chose to provision place with local rhyolites at Walker Road, Moose Creek C1, Owl Ridge C1, and Eroadaway. It is noteworthy that Walker Road also contains a significant amount (40%) of nonlocal rhyolite because it may represent a base camp where both local and nonlocal toolstones are expected to be discarded. During the YD, foragers all chose to provision place with local rhyolites, as was the case during the early Holocene, apart from Panguingue Creek C2 where people shifted towards provisioning individuals with more nonlocal rhyolites. During the middle Holocene, there was a mixture of provisioning strategies, with Houdini Creek, Moose Creek C4, and Dry Creek C4 expressing a provisioning-individuals pattern of mostly nonlocal rhyolites used, while Teklanika West C3, Carlo Creek C2, Moose Creek C3, and Panguingue Creek C3 express a provisioning-place pattern of mostly local rhyolites (Table 10). Below, these results are placed into a broader discussion of changing provisioning strategies through time.

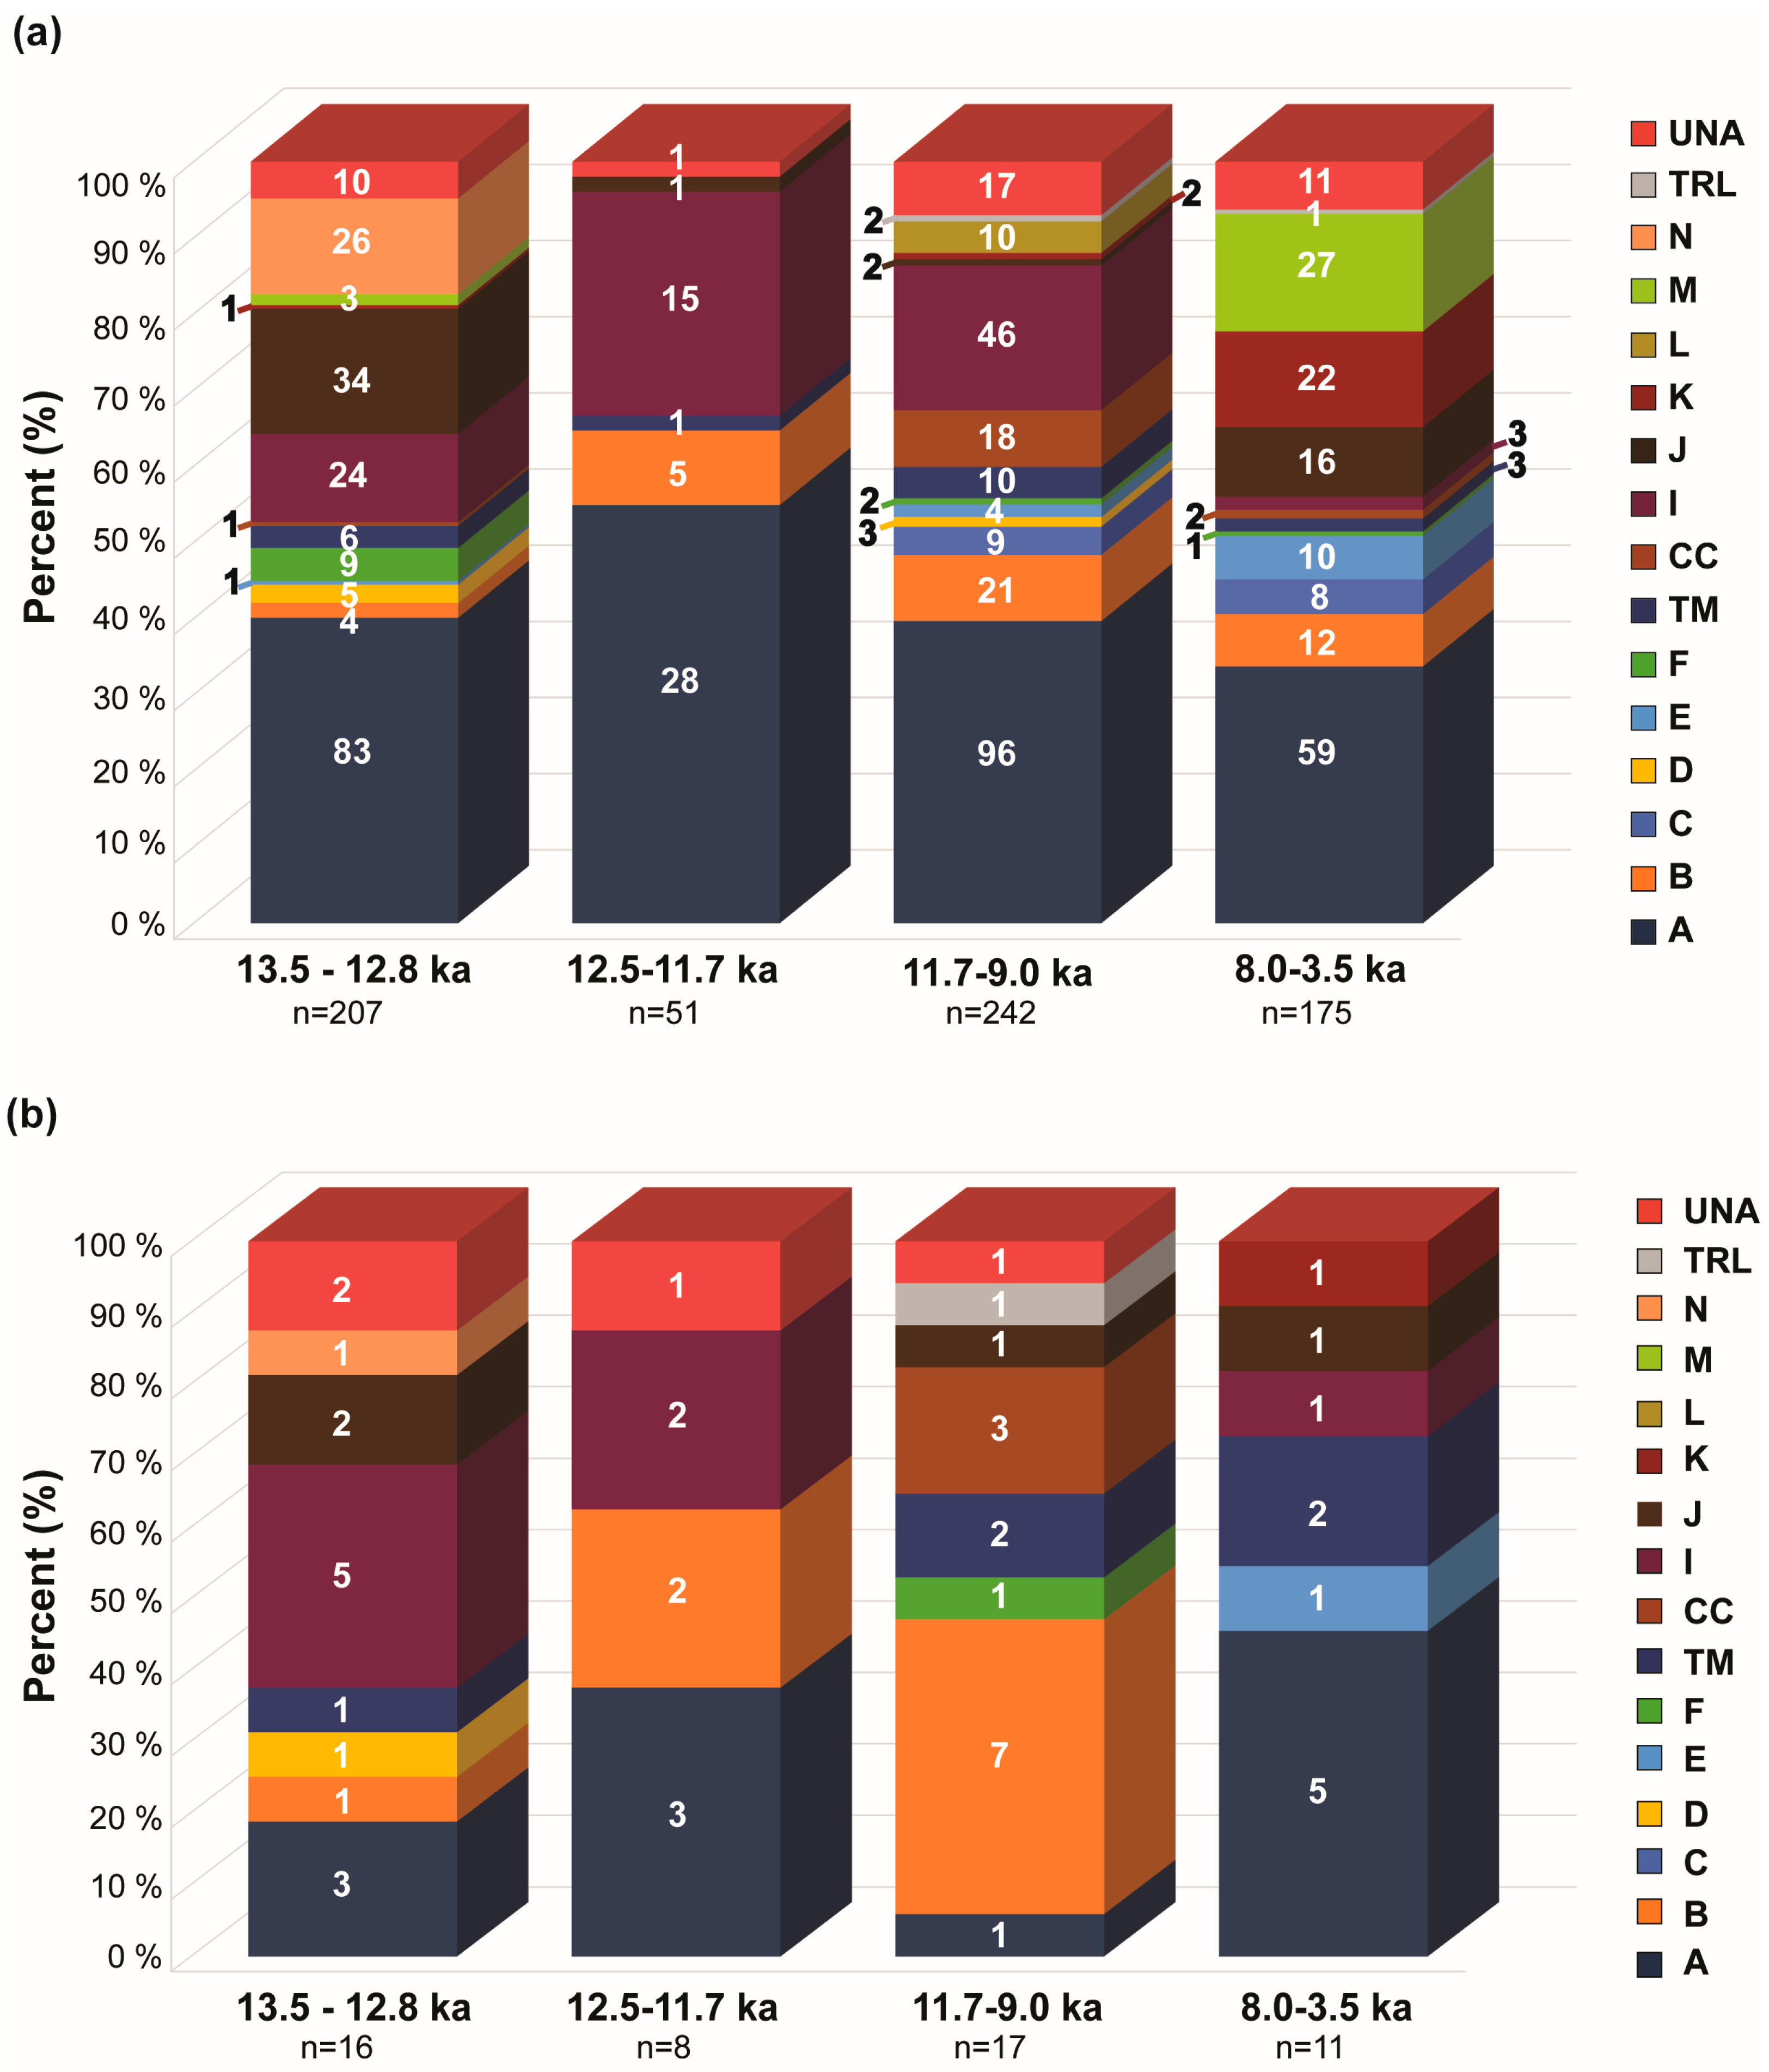
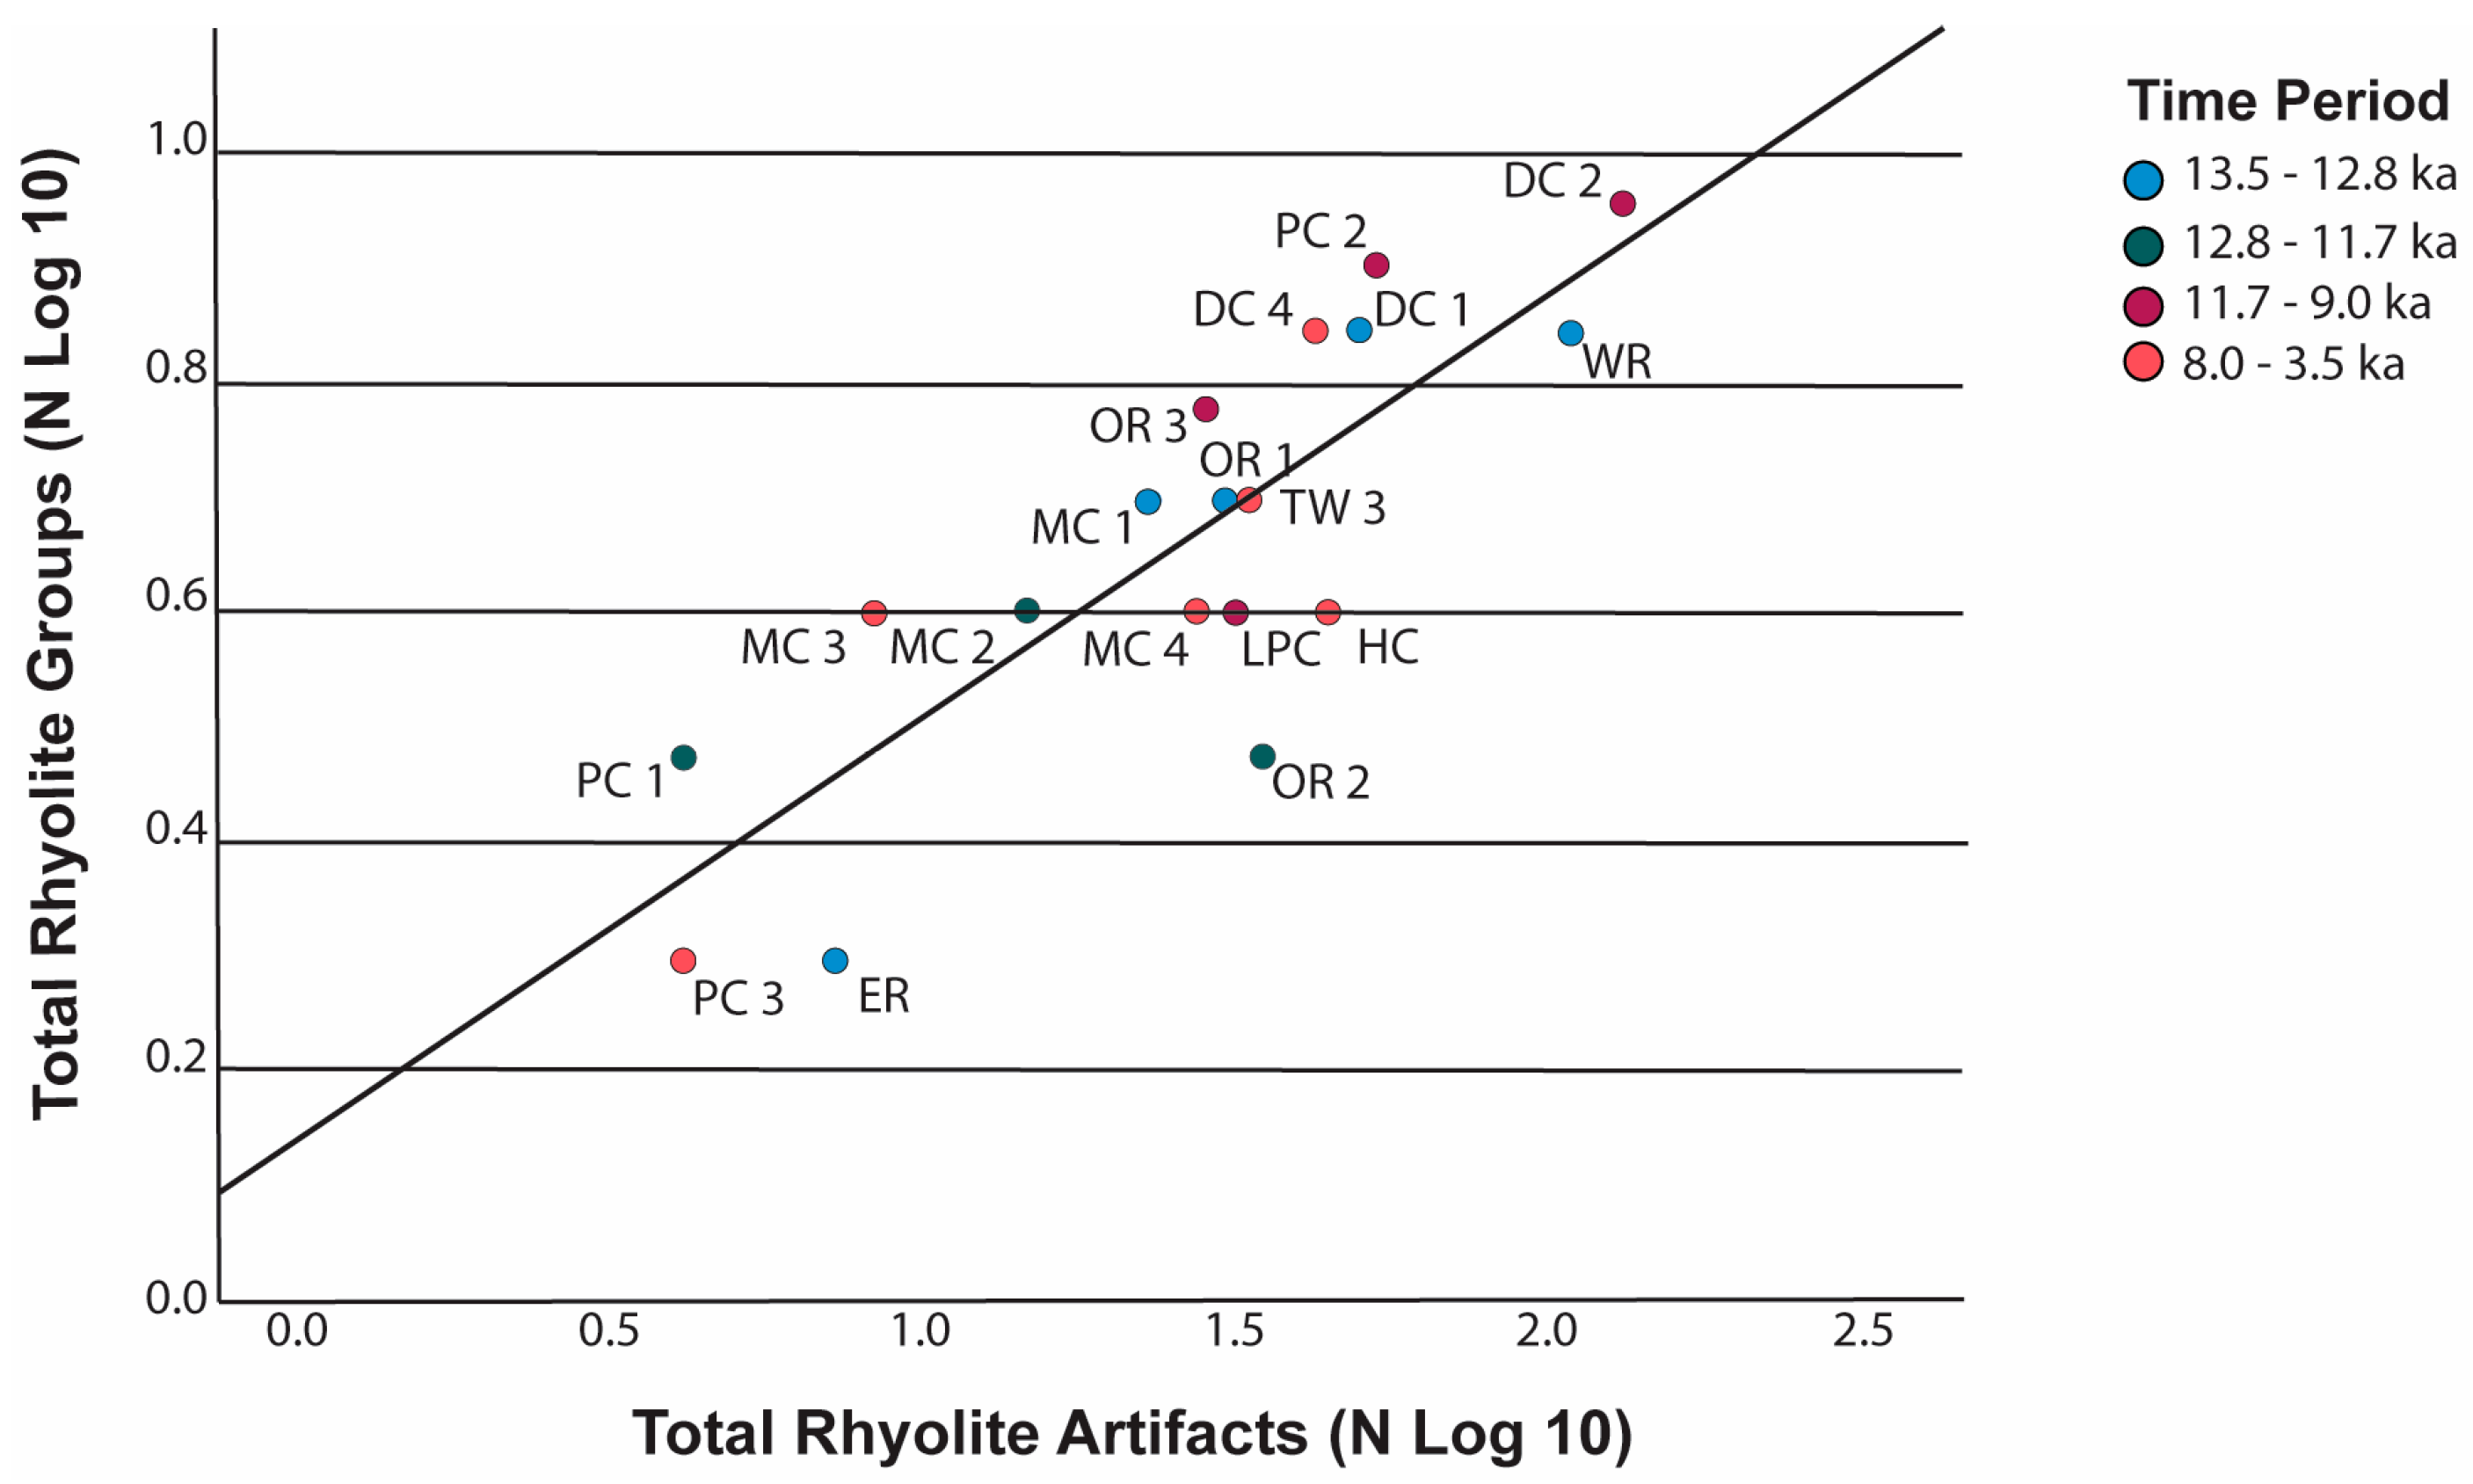
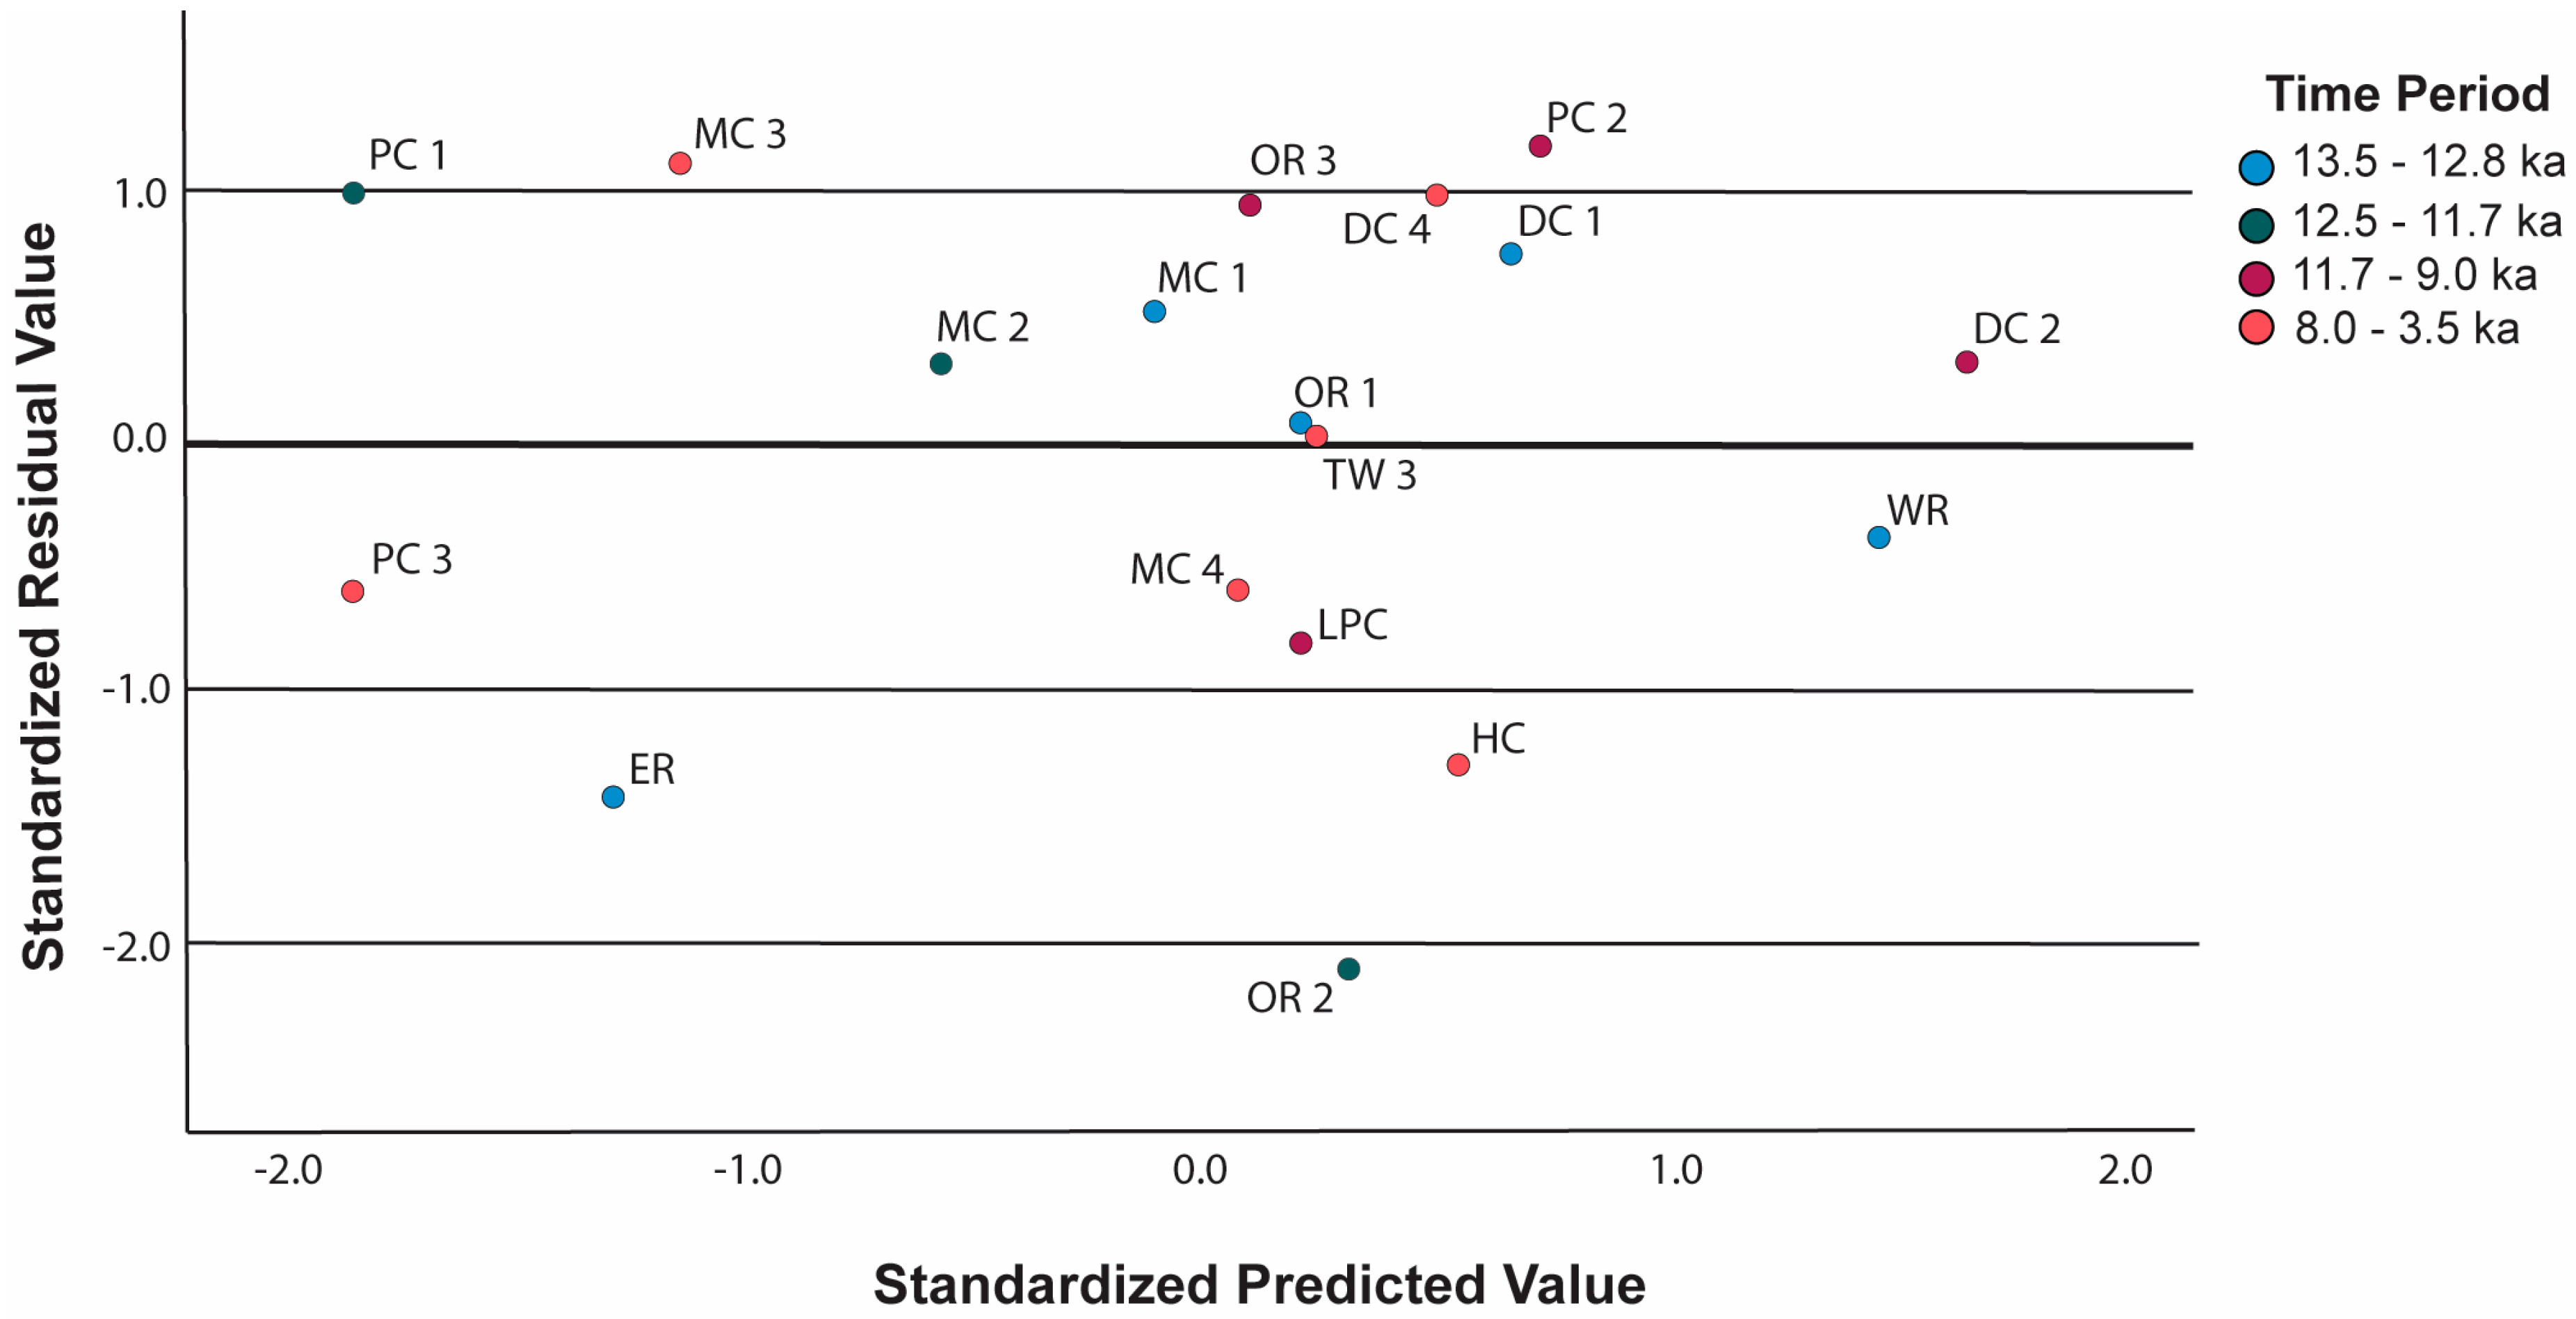
5.5.3. Rhyolite Diversity

To assess rhyolite diversity, Table 11 presents the ratio of the number of rhyolite groups and sources found in each assemblage to the total number of rhyolite groups and sources found among all assemblages within the Nenana valley. These ratios are high for the Allerød, early Holocene, and middle Holocene time periods (0.80, 0.87, and 0.80, respectively), reflecting higher overall diversity of rhyolites in these assemblages, whereas the total ratio for the YD period is low (0.33), reflecting low overall rhyolite diversity. Interestingly, if these ratios are examined more closely, there is quite a bit of variability within the time periods that tells a more complicated story. For example, when comparing the average ratio values between the YD (0.22) and the Allerød (0.32), it becomes clear that the Allerød period has as many low-diversity sites as the YD (3), showing similar low-diversity signals. Though overall diversity seems less for the YD, this might be related more to the amount of YD sites than to the fact that these sites are less diverse in their rhyolite-use pattern. Alternatively, it may also be a result of similar site function, occupation duration (with low-diversity sites being short-term occupations while Dry Creek C1 and Walker Road were longer-term occupations), or sampling. Early Holocene assemblages show an overall high diversity signal while a closer look at middle Holocene assemblages reveals an average diversity of just (0.26) with the highest number of least-diverse sites.
To further assess rhyolite group diversity, the number of rhyolite groups used at each site was compared with the total number of rhyolite artifacts studied by logging (base 10) the numbers to control for small and variable sample sizes (e.g., Dry Creek C2 sample is 119 and Panguingue Creek C3 is 4) (Figure 15). Linear regression evaluates diversity among assemblages by assuming that as a site’s rhyolite assemblage size increases, the diversity of identified rhyolite groups should increase. The Carlo Creek C2 assemblage was omitted from this analysis because it is an outlier with only one rhyolite group present. The scatterplot shows a strong linear relationship between the number of rhyolite groups and the total number of rhyolites sampled (Pearson’s R = 0.824; p < 0.001) with randomly patterned standardized residuals (Figure 16) indicating this positive correlation is a reliable fit to the data. The slope coefficient for the rhyolite sample is 0.369 so the number of rhyolite groups increases by this amount for each additional artifact sampled. The adjusted R2 value is 0.659, indicating that 66% of the variation in rhyolite groups can be explained by the number of artifacts sampled for each site.
Examining the best-fit line (Figure 15), nine site assemblages have more-than-expected rhyolite groups relative to the total number of rhyolite artifacts sampled, indicating greater rhyolite diversity among these assemblages. These rhyolite-diverse assemblages include Dry Creek C1, C2, and C4; Moose Creek C1, C2, and C3; Panguingue Creek C1 and C2; and Owl Ridge C3. In contrast, seven site assemblages have less-than-expected rhyolite diversity, including Walker Road, Eroadaway, Owl Ridge C2, Little Panguingue Creek, Houdini Creek, Moose Creek C4, and Panguingue Creek C3. The Owl Ridge C1 and Teklanika West C3 assemblages lie on the best-fit line with the Owl Ridge assemblage slightly more diverse than expected and the Teklanika West assemblage slightly less diverse than expected.
Among the more diverse assemblages, the majority (60%) are terminal Pleistocene in age, with four dating to the Allerød and two dating to the YD. The reverse is true for the less-diverse assemblages, where less than 40% date to the terminal Pleistocene: two dating to the Allerød and one to the YD. Fifty percent of the less diverse assemblages are middle Holocene in age (Figure 15). For each Nenana valley assemblage, Figure 17 compares the relative frequencies of total number of rhyolite artifacts with the number of rhyolite groups represented. Through time, there is a trend in decreasing diversity of rhyolite types relative to the total amount of rhyolite in each assemblage, especially after the early Holocene. There are recognizable spatial patterns in these diversity data (Figure 1 and Figure 15). An equal number of less-diverse assemblages are located on either side of the river; however, 70% of the more-diverse assemblages are located west of the river.

6. Discussion

Humans develop mobility and provisioning strategies in response to environmental conditions and the local lithic landscape [68,73,74]. Understanding the lithic landscape is critical when interpreting adaptive behavior. Study survey results show the Nenana valley is extremely limited in high-quality, easily knappable materials (e.g., rhyolites), comprised of mostly hard-to-knap, low-quality quartzes, schists, and quartzites. Rhyolite availability is limited in Nenana valley outcrops and alluvium. Geochemical analysis coupled with geological survey has resulted in the discovery of only one new rhyolite source, Triple Lakes, found within Denali National Park and Preserve boundaries. Further, this study confirms two previously reported source areas, Calico Creek and Talkeetna Mountains [95] and demonstrates their presence in Nenana valley archaeological assemblages. It also confirms eight previously reported geographically unknown rhyolite artifact groups [95] and reports an additional four geochemically distinct rhyolite groups without known source locations. Discovery of a new geographically known source, additional unknown rhyolite groups, and confirmation of previously reported source areas and geochemical rhyolite groups provide more specific descriptions about rhyolite transport, provisioning, and landscape knowledge.

6.1. Rhyolite Transport

The overarching chronological patterns recognized here suggest continuous reliance on transporting local rhyolite groups (A in particular) from the initial occupation of the valley onward, but that most rhyolite outcrops in the valley, Sugarloaf Mountain, Ferry Group, and Triple Lakes, were not very desirable to any foragers no matter when or where they were operating within the region. Nenana valley occupants in all time periods chose to supplement local groups (A, B, and I) with nonlocal rhyolites. Rhyolite from the Talkeetna Mountains source area was transported over 200 km to the Nenana valley, and Calico Creek transported ~40–50 km, in addition to groups C, D, E, F, J, K, L, M, and N, which were presumably transported from unknown sources outside of the valley.
Examining distributions of concentrations of each rhyolite artifact group may reveal information regarding source location (Figure 12). Group A cortical pieces are concentrated in far northern sites and may have originated from a northern source location, confirming an observation offered by Coffman and Rasic [95]. Group B artifacts and cortical pieces are similarly concentrated in the foothills and northern sites, and may also originate from the north, broadly consistent with a source origin in the central Alaska Range posited by Coffman and Rasic [95]. Like groups A and B, Group I has wide distribution among all sites in the valley but rhyolite artifact numbers and cortex values are highest at Owl Ridge, perhaps indicating a western source origin. Group J artifacts and cortical pieces are concentrated towards the east (Moose Creek C1, C2, C4, and Walker Road), supporting a possible source location east of the Nenana River, perhaps in the eastern Alaska Range or middle Tanana valley. Overall, spatial patterns show slightly more rhyolite groups found in assemblages on the west side of the Nenana River, suggesting more rhyolite sources occur to the west. For example, groups C, F, L, M, and N are absent in assemblages east of the Nenana River. Similarly, Coffman and Rasic [95] suggested a western origin in the Kuskokwim Mountains for Group C. Spatial trends of known sources may also reveal patterns of movement. Pieces of Triple Lakes rhyolite are few, but this rhyolite is found at just two archaeological sites 40–50 km north of the source outcrop, perhaps indicative of movement of this rhyolite from south to north (or extensive but rare occurrence in the region’s alluvium). Rhyolite from the Talkeetna Mountains source area also seems to have been carried in a south-to-north direction because it was found in six sites in this study, Moose Creek, Walker Road, Dry Creek, Little Panguingue Creek, Panguingue Creek, and Houdini Creek. Specifically, it is missing from the two most southern sites in the Nenana valley, more proximate to the Talkeetna Mountains.
Transport expectations are only partially met when focusing on the sourced raw materials. For example, regarding the expectation of increased frequency of a rhyolite source in nearby site assemblages, Triple Lakes and Calico Creek sources are expected to be used more in the Nenana valley compared with use of the more distant Talkeetna Mountains source area; however, neither Triple Lakes nor Calico Creek sources are prevalent in Nenana valley assemblages. Artifacts on Triple Lakes rhyolite number just three and are found in only two sites, Owl Ridge and Moose Creek. Calico Creek rhyolite numbers 23 artifacts from just four sites (see [95], Table 6). Though Talkeetna Mountains rhyolite occurs in low frequencies, it is distributed in six different site assemblages. Nevertheless, none of these three nonlocal sources were used in every site nor in the frequencies documented for groups A, B, and I. Regarding expectations of finding low frequencies of cortex on distant, or nonlocal toolstones, Triple Lakes provides an interesting case. Although considered a nonlocal source, it preserves cortex on a single artifact at Owl Ridge despite being located at nearly the opposite end of the valley from this site. Perhaps more confounding and counter to the expectations laid out here is the distribution of cortical pieces for the Calico Creek and Talkeetna Mountains rhyolites. Sites in the Nenana valley with cortex on these source materials are concentrated in the north, and therefore traveled the farthest. These observations rely on simple distance measures, not on specific pathways (e.g., least-cost pathways [165,166]) and cannot account for nuanced decisions made by users of these toolstones. Directional trends discussed here remain somewhat speculative and warrant further testing by increasing the sample size to include interregional comparisons.

6.2. Rhyolite Provisioning Strategies

This study used relative measures of local and nonlocal rhyolites to inform on overall provisioning strategies. Expectations are that humans choosing to provision place would leave behind assemblages with a preponderance of local materials alongside nonlocal materials, while humans engaging in provisioning individuals would leave behind assemblages of mostly nonlocal rhyolites. There are variable patterns in rhyolite provisioning strategies in the Nenana valley through time, and these are discussed below.
During the Allerød, most site assemblages appear to have relied on local rhyolites (mostly A and I), except for Walker Road and Dry Creek (Figure 14; Table 6). Dry Creek (C1) has only one artifact belonging to Group A, the only local group represented in the assemblage, while the remainder (98%) represents nonlocal rhyolite groups, indicative of provisioning individuals. Walker Road is described as a base-camp occupation with an assemblage produced on mostly local materials, reflecting a provisioning place strategy [67,130]. Rhyolites make up nearly 50% of assemblage’s toolstones (Figure 18), and nearly 40% of these consist of nonlocal materials (Figure 14). Because it is suspected to be a base camp, Walker Road is expected to have a mixture of local and nonlocal rhyolites, with local rhyolites possessing relatively high cortex values. The former expectation of an assemblage with both local and nonlocal rhyolite groups is met, but the latter expectation of local rhyolites exhibiting high cortex values is not. Neither local nor nonlocal rhyolites express many cortical pieces. Further, local groups B and I were not selected by Walker Road inhabitants. The Dry Creek C1 and Walker Road assemblages contain the most nonlocal rhyolites of all Allerød-aged sites, reflecting more of a provisioning-individuals pattern for these two earliest sites. The Allerød occupations of Moose Creek C1, Owl Ridge C1, and Eroadaway are described as camps where occupants used primarily local toolstones, supported by geochemical results of the rhyolites reported here [16,41,96,132]. These results indicate a change to more of a provisioning-place strategy near the end of the Allerød.
During the YD, the percentage of nonlocal rhyolites in assemblages decreases compared to Allerød sites. The Moose Creek C2 and Panguingue Creek C1 assemblages are small, but nevertheless contain mostly local rhyolites, while rhyolites at Owl Ridge C2 are exclusively local, indicative of a continuation of a provisioning-place strategy with ever-increasing familiarity of the rhyolite landscape. Previous descriptions of YD technological organization, however, suggest YD populations may have been provisioning individuals because site toolkits were highly standardized, well-planned as part of a mobile land-use system [16,17]. Gore and Graf [16] studied the complete array of raw materials and technological strategies represented at a single site in the foraging system, Owl Ridge, a short-term, special-task site; here the focus is solely on rhyolite use at all sites in the region. The two studies represent two scales of the research, and continued work will be geared toward bringing these varied lines of inquiry together for a more holistic view. For example, individuals operating in a provisioning-place system are expected to still gear up when undertaking task-specific forays at resource extraction sites, especially if there were known local sources of toolstone near the camp. In addition to the presumed local rhyolites in the Owl Ridge assemblage, andesite, too, was used and readily available in the alluvial cobbles within 1 km of the site [16].
During the early Holocene, foragers at Owl Ridge C3, Dry Creek C2, and Little Panguingue Creek continued to utilize predominantly local rhyolites, while at Panguingue Creek C2 the opposite pattern is true. This would seem to indicate humans provisioned place at Owl Ridge, Dry Creek, and Little Panguingue Creek, but provisioned individuals at Panguingue Creek. While place provisioning was likely employed at Owl Ridge [16] and Little Panguingue Creek [55], previous analyses of the Dry Creek C2 assemblage note that overall toolstone procurement was both local and nonlocal with formal, planned technologies, reflecting a mobility strategy emphasizing the provisioning of individuals [56,67]. Therefore, on the spectrum between provisioning individuals and provisioning place, these early Holocene assemblages express a pattern of provisioning place with some individual provisioning represented at Dry Creek and Panguingue Creek, a similar pattern to the one described for the YD interval.
Middle Holocene assemblages exhibit a clear shift back to incorporating more nonlocal rhyolites in their toolkits. Three assemblages, Houdini Creek, Moose Creek C3, and Dry Creek C4, are dominated by nonlocal rhyolites, expressing the provisioning of individual foragers. The remaining sites are dominated by local rhyolites, representing provisioning of place. Overall, this pattern resembles that identified for the earliest few hundred years of human occupation in the Nenana valley.

6.3. Rhyolite Diversity

Rhyolite group diversity helps us estimate degree of landscape knowledge. This assumes that landscape novices will procure fewer local rhyolite groups because they are unfamiliar with where to find these resources, and they will bring more nonlocal rhyolites with them to reduce the risk of not finding adequate toolstone [87,160,162,167,168,169]. As foragers learn the landscape, they will encounter new, local resources and gradually incorporate them into their toolkits, ultimately resulting in less-diverse assemblages. Much of this variability likely reflects different site functionality. Base camps accumulate more artifact and raw material diversity, whereas special-task sites express less diverse, task-specific assemblages [154]. In this study of rhyolite use, there are two important trends to highlight. First, the majority of more-diverse-than-expected Nenana valley assemblages date to the terminal Pleistocene, especially the Allerød interval (Figure 15, Figure 16 and Figure 17). This behavior fits our model of landscape learners entering a new landscape. Second, middle Holocene sites demonstrate less diversity than expected. Beringian foragers in the Nenana valley during the terminal Pleistocene were engaged in landscape learning, while Holocene foragers increasingly accumulated landscape knowledge.
Landscape Learning. Together, rhyolite transport, provisioning, and diversity can elucidate patterns in landscape learning processes through time. Expectations of this study are that landscape learners would have provisioned individuals with mostly nonlocal rhyolites because they did not yet know where to find local rhyolites, while landscape experts would have known where to obtain local materials and provisioned place with mostly local rhyolites. In the two oldest sites of the Allerød interval, Dry Creek C1 (~13.5 ka) and Walker Road (~14–13.3 ka), there is more nonlocal rhyolite than expected, suggesting the earliest inhabitants of the Nenana valley were bringing rhyolite materials to the valley. Both early sites express mixed patterns of provisioning, yet there is a strong current of provisioning individuals. Diversity within the Dry Creek C1 assemblage is among the highest of all sites. For example, Group N is only found in the Dry Creek C1 assemblage. Though the Walker Road assemblage falls below the regression line in Figure 15, because of its large sample size, it still expresses a considerable amount of diversity in rhyolite groups compared to many other site assemblages in the valley. Despite this diversity, local rhyolite groups A, B, and I were virtually unused and unknown, while these earliest foragers were using the Talkeetna Mountains source, located ~200 km away. Together, these data suggest the Dry Creek C1 and Walker Road assemblages represent forager groups still learning the nuances of the Nenana valley lithic landscape.
After 13.3 ka, foragers in the Nenana valley began using more local raw materials and increasingly engaged in a provisioning place strategy supported by deep knowledge of high-quality rhyolite sources. This pattern continues through the YD when reliance on distant rhyolite sources is reduced, except for Talkeetna Mountains and Group J. Results indicate C, L, and Triple Lakes groups remained unknown until the early Holocene, indicating humans were still building complete knowledge of local toolstone; alternatively, groups C and L may have been located high in the mountains and remained under glacial cover. During the early Holocene, transport was predominantly local, and people were provisioning place, but more nonlocal sources were being used compared to the late Allerød and YD. All rhyolite groups are represented at this time except M and N which were known and used by the earliest people to enter the Nenana valley.
By 8 ka, assemblages exhibit more nonlocal rhyolites overall, however, these are represented by fewer groups. In other words, nonlocal rhyolite diversity falls precipitously. This suggests these hunter-gatherers were selectively provisioning individuals, coupling this strategy with provisioning of place when needed. Middle Holocene foragers had become familiar enough with regional rhyolite sources to deftly practice a strategy relying on gearing up for special tasks and provisioning place as needed.

6.4. Paleoenvironment and Human Settlement of the Nenana Valley

This examination of rhyolite procurement and use in the Nenana valley shows a pattern of initial landscape learning and settling in, followed by a quick accumulation of nuanced knowledge. Learning a landscape is achieved through the gathering of environmental information [85,86,87,88,89,90,91,92,93,94,95,96,97,98,99,100,101,102,103,104,105,106,107,108,109,110,111,112,113,114,115,116,117,118,119,120,121,122,123,124,125,126,127,128,129,130,131,132,133,134,135,136,137,138,139,140,141,142,143,144,145,146,147,148,149,150,151,152,153,154,155,156,157,158,159,160,161]; therefore, this process is contextualized by considering how fluctuating climate regimes shaped the region’s environments and influenced human behavioral response. The earliest Allerød assemblages (~14–13.3 ka) reflect humans subsisting in an environment transitioning from a treeless, xeric herb-tundra to a more mesic shrub-tundra. During the latter climatic regime there was an increase in archaeological visibility, representing human expansion into the Alaskan interior. The Allerød landscape supported a variety of large- and small-game resources procured by humans (e.g., bison, wapiti, and waterfowl) and perhaps provided more woody vegetation for fueling fires used for cooking and warmth compared with the herb-tundra of pre-Allerød times [128]. If the expansion of shrub-tundra brought about increased fuel opportunities while supporting plentiful ungulate populations, this environmental transition may have been key in enabling humans to expand, explore, and successfully establish themselves in the region. This, in addition to the high surface visibility offered by a shrub-tundra landscape, enabled initial valley occupants to successfully accumulate specific locational knowledge of toolstone sources beyond the largest, most visible ones. It seems initial humans arriving in the Nenana valley during the early Allerød brought high-quality rhyolite (and obsidian [91]) from outside the area but were less knowledgeable of local rhyolites. Through the end of the Allerød and into the YD, visitors to the valley had gained enough local knowledge to map onto several local rhyolite sources.
By contrast, Holocene rhyolite use suggests a more complete and nuanced knowledge of the local and regional lithic landscape, but there is a general decrease in diversity among Holocene assemblages compared to late Pleistocene assemblages. Arrival of the HTM is marked by transition from a shrub-tundra to boreal-forest biome with warmer and more mesic conditions, peatland, conifer expansion, and range restriction of both small and large fauna [170,171,172]. While wood-fuel would have been plentiful, gregarious animals (e.g., caribou) would have been accessed seasonally in uplands, with more solitary species (e.g., moose and bear) being more common throughout the region. In response, human land-use patterns changed, and technologies shifted [14,22,23,173,174]. Given these shifting environmental conditions and subsequent behavioral adaptations, perhaps some rhyolites were no longer cost-effective to procure despite persisting knowledge of source locations. In addition, a decrease in rhyolite diversity could indicate that some sources were less visible or accessible because of boreal-forest cover, more months with snow cover, difficulty crossing glacially fed streams and rivers during warm summers, or limited accessibility due to increased glacio-fluvial erosion, especially during the early Holocene. Regardless, these environmental conditions did not completely prohibit access to all high-quality rhyolites because many continued to be used in the Nenana valley.

7. Conclusions

The overarching goal of this study was to contribute to the nascent body of raw material studies in eastern Beringia by establishing the local lithic landscape of the Nenana valley and investigating rhyolite use through a geochemical and behavioral approach. Raw material surveys completed to date show that high-quality raw materials are limited in quantity, availability, and even distribution within the region. In the case of rhyolites, several outcrops are available within the valley, but geochemical comparison indicates most of these geological outcrops were not utilized by prehistoric humans. Only a few known sources were used sporadically, one being the newly identified Triple Lakes source. It seems these were never compelling sources of toolstone for Alaskans. Work reported here provides compelling support for most rhyolite procurement elsewhere, perhaps deeper within upland settings of the Alaska Range as posited by Coffman and Rasic [95]. Clearly the use of the Talkeetna Mountains source area is a good example of upland source exploitation. Perhaps groups A, B, and I will eventually be found in similar upland contexts.
Several interesting patterns in rhyolite use are evident from the incorporation of pXRF geochemistry and lithic analyses. First, a broad number of rhyolites were used from the earliest visible occupation of the Nenana valley through the middle Holocene. Ancient Alaskans inhabiting the valley during the Allerød provisioned their sites with a wide variety of local and nonlocal materials, showing that they had sufficient knowledge of raw material locations in the greater interior region of Alaska [67,91,95,175,176]. All geochemically identified rhyolites appearing within Allerød assemblages, except one, continue to be used by humans within the Nenana valley into the Holocene, further suggesting humans at this time were already engaged in learning the local lithic landscape. However, the absence of rhyolites seen later in Holocene assemblages indicates landscape knowledge was incomplete. As the shrub-tundra transitioned to a boreal-forest regime in interior Alaska, landscape knowledge appears to have increased as new local rhyolites were procured by Nenana valley inhabitants. By 8 ka, the Indigenous peoples of interior Alaska had become rhyolite experts. During this time there is an increase in the use of nonlocal rhyolites and a concurrent decrease in rhyolite diversity, perhaps because the warm temperatures and boreal cover of the HTM brought about different constraints and opportunities, such as decreased rhyolite visibility and accessibility and/or seasonal focus on caribou hunting which likely led to a need for traveling greater distances to social aggregation sites during caribou hunting season. This may have brought about the opportunity to easily embed procurement of distant rhyolites (i.e., Talkeetna Mountains source) [20,71,177].
This study shows that locations of high-quality rhyolites in interior Alaska were understood and valued as significant raw material sources from the earliest occupation of the Nenana valley throughout the Holocene, implying that the process of landscape learning happened quickly upon arrival. Questions remain, however, about the degree to which the complexity of this landscape knowledge was affected by environmental constraints, provisioning strategies, and/or settlement patterns. The limited archaeological record and scope of this study permitted discussion of just a few aspects of human behavior. To unravel the complexities of these behaviors as reflected in the lithic record, further studies incorporating toolstone sourcing and assemblage studies must be conducted at the local and regional level to clarify behavioral strategies underlying patterns described here. Doing so will elucidate a more holistic picture of the complex behaviors that contributed to lithic provisioning, mobility, and behavioral adaptation in prehistoric Alaska.
Continuing systematic, region-wide raw material surveys in interior Alaska is integral in the search for geographic locations of rhyolite sources. Geochemically characterizing new rhyolite sources is essential in anchoring geochemical rhyolite groups to known source locations and providing further insight into mobility patterns. Such legwork will eventually untangle questions of technological provisioning and use, including full characterization of lithic landscapes, landscape knowledge, technological needs, mobility strategies, seasonal landscape use, climate regimes, social interaction, trade, and exchange.

Supplementary Materials

The following supporting information can be downloaded at: https://www.mdpi.com/article/10.3390/min13091146/s1, Table S1: Raw material survey results of samples collected from select alluvial locations; Table S2: Principal component eigenvalues and variance for rhyolite outcrop samples; Table S3: Principal component eigenvalues and variance for rhyolite outcrop and alluvial samples; Table S4: Principal component eigenvalues and variance for rhyolite artifact samples; Table S5: Principal component eigenvalues and variance for rhyolite artifact and alluvium samples; Table S6: Principal component eigenvalues and variance for rhyolite artifact and outcrop samples; Table S7: Rhyolite outcrop group membership probabilities.

Author Contributions

Conceptualization, A.K.G. and K.G.; methodology, A.K.G.; formal analysis, A.K.G.; investigation, A.K.G. and J.J.L.; resources, A.G and K.G.; data curation, A.K.G.; writing—original draft preparation, A.K.G.; writing—review and editing, J.J.L.; supervision, A.K.G. and K.G.; visualization, A.K.G.; project administration, A.K.G.; funding acquisition, A.K.G. All authors have read and agreed to the published version of the manuscript.

Funding

This research was funded by the National Science Foundation Doctoral Dissertation Improvement Grant number 1838679; the American Philosophical Society Lewis and Clark Fund; the Elfrieda Frank Foundation; and the Dr. Roy J. Shlemon Field Geoarchaeology Fund, Center for the Study of the First Americans.

Data Availability Statement

The data presented in this study are available in study Supplementary Materials and upon request from the corresponding author.

Acknowledgments

Thanks to the University of Alaska Fairbanks Museum of the North for providing access to collections, to Sam Coffman for his accommodating help, to Heather Smith, Adam Burke, and Jim Geyser for their field assistance, alongside the 2016 and 2017 Texas A&M field schools crews. Thanks to the Center for the Study of the First Americans at Texas A&M for providing access to their Bruker Tracer portable XRF machine. Lastly, thank you to the anonymous reviewers whose comments greatly improved this manuscript.

Conflicts of Interest

The authors declare no conflict of interest.

References

  1. Flegontov, P.; Altınışık, N.E.; Changmai, P.; Rohland, N.; Mallick, S.; Adamski, N.; Bolnick, D.A.; Broomandkhoshbacht, N.; Candilio, F.; Culleton, B.J.; et al. Palaeo-Eskimo genetic ancestry and the peopling of Chukotka and North America. Nature 2019, 570, 236–240. [Google Scholar] [CrossRef] [PubMed]
  2. Fu, Q.; Meyer, M.; Gao, X.; Stenzel, U.; Burbano, H.A.; Kelso, J.; Pääbo, S. DNA Analysis of an Early Modern Hu-mans from Tianyuan Cave, China. Proc. Natl. Acad. Sci. USA 2013, 110, 2223–2227. [Google Scholar] [CrossRef]
  3. Graf, K.E.; Buvit, I. Human Dispersal from Siberia to Beringia: Assessing a Beringian Standstill in Light of the Archaeological Evidence. Curr. Anthropol. 2017, 58, S583–S603. [Google Scholar] [CrossRef]
  4. He, Y.; Wang, W.R.; Li, R.; Wang, S.; Jin, L. Genetic Divergence Disclosing a Rapid Prehistorical Dispersion of Native Americans in Central and South America. PLoS ONE 2012, 7, e44788. [Google Scholar] [CrossRef] [PubMed]
  5. Hoffecker, J.F.; Elias, S.A.; O’Rourke, D.H. Out of Beringia? Sci. Perspect. 2014, 343, 979–980. [Google Scholar] [CrossRef] [PubMed]
  6. Moreno-Mayar, J.V.; Potter, B.A.; Vinner, L.; Steinrücken, M.; Rasmussen, S.; Terhorst, J.; Kamm, J.A.; Albrechtsen, A.; Malaspinas, A.-S.; Sikora, M.; et al. Terminal Pleistocene Alaskan genome reveals first founding population of Native Americans. Nature 2018, 553, 203–207. [Google Scholar] [CrossRef]
  7. Moreno-Mayar, J.V.; Vinner, L.; de Barros Damgaard, P.; De La Fuente, C.; Chan, J.; Spence, J.P.; Allentoft, M.E.; Vimala, T.; Racimo, F.; Willerslev, E.; et al. Early Human Dispersals within the Americas. Science 2018, 362, eaav2621. [Google Scholar] [CrossRef] [PubMed]
  8. Raff, J.A.; Bolnick, D.A. Palaeogenomics: Genetic roots of the first Americans. Nature 2014, 506, 162–163. [Google Scholar] [CrossRef]
  9. Raghavan, M.; Skoglund, P.; Graf, K.E.; Metspalu, M.; Albrechtsen, A.; Moltke, I.; Rasmussen, S.; Stafford, T.W., Jr.; Orlando, L.; Metspalu, E.; et al. Upper Paleolithic Siberian Genome Reveals Dual Ancestry of Native Americans. Nature 2014, 505, 87–91. [Google Scholar] [CrossRef]
  10. Reich, D.; Patterson, N.; Campbell, D.; Tandon, A.; Mazieres, S.; Ray, N.; Parra, M.V.; Rojas, W.; Duque, C.; Mesa, N.; et al. Reconstructing Native American Population History. Nature 2012, 488, 370–374. [Google Scholar] [CrossRef]
  11. Sikora, M.; Pitulko, V.; Sousa, V.C.; Allentoft, M.E.; Vinner, L.; Rasmussen, S.; Margaryan, A.; de Barros Damgaard, P.; de la Fuente, C.; Renaud, G.; et al. The Population History of Northeastern Siberia Since the Pleistocene. Nature 2019, 570, 182–188. [Google Scholar] [CrossRef] [PubMed]
  12. Skoglund, P.; Mallick, S.; Bortolini, M.C.; Chennagiri, N.; Hünemeier, T.; Petzl-Erler, M.L.; Salzano, F.M.; Patterson, N.; Reich, D. Genetic evidence for two founding populations of the Americas. Nature 2015, 525, 104–108. [Google Scholar] [CrossRef] [PubMed]
  13. Wells, R.S.; Yuldasheva, N.; Ruzibakiev, R.; Underhill, P.A.; Evseeva, I.; Blue-Smith, J.; Jin, L.; Su, B.; Pitchappan, R.; Shanmu-galakshmi, S.; et al. The Eurasian Heartland: A Continental Perspective on Y-Chromosome Diversity. Proc. Natl. Acad. Sci. USA 2001, 98, 10244–10249. [Google Scholar] [CrossRef]
  14. Esdale, J.A. A Current Synthesis of the Northern Archaic. Arct. Anthr. 2008, 45, 3–38. [Google Scholar] [CrossRef]
  15. Ackerman, R.E. Microblade Assemblages in Southwestern Alaska: An Early Holocene Adaptation. In From the Yenisei to the Yukon: Interpreting Lithic Assemblage Variability in Late Pleistocene/Early Holocene Beringia; Goebel, T., Buvit, I., Eds.; Texas A&M University Press: College Station, TX, USA, 2011; pp. 255–269. [Google Scholar]
  16. Gore, A.K.; Graf, K.E. Technology and Human Response to Environmental Change at the Pleistocene-Holocene Boundary in Eastern Beringia: A View from Owl Ridge, Central Alaska. In Lithic Technological Organization and Paleoenvironmental Change: Global and Diachronic Perspectives; Robinson, E., Sellet, F., Eds.; Springer: Cham, Switzerland, 2018; pp. 203–234. [Google Scholar]
  17. Graf, K.E.; Bigelow, N.H. Human Response to Climate During the Younger Dryas Chronozone in Central Alaska. Quat. Int. 2011, 242, 434–451. [Google Scholar] [CrossRef]
  18. Hoffecker, J.F. Late Pleistocene and Early Holocene Sites in the Nenana River Valley, Central Alaska. Arct. Anthropol. 2001, 38, 139–153. [Google Scholar]
  19. Holmes, C.E. The Beringian and Transitional Periods in Alaska: Technology of the East Beringian Tradition as Viewed from Swan Point. In From the Yenisei to the Yukon: Interpreting Lithic Assemblage Variability in Late Pleistocene/Early Holocene Beringia; Goebel, T., Buvit, I., Eds.; Texas A&M University Press: College Station, TX, USA, 2011; pp. 179–191. [Google Scholar]
  20. Mason, O.K.; Bowers, P.M.; Hopkins, D.H. The early Holocene Milankovitch Thermal Maximum and Humans: Adverse Conditions for the Denali Complex of Eastern Beringia. Quat. Sci. Rev. 2001, 20, 525–548. [Google Scholar] [CrossRef]
  21. Odess, D.; Rasic, J.T. Toolkit Composition and Assemblage Variability: The Implications of Nogahabara I, Northern Alaska. Am. Antiq. 2007, 72, 691–718. [Google Scholar] [CrossRef]
  22. Potter, B.A. Radiocarbon Chronology of Central Alaska: Technological Continuity and Economic Change. Radiocarbon 2008, 50, 181–204. [Google Scholar] [CrossRef]
  23. Potter, B.A. Exploring Models of Intersite Variability in Mid to Late Holocene Central Alaska. Arctic 2008, 61, 407–425. [Google Scholar]
  24. Potter, B.A.; Holmes, C.E.; Yesner, D.R. Technology and Economy Among the Earliest Prehistoric Foragers in interior Eastern Beringia. In Paleoamerican Odyssey; Graf, K.E., Ketron, C.V., Waters, M.R., Eds.; Texas A&M University Press: College Station, TX, USA, 2014; pp. 81–103. [Google Scholar]
  25. West, F.H. (Ed.) The Archaeological Evidence. In American Beginnings: The Prehistory and Palaeoecology of Beringia; University of Chicago Press: Chicago, IL, USA, 1996; pp. 537–559. [Google Scholar]
  26. Wygal, B.T. The Microblade/Non-Microblade Dichotomy: Climatic Implications, Toolkit Variability and the Role of Tiny Tools in Eastern Beringia. In From the Yenisei to the Yukon: Interpreting Lithic Assemblage Variability in Late Pleistocene/Early Holocene Beringia; Goebel, T., Buvit, I., Eds.; Texas A&M University Press: College Station, TX, USA, 2011; pp. 234–254. [Google Scholar]
  27. Graf, K.E.; DiPietro, L.M.; Krasinski, K.E.; Gore, A.K.; Smith, H.L.; Culleton, B.J.; Kennett, D.J.; Rhode, D. Dry Creek Revisited: New Excavations, Radiocarbon Dates, and Site Formation Inform on the Peopling of Eastern Beringia. Am. Antiq. 2015, 80, 671–694. [Google Scholar] [CrossRef]
  28. Graf, K.E.; Gore, A.K.; Melton, J.A.; Marks, T.; DiPietro, L.; Goebel, T.; Waters, M.R.; Rhode, D. Recent excavations at Owl Ridge, interior Alaska: Site stratigraphy, chronology, and site formation and implications for late Pleistocene archaeology and peopling of eastern Beringia. Geoarchaeology 2019, 35, 3–26. [Google Scholar] [CrossRef]
  29. McLaren, D.; Fedje, D.; Mackie, Q.; Davis, L.G.; Erlandson, J.; Gauvreau, A.; Vogelaar, C. Late Pleistocene Archaeological Discovery Models on the Pacific Coast of North America. PaleoAmerica 2020, 6, 43–63. [Google Scholar] [CrossRef]
  30. Potter, B.A.; Baichtal, J.F.; Beaudoin, A.B.; Fehren-Schmitz, L.; Haynes, C.V.; Holliday, V.T.; Holmes, C.E.; Ives, J.W.; Kelly, R.L.; Llamas, B.; et al. Current evidence allows multiple models for the peopling of the Americas. Sci. Adv. 2018, 4, eaat5473. [Google Scholar] [CrossRef] [PubMed]
  31. Esdale, J.A. Lithic Production Sequences and Toolkit Variability: Examples from the Middle Holocene, Northwest Alaska. Ph.D. Thesis, Department of Anthropology, Brown University, Providence, RI, USA, 2009. [Google Scholar]
  32. Reuther, J.D.; Holmes, C.E.; Smith, G.M.; Lanoe, F.B.; Crass, B.A.; Rowe, A.G.; Wooller, M.J. The Swan Point Site, Alaska: The Chronology of a Multi-Component Archaeological Site in Eastern Beringia. Radiocarbon 2023, 65, 693–720. [Google Scholar] [CrossRef]
  33. Bourgeon, L.; Burke, A.; Higham, T. Earliest Human Presence in North America Dated to the Last Glacial Maximum: New Radiocarbon Dates from Bluefish Caves, Canada. PLoS ONE 2017, 12, e0169486. [Google Scholar] [CrossRef]
  34. Cinq-Mars, J. 2001 On the Significance of Modified Mammoth Bones from Eastern Beringia. In La Terra Degli Elefanti the World of Elephants, Proceedings of the 1st International Congress, Rome, Italy, 16–20 October 2001; Cavarretta, G., Gioia, P., Mussi, M., Palumbo, M.R., Eds.; Consiglio Nazionale delle Ricerche: Rome, Italy, 2001; pp. 424–428. [Google Scholar]
  35. Gómez Coutouly, Y.A.; Holmes, C.E. The Microblade Industry from Swan Point Cultural Zone 4b: Techno-logical and Cultural Implications from the Earliest Human Occupation in Alaska. Am. Antiq. 2018, 83, 735–752. [Google Scholar] [CrossRef]
  36. Hirasawa, Y.; Holmes, C.E. The relationship between microblade morphology and production technology in Alaska from the perspective of the Swan Point site. Quat. Int. 2017, 442, 104–117. [Google Scholar] [CrossRef]
  37. Goebel, T.; Powers, W.R.; Bigelow, N.H. The Nenana Complex of Alaska and Clovis Origins. In Clovis: Origins and Adaptations; Bonnichsen, R., Turnmire, K.L., Eds.; Center for the Study of the First Americans: Corvallis, OR, USA, 1991; pp. 49–79. [Google Scholar]
  38. Goebel, T.; Waters, M.R.; Dikova, M. The Archaeology of Ushki Lake, Kamchatka, and the Pleistocene Peopling of the Americas. Science 2003, 301, 501–505. [Google Scholar] [CrossRef]
  39. Goebel, T.; Slobodin, S.B.; Waters, M.R. New Dates from Ushki-1, Kamchatka, Confirm 13,000 cal BP Age for Earliest Paleolithic Occupation. J. Archaeol. Sci. 2010, 37, 2640–2649. [Google Scholar] [CrossRef]
  40. Graf, K.E.; Goebel, T. The Paleolithic of Eastern Beringia from Western Alaska to Canadian Yukon. In Human Colonization of the Arctic; the Interaction Between Early Migration and the Paleoenvironment; Kotlyakov, V.M., Velichko, A.A., Vasil’ev, S.A., Eds.; Academic Press: Cambridge, MA, USA, 2017; pp. 311–338. [Google Scholar]
  41. Pearson, G.A. Early Occupations and Cultural Sequence at Moose Creek: A Late Pleistocene Site in Central Alaska. Arctic 1999, 52, 332–345. [Google Scholar] [CrossRef]
  42. Pitulko, V.V.; Nikolskiy, P.; Basilyan, A.; Pavlova, E. Human Habitation in Arctic Western Beringia Prior to the LGM. In Paleoamerican Odyssey; Graf, K.E., Ketron, C.V., Waters, M.R., Eds.; Texas A&M University Press: College Station, TX, USA, 2014; pp. 15–44. [Google Scholar]
  43. Pitulko, V.V.; Pavlova, E.; Nikolskiy, P. Revising the Archaeological Record of the Upper Pleistocene Arctic Siberia: Human Dispersal and Adaptations in MIS 3 and 2. Quat. Sci. Rev. 2017, 165, 127–148. [Google Scholar] [CrossRef]
  44. Goebel, T.; Pontti, L. The Chindadn Point: A New Type Fossil for the Beringian Paleolithic. Occasional Paper 4. In Circumpolar Modeling of Climatic Change; University of Alaska Museum, Alaska Quaternary Center: Fairbanks, Alaska; pp. 103–114.
  45. Goebel, T.; Potter, B. First Traces: Late Pleistocene Human Settlement in the Arctic. In The Oxford Handbook of the Prehistoric Arctic; Friesen, M., Mason, O., Eds.; Oxford University Press: Oxford, UK, 2016; pp. 223–252. [Google Scholar]
  46. Younie, A.M. Linda’s Point and the Village Site: A New Look at the Chindadn Complex and Archaeological Record at Healy Lake, Alaska. Ph.D. Thesis, Department of Anthropology, Texas A&M University, College Station, TX, USA, 2015. [Google Scholar]
  47. Gaglioti, B.V.; Mann, D.H.; Wooller, M.J.; Jones, B.M.; Wiles, G.C.; Groves, P.; Kunz, L.M.; Baughman, C.A.; Reanier, R.E. Younger-Dryas Cooling and Sea-Ice Feedbacks Were Prominent Features of the Pleistocene-Holocene Transition in Arctic Alaska. Quat. Sci. Rev. 2017, 169, 330–343. [Google Scholar] [CrossRef]
  48. Mochanov, Y.A. Drevneishie Etapy Zaselenia Chelovekom Severo-Vostochnoi Azii; Nauka: Novosibirsk, Russia, 1977. [Google Scholar]
  49. Dikov, N.N.; Powers, R. The Discovery of the Palaeolithic in Kamchatka and the Problem of the Initial Occupation of America. Arct. Anthropol. 1968, 5, 191–203. [Google Scholar]
  50. Buvit, I.; Rasic, J.T.; Kuehn, S.R.; Hedman, W.H. Fluted projectile points in a stratified context at the Raven Bluff site document a late arrival of Paleoindian technology in northwest Alaska. Geoarchaeology 2018, 34, 3–14. [Google Scholar] [CrossRef]
  51. Goebel, T.; Smith, H.L.; DiPietro, L.; Waters, M.R.; Hockett, B.; Graf, K.E.; Gal, R.; Slobodin, S.B.; Speakman, R.J.; Driese, S.G.; et al. Serpentine Hot Springs, Alaska: Results of excavations and implications for the age and significance of northern fluted points. J. Archaeol. Sci. 2013, 40, 4222–4233. [Google Scholar] [CrossRef]
  52. Kunz, M.L.; Reanier, R.E. The Mesa Site: A Paleoindian Hunting Lookout in Arctic Alaska. Arct. Anthropol. 1995, 32, 5–30. [Google Scholar]
  53. Smith, H.L.; Rasic, J.T.; Goebel, T. Biface Traditions of Northern Alaska and Their Role in the Peopling of the Americas. In Paleoamerican Odyssey; Graf, K.E., Ketron, C.V., Waters, M.R., Eds.; Texas A&M University Press: College Station, TX, USA, 2014; pp. 105–123. [Google Scholar]
  54. Bowers, P.M. The Carlo Creek Site: Geology and Archaeology of an Early Holocene Site in the Central Alaska Range; Occasional Papers No. 27, Anthropology and Historic Preservation Cooperative Park Series Unit; University of Alaska: Fairbanks, AK, USA, 1980. [Google Scholar]
  55. Gómez Coutouly, Y.A.; Graf, K.E.; Gore, A.K.; Goebel, T. Little Panguingue Creek: A c. 9600 Year Old Prehistoric Knapping Workshop in the Nenana Valley, Central Alaska. PaleoAmerica 2019, 5, 16–31. [Google Scholar] [CrossRef]
  56. Powers, W.R.; Guthrie, R.D.; Hoffecker, J.F.; Goebel, T. Dry Creek: Archaeology and Paleoecology of a Late Pleistocene Alaskan Hunting Camp; Texas A&M University Press: College Station, TX, USA, 2017. [Google Scholar]
  57. Hare, P.G.; Greer, S.; Gotthardt, R.; Farnell, R.; Bowyer, V.; Schweger, C.; Strand, D. Ethnographic and Archaeological Investigations of Alpine Ice Patches in Southwest Yukon, Canada. Arctic 2004, 57, 260–272. [Google Scholar] [CrossRef]
  58. Hare, P.G.; Thomas, C.D.; Topper, T.N.; Gotthardt, R.M. The Archaeology of Yukon Ice Patches: New Artifacts, Observations, and Insights. Arctic 2012, 65, 118–135. [Google Scholar] [CrossRef]
  59. Rasic, J.T. Functional Variability in the Late Pleistocene Archaeological Record of Eastern Beringia: A Model of Late Pleistocene Land Use and Technology from Northwest Alaska. In From the Yenisei to the Yukon: Interpreting Lithic Assemblage Variability in Late Pleistocene/Early Holocene Beringia; Goebel, T., Buvit, I., Eds.; Texas A&M University Press: College Station, TX, USA, 2011; pp. 128–165. [Google Scholar]
  60. Ackerman, R.E. The Northern Archaic Tradition in Southwestern Alaska. Arct. Anthr. 2004, 41, 153–162. [Google Scholar] [CrossRef]
  61. Anderson, D.D. A Stone Age Campsite at the Gateway to America. Sci. Am. 1968, 218, 24–33. [Google Scholar] [CrossRef]
  62. Anderson, D.D. Onion Portage: The Archaeology of a Stratified Site from the Kobuk River, Northwest Alaska. In Anthropological Papers of the University of Alaska; University of Alaska: Fairbanks, AK, USA, 1988; Volume 22, pp. 1–2. [Google Scholar]
  63. Giddings, J.L. The Archaeology of Cape Denbigh; Brown University Press: Providence, RI, USA, 1964. [Google Scholar]
  64. Giddings, J.L.; Anderson, D.D. Beach Ridge Archaeology of Cape Krusenstern National Monument; Publications in Archaeology, No. 20; National Park Service: Washington, DC, USA, 1986. [Google Scholar]
  65. Potter, B.A. Models of faunal processing and economy in Early Holocene interior Alaska. Environ. Archaeol. 2007, 12, 3–23. [Google Scholar] [CrossRef]
  66. Rasic, J.T.; Slobodina, N.S. Weapon Systems and Assemblage Variability During the Northern Archaic Period in Northern Alaska. Arct. Anthropol. 2008, 45, 71–88. [Google Scholar] [CrossRef]
  67. Graf, K.; Goebel, T. Upper Paleolithic Toolstone Procurement and Selection at the Sites of Dry Creek, Alaska and Ushki-5, Russia. In Lithic Materials and Paleolithic Societies; Blades, B., Adams, B., Eds.; Blackwell Publishers: London, UK, 2009; pp. 54–77. [Google Scholar]
  68. Kuhn, S.L. Mousterian Lithic Technology: An Ecological Perspective; Princeton University Press: Princeton, NJ, USA, 1995. [Google Scholar]
  69. Kuhn, S.L. Upper Paleolithic Raw Material Economies at Üçağızlı Cave, Turkey. J. Anthropol. Archaeol. 2004, 23, 431–448. [Google Scholar] [CrossRef]
  70. Nelson, M.C. The Study of Technological Organization. In Archaeological Method and Theory; Schiffer, M.B., Ed.; University of Arizona Press: Tucson, AZ, USA, 1991; Volume 3, pp. 57–100. [Google Scholar]
  71. Binford, L.R. Organization and Formation Processes: Looking at Curated Technologies. J. Anthropol. Res. 1979, 35, 255–273. [Google Scholar] [CrossRef]
  72. Binford, L.R. Willow Smoke and Dogs’ Tails: Hunter-Gatherer Settlement Systems and Archaeological Site Formation. Am. Antiq. 1980, 45, 4–20. [Google Scholar] [CrossRef]
  73. Andrefsky, W., Jr. Raw-Material Availability and the Organization of Technology. Am. Antiq. 1994, 59, 21–34. [Google Scholar] [CrossRef]
  74. Andrefsky, W., Jr. The Analysis of Stone Tool Procurement, Production, and Maintenance. J. Archaeol. Res. 2009, 17, 65–103. [Google Scholar] [CrossRef]
  75. Braun, D.R. Examining Flake Production Strategies: Examples from the Middle Paleolithic of Southwest Asia. Lithic Technol. 2005, 30, 107–125. [Google Scholar] [CrossRef]
  76. Elston, R.G. Selection, Planning, and Convenience in Lithic Procurement. N. Am. Archaeol. 2013, 34, 433–450. [Google Scholar] [CrossRef]
  77. Gould, R.A.; Saggers, S. Lithic Procurement in Central Australia: A Closer Look at Binford’s Idea of Embeddedness in Archaeology. Am. Antiq. 1985, 50, 117–136. [Google Scholar] [CrossRef]
  78. Surovell, T.A. Toward a Behavioral Ecology of Lithic Technology: Cases from Paleoindian Archaeology; University of Arizona Press: Tucson, AZ, USA, 2009. [Google Scholar]
  79. Bettinger, R.L. Archaeological Approaches to Hunter-Gatherers. Annu. Rev. Anthropol. 1987, 16, 121–142. [Google Scholar] [CrossRef]
  80. Blades, B.S. Aurignacian lithic economy and early modern human mobility: New perspectives from classic sites in the Vézère valley of France. J. Hum. Evol. 1999, 37, 91–120. [Google Scholar] [CrossRef]
  81. Blumenschine, R.J.; Masao, F.T.; Tactikos, J.C.; Ebert, J.I. Effects of distance from stone source on landscape-scale variation in Oldowan artifact assemblages in the Paleo-Olduvai Basin, Tanzania. J. Archaeol. Sci. 2008, 35, 76–86. [Google Scholar] [CrossRef]
  82. Ford, A. Stone Tool Production-Distribution Systems During the Early Bronze Age at Huizui, China. Master’s Thesis, School of Historical and European Studies, La Trobe University, Melbourne, Australia, 2007. [Google Scholar]
  83. Ford, A. Learning the Lithic Landscape: Using Raw Material Sources to Investigate Pleistocene Colonisation in the Ivane Valley, Papua New Guinea. Archaeol. Ocean. 2011, 46, 42–53. [Google Scholar] [CrossRef]
  84. Kuhn, S.L. Moving on From Here: Suggestions for the Future of “Mobility Thinking” in Studies of Paleolithic Technologies. J. Paleolit. Archaeol. 2020, 3, 664–681. [Google Scholar] [CrossRef]
  85. Rockman, M. Knowledge and Learning in the Archaeology of Colonization. In Colonization of Unfamiliar Landscapes: The Archaeology of Adaptation; Rockman, M., Steele, J., Eds.; Routledge: London, UK, 2003; pp. 3–24. [Google Scholar]
  86. Bamforth, D.B. Technological Efficiency and Tool Curation. Am. Antiq. 1986, 51, 38–50. [Google Scholar] [CrossRef]
  87. Cook, J.P. Characterization and distribution of obsidian in Alaska. Arct. Anthropol. 1995, 32, 92–100. [Google Scholar]
  88. Goebel, T.; Speakman, R.J.; Reuther, J.D. Obsidian from the Late-Pleistocene Walker Road site, Central Alaska. Curr. Res. Pleistocene 2008, 25, 88–90. [Google Scholar]
  89. Grebennikov, A.V.; Kuzmin, Y.V.; Glascock, M.D.; Popov, V.K.; Budnitskiy, S.Y.; Dikova, M.A.; Nozdrachev, E.A. The Lake Krasnoe obsidian source in Chukotka (Northeastern Siberia): Geological and geochemical frameworks for provenance studies in Beringia. Archaeol. Anthr. Sci. 2016, 10, 599–614. [Google Scholar] [CrossRef]
  90. Reimer, R. Reassessing the role of Mount Edziza obsidian in northwestern North America. J. Archaeol. Sci. Rep. 2015, 2, 418–426. [Google Scholar] [CrossRef]
  91. Reuther, J.D.; Slobodina, N.S.; Rasic, J.T.; Cook, J.P.; Speakman, R.J. Gaining momentum: Late Pleistocene and Early Holocene archaeological obsidian source studies in Interior and Northeastern Beringia. In From the Yenisei to the Yukon: Interpreting Lithic Assemblage Variability in Late Pleistocene/Early Holocene Beringia; Goebel, T., Buvit, I., Eds.; Texas A&M University Press: College Station, TX, USA, 2011; pp. 270–286. [Google Scholar]
  92. Slobodina, N.S.; Reuther, J.D.; Rasic, J.T.; Cook, J.P.; Speakman, R.J. Obsidian Procurement and Use at the Dry Creek Site (HEA-005), Interior Alaska. Curr. Res. Pleistocene 2009, 26, 115–117. [Google Scholar]
  93. Speakman, R.J.; Neff, H. The Application of Laser Ablation ICP-MS to the Study of Archaeological Materials an Introduction. In Laser Ablation ICP-MS in Archaeological Research; Speakman, R.J., Neff, H., Eds.; University of New Mexico Press: Albuquerque, NM, USA, 2005; pp. 1–15. [Google Scholar]
  94. Speakman, R.J.; Holmes, C.E.; Glascock, M.D. Source Determination of Obsidian Artifacts from Swan Point (XBD-156), Alaska. Curr. Res. Pleistocene 2007, 24, 86–88. [Google Scholar]
  95. Coffman, S.; Rasic, J.T. Rhyolite characterization and distribution in central Alaska. J. Archaeol. Sci. 2015, 57, 142–157. [Google Scholar] [CrossRef]
  96. Gore, A.K. Sourcing Dacites from the Moose Creek Nenana Complex, Interior Alaska. PaleoAmerica 2021, 7, 85–92. [Google Scholar] [CrossRef]
  97. Malyk-Selivanova, N.; Ashley, G.M.; Gal, R.; Glascock, M.D.; Neff, H. Geological–Geochemical Approach to “Sourcing” of Prehistoric Chert Artifacts, Northwestern Alaska. Geoarchaeology 1998, 13, 673–708. [Google Scholar] [CrossRef]
  98. Lawler, B.A. Prehistoric Toolstone Procurement and Land Use in the Tangle Lakes Region, Central Alaska. Master’s Thesis, Department of Anthropology, University of Alaska, Fairbanks, AK, USA, 2019. [Google Scholar]
  99. Phillips, S.C.; Speakman, R.J. Initial Source Evaluation of Archaeological Obsidian from the Kuril Islands of the Russian Far East Using Portable XRF. J. Archaeol. Sci. 2009, 36, 1256–1263. [Google Scholar] [CrossRef]
  100. Shackley, M.S. Obsidian: Geology and Archaeology in the North American Southwest; University of Arizona Press: Tucson, AZ, USA, 2005. [Google Scholar]
  101. Shackley, M.S. Archaeological petrology and the Archaeometry of Lithic Materials. Archaeometry 2008, 50, 194–215. [Google Scholar] [CrossRef]
  102. Shackley, M.S. X-Ray Fluorescence Spectrometry (XRF) in Geoarchaeology; Springer Science & Business Media: New York, NY, USA, 2011. [Google Scholar]
  103. Powers, W.R.; Hoffecker, J.F. Late Pleistocene Settlement in the Nenana Valley, Central Alaska. Am. Antiq. 1989, 54, 263–287. [Google Scholar] [CrossRef]
  104. Ritter, D.F. Complex river terrace development in the Nenana Valley near Healy, Alaska. GSA Bull. 1982, 93, 346. [Google Scholar] [CrossRef]
  105. Thorson, R.M.; Hamilton, T.D. Geology of the Dry Creek Site; a Stratified Early Man Site in Interior Alaska. Quat. Res. 1977, 7, 149–176. [Google Scholar] [CrossRef]
  106. Wahrhaftig, C. Quaternary and Engineering Geology in the Central Part of the Alaska Range. In Geological Survey Professional Paper; Alaska Division of Geological & Geophysical Surveys: Fairbanks, AK, USA, 1958; Volume 239-A, p. 69. [Google Scholar]
  107. Csejtey, B., Jr.; Mullen, M.W.; Cox, D.P.; Gilbert, W.G.; Yeend, W.E.; Smith, T.E.; Wahrhaftig, C.; Craddock, C.; Brewer, W.M.; Sherwood, K.W.; et al. Geology and Geochronology of the Healy Quadrangle, Alaska; U.S. Geological Survey Open File Report: Reston, VA, USA, 1986; pp. 86–396. [Google Scholar]
  108. Wahrhaftig, C. Geologic Map of the Healy D-5 Quadrangle, Alaska; U.S. Geological Survey Map GQ-807, Scale 1:63,000; Division of Geological & Geophysical Surveys: Fairbanks, AK, USA, 1970. [Google Scholar]
  109. Wahrhaftig, C. Geologic Map of the Healy D-4 Quadrangle, Alaska; U.S. Geological Survey Map GQ-806, Scale 1:63,000; Division of Geological & Geophysical Surveys: Fairbanks, AK, USA, 1970. [Google Scholar]
  110. Wahrhaftig, C. Geologic Map of the Fairbanks A-4 Quadrangle, Alaska; U.S. Geological Survey Map GQ-810, Scale 1:63,000; Division of Geological & Geophysical Surveys: Fairbanks, AK, USA, 1970. [Google Scholar]
  111. Wahrhaftig, C.; Lanphere, M.A.; Leopold, E.B.; Wolfe, J.A. The Coal-Bearing Group in the Nenana Coal Field, Alaska; Geological Survey Bulletin 1274-D; U.S. Department of the Interior: Washington, DC, USA, 1969. [Google Scholar]
  112. Cameron, C.E.; Nye, C.; Bull, K.F.; Woods, R.E.F. Jumbo Dome, Interior Alaska: Whole Rock Major and Trace Element Analyses; State of Alaska, Department of Natural Resources, Division of Geological & Geophysical Surveys: Fairbanks, AK, USA, 2015. [Google Scholar]
  113. Wahrhaftig, C. Quaternary Geology of the Nenana River and Adjacent Parts of the Alaska Range, Alaska; US Geological Survey: Anchorage, AK, USA, 1953. [Google Scholar]
  114. Wahrhaftig, C. The Cenozoic Section at Suntrana, Alaska. In Cordilleran Section of the Geological Society of America: Centennial Field Guide; Hill, M.L., Ed.; Geological Society of America Press: Boulder, CO, USA, 1987; Volume 1, pp. 446–460. [Google Scholar]
  115. Albanese, M. The Geology of Three Extrusive Bodies in the Central Alaska Range. Ph.D. Dissertation, Department of Geology, University of Alaska, Fairbanks, AK, USA, 1980. [Google Scholar]
  116. Sortor, R.N.; Goehring, B.M.; Bemis, S.P.; Ruleman, C.A.; Caffee, M.W.; Ward, D.J. Early Pleistocene Climate-Induced Erosion of the Alaska Range Formed the Nenana Gravel. Geology 2021, 49, 1473–1477. [Google Scholar] [CrossRef]
  117. Csejtey, B., Jr.; Mullen, M.W.; Cox, D.P.; Stricker, G.D. Geology and Geochronology of the Healy Quadrangle, South-Central; U.S. Geological Survey Miscellaneous Investigations Series Map I-1961; U.S. Geological Survey: Fairbanks, AK, USA, 1992; 63 p, 2 sheets, Scale 1:250,000. [Google Scholar]
  118. Athey, J.E.; Werdon, R.J.; Freeman, M.B.; Smith, L.K.; RL Szumigala, D.J. Bedrock Geologic Map of the Liberty Bell Area, Fairbanks A-4 Quadrangle, Bonnifield Mining District, Alaska. Report of Investigations 2006-2, V. 1.0.1; Alaska Division of Geological & Geophysical Surveys, State of Alaska Department of Natural Resources: Anchorage, AK, USA, 2006. [Google Scholar]
  119. Frost, G.M.; Barnes, D.F.; Stanley, R.G. Geologic and Isostatic Gravity Map of the Nenana Basin Area, Central Alaska; USGS Numbered Series 2543; U.S. Geological Survey: Fairbanks, AK, USA, Scale 1:250,000, 2002.
  120. Gilbert, W.G.; Ferrell, V.M.; Turner, D.L. The Teklanika Formation—A New Paleocene Volcanic Formation in the Central Alaska Range; Alaska State Division of Geological and Geophysical Surveys Report 47: Anchorage AK, USA, 1976. [Google Scholar]
  121. Wolfe, J.A.; Wahrhaftig, C. The Cantwell Formation of the Central Alaska Range. USA Geol. Surv. Bull. 1970, 1294, 41–55. [Google Scholar]
  122. Clautice, K.H.; Newberry, R.J.; Blodgett, R.B.; Bundtzen, T.K.; Gage, B.G.; Harris, E.E. Preliminary Geologic Map of the Healy A-6 Quadrangle, South-Central Alaska; Alaska Division of Geological & Geophysical Surveys Public Data File 99-24B, 27p.; Alaska Division of Geological & Geophysical Surveys: Fairbanks, AK, USA, 1992; Scale 1:63,360. [Google Scholar]
  123. Nye, C. The Teklanika Formation in the Calico Creek Area: Mt. McKinley National Park, Alaska. Master’s Thesis, Department of Anthropology, University of Alaska, Fairbanks, AK, USA, 1978. [Google Scholar]
  124. Wilson, F.H.; Dover, J.H.; Bradley, D.C.; Weber, F.R.; Bundtzen, T.K.; Haeussler, P.J. Geologic Map of Central (Interior) Alaska; U.S. Geological Survey Open-File Report 98-133-A; U.S. Department of the Interior: Washington, DC, USA, 1998; Scale 1:1,584,000. [Google Scholar]
  125. Albanese, M.D.; Turner., D.L. 40K-40Ar Ages from Rhyolite of Sugar Loaf Mountain, Central Alaska Range, Implications for Offset Along the Hines Creek Strand of the Denali Fault System: Short Notes on Alaska Geology 1979–1980; Alaska State Division of Geological and Geophysical Surveys: Fairbanks, AK, USA, 1980; pp. 7–10. [Google Scholar]
  126. Robinson, M.S.; Smith, T.E.; Metz, P.A. Bedrock Geology of the Fairbanks Mining District; Alaska Division of Geological and Geophysical Surveys Professional Report 106; Alaska Division of Geological & Geophysical Surveys: Fairbanks, AK, USA, 1990; 2 Sheets, Scale 1:63,360. [Google Scholar]
  127. Thornberry-Ehrlich, T. Denali National Park and Preserve: Geologic Resources Inventory Report. In Natural Resource Report NPS/NRPC/GRD/NRR—2010/244; National Park Service, Ft.: Collins, CO, USA, 2010. [Google Scholar]
  128. Hoffecker, J.F.; Elias, S.A. The Human Ecology of Beringia; Columbia University Press: New York, NY, USA, 2007. [Google Scholar]
  129. Ritter, D.F.; Ten Brink, N.W. Alluvial Fan Development and the Glacial-Glaciofluvial Cycle, Nenana Valley, Alaska. J. Geol. 1986, 94, 613–625. [Google Scholar] [CrossRef]
  130. Goebel, T.; Powers, W.R.; Bigelow, N.H.; Higgs, A.S. Walker Road. In American Beginnings: The Prehistory and Paleoecology of Beringia; West, F.H., Ed.; University of Chicago Press: Chicago, IL, USA, 1996; pp. 356–363. [Google Scholar]
  131. Hamilton, T.D.; Goebel, T. Late Pleistocene Peopling of Alaska. In Ice Age Peoples of North America: Environments, Origins and Adaptations of the First Americans; Bonnichsen, R., Turnmire, K.L., Eds.; Oregon State University Press: Corvallis, OR, USA, 1999; pp. 156–199. [Google Scholar]
  132. Holmes, C.E.; Reuther, J.D.; Adams, J.S.; Bowers, P.M.; Little, A. The Eroadaway Site: Lithic Technological Variability at a Late Glacial Subalpine Camp in the Central Alaska Range. Alsk. J. Anthropol. 2018, 16, 44–70. [Google Scholar]
  133. Goebel, T.; Bigelow, N.H. Panguingue Creek. In American Beginnings: The Prehistory and Paleoecology of Beringia; West, F.H., Ed.; University of Chicago Press: Chicago, IL, USA, 1996; pp. 366–371. [Google Scholar]
  134. Powers, W.R.; Maxwell, H.E. Alaska Range Northern Foothills Cultural Resource Survey 1985. In Unpublished Report Submitted to the Alaska Division of Parks and Outdoor Recreation; Alaska Division of Parks and Outdoor Recreation: Anchorage, AK, USA, 1986. [Google Scholar]
  135. Potter, B.A.; Bowers, P.M.; Reuther, J.D.; Mason, O.K. Holocene Assemblage Variability in the Tanana Basin: NLUR Archaeological Research, 1994–2004. Alsk. J. Anthro. 2007, 5, 23–42. [Google Scholar]
  136. Coffman, S.C. Archaeology at Teklanika West (HEA-001): An Upland Archaeological Site, Central Alaska. Master’s Thesis, Department of Anthropology, University of Alaska, Fairbanks, AK, USA, 2011. [Google Scholar]
  137. Goebel, T. Recent Research at Teklanika West: Site Stratigraphy and Dating. In American Beginnings: The Prehistory and Paleoecology of Beringia; West, F.H., Ed.; University of Chicago Press: Chicago, IL, USA, 1996; pp. 341–343. [Google Scholar]
  138. Reimer, P.J.; Austin, W.E.; Bard, E.; Bayliss, A.; Blackwell, P.G.; Ramsey, C.B.; Butzin, M.; Cheng, H.; Edwards, R.L.; Talamo, S.; et al. The InCal20 Northern Hemisphere Radiocarbon Age Calibration Curve (0–55 cal k BP). Radiocarbon 2020, 62, 725–757. [Google Scholar] [CrossRef]
  139. Glascock, M.D.; Braswell, G.E.; Cobean, R.H. A Systematic Approach to Obsidian Source Characterization. In Archaeological Obsidian Studies; Shackley, M.S., Ed.; Advances in Archaeological and Museum Science; Springer: Boston, MA, USA, 1998; Volume 3, pp. 15–65. [Google Scholar]
  140. Eerkens, J.W.; Spurling, A.M.; Gras, M.A. Measuring Prehistoric Mobility Strategies Based on Obsidian Ge-ochemical and Technological Signatures in the Owens Valley, California. J. Archaeol. Sci. 2008, 35, 668–680. [Google Scholar] [CrossRef]
  141. Hughes, R.E. Determining the Geologic Provenance of Tiny Obsidian Flakes in Archaeology Using Nondestructive EDXRF. Am. Lab. 2010, 42, 27–31. [Google Scholar]
  142. Fertelmes, C. Vesicular Basalt Provisioning Practices Among the Prehistoric Hohokam of the Salt-Gila Basin, Southern Arizona. Ph.D. Dissertation, Department of Anthropology, Arizona State University, Tampe, AZ, USA, 2014. [Google Scholar]
  143. Ferguson, J.R. X-ray Fluorescence of Obsidian: Approaches to Calibration and the Analysis of Small Samples. In Handheld XRF for Art and Archaeology; Shugar, A.N., Mass, J.L., Eds.; Leuven University Press: Leuven, Belgium, 2012; pp. 401–422. [Google Scholar]
  144. Grave, P.; Attenbrow, V.; Sutherland, L.; Pogson, R.; Forster, N. Non-Destructive pXRF of Mafic Stone Tools. J. Archaeol. Sci. 2012, 39, 1674–1686. [Google Scholar] [CrossRef]
  145. Palumbo, S.; Golitko, M.; Christensen, S.; Tietzer, G. Basalt Source Characterization in the Highlands of Western Panama Using Portable X-ray Fluorescence (pXRF) Analysis. J. Archaeol. Sci. Rep. 2015, 2, 61–68. [Google Scholar] [CrossRef]
  146. Speakman, R.J. Evaluation of Bruker’s Tracer Family Factory Obsidian Calibration for Handheld Portable XRF Studies of Obsidian; Report Prepared for Bruker AXS: Kennewick, WA, USA, 2012; Available online: http://www.brukeraxs.com/fileadmin/user_upload/PDFse/handhelds/Bruker_Obsidian_Report.pdf (accessed on 1 May 2020).
  147. Aitchison, J. Log Ratios and Natural Laws in Compositional Data Analysis. Math. Geol. 1999, 31, 563–580. [Google Scholar] [CrossRef]
  148. Lubbe, S.; Filzmoser, P.; Templ, M. Comparison of Zero Replacement Strategies for Compositional Data with Large Numbers of Zeros. Chemom. Intell. Lab. Syst. 2021, 210, 104–248. [Google Scholar] [CrossRef]
  149. Shackley, M.S. Sources of Archaeological Obsidian in the Southwest: An Archaeological, Petrological, and Geo-chemical Study. Am. Antiq. 1988, 53, 752–772. [Google Scholar] [CrossRef]
  150. Ozbun, T.L. Toolstone Geography and the Larger Lithic Landscape. In Toolstone Geography of the Pacific Northwest; Ozbun, T.L., Adams, R.L., Eds.; Archaeology Press: Burnaby, BC, Canada, 2015; pp. 1–11. [Google Scholar]
  151. R Core Team. R: A Language and Environment for Statistical Computing. R Foundation for Statistical Computing; R Foundation for Statistical Computing: Vienna, Austria, 2021; Available online: https://www.r-project.org/ (accessed on 1 May 2020).
  152. Giraudoux, P.; Antonietti, J.-P.; Beale, C.; Lancelot, R.; Pleydell, D.; Treglia, M. Pgirmess: Spatial Analysis and Data Mining for Field Ecologists. R Package v.1.7.0. 2021. 2021. Available online: https://CRAN.R-project.org/package=pgirmess (accessed on 1 May 2020).
  153. Binford, L.R. Dimensional Analysis of Behavior and Site Structure: Learning from an Eskimo Hunting Stand. Am. Antiq. 1978, 43, 330–361. [Google Scholar] [CrossRef]
  154. Graf, K.E. Hunter-Gatherer Dispersals in the Mammoth-Steppe: Technological Provisioning and Land-Use in the Enisei River Valley, South-Central Siberia. J. Archaeol. Sci. 2010, 37, 210–223. [Google Scholar] [CrossRef]
  155. Kelly, R.L. The Three Sides of a Biface. Am. Antiq. 1988, 53, 717–734. [Google Scholar] [CrossRef]
  156. Kuhn, S.L. “Unpacking” Reduction: Lithic Raw Material Economy in the Mousterian of West-Central Italy. J. Anthropol. Archaeol. 1991, 10, 76–106. [Google Scholar] [CrossRef]
  157. Parry, W.J.; Kelly, R.L. Expedient Core Technology and Sedentism. In The Organization of Core Technology; Johnson, J.K., Morrow, C.A., Eds.; Westview Press: Boulder, CO, USA, 1987; pp. 285–304. [Google Scholar]
  158. Fitzhugh, B. Colonizing the Kodiak Archipelago: Trends in Raw Material Use and Lithic Technologies at the Tanginak Spring Site. Arct. Anthr. 2004, 41, 14–40. [Google Scholar] [CrossRef]
  159. Meltzer, D.J. What Do You Do When No One’s Been There Before? Thoughts on the Exploration and Colonization of New Lands. In The First Americans: The Pleistocene Colonization of the New World; Jablonski, N.G., Ed.; Wattis Symposium Series in Anthropology Memoirs of the California Academy of Sciences, No. 27; University of California Press: San Francisco, CA, USA, 2002; pp. 27–58. [Google Scholar]
  160. Meltzer, D.J. Lessons in Landscape Learning. In Colonization of Unfamiliar Landscapes: The Archaeology of Adaptation; Rockman, M., Steele, J., Eds.; Routledge: London, UK, 2003; pp. 222–241. [Google Scholar]
  161. Rockman, M. Landscape Learning in Relation to Evolutionary Theory. In Macroevolution in Human Prehistory; Prentiss, A., Kuijt, I., Chatters, J.C., Eds.; Springer: New York, NY, USA, 2009; pp. 51–71. [Google Scholar]
  162. Steele, J.; Rockman, M. “Where Do We Go from Here?” Modeling the Decision-Making Process During Exploratory Dispersal. In Colonization of Unfamiliar Landscapes: The Archaeology of Adaptation; Rockman, M., Steele, J., Eds.; Routledge: London, UK, 2003; pp. 130–143. [Google Scholar]
  163. Odell, G.H. Economising Behaviour and the Concept of “Curation”. In Stone Tools: Theoretical Insights into Human Prehistory; Odell, G.H., Ed.; Plenum Press: New York, NY, USA, 1996; pp. 51–80. [Google Scholar]
  164. Wahrhaftig, C.; Black, R.F. Engineering Geology Along Part of the Alaska Railroad. US Geol. Surv. Pap. 1958, 293, 69–118. [Google Scholar]
  165. Anderson, D.G.; Gillam, J.C. Paleoindian Colonization of the Americas: Implications From an examination of Physiography, Demography, and Artifact Distribution. Am. Antiq. 2000, 65, 43–66. [Google Scholar] [CrossRef]
  166. Taliaferro, M.S.; Schriever, B.A.; Shackley, M.S. Obsidian Procurement, Least Cost Path Analysis, and Social Interaction in the Mimbres Area of Southwestern New Mexico. J. Archaeol. Sci. 2010, 37, 536–548. [Google Scholar] [CrossRef]
  167. Kelly, R.L. Maybe We Do Know When People First Came to North America; and What Does it Mean if We Do? Quat. Int. 2003, 109, 133–145. [Google Scholar] [CrossRef]
  168. Kelly, R.L.; Todd, L.C. Coming into the Country: Early Paleoindian Hunting and Mobility. Am. Antiq. 1988, 53, 231–244. [Google Scholar] [CrossRef]
  169. Meltzer, D.J. Peopling of North America. In The Quaternary Period in the United States; Gillespie, A., Porter, S.C., Atwater, B., Eds.; Elsevier: New York, NY, USA, 2004; pp. 539–563. [Google Scholar]
  170. Jones, M.C.; Yu, Z. Rapid deglacial and early Holocene expansion of peatlands in Alaska. Proc. Natl. Acad. Sci. USA 2010, 107, 7347–7352. [Google Scholar] [CrossRef] [PubMed]
  171. Kaufman, D.S.; Axford, Y.L.; Henderson, A.C.; McKay, N.P.; Oswald, W.W.; Saenger, C.; Anderson, R.S.; Bailey, H.L.; Clegg, B.; Gajewski, K.; et al. Holocene Climate Changes in Eastern Beringia (NW North America) A Systematic Review of Multi-Proxy Evidence. Quat. Sci. Rev. 2016, 147, 312–339. [Google Scholar] [CrossRef]
  172. Mason, O.K.; Bigelow, N.H. The Crucible of Early to Mid-Holocene Climate in Northern Alaska: Does Northern Archaic Represent the People of the Spreading Forest? Arct. Anthropol. 2008, 45, 38–70. [Google Scholar] [CrossRef]
  173. Doering, B.N. Subarctic landscape adaptations and paleodemography: A 14,000-year history of climate change and human settlement in central Alaska and Yukon. Quat. Sci. Rev. 2021, 268, 107139. [Google Scholar] [CrossRef]
  174. Potter, B.A. Holocene Prehistory of the Northwestern Subarctic. In The Oxford Handbook of the Prehistoric Arctic; Friesen, T.M., Mason, O.K., Eds.; Oxford University Press: New York, NY, USA, 2016; pp. 537–562. [Google Scholar]
  175. Blong, J.C. Late-Glacial Hunter-Gatherers in the Central Alaska Range and the Role of Upland Ecosystems in the Peopling of Alaska. PaleoAmerica 2018, 4, 103–133. [Google Scholar] [CrossRef]
  176. Goebel, T. What is the Nenana Complex? Raw Material Procurement and Technological Organization at Walker Road, Central Alaska. In From the Yenisei to the Yukon: Interpreting Lithic Assemblage Variability in Late Pleistocene/Early Holocene Beringia; Goebel, T., Buvit, I., Eds.; Texas A&M University Press: College Station, TX, USA, 2011; pp. 200–214. [Google Scholar]
  177. Smith, G.M. Ethnoarchaeology of the Middle Tanana Valley, Alaska. Ph.D. Thesis, Department of Anthropology, University of Alaska, Fairbanks, AK, USA, 2020. [Google Scholar]
Figure 1. Map of archaeological sites, sample locations, and survey boundaries in the Nenana River valley. Rhyolite outcrops: 1: Triple Lakes; 2: Sugarloaf Mountain; 3: Ferry 1; 4: Ferry 2; 5: Ferry 3; 6: Ferry 4; 7: Ferry 5; and 8: Calico Creek rhyolite (approximate location reported by Coffman and Rasic [98]; this location was not sampled during survey). Rhyolite alluvial samples: 1: Bear Creek; 2: California Creek; 3: Savage and Teklanika Confluence; 4: Teklanika River.
Minerals 13 01146 g001
Figure 2. Logged (base 10) biplots of principal component 1 and 2 scores for rhyolites sampled from seven rhyolite outcrop locations in this study. Ellipse confidence intervals drawn at 90%.
Minerals 13 01146 g002
Figure 3. Logged (base 10) biplots of rhyolite outcrop samples comparing principal components 2 and 4 scores of Ferry 3, Ferry 5, and Sugarloaf rhyolites (a) and Nb and Zr (ppm) values for Ferry 3, Ferry 5, Sugarloaf, and Triple Lakes rhyolites (b). Ellipse confidence intervals drawn at 90%.
Minerals 13 01146 g003
Figure 4. Logged (base 10) 3D plots of rhyolite outcrops sampled in this study, comparing (a) principal components 1, 2, and 4 scores of the Ferry 1 and Ferry 3 rhyolites and (b) principal components 2, 3, and 5 scores of the Ferry 3 and Triple Lakes rhyolites.
Minerals 13 01146 g004
Figure 5. Logged (base 10) biplots comparing alluvial and outcrop samples by (a) principal components 1 and 2 scores and (b) principal component 1 and 3 scores. Ellipse confidence intervals drawn at 90%.
Minerals 13 01146 g005
Figure 6. Logged (base 10) biplots of (a) rhyolite artifact samples and their assigned groups by scores of principal components 1 and 2, (b) principal components 1 and 3, (c) principal components 1 and 4, and (d) principal components 1 and 5. Unassigned artifacts denoted by black crosses in all plots. Ellipse confidence intervals drawn at 90%. TM = Talkeetna Mountains source area, formerly “group G;” CC = Calico Creek source area, formerly “group H.”.
Minerals 13 01146 g006
Figure 7. Logged (base 10) biplot comparing rhyolite artifact groups (ellipses) and unassigned artifacts with alluvial samples by scores of principal components 1 and 2. Alluvial samples overlapping with artifact rhyolite groups are highlighted in red. Ellipse confidence intervals drawn at 90%. TM = Teklanika Mountains source area; CC = Calico Creek source area.
Minerals 13 01146 g007
Figure 8. Logged (base 10) biplots comparing select rhyolite artifact groups (ellipses) with alluvial samples by scores of principal components 1 and 3 (a) and principal components 3 and 5 (b). Alluvial samples positioned within or near a group ellipse in Figure 7 are shown here in red. CC = Calico Creek source area. Ellipse confidence intervals drawn at 90%.
Minerals 13 01146 g008
Figure 9. Logged (base 10) biplots comparing unassigned artifacts and alluvium by (a) principal components 1 and 2, (b) principal components 1 and 3, and (c) principal components 1 and 4. Unassigned artifacts discussed in text denoted by red crosses and the label “UA”; alluvial samples discussed in text denoted by blue alluvial symbol and labeled. ST = Savage and Teklanika Confluence sample; T = Teklanika River sample.
Minerals 13 01146 g009
Figure 10. Logged (base 10) biplots comparing artifact rhyolite group ellipses, unassigned artifacts, and outcrop samples (ellipses) by (a) scores of principal components 1 and 2, (b) principal components 1 and 3, (c) principal components 1 and 4, and (d) principal components 2 and 3. Artifacts assigned to Triple Lakes denoted by red crosses and labeled according to site assemblages (Moose Creek C3 (MC); Owl Ridge C3 (OR1 and OR2)). TM = Talkeetna source area; CC = Calico Creek source area. Ellipse confidence intervals drawn at 90%.
Minerals 13 01146 g010
Figure 11. Logged (base 10) 3D plot of rhyolite outcrops sampled in this study, comparing Sr, Nb, and Rb (ppm) values of Group B artifacts and Ferry 5 outcrop samples.
Minerals 13 01146 g011
Figure 12. Spatial distribution and proportion of rhyolite artifact groups A, B, C, D, E, F, I, J, K, L, M, N, TM (Talkeetna Mountains), CC (Calico Creek), and TRL (Triple Lakes) at sites in the Nenana valley. Density circles are representative of the number of rhyolite artifacts analyzed from each site.
Minerals 13 01146 g012
Figure 13. Stacked bar charts showing (a) proportions and numbers of rhyolite artifact groups by time, and (b) cortex amount by group by time. CC = Calico Creek artifacts; TM = Talkeetna Mountain artifacts; TRL = Triple Lakes artifacts; UNA = unassigned artifacts. Raw counts are given within each bar section, and percentages are measured along the y-axis.
Minerals 13 01146 g013
Figure 14. Stacked bar chart showing proportions and numbers of local and nonlocal rhyolites within each assemblage. Assemblages proceed chronologically, oldest to youngest, from left to right. Raw counts are given in each bar section, and percentages are measured along the y-axis.
Minerals 13 01146 g014
Figure 15. Linear regression graph comparing number of rhyolite groups (y-axis; log base 10) with total number of rhyolite artifacts sampled (x-axis; log base 10). The slope coefficient is 0.369; the intercept coefficient is 0.336; Pearson’s correlation coefficient (R) is 0.824; the R2 value is 0.659. Assemblages are color coded by time period. WR is Walker Road; DC 1, DC 2, and DC 4 are Dry Creek C1, Dry Creek C2, and Dry Creek C4, respectively; MC 1, MC 2, MC 3, and MC 4 are Moose Creek C1, Moose Creek C2, Moose Creek C3, and Moose Creek C4, respectively; OR 1, OR 2, and OR 3 are Owl Ridge C1, Owl Ridge C2, and Owl Ridge C3, respectively; PC 1, PC 2, and PC 3 are Panguingue Creek C1, Panguingue Creek C2, and Panguingue Creek C1, respectively; ER is Eroadaway; TW 3 is Teklanika West C3; HOU is Houdini Creek; and LPC is Little Panguingue Creek C2.
Minerals 13 01146 g015
Figure 16. Bar chart showing mean standardized residuals (y-axis) for each archaeological assemblage (x-axis), color coded by time period. WR is Walker Road; DC 1, DC 2, and DC 4 are Dry Creek C1, Dry Creek C2, and Dry Creek C4, respectively; MC 1, MC 2, MC 3, and MC4 are Moose Creek C1, Moose Creek C2, Moose Creek C3, and Moose Creek C4, respectively; OR 1, OR 2, and OR 3 are Owl Ridge C1, Owl Ridge C2, and Owl Ridge C3, respectively.
Minerals 13 01146 g016
Figure 17. Bar chart showing proportion and numbers of rhyolite toolstone in each assemblage compared with the proportion and number of rhyolite groups within each assemblage, presented in chronological order from left to right; percentages measured along the y-axis.
Minerals 13 01146 g017
Figure 18. Stacked bar chart showing proportions of toolstone types within each assemblage, with percentages measured along the y axis; raw material type scored during lithic analysis of these assemblages.
Minerals 13 01146 g018
Table 1. Radiocarbon dates for site assemblages from the Nenana valley used in this study.
Site AssemblageArtifact Sample (n = 675)Calibrated Date (ka BP) 1Radiocarbon DatesReference
Dry Creek C14813.5–13.3 ka11,510 ± 40 (UCIAMS-135114)
11,530 ± 50 (BETA-315411)
11,580 ± 40 (UCIAMS-135113)
11,635 ± 40 (UCIAMS-135112)
[27]
Walker Road9814.1–13.3 ka11,820 ± 200 (BETA-11254)
11,010 ± 230 (AA-1683)
11,170 ± 180 (AA-1683)
11,300 ± 120 (AA-2264)
[130,131]
Moose Creek C12213.2–13.0 ka11,190 ± 60 (BETA-96627)[41]
Owl Ridge C13113.3–12.8 ka11,060 ± 60 (AA86969)[28]
Eroadaway812.9–12.5 ka10,890 ± 40 (BETA-24155)
10,570 ± 50 (BETA-368365)
[132]
Moose Creek C21412.7–12.5 ka10,500 ± 60 (BETA-106040)[41]
Owl Ridge C23312.5–11.4 ka10,485 ± 25 (UCIAMS-71261)
10,420 ± 60 (AA-86960)
10,340 ± 75 (AA-86963)
10,020 ± 40 (BETA-289382)
[28] 2
Panguingue Creek C1412.2–11.4 ka10,180 ± 130 (AA-1686)
9836 ± 62 (GX-17457)
[133]
Owl Ridge C33311.3–11.2 ka9880 ± 40 (BETA-330172)
9790 ± 40 (BETA-289379)
[28]
Dry Creek C212711.1–10.4 ka9480 ± 35 (UCIAMS-135115)
9460 ± 40 (BETA-315410)
[27]
Little Panguingue Creek C2309.6 ka8620 ± 40 (BETA-431673)[55]
Panguingue Creek C2529.0–8.4 ka7850 ± 180 (BETA-15093)
7130 ± 180 (BETA-15094)
7430 ± 270 (AA-1688)
7595 ± 405 (GX-13012)
[133,134]
Houdini Creek428.8 ka7880 ± 60 (Beta-74737)[135]
Teklanika West C3327.7–7.5 ka6770 ± 50 (BETA-276455)
7030 ± 40 (BETA-292107)
7330 ± 40 (GX-18518)
[136,137]
Carlo Creek C2267.5–6.0 ka-[54]
Moose Creek C386.6–6.4 ka5680 ± 50 (BETA-106041)[41]
Panguingue Creek C346.4 ka4510 ± 95 (GX-13011)
5620 ± 65 (SI-3237)
[134]
Moose Creek C4246.4–4.0 ka-[41]
Dry Creek C4393.9–3.5 ka3430 ± 75 (SI-2332)
3655 ± 60 (SI-1934)
4670 ± 95 (SI-1937)
[56]
1 Radiocarbon date ranges calibrated using Reimer [138] calibration curve in OxCal online software IntCal20.0; 2 Representative dates selected; for full list of all dates, see [28].
Table 2. Expectations of rhyolite transport and technological provisioning.
VariablesTransport Expectations
LocalNonlocal
Diversity of Rhyolite GroupsHighLow
Cortex Presence in Rhyolite GroupsHighLow
Provisioning Strategy Expectations
PlaceIndividuals
Local Rhyolite TransportHighLow
Nonlocal Rhyolite TransportLowHigh
Table 3. Expectations of landscape learning.
VariablesLandscape Learning Expectations
LearnersExperts
Rhyolite Group DiversityHighLow
Rhyolite TransportMostly NonlocalMostly Local
Rhyolite Provisioning StrategyIndividualsPlace
Table 4. Statistical summaries of minimum, maximum, mean, standard deviation (St Dev), and percent standard deviation (%SD) of element concentrations (ppm) measured from outcrop sample locations.
OutcropElementMinMaxMeanSt Dev%SD
Ferry 1Mn61.19211.05115.7939.3433.98
N = 20Fe3630.5423,158.378935.535553.0062.15
Zn7.3633.8915.956.7842.49
Ga9.3226.2217.893.9822.24
Rb171.54263.27214.6828.2613.16
Sr137.69265.34216.4136.2116.73
Y12.7941.2519.666.5833.47
Zr85.44164.38130.1122.6317.39
Nb9.7623.7515.963.0619.18
Th10.2138.2017.488.7650.12
Ferry 2Mn11.25583.46119.46135.68113.58
N = 20Fe1349.999994.883462.481832.9852.94
Zn5.8644.0013.218.5564.68
Ga2.5117.029.463.1933.69
Rb6.3130.6514.627.0848.40
Sr2.0446.1522.3013.4160.15
Y3.2917.657.353.1042.15
Zr23.6771.7342.0910.9926.10
Nb0.474.702.121.1252.81
Th0.014.521.291.30100.76
Ferry 3Mn4.26450.8571.6092.10128.63
N = 20Fe1919.0315,409.166848.113705.8754.12
Zn2.9327.6312.656.6552.59
Ga11.8319.9417.062.1812.79
Rb72.86224.56119.8840.3433.65
Sr17.12150.0658.1441.8672.00
Y11.04122.6525.6023.7692.80
Zr58.54148.9877.4518.6524.09
Nb9.8928.6519.134.5223.60
Th11.1116.7713.751.8313.28
Ferry 4Mn44.08132.7780.3224.8830.97
N = 20Fe1595.398553.464762.001622.4534.07
Zn7.6571.7347.3518.0638.15
Ga9.8222.7618.953.1316.52
Rb135.14321.92242.2248.5720.05
Sr54.31158.89118.5927.3823.09
Y18.66107.7734.7422.4764.68
Zr56.73122.5477.3913.7717.79
Nb14.7439.7022.776.1126.82
Th14.3534.6521.535.3024.61
Ferry 5Mn29.76137.8380.6428.6035.46
N = 20Fe1211.189561.482820.661989.6670.54
Zn4.2616.6410.053.4434.17
Ga7.5721.6314.024.0128.58
Rb96.41261.04175.3454.7431.22
Sr21.9898.4050.4822.6744.91
Y11.6873.4023.8313.4856.56
Zr66.09130.9296.0017.0617.77
Nb3.1812.477.942.2628.46
Th7.6040.9416.549.2656.02
SugarloafMn82.85869.66257.05181.1670.48
MountainFe3224.2310,923.045249.461782.2233.95
N = 20Zn17.7276.5842.3718.2142.97
Ga15.5725.8720.132.6313.08
Rb203.57557.97366.38106.7629.14
Sr2.5726.9910.107.7176.30
Y30.8491.1859.9113.7022.86
Zr54.4170.8862.974.457.06
Nb12.6724.6419.794.0020.21
Th13.6325.9419.083.3517.58
TripleMn21.54309.13109.5669.0363.01
LakesFe1420.0612,011.217569.192610.3134.49
N = 20Zn12.6437.1123.268.4036.13
Ga5.1720.4214.273.7626.33
Rb45.30186.38124.8749.4239.58
Sr5.3025.5312.125.7447.39
Y11.48173.9632.3935.65110.08
Zr51.83105.9285.6313.3215.56
Nb5.9318.109.502.4425.65
Th5.8012.709.851.8018.25
Table 5. Statistical summaries of minimum, maximum, mean, standard deviation (St Dev), and percent standard deviation (%SD) of element concentrations (ppm) measured from alluvial samples collected from each alluvial collection spot.
SampleElementMinMaxMeanSt Dev%SD
California
Creek
(N = 2)
Mn190.27405.09297.68151.9051.03
Fe6021.659492.027756.832453.9231.64
Zn15.4831.2823.3811.1747.77
Ga19.9020.7920.340.623.07
Rb179.43198.58189.0013.557.17
Sr46.4262.2254.3211.1720.57
Y45.5848.7947.192.274.81
Zr102.70171.80137.2548.8635.60
Nb32.0038.3135.154.4612.68
Th12.1921.0816.646.2937.78
Bear
Creek
(N = 2)
Mn62.941135.13599.03758.15126.56
Fe12,586.9425,039.9118,813.438805.5846.80
Zn61.20134.9298.0652.1353.16
Ga15.1125.2720.197.1835.57
Rb185.37236.91211.1436.4417.26
Sr20.4623.2921.872.009.14
Y40.7650.5145.636.8915.11
Zr549.00706.16627.58111.1217.71
Nb35.4549.1442.299.6822.89
Th19.0122.6520.832.5712.34
Teklanika
River
(N = 23)
Mn70.801089.70305.49277.1990.73
Fe3681.0733,096.1712,819.917490.4758.43
Zn23.09128.0072.0329.6041.10
Ga13.7524.9219.783.0115.23
Rb41.32240.49142.1555.7839.24
Sr6.79114.4630.3627.3289.98
Y23.4789.2260.2918.1530.11
Zr118.30624.44306.97137.8544.91
Nb10.6347.1529.999.0730.23
Th7.2123.8016.414.2325.79
Confluence
of Savage
and
Teklanika
Rivers
(N = 20)
Mn139.051749.46507.72408.9480.55
Fe5636.6353,700.4525,842.6411,448.5144.30
Zn63.63310.54140.3962.2544.34
Ga16.1527.9521.763.1914.66
Rb93.34229.62175.2141.0223.41
Sr7.1170.7433.2216.2048.77
Y42.40111.4971.1216.3022.92
Zr196.99661.74461.21178.5438.71
Nb18.9146.7935.738.3923.48
Th12.8424.3818.923.7019.54
Table 6. Count of artifacts in each archaeological assemblage by geochemical rhyolite groups. TM = Talkeetna Mountains; CC = Calico Creek.
Rhyolite Group
Assemblages by TimeTotal (%)ABCDEFTM [G]CC [H]IJKLMNUna 1
13.5–12.8 ka
Dry Creek C148
(7.1)
1
(0.2)
3
(0.4)
1
(0.2)
9
(1.3)
2
(0.3)
2
(0.3)
26
(3.9)
4
(0.6)
Walker Road98
(14.5)
56
(8.3)
2
(0.3)
2
(0.3)
4
(0.6)
1
(0.2)
1
(0.2)
32
(4.7)
Moose Creek C122
(3.3)
15
(2.2)
2
(0.3)
2
(0.3)
1
(0.2)
2
(0.3)
Owl Ridge C131
(4.6)
11
(1.6)
15
(2.2)
1
(0.2)
1
(0.2)
3
(0.4)
Eroadaway8
(1.2)
6
(0.9)
1
(0.2)
1
(0.2)
Subtotal207
(30.7)
12.5–11.7 ka
Moose Creek C214
(2.1)
9
(1.3)
2
(0.3)
1
(0.2)
1
(0.2)
1
(0.2)
Owl Ridge C233
(4.9)
18
(2.7)
1
(0.2)
14
(2.0)
Panguingue C14
(0.6)
1
(0.2)
2
(0.3)
1
(0.2)
Subtotal51
(7.6)
11.7–9 ka
Dry Creek C2127
(18.8)
73
(10.8)
8
(1.2)
3
(0.4)
4
(0.6)
2
(0.3)
17
(2.5)
2
(0.3)
10
(1.5)
8
(1.2)
Owl Ridge C333
(4.9)
17
(2.5)
3
(0.4)
1
(0.2)
2
(0.3)
2
(0.3)
8
(1.2)
Panguingue C252
(7.7)
4
(0.6)
18
(2.7)
1
(0.2)
2
(0.3)
2
(0.3)
5
(0.7)
16
(2.4)
1
(0.2)
3
(0.4)
Little Panguingue Creek C230
(4.4)
2
(0.3)
1
(0.2)
1
(0.2)
26
(3.9)
Subtotal242
(35.9)
8–3.5 ka
Houdini Creek42
(6.2)
8
(1.2)
10
(1.5)
2
(0.3)
22
(3.3)
Teklanika West C332
(4.7)
16
(2.4)
1
(0.2)
6
(0.9)
2
(0.3)
1
(0.2)
4
(0.6)
4
(0.6)
Carlo Creek C226
(3.9)
26
(3.9)
Moose Creek C38
(1.2)
1
(0.2)
5
(0.7)
1
(0.2)
1
(0.2)
Panguingue C34
(0.6)
1
(0.2)
3
(0.4)
Moose Creek C424
(3.6)
4
(0.6)
3
(0.4)
1
(0.2)
16
(2.4)
Dry Creek C439
(5.8)
3
(0.4)
2
(0.3)
4
(0.6)
2
(0.3)
1
(0.2)
24
(3.6)
7
(1.0)
Subtotal175
(25.9)
Total675
(100)
266
(39.4)
42
(6.2)
17
(2.5)
8
(1.2)
15
(2.2)
12
(1.8)
20
(3.0)
21
(3.1)
88
(13.0)
53
(7.9)
25
(3.7)
10
(1.5)
30
(4.4)
26
(3.9)
42
(6.2)
1 Number of unassigned artifacts.
Table 7. Statistical summaries of minimum, maximum, mean, standard deviation (St Dev), and percent standard deviation (%SD) of element concentrations (ppm) measured for each artifact rhyolite group A-N.
Rhyolite GroupElementMinMaxMeanSt Dev%SD
A
(N = 266)
Mn167.612632.84529.55357.2867.47
Fe12,018.1453,436.8227,960.767237.2125.88
Zn76.99542.73188.9670.3337.22
Ga21.2562.5242.5110.7625.31
Rb141.10348.59231.5737.5416.21
Sr14.8732.1622.764.1918.43
Y36.0576.9749.486.5513.23
Zr128.44236.36179.4422.0312.27
Nb13.5127.4819.342.6313.59
Th22.1862.1936.057.3020.25
B
(N = 42)
Mn200.522624.06662.20618.8493.45
Fe9693.9775,573.2534,981.7016,681.3247.69
Zn49.50423.30203.8577.3237.93
Ga19.6557.5032.8710.3931.60
Rb120.61205.80151.4926.2217.31
Sr60.36107.6886.2513.2115.32
Y24.6542.0932.744.4213.50
Zr130.06241.38176.3426.8215.21
Nb10.3229.5719.854.0520.42
Th7.3626.8115.354.1226.83
C
(N = 17)
Mn427.611213.79898.38204.2122.73
Fe15,376.7544,958.6629,165.567836.3326.87
Zn51.08112.3067.8014.7521.75
Ga19.2649.8531.968.5926.86
Rb86.92159.82121.6921.2717.48
Sr86.87134.01107.3212.5611.70
Y31.4953.4041.934.7711.37
Zr212.03321.12262.1930.9011.79
Nb13.8424.9318.832.8114.92
Th3.1512.907.992.8135.13
D
(N = 8)
Mn319.621456.81561.58348.9862.14
Fe26,677.4477,584.6936,458.8616,121.8644.22
Zn93.65188.10128.8531.3524.33
Ga19.7046.5626.618.5131.98
Rb82.97119.60100.0212.1912.19
Sr175.19231.04200.4015.937.95
Y19.7332.1026.023.4313.18
Zr141.19190.07165.9614.788.91
Nb12.0813.9313.140.735.59
Th8.0110.248.830.889.97
E
(N = 15)
Mn38.16672.75445.51166.3137.33
Fe21,266.0172,755.2736,810.6914,019.0038.08
Zn121.92189.63147.9218.6912.64
Ga19.6541.0930.276.6722.05
Rb103.51163.13130.2613.2910.20
Sr168.60220.66194.2414.637.53
Y27.8640.3933.023.5310.70
Zr167.87244.08207.3622.2210.72
Nb16.7719.6218.441.045.64
Th9.5417.8314.822.6117.61
F
(N = 12)
Mn404.04853.67697.26150.4321.57
Fe18,920.7635,043.2925,785.284521.7717.54
Zn75.08150.12102.8623.7523.09
Ga20.4651.6040.9011.2227.44
Rb91.81128.05107.1010.7510.04
Sr253.15284.65270.819.563.53
Y24.6144.5735.935.7515.99
Zr162.35308.43264.3754.3120.54
Nb12.6617.9915.501.8411.87
Th8.2114.5610.591.9718.57
G (Talkeetna Mountains)
(N = 20)
Mn260.311647.17793.21438.5155.28
Fe20,343.63118,057.5150,268.9428,194.5856.09
Zn81.74214.23132.1433.4525.31
Ga12.2656.9527.3011.0440.43
Rb72.96157.74110.2422.8220.70
Sr112.92165.68144.2813.869.61
Y22.3040.2729.274.7316.15
Zr143.10204.18163.9516.8110.25
Nb11.3316.5513.471.299.56
Th6.8514.379.912.1822.03
H (Calico Creek)
(N = 21)
Mn160.121568.79444.56315.2770.92
Fe15,911.5545,849.7626,805.776881.3025.67
Zn41.93184.59103.8834.6633.37
Ga11.6933.4122.525.9226.30
Rb54.32208.67115.7429.6725.64
Sr52.2676.9864.887.0310.83
Y30.6439.5934.632.968.54
Zr149.73259.80200.0625.9312.96
Nb9.0719.2014.742.5917.58
Th2.9922.0211.263.6832.70
I
(N = 88)
Mn10.642521.64288.31379.92131.77
Fe3130.6397,848.5619,925.2216,254.0981.58
Zn16.23151.7348.0928.6259.52
Ga13.4353.6833.869.6428.46
Rb96.64314.50196.2342.3821.59
Sr18.8043.2830.585.9719.52
Y17.2241.0827.644.3515.72
Zr161.69374.81280.2341.1614.69
Nb8.5823.7314.042.8920.59
Th4.9125.299.633.2834.02
J
(N = 53)
Mn198.272180.51413.82275.5866.59
Fe13,199.0538,572.3921,995.976327.2928.77
Zn99.56428.76206.3463.8830.96
Ga23.2756.6840.199.7524.27
Rb164.03323.25225.5437.8716.79
Sr38.91104.5562.8716.0425.51
Y38.3672.3053.868.0614.96
Zr130.68242.99179.3024.4413.63
Nb14.2026.9820.873.1915.27
Th24.2365.5736.248.9324.65
K
(N = 25)
Mn994.752446.141659.44382.3823.04
Fe68,174.2895,913.5183,166.858709.3010.47
Zn135.58264.68170.7932.9519.29
Ga25.9853.9339.798.3721.04
Rb63.00140.52103.2118.7218.14
Sr262.35384.52336.0532.649.71
Y22.5746.9335.196.6618.93
Zr234.01362.86308.5231.1810.11
Nb24.5936.8730.253.6912.18
Th5.3014.1210.692.0719.33
L
(N = 10)
Mn197.49511.97302.6289.5729.60
Fe10,422.0128,481.9317,671.275104.6928.89
Zn41.9185.9362.3015.4324.78
Ga17.6745.9533.859.0226.66
Rb164.21256.32215.6529.1513.52
Sr15.9723.7119.012.5113.22
Y45.2858.6352.294.759.09
Zr317.68445.47395.0038.979.87
Nb20.1827.6624.582.6810.89
Th9.3412.9811.551.2110.44
M
(N = 30)
Mn552.291997.761096.03371.5733.90
Fe21,355.7874,821.3349,030.3713,900.6228.35
Zn39.81153.7692.9633.8036.36
Ga15.9658.3035.9210.5529.36
Rb81.07148.18106.5318.5117.38
Sr295.98670.40447.18106.5523.83
Y25.8542.5732.144.5014.02
Zr189.31348.11248.2236.7914.82
Nb8.4818.2012.602.4719.61
Th2.0612.237.802.2528.81
N
(N = 26)
Mn318.53709.07496.68100.5420.24
Fe8499.0520,228.2113,466.293135.8123.29
Zn37.60105.1260.5217.7829.37
Ga13.6545.3327.719.0232.54
Rb33.8685.0559.0411.1218.83
Sr617.221102.29804.09125.7215.64
Y12.2219.5615.341.8011.75
Zr98.59176.08136.5822.2416.28
Nb8.2014.6510.571.6515.60
Th8.5916.0411.281.7015.03
Table 8. Total number of artifact rhyolite groups used during each time period and the mean and median of artifact rhyolite groups used at each site within the time period.
Time PeriodTotal Number of
Rhyolite Groups
μ M
13.5–12. 8 ka125.05.0
12.5–11.7 ka53.33.0
11.7–9.0 ka135.26.0
8.0–3.5 ka123.94.0
A Kruskal-Wallis H test confirms that the differences in overall number of rhyolite groups at sites is statistically significant between these time periods (H = 18.96, df = 3, p < 0.001).
Table 9. Count and percentage of artifacts with cortex in each archaeological assemblage and their assigned artifact rhyolite group.
Rhyolite Group
Assemblages by TimeTotal (%)ABCDEFTMCCIJKLMNTRLUna 1
13.5–12.8 ka
Dry Creek C11
(1.9)
1
(1.9)
Walker Road7
(13.4)
2
(3.9)
1
(1.9)
1
(1.9)
1 (1.9) 2
(3.9)
Moose Creek C12
(3.9)
1
(1.9)
1
(1.9)
Owl Ridge C16
(11.5)
5
(9.6)
1
(1.9)
Eroadaway0
(0.0)
Subtotal16 (30.8)
12.5–11.7 ka
Moose Creek C25
(9.6)
2
(5.7)
1
(1.9)
1
(1.9)
1
(1.9)
Owl Ridge C22
(3.9)
1
(1.9)
1
(1.9)
Panguingue C11
(1.9)
1
(1.9)
Subtotal8
(15.4)
11.7–9 ka
Dry Creek C24
(7.7)
1
(1.9)
1
(1.9)
1
(1.9)
1
(1.9)
Owl Ridge C31
(1.9)
1
(1.9)
Panguingue C212 (23.0) 7
(13.4)
1
(1.9)
1
(1.9)
2
(3.9)
1
(1.9)
Little Panguingue Creek C20
(0.0)
Subtotal17 (32.7)
8–3.5 ka
Houdini Creek4
(7.7)
1
(1.9)
2
(3.9)
1
(1.9)
Tek West C31
(1.9)
1
(1.9)
Carlo Creek C22
(3.9)
2
(3.9)
Moose Creek C30
(0.0)
Panguingue C31
(1.9)
1
(1.9)
Moose Creek C43
(5.8)
1
(1.9)
1
(1.9)
1
(1.9)
Dry Creek C40
(0.0)
Subtotal11 (21.2)
Total (%)52 (100)12 (23.1)10 (19.2)0
(0.0)
1
(1.9)
1
(1.9)
1
(1.9)
5
(9.6)
3
(5.8)
8
(15.4)
4
(7.7)
1
(1.9)
0
(0.0)
0
(0.0)
1
(1.9)
1
(1.9)
4
(7.7)
1 Number of unassigned artifacts.
Table 10. Summary of local rhyolite transport, nonlocal rhyolite transport, and dominant provisioning strategy within each assemblage, organized by time period.
Local Rhyolite TransportNonlocal Rhyolite TransportDominant Provisioning Strategy
Allerød
Dry Creek C1LowHighIndividuals
Walker RoadHighModeratePlace
Owl Ridge C1HighLowPlace
Moose Creek C1HighLowPlace
EroadawayHighLowPlace
YD
Panguingue Creek C1HighLowPlace
Moose Creek C2HighLowPlace
Owl Ridge C2HighLowPlace
Early Holocene
Little Panguingue Creek C2HighLowPlace
Owl Ridge C3HighLowPlace
Panguingue Creek C2HighLowPlace
Dry Creek C2HighLowPlace
Middle Holocene
Houdini CreekLowHighIndividuals
Teklanika West C3HighModeratePlace
Moose Creek C3HighLowPlace
Carlo CreekHighLowPlace
Panguingue Creek C3HighLowPlace
Moose Creek C4LowHighIndividuals
Dry Creek C4LowHighIndividuals
Table 11. Comparison of number of artifact rhyolite groups and sources represented in each assemblage with the total number of groups and sources found in Nenana valley site assemblages.
AssemblageTotal *n Groups/15 Total Groups(%)
Allerød Assemblages
Dry Creek C1447/15(0.47)
Walker Road987/15(0.47)
Moose Creek C1204/15(0.27)
Owl Ridge C1284/15(0.27)
Eroadaway72/15(0.13)
Subtotal19712/15(0.80)
Younger Dryas Assemblages
Moose Creek C2134/15(0.27)
Owl Ridge C2333/15(0.20)
Panguingue C143/15(0.20)
Subtotal505/15(0.33)
Early Holocene Assemblages
Dry Creek C21198/15(0.53)
Owl Ridge C3276/15(0.40)
Panguingue C2498/15(0.53)
Little Panguingue Creek C2304/15(0.27)
Subtotal22513/15(0.87)
Middle Holocene Assemblages
Houdini Creek424/15(0.27)
Teklanika West C3286/15(0.40)
Carlo Creek C2261/15(0.07)
Moose Creek C384/15(0.27)
Panguingue C342/15(0.13)
Moose Creek C4244/15(0.27)
Dry Creek C4326/15(0.40)
Subtotal16412/15(0.80)
Sum of Artifacts636
* Thirty-nine unassigned artifacts excluded.
Disclaimer/Publisher’s Note: The statements, opinions and data contained in all publications are solely those of the individual author(s) and contributor(s) and not of MDPI and/or the editor(s). MDPI and/or the editor(s) disclaim responsibility for any injury to people or property resulting from any ideas, methods, instructions or products referred to in the content.

