
Digital Rock Physics in Cuttings Using High-Resolution Thin Section Scan Images

 , and
, and
Abstract
:1. Introduction
2. Materials and Methods
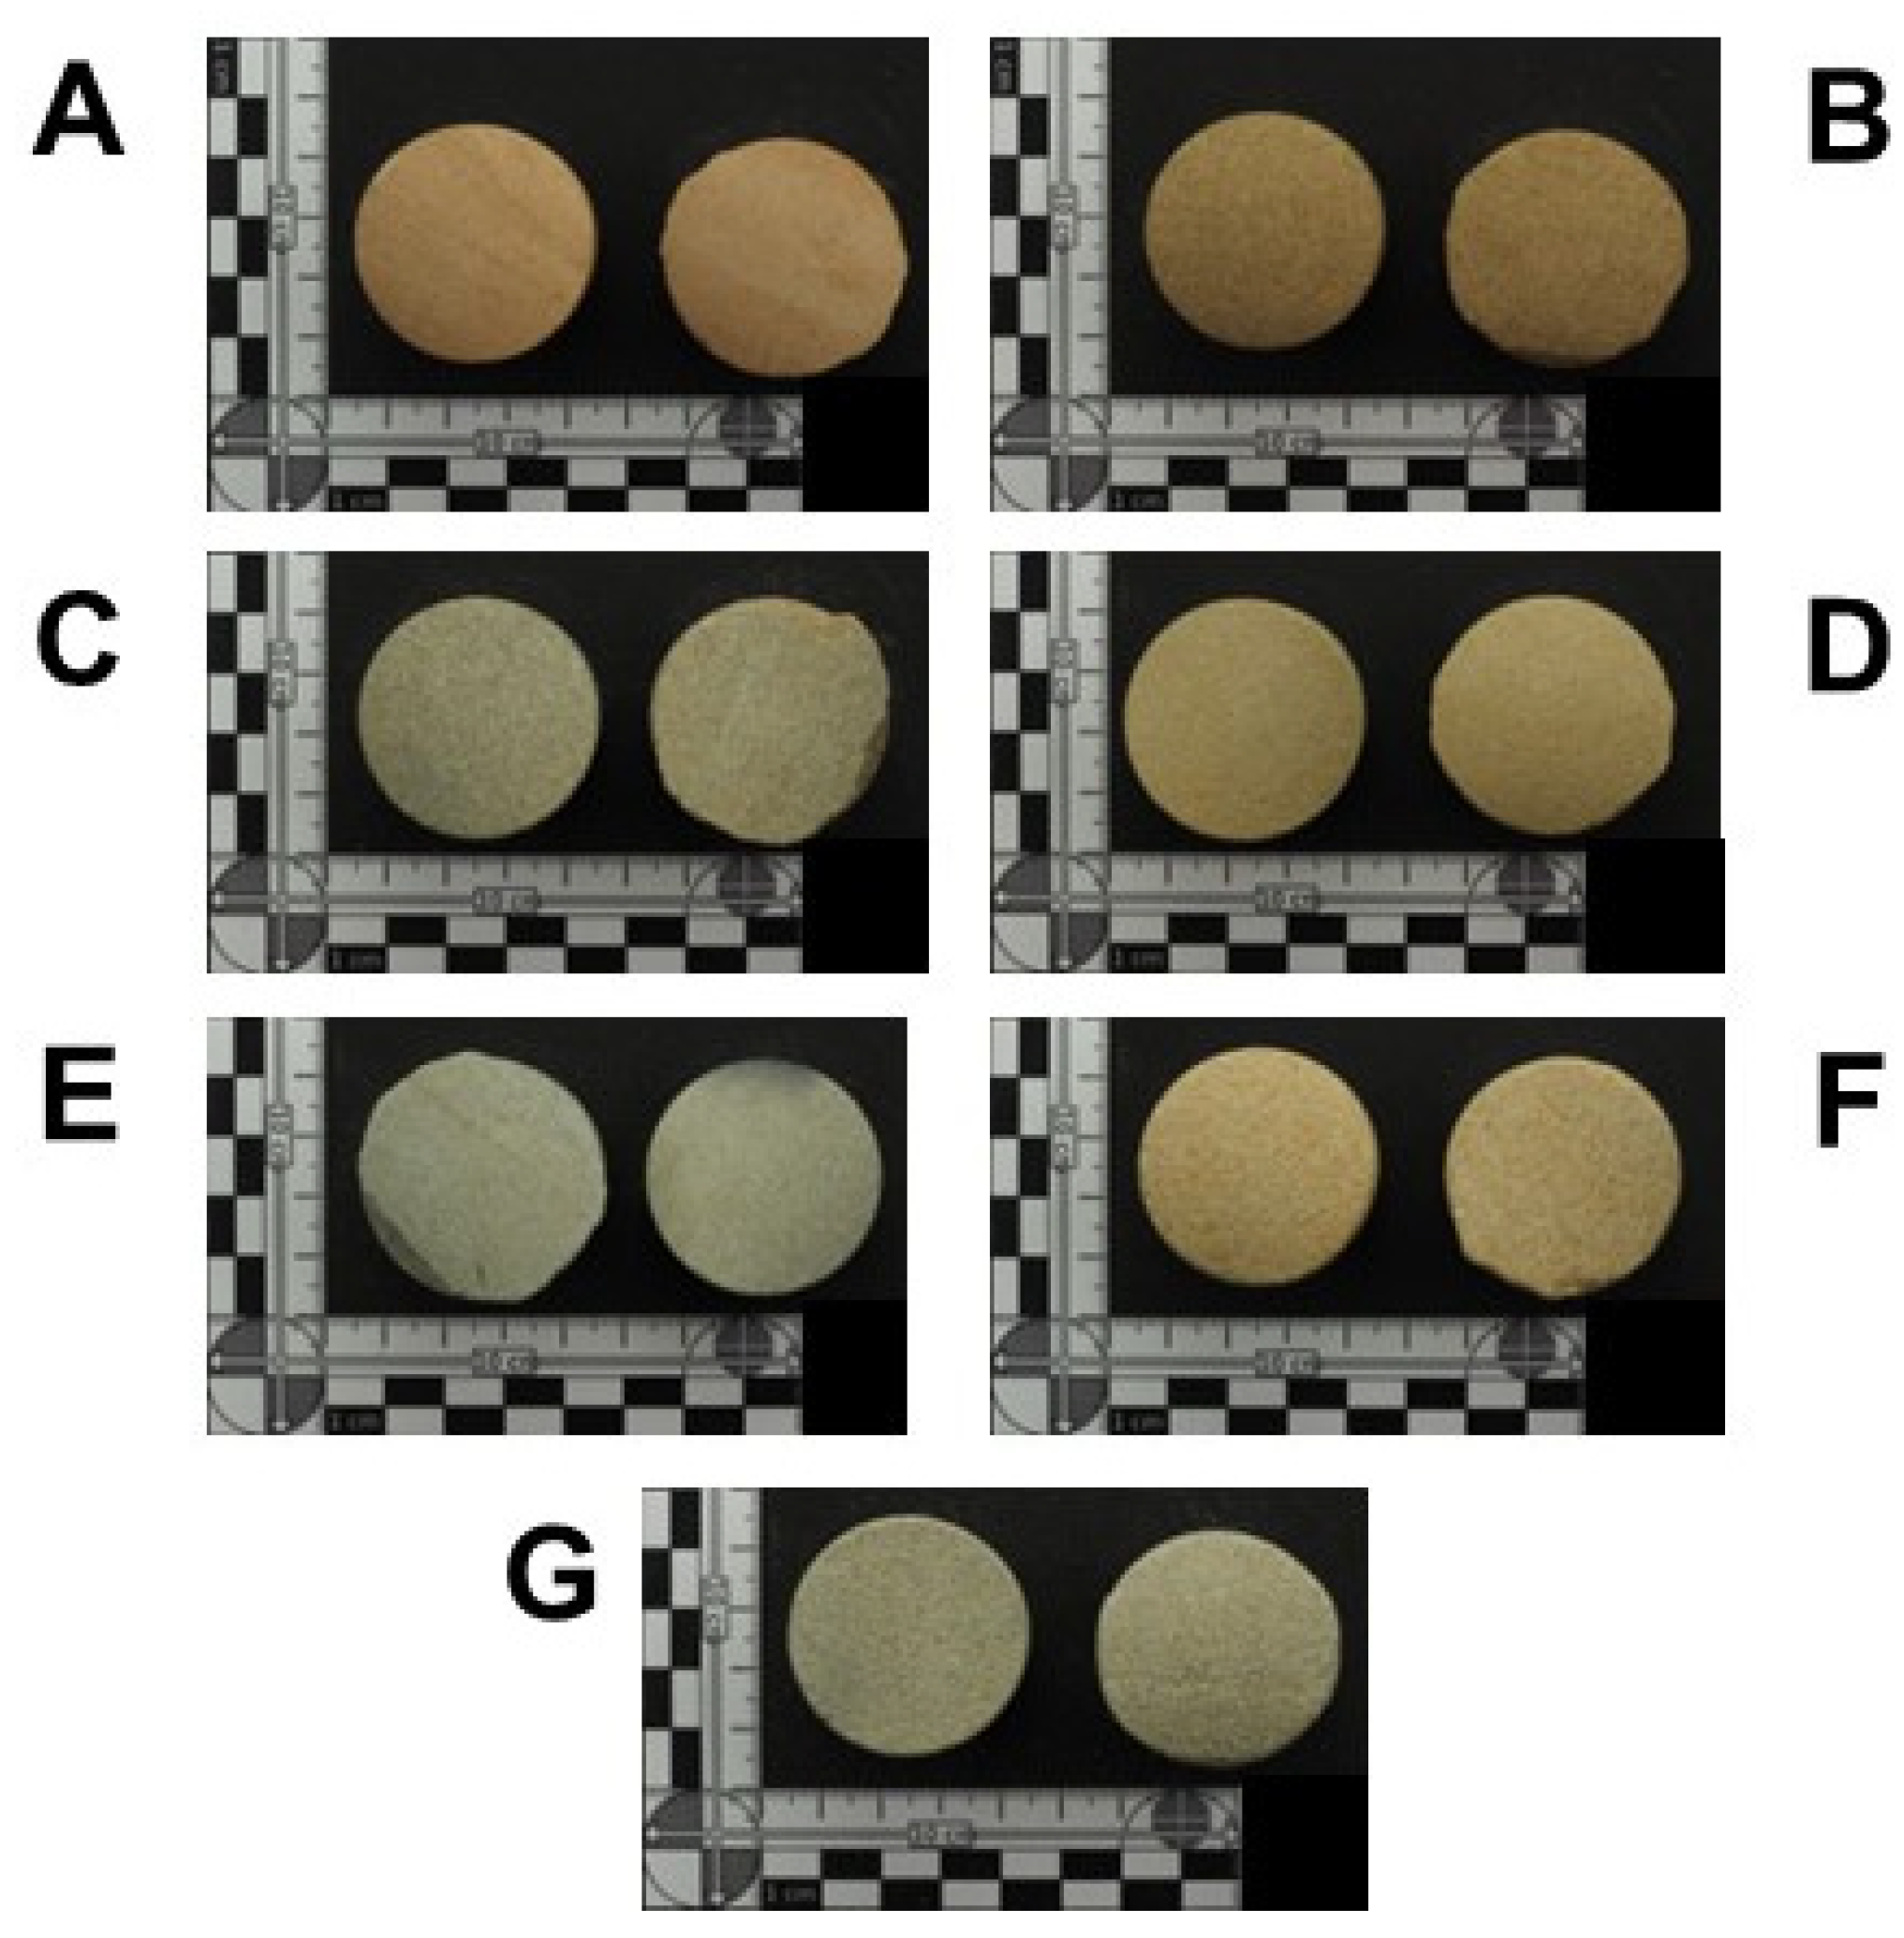
2.1. Plug Samples
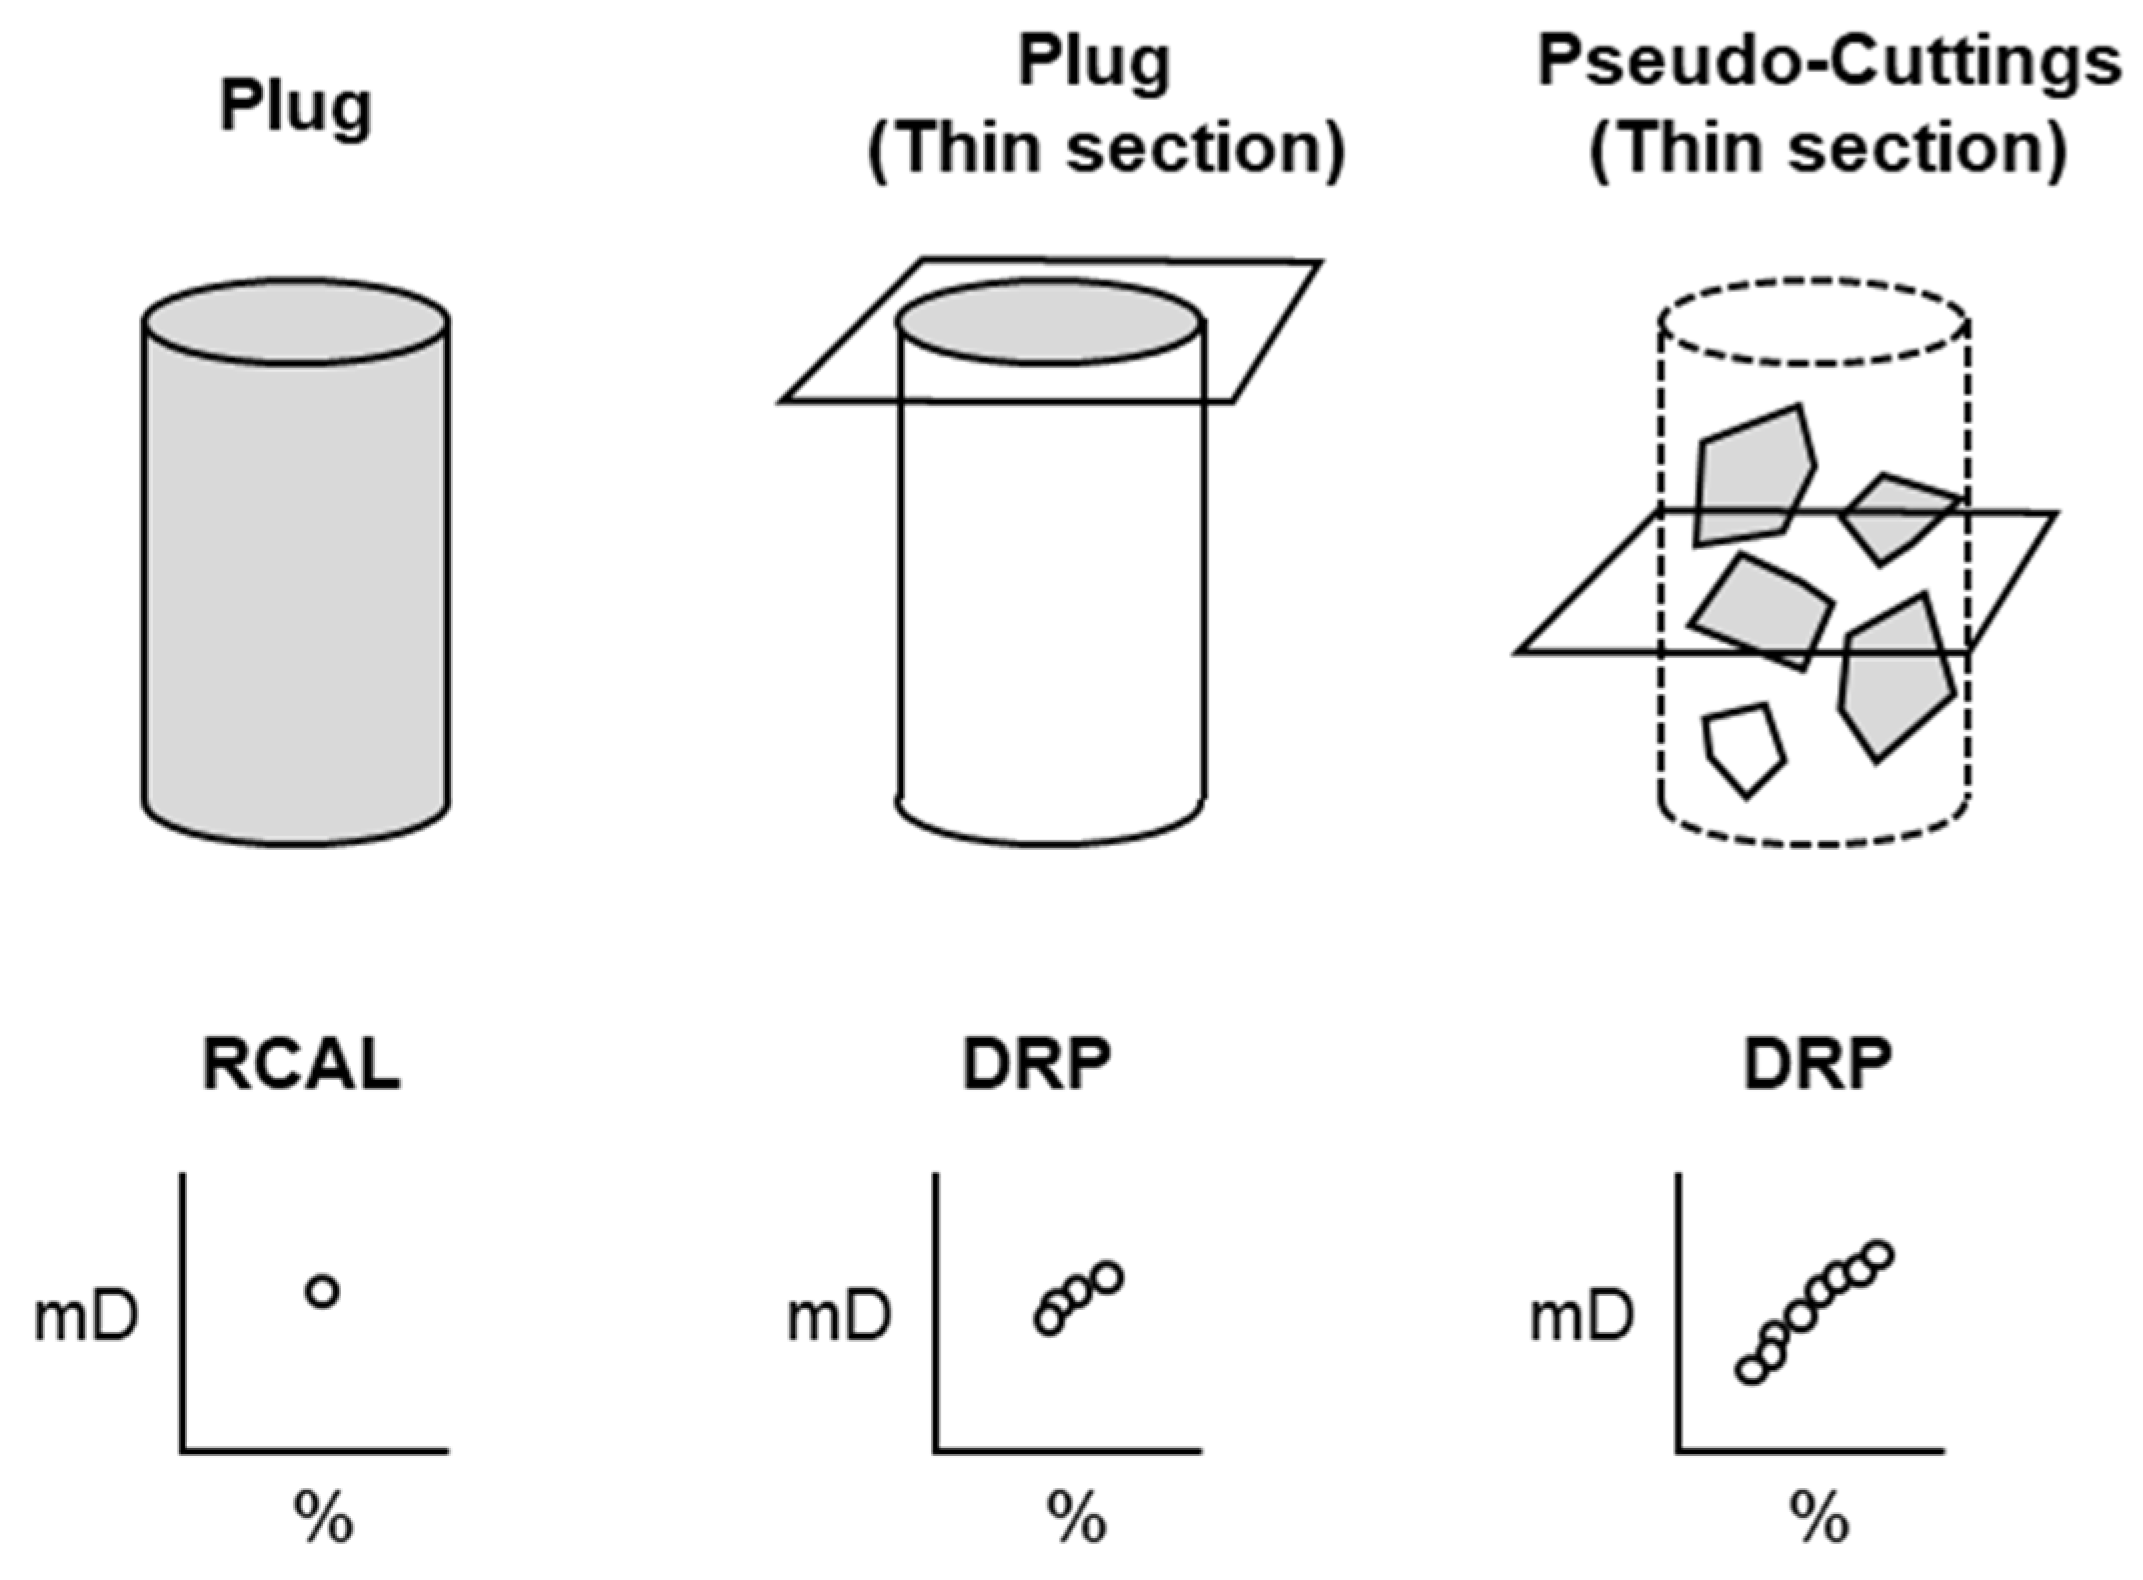
2.2. Routine Core Analysis in Plug Samples
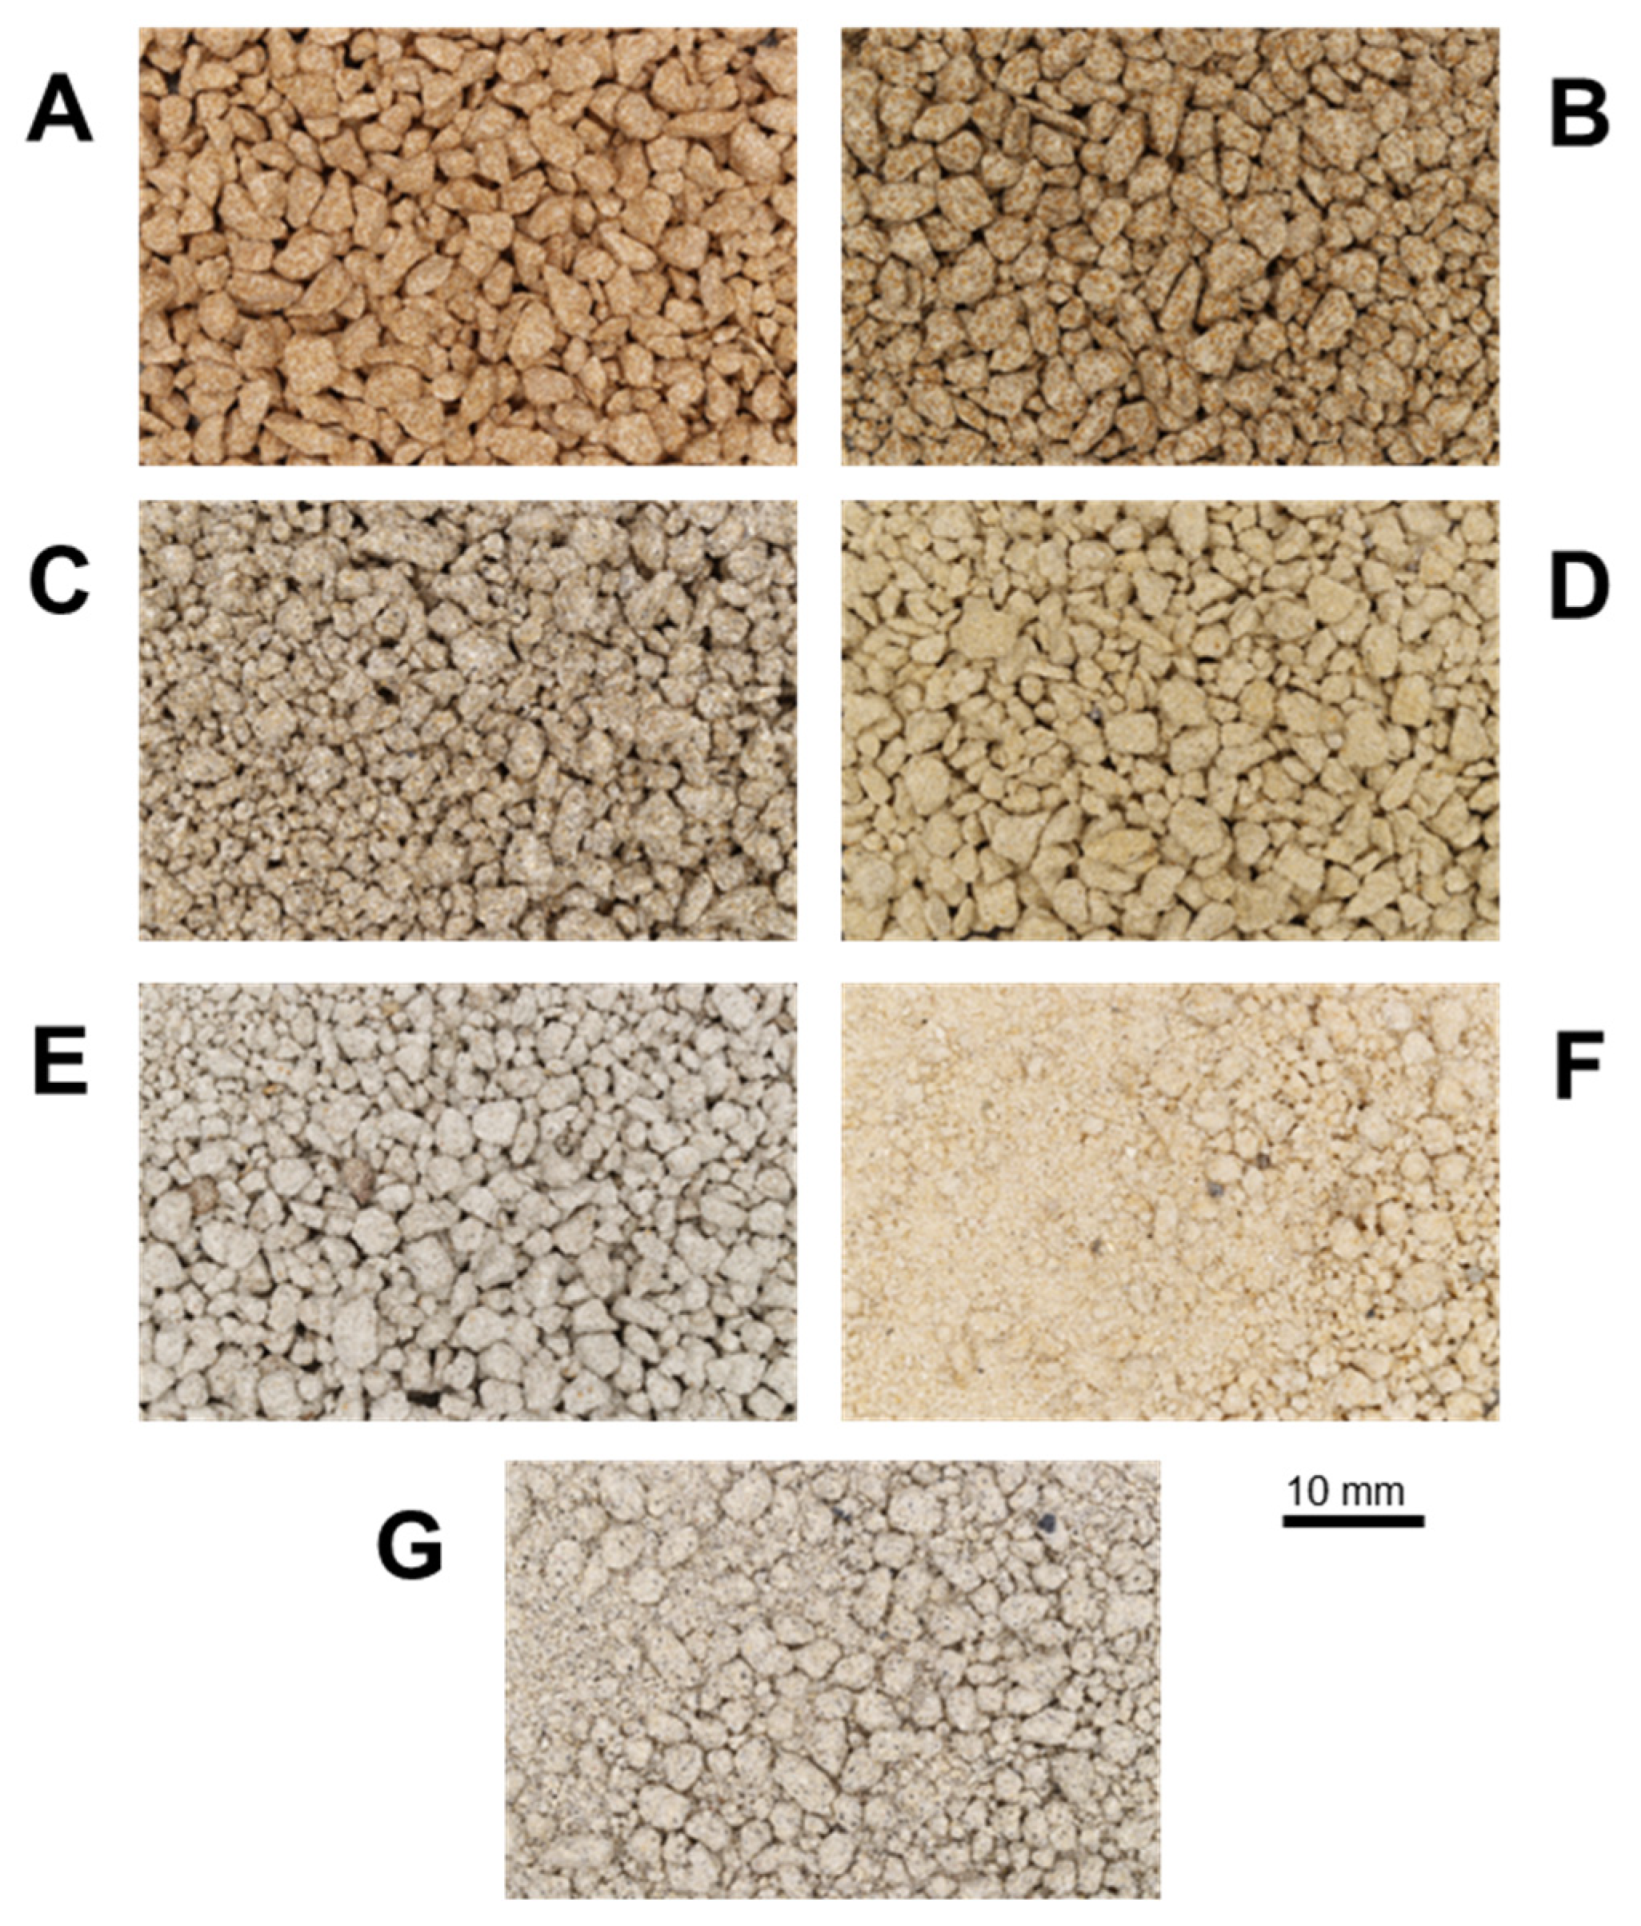
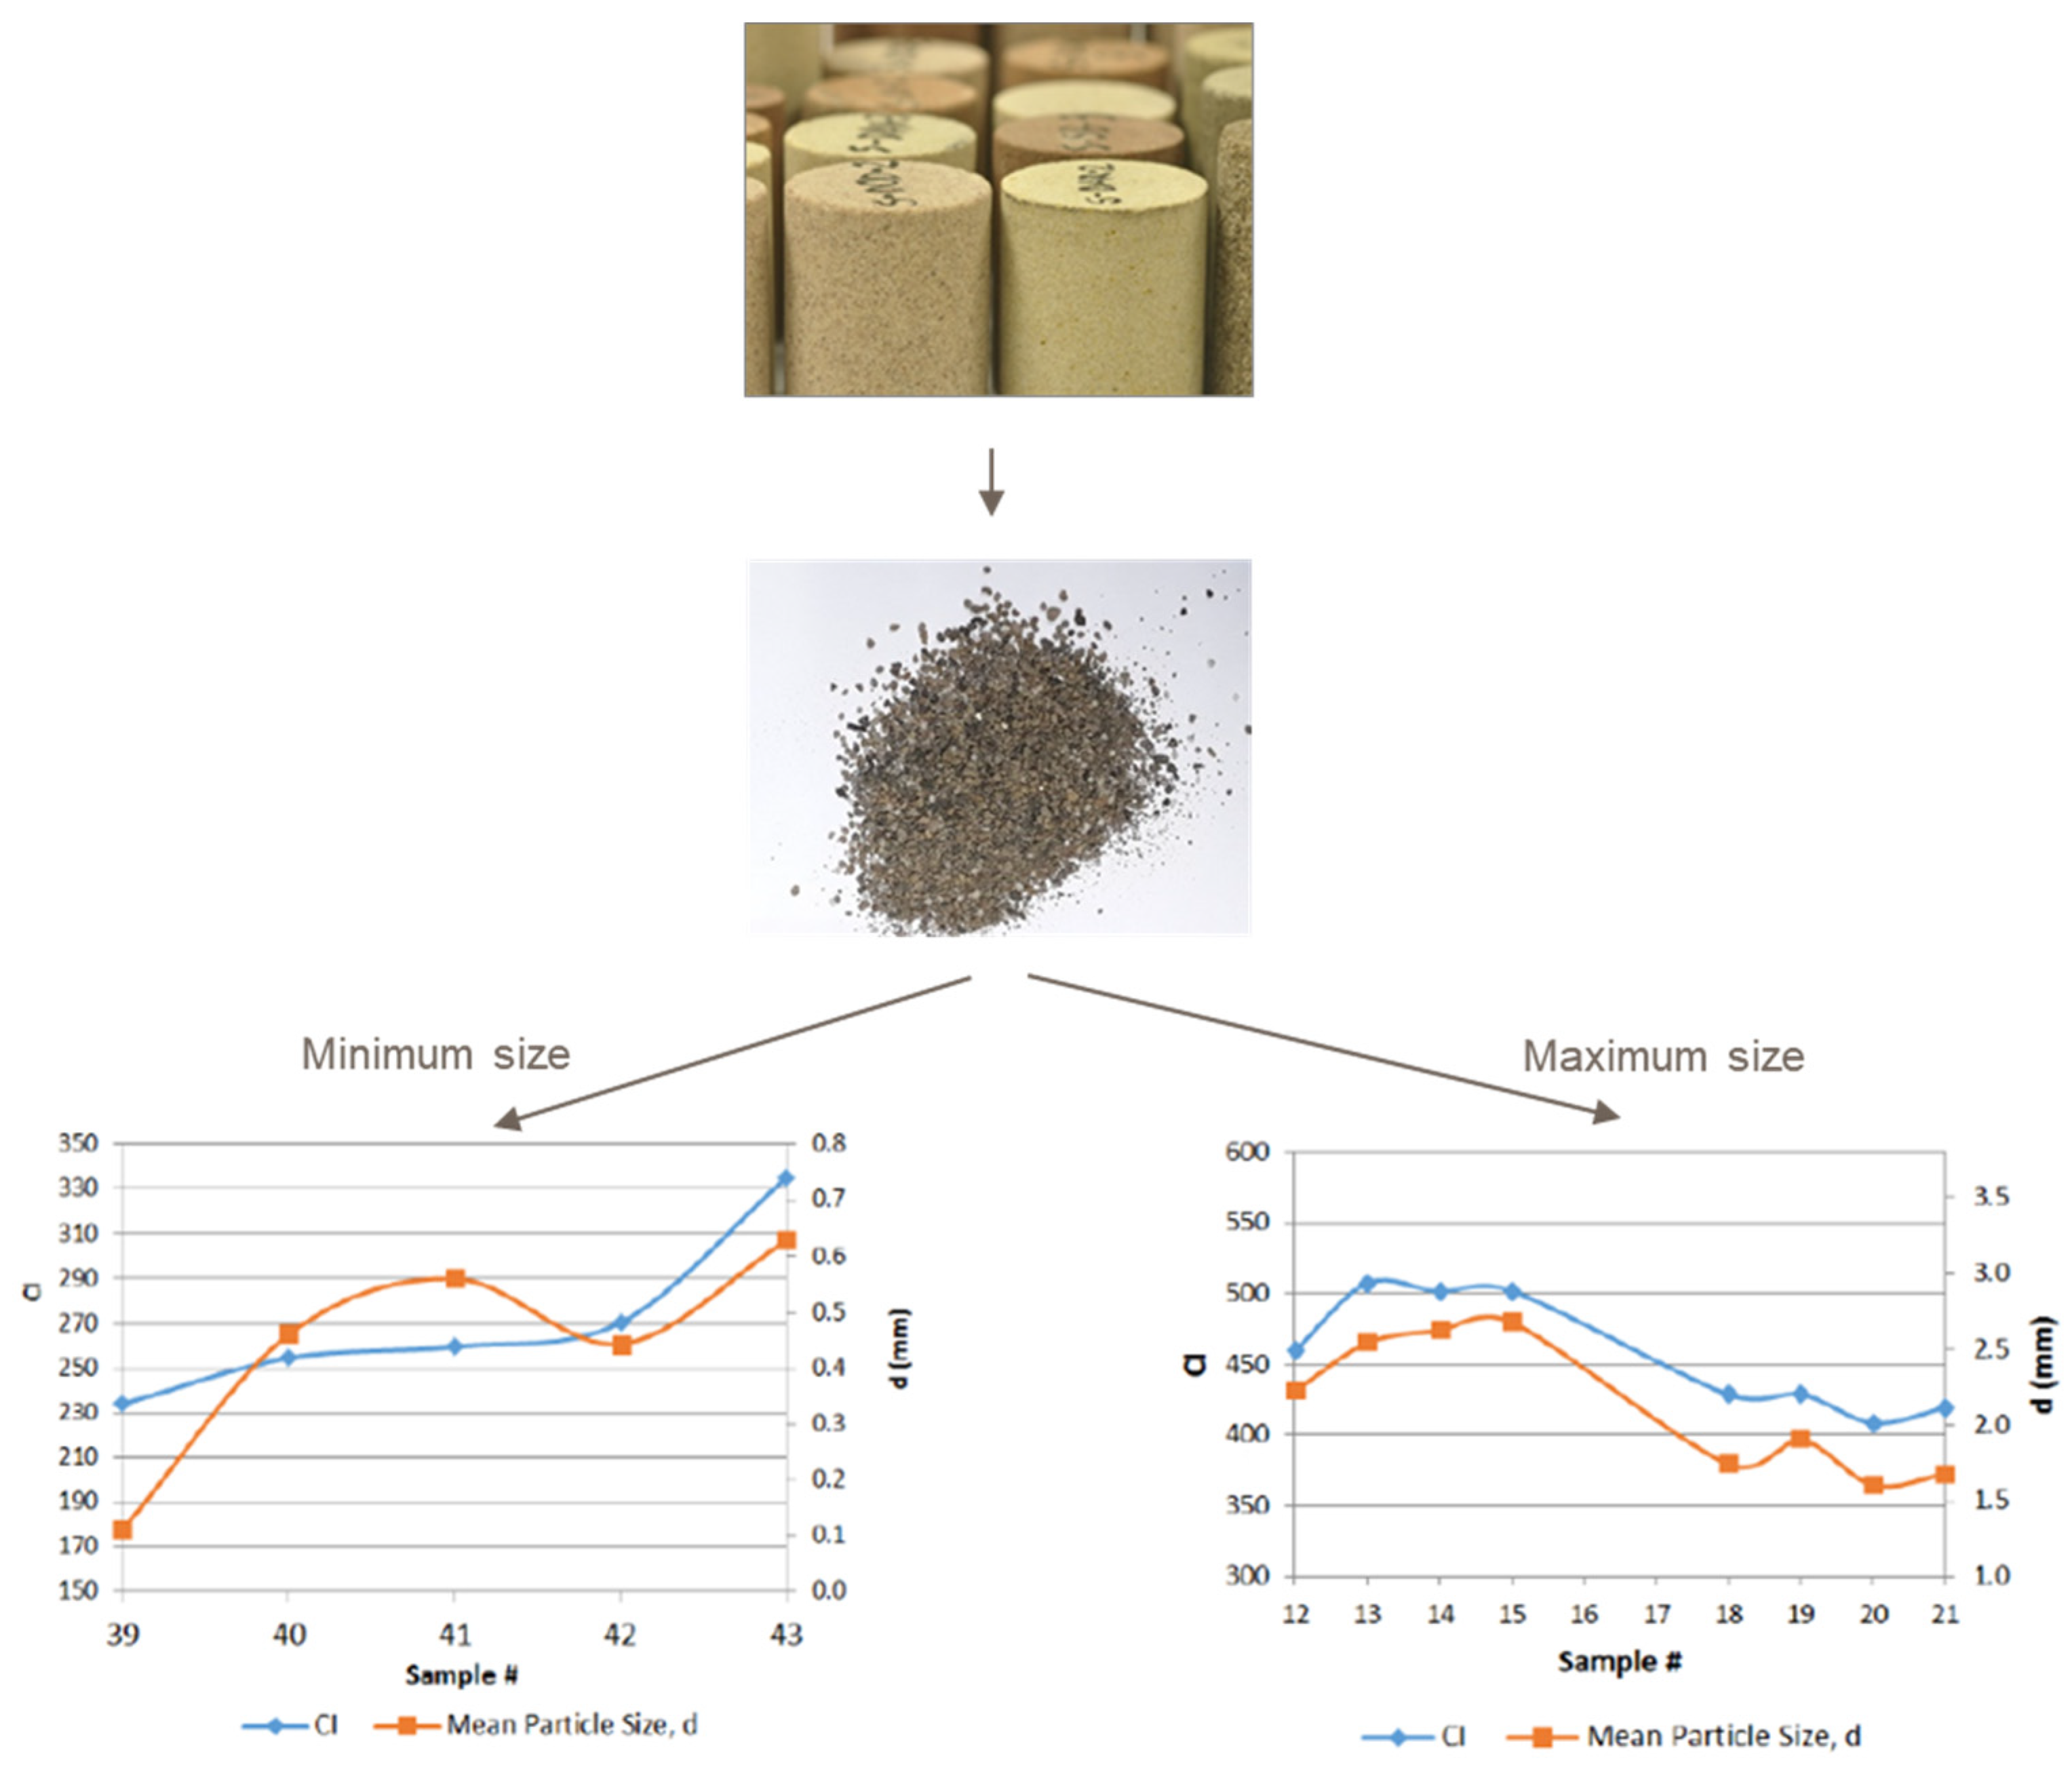
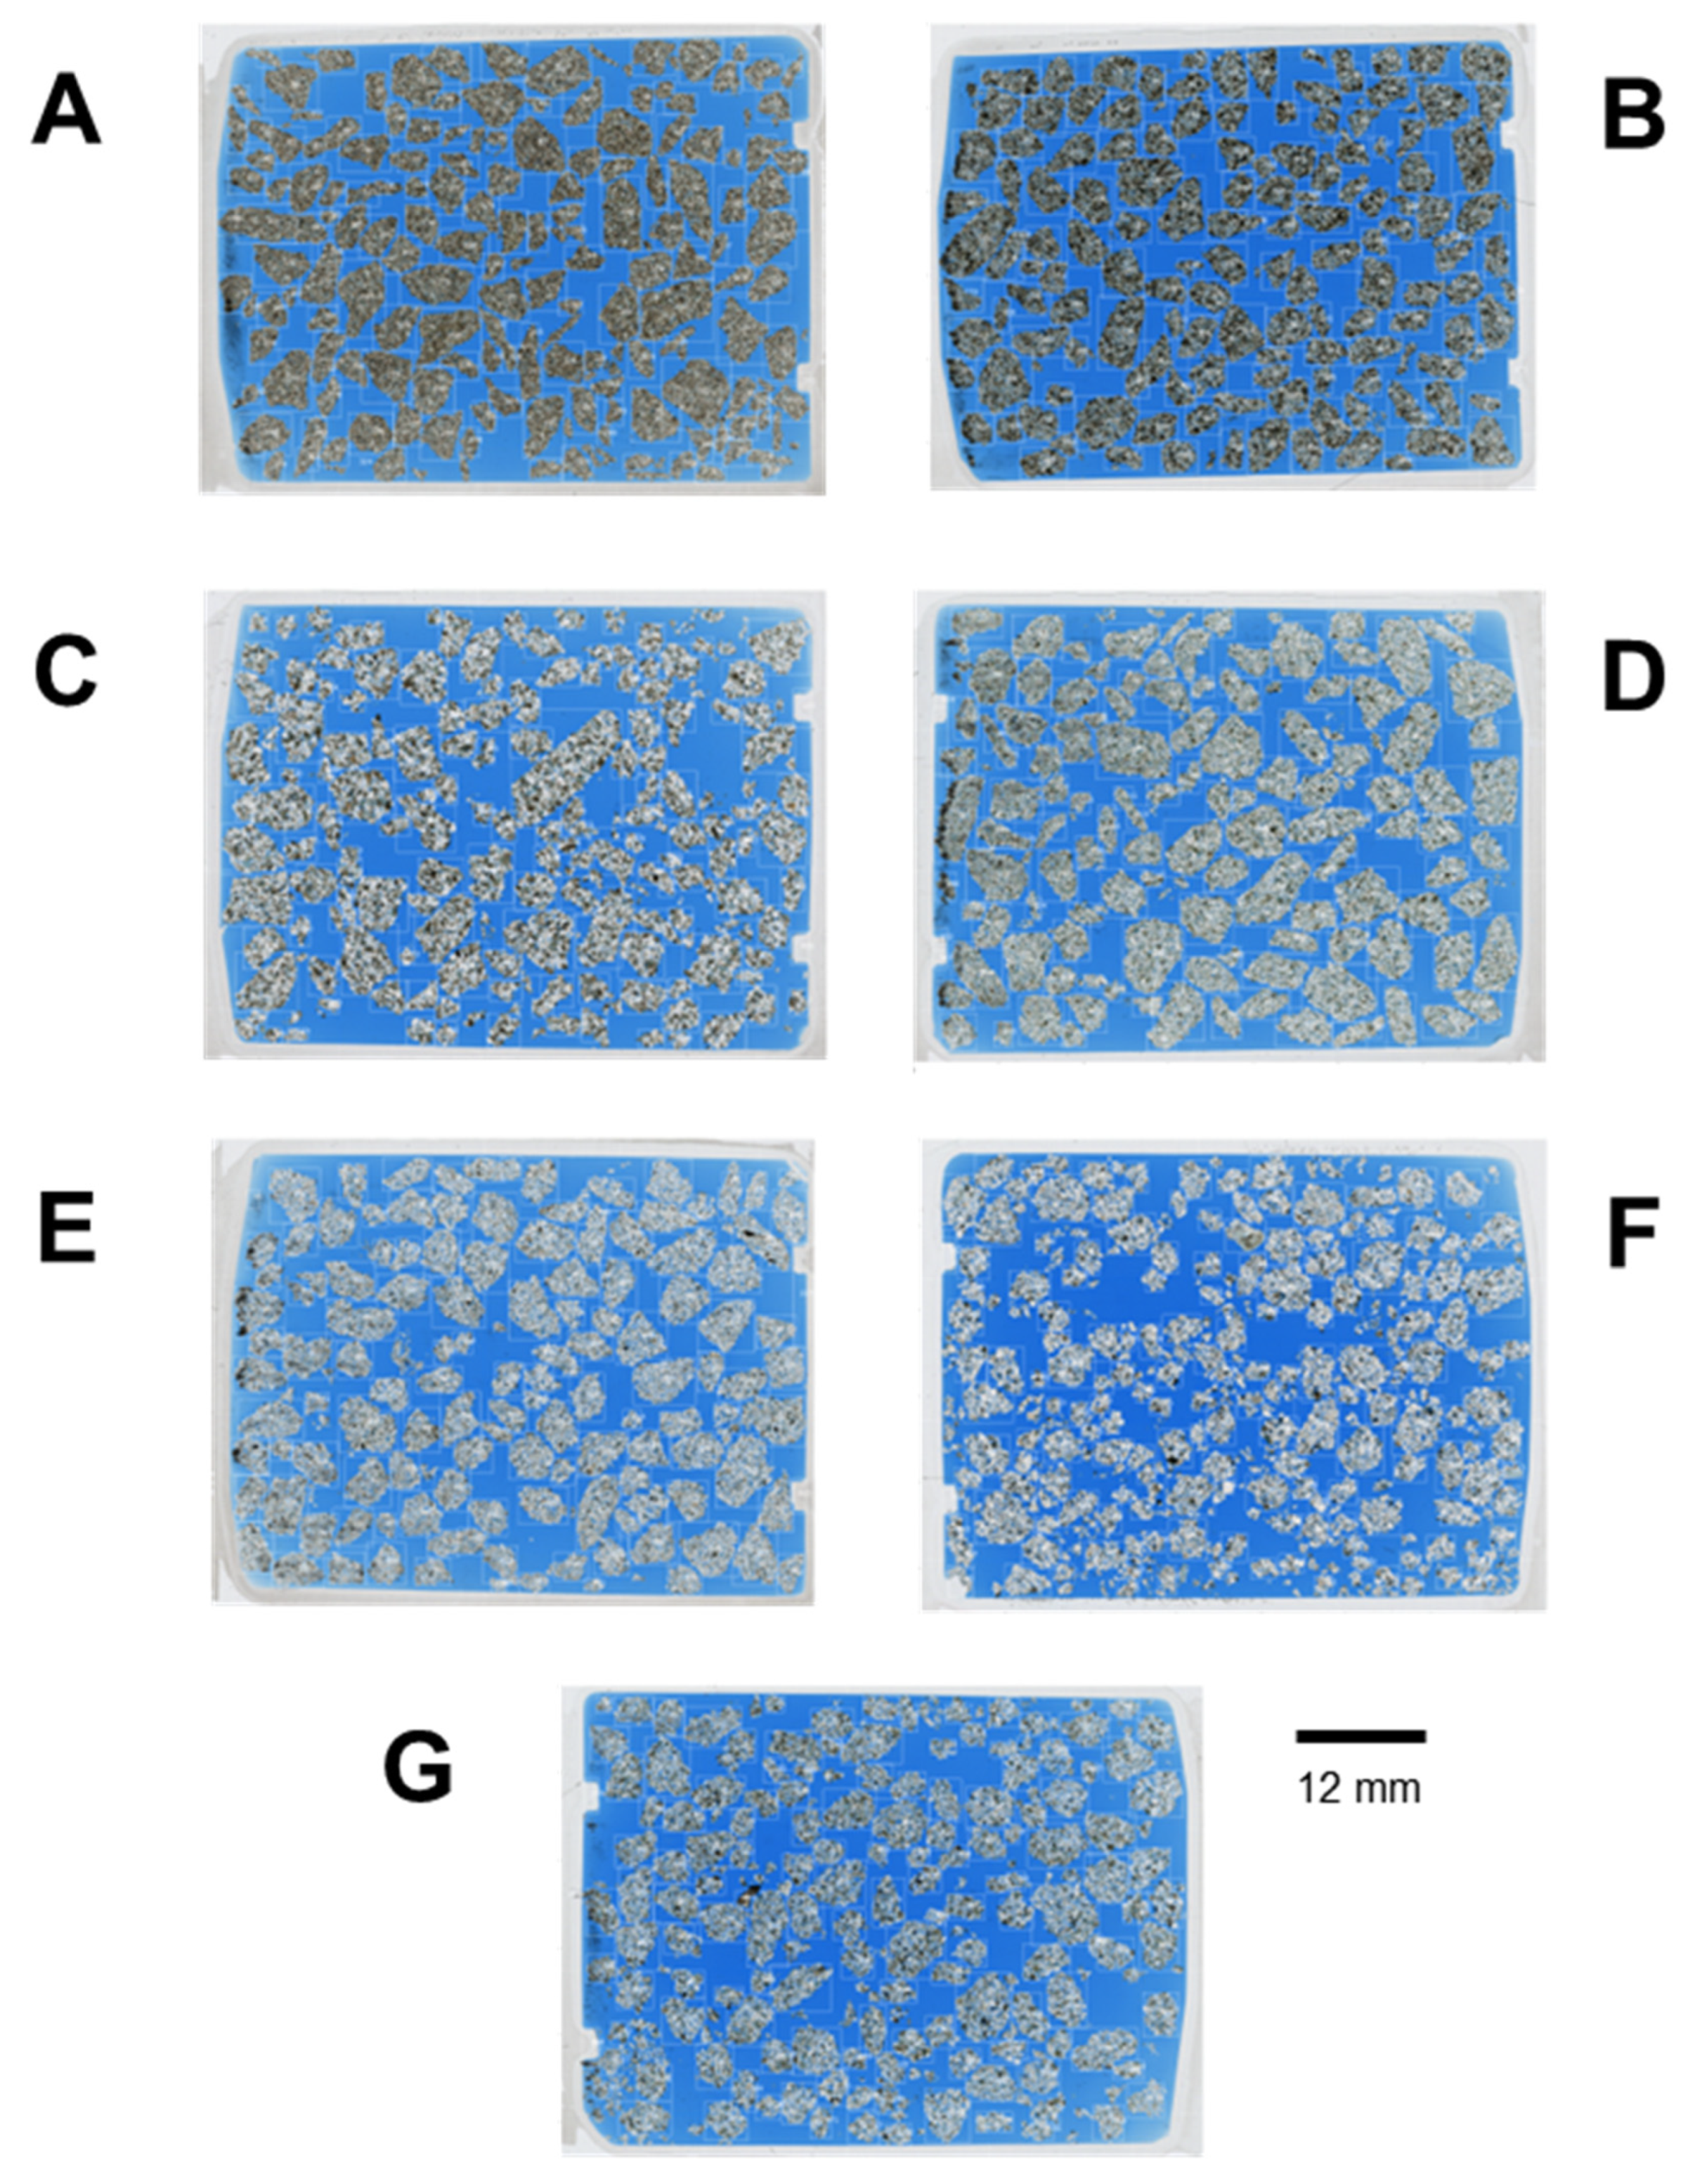
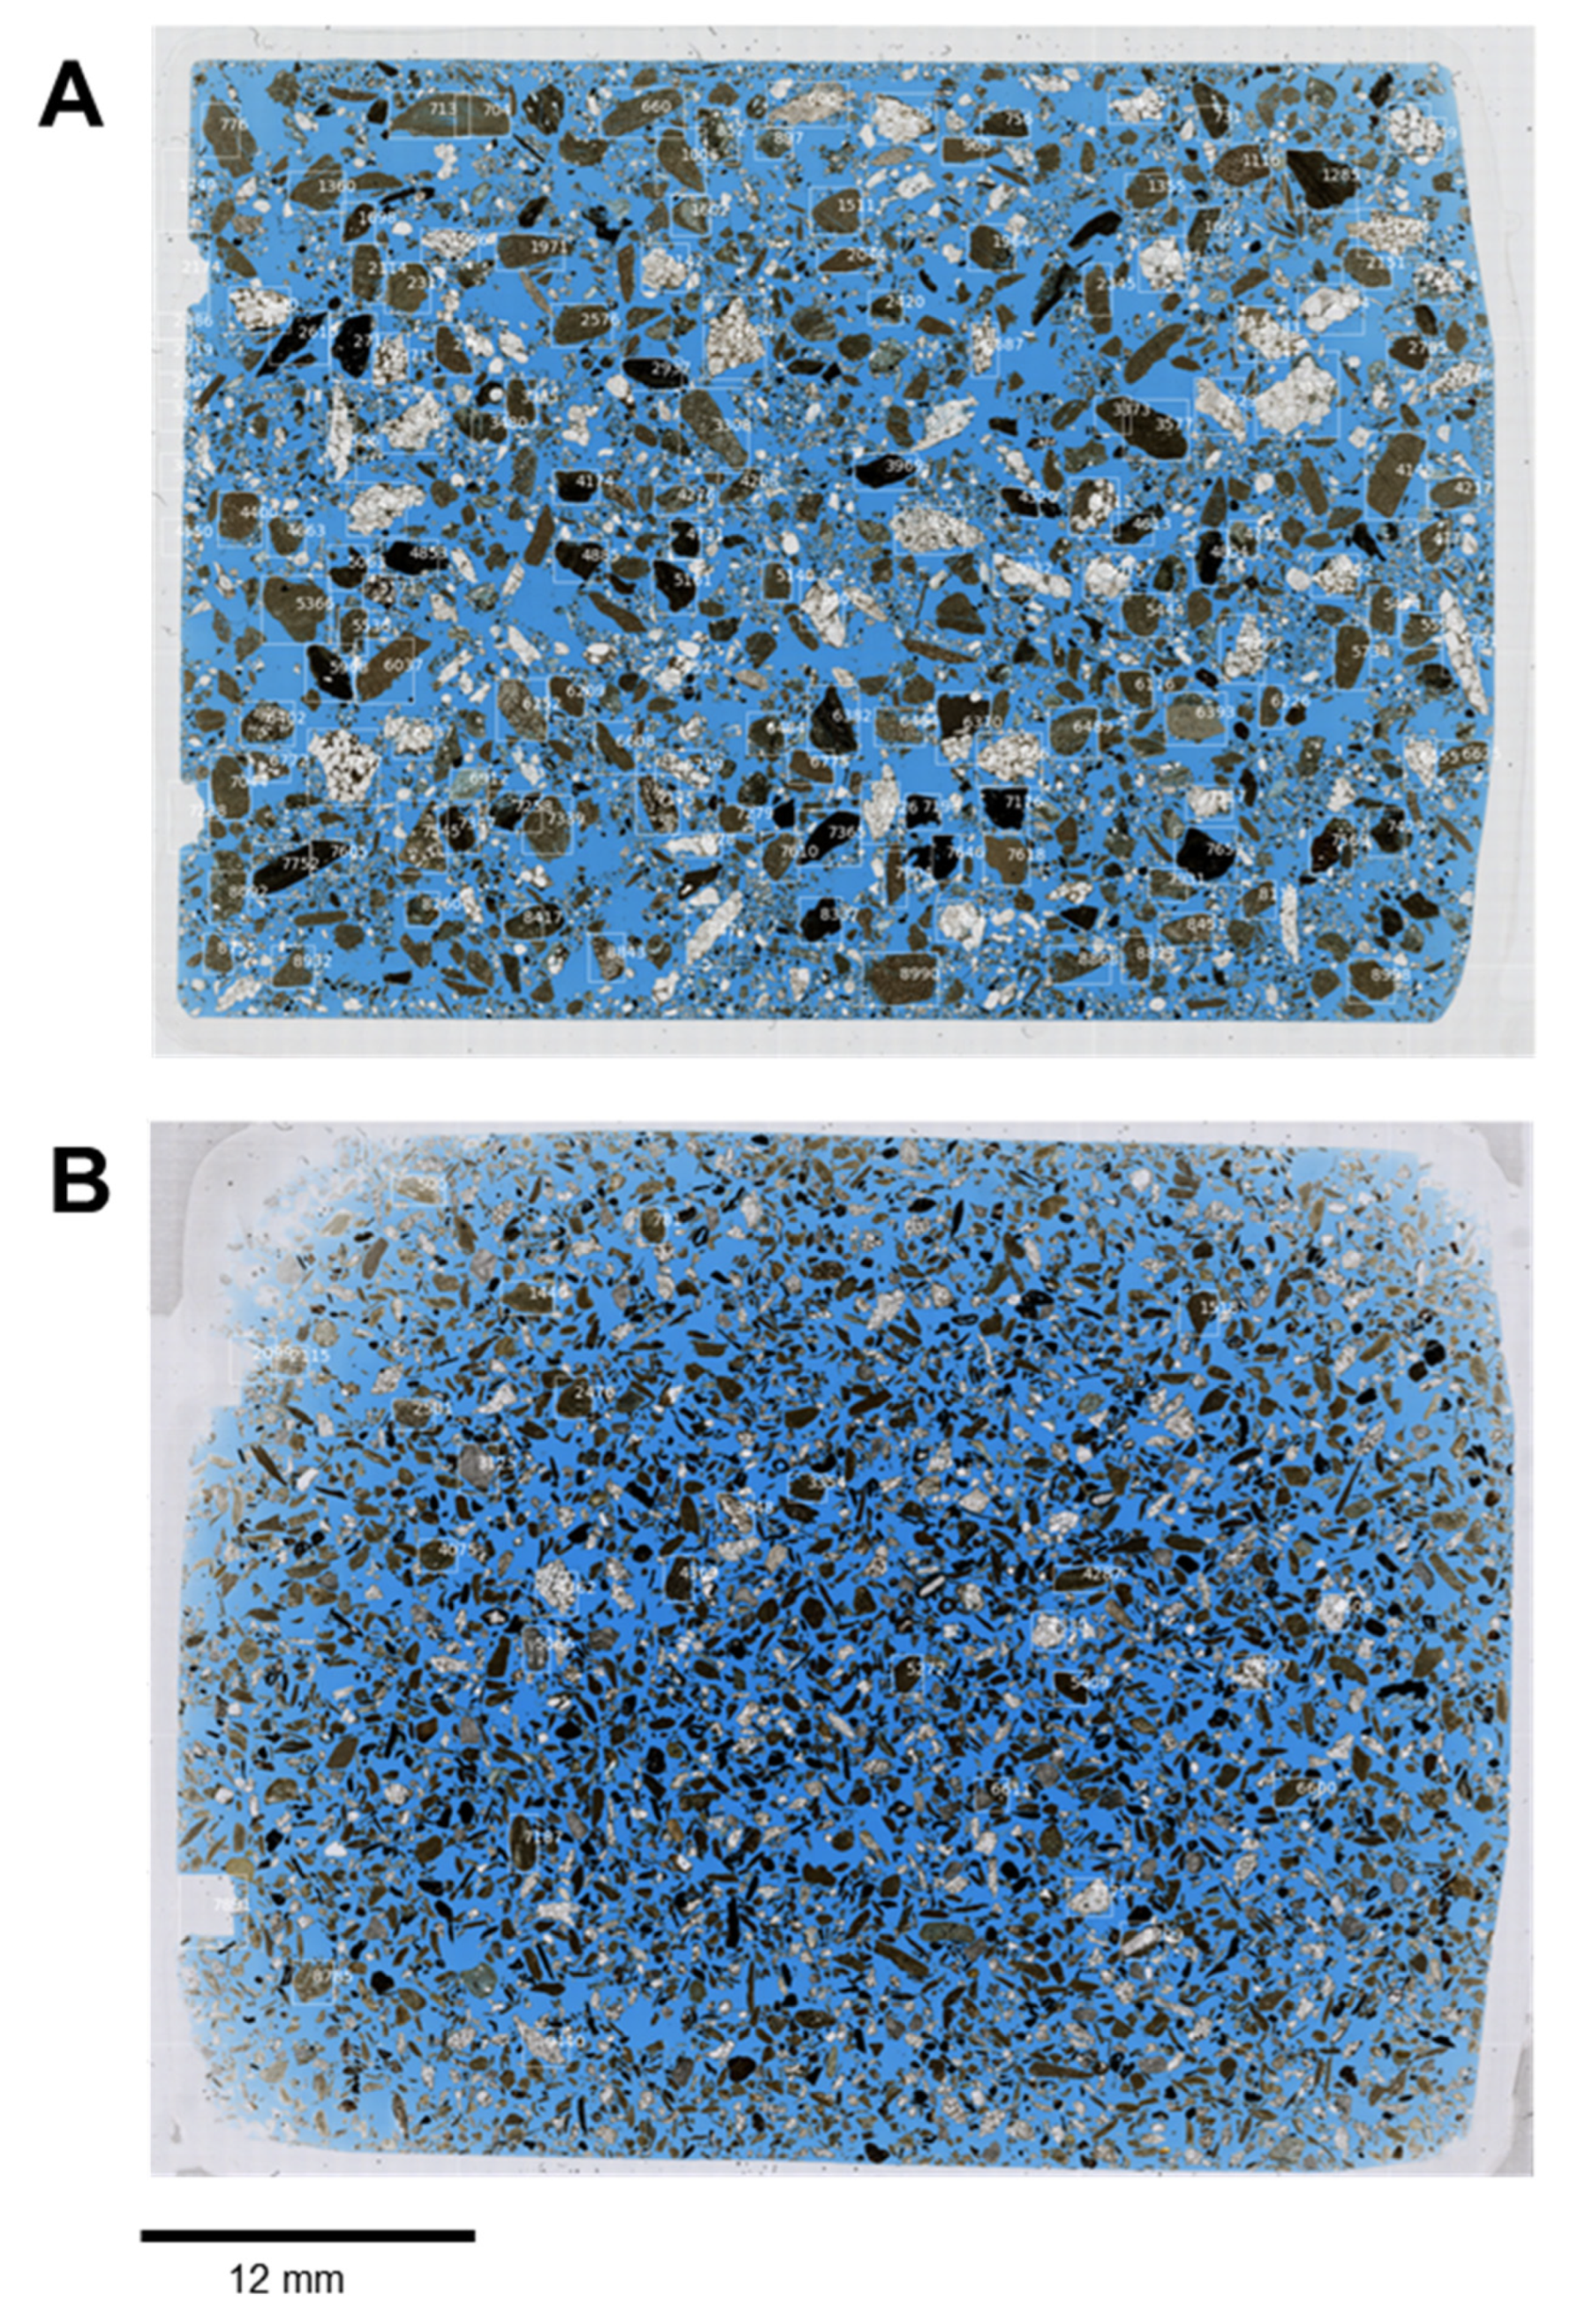
2.3. Pseudo-Cuttings Generation
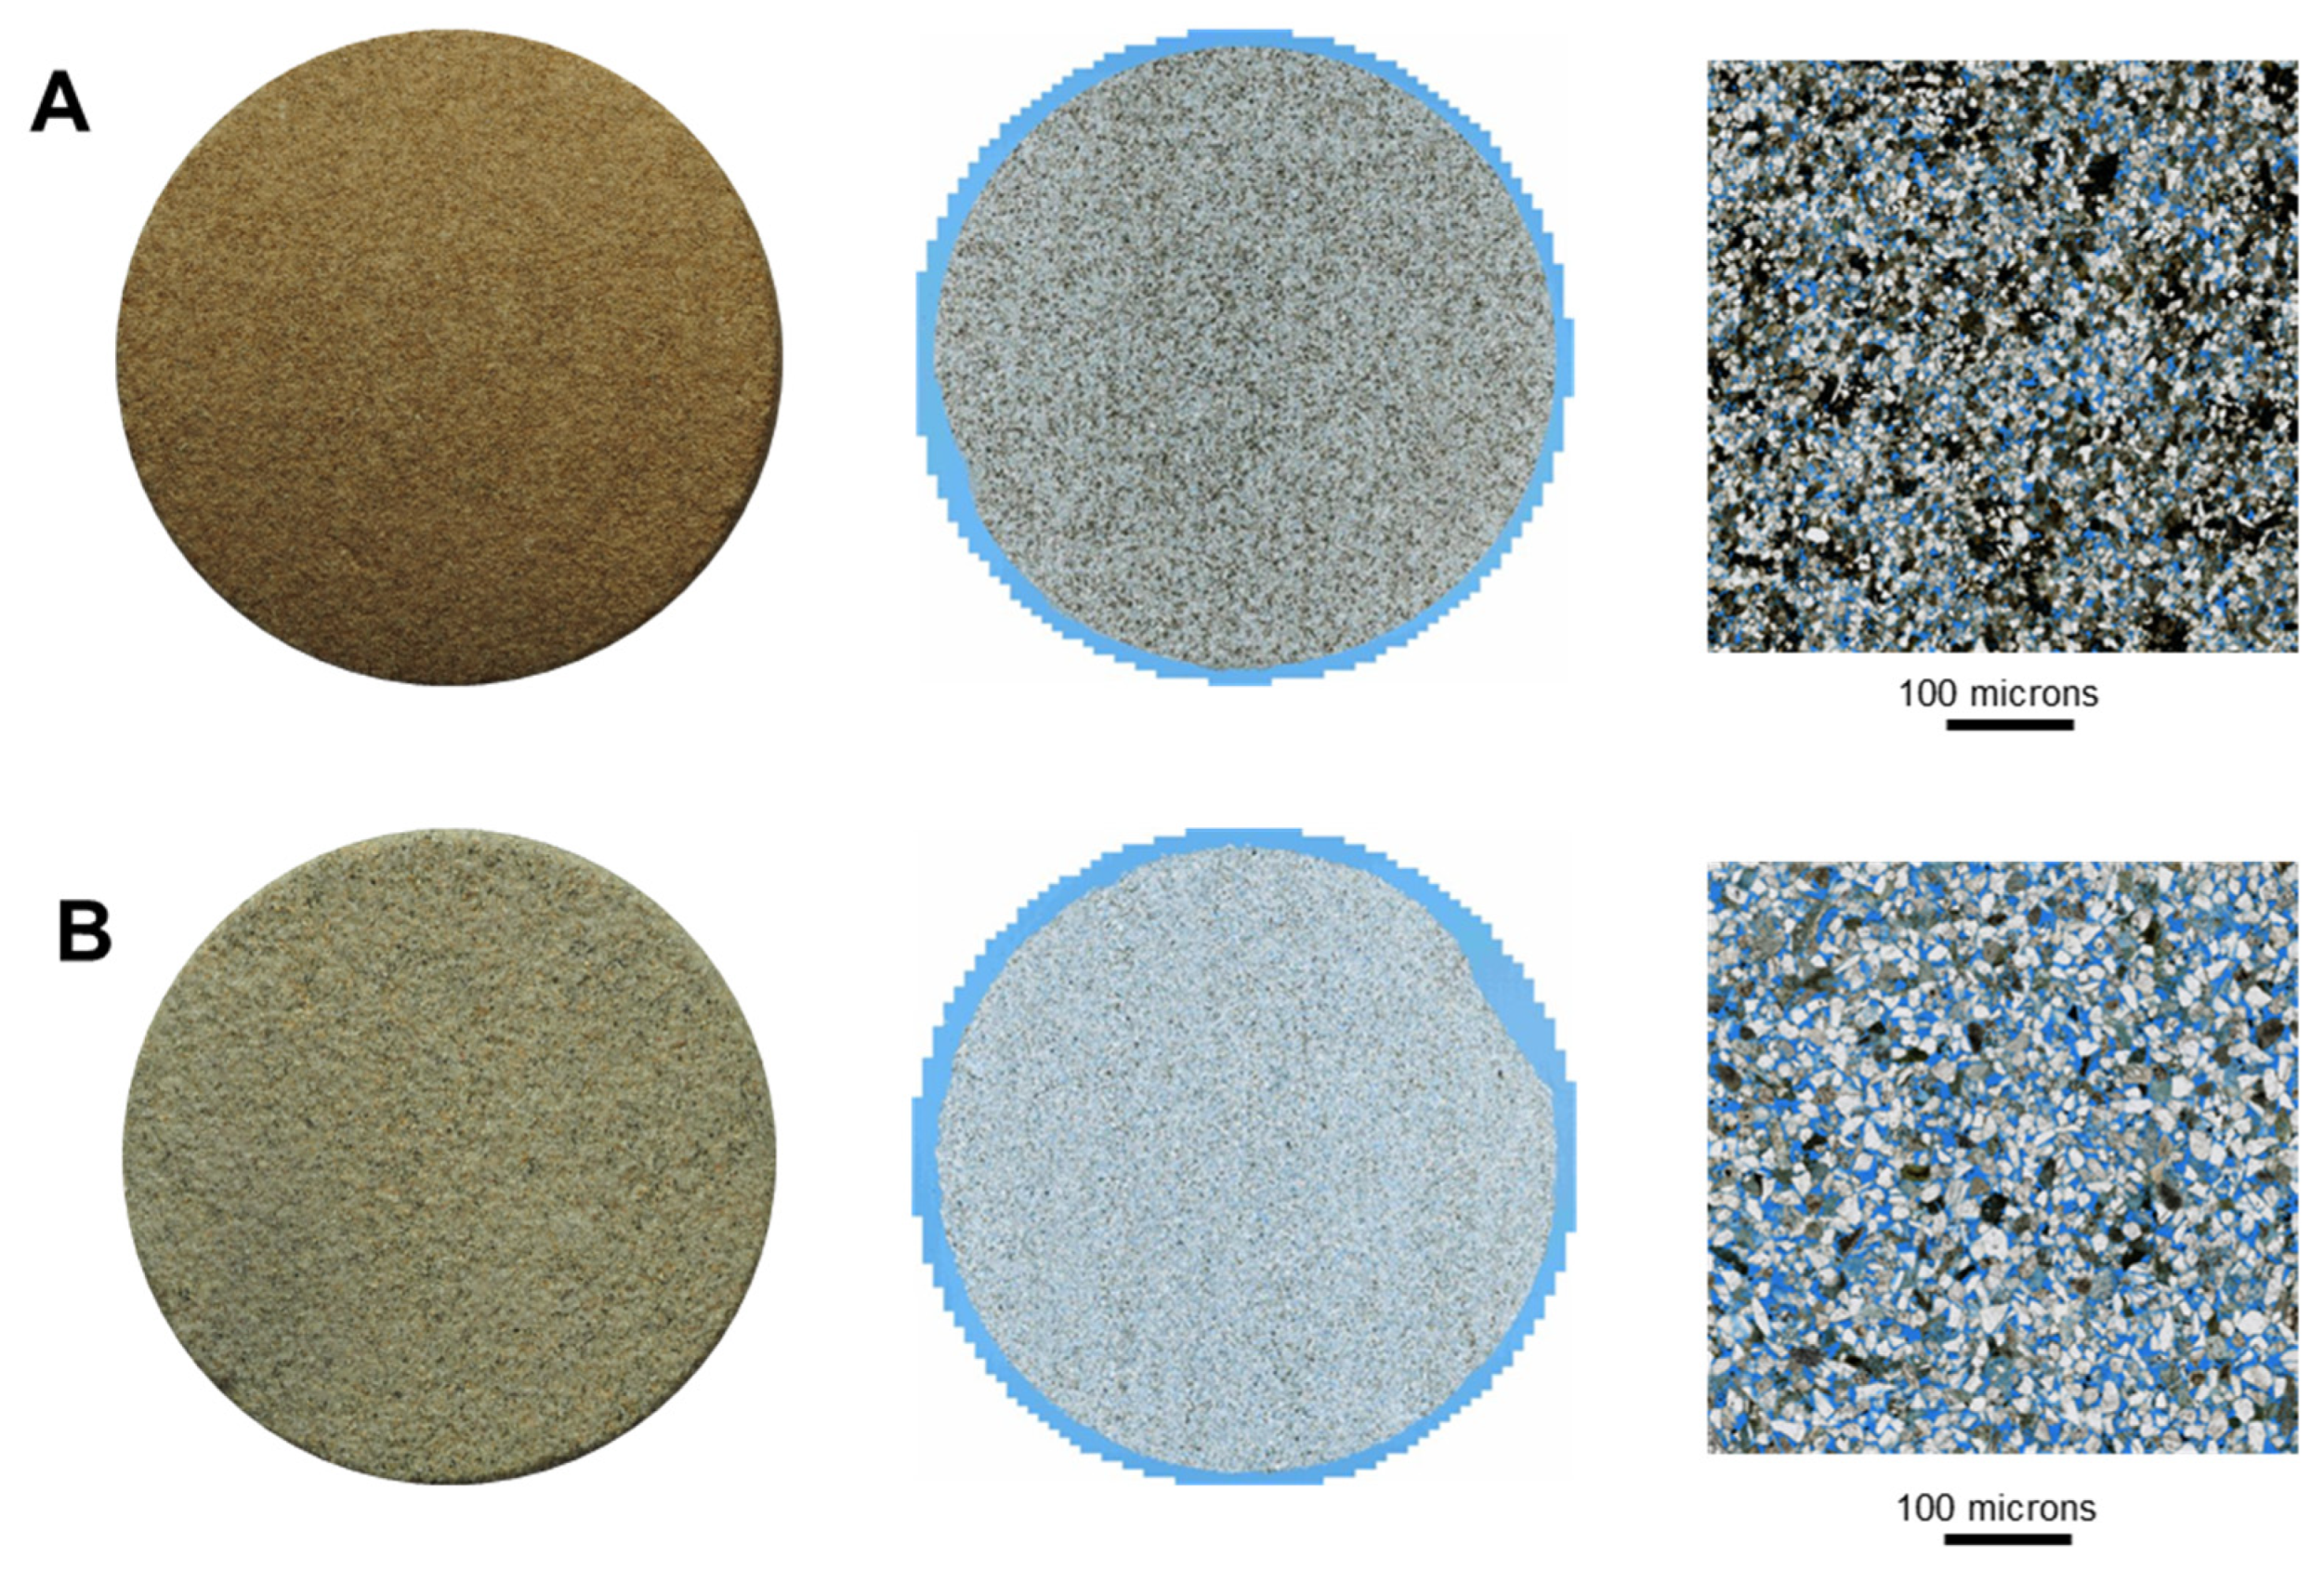
2.4. Thin Section Preparation
2.5. Thin Section Scan
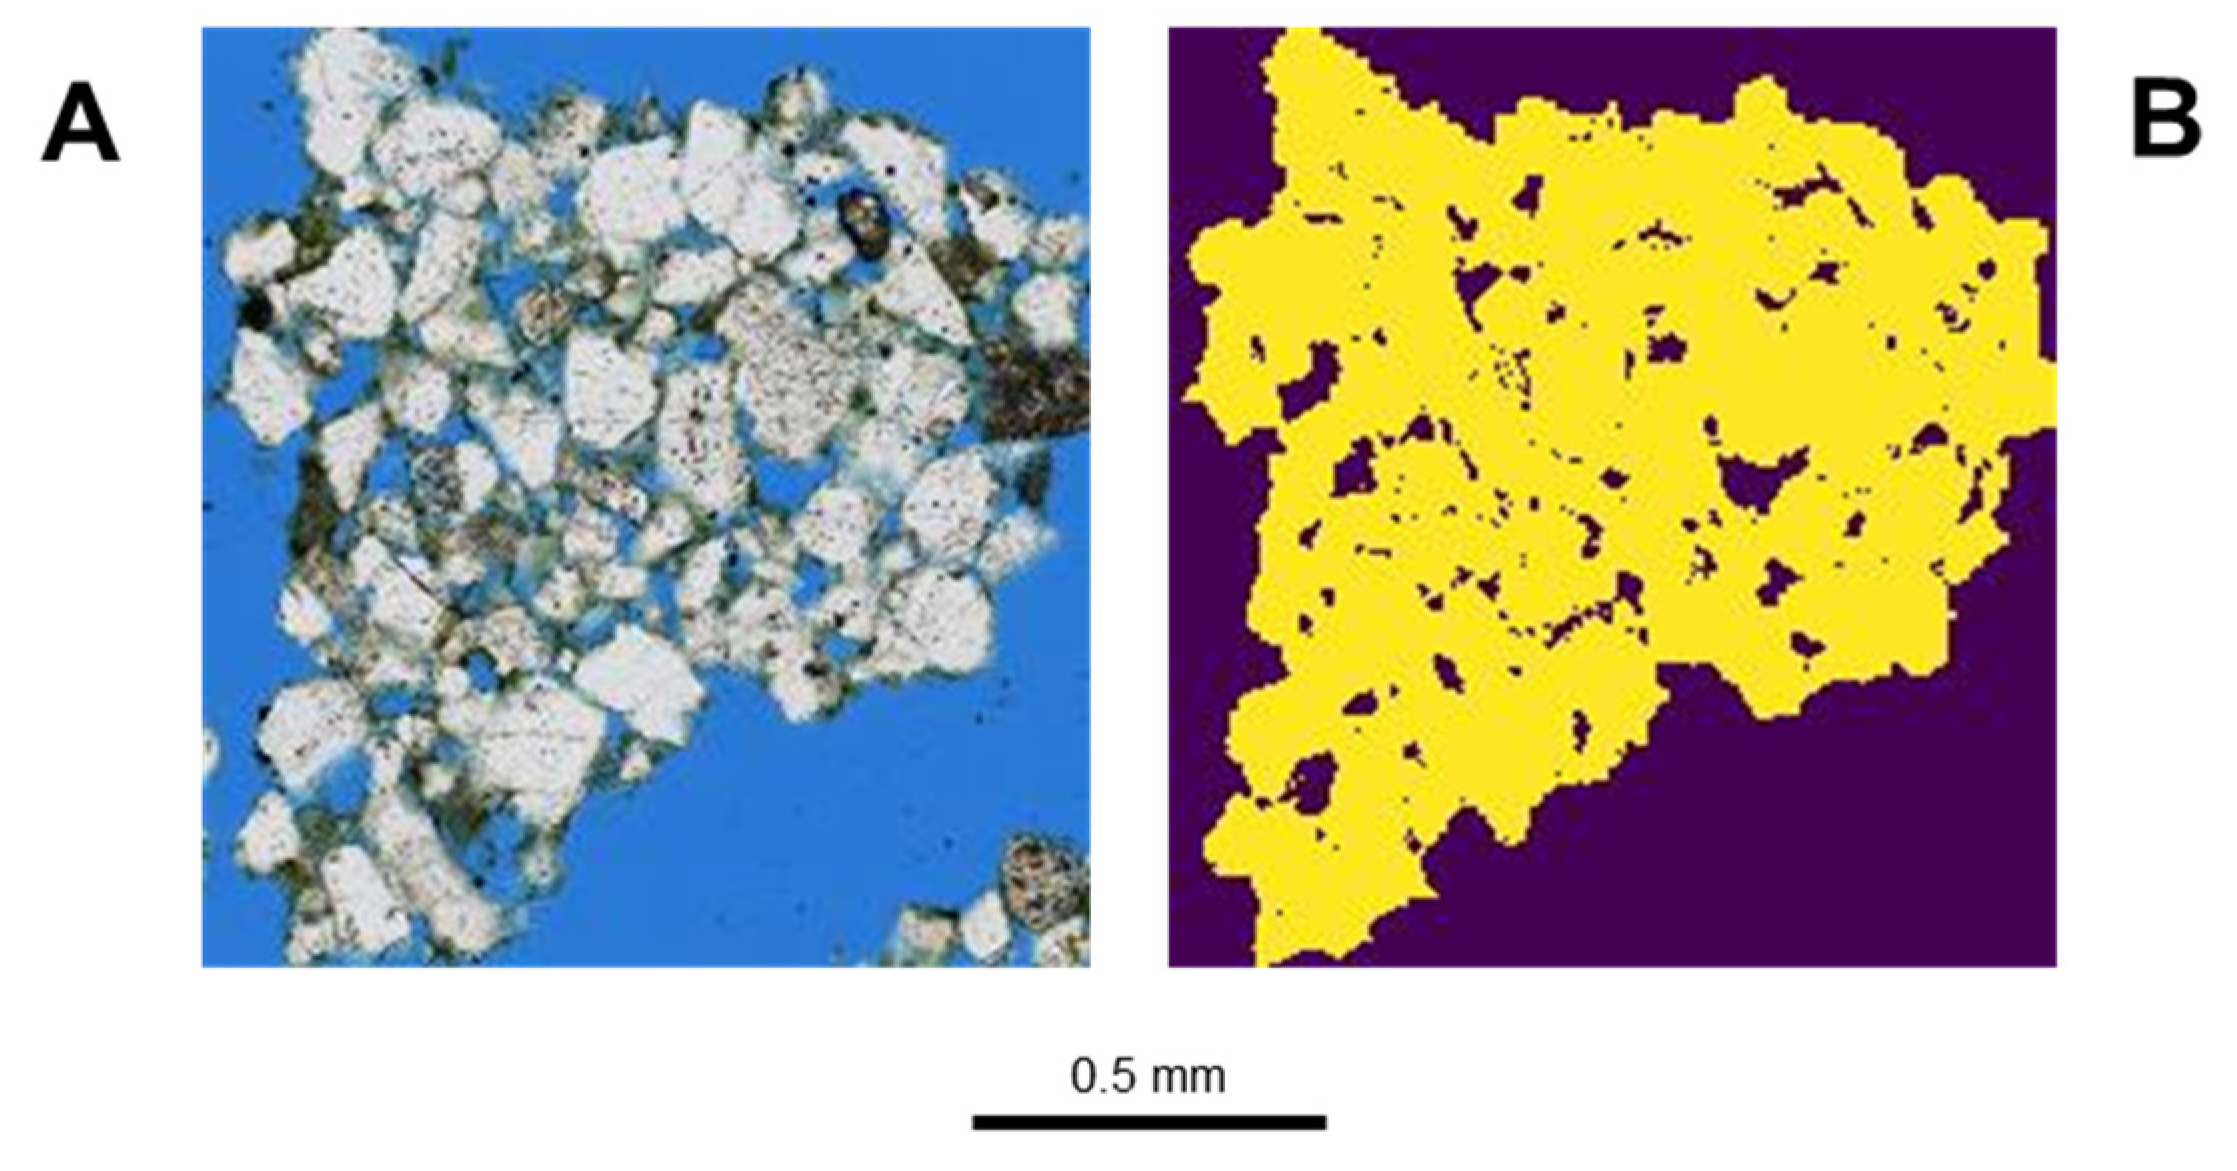
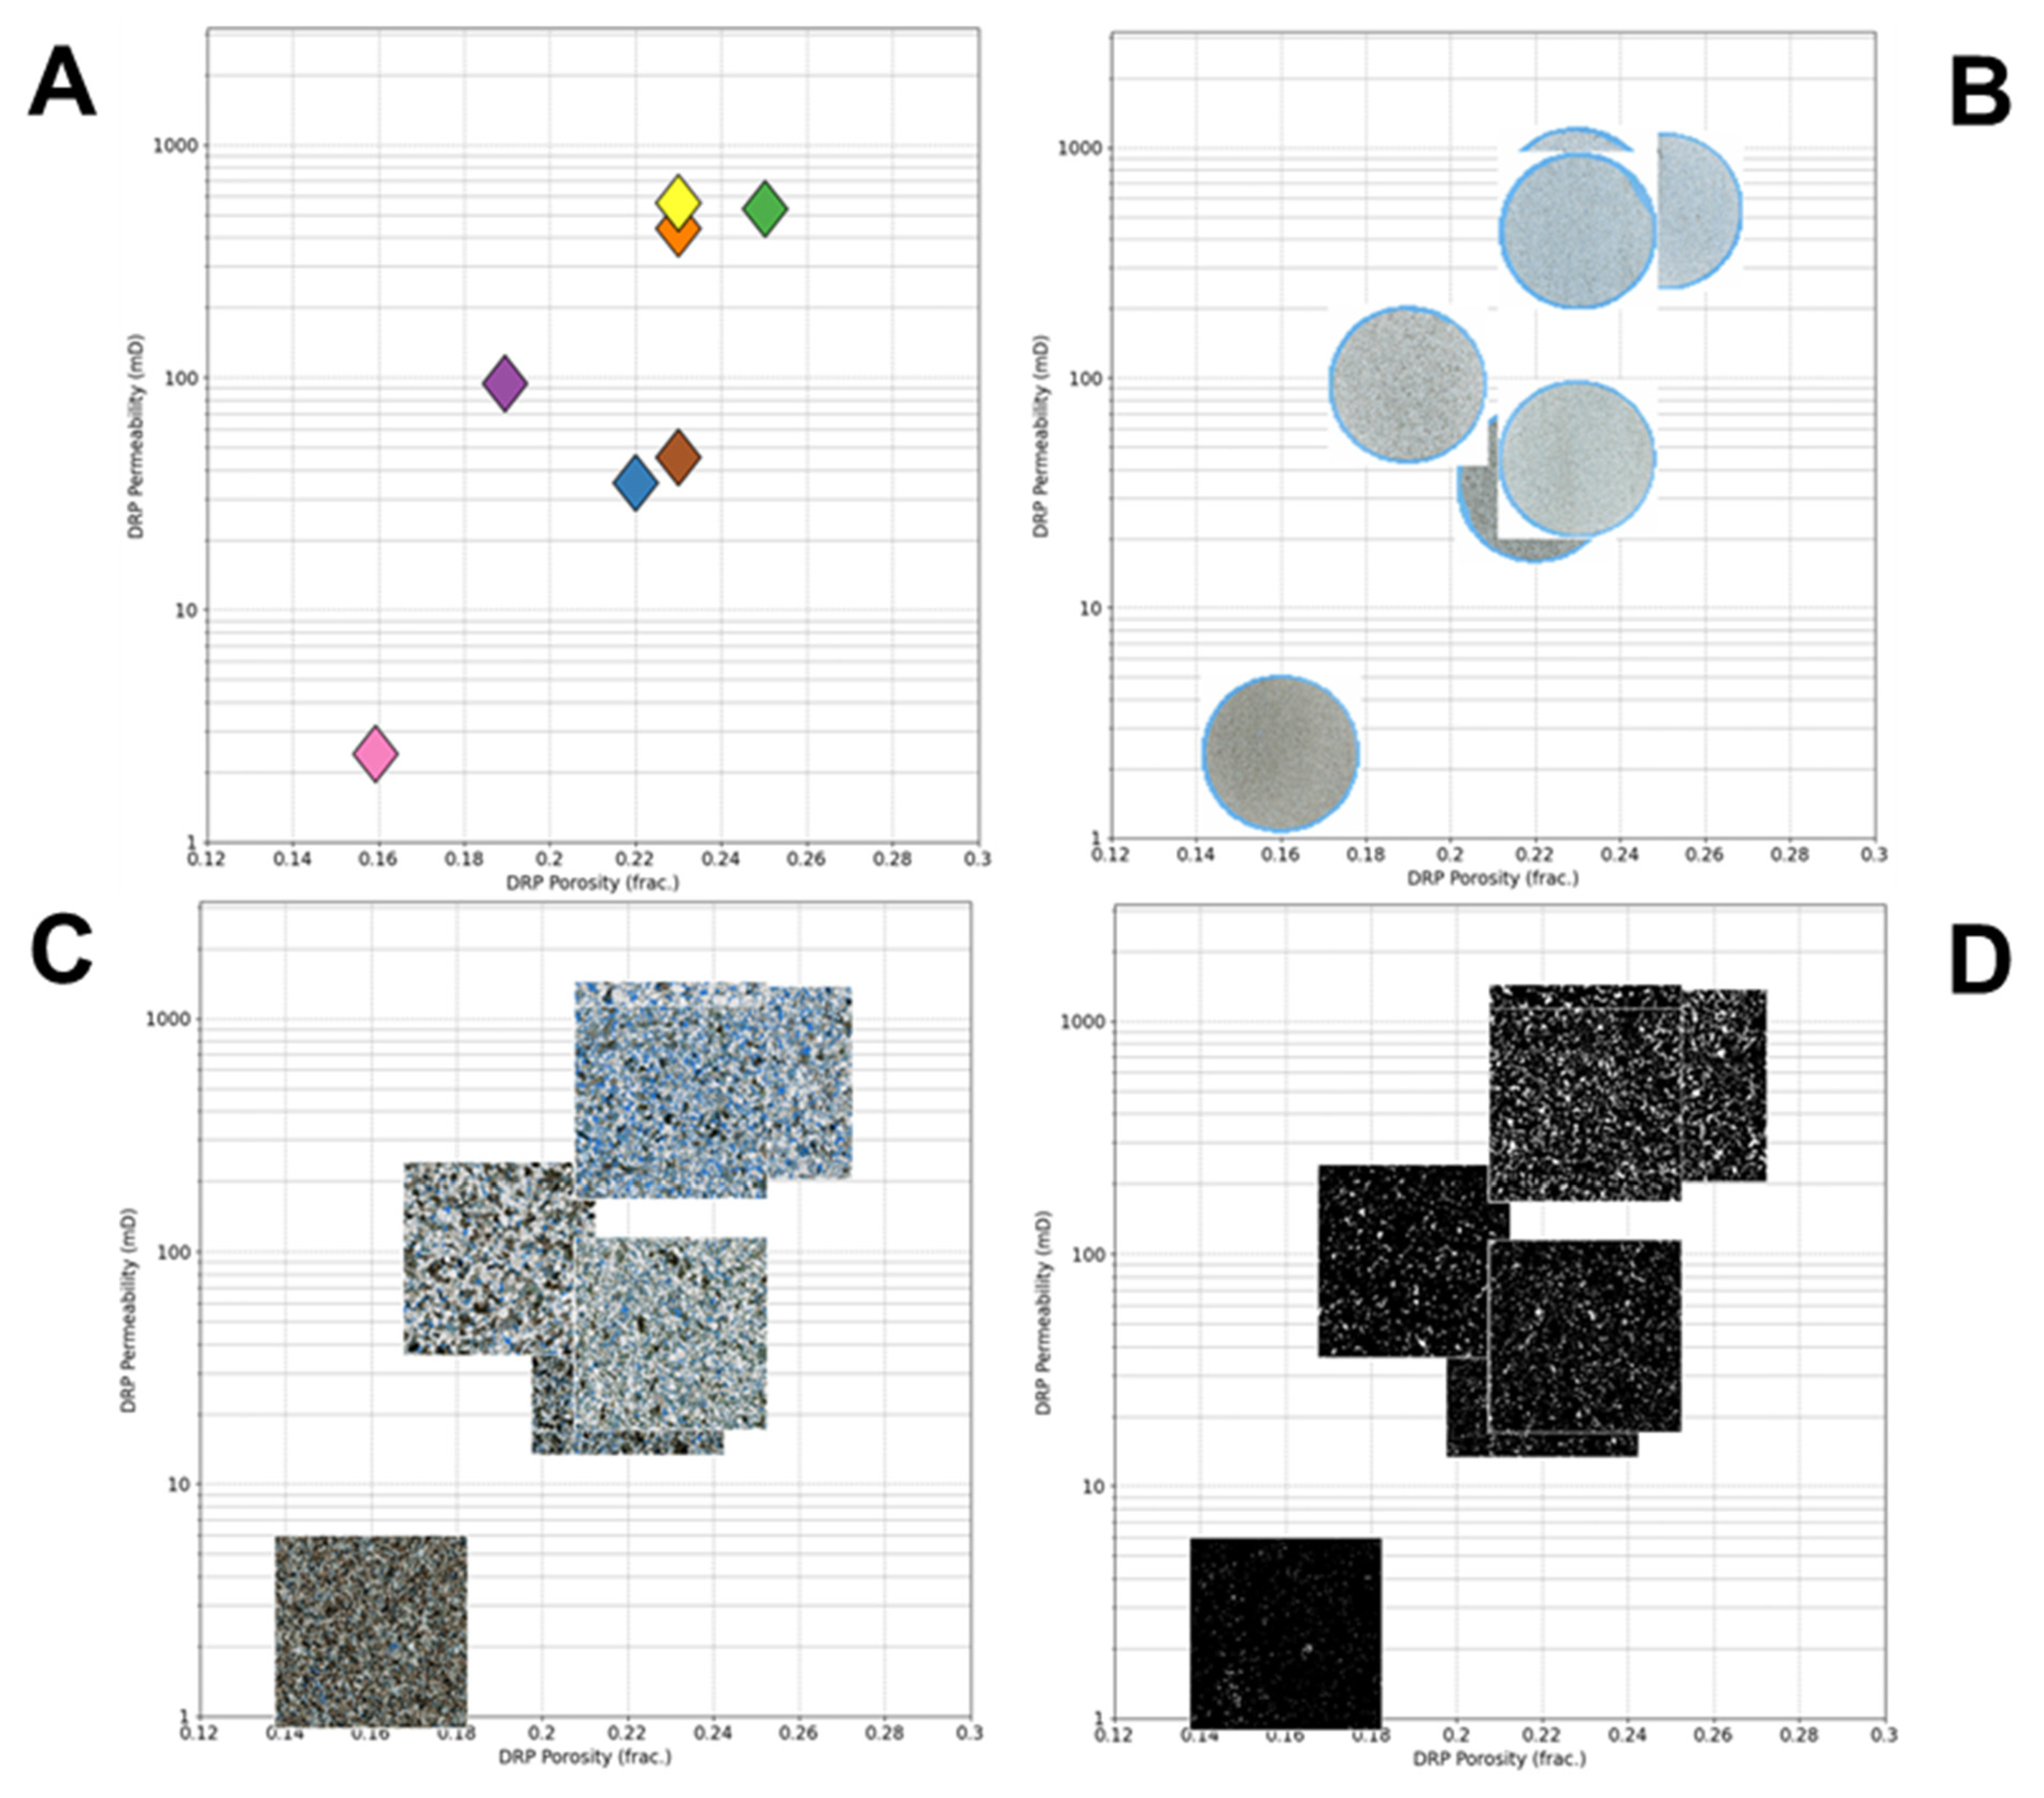
2.6. Digital Rock Physics Workflow
2.7. PETMiner Software
2.8. Cuttings from Oil and Gas Wells
3. Results
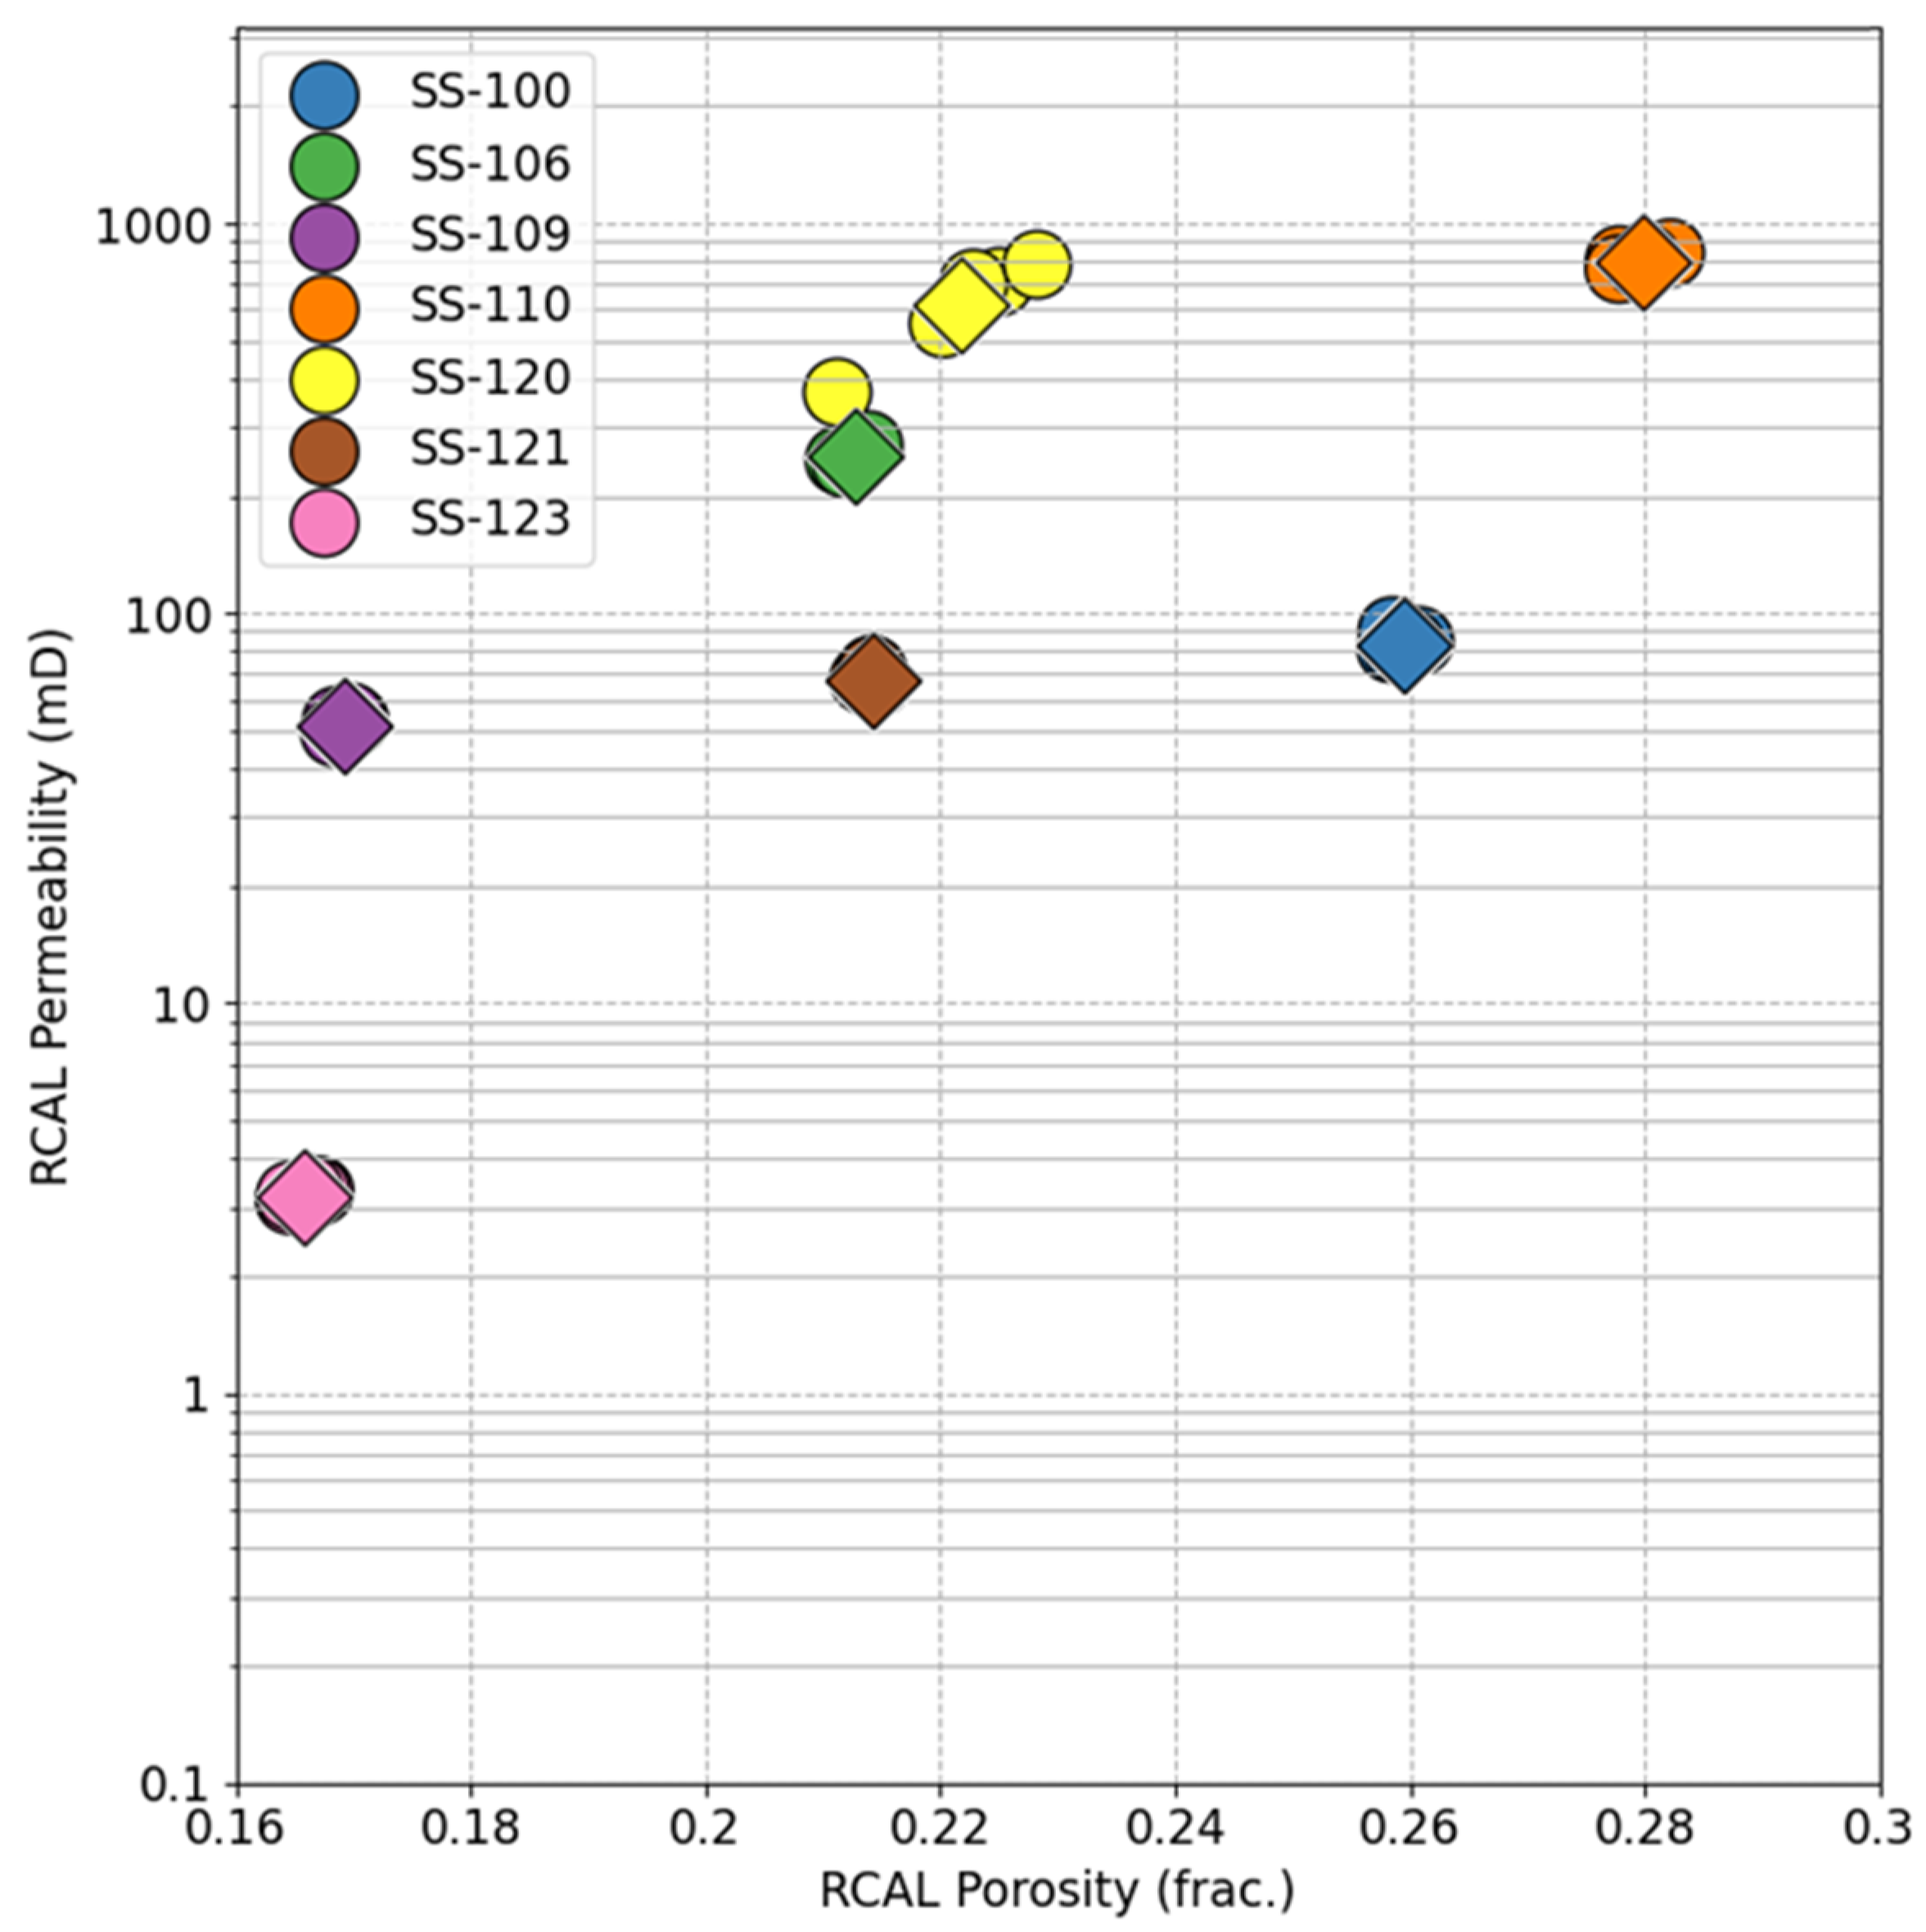
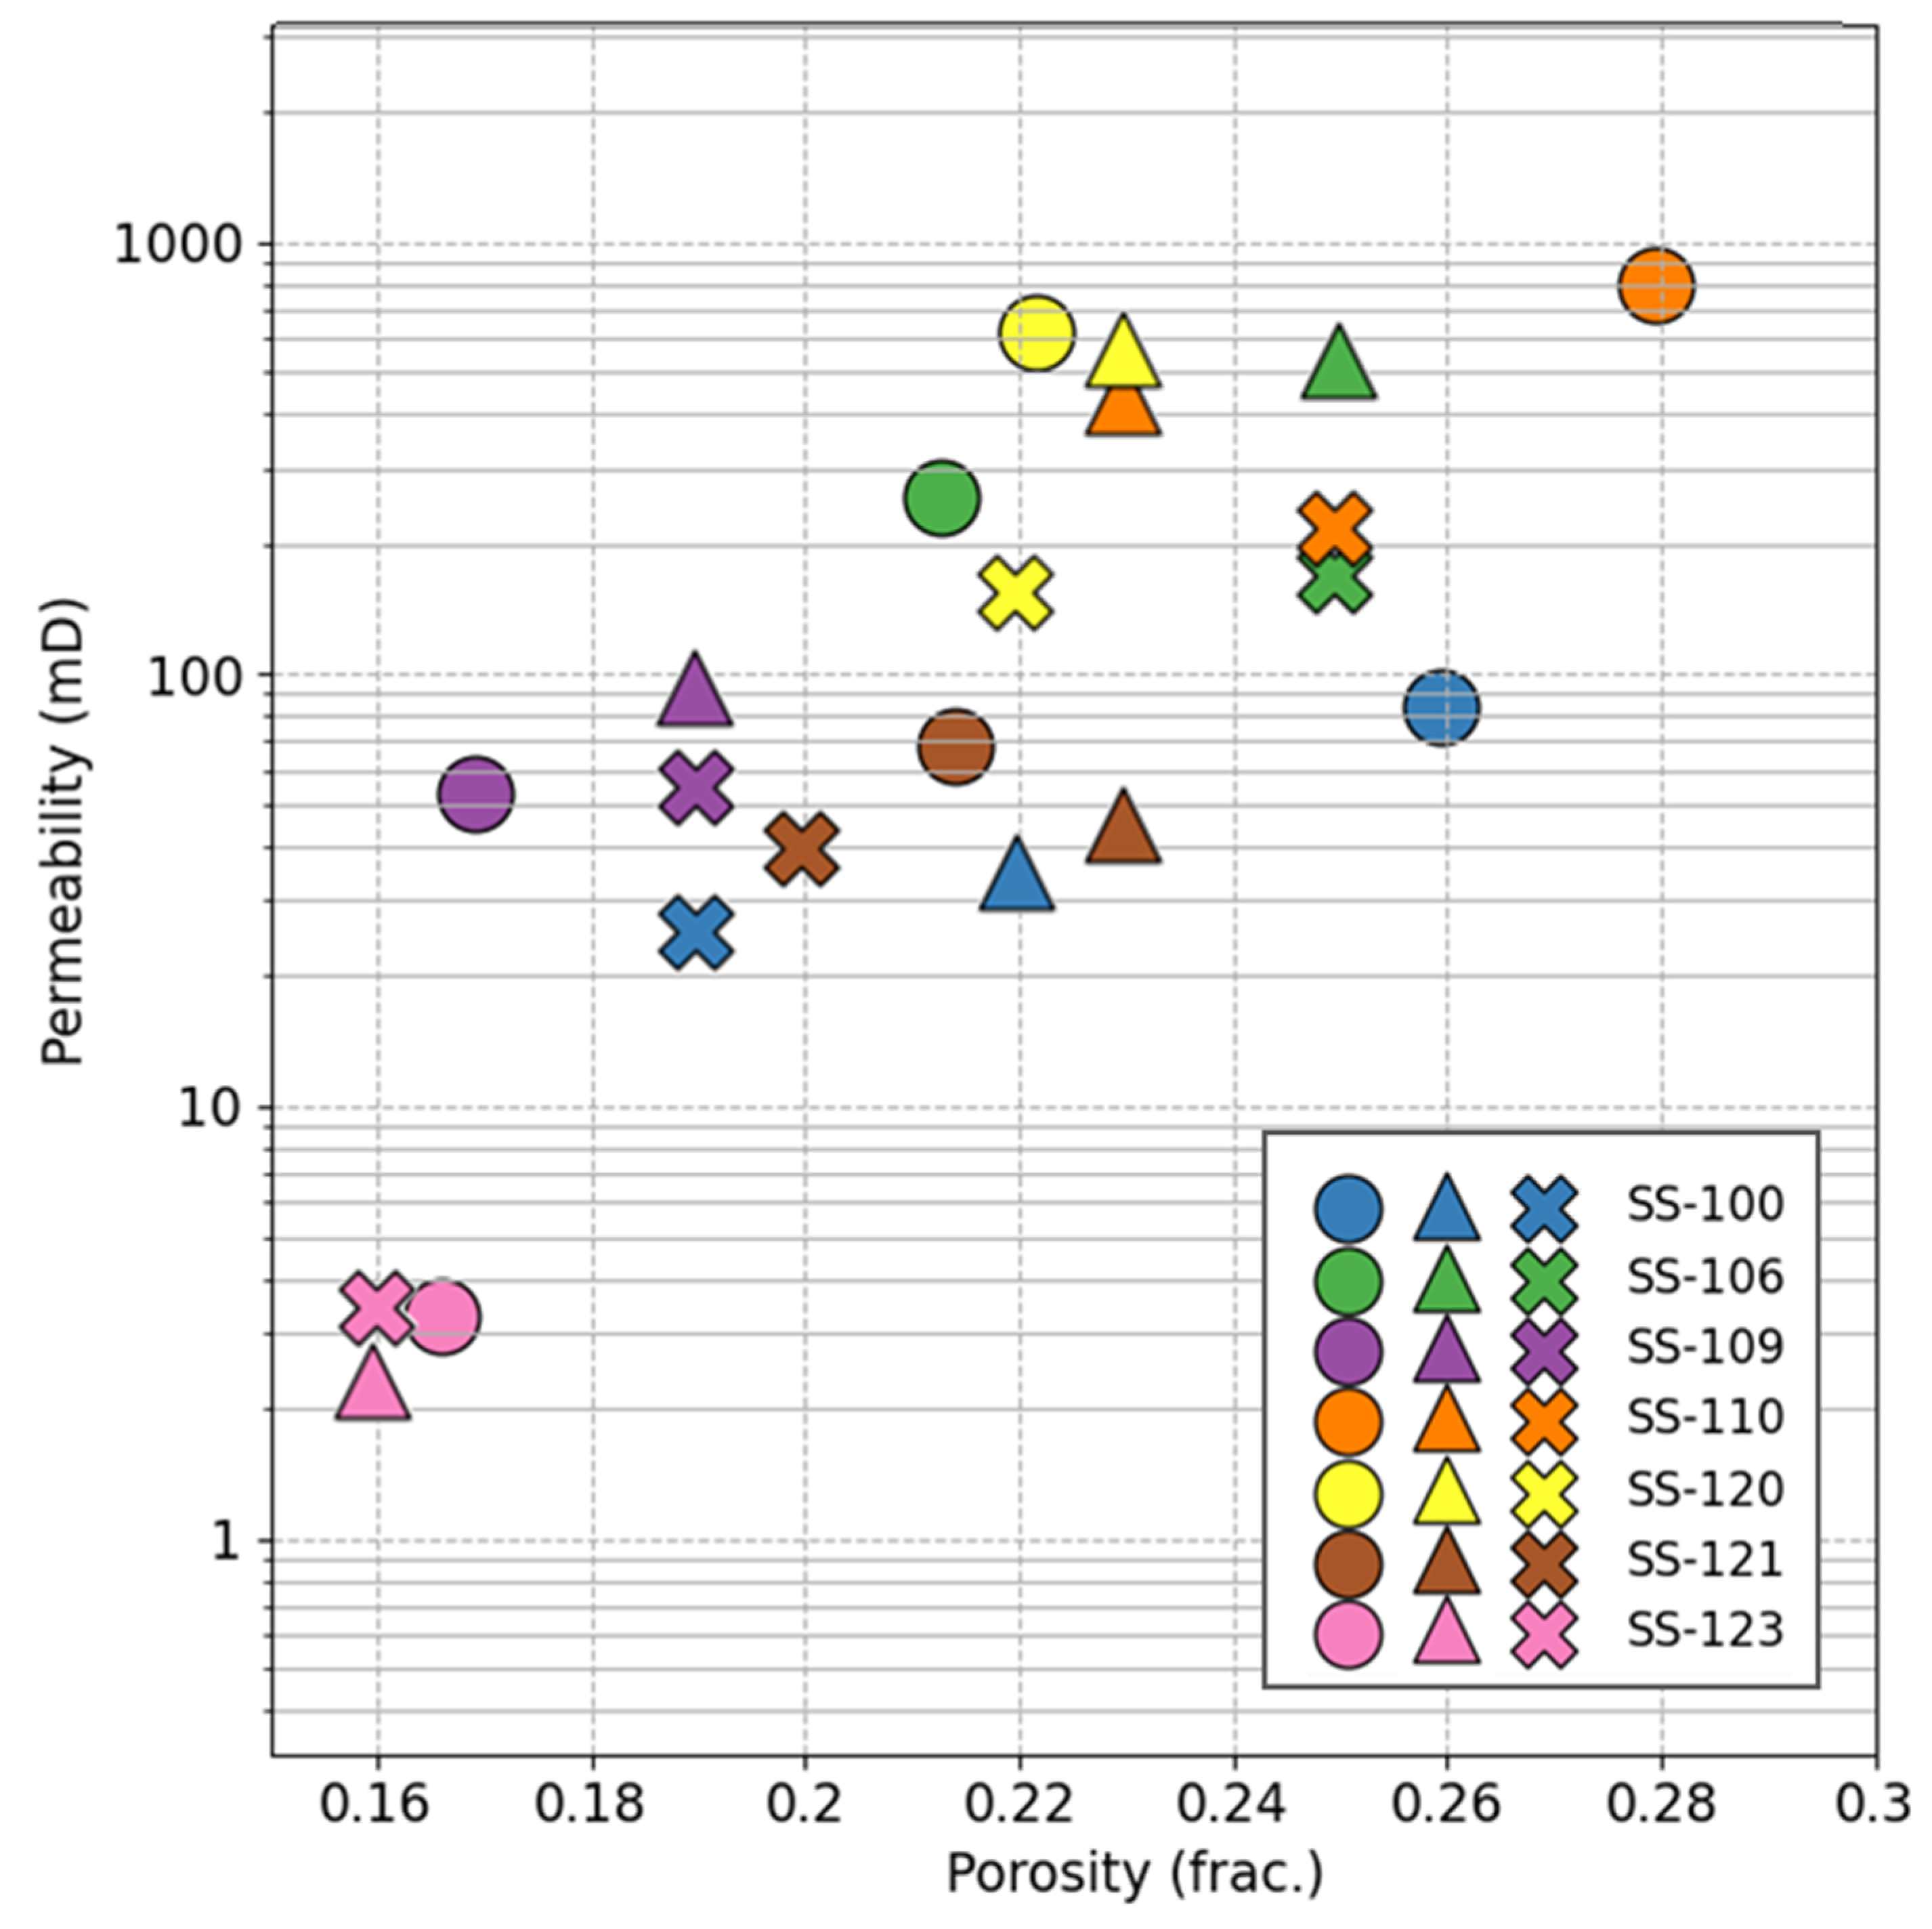
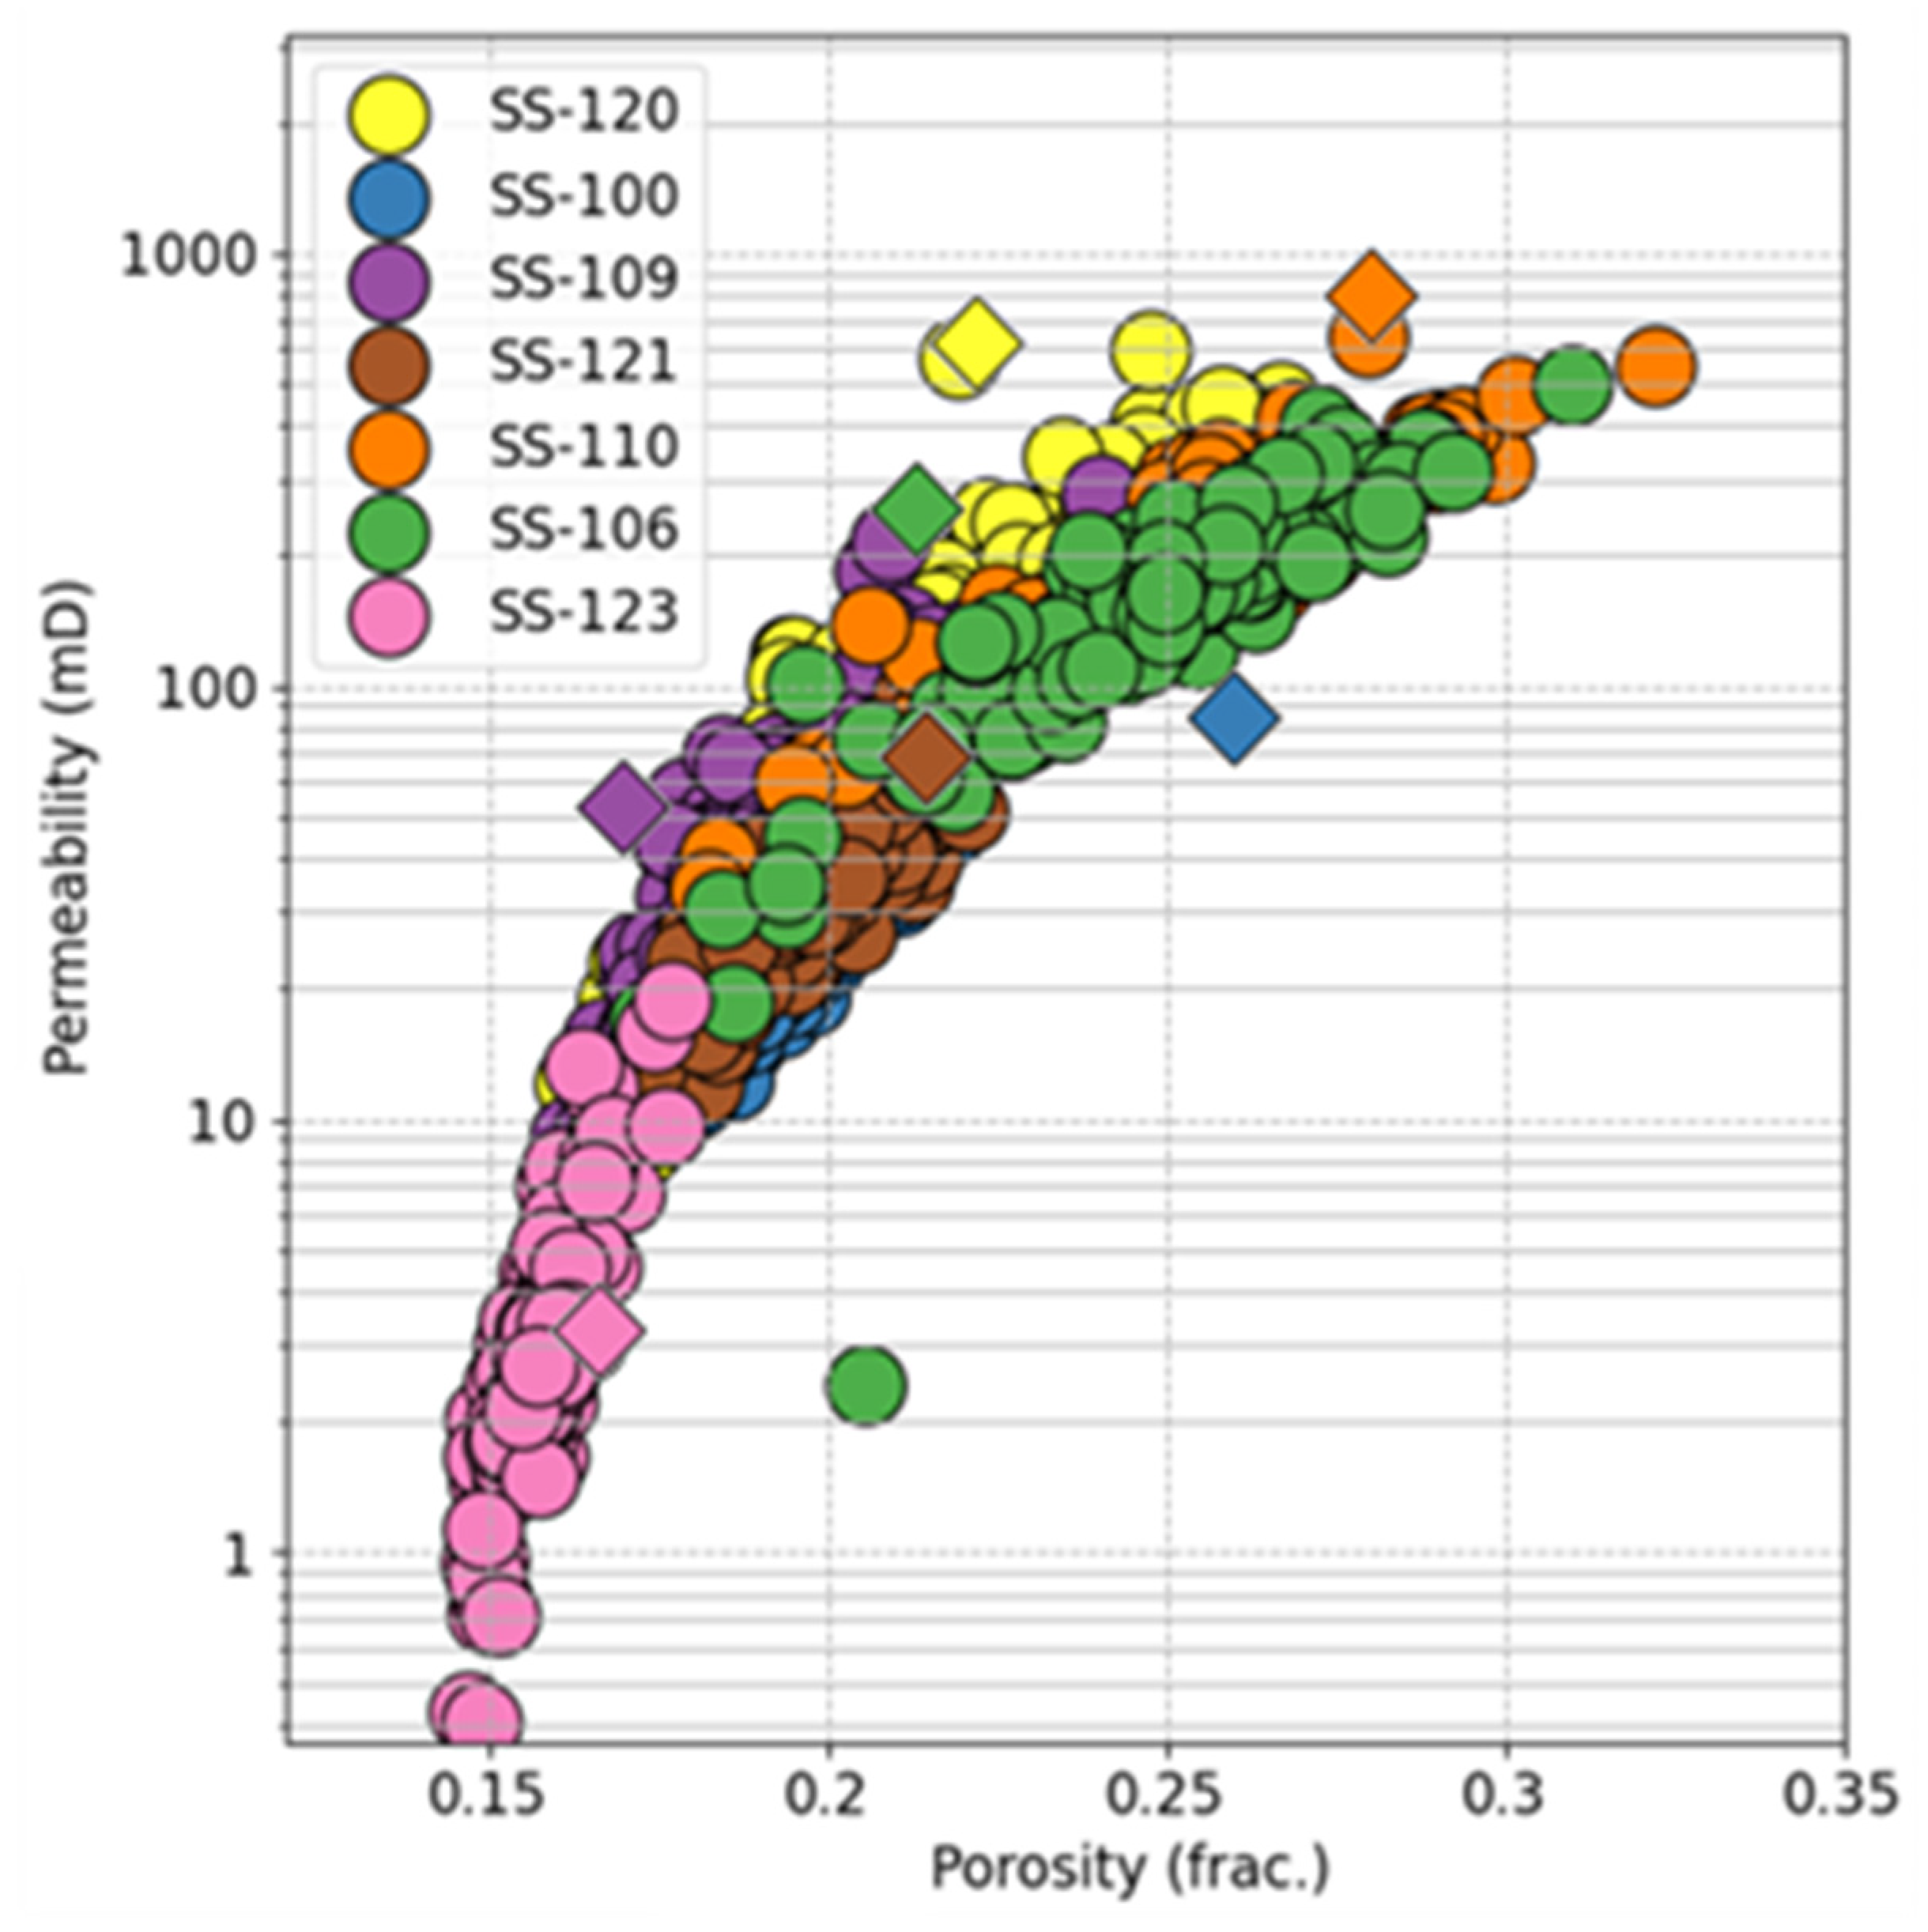
3.1. RCAL Plugs
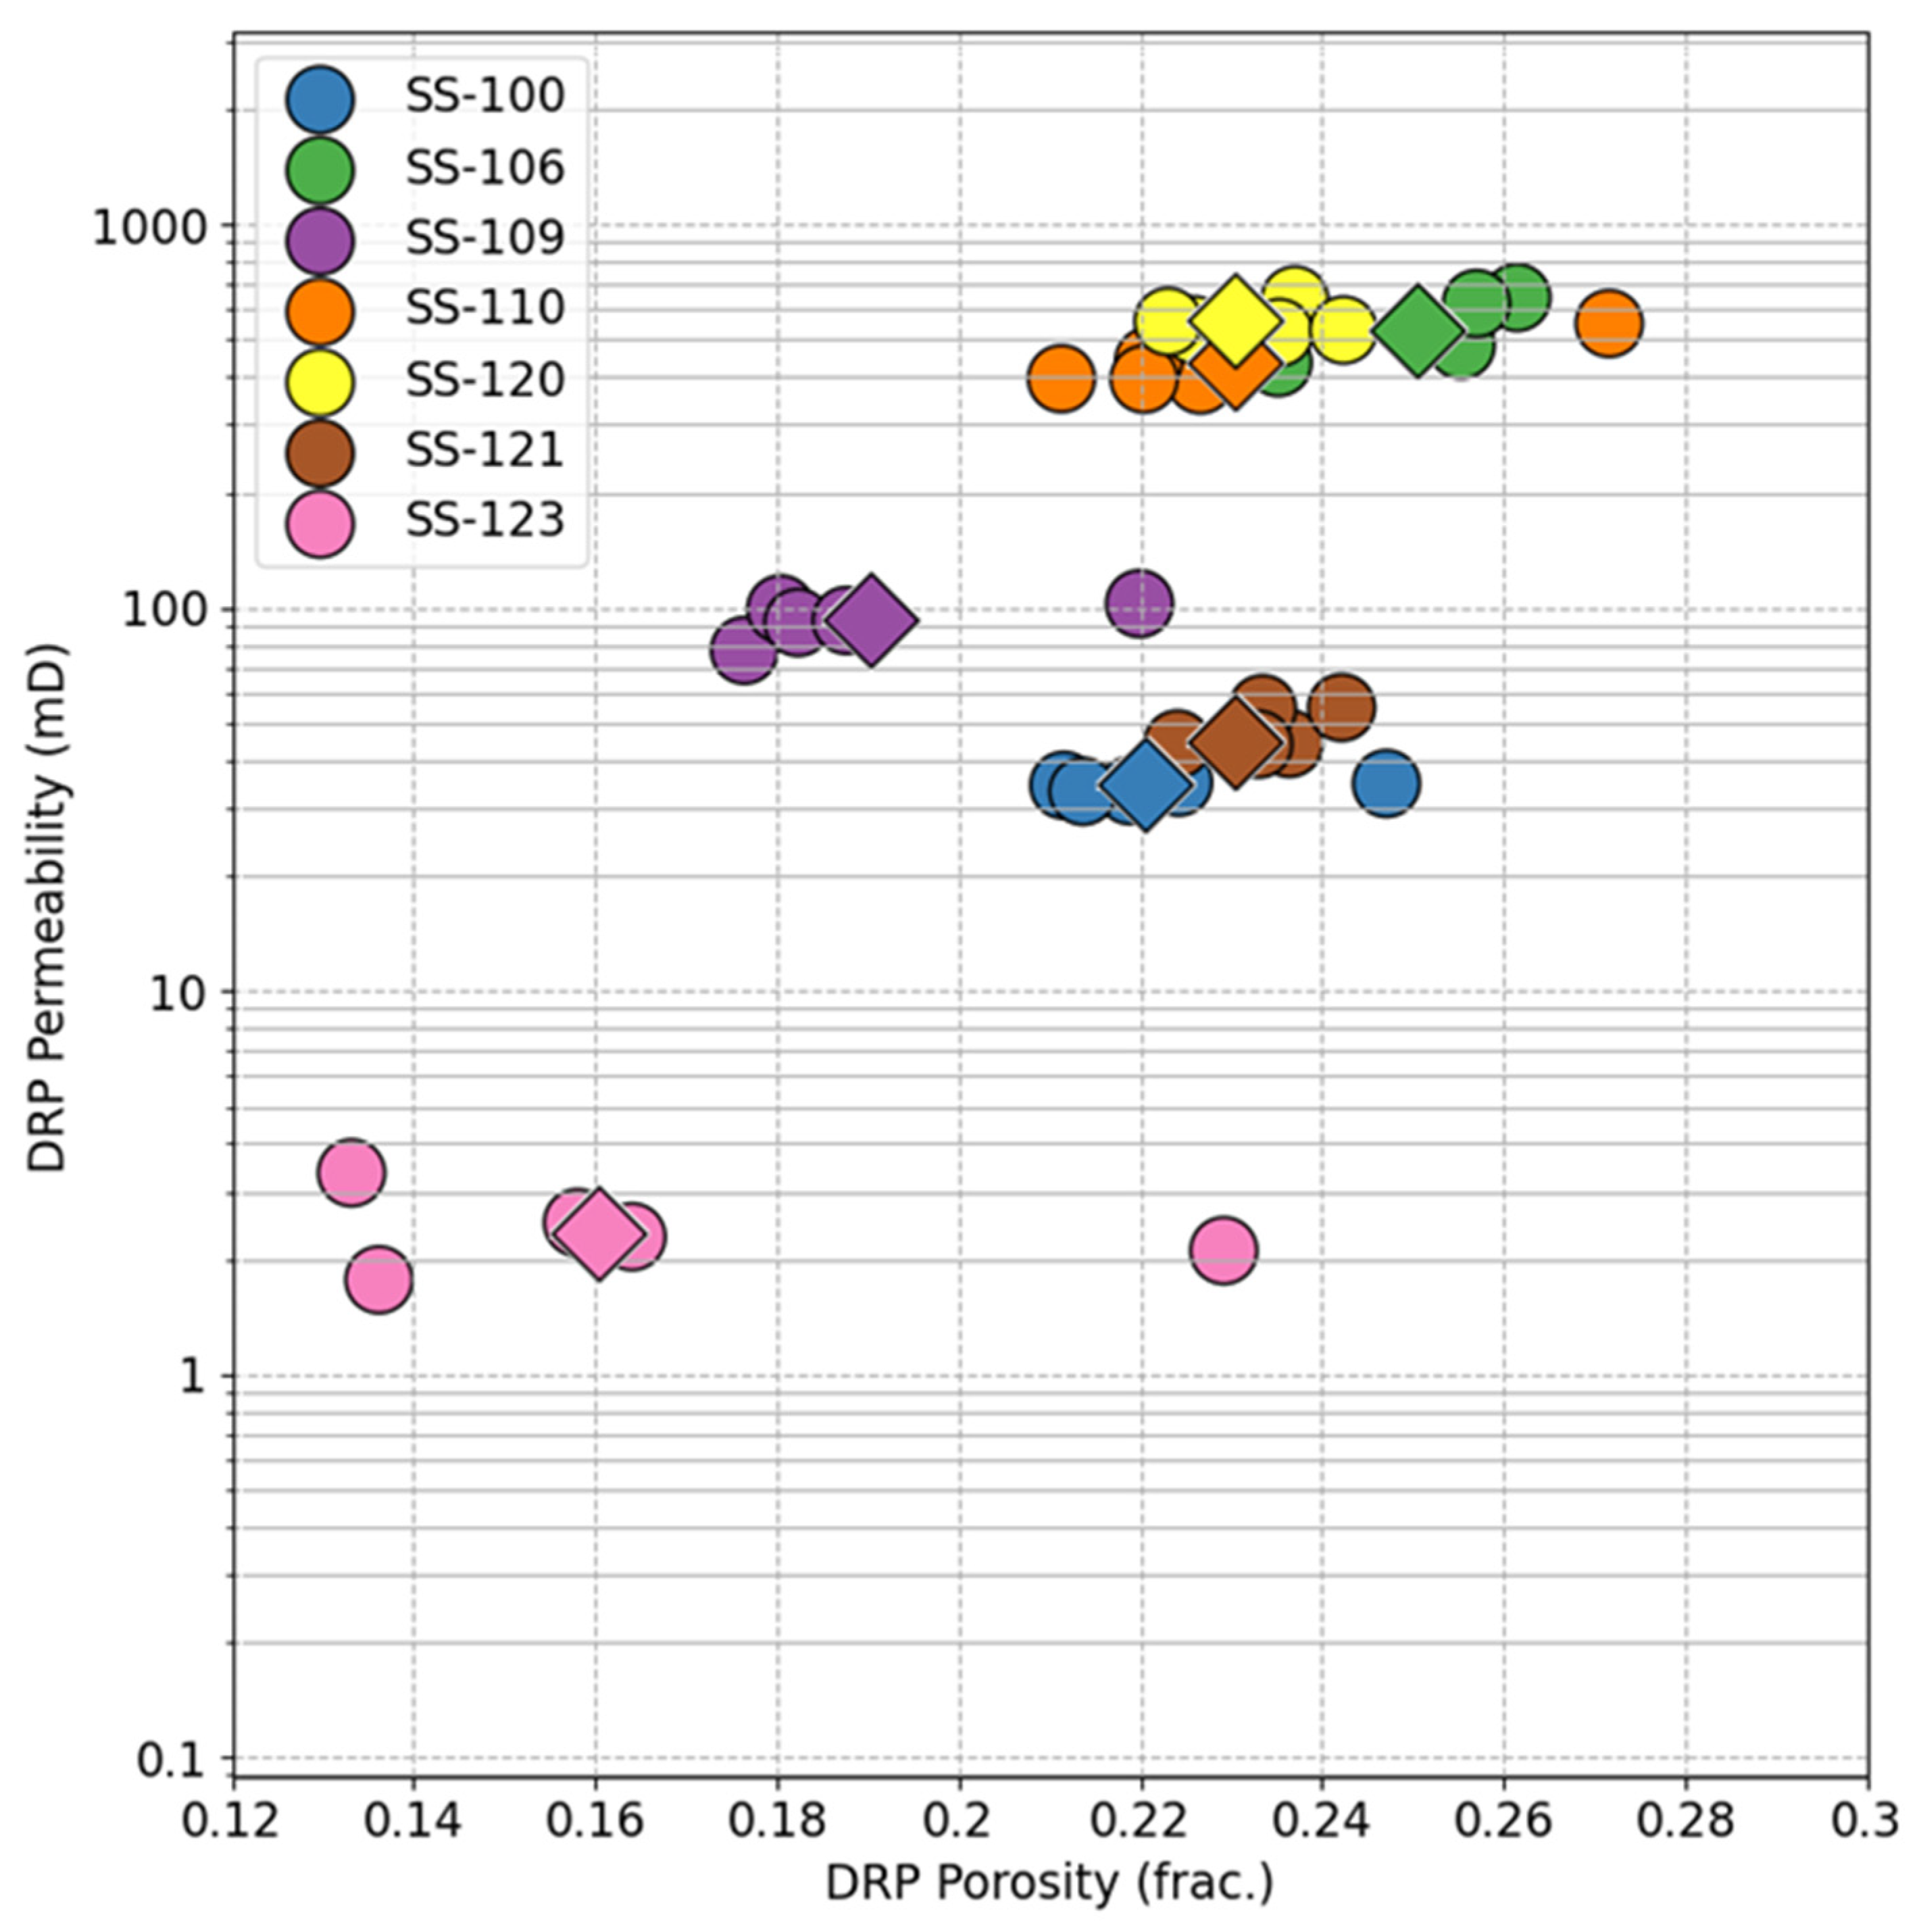
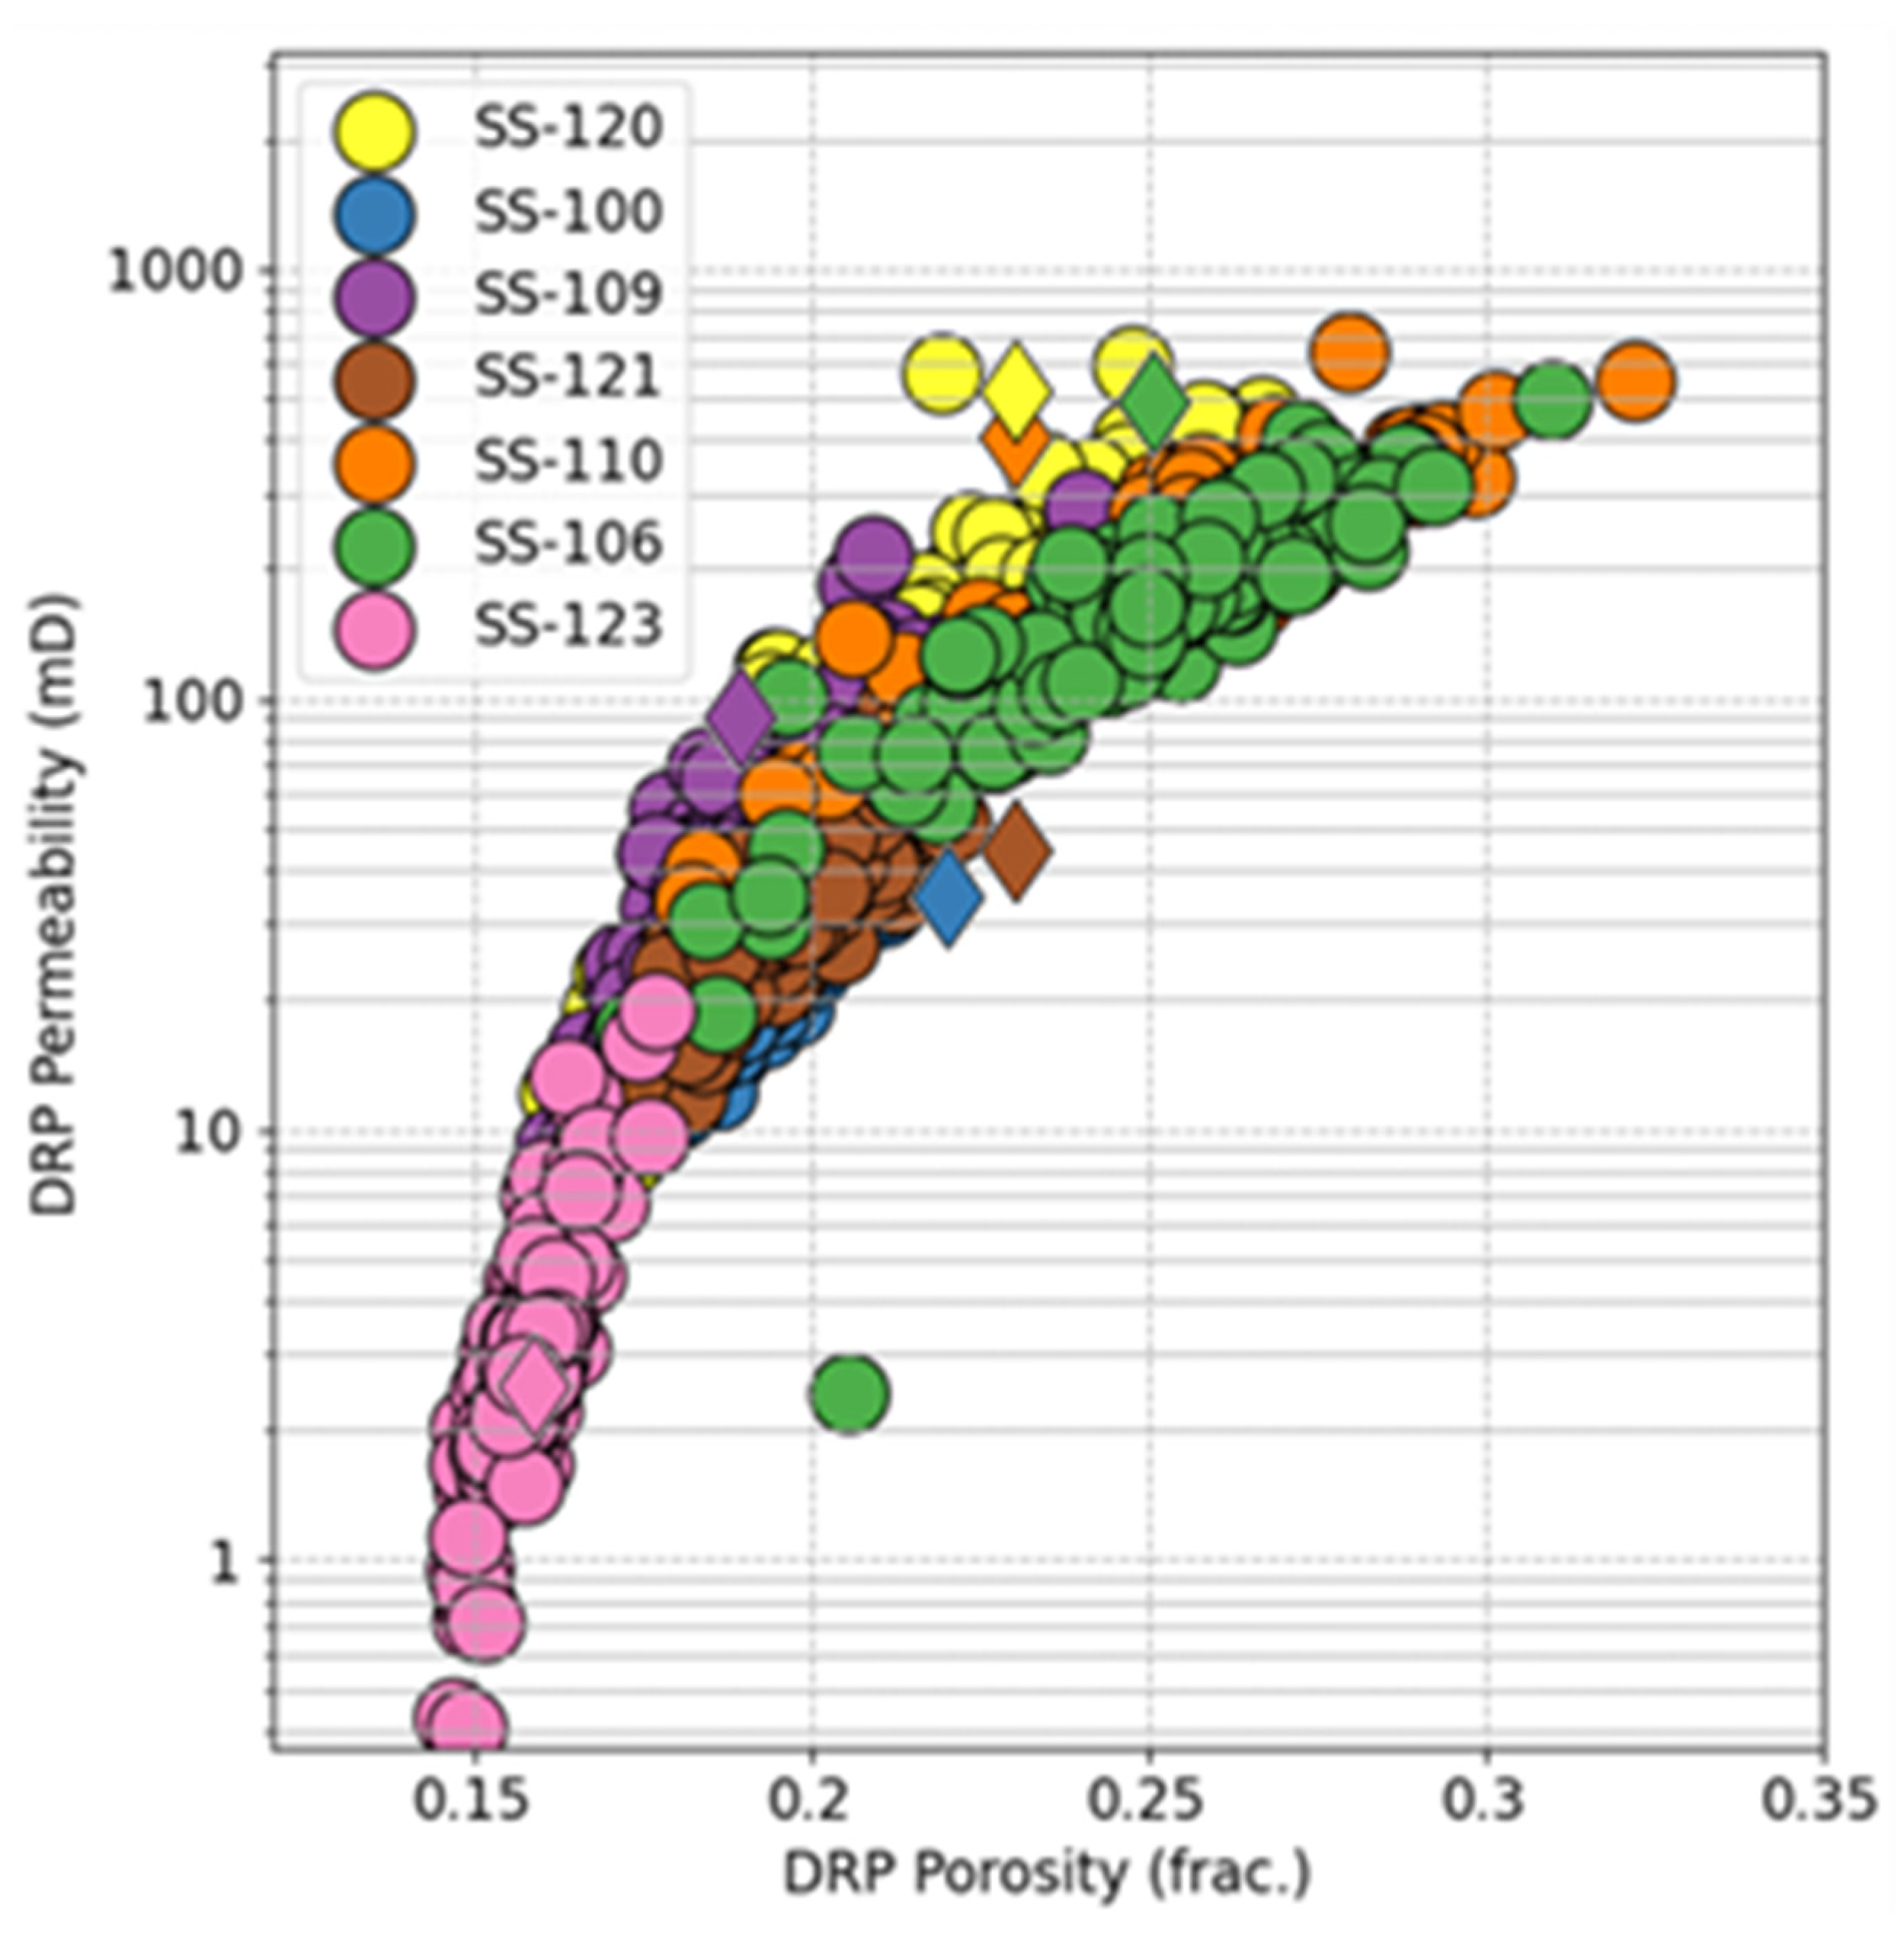
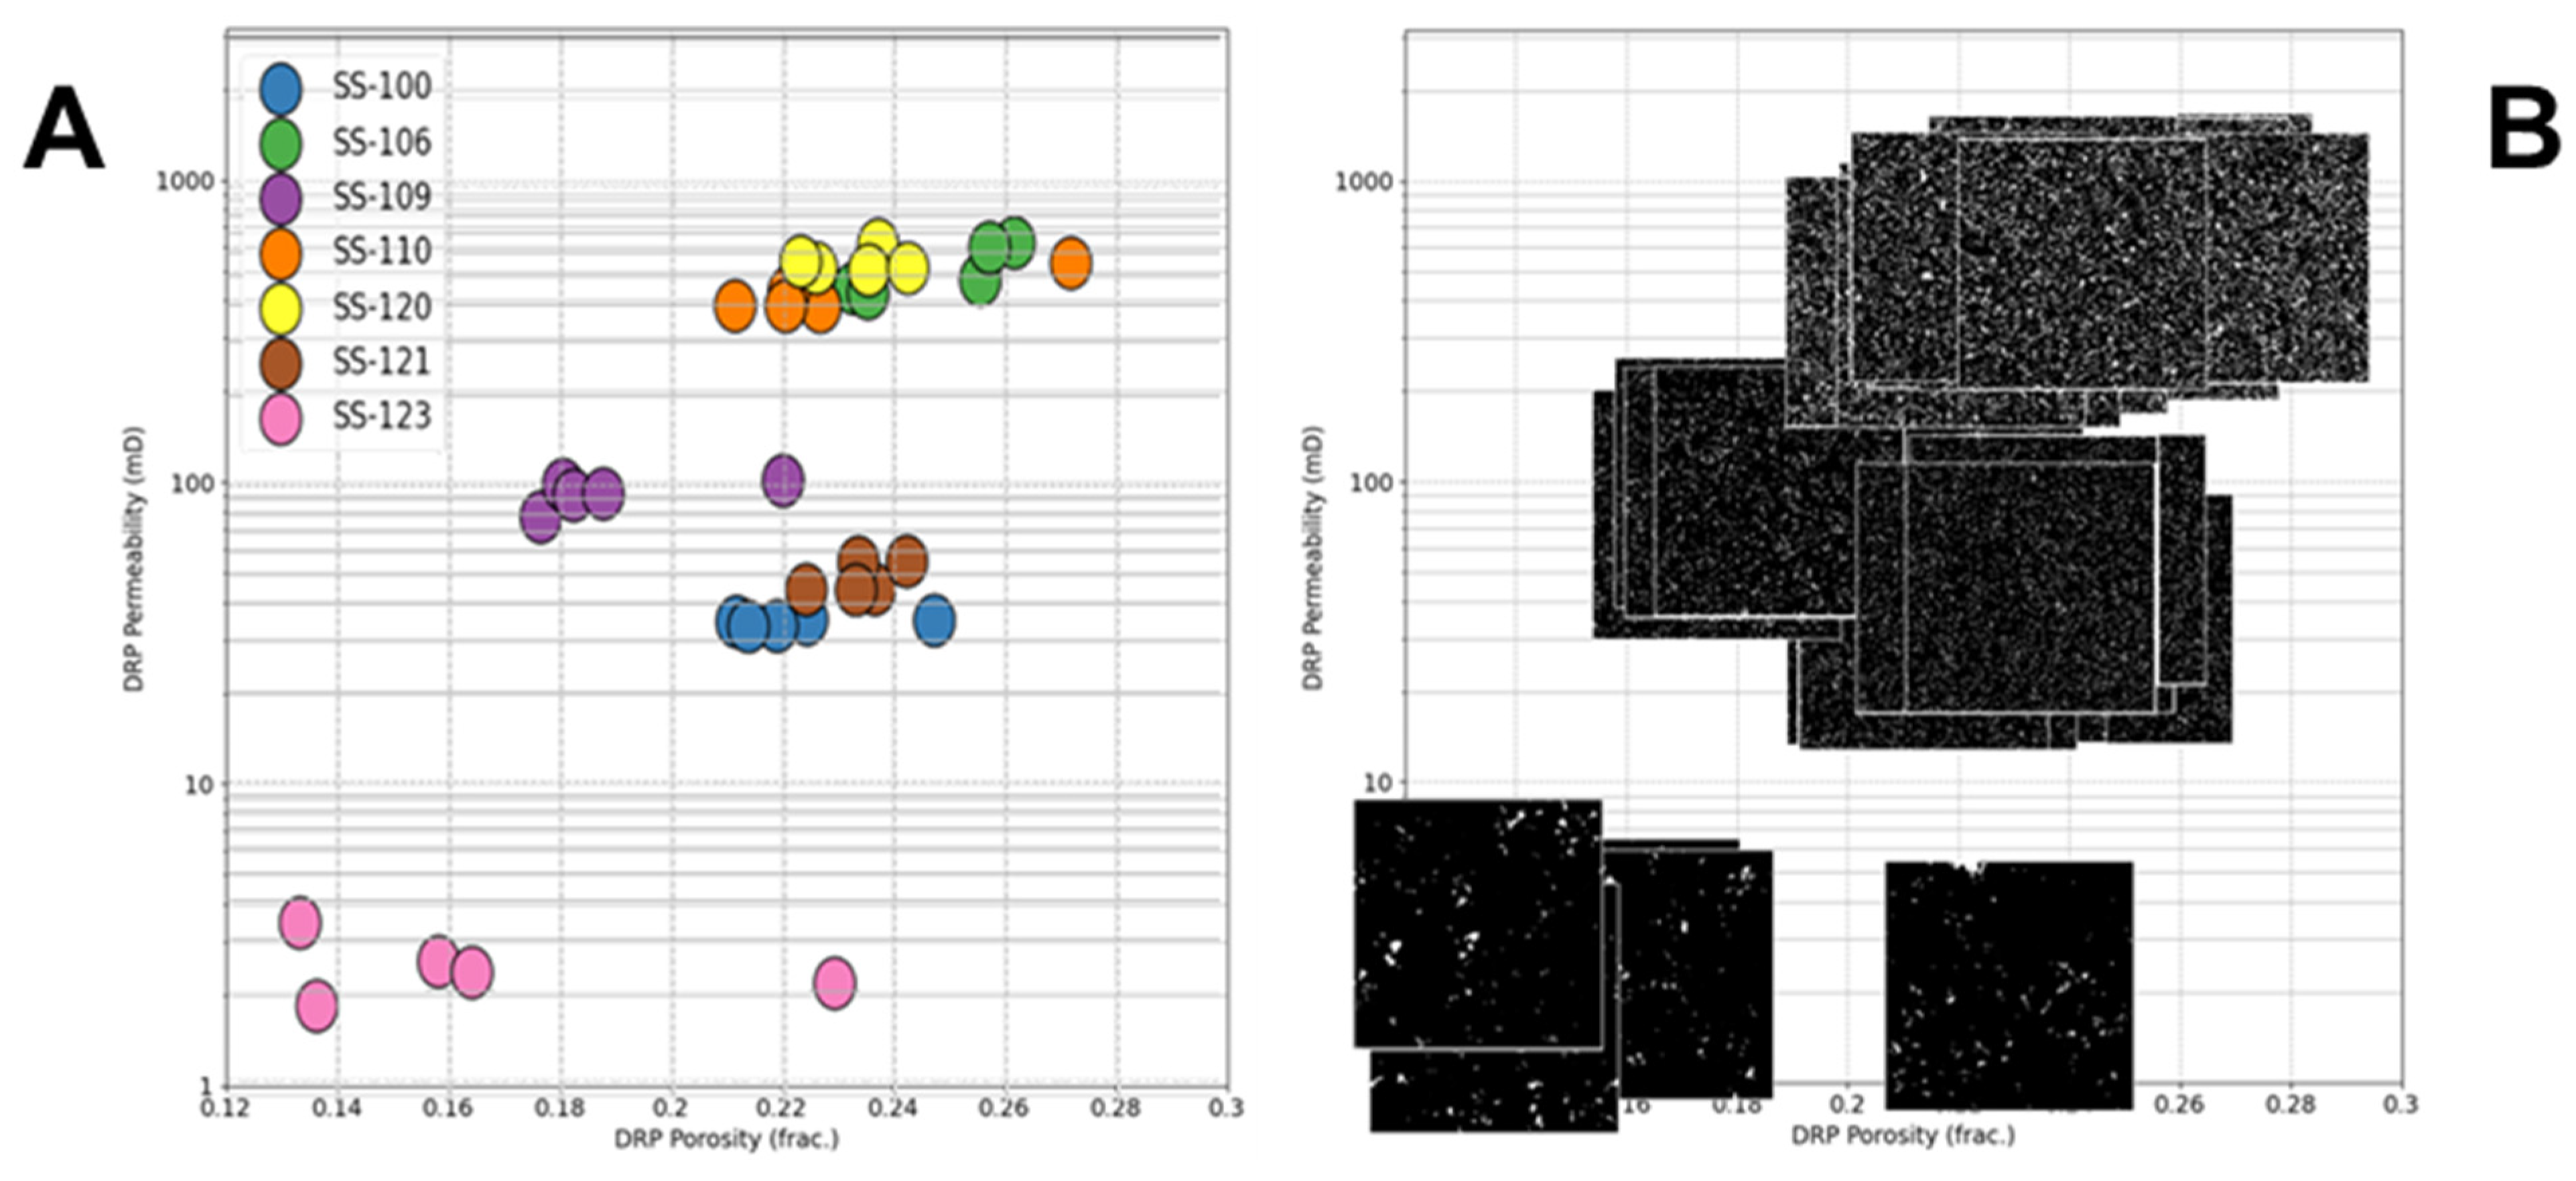
3.2. DRP Plugs
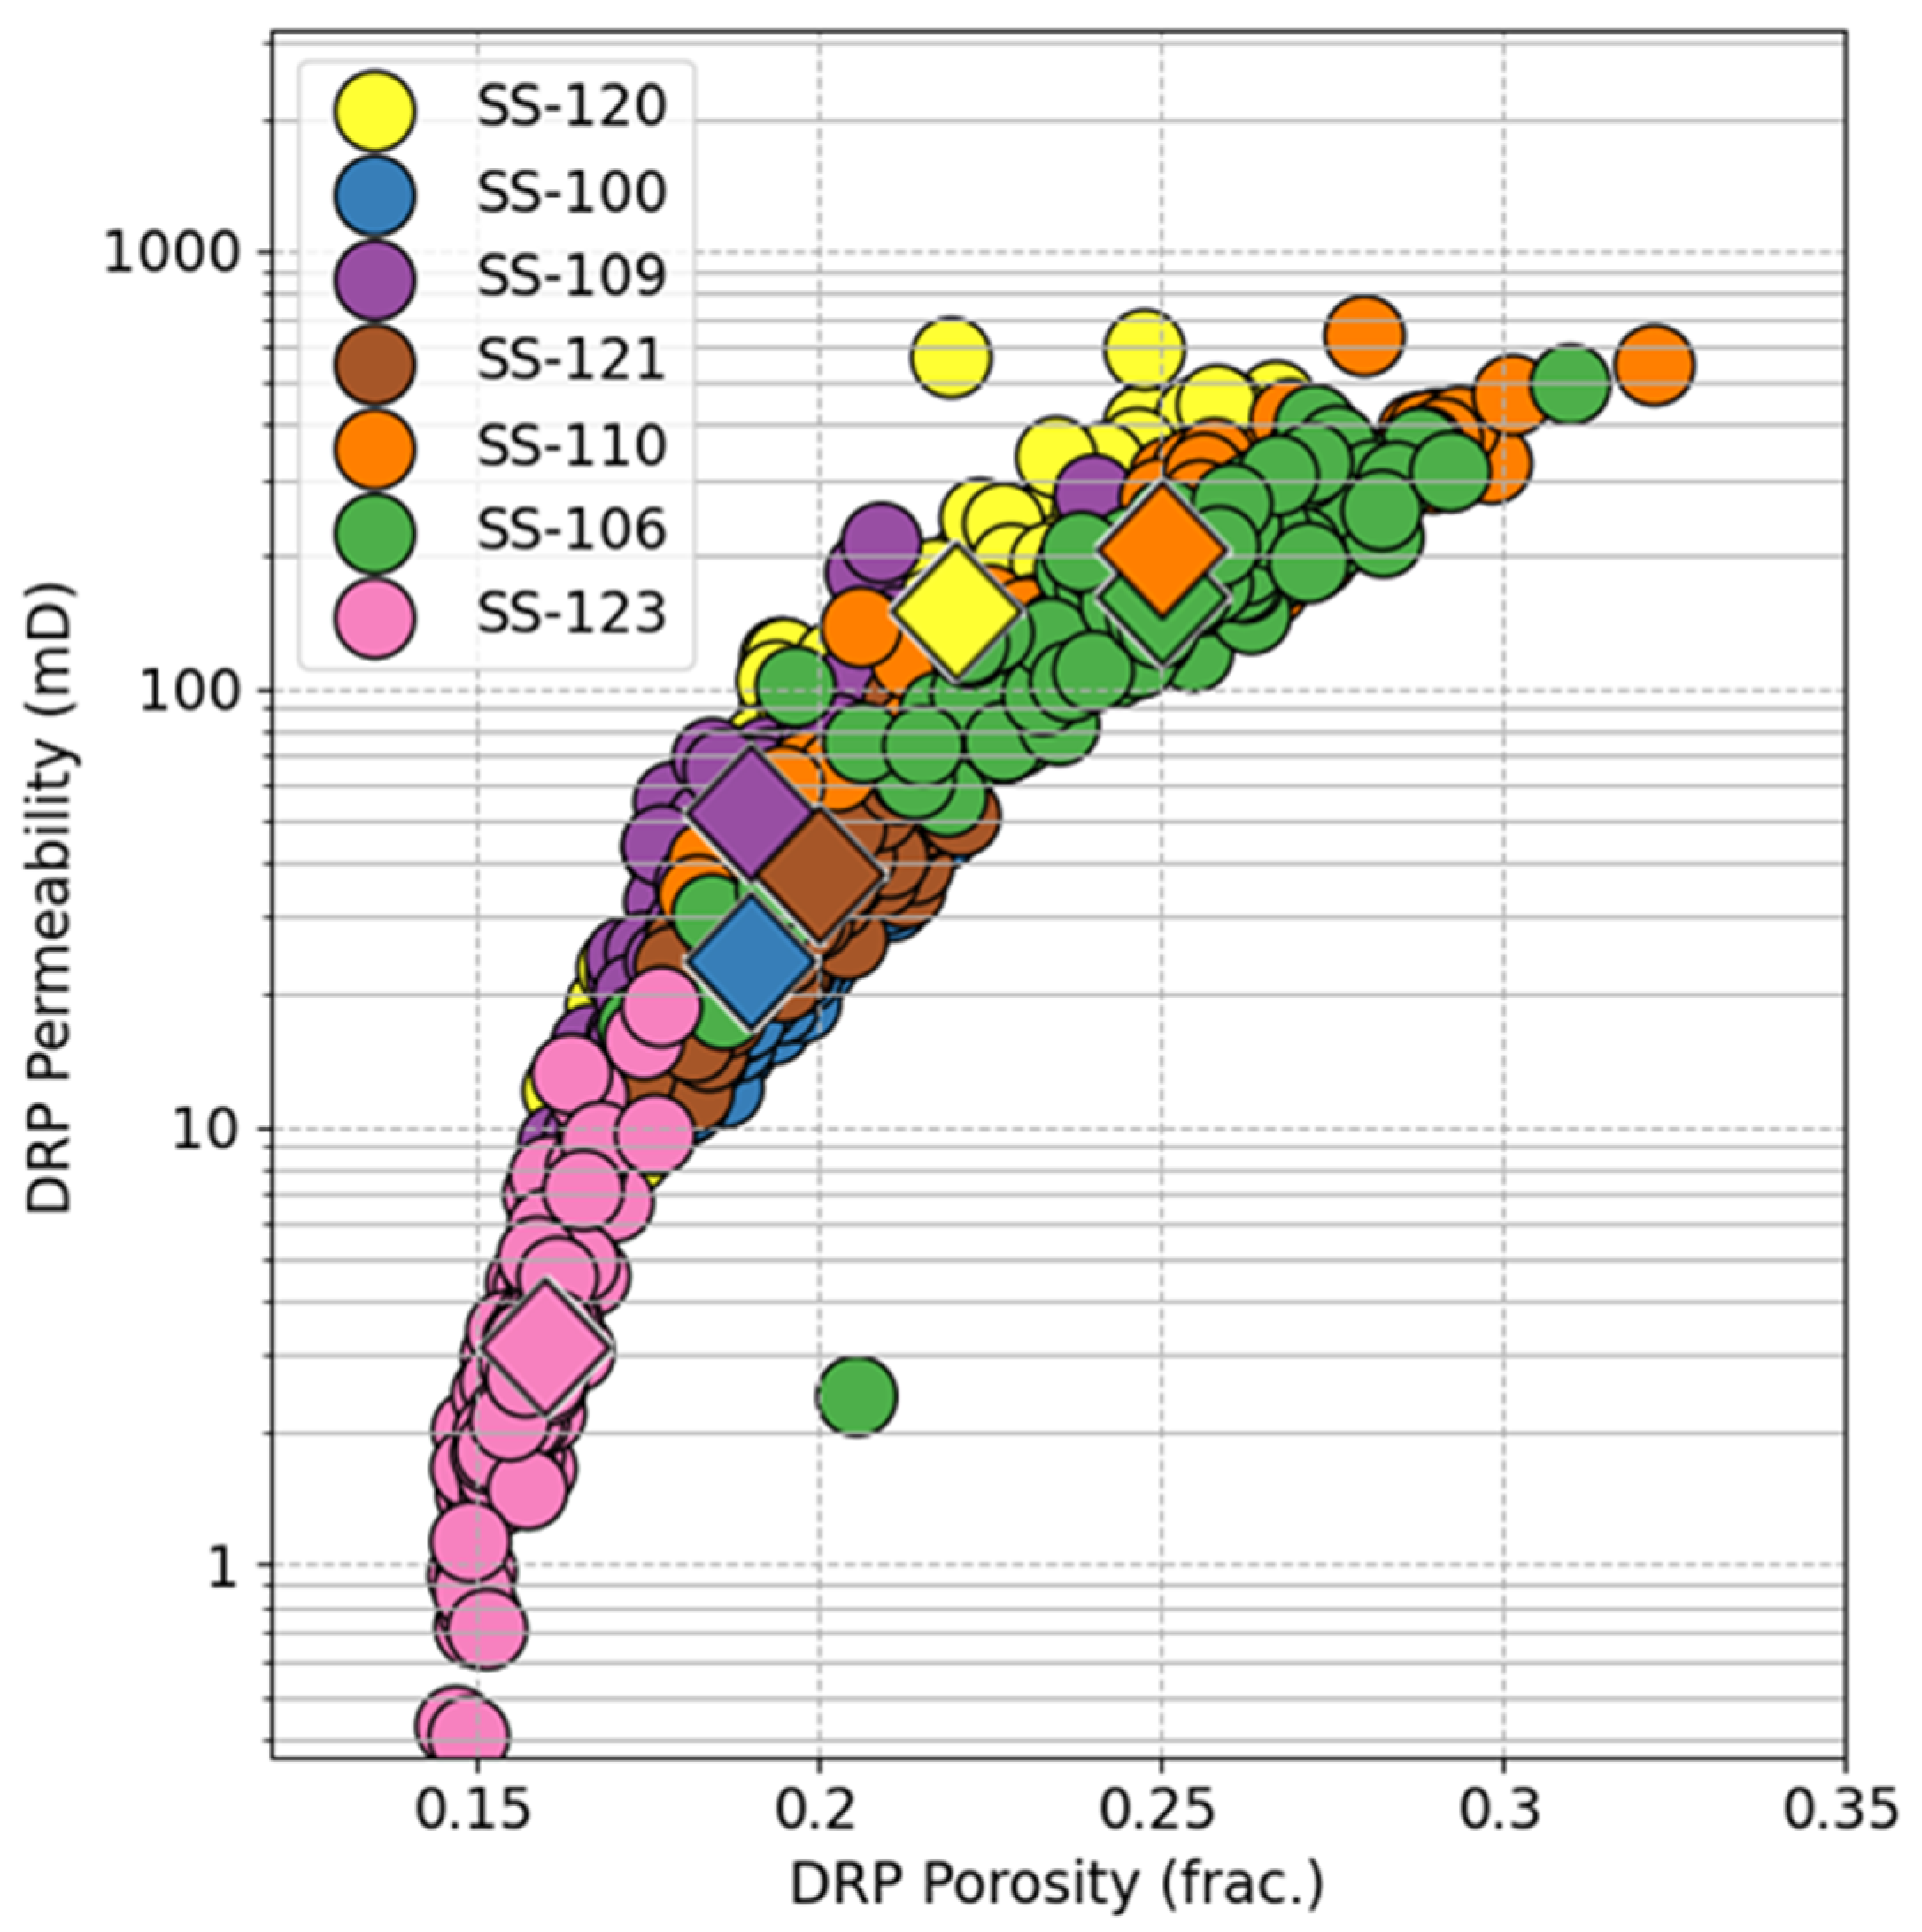
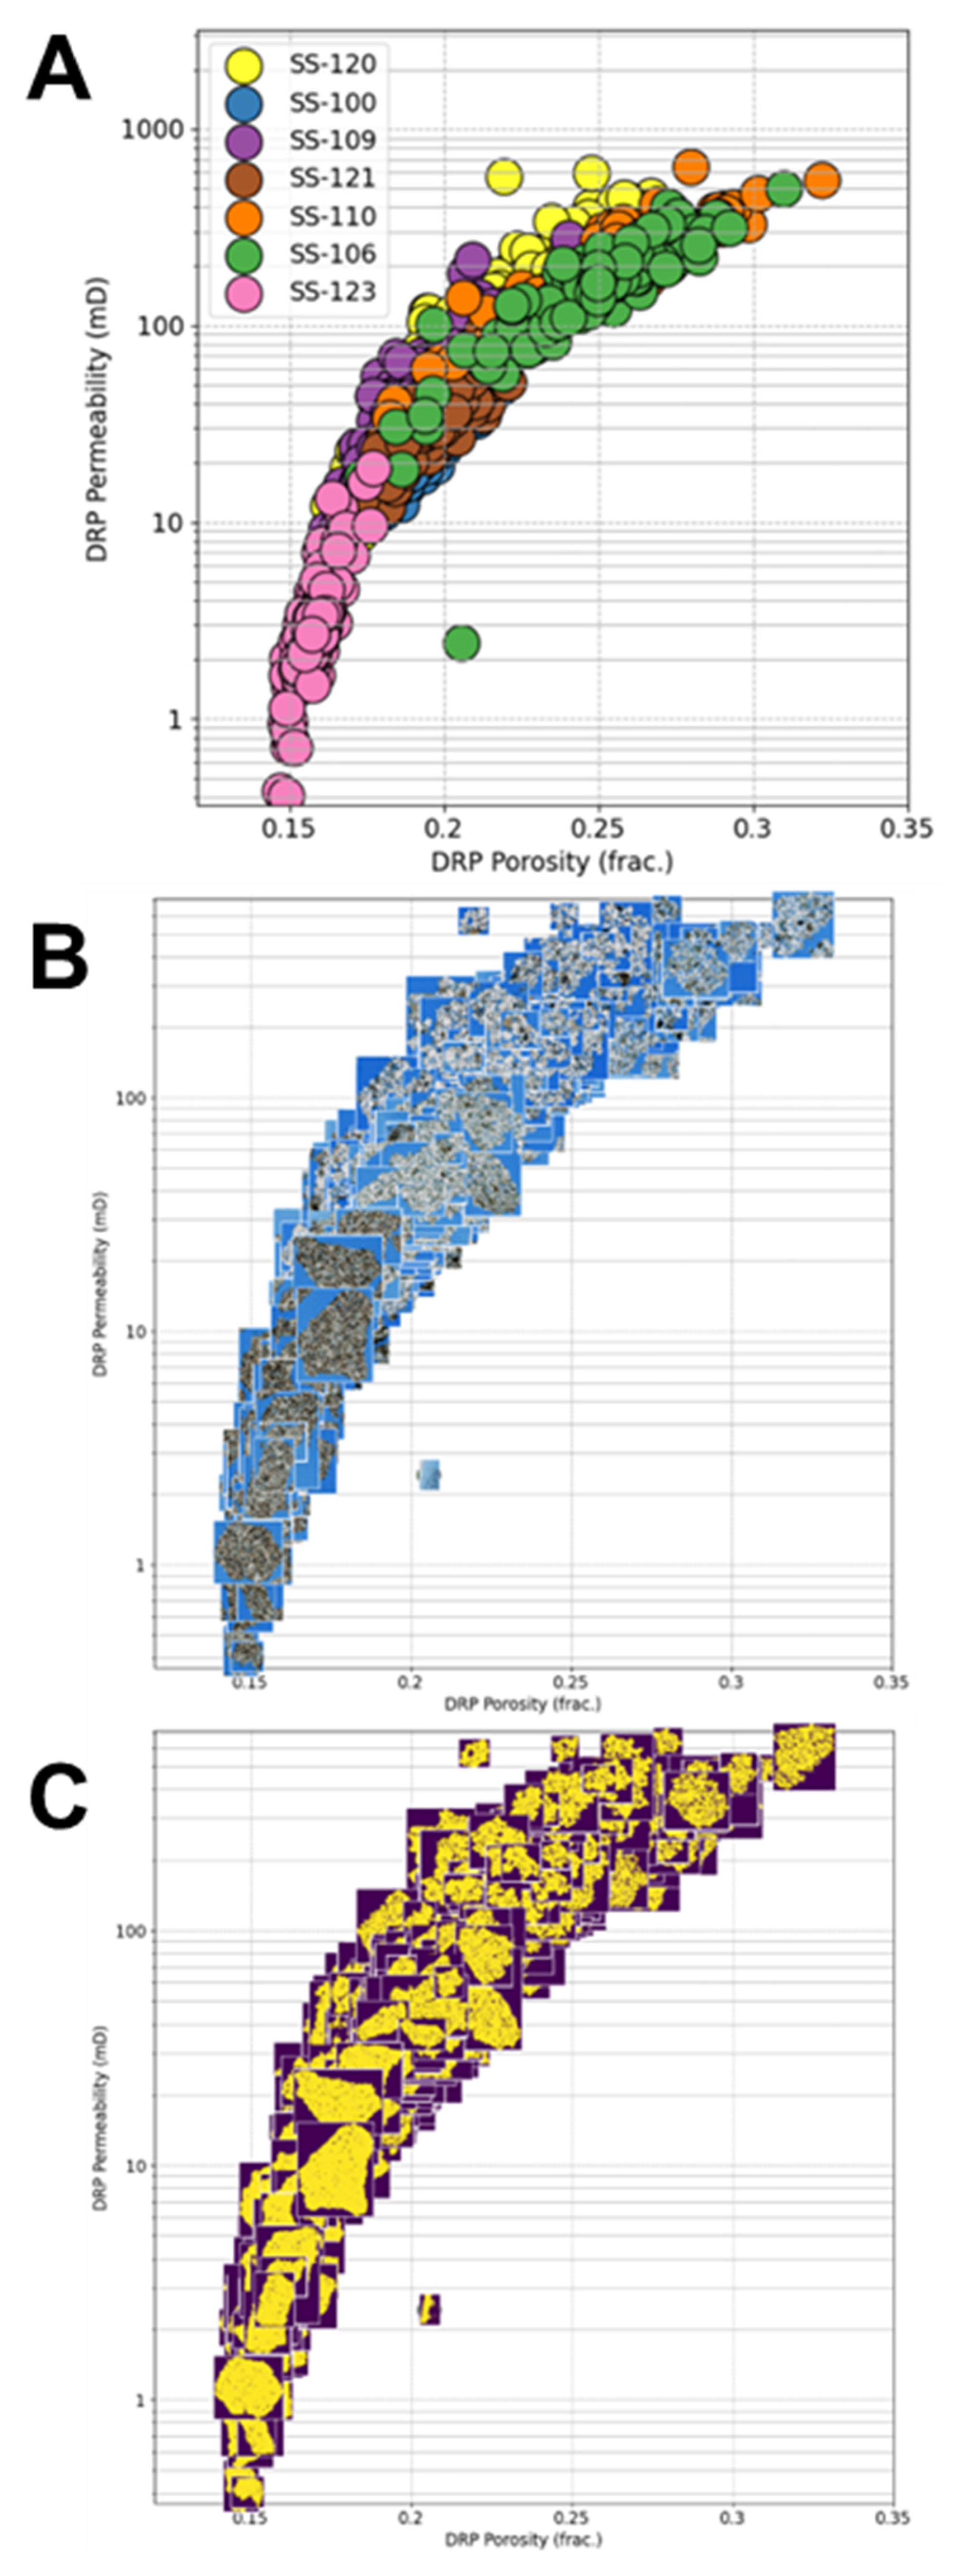
3.3. DRP Pseudo-Cuttings
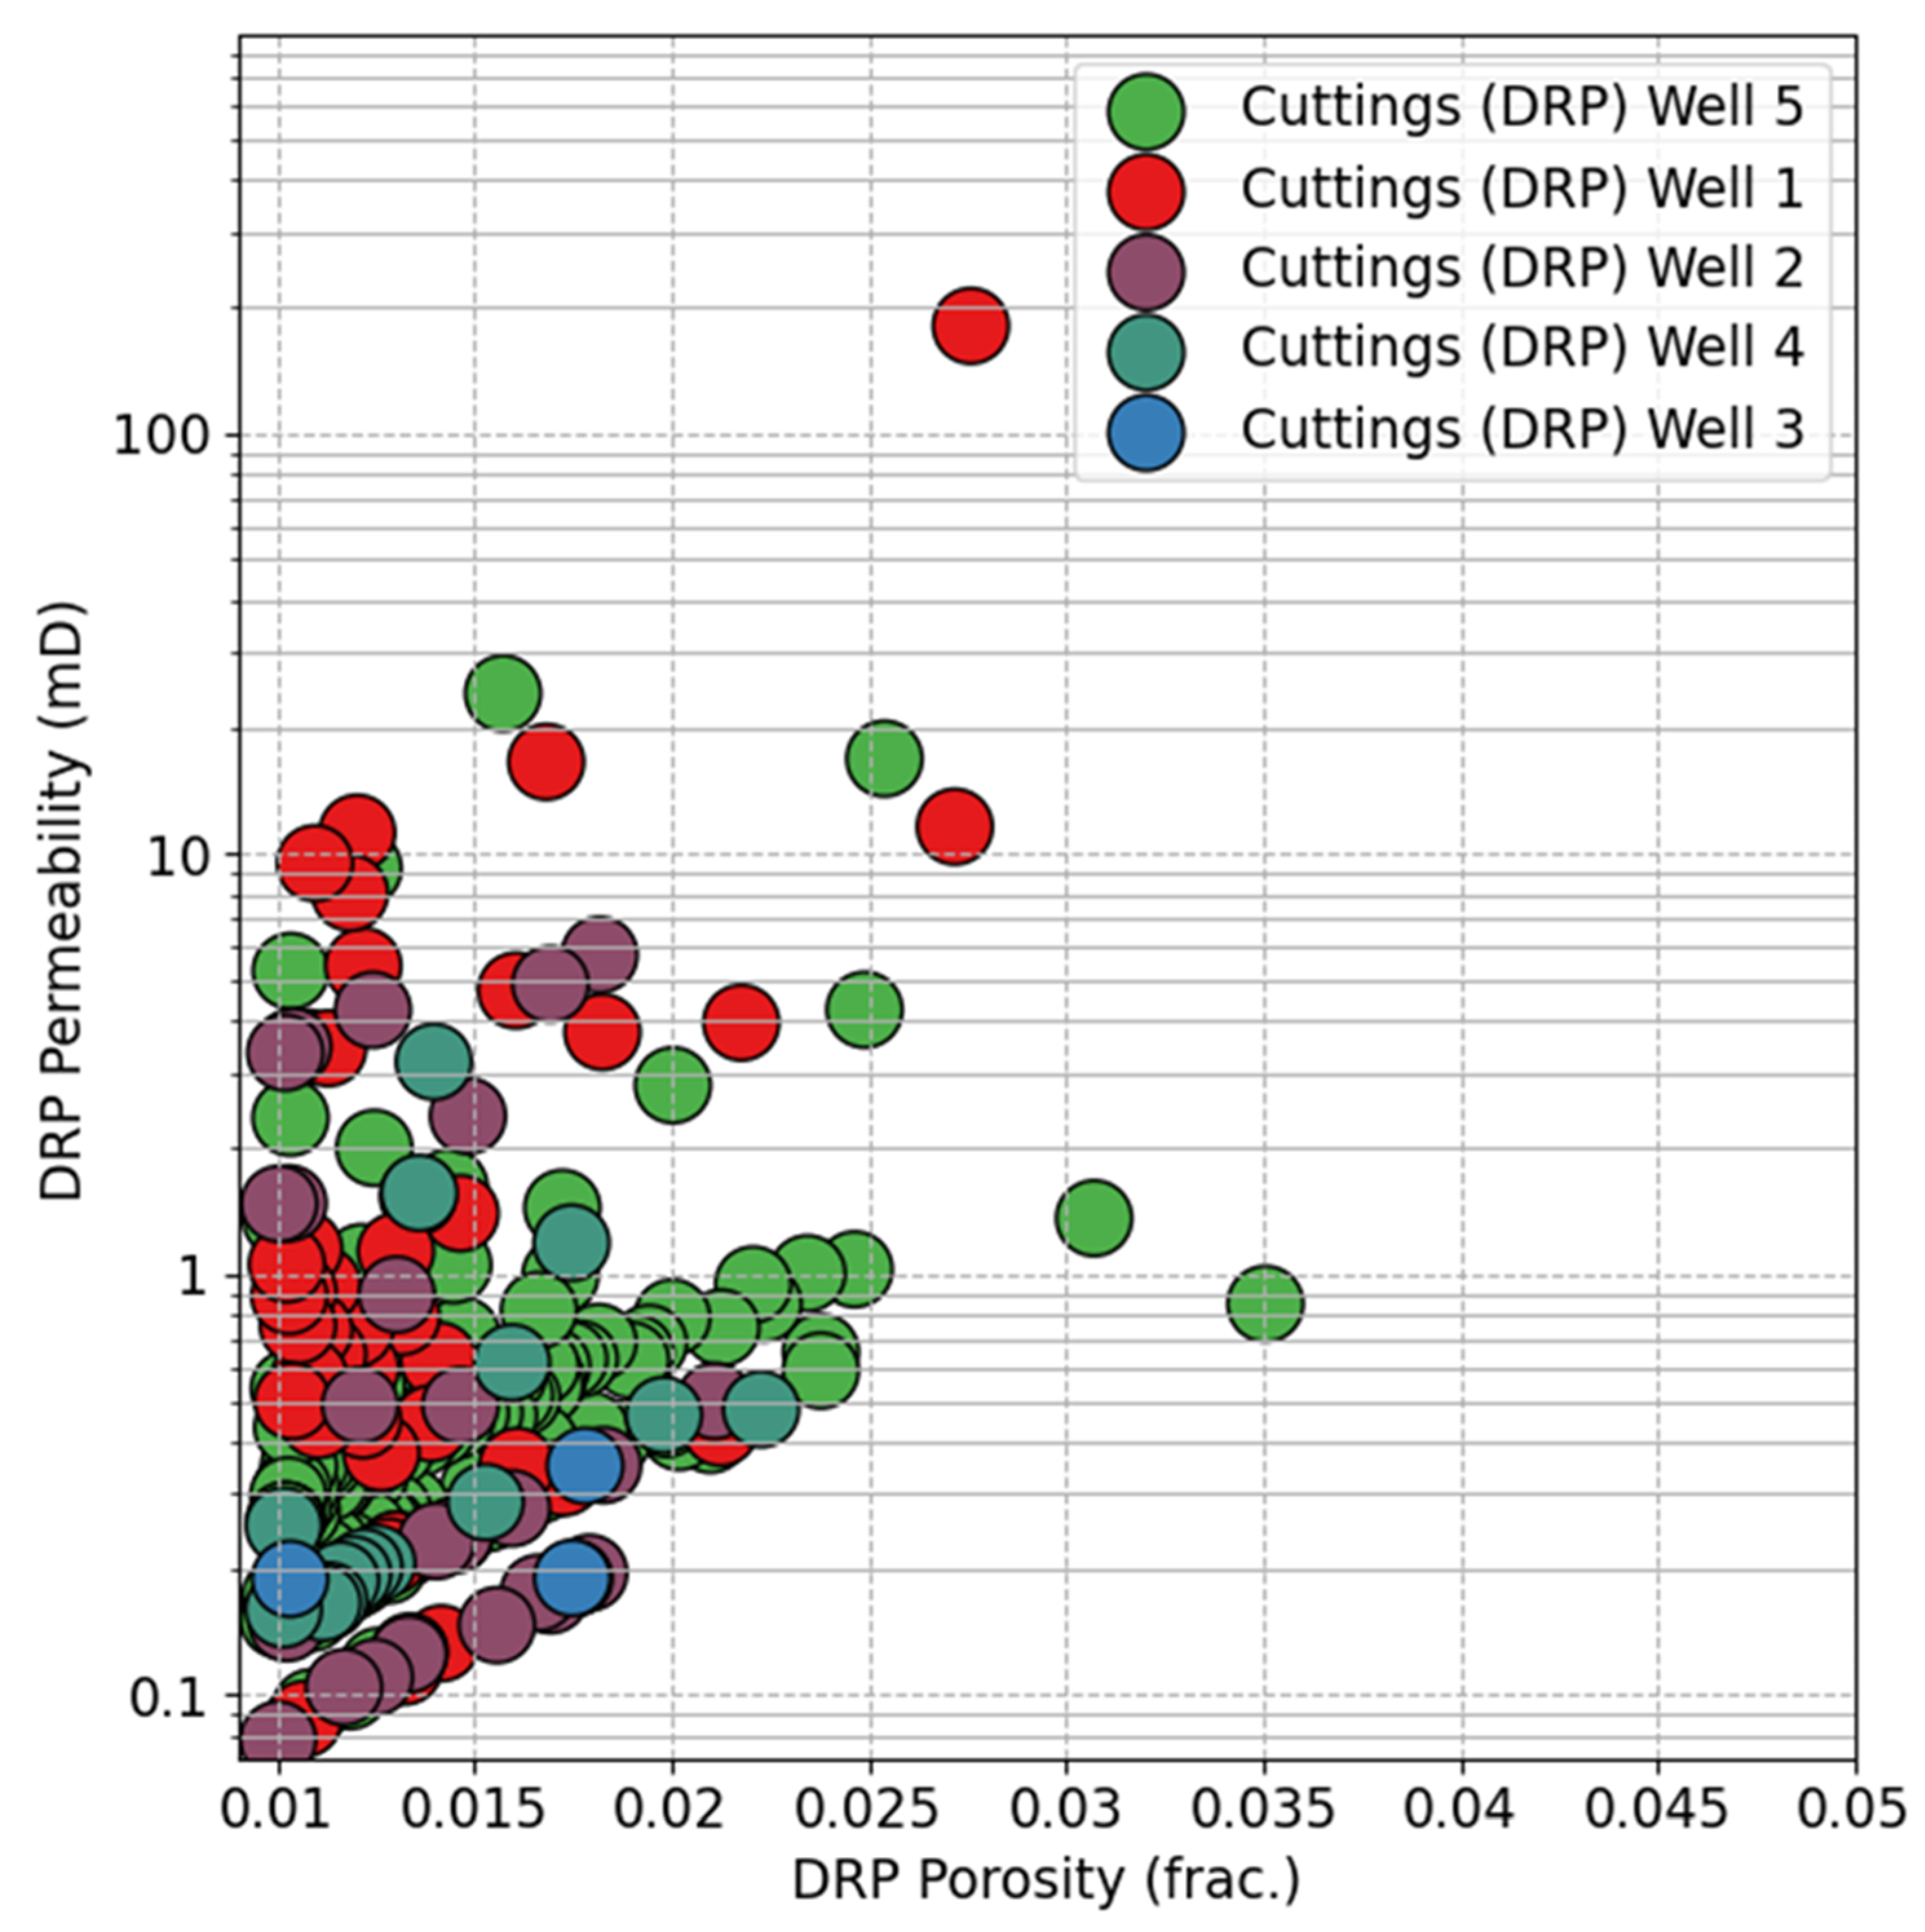
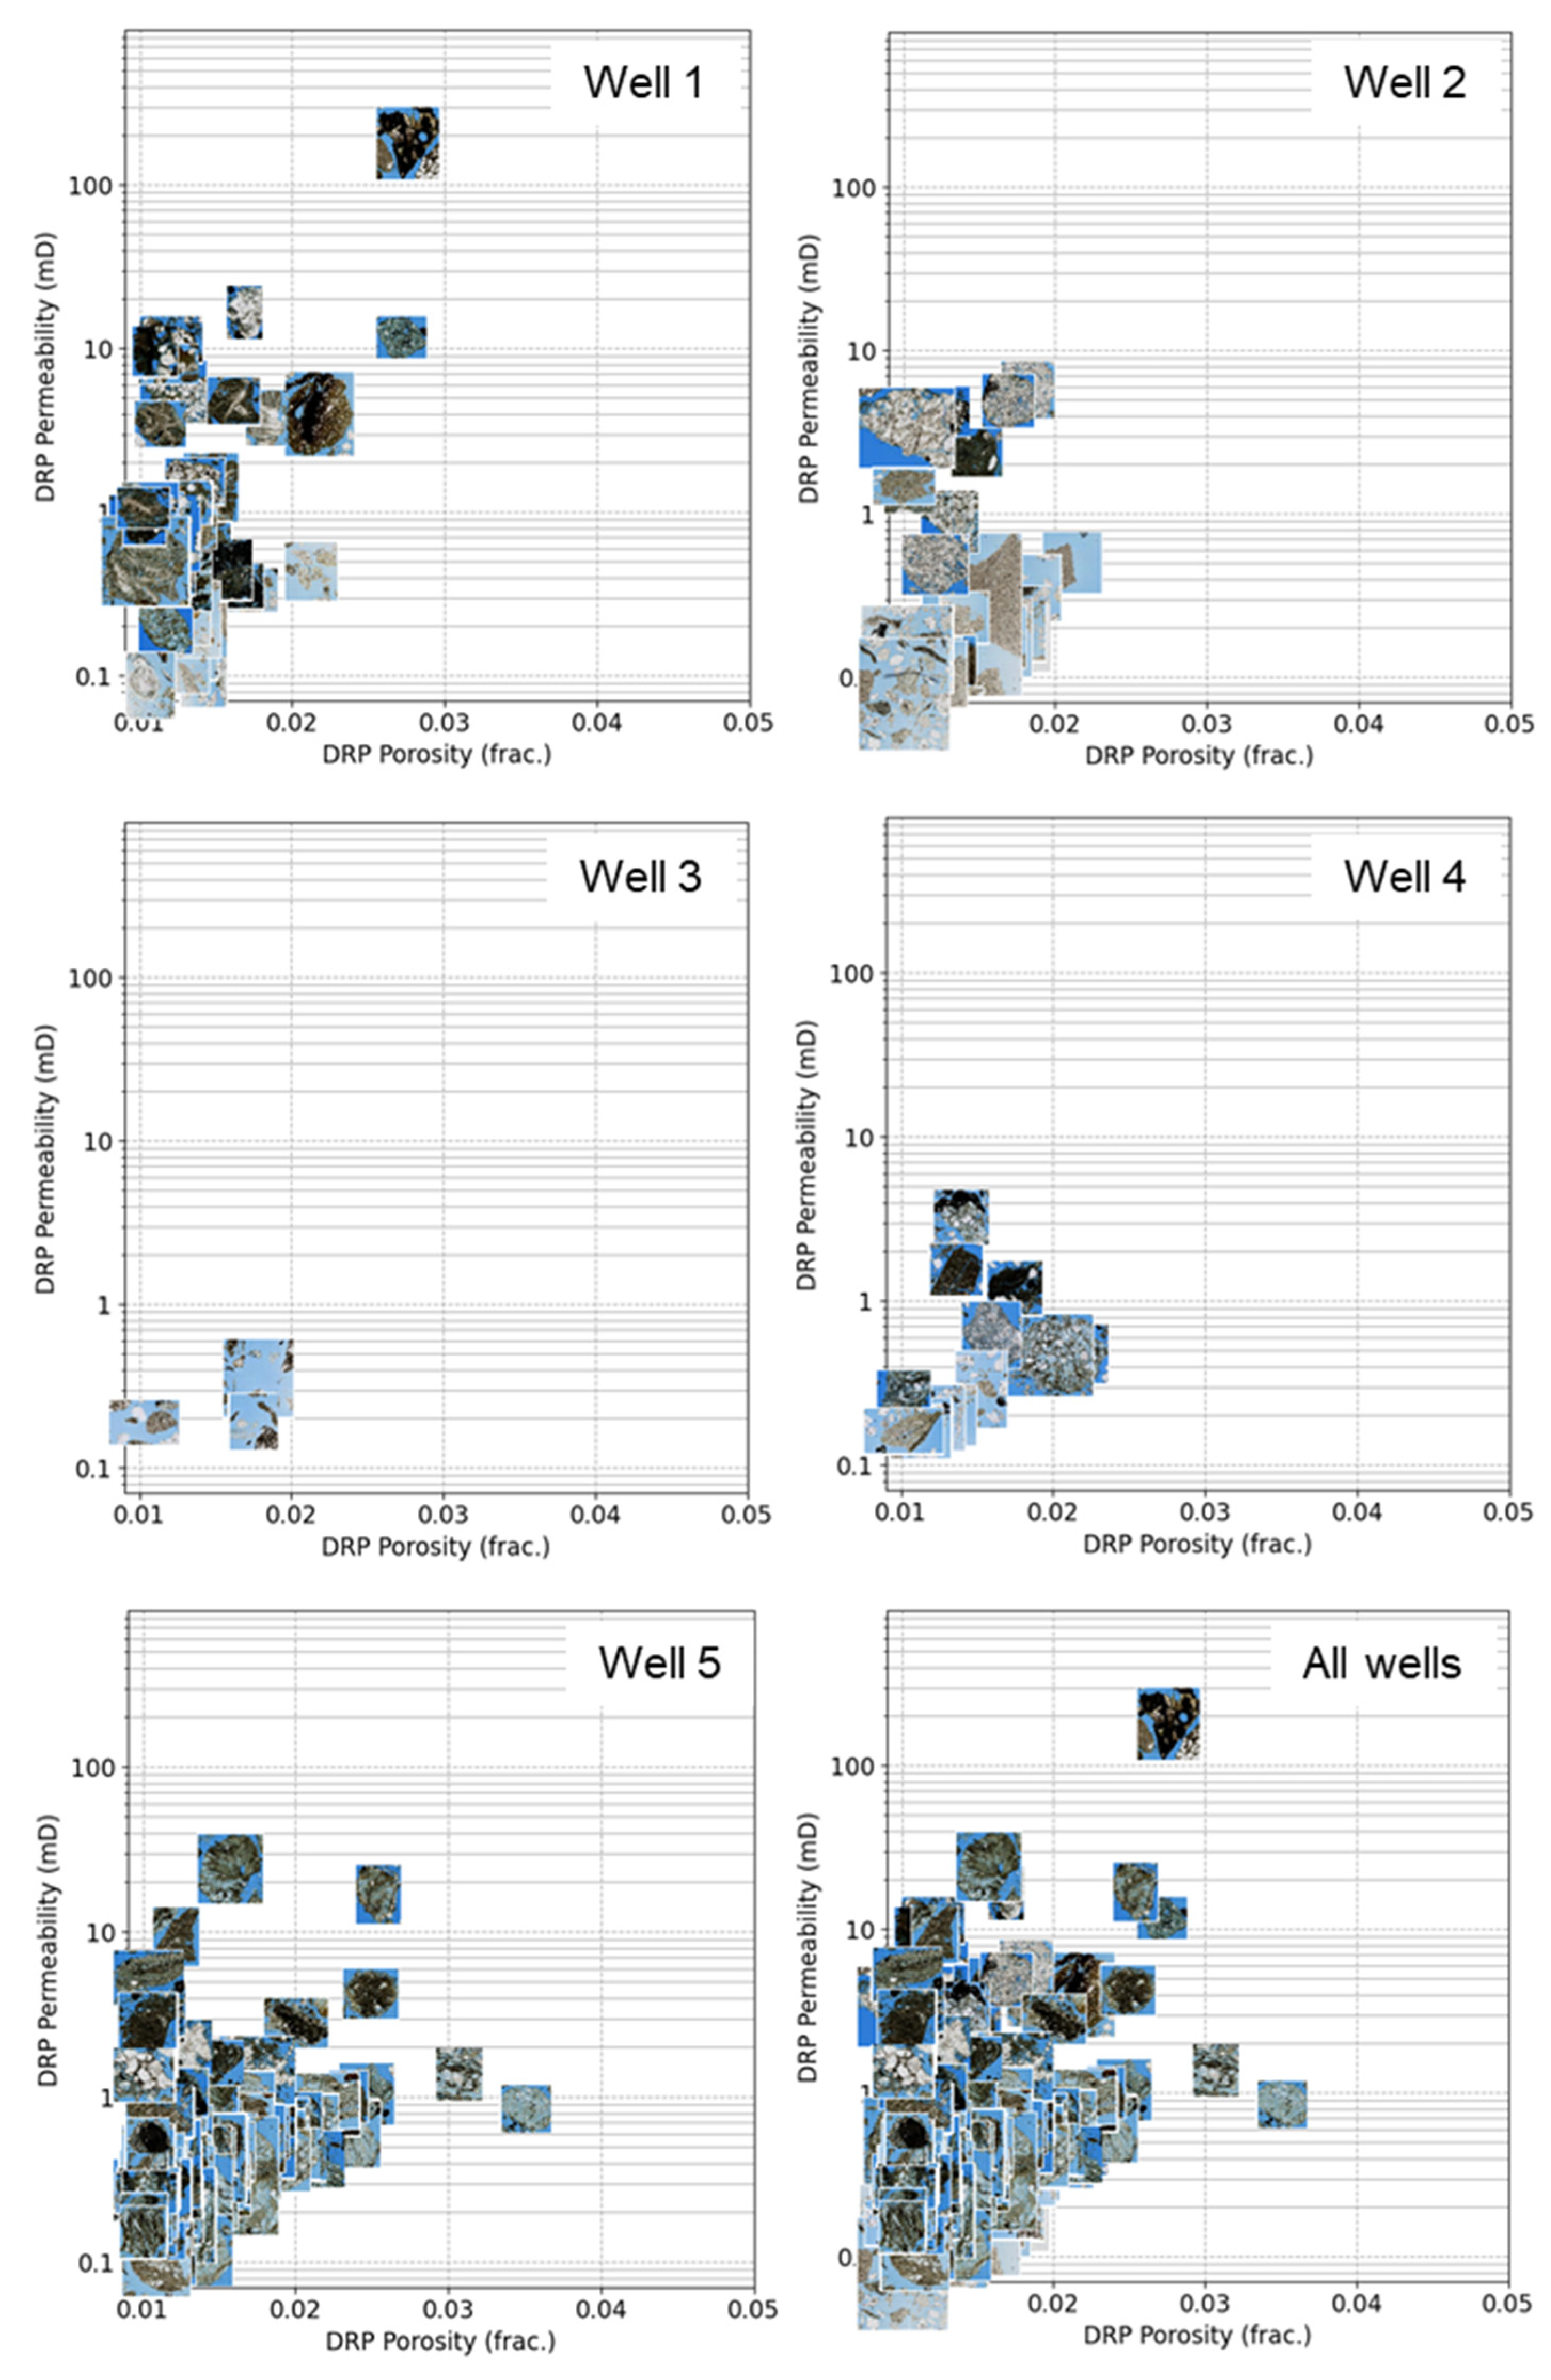
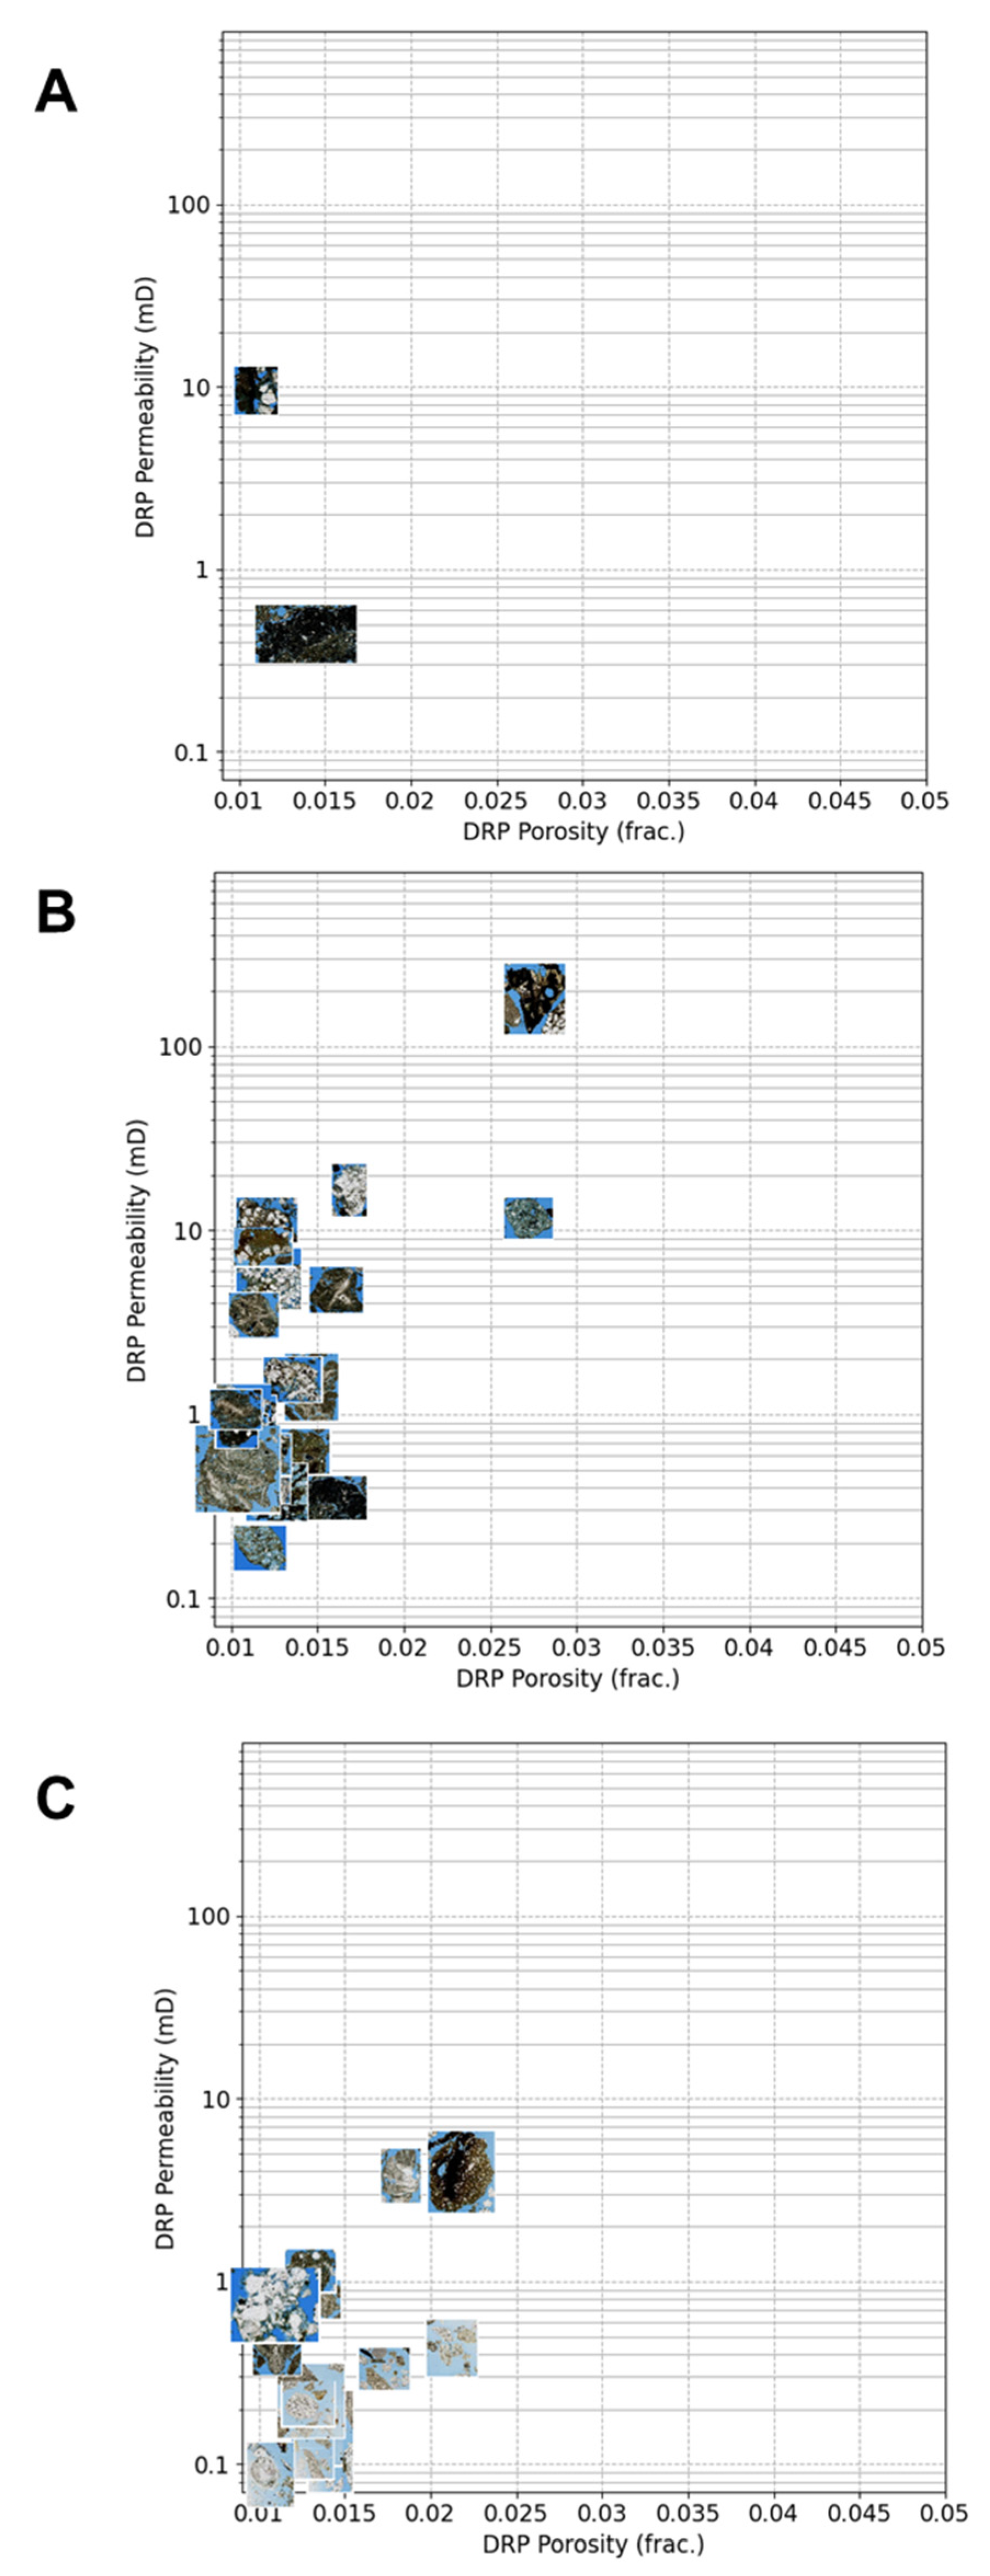
3.4. DRP Cuttings from Oil and Gas Wells
4. Discussion
4.1. RCAL vs. DRP in Plugs and Pseudo-Cuttings
4.2. DRP in Real Cuttings
4.3. DRP Workflow and Image Data
4.4. DRP Time, Cost, and Added Value
5. Conclusions
Supplementary Materials
Author Contributions
Funding
Data Availability Statement
Conflicts of Interest
References
- Dvorkin, J.; Armbruster, M.; Baldwin, Q.; Derzhi, N.; Gomez, C.; Nur, B.; Nur, A.; Mu, Y. The future of rock physics: Computational methods vs. lab testing. First Break. 2008, 26, 63–68. [Google Scholar] [CrossRef]
- Balcewicz, M.; Siegert, M.; Gurris, M.; Ruf, M.; Krach, D.; Steeb, H.; Saenger, E.H. Digital Rock Physics: A Geological Driven Workflow for the Segmentation of Anisotropic Ruhr Sandstone. Front. Earth Sci. 2021, 9, 19. [Google Scholar] [CrossRef]
- Riepe, L.; Knackstedt, M. Quantitative Mineralogical and Petrophysical Analysis of Cuttings. In Proceedings of the Petroleum Geoscience Conference & Exhibition, Kuala Lumpur, Malaysia, 18–19 March 2013; European Association of Geoscientists & Engineers: Utrecht, The Netherlands, 2013; p. 4. [Google Scholar]
- Andrä, H.; Combaret, N.; Dvorkin, J.; Glatt, E.; Han, J.; Kabel, M.; Keehm, Y.; Krzikalla, F.; Lee, M.; Madonna, C.; et al. Digital rock physics benchmarks—Part I: Imaging and segmentation. Comput. Geosci. 2013, 50, 25–32. [Google Scholar] [CrossRef]
- Jouini, M.S.; Keskes, N. Numerical estimation of rock properties and textural facies classification of core samples using X-ray Computed Tomography images. Appl. Math. Model. 2017, 41, 562–581. [Google Scholar] [CrossRef]
- Jouini, M.S.; Gomes, J.S.; Tembely, M.; Ibrahim, E.R. Upscaling Strategy to Simulate Permeability in a Carbonate Sample Using Machine Learning and 3D Printing. IEEE Access 2021, 9, 90631–90641. [Google Scholar] [CrossRef]
- Sun, H.; Tao, G.; Vega, S.; Al-Suwaidi, A. Simulation of gas flow in organic-rich mudrocks using digital rock physics. J. Nat. Gas Sci. Eng. 2017, 41, 17–29. [Google Scholar] [CrossRef]
- Verri, I.; Della Torre, A.; Montenegro, G.; Onorati, A.; Duca, S.; Mora, C.A.; Radaelli, F. Development of a Digital Rock Physics workflow for the analysis of sandstones and tight rocks. J. Nat. Gas Sci. Eng. 2017, 156, 790–800. [Google Scholar] [CrossRef]
- Arns, C.H.; Knackstedt, M.A.; Pinczewski, W.V.; Martys, N.S. Virtual permeametry on microtomographic images. J. Pet. Sci. Eng. 2004, 45, 41–46. [Google Scholar] [CrossRef]
- Pérez-Jiménez, J.L.; Caja, M.A.; Peña, A.C.; Blázquez, V.; Santos, C.A.; García-Diego, L.; Sánchez Pérez-Cejuela, V.; Palomares, E.; Bover-Arnal, T.; Martín-Martín, J.D. Digital Rock Physics in Drill Cuttings. In Proceedings of the ResTech2020 Virtual Reservoir Conference, Online, 22 April 2020; European Association of Geoscientists & Engineers: Utrecht, The Netherlands, 2020; p. 2. [Google Scholar]
- Menéndez, B.; Christian, D.; Nistal, A. Confocal scanning laser microscopy applied to the study of pore and crack networks in rocks. Comput. Geosci. 2001, 27, 1101–1109. [Google Scholar] [CrossRef]
- Hurley, N.F.; Zhang, T.; Zhao, W.; Xu, G. Confocal Microscopy—A New Way to Model Carbonate Porosity in 3D. In Proceedings of the AAPG GEO 2010 Middle East Geoscience Conference & Exhibition, Manama, Bahrain, 7–10 March 2010; European Association of Geoscientists & Engineers: Utrecht, The Netherlands, 2010; p. 1. [Google Scholar]
- Al Ibrahim, M.A.; Hurley, N.F.; Zhao, W.; Acero-Allard, D. An automated PIA system: Capillary pressure curves using confocal microscopy. In Proceedings of the SPE Annual Technical Conference and Exhibition, San Antonio, TX, USA, 8–10 October 2012; OnePetro: Richardson, TX, USA, 2012. SPE-159180-MS. p. 21. [Google Scholar]
- Shah, S.M.J.; Yang, J.; Crawshaw, P.; Gharbi, O.; Boek, E.S. Predicting porosity and permeability of carbonate rocks from core-scale to pore-scale using medical CT, confocal laser scanning microscopy and micro CT. In Proceedings of the Society of Petroleum Engineers Annual Technical Conference and Exhibition, New Orleans, LA, USA, 30 September–2 October 2013; SPE: San Antonio, TX, USA, 2013. SPE-166252-MS. p. 13. [Google Scholar] [CrossRef]
- Shah, S.M.; Crawshaw, P.; Boek, E.S. Threedimensional imaging of porous media using confocal laser scanning microscopy. J. Microsc. 2017, 265, 261–271. [Google Scholar] [CrossRef] [PubMed]
- Caja, M.A.; Pérez-Jiménez, J.L.; León, M.F.; Acero-Allard, D. Confocal laser scanning microscopy and automated petrographic image analysis in different rock types: Two-dimensional images capillary pressure curves estimation and three-dimensional porosity reconstruction. AAPG Bull. 2019, 103, 1963–1978. [Google Scholar] [CrossRef]
- Caja, M.A.; Santos, C.A.; García, L.; Fernández, P.R.; Pérez, J.L.; Peña, A.; Canal, J.; Blázquez, V.; González, H.; Sánchez, V.; et al. Characterizing Algeria tight reservoir cutting samples with Virtual Microscopy, Petrography, Mineralogy and Digital Petrophysics. In Proceedings of the EAGE/ALNAFT Geoscience Workshop, Algiers, Africa, 28–29 January 2019; European Association of Geoscientists & Engineers: Utrecht, The Netherlands, 2019; p. 5. [Google Scholar]
- Crabtree, M. Algorithm Development of a PIA System. Ph.D. Thesis, The University of Tulsa, Tulsa, OK, USA, 1983. [Google Scholar]
- Ehrlich, R.; Kennedy, S.K.; Crabtree, S.J.; Cannon, R.L. PIA. Pt 1 analysis of reservoir pore complexes. J. Sediment. Petrol. 1984, 54, 1365–1378. [Google Scholar]
- Korkowitz, J.P. Estimation of petrophysics from thin sections—PIA. AAPG Bull. 1987, 71, 2. [Google Scholar]
- James, H. Application of PIA to the characterization of fluid-flow pathways in a highly-cemented reservoir. J. Pet. Sci. Eng. 1995, 13, 141–154. [Google Scholar] [CrossRef]
- Caja, M.A.; Peña, A.C.; Campos, J.R.; García Diego, L.; Tritlla, J.; Bover-Arnal, T.; Martín-Martín, J.D. Image processing and machine learning applied to lithology identification, classification and quantification of thin section cutting samples. In Proceedings of the SPE Annual Technical Conference and Exhibition, Calgary, AB, Canada, 30 September–2 October 2019; OnePetro: Richardson, TX, USA, 2019. SPE-196117-MS. p. 8. [Google Scholar]
- Peña, A.; Caja, M.A.; Campos, J.R.; Santos, C.A.; Pérez, J.L.; Fernández, P.R.; Tritlla, J. Application of Machine Learning models in thin sections image of drill cuttings: Lithology classification and quantification (Algeria tight reservoirs). In Proceedings of the EAGE/ALNAFT Geoscience Workshop, Algiers, Africa, 28–29 January 2019; European Association of Geoscientists & Engineers: Utrecht, The Netherlands, 2019; p. 5. [Google Scholar]
- López-García, J.; Caja, M.A.; Peña, A.C.; Nadukandi, P. Automatic lithological classification and quantification in thin-sections of drill cuttings, 2020. In Proceedings of the ResTech2020 Virtual Reservoir Conference, Online, 22 April 2020; European Association of Geoscientists & Engineers: Utrecht, The Netherlands, 2019; p. 2. [Google Scholar]
- ASTM D422-63 2007-e2; Standard Test Method for Particle-Size Analysis of Soils. ASTM International: West Conshohocken, PA, USA, 2007. Available online: https://www.astm.org/ (accessed on 28 August 2023).
- Reyes, R.; Kyzym, I.; Rana, P.S.; Molgaard, J.; Butt, S.D. Cuttings Analysis for Rotary Drilling Penetration Mechanisms and Performance Evaluation. In Proceedings of the ARMA US Rock Mechanics/Geomechanics Symposium, San Francisco, CA, USA, 29 June–1 July 2015; OnePetro: Richardson, TX, USA, 2015. ARMA 15-764. p. 9. [Google Scholar]
- Winland, H.D. Oil Accumulation in Response to Pore Size Changes. In Amoco Production Research Report; Amoco Production Company: Weyburn Field, SK, Canada, 1972; No. F72-G-25. [Google Scholar]
- PETMiner Software. Available online: http://www.petriva.co.uk/en/software-new/ (accessed on 28 August 2023).
- Graves, W. Bit-Generated Rock Textures and Their Effect on Evaluation of Lithology, Porosity, and Shows in Drill-Cutting Samples. AAPG Bull. 1986, 70, 1129–1135. [Google Scholar]
- Wenger, L.M.; Pottorf, R.J.; Macleod, G.; Otten, G.; Dreyfus, S.; Justwan, H.; Wood, E.S. Drill-Bit Metamorphism: Recognition and Impact on Show Evaluation. In Proceedings of the SPE Annual Technical Conference and Exhibition, New Orleans, LA, USA, 4–7 October 2009; SPE: San Antonio, TX, USA, 2009. SPE 125218. p. 9. [Google Scholar]
- Jones, D.; Davis, C.; Justwan, H.; Wenger, L. Effect of PDC-bit platelets on geochemical data quality and hydrocarbon-systems evaluation. In Proceedings of the 25th IMOG Interlaken, Interlaken, Switzerland, 18–23 September 2011; European Association of Roganic Geochemistry: Montpelier, France; p. 1. [Google Scholar]


| ID | Sample ID | Name | Formation | Homogeneous | Porosity (%) | Permeability (mD) |
|---|---|---|---|---|---|---|
| 1 | SS-123 | Torrey Buff | Eocene | Yes | 13–17 | 0.4–3 |
| 2 | SS-100 | Bandera Brown | Desmoinesian | No | 21–23 | 30–45 |
| 3 | SS-109 | Carbon Tan | Late Cretaceous | Yes | 12–17 | 40–50 |
| 4 | SS-121 | San Saba | Paleozoic | Yes | 19–21 | 70–85 |
| 5 | SS-106 | Berea Spider | Upper Devonian | Yes | 19–21 | 120–300 |
| 6 | SS-120 | Salt Wash North | N/A | Yes | 20–22 | 440–800 |
| 7 | SS-110 | Castlegate | Late Cretaceous | Yes | 27–29 | 800–1200 |
| ID | Sample ID | Name | Porosity (frac.) | Permeability (mD) |
|---|---|---|---|---|
| 1 | SS-123 | Torrey Buff | 0.17 | 3.2 |
| 2 | SS-100 | Bandera Brown | 0.26 | 84 |
| 3 | SS-109 | Carbon Tan | 0.17 | 53 |
| 4 | SS-121 | San Saba | 0.21 | 68 |
| 5 | SS-106 | Berea Spider | 0.21 | 256 |
| 6 | SS-120 | Salt Wash North | 0.22 | 622 |
| 7 | SS-110 | Castlegate | 0.28 | 801 |
| ID | Sample ID | Name | Porosity (frac.) | Permeability (mD) |
|---|---|---|---|---|
| 1 | SS-123 | Torrey Buff | 0.16 | 2.3 |
| 2 | SS-100 | Bandera Brown | 0.22 | 34 |
| 3 | SS-109 | Carbon Tan | 0.19 | 93 |
| 4 | SS-121 | San Saba | 0.23 | 44 |
| 5 | SS-106 | Berea Spider | 0.25 | 528 |
| 6 | SS-120 | Salt Wash North | 0.23 | 555 |
| 7 | SS-110 | Castlegate | 0.23 | 435 |
| ID | Sample ID | Name | Porosity (frac.) | Permeability (mD) |
|---|---|---|---|---|
| 1 | SS-123 | Torrey Buff | 0.16 | 3.4 |
| 2 | SS-100 | Bandera Brown | 0.19 | 26 |
| 3 | SS-109 | Carbon Tan | 0.19 | 55 |
| 4 | SS-121 | San Saba | 0.2 | 40 |
| 5 | SS-106 | Berea Spider | 0.25 | 172 |
| 6 | SS-120 | Salt Wash North | 0.22 | 158 |
| 7 | SS-110 | Castlegate | 0.25 | 220 |
Disclaimer/Publisher’s Note: The statements, opinions and data contained in all publications are solely those of the individual author(s) and contributor(s) and not of MDPI and/or the editor(s). MDPI and/or the editor(s) disclaim responsibility for any injury to people or property resulting from any ideas, methods, instructions or products referred to in the content. |
© 2023 by the authors. Licensee MDPI, Basel, Switzerland. This article is an open access article distributed under the terms and conditions of the Creative Commons Attribution (CC BY) license (https://creativecommons.org/licenses/by/4.0/).
Share and Cite
Caja, M.Á.; Castillo, J.N.; Santos, C.A.; Pérez-Jiménez, J.L.; Fernández-Díaz, P.R.; Blázquez, V.; Esteve, S.; Campos, J.R.; Bover-Arnal, T.; Martín-Martín, J.D. Digital Rock Physics in Cuttings Using High-Resolution Thin Section Scan Images. Minerals 2023, 13, 1140. https://doi.org/10.3390/min13091140
Caja MÁ, Castillo JN, Santos CA, Pérez-Jiménez JL, Fernández-Díaz PR, Blázquez V, Esteve S, Campos JR, Bover-Arnal T, Martín-Martín JD. Digital Rock Physics in Cuttings Using High-Resolution Thin Section Scan Images. Minerals. 2023; 13(9):1140. https://doi.org/10.3390/min13091140
Chicago/Turabian StyleCaja, Miguel Ángel, José Nicolás Castillo, Carlos Alberto Santos, José Luis Pérez-Jiménez, Pedro Ramón Fernández-Díaz, Vanesa Blázquez, Sergi Esteve, José Rafael Campos, Telm Bover-Arnal, and Juan Diego Martín-Martín. 2023. "Digital Rock Physics in Cuttings Using High-Resolution Thin Section Scan Images" Minerals 13, no. 9: 1140. https://doi.org/10.3390/min13091140