Article

Mineral Carbonation Potential (MCP) of Mine Waste Material: Derivation of an MCP Parameter

1
Norman B. Keevil Institute of Mining Engineering, University of British Columbia, Vancouver, BC V6T 1Z4, Canada
2
WA School of Mines: Minerals, Energy and Chemical Engineering, Bentley, WA 6102, Australia
3
Faculty of Science, University of the Fraser Valley, Abbotsford, BC V2S 7M8, Canada
4
School of Civil and Resource Engineering, University of Science and Technology Beijing, Beijing 100083, China
5
Key Laboratory of Efficient Mining and Safety of Metal Mines, Ministry of Education, University of Science and Technology Beijing, Beijing 100083, China
*
Author to whom correspondence should be addressed.
Minerals 2023, 13(9), 1129; https://doi.org/10.3390/min13091129
Submission received: 3 July 2023 / Revised: 12 August 2023 / Accepted: 17 August 2023 / Published: 26 August 2023
(This article belongs to the Special Issue Advances in Mineral Carbonation)

Abstract

:
The heterogenous mineralogy of ultramafic deposits hosting mining operations makes it challenging to accurately determine the waste rock’s mineral carbonation potential (MCP). Additionally, the significantly higher carbonation capabilities of olivine than serpentine add to the difficulty. To address this issue, in this work, a new and unique tool called the MCP calculator was developed as a Microsoft ExcelTM spreadsheet to accurately determine the amount of anthropogenic CO2 that a given rock mass can sequester through mineral carbonation. The program estimates the modal mineral abundance of ultramafic rocks to aid in MCP estimation. This tool is designed to be cost-effective and tailored for use by the mining industry, utilising abundant lithogeochemical data to evaluate their deposit as a potential substrate for industrial mineral carbonation operations. The paper introduces the MCP calculator, outlines a framework for developing the MCP parameter, and presents an example of its application. The calculator is specific to the mineral assemblage investigated at the Turnagain ultramafic complex in northern British Columbia but can be adjusted to study comparable deposits. The paper acknowledges that using waste rock in a mineral carbonation operation requires economic and practical decisions beyond the scope of the research.

1. Introduction

Mineral carbonation is a process by which carbon dioxide (CO2) reacts with minerals in rocks to form solid carbonates [1]. The reaction can naturally occur over geological timescales or can be artificially accelerated for carbon-capture and storage purposes [2]. Mineral carbonation has the potential to significantly mitigate greenhouse gas emissions by removing CO2 from the atmosphere and permanently storing it in solid form [3,4]. The process can utilise waste materials, such as mine tailings, as a source of minerals, providing an additional benefit of reducing waste while mitigating emissions [5,6]. Mineral carbonation has been the subject of numerous studies in the fields of geology [7,8,9], mineralogy [10], engineering [11,12,13,14], and environmental science [15,16]. These studies have focused on several key aspects of the process, including, but not limited to, the reaction kinetics [11,17,18], mineral reactivity [17], rock types [9], and life cycle analysis [4,15,16]. Different rocks have been studied to understand their potential for mineral carbonation and the effectiveness of different carbonation methods for specific rock types [19,20,21]. The mineralogy of the rock and the presence of reactive minerals, such as olivine, serpentine, and brucite, play a critical role in determining the suitability of a rock for mineral carbonation [8,22]. In practice, the capability of a rock to sequester anthropogenic CO2 through mineral carbonation is determined through a combination of laboratory experiments and field studies, which provide information on the kinetics and thermodynamics of mineral carbonation reactions [23]. The typical procedure starts with a complete characterisation of the rock mineralogy and composition, followed by reactivity tests at the laboratory and pilot scales to measure the rate and extent of the carbonation reaction for the specific rock [24,25]. In the case of field studies, once carbonation has been initiated, the process is monitored to determine the extent of carbonation over time and ensure the stability of the carbonates in the long-term [7,26,27].
Although following these steps provides valuable information for designing and implementing mineral carbonation, conducting experiments on every available rock is impractical. Therefore, developing mathematical models is necessary to predict the performance of mineral carbonation for different rock types and conditions. Researchers worked extensively on kinetics and thermodynamic models that simulate the mineral carbonation reaction rate and extent over time and under conditions, such as the temperature, pressure, and pH. They also predict the type and stability of carbonates and the reaction conditions required for mineral carbonation [28,29].
The possibility of using mine tailings from ultramafic formations for ex situ mineral carbonation and additional mineral recovery has been the subject of several studies conducted by mining companies and research institutes [30,31,32]. Incorporating waste rock and tailings in a mineral carbonation operation involves several practical and economic considerations. These include developing a viable industrial-scale mineral carbonation process, determining the economic feasibility of mining enough substrate rock to supply a mineral carbonation plant, and, crucially, establishing a financial incentive to pursue mineral carbonation operations in the first place [33]. Diamond drill core sampling and analysis commonly provide lithogeochemical data in mining operations. Hence, there is a significant benefit in developing a method to utilise this data to determine a deposit’s mineral carbonation potential and inherent internal variability.
The geological mapping of ultramafic deposits can provide an initial estimate of the volume of ultramafic rocks at a deposit, whether carried out by a national geological survey or a mining company. By analysing bulk rock samples taken during surface mapping and assaying them for principal cation oxides, the R CO 2 of that rock mass can be derived, which can be used to provide a preliminary estimate of the capacity of that rock mass to sequester CO2. R CO 2 is a widely used parameter to estimate the mineral carbonation potential of an ultramafic deposit. This measure was initially proposed by Lackner, Wendt [34]. R CO 2 is the mass of ore required to convert a unit mass of CO2 into carbonate. The initial measure was based on the molar concentration of magnesium and calcium, as described by Lackner, Wendt [34,35]. However, the calculation was later revised [36] to include ferric iron as shown below:
Modified   R CO 2 = 100 ( Ca 2 + + Fe 2 + + Mg 2 + ) MW CO 2
where ΣCa2+ + Fe2+ + Mg2+ are the sum of the molar concentrations for the specified cations, and MWCO2 is the molecular weight of CO2. Theoretical minimum R CO 2 values have been calculated as 2.1, 1.6, and 2.7 for serpentine, olivine and wollastonite, respectively [37]. This initial approach is sufficient to determine if the deposit justifies additional exploration as a potential material source for a mineral carbonation operation. To develop a more informed estimation, a more detailed investigation is required.
In this research, we aimed to create the mineral carbonation potential (MCP) parameter, which can be generated from existing lithogeochemical data in three-dimensional space. The parameter is exclusively intended for use in the mining industry due to data availability, typically only found in deposits with economic mineral importance. The MCP parameter measures the potential for a rock mass at a specific location to store carbon dioxide via mineral carbonation. Due to varying deposit types, mineralogy, and the range of mineral carbonation methods present at a research stage, generating an applicable parameter to suit all these factors is challenging. In this article, we first propose a framework for developing an MCP parameter. Then, this approach is illustrated using lithogeochemical data from the Turnagain ultramafic complex in northern British Columbia, Canada, as an example. Although the calculator is tailored to the specific mineral assemblage studied at Turnagain, the estimation process can be modified to analyse similar deposits.

2. Data Collection and Mineralogical Investigation for the Estimation of MCP

A well-structured data collection program is imperative to assess ultramafic deposits for their potential in mineral carbonation. Such a program should include a sampling protocol explicitly designed for a mineral carbonation investigation, utilising various geological, mineralogical, and geochemical analytical techniques. This section provides an overview of the data types commonly available during mining exploration or operation stages. In the following section, methodology is proposed for manipulating existing data to estimate the MCP of ultramafic deposits, using the available data from the Turnagain ultramafic deposit as a case study.
The data preparation required for the MCP calculator is relatively simple. All lithogeochemical assay results obtained from drill core samples at the ultramafic complex can be incorporated into the calculator. However, it is essential to store each drill core assay interval in a database and link it to the corresponding drill hole. A unique sample identification should be assigned to identify the depth interval represented by each sample. It is crucial to have a geoscientist classify the rock by logging the drill core sample intervals based on their geological characteristics. A representative sample from each interval must also be assayed for major cation quantities.
A mineralogical investigation is crucial to estimate the mineral carbonation potential (MCP) of ultramafic deposits. Mining or exploration companies usually conduct a detailed mineralogical study of the central rock units in targeted ultramafic deposits. This investigation involves optical microscopy of thin sections cut from representative samples of each lithology and an X-ray diffraction analysis (XRD) to determine the principal mineral assemblage of each lithology. Estimating the proportions of magnesium and calcium silicates within each rock unit is essential due to the variable success of using differing magnesium and calcium silicates in experimental mineral carbonation. Identification of the major mineral phases for each lithology should be determined through optical microscopy and XRD, which can provide a preliminary assessment of the abundance of each mineral and the degree of alteration present for each lithology. Quantitative methods, such as thin-section point counting and XRD with Rietveld refinement, can provide a more precise determination of the principal mineral quantities. Mineralogical investigation can also aid any modal mineral estimation undertaken, such as electron microprobe analysis of individual minerals, which can aid in determining their precise geochemical makeup. For instance, determining the Mg2+/Fe2+ ratio (magnesium number) of olivine minerals is crucial. It can vary significantly between rock types and provide a misrepresentation of the magnesium cation quantity available for mineral carbonation from olivine. A better understanding of the mineralogy of ultramafic deposits can improve the estimation of their MCP.

3. Case Study: Turnagain Ultramafic Deposit, British Columbia, Canada

The Turnagain ultramafic deposit was evaluated as a potential site for mineral carbonation based on preliminary geological mapping that estimated a volume of approximately 10.8 km3 of ultramafic rocks. This deposit has been explored and drilled by Hard Creek Nickel Corporation to develop a resource estimate for a potential nickel sulphide mining operation.

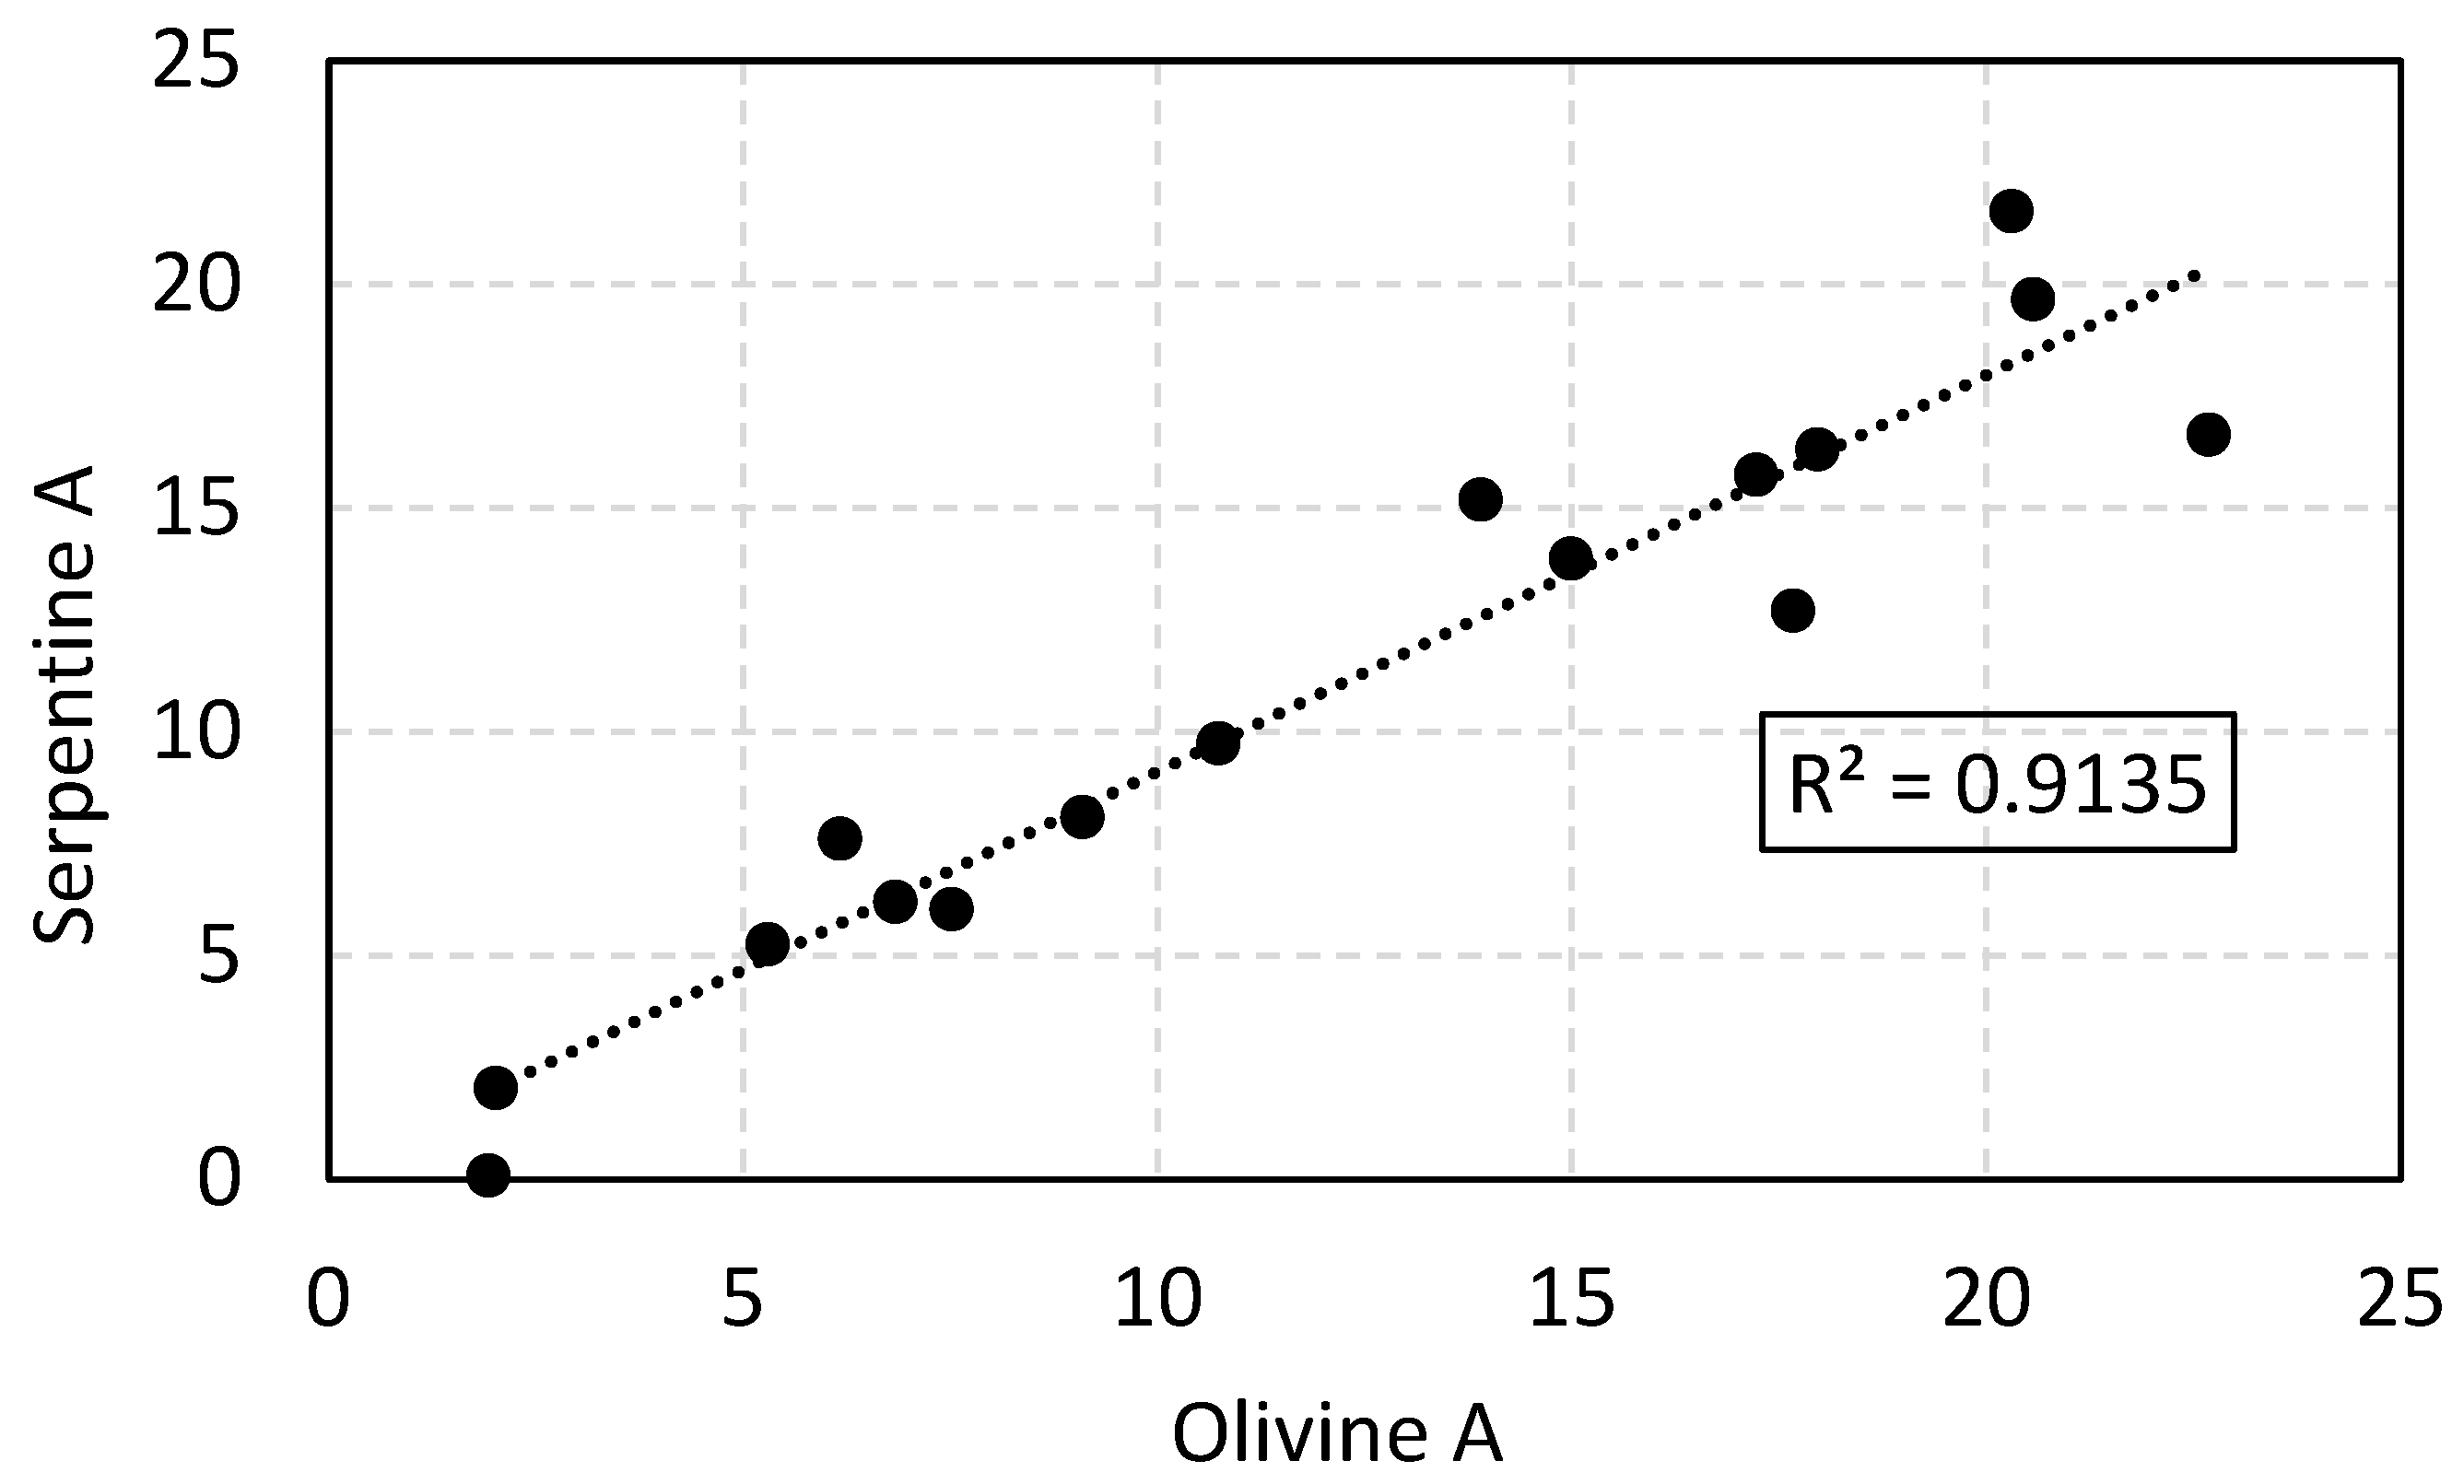
3.1. Preliminary Data Analysis

This research performed X-ray fluorescence (XRF) on 16 samples to estimate their major oxide content. The loss on ignition (LOI) value, a key indicator targeted for the estimation of serpentine in the rocks, was determined. Optical mineralogy was also undertaken by geoscientists at the Turnagain ultramafic complex [38,39]. The major cumulate rock units at Turnagain comprise dunite, wehrlite, hornblendite, and minor dioritic phases. More details on the predominant mineral assemblage of each of these significant rock types were published in a Master’s thesis by Scheel [39]. This provided the basis for estimating the mineral assemblage using the MCP calculator in this research.
Five specific rock types were targeted at the deposit based on their potential to sequester CO2 via direct aqueous mineral carbonation. These rock types were green dunite, dunite, wehrlite, olivine clinopyroxenite, and serpentinite. The rock identification of each interval was extracted from the Turnagain exploration database, and the drill hole collar and survey information, the logged geology codes, and relevant ICP-ES geochemical assay results were added to the database. The rock types were selected based on the recorded high magnesium contents and expected high olivine contents.
The green dunite lithology was identified as separate from dunite due to the olivine crystals’ higher Mg2+/Fe2+ composition. The MCP calculator requires the magnesium number to be identified for each lithology to determine the proportions of magnesium and iron cation quantity that should be estimated into olivine during the mineral estimation process of the MCP calculator. The magnesium number is calculated using the following formula:
Magnesium   number = Mg ( Fe 2 + + Mg 2 + ) × 100
The assigned rock codes of each lithology studied and their average magnesium number can be found in Table 1. Rocks identified as serpentinite were also analysed to test the effectiveness of the MCP calculator in estimating olivine and serpentine abundances.

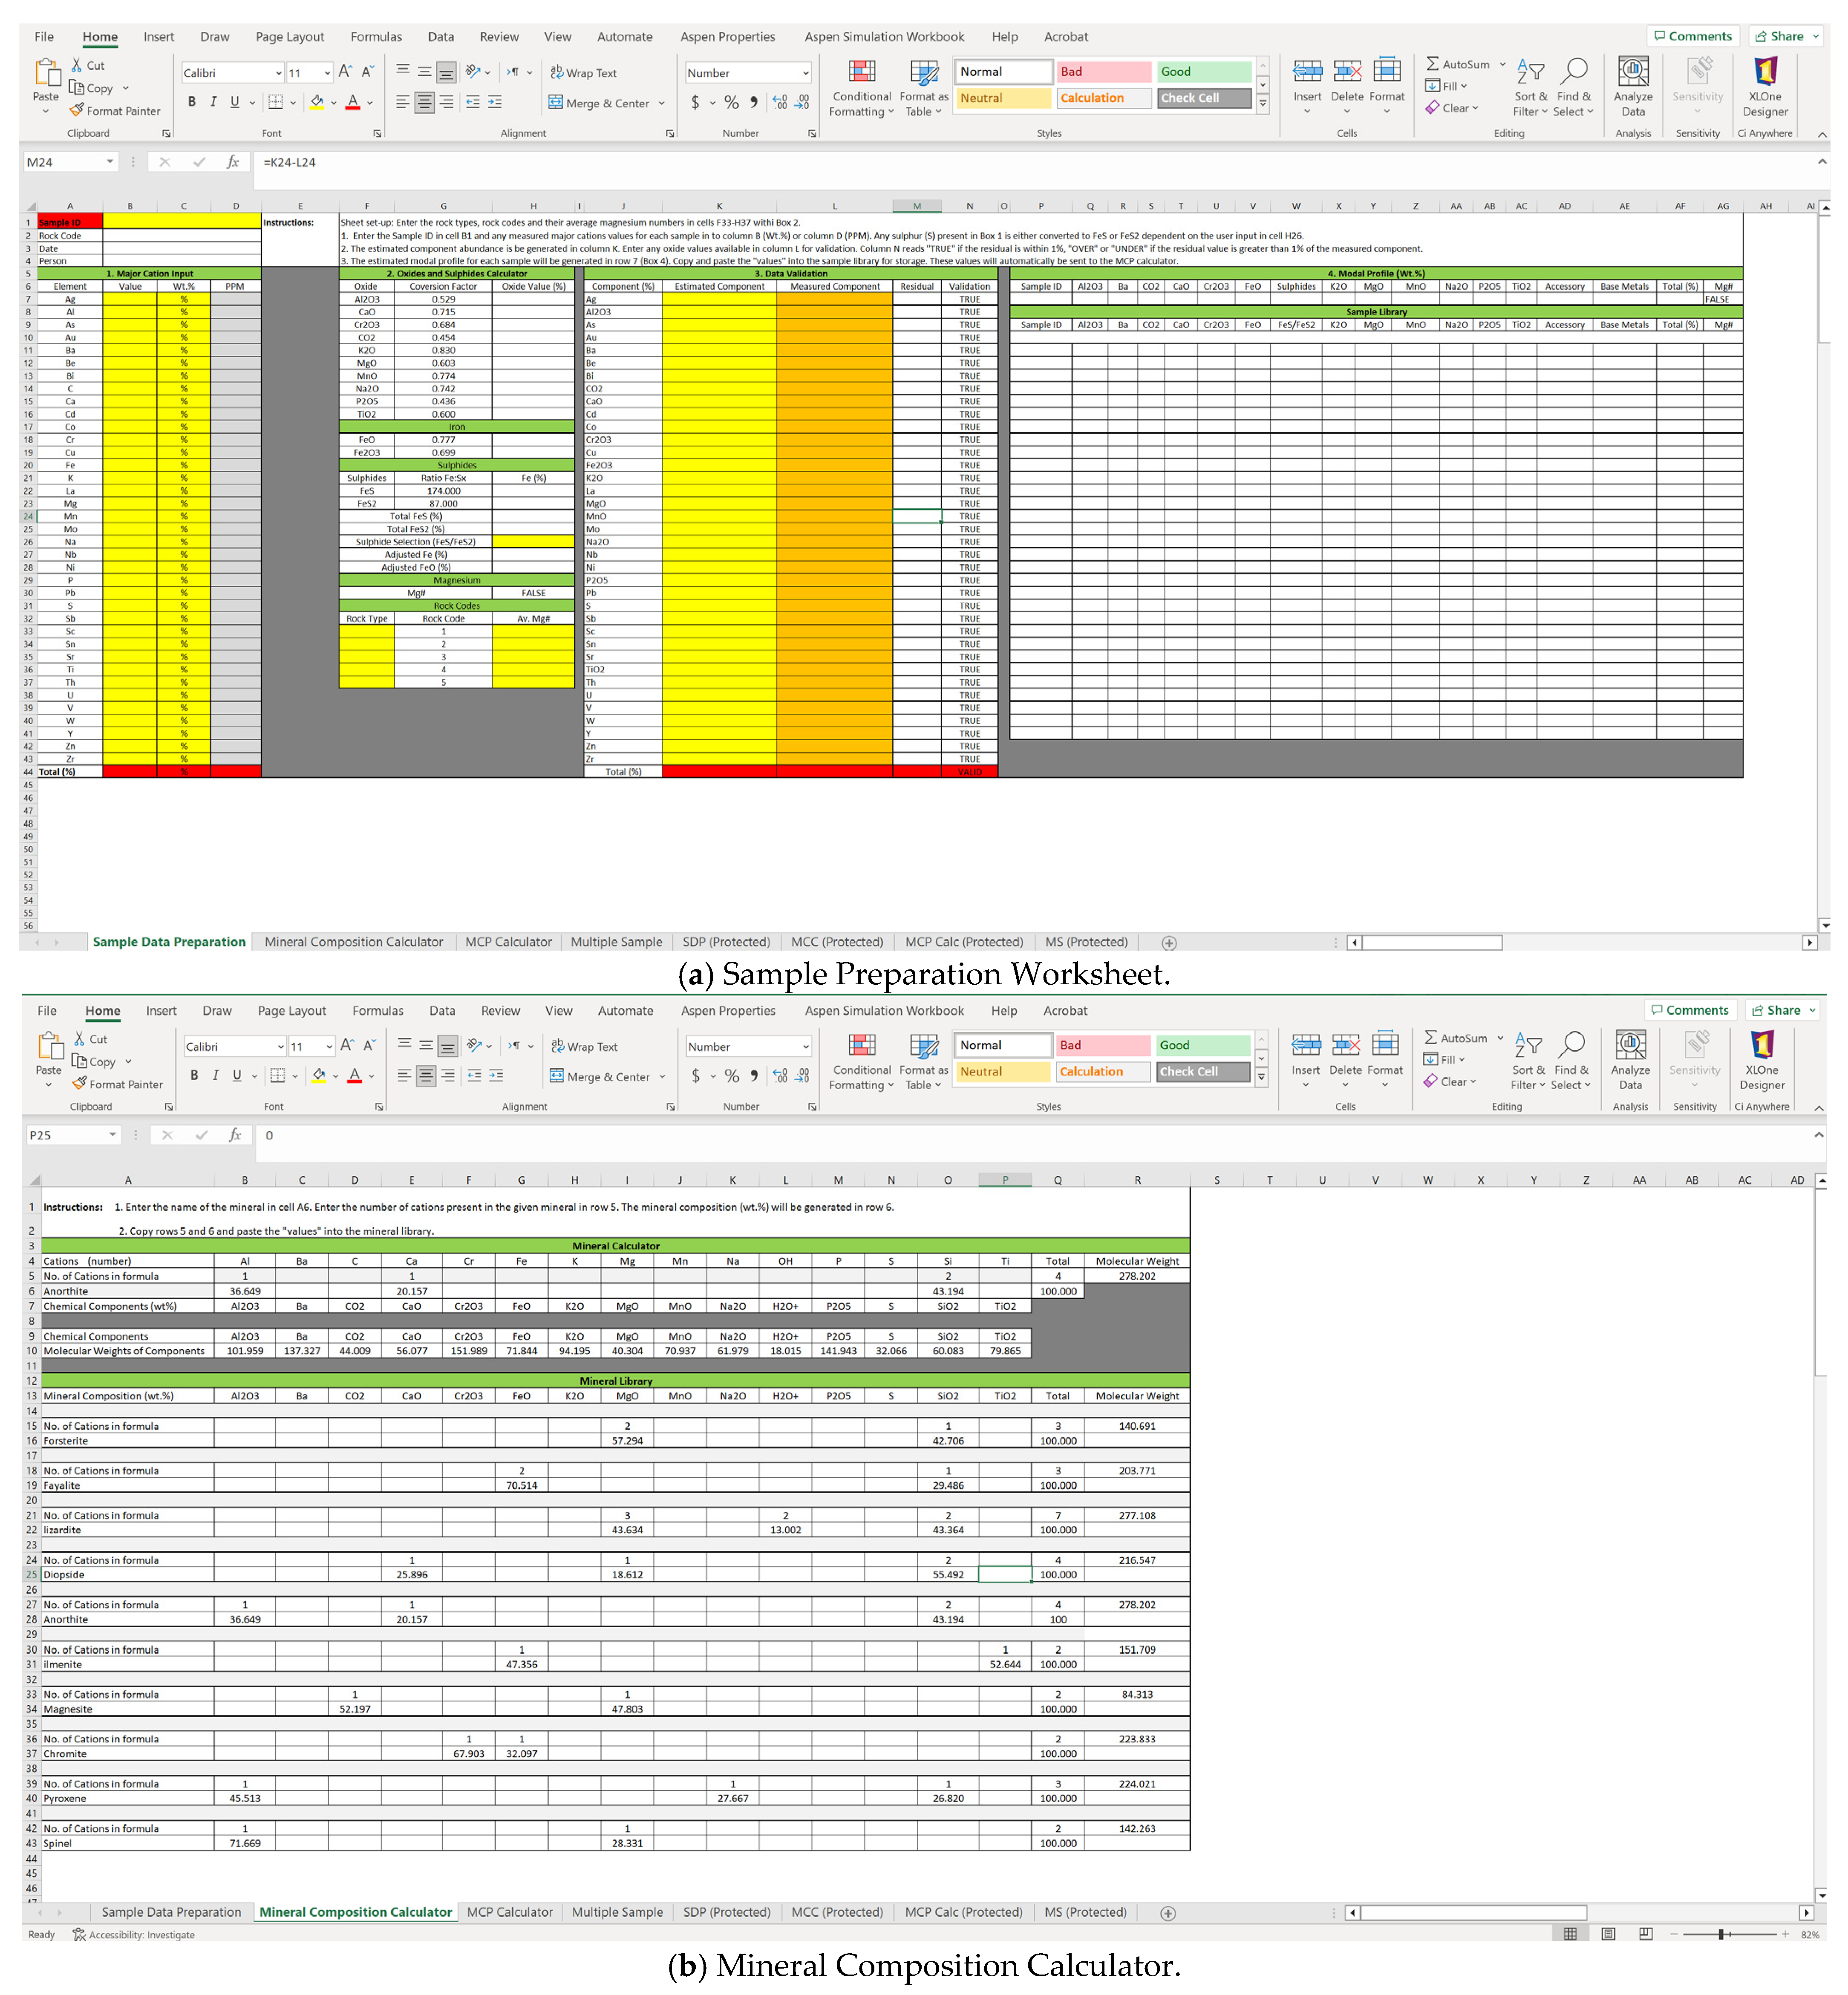
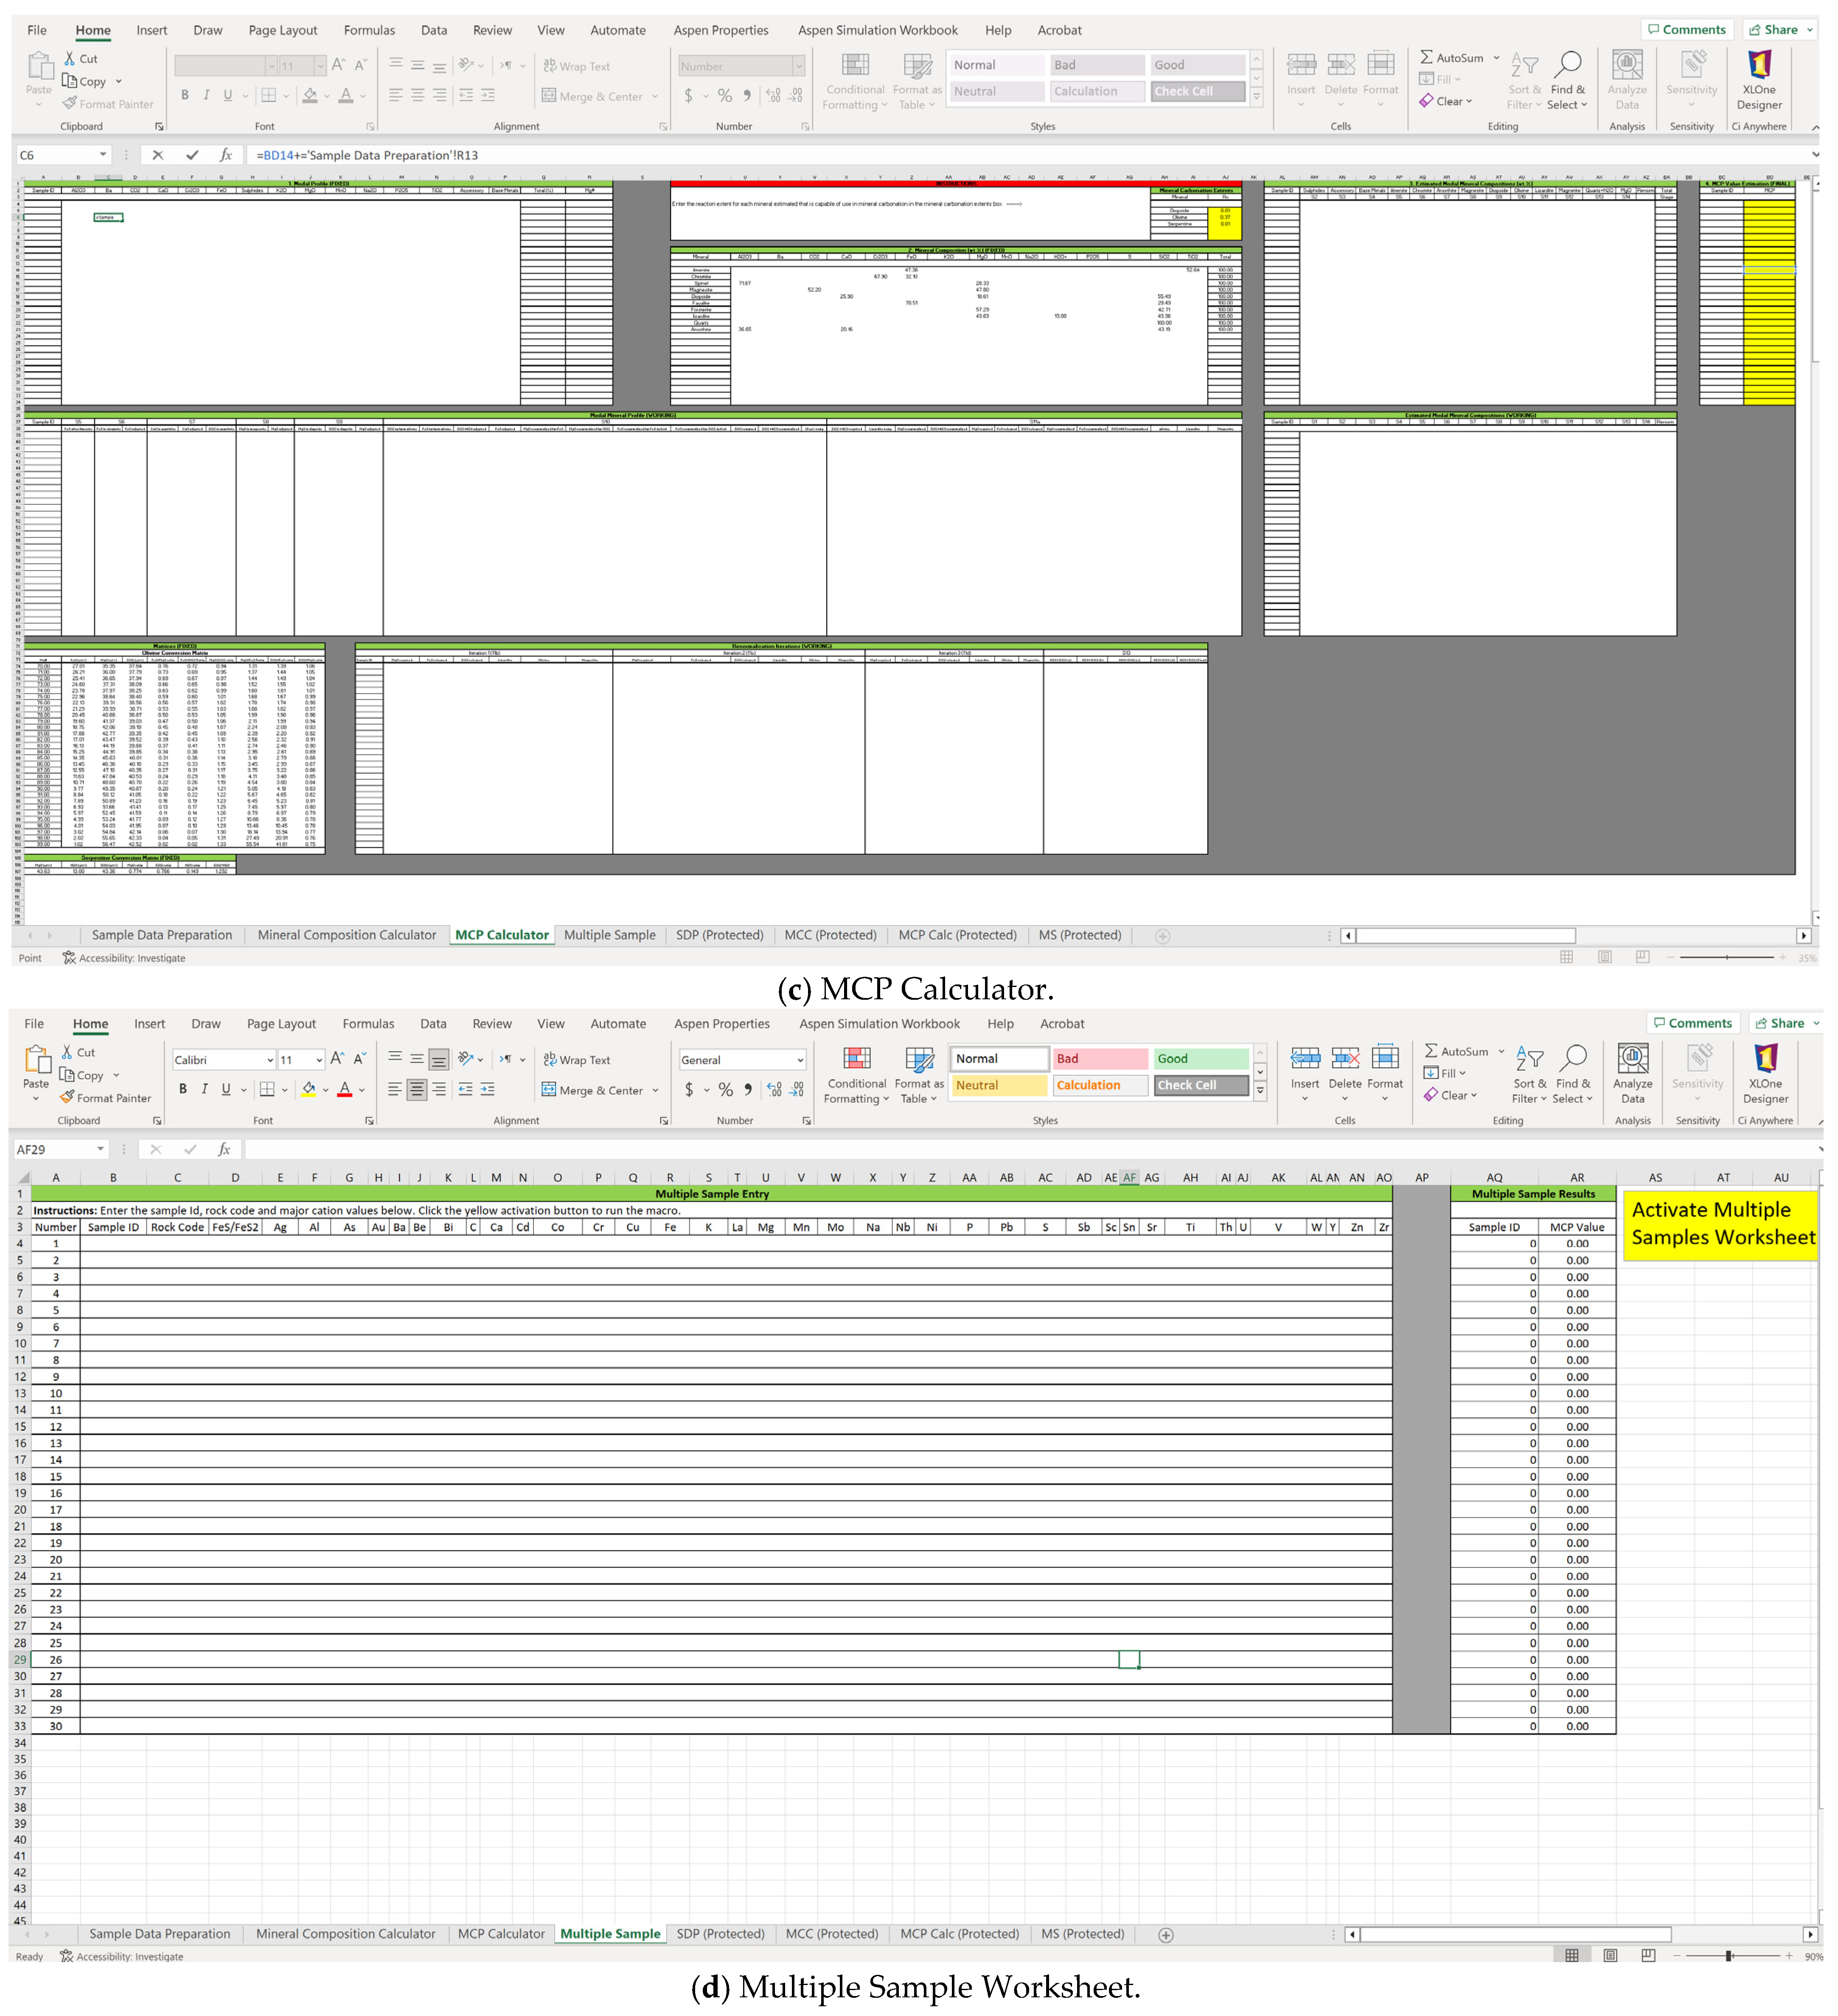
3.2. The MCP Calculator

The MCP calculator was developed to provide a more accurate estimate of the mineral carbonation potential of a rock mass by considering the variability in silicate mineralogy throughout a rock mass, as different silicates have variable mineral carbonation capabilities. The calculator provides the volume of potential carbonate minerals that can be formed for a discrete volume of substrate rock by converting the major cation weight percentage composition into major oxides, estimating their abundance based on a linear best fit stoichiometric conversion into a mineral assemblage suite defined by the user, and estimating the potential stoichiometric magnesium silicate-to-magnesium carbonate conversion achievable by that discrete volume of rock based on the conversion extent for a given mineral through experimental mineral carbonation.
The MCP calculator requires adaptation on a deposit-by-deposit basis to account for the specific mineral assemblage local to the deposit. The instructions for data input into each worksheet and potential modifications that can be made to customise the program to a specific ultramafic deposit are provided in the Ph.D. thesis by Jacobs [33]. The program consists of four worksheets: the Sample Preparation Worksheet, the Mineral Composition Calculator, the MCP Calculator Worksheet, and the Multiple Sample Worksheet. To facilitate a better understanding of the program’s structure, visual representations of these worksheets are displayed in Figure 1. Subsequent sections will provide a more comprehensive explanation of each worksheet. The program is provided as a macro-enabled worksheet allowing the user to process up to 30 samples simultaneously.
The Sample Preparation Worksheet is designed to allow users to enter rock types, rock codes, and their average magnesium numbers. Additionally, it provides an option to enter the measured major cation values for each sample in either weight percent (wt.%) or parts per million (PPM). The sulphur (S) content can be converted to FeS or FeS2. The estimated component abundance will be automatically generated and can be used in the MCP Calculator Worksheet.
Based on the field Herrmann and Berry [40] method, the Mineral Composition Calculator Worksheet is a tool designed to determine the chemical composition of individual minerals to estimate their assemblage. The worksheet is divided into two main sections: (1) the mineral calculator and (2) the mineral library. The mineral calculator allows users to calculate the major oxide values of each mineral. The mineral calculator for oxide conversion includes the major cations commonly found within minerals from ultramafic rocks. The user must enter the name of the mineral being assessed and input the number of each respective cations for the mineral formula. The molecular weight of the mineral is automatically updated by summing the totals of the number of each cation multiplied by the molecular weight of each cation converted into their respective oxides. The weight percentage of each chemical component making up the mineral is generated and sums up to 100%. The general formula used to calculate the weight percentage of each chemical component is as follows:
w t . % = N o .   o f   c a t i o n s   i n   f o r m u l a × M o l e c u l a r   w e i g h t   o f   c o m p o n e n t M o l e c u l a r   w e i g h t   o f   t h e   m i n e r a l × 100
The mineral library in this worksheet provides a place where the results for each mineral can be pasted for storage before being inputted into the MCP calculator.
The MCP Calculator Worksheet consists of four sections, which provide data sources for the calculator and display its results. The working part of the worksheet contains a series of data grids that require no input from the user unless the estimated mineral assemblage differs from the test data. These grids comprise a series of equations for modal mineral estimation following a general linear stoichiometric estimation procedure through numbered stages. The first section contains the imported modal profile of the entire sample data analysed, providing the data source for the iterative working data grids in the same worksheet. The second section is designed to store any ideal modal mineral stoichiometric compositions to be estimated. Although these cells are inactive, they can be incorporated within the working data grids for mineral estimation. Section 3 of the worksheet displays the estimated mineral compositions in weight percentage, which can be customised to match the mineral assemblage identified at the studied deposit. This section is populated from the working data grid labelled by a series of stages. Each stage represents a calculated section of the linear stoichiometric estimation process. The MCP calculator can be customised for different deposits by altering the calculation formulas within the worksheet.
The stoichiometric linear mineral estimation stages created by the author for use at Turnagain are summarised in Figure 2. Stage one within the calculator is the normalisation of the modal profile to 100%, which assumes that the remaining weight percent of each sample tested comprises SiO2 and H2O. Stages two, three, and four assign the modal weight percentages from the sample data preparation worksheet for the sulphides (FeS or FeS2), base metal quantity, and all other accessory components not identified as a component of the major mineral assemblage. The TiO2 and Cr2O3 component of the major oxide profile is identified from quantitative XRD based on the Turnagain samples as ilmenite (FeTiO3) and chromite (FeCr2O4), respectively. These mineral abundances are estimated using all the respective oxides available in each sample, and the iron content is renormalised as FeO for further estimation. Suppose minerals other than ilmenite and chromite are the major mineral phase of their respective oxides. In that case, the associated formulas within the data grid cells can be adjusted as needed. The analysis of major cations in multiple samples from Turnagain revealed high levels of aluminium (up to 20 wt.%), concerning the generally low mean aluminium contents of ultramafic rocks. To consider this elevated aluminium content, the weight percent anorthite (CaAl2Si2O8) content is estimated in stage seven. Plagioclase is present in a significant proportion of the samples, and anorthite can be substituted for a generic plagioclase mineral formula for estimation or other plagioclase end-member mineral formulas. Enstatite was identified as another plagioclase mineral at Turnagain, but estimating both enstatite (MgSiO3) and forsterite (Mg2SiO4) needed to be more practical. Hence, forsterite being the dominant mineral, it was selected over enstatite for the estimation.
The low concentrations of K2O, MnO, Na2O, and P2O5 measured in the samples analysed indicate that these major oxides are incorporated into the accessory minerals in stage three. They mainly form minor components of the silica minerals already estimated. The presence of the minerals from XRD or similar analytical techniques should define the choice of plagioclase mineral estimation. This is a deposit-specific variable.
The magnesium-bearing minerals are the principal controlling factor based on estimated MCP values. In stage eight, the magnesite (MgCO3) content is estimated if the CO2 content is accurately determined. If no accurate CO2 content is available, the estimated rock sample is considered to have no carbonates. The working data grid can be adapted to include calcite (CaCO3) if required. The principal mineral source of calcium at Turnagain was identified in XRD analysis as diopside (CaMgSi2O6) and estimated in stage nine. Diopside is particularly abundant in wehrlite and olivine clinopyroxenite. Other pyroxene minerals could be substituted in the calculator at this stage. The diopside estimate uses all the CaO content of each sample. The mineral estimate is extracted from the associated stoichiometric MgO and SiO2 contents. The stage one value and the MgO weight abundances are renormalised for use in later stages of the estimation.
Olivine, serpentine, magnetite/hematite, quartz, and periclase are estimated in stages ten to fourteen. These are estimated through a series of iterations that stoichiometrically best estimate the modal weight percentages based on user-defined factors. The estimation process for Turnagain ultramafic rocks starts with olivine since it is the most abundant mineral in this deposit. The calculator then assumes that any remaining unaccounted magnesium oxide (MgO) from the earlier estimation stages is present in this mineral, resulting in a complete estimation procedure. The magnesium number assigned to each sample within the modal profile determines the proportions of MgO, FeO, and SiO2 for the olivine estimation. The olivine conversion matrix in the worksheet controls the active cells for use in the olivine estimation. This is referred to within the series of iterations and can estimate olivine with any assigned magnesium number between 70 and 99.
The Initial olivine quantity is estimated by first calculating the SiO2 and FeO content required to form olivine with the assigned magnesium number to fix all the MgO into olivine. The SiO2 + H2O content from stage one and the FeO content is subsequently recalculated. If the SiO2 + H2O or FeO content is in a deficit, the MgO concentration is renormalised to account for this deficit, as such, to return zero values for SiO2 + H2O and/or FeO. If the MgO content is renormalised for a SiO2 deficit, the olivine content is determined. If no serpentine is estimated, the remaining FeO is assigned to magnetite/hematite. The MgO content is assigned as periclase in stage 14. In the final stage, the sample is renormalised to balance the modal mineral composition to 100% stoichiometrically, completing the modal mineral profile for the sample.
The serpentine content is estimated through a series of iterations in stage 11. Where necessary, the olivine abundance is adjusted in stage ten to appropriately balance the FeO, MgO, SiO2 + H2O contents within the estimated mineral assemblage. The general serpentine formula used for estimation was Mg3Si2O5(OH)4. The active cells for internal calculations are determined from the serpentine conversion matrix to proportion the mineral’s MgO and SiO2 + H2O components. When estimating olivine, serpentine abundance is first estimated to mineralogically fix any MgO released from an FeO deficit. Enough SiO2 + H2O must be available to fix the surplus MgO.
Suppose there is a surplus SiO2 + H2O content above a user-defined quantity (a 1 wt.% tolerance is defined at Turnagain based on XRD analyses), the required MgO to estimate the amount of serpentine is taken from the provisional olivine weight percent. This releases FeO from the estimated olivine quantity and assigns it to stage 12. The olivine weight percent is renormalised to account for the removed MgO, FeO, and SiO2 content. This process is repeated through three further sequences to balance the MgO, FeO, and SiO2 iteratively. This normalises the olivine, serpentine, magnetite/hematite, and quartz ± water weight abundance following the iteration. The minimum olivine content is set to 10% within the equation formulas at Turnagain, if each sample contains at least 10 wt.% olivine. This is to avoid generating negative olivine weight percentages. Further iterations could be added if samples have an extremely high serpentine content resulting in a large residual SiO2 + H2O estimated content remaining after three iterations.
In stage 12, all the FeO content is assigned to magnetite/hematite. The MCP calculator has no method of determining the ratio of magnetite versus hematite in the samples being examined, and as such, the FeO content is grouped as both. The mineral profile is normalised to 100% by assigning the remaining weight percent to silica ± water. The final estimated modal mineral composition profile is added to Section 3 of the worksheet. If the reaction extents are not known for each mineral, the values produced in this section could be used to model the mineral distribution within the deposit.
The final MCP values for each sample estimated are determined in the fourth section. This is automatically completed, dependent on the values reported in the previous section and those defined by the user in the mineral carbonation extents table. The mineral carbonation extents table defines either the maximum or average mineral carbonation reaction extent of the selected mineral carbonation process. The table can contain up to five minerals capable of supplying cations that can be bound to carbon to form carbonates. In the example provided by the Turnagain ultramafic deposit, olivine, serpentine, and diopside are potential silicate minerals that can provide magnesium and/or calcium to be bound with carbon dioxide. At Turnagain, olivine is targeted as the principal contributor to the MCP value; however, this could easily be adapted to focus on serpentine.
The MCP values are determined using Equation (4):
MCP = S min a   × R x + S min b   × R x + + S min n   × R x × CO 2 wt . % 100
where MCP is the volume weight percentage of magnesite that can be formed from a given volume of rock. Smin is the weight percentage of substrate mineral available for carbonation (a, b,…, n), calculated using Equation (5), Rx is the average or maximum extent of silicate-to-carbonate conversion achieved through experimental mineral carbonation for the given mineral, as in Jacobs [33]. CO2 wt.% is the volume weight percent carbon dioxide required to sequester the available MgO as magnesite.
S min = wt . %   Mineral × wt . %   MgO   in   mineral 100
The mass of CO2 that a given rock mass can sequester is calculated as
Mass   CO 2   seq = Mass   of   rock × MCP 100 × wt . %   CO 2   in   magnesite 100
where wt . %   CO 2   in   magnesite 100 = 0.522 .

3.3. Reliability and Limitations of the MCP Calculator

This section discusses the limitations of the MCP calculator, providing insight into the sources of variation in the calculated MCP values when using this method instead of other methods.
An incomplete modal profile without information on SiO2 and H2O contents only partially estimates mineral proportions and CO2 sequestration capacity in the MCP calculator. Major cation data input creates an internally consistent profile through conversion to major oxides using fixed conversion factors.
A high sulphide content in rock samples can result in lower FeO values in the mineral estimation stage when Fe is incorporated as FeS or FeS2. If assigning sulphur content as iron sulphides is problematic, the calculator can estimate this based on the inputted sulphur content and a user-defined sulphur mineral formula within stage two of the MCP calculator.
The MCP calculator’s estimation process is linear, which imposes certain limitations on the number of minerals that can be included in the mineral profile. It is recommended to use generic mineral formulas for accessory minerals other than the principal magnesium and calcium-bearing silicates, which are the primary focus of the calculator. In the example provided in this work, anorthite and diopside are used as principal sources of aluminium and calcium, respectively, due to their familiar presence in rocks and their contribution to the modal profile. Realistically estimating the remaining SiO2 content is essential for estimating the magnesium silicate mineral, as the magnesium-to-silica ratio controls the olivine and serpentine proportioning in the mineral profile.
The iterative estimation of olivine in stage ten of the MCP calculator assumes SiO2 as the remaining weight percentage based on assumptions about the rock type and magnesium number. However, variations in magnesium numbers within a rock type can affect the accuracy of the estimation and may require internal renormalisation of the iteration equations.
After estimating olivine, any unaccounted oxide percentages are assumed to be SiO2 + H2O, with MgO being removed from the estimated olivine weight percentage to satisfy the stoichiometric serpentine formula. The SiO2 content removed from the olivine matrix is assumed as SiO2 and H2O to balance the olivine and serpentine proportioning, resulting in an internally consistent iteration.
Using the data grids presented in the MCP calculator, the mineral estimation consistently provides a modal mineral profile totalling 100%. MCP value calculations utilising the user-defined reaction extents are consistent for all samples. These can be adapted to account for improvements in the mineral carbonation extent for a given mineral. The MCP value calculation relies only on minerals with an assigned reaction extent. It does not consider external factors within the modal profile that may influence mineral carbonation on a sample-by-sample basis.

4. Results and Evaluation of the MCP Calculator

The MCP calculator was evaluated using lithogeochemical data from the Turnagain ultramafic complex. Sixteen samples were chosen for validation due to a full suite of geochemical analyses being undertaken. The mean stoichiometric olivine to magnesite achieved from experimental carbonation based on the samples was used as the average carbonation extent for olivine at the deposit. The effectiveness of the calculator was evaluated using the XRD analysis of mineral carbonation products. For XRD analysis, all samples were reduced into fine powder to the optimum grain-size range (<10 μm). Step-scan X-ray diffraction data were collected over a range 3–80 °2θ with CoKa radiation and a step size of 0.04 °2θ. The X-ray diffractograms were analysed using the International Centre for Diffraction Database (ICDD) PDF-4 and Search-Match software by Siemens (Bruker, Billerica, MA, USA). X-ray diffraction data of the samples were refined with Rietveld program Topas 4.2 (Bruker AXS).

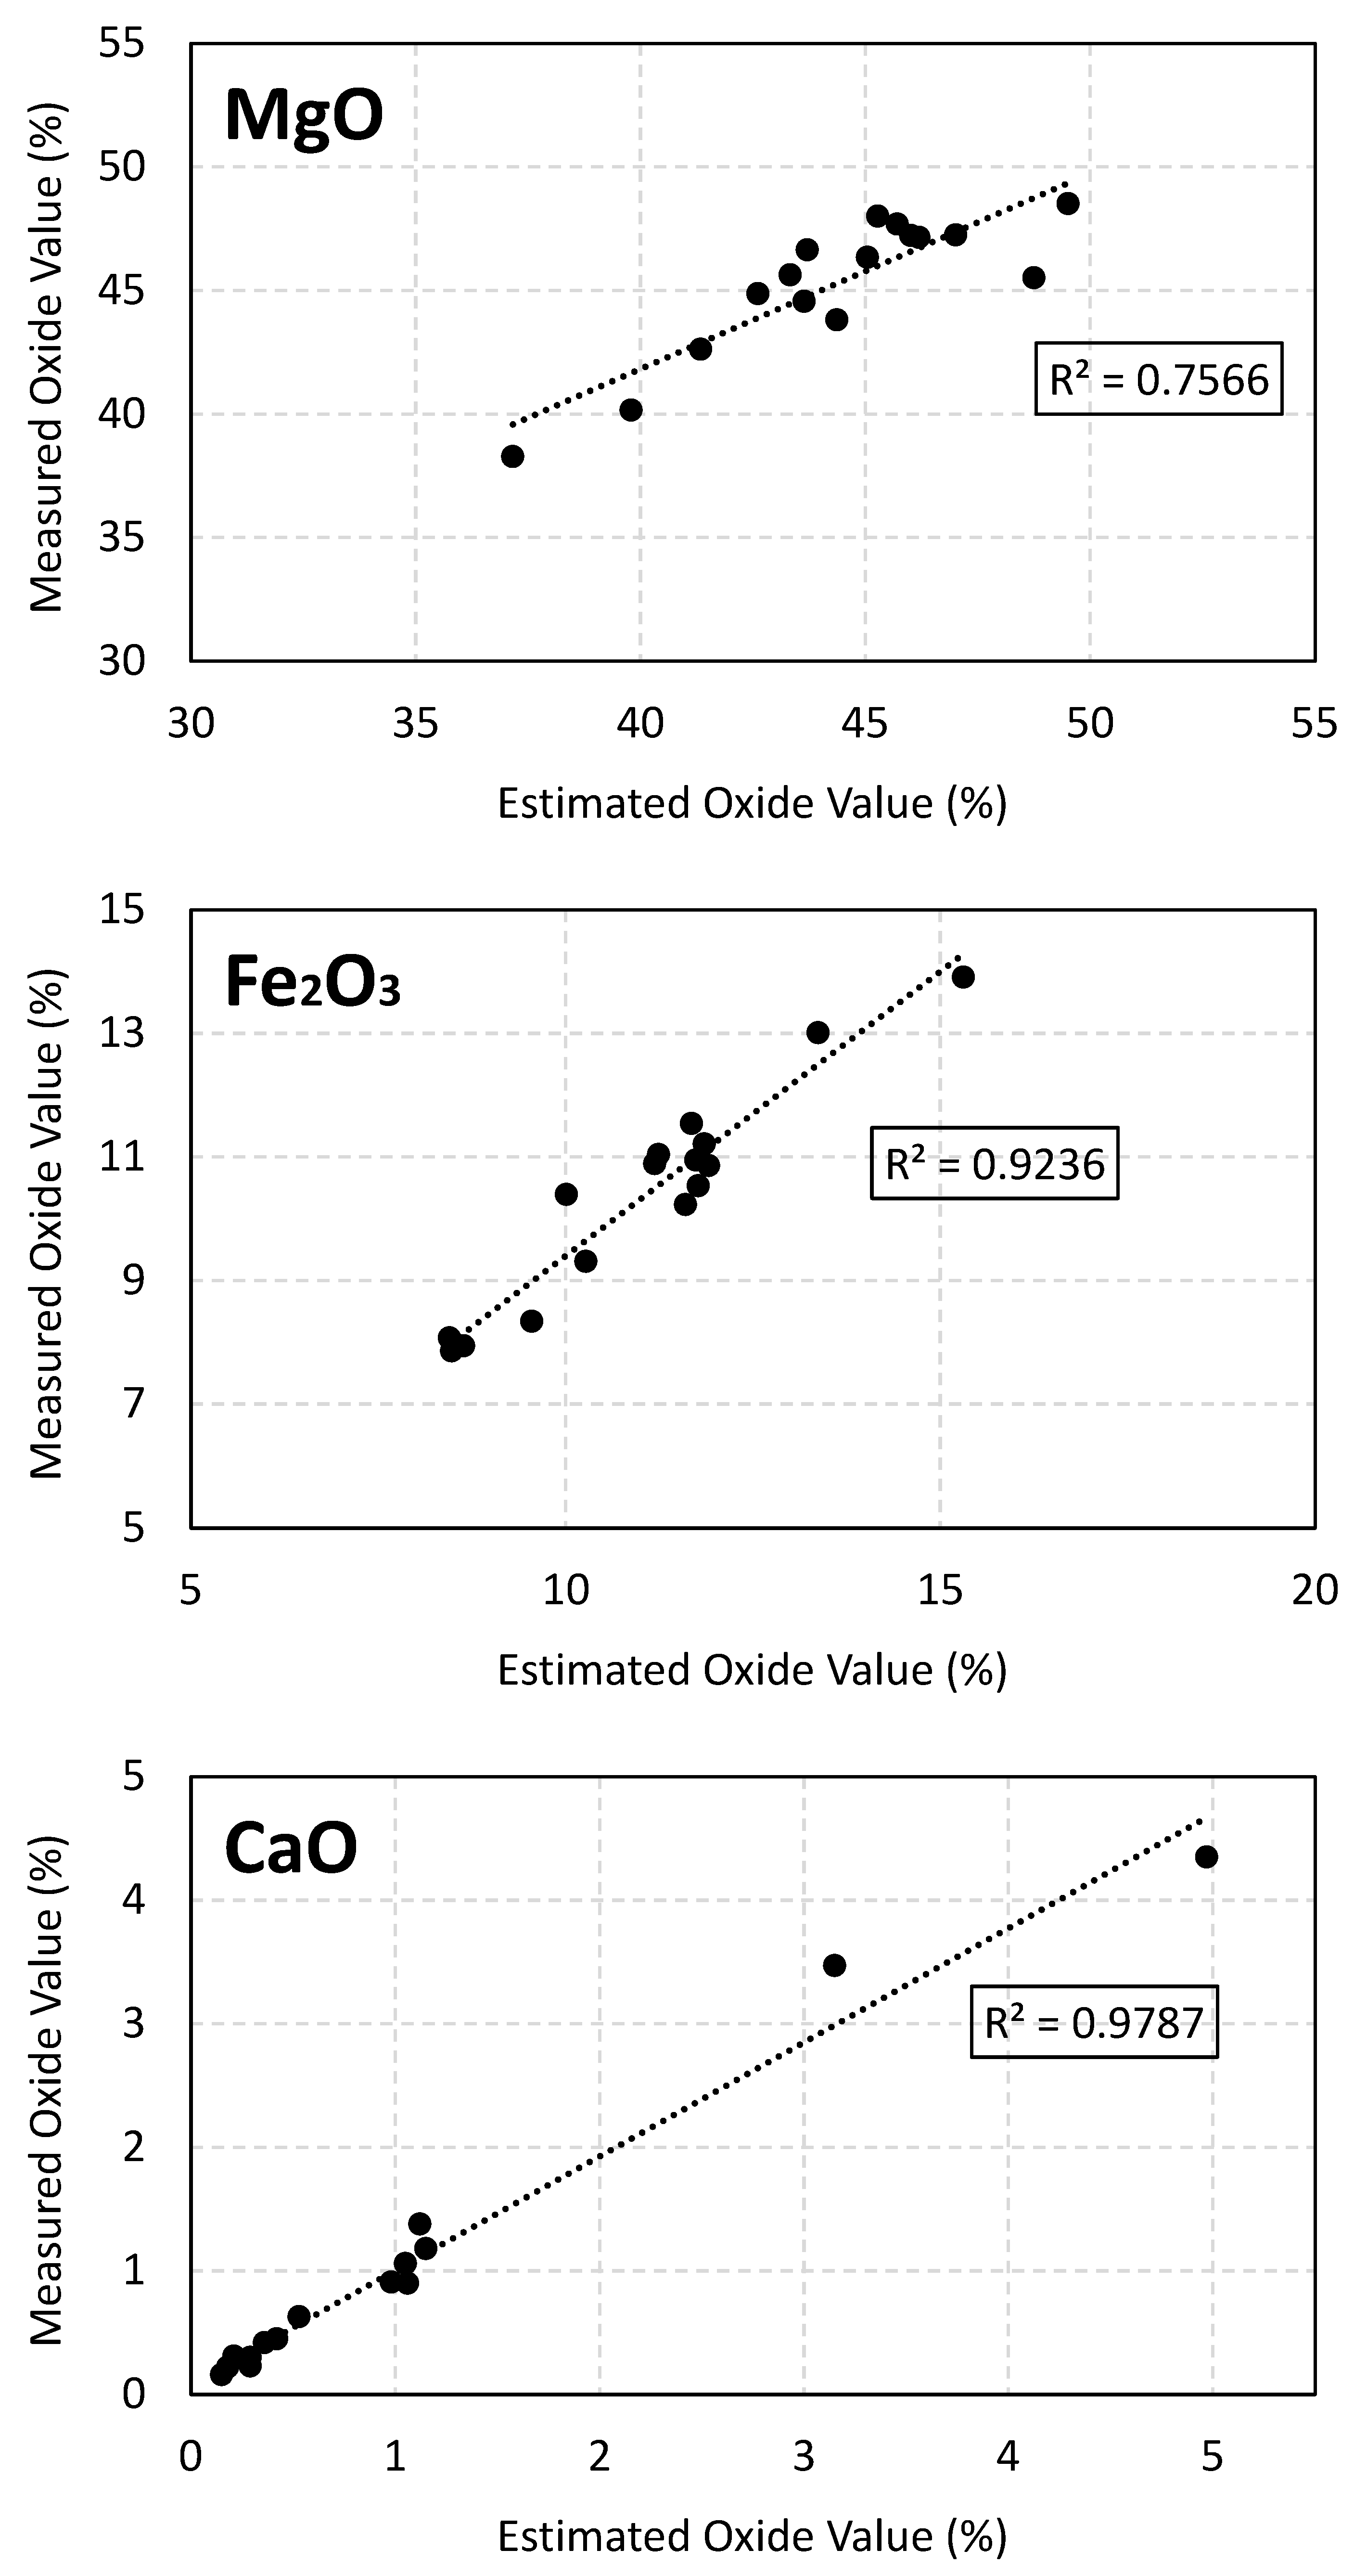
4.1. Major Cation-to-Oxide Conversion

To assess the accuracy of the MCP calculator, all 16 samples from the Turnagain ultramafic deposit were analysed via ICP-ES at Acme Analytical Laboratories in Vancouver, British Columbia. The ICP-ES data were added to the sample data preparation worksheet of the MCP calculator program, and a modal profile of the major oxides for each sample was generated. The resulting major oxide values were compared to those obtained using XRF from the same samples. The results were validated using the sample data preparation worksheet. Table 2 shows that the total absolute residual values for the estimated values were all below 5 wt.%, which is acceptable. The residual values are the calculated difference between estimated and measured values. The total residual values sum the absolute differences observed between the estimated and measured components. The most significant difference between estimated and measured values was for MgO, which is unsurprising given that it makes up almost 50% of each sample. However, the difference between estimated and measured values was still under 3 wt.%. Figure 3 compares measured MgO, Fe2O3, and CaO oxide values from XRF analysis with estimated oxide values from the MCP calculator program for all 16 samples from the Turnagain ultramafic complex.

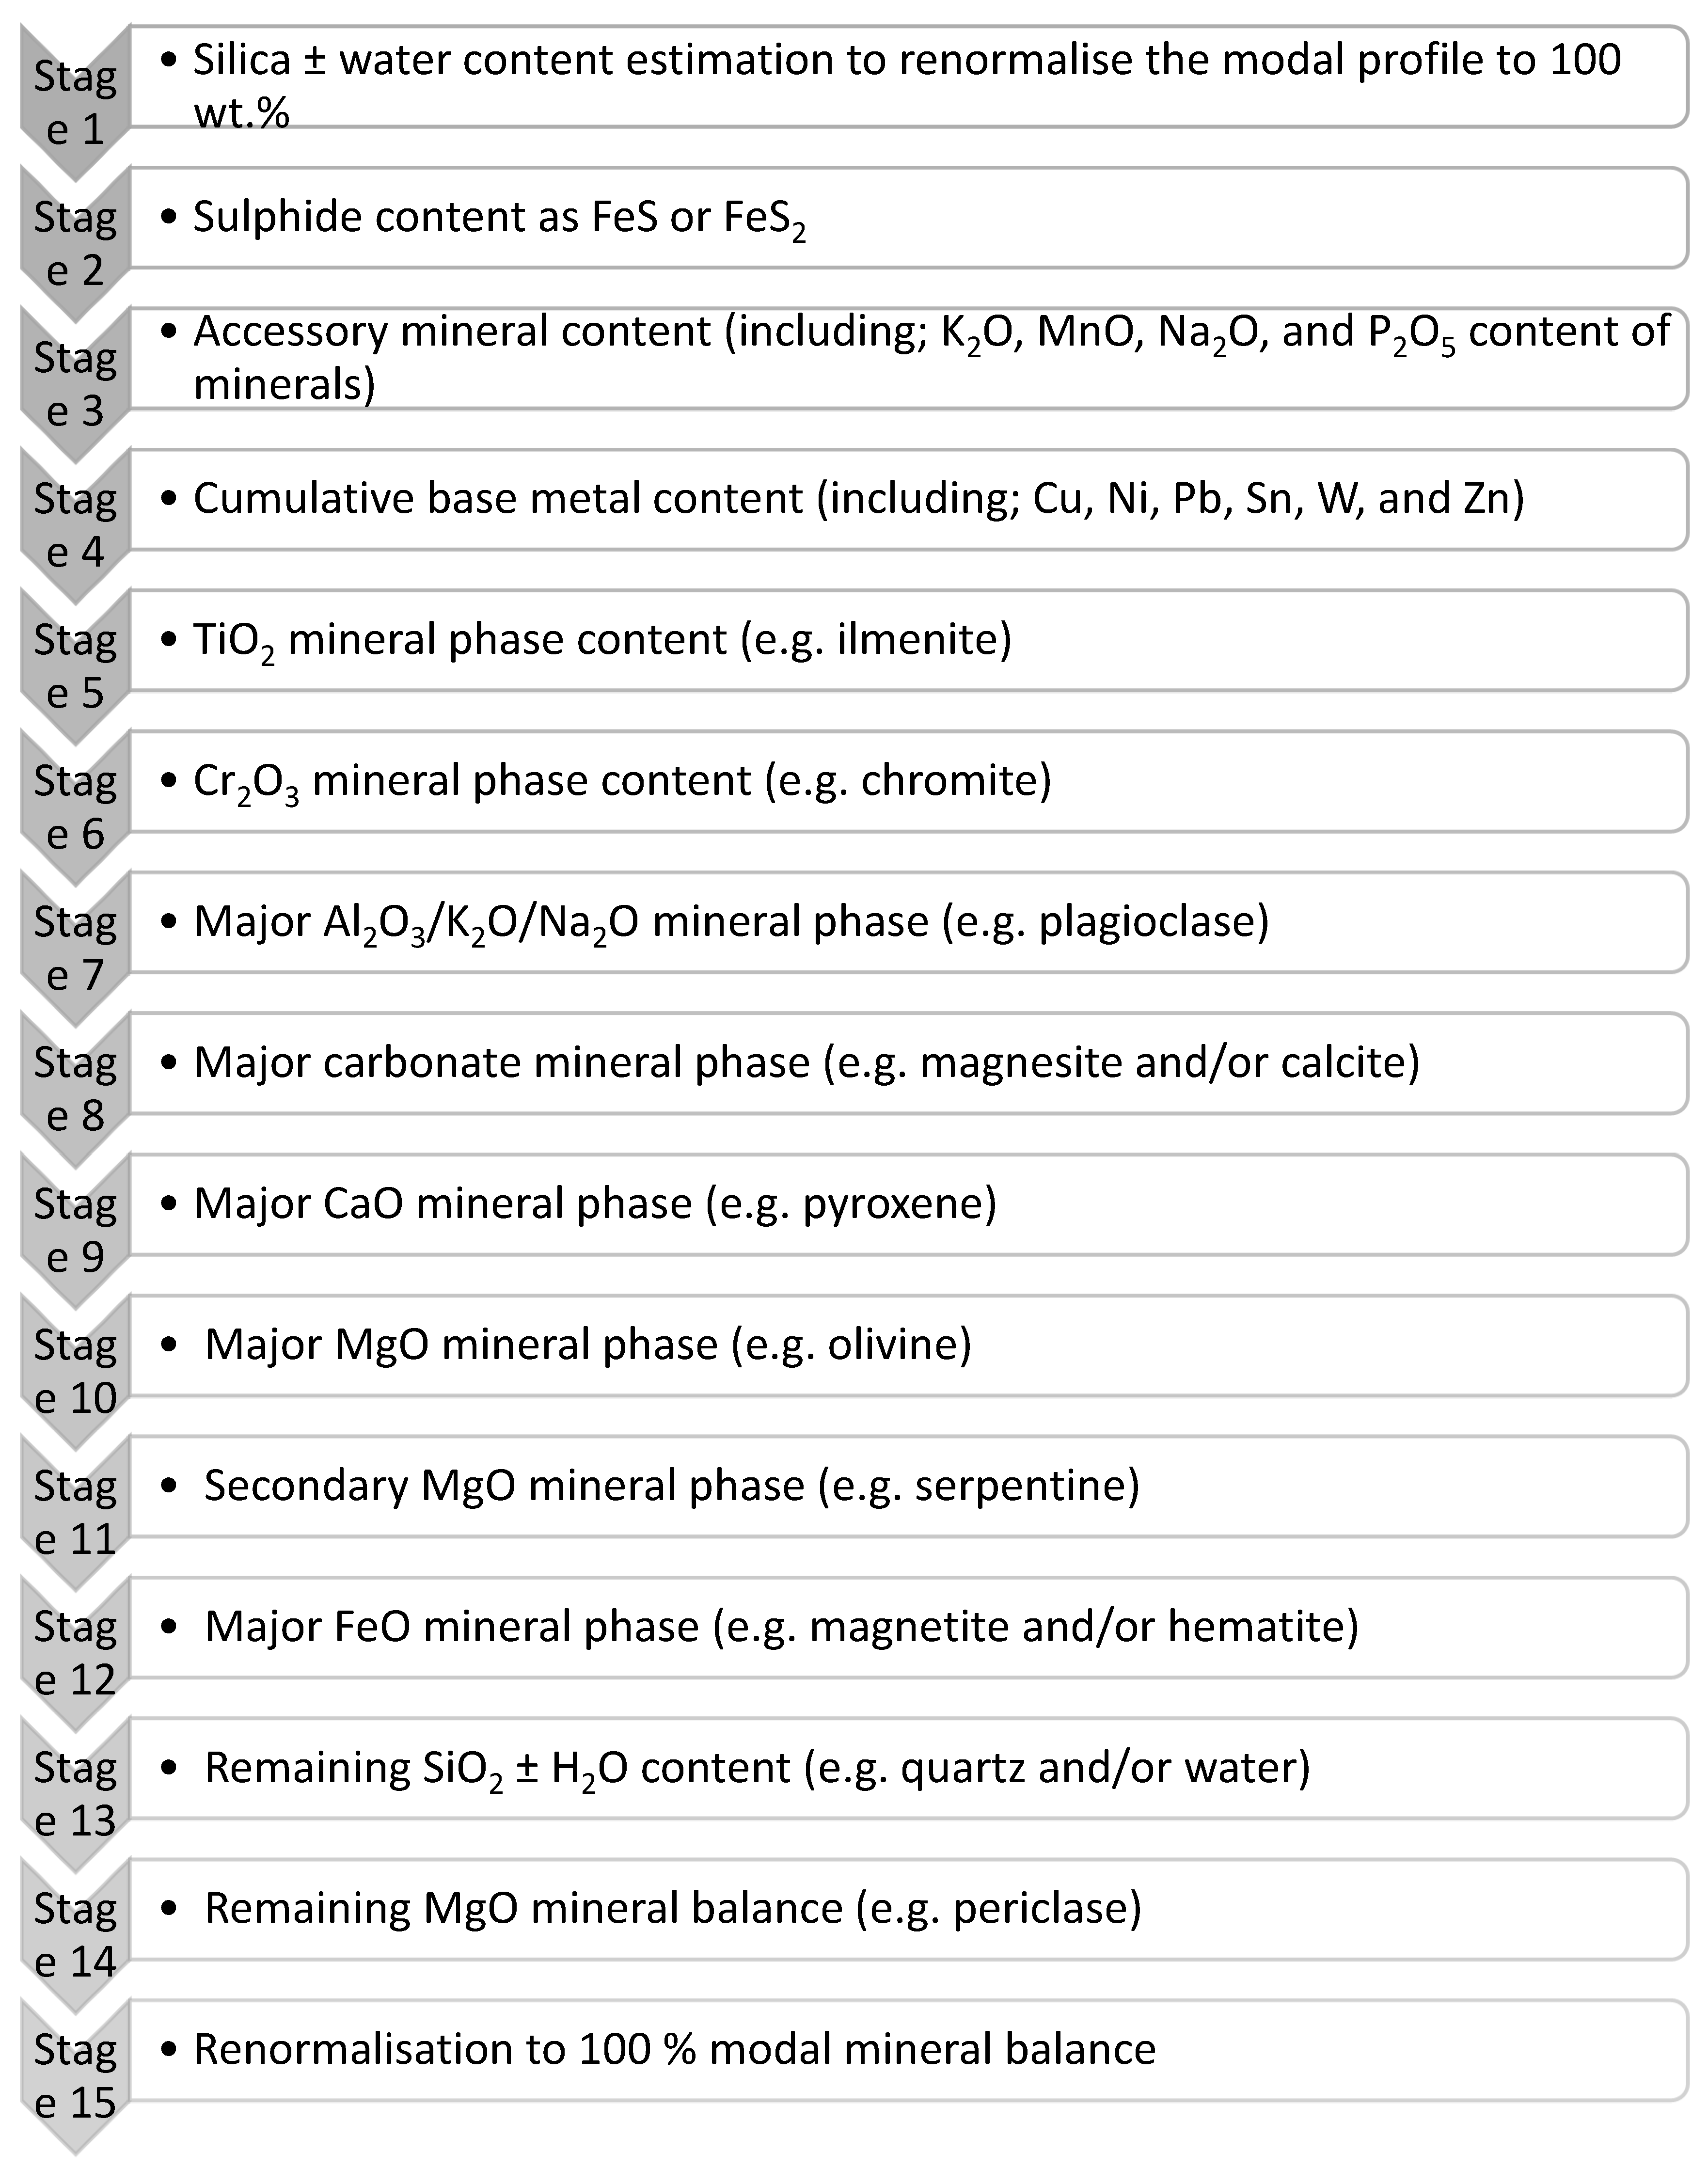
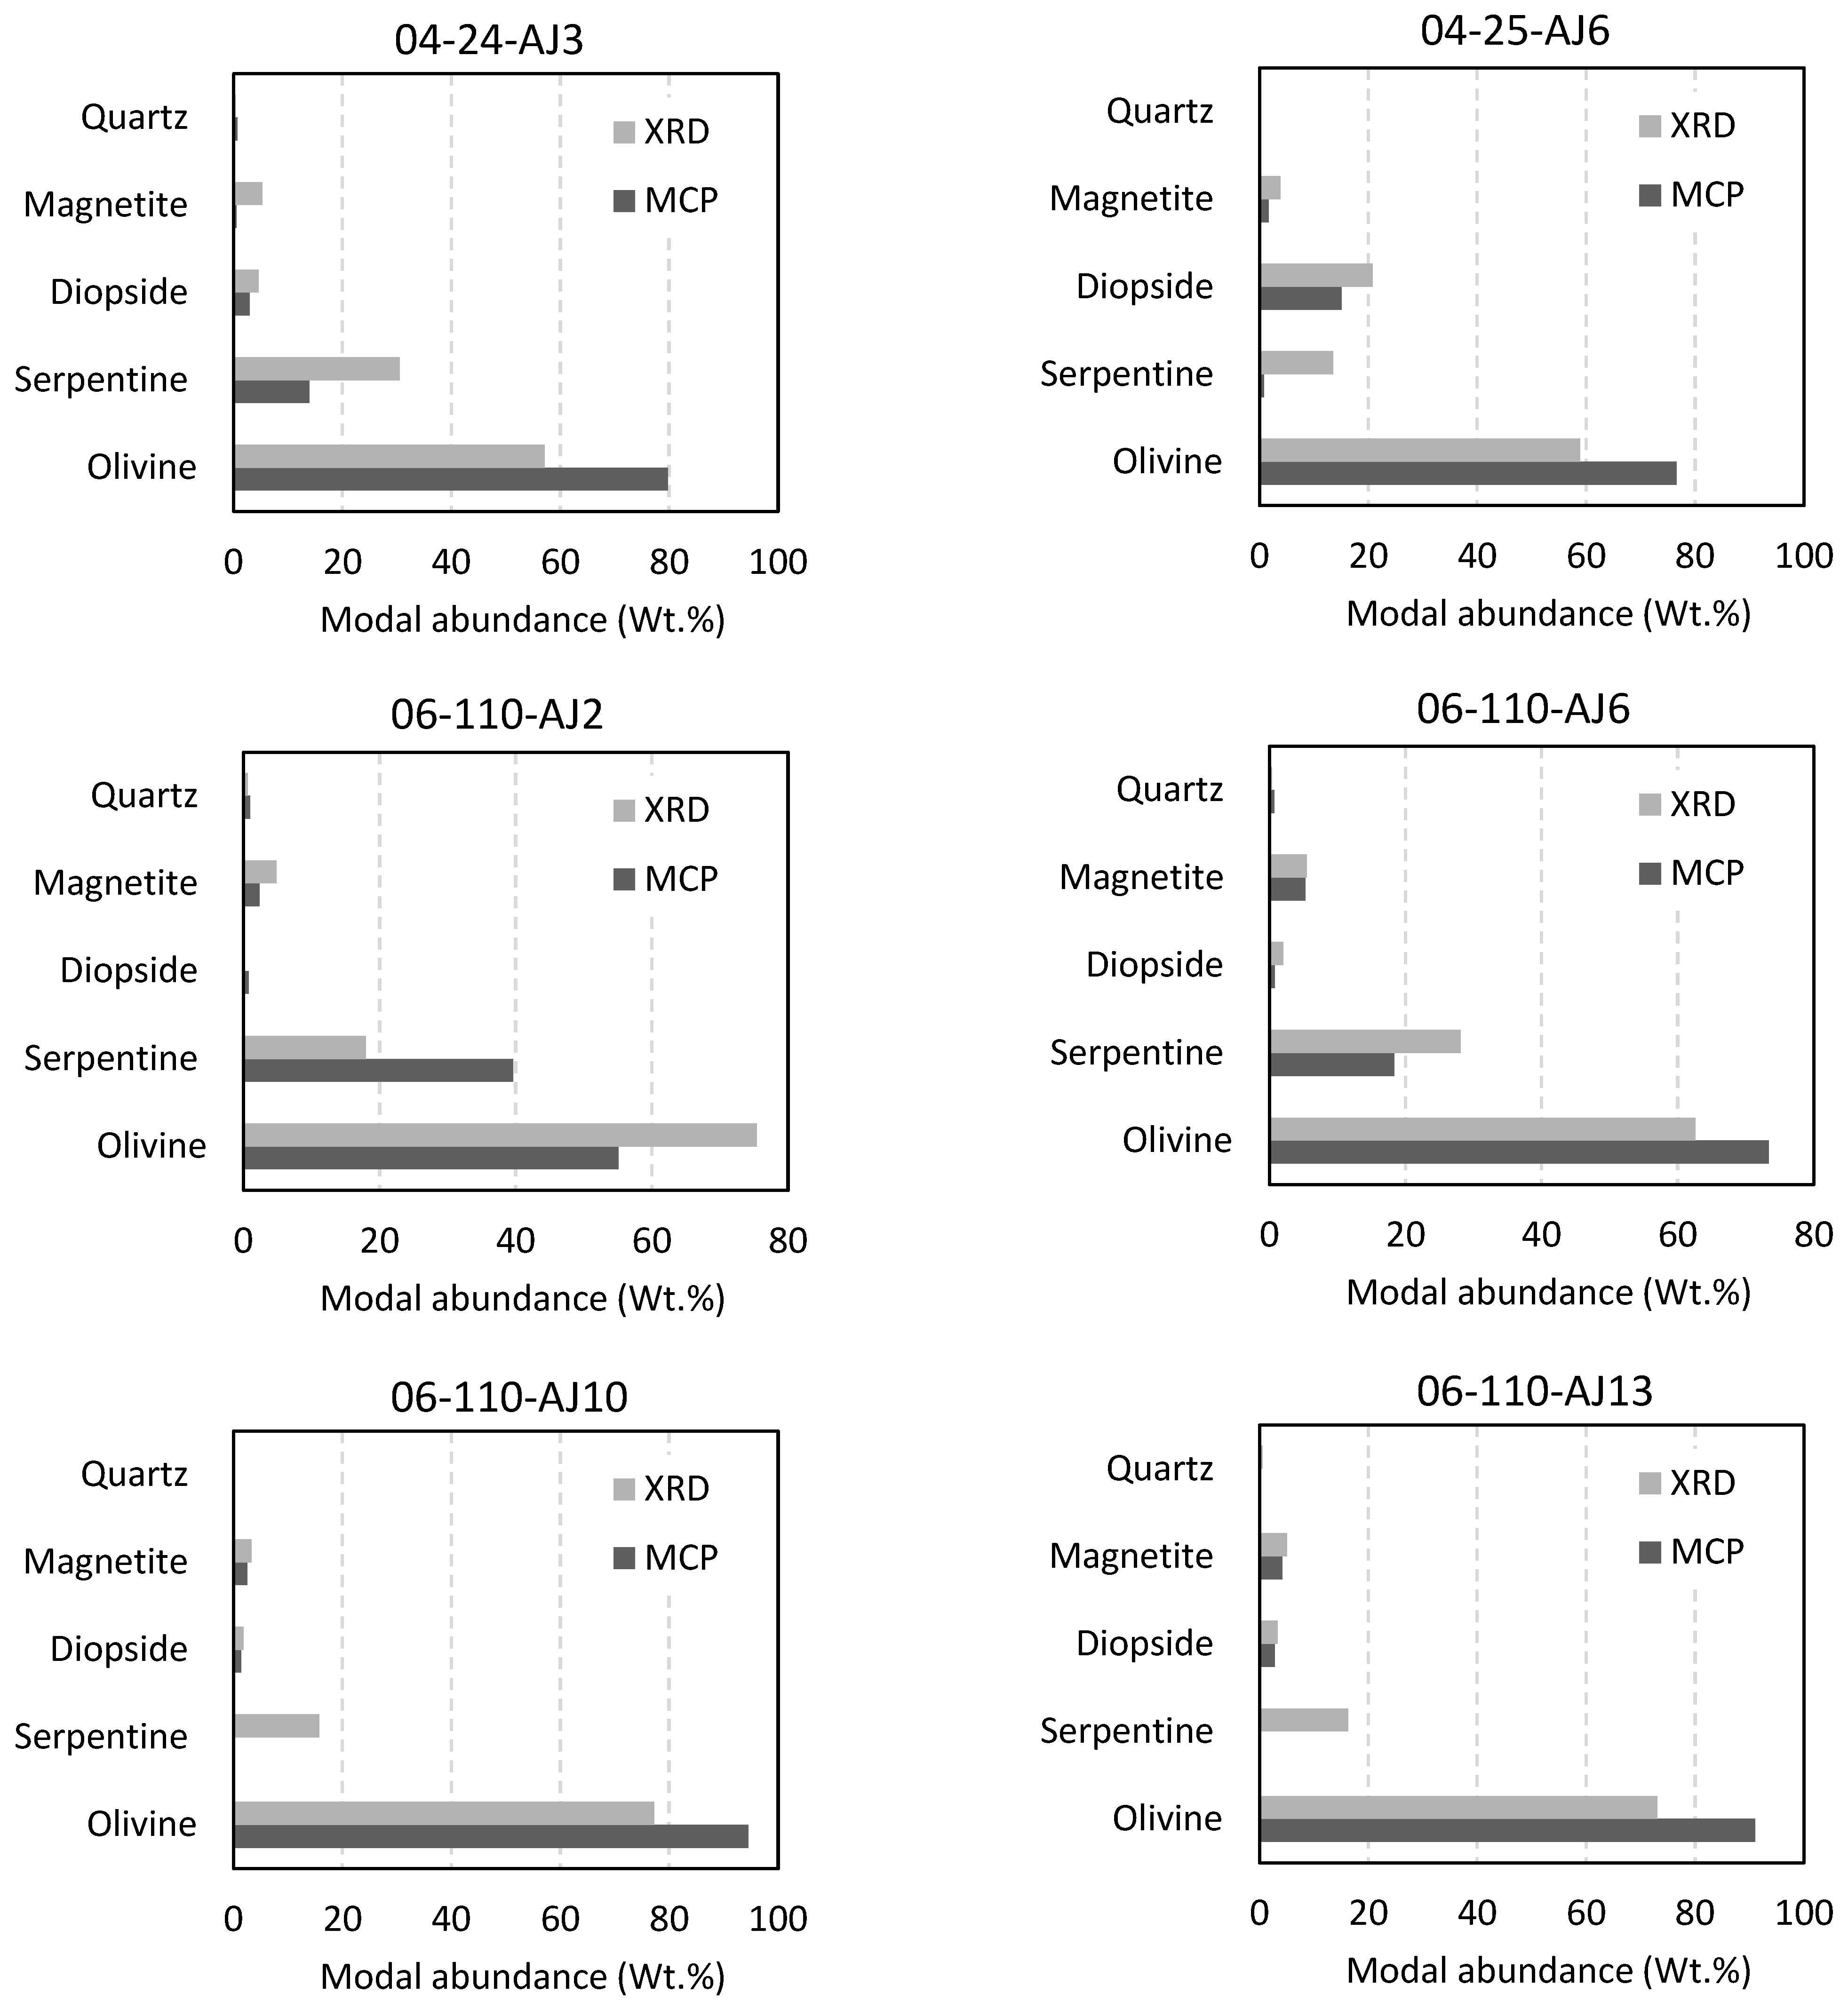
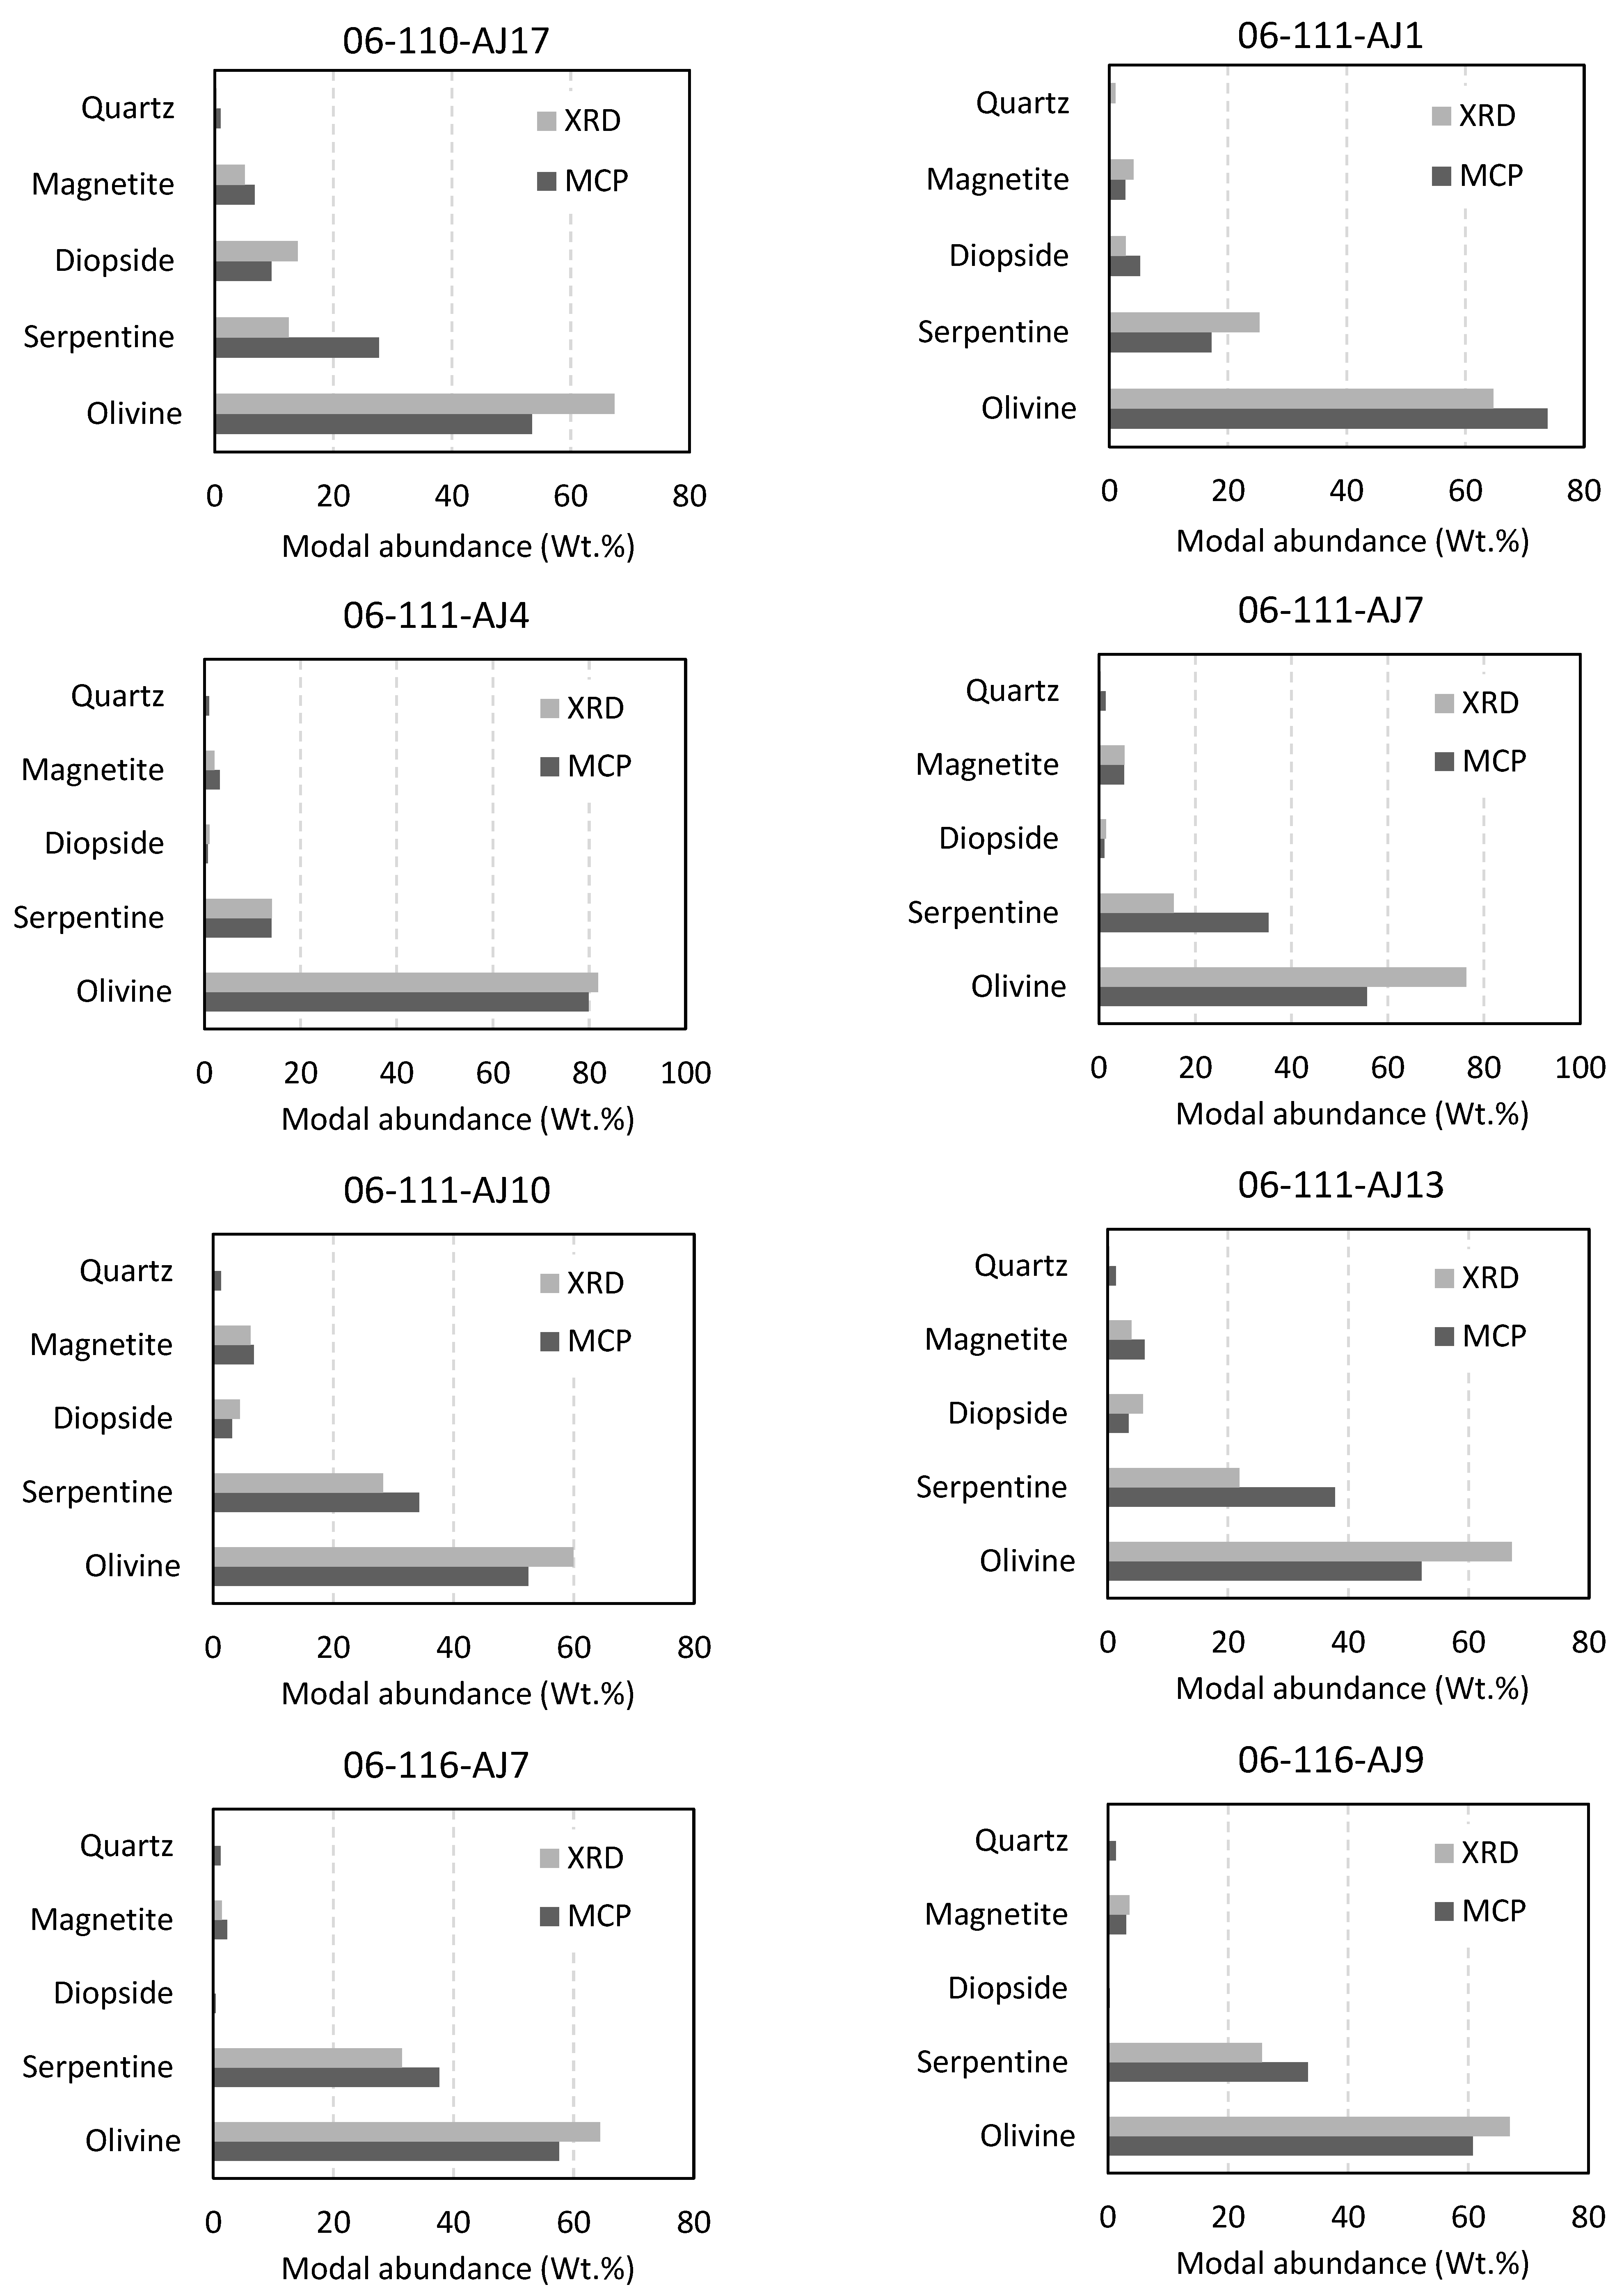
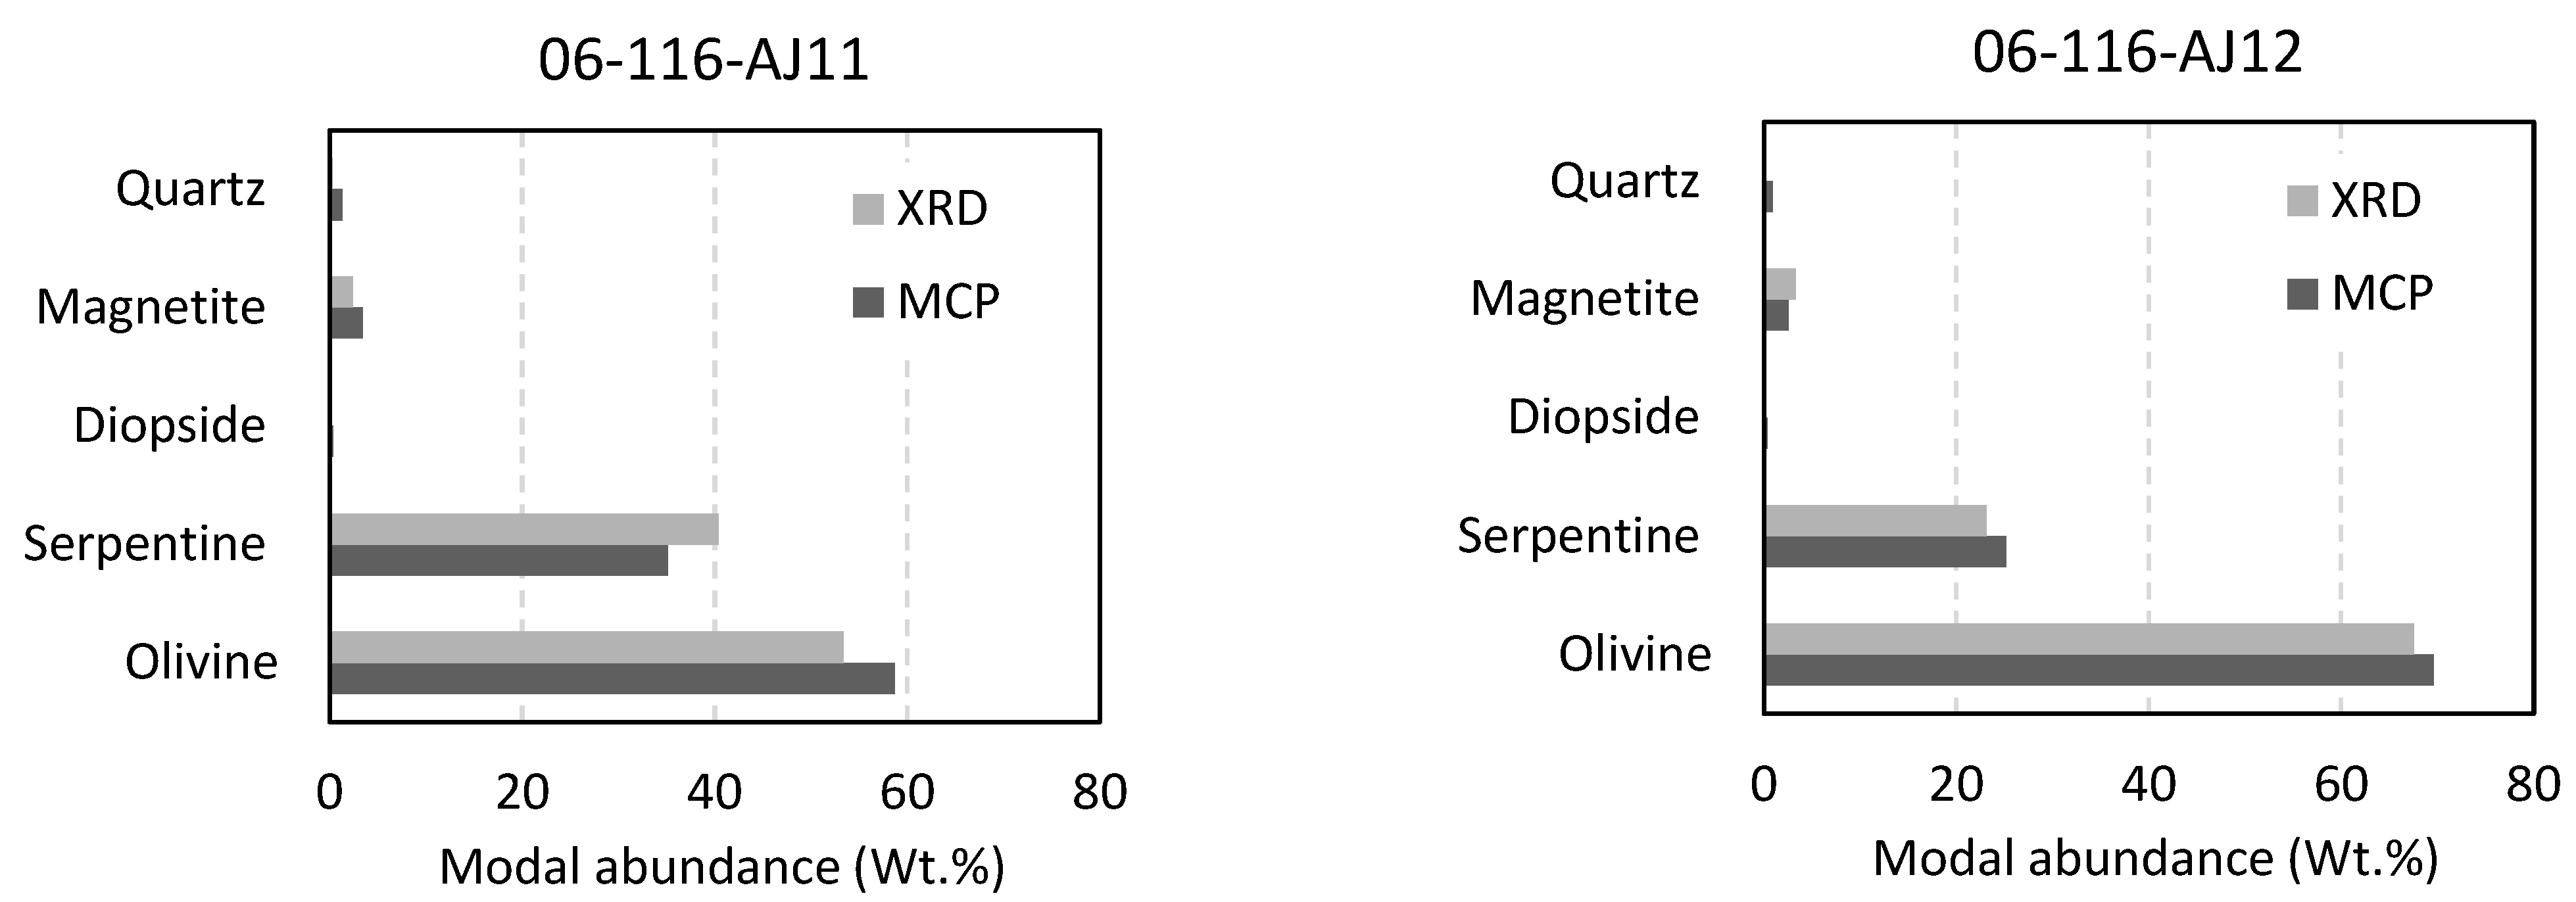
4.2. Reactant Modal Mineral Estimation

A representative sample from the Twin Sisters ultramafic complex and 16 samples from the Turnagain ultramafic complex were subjected to analysis using the MCP calculator. The accuracy of the MCP calculator was evaluated by comparing its results with those obtained through quantitative XRD with Rietveld refinement. An example of the Rietveld refinement plot of the sample 04-25-AJ6 carbonated product is presented in Figure 4. The Twin Sisters sample was analysed in the MCP calculator to evaluate olivine and serpentine estimation on what is known to be a relatively unaltered dunite sample with high olivine content. The results are provided in Table 3. The sample tested was assigned a magnesium number of 96 [41] in the calculator. The results show an excellent correlation between the measured (XRD) and estimated (MCP calculator) values.
The modal mineral abundances estimated using the MCP calculator based on samples tested from Turnagain are compared with the mineral abundances determined from the same drill core samples via XRD in Figure 5. Some minor phases were identified in XRD and MCP calculator results, yet olivine, serpentine, diopside, magnetite, and quartz are common and significant phases. Both magnetite and hematite were identified in XRD analyses, but the MCP calculator totals the remaining FeO weight percentage after the estimation. For graphical representation, FeO is identified as magnetite here.
In Figure 5, the mineral abundances of olivine, serpentine, diopside, and magnetite estimated using the MCP calculator program are compared graphically with the mineral abundances determined via quantitative XRD. According to Scheel [39], the degree of serpentinisation in the Turnagain ultramafic deposit varies significantly from 0 to 100%, with an average of approximately 10% based on field and drill core analysis. As shown based on both XRD and MCP calculator analyses, the olivine and serpentine modal abundances fluctuate between 40% to 100% and 0% to 40% in all tested samples, respectively. The discrepancy between the calculated XRD modal abundances and the MCP calculator estimated abundances for olivine and serpentine could vary up to 20 wt.% from sample to sample.
When the estimated serpentine and olivine quantities are compared to XRD analyses, the mean absolute error for serpentine estimation is 11 wt.%, and for olivine estimation, it is 12 wt.%. Figure 6 displays a strong positive correlation between the absolute difference in olivine and serpentine estimated quantities between the calculated XRD and estimated MCP calculator result, indicating that an overestimation of olivine values based on the MCP calculator leads to an underestimation of serpentine and vice versa. This relationship has important implications for the MCP value estimation of the tested sample, particularly if the mineral carbonation method selected can only sequester one substrate (either olivine or serpentine) and not both, as the degree of error in mineral estimation is directly related to the absolute error.
The serpentine content estimated based on the MCP calculator is renormalised based on the degree of crystallisation determined via XRD analyses. Still, it should be noted that the XRD analyses only provide a partial estimate of the serpentine content. This estimate is derived by assuming that all amorphous material is serpentine during Rietveld refinement. The total MgO, SiO2, and H2O contents estimated in the MCP calculator’s sample data preparation worksheet positively correlate with the same components measured via XRF [33]. The absolute error in olivine and serpentine modal abundances between the MCP calculator program-derived values and the calculated XRD values can be attributed to several factors, including the estimation error in the individual oxide components used for the olivine and serpentine estimation at the sample data preparation stage of the MCP calculator, error in proportioning these components into the respective mineral formulas, and/or inaccuracies in the serpentine and olivine quantities resulting from the partially quantitative XRD analyses being renormalised.
It is easier to accurately quantify the estimation error expected by the MCP calculator program with a precisely determined serpentine modal abundance for each sample tested. However, the guideline mean estimation errors of 11 wt.% and 12 wt.%, compared with semi-quantitative results of the same samples, seem reasonable. The MCP calculator program can determine the high serpentine contents in samples that are also measured with high serpentine contents via XRD with Rietveld refinement. This is demonstrated by analysing samples from the Twin Sisters ultramafic complex, where the calculator determined an extremely high olivine content with an acceptable estimation error. Although some degree of error is expected when estimating rock samples’ olivine and serpentine contents, the MCP calculator program is an effective tool for estimating the degree of serpentinisation throughout an ultramafic deposit from lithogeochemical data.
Table 4 compares the MCP values obtained from the analysis of sixteen samples from the Turnagain ultramafic complex using the MCP calculator program with the estimated MCP values projected from XRD analyses of reactant samples. The table also includes the measured magnesite contents obtained from quantitative XRD analyses of the experimental mineral carbonation products. The MCP calculation in Equation (4) only considered olivine as the mineral contributing MgO for mineral carbonation since it was the only mineral that contributed to mineral carbonation during experimental mineral carbonation. The experimental results are reported in the Ph.D. thesis by Jacobs [33].
The MgO weight percentage available for mineral carbonation from olivine in Equation (4) depended on the magnesium number of the estimated olivine content defined in Equation (4). These magnesium numbers were applied in both the MCP calculator and the projected MCP values based on the quantitative XRD values of the reactant samples. The projected stoichiometric olivine-to-magnesite conversion extent was set at 37% based on the mean carbonation extent achieved using the experimental mineral carbonation procedure and conditions based on material from the Twin Sisters ultramafic deposit.
When comparing the average estimation difference in MCP values between those estimated using the MCP calculator program and those projected using the same reaction extent of 37% from quantitative XRD, there is little difference, at 5.15% to 4.89%, respectively. Both the MCP calculator values and those projected from reactant XRD are consistent throughout, typically ranging between 10% and 20%. The significant differences observed between estimated and measured values appear to be a function of the variability in the mineral carbonation extent. The use of the MCP parameter here is restricted by the industrial mineral carbonation processing regime. Until an established mineral carbonation process has been defined, the accurate use of MCP values is difficult to validate. Some samples, including 04-24-AJ3, 06-110-AJ2, 06-110-AJ17, 06-111-AJ1, 06-116-AJ9, and 06-116-AJ12, were estimated within 1% of the observed experimental mineral carbonation values, suggesting promising estimation results. The relative consistency of estimated MCP values and those projected from XRD indicate that the MCP calculator is an effective tool for predicting MCP behaviour, provided that the variable nature of experimental mineral carbonation is considered.

5. Conclusions

The MCP calculator and the MCP values it generates represent an initial attempt at maximising the use of lithogeochemical data available at mining operations to create a more informed estimate of their CO2 capacity based on the rocks available. In addition to the mining industry, this research can be beneficial to any carbon capture sequestration (CCS) project. This tool provides a cost-effective solution for mining companies to evaluate their deposit as a potential substrate for industrial mineral carbonation operations without additional geochemical testing. Although the MCP calculator has limitations, such as the use of oxide values converted from elemental measurements and sensitivity to the inherent variability of the carbonation process, in this work, it is shown that it can accurately determine samples with a high serpentine content, as demonstrated by its analysis of samples from the Twin Sisters ultramafic complex. Despite some margin of error, the program effectively estimated the degree of serpentinisation throughout the deposit from lithogeochemical data. The program also determined an extremely high olivine content with an acceptable estimation error, showing its effectiveness in determining the mineral contents of rock samples.

Author Contributions

Conceptualization M.H.; methodology, A.J.; validation, A.J., M.H. and J.L.; formal analysis and investigation, A.J. and F.F.; writing—original draft preparation, A.J., F.F. and S.M.; writing—review and editing, F.F., M.H. and T.B.; supervision, M.H.; funding acquisition, J.L. All authors have read and agreed to the published version of the manuscript.

Funding

This research was funded by National Natural Science Foundation of China (52004021), Fundamental Research Funds for the Central Universities and the Youth Teacher International Exchange & Growth Program (QNXM20220003) and Hebei Provincial Key Research Projects (22373706D).

Data Availability Statement

The data presented in this study are openly available at https://dx.doi.org/10.14288/1.0167631 (accessed on 1 July 2023).

Conflicts of Interest

The authors declare no conflict of interest.

References

  1. Oelkers, E.H.; Gislason, S.R.; Matter, J. Mineral Carbonation of CO2. Elements 2008, 4, 333–337. [Google Scholar] [CrossRef]
  2. Herzog, H. Carbon Sequestration via Mineral Carbonation: Overview and Assessment 14 March 2002. 2002. Available online: http://callian2008.free.fr/climatechange/carbon-sequestration/sequestration2.pdf (accessed on 1 June 2023).
  3. Kirchofer, A.; Becker, A.; Brandt, A.; Wilcox, J. CO2 Mitigation Potential of Mineral Carbonation with Industrial Alkalinity Sources in the United States. Environ. Sci. Technol. 2013, 47, 7548–7554. [Google Scholar] [CrossRef] [PubMed]
  4. Bodénan, F.; Bourgeois, F.; Petiot, C.; Augé, T.; Bonfils, B.; Julcour-Lebigue, C.; Guyot, F.; Boukary, A.; Tremosa, J.; Lassin, A.; et al. Ex situ mineral carbonation for CO2 mitigation: Evaluation of mining waste resources, aqueous carbonation processability and life cycle assessment (Carmex project). Miner. Eng. 2014, 59, 52–63. [Google Scholar] [CrossRef]
  5. Li, J.; Hitch, M.; Power, I.M.; Pan, Y. Integrated mineral carbonation of ultramafic mine deposits—A review. Minerals 2018, 8, 147. [Google Scholar] [CrossRef]
  6. Bodor, M.; Santos, R.; Gerven, T.; Vlad, M. Recent developments and perspectives on the treatment of industrial wastes by mineral carbonation—A review. Open Eng. 2013, 3, 566–584. [Google Scholar] [CrossRef]
  7. Matter, J.M.; Kelemen, P.B. Permanent storage of carbon dioxide in geological reservoirs by mineral carbonation. Nat. Geosci. 2009, 2, 837–841. [Google Scholar] [CrossRef]
  8. García del Real, P.; Vishal, V. Mineral Carbonation in Ultramafic and Basaltic Rocks. In Geologic Carbon Sequestration: Understanding Reservoir Behavior; Vishal, V., Singh, T.N., Eds.; Springer International Publishing: Cham, Switzerland, 2016; pp. 213–229. [Google Scholar]
  9. Kelemen, P.B.; Matter, J.; Streit, E.E.; Rudge, J.F.; Curry, W.B.; Blusztajn, J. Rates and Mechanisms of Mineral Carbonation in Peridotite: Natural Processes and Recipes for Enhanced, in situ CO2 Capture and Storage. Annu. Rev. Earth Planet. Sci. 2011, 39, 545–576. [Google Scholar] [CrossRef]
  10. O’Connor, W.K.; Dahlin, D.C.; Rush, G.E.; Dahlin, C.L.; Collins, W.K. Carbon dioxide sequestration by direct mineral carbonation: Process mineralogy of feed and products. Min. Metall. Explor. 2002, 19, 95–101. [Google Scholar] [CrossRef]
  11. Farhang, F.; Rayson, M.; Brent, G.; Hodgins, T.; Stockenhuber, M.; Kennedy, E. Insights into the dissolution kinetics of thermally activated serpentine for CO2 sequestration. Chem. Eng. J. 2017, 330, 1174–1186. [Google Scholar] [CrossRef]
  12. Sanna, A.; Uibu, M.; Caramanna, G.; Kuusik, R.; Maroto-Valer, M.M. A review of mineral carbonation technologies to sequester CO2. Chem. Soc. Rev. 2014, 43, 8049–8080. [Google Scholar] [CrossRef]
  13. Sanna, A.; Maroto-Valer, M. CO2 Sequestration Using a Novel Na-salts pH Swing Mineral Carbonation Process. Energy Procedia 2014, 63, 5897–5903. [Google Scholar] [CrossRef]
  14. Rashid, M.I.; Benhelal, E.; Farhang, F.; Oliver, T.K.; Stockenhuber, M.; Kennedy, E.M. Application of a concurrent grinding technique for two-stage aqueous mineral carbonation. J. CO2 Util. 2020, 42, 101347. [Google Scholar] [CrossRef]
  15. Thonemann, N.; Zacharopoulos, L.; Fromme, F.; Nühlen, J. Environmental impacts of carbon capture and utilization by mineral carbonation: A systematic literature review and meta life cycle assessment. J. Clean. Prod. 2022, 332, 130067. [Google Scholar] [CrossRef]
  16. Khoo, H.; Bu, J.; Wong, R.; Kuan, S.; Sharratt, P. Carbon capture and utilization: Preliminary life cycle CO2, energy, and cost results of potential mineral carbonation. Energy Procedia 2011, 4, 2494–2501. [Google Scholar] [CrossRef]
  17. Farhang, F.; Oliver, T.K.; Rayson, M.S.; Brent, G.F.; Molloy, T.S.; Stockenhuber, M.; Kennedy, E.M. Dissolution of heat activated serpentine for CO2 sequestration: The effect of silica precipitation at different temperature and pH values. J. CO2 Util. 2019, 30, 123–129. [Google Scholar] [CrossRef]
  18. Haug, T.A.; Munz, I.A.; Kleiv, R.A. Importance of dissolution and precipitation kinetics for mineral carbonation. Energy Procedia 2011, 4, 5029–5036. [Google Scholar] [CrossRef]
  19. Wang, F.; Dreisinger, D.; Jarvis, M.; Hitchins, T. Kinetics and mechanism of mineral carbonation of olivine for CO2 sequestration. Miner. Eng. 2019, 131, 185–197. [Google Scholar] [CrossRef]
  20. Alexander, G.; Maroto-Valer, M.M.; Gafarova-Aksoy, P. Evaluation of reaction variables in the dissolution of serpentine for mineral carbonation. Fuel 2007, 86, 273–281. [Google Scholar] [CrossRef]
  21. Zhao, L.; Sang, L.; Chen, J.; Ji, J.; Teng, H.H. Aqueous carbonation of natural brucite: Relevance to CO2 sequestration. Environ. Sci. Technol. 2010, 44, 406–411. [Google Scholar] [CrossRef] [PubMed]
  22. Lavikko, S.; Eklund, O. The significance of the serpentinite characteristics in mineral carbonation by “the ÅA Route”. Int. J. Miner. Process. 2016, 152, 7–15. [Google Scholar] [CrossRef]
  23. Haque, F.; Santos, R.M.; Chiang, Y.W. Using nondestructive techniques in mineral carbonation for understanding reaction fundamentals. Powder Technol. 2019, 357, 134–148. [Google Scholar] [CrossRef]
  24. Farhang, F.; Oliver, T.K.; Rayson, M.; Brent, G.; Stockenhuber, M.; Kennedy, E. Experimental study on the precipitation of magnesite from thermally activated serpentine for CO2 sequestration. Chem. Eng. J. 2016, 303, 439–449. [Google Scholar] [CrossRef]
  25. Rashid, M.I.; Benhelal, E.; Farhang, F.; Oliver, T.K.; Rayson, M.S.; Brent, G.F.; Stockenhuber, M.; Kennedy, E.M. ACEME: Direct Aqueous Mineral Carbonation of Dunite Rock. Environ. Prog. Sustain. Energy 2019, 38, e13075. [Google Scholar] [CrossRef]
  26. Lechat, K.; Lemieux, J.-M.; Molson, J.; Beaudoin, G.; Hébert, R. Field evidence of CO2 sequestration by mineral carbonation in ultramafic milling wastes, Thetford Mines, Canada. Int. J. Greenh. Gas Control 2016, 47, 110–121. [Google Scholar] [CrossRef]
  27. Reynolds, B.; Reddy, K.J.; Argyle, M.D. Field Application of Accelerated Mineral Carbonation. Minerals 2014, 4, 191–207. [Google Scholar] [CrossRef]
  28. Oliver, T.K.; Farhang, F.; Hodgins, T.W.; Rayson, M.S.; Brent, G.F.; Molloy, T.S.; Stockenhuber, M.; Kennedy, E.M. CO2 Capture Modeling Using Heat-Activated Serpentinite Slurries. Energy Fuels 2019, 33, 1753–1766. [Google Scholar] [CrossRef]
  29. Teir, S.; Revitzer, H.; Eloneva, S.; Fogelholm, C.-J.; Zevenhoven, R. Dissolution of natural serpentinite in mineral and organic acids. Int. J. Miner. Process. 2007, 83, 36–46. [Google Scholar] [CrossRef]
  30. Hitch, M.; Ballantyne, S.; Hindle, S. Revaluing mine waste rock for carbon capture and storage. Int. J. Min. Reclam. Environ. 2010, 24, 64–79. [Google Scholar] [CrossRef]
  31. Puthiya Veetil, S.K.; Hitch, M. Aqueous mineral carbonation of ultramafic material: A pre-requisite to integrate into mineral extraction and tailings management operation. Environ. Sci. Pollut. Res. 2021, 28, 29096–29109. [Google Scholar] [CrossRef] [PubMed]
  32. Back, J.; Zevenhoven, R.; Fagerlund, J.; Sorjonen-Ward, P. Mineral Carbonation Using Mine Tailings-a Strategic Overview of Potential and Opportunities. SSRN 4285256. 2022. Available online: https://papers.ssrn.com/sol3/papers.cfm?abstract_id=4285256 (accessed on 28 November 2022).
  33. Jacobs, A.D. Quantifying the mineral carbonation potential of mine waste material: A new parameter for geospatial estimation. In Mining Engineering; University of British Columbia: Vancouver, BC, Canada, 2014; p. 250. [Google Scholar]
  34. Lackner, K.S.; Wendt, C.H.; Butt, D.P.; Joyce, E.L.; Sharp, D.H. Carbon dioxide disposal in carbonate minerals. Energy 1995, 20, 1153–1170. [Google Scholar] [CrossRef]
  35. Goff, F.; Lackner, K.S. Carbon dioxide sequestering using ultramafic rocks. Environ. Geosci. 1998, 5, 89–102. [Google Scholar] [CrossRef]
  36. Penner, L.R.; O’Connor, W.K.; Dahlin, D.C.; Gerdemann, S.J.; Rush, G.E. Mineral Carbonation: Energy Costs of Pretreatment Options and Insights Gained from Flow Loop Reaction Studies; Albany Research Center (ARC): Albany, OR, USA, 2004. [Google Scholar]
  37. Goff, F.; Guthrie, G.; Lipin, B.; Fite, M.; Chipera, S.; Counce, D.; Kluk, E.; Ziock, H. Evaluation of Ultramafic Deposits in the Eastern United States and Puerto Rico as Sources of Magnesium for Carbon Dioxide Sequestration; Los Alamos National Lab. (LANL): Los Alamos, NM, USA, 2000.
  38. Nixon, G.T.; Hammack, J.L. Geology and Platinum-group Element Mineralization of Alaskan-type Ultramafic-Mafic Complexes in British Columbia; British Columbia, Ministry of Employment and Investment: Burnaby, BC, Canada, 1997; Volume 93, p. 141.
  39. Scheel, J.E. Age and Origin of the Turnagain Alaskan-Type Intrusion and Associated Ni-Sulphide Mineralization, North-Central British Columbia, Canada; University of British Columbia: Vancouver, BC, Canada, 2007. [Google Scholar]
  40. Herrmann, W.; Berry, R.F. MINSQ—A least squares spreadsheet method for calculating mineral proportions from whole rock major element analyses. Geochem. Explor. Environ. Anal. 2002, 2, 361–368. [Google Scholar] [CrossRef]
  41. Onyeagocha, A. Twin Sisters dunite: Petrology and mineral chemistry. Geol. Soc. Am. Bull. 1978, 89, 1459–1474. [Google Scholar] [CrossRef]
Figure 1. Illustrations of the MCP calculator program’s four primary worksheets.
Minerals 13 01129 g001aMinerals 13 01129 g001b
Figure 2. Generalised sequence of stages used for modal mineral estimation of ultramafic rocks in the MCP calculator program.
Minerals 13 01129 g002
Figure 3. Measured MgO, Fe2O3, and CaO oxide values from XRF analysis versus estimated values based on the MCP calculator at Turnagain.
Minerals 13 01129 g003
Figure 4. Rietveld refinement plot of sample “04-25-AJ6- Product” (blue line—observed intensity at each step; red line—calculated pattern; solid grey line below—difference between observed and calculated intensities; vertical bars—positions of all Bragg reflections). Coloured lines are individual diffraction patterns of all phases.
Minerals 13 01129 g004
Figure 5. Modal mineral estimation comparison of 16 samples tested from the Turnagain.
Minerals 13 01129 g005aMinerals 13 01129 g005bMinerals 13 01129 g005c
Figure 6. Mean absolute error of serpentine versus olivine using the MCP calculator program.
Minerals 13 01129 g006
Table 1. Lithology selected for use in the MCP calculator at the Turnagain ultramafic deposit.
LithologyRock CodeAverage Magnesium Number
Green Dunite193
Dunite291
Wehrlite388
Olivine Clinopyroxenite485
Serpentinite591
Table 2. Estimated major oxide values from the MCP calculator compared with those measured via XRF analysis from 16 samples tested at the Turnagain ultramafic complex.
Sample IDData TypeOxide Component (Wt.%)
Al2O3CaOFe2O3K2OMgOMnONa2OP2O5TiO2Total
04-24-AJ3Est. Oxide0.321.0611.60.0144.370.170.010.02- *57.56
Meas. Oxide0.360.910.230.0343.810.140.02-0.0355.52
Residual−0.040.161.37−0.020.560.03−0.010.02−0.032.24
04-25-AJ6Est. Oxide0.44.9715.310.0137.160.210.040.02-58.12
Meas. Oxide0.414.3513.910.0638.280.180.0300.0657.28
Residual−0.010.621.4−0.05−1.120.030.010.02−0.063.32
06-110-AJ2Est. Oxide0.110.2910.010.0143.710.150.010.010.0254.32
Meas. Oxide0.150.310.39-46.640.16---57.64
Residual−0.04−0.01−0.380.01−2.93−0.010.010.010.023.42
06-110-AJ6Est. Oxide0.260.3611.850.0146.010.140.010.010.0258.67
Meas. Oxide0.130.4211.21-47.230.16---59.15
Residual0.13−0.060.640.01−1.22−0.020.010.010.022.12
06-110-AJ10Est. Oxide0.190.5310.270.0149.510.150.010.010.0260.7
Meas. Oxide0.20.639.310.0148.510.13--0.0158.8
Residual−0.01−0.10.96010.020.010.010.012.12
06-110-AJ13Est. Oxide0.190.9811.770.0548.750.170.010.010.0361.96
Meas. Oxide0.210.9110.530.0345.510.16--0.0357.38
Residual−0.020.071.240.023.240.010.010.0104.62
06-110-AJ17Est. Oxide0.213.1511.910.0139.790.190.050.010.0555.37
Meas. Oxide0.173.4710.860.0340.160.10.04--54.83
Residual0.04−0.321.05−0.02−0.370.090.010.010.051.96
06-111-AJ1Est. Oxide0.41.0511.240.0143.640.180.010.050.0556.63
Meas. Oxide0.171.0611.04-44.560.210.01--57.05
Residual0.23−0.010.20.01−0.92−0.0300.050.051.5
06-111-AJ4Est. Oxide0.130.2911.740.0146.190.180.010.010.0258.58
Meas. Oxide0.140.2310.95-47.150.15--0.0458.66
Residual−0.010.060.790.01−0.960.030.010.01−0.021.9
06-111-AJ7Est. Oxide0.130.4211.680.0143.330.180.010.010.0355.8
Meas. Oxide0.160.4511.54-45.630.18---57.96
Residual−0.03−0.030.140.01−2.300.010.010.032.56
06-111-AJ10Est. Oxide0.281.1213.370.0141.340.180.010.010.0256.34
Meas. Oxide0.091.3813.010.0242.620.12---57.24
Residual0.19−0.260.36−0.01−1.280.060.010.010.022.2
06-111-AJ13Est. Oxide0.111.1511.190.0142.610.150.010.010.0155.25
Meas. Oxide0.141.1810.89-44.870.160.06-0.0157.31
Residual−0.03−0.030.30.01−2.26−0.01−0.050.0102.7
06-116-AJ7Est. Oxide0.060.158.450.0145.280.120.010.010.0254.11
Meas. Oxide0.090.168.07-48.010.120.01-0.0356.49
Residual−0.03−0.010.380.01−2.73000.01−0.013.18
06-116-AJ9Est. Oxide0.210.189.550.0145.050.130.010.010.0255.17
Meas. Oxide0.260.228.340.0246.340.110.01--55.3
Residual−0.05−0.041.21−0.01−1.290.0200.010.022.65
06-116-AJ11Est. Oxide0.090.158.640.0145.710.130.010.010.0254.77
Meas. Oxide0.130.167.94-47.690.110.01-0.0256.06
Residual−0.04−0.010.70.01−1.980.0200.0102.77
06-116-AJ12Est. Oxide0.190.218.480.0147.010.130.010.010.0256.07
Meas. Oxide0.080.317.860.0147.250.1---55.61
Residual0.11−0.10.620−0.240.030.010.010.021.14
The residual values are the calculated difference between estimated and measured values. The total residual values are the sum of the squared differences observed between the estimated and measured components. * Value not measured or estimated.
Table 3. Measured mineral abundance based on XRD with Rietveld refinement and estimated values based on the MCP calculator of a Twin Sisters olivine.
MineralXRD (wt.%)MCP Calculator (wt.%)Residual
Olivine97.995.991.91
Chromite1.50.970.53
Magnetite-1.91−1.91
Serpentine0.20.57−0.37
Quartz0.40.190.21
Anorthite-0.36−0.36
Diopside-0.01−0.01
Total100100
Table 4. Estimated MCP values based on the MCP calculator compared with those projected from XRD with Rietveld refinement analyses.
MCP Calculator Mineral ResultsProjected MCP Mineral Results from XRD
Sample IDEstimated MCP Value (%) by MCP CalculatorXRD Measured MCP Value (%) Post-Carbonation DifferenceXRD Projected MCP Value (%) from ReactantXRD Measured MCP Value (%) Post-Carbonation Difference
04-24-AJ315.514.530.9710.1114.534.42
04-25-AJ614.8426.9312.0910.4326.9316.5
06-110-AJ210.8511.60.7513.3511.61.76
06-110-AJ615.412.642.7611.9712.640.67
06-110-AJ1019.737.9611.7714.777.966.81
06-110-AJ1319.027.4511.5713.977.456.53
06-110-AJ1711.3211.010.3112.8811.011.87
06-111-AJ113.2413.150.0813.6913.150.54
06-111-AJ416.256.1410.1115.176.149.03
06-111-AJ711.4516.324.8714.1516.322.18
06-111-AJ1010.7821.0510.2711.1121.059.94
06-111-AJ1311.0722.7411.6712.8422.749.9
06-116-AJ711.8314.422.5811.9414.422.48
06-116-AJ912.4611.50.9612.4111.50.91
06-116-AJ1112.4213.621.210.2113.623.41
06-116-AJ1214.6514.170.4812.9214.171.25
Average13.814.085.1512.6214.084.89
Disclaimer/Publisher’s Note: The statements, opinions and data contained in all publications are solely those of the individual author(s) and contributor(s) and not of MDPI and/or the editor(s). MDPI and/or the editor(s) disclaim responsibility for any injury to people or property resulting from any ideas, methods, instructions or products referred to in the content.

