Article

Evaluation Model of Hard Limestone Reformation and Strength Weakening Based on Acidic Effect

State Key Laboratory of Coal Resources and Safe Mining, China University of Mining and Technology, Xuzhou 221116, China
*
Author to whom correspondence should be addressed.
Minerals 2023, 13(8), 1101; https://doi.org/10.3390/min13081101
Submission received: 30 June 2023 / Revised: 4 August 2023 / Accepted: 16 August 2023 / Published: 18 August 2023
(This article belongs to the Topic Failure Characteristics of Deep Rocks, Volume II)

Abstract

:
The typical thick-hard limestone roof with high failure pressure and easy fracture closure under in situ stress is extremely prone to induce disasters, which seriously threatens the safe production of coal mines. The modification of carbonate minerals by acidic effects can effectively realize the weakening control of hard limestone strata. In this study, a multi-factor orthogonal experiment was designed for limestone acidification reactions, and the evaluation model for the reformation and strength weakening of hard limestone based on the acidic effect was established accordingly. The results showed that there is an order in the influence of various factors on the reaction parameters and strength indices of acidified limestone, and the improvement of rock properties by the level difference of acid concentration is significantly better than that of acid type and acidification time. Through numerical analysis, the evaluation model of limestone reformation and strength weakening considering the acid reaction parameters is given. The reliability of the model passed the credibility test and experimental verification, which can effectively reflect the strength response characteristics of acidified limestone. The simulated annealing (SA) algorithm is introduced to derive the optimal acidification system suitable for limestone weakening. Combined with the model, the control mechanism of the acidic effect on hard limestone strata was analyzed. The acidic effect can not only induce the rapid generation and expansion of micro-cracks at mineral-containing crystal defects, but also make the cracks remain relatively open under in situ stress due to the differential interaction on mineral components, which is conducive to the bearing capacity reduction and structural damage of limestone rock mass. The research results provide theoretical guidance for the acidification control of hard limestone strata in underground mines.

1. Introduction

In China, more than one third of the coal seam roofs are thick-hard roofs with high rock strength, undeveloped joint fissures, and strong bearing capacity, which can easily induce roof accidents and derived mine pressure disasters [1,2,3]. For the thick-hard rock strata (especially limestone strata) overlying the working face of longwall mining, such as Jincheng mining area [4], Datong mining area [5], and Shendong mining area [6], due to the extreme fracture pressure and the secondary closure of cracks under in situ stress, the effect of conventional strata control methods such as hydraulic fracturing [7,8] and blasting [9] is limited, which seriously threatens the safety production of coal mines. Therefore, it is urgent to find a more suitable treatment method for hard limestone. The strong reaction of acid to limestone can improve the rock structure and reduce the strength properties, which is a novel and effective way to control the hard limestone strata in coal mines [10]. The acidification method of strata is derived from the stimulation of low permeability carbonate reservoirs. Specifically, it changes the rock structure through acid–rock chemical reactions, and has the ability to etch cracks, dissolve cementation, and etch diversion [11].
The existing rock acidification theories and evaluation models focus on the structural reformation of reservoir-bearing strata and construct a highly conductive wormhole network in the strata through the acidic effect to promote the efficient output of oil, gas, or geothermal resources [12,13]. Since the establishment of the classical N-K empirical formula considering the equivalent relationship between rock dissolution and fracture conductivity in 1973 [14], the acidification model based on this has been continuously refined and optimized for the evaluation of acid etching fracture morphology, acid penetration distance, and acid etching fracture conductivity [15,16]. The corresponding relationship between the conductivity of acid etching fractures has also evolved from the single factor models (Gangi model [17], Walsh model [18], T-W model [19], etc.) that only consider closure stress, lithology, and surface roughness, and then gradually developed into the models under different factors (Gong model [20], Mou model [21], etc.). In recent years, the refined models of rock characteristics under various acidic effects are mostly applied to the analysis of acid fluid filtration, the identification of multiphase flow and the description of fracture behavior. The existing acidification theory system and related evaluation are mainly limited to the improvement of permeability and conductivity of reservoir-bearing strata under different occurrence conditions and reservoir spaces.
However, there are obvious differences in the acidification environment between the reservoir and the rock strata in the underground mine [22,23,24], and the rock strata control area of the longwall mining surface of the coal mine is relatively concentrated and basically homogeneous [25,26,27]. The acidification of hard rock strata should ensure that the acid pressure fluid is injected into the surrounding rock through drilling methods, so as to achieve the purpose of weakening the strength of rock mass and rapidly destroy the structural integrity. Therefore, the response law of reformation characteristics and mechanical properties of hard rock strata under the acidic effect is the primary purpose of this research. The existing acidic effect evaluation model is not suitable for the reformation and strength influence of limestone strata in coal mines, so it cannot be further systematically and accurately applied to field projects.
Therefore, in this study, the reformation test of hard limestone under the acidic effect was carried out. Based on the sensitivity and significance analysis of reaction results and mechanical indices under different acidification factors, the reformation and strength evaluation model of limestone considering acid reaction parameters was established. The optimized acid reaction system suitable for the weakening of hard limestone was given, and the damage mechanism of the acidic effect on the mineral crystals contained in hard limestone was discussed in order to provide guidance for the weakening control of hard limestone strata in underground mines by the acidic effect.

2. Orthogonal Simulation Experiment

2.1. Chemical Reaction Principle

Limestone is a carbonate rock with calcite group minerals (CaCO3) and dolomite group minerals (CaMg(CO3)2) as the main components [28]. It can undergo metathesis reactions with acidic media, and the reaction products are neutral compounds containing calcium and magnesium ions. Most of them can be dissolved in water, which has little effect on the geological environment of the stope. The premise of acid–rock reactions is the dissolution and ionization of carbonate mineral components in limestone under liquid phase. Taking the calcite group as an example, Equation (1) is the dissolution and ionization equilibrium equation of calcium carbonate, the main composition of the calcite group, which is a strong electrolyte and can undergo complete ionization when dissolved in water.
CaCO 3 ( s ) CaCO 3 ( aq ) = Ca 2 + ( aq ) + CO 3 2 ( aq )
For the overlying limestone strata of the stope in underground mining operations, the acid solution is pumped into the control area through the dense drilling of the roof, and the acid ions penetrate deep into the surrounding rock. The carbonate minerals in the area are completely ionized under acidic conditions to produce carbonate ions, and salt compounds, carbon dioxide gas, and water are generated according to the acid reaction of different media (Equation (2)), which will promote the dissolution reaction of mineral components to be positive, resulting in the acid etching behavior of the macroscopic limestone matrix.
CaCO 3 + 2 HCOOH Ca ( HCOO ) 2 + CO 2 + H 2 O CaCO 3 + 2 HCl CaCl 2 + CO 2 + H 2 O CaCO 3 + 2 HF CaF 2 + CO 2 + H 2 O
The acid–rock chemical reaction behavior is mainly reflected in the initial stage containing a high concentration of hydrogen ions, and the reactants are sufficient to make the ion replacement capacity within the system stronger. At the same time, it is known from Van’s law [29] that the activated particles involved in the replacement will collide more frequently and effectively along with the exothermic reaction, so the initial stage has the most significant acidic effect on limestone. In the later stages of the reaction, the hydrogen ions in the solution system are consumed. In addition, some of the generated carbon dioxide gas will dissolve in water to form carbonic acid, which can cause certain dissolution of carbonate minerals in limestone, but the effect is limited.

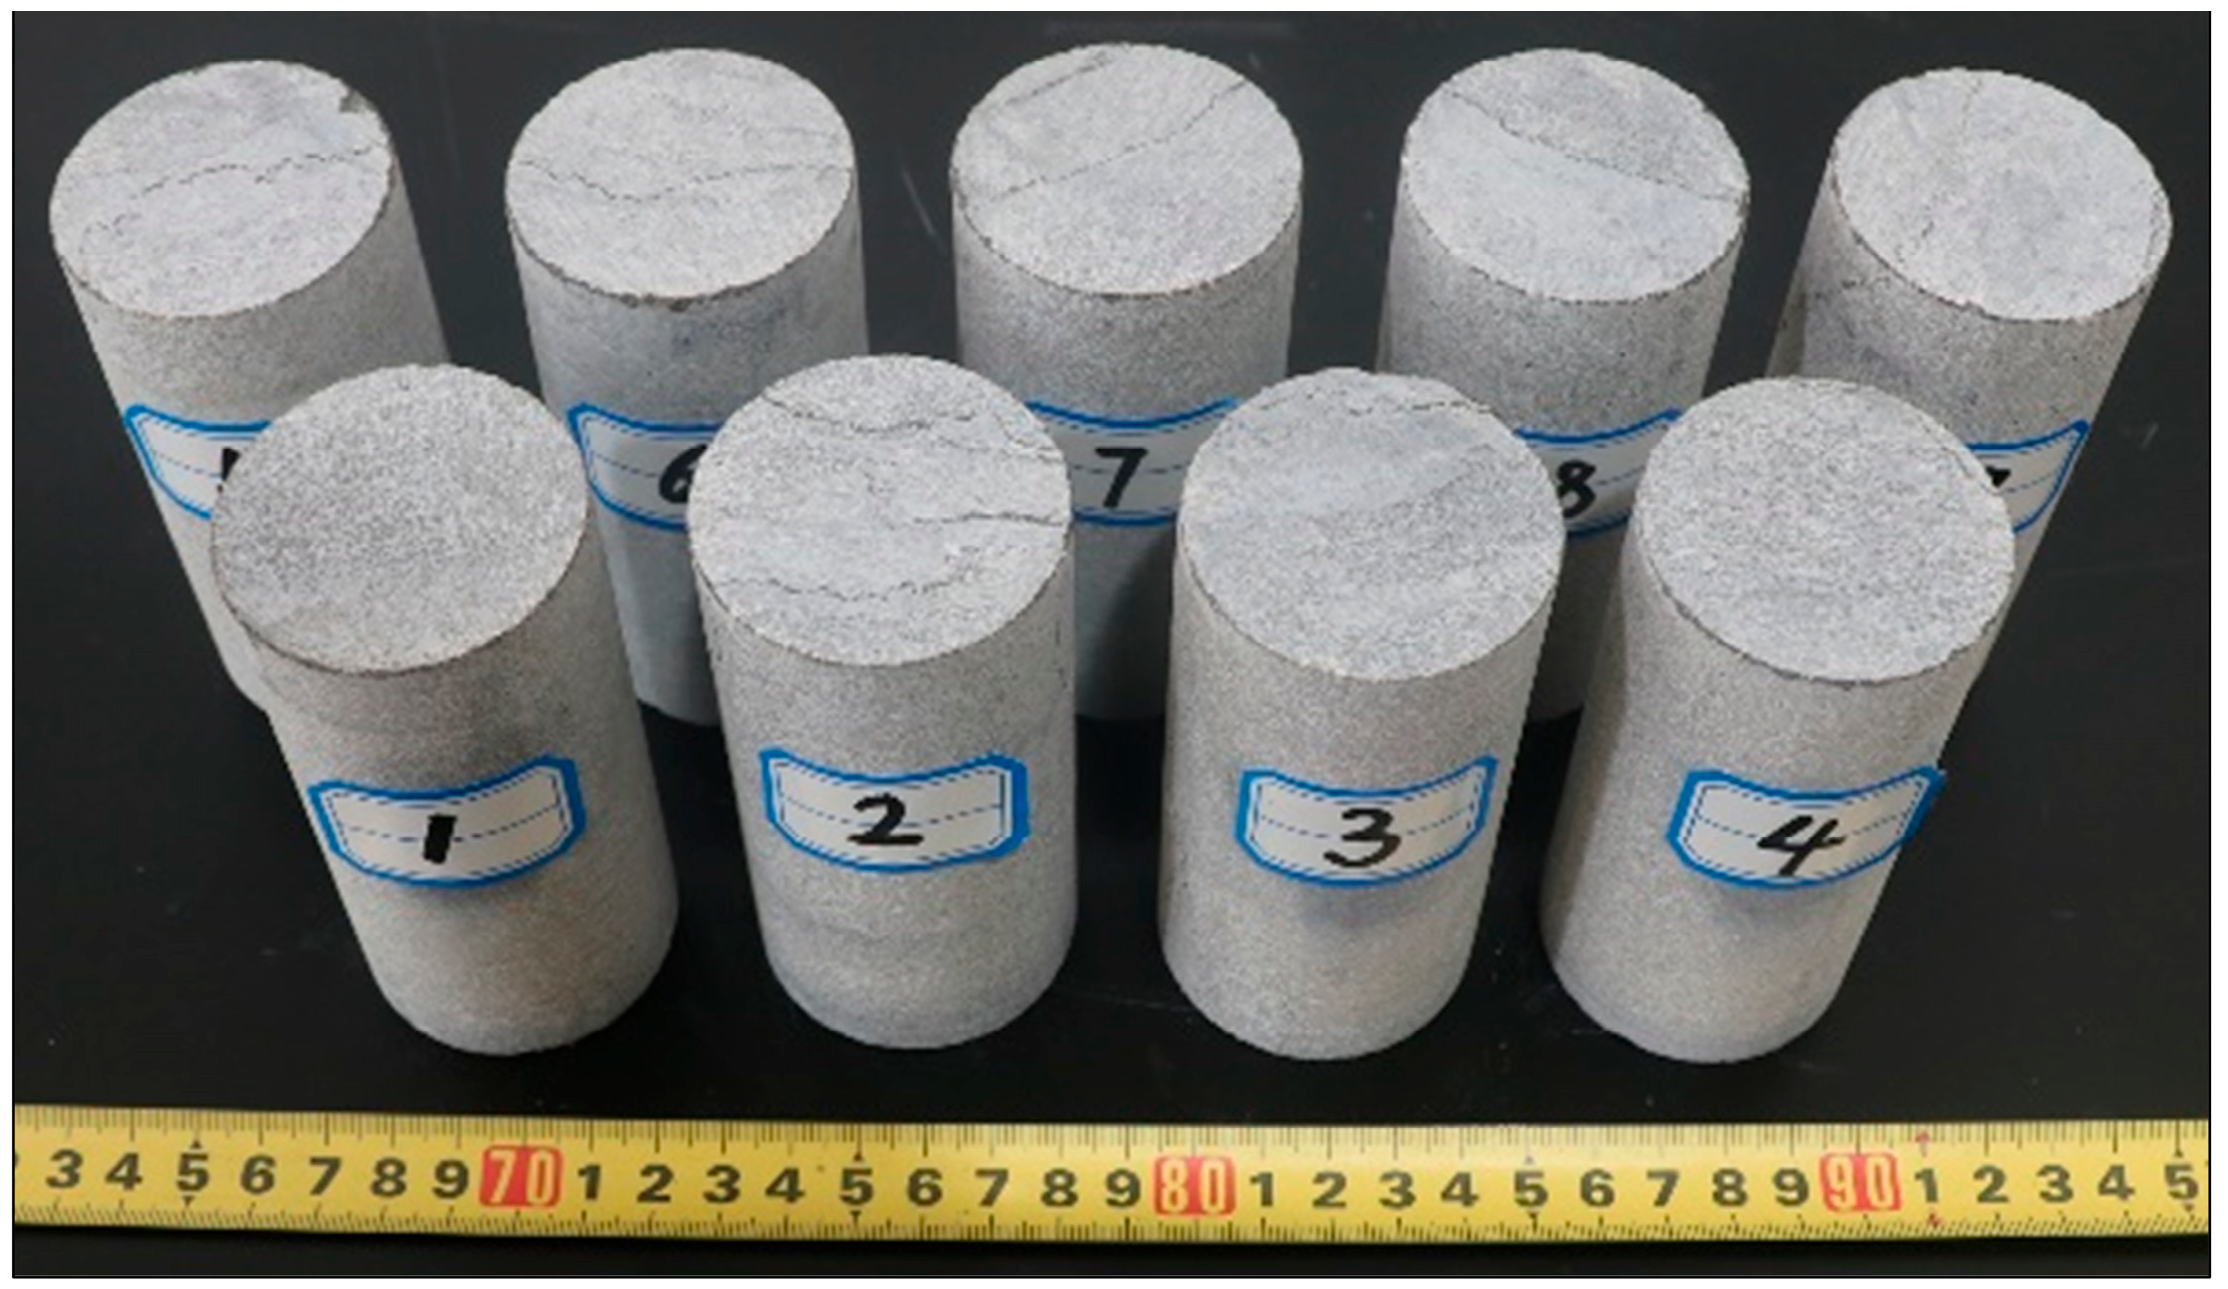
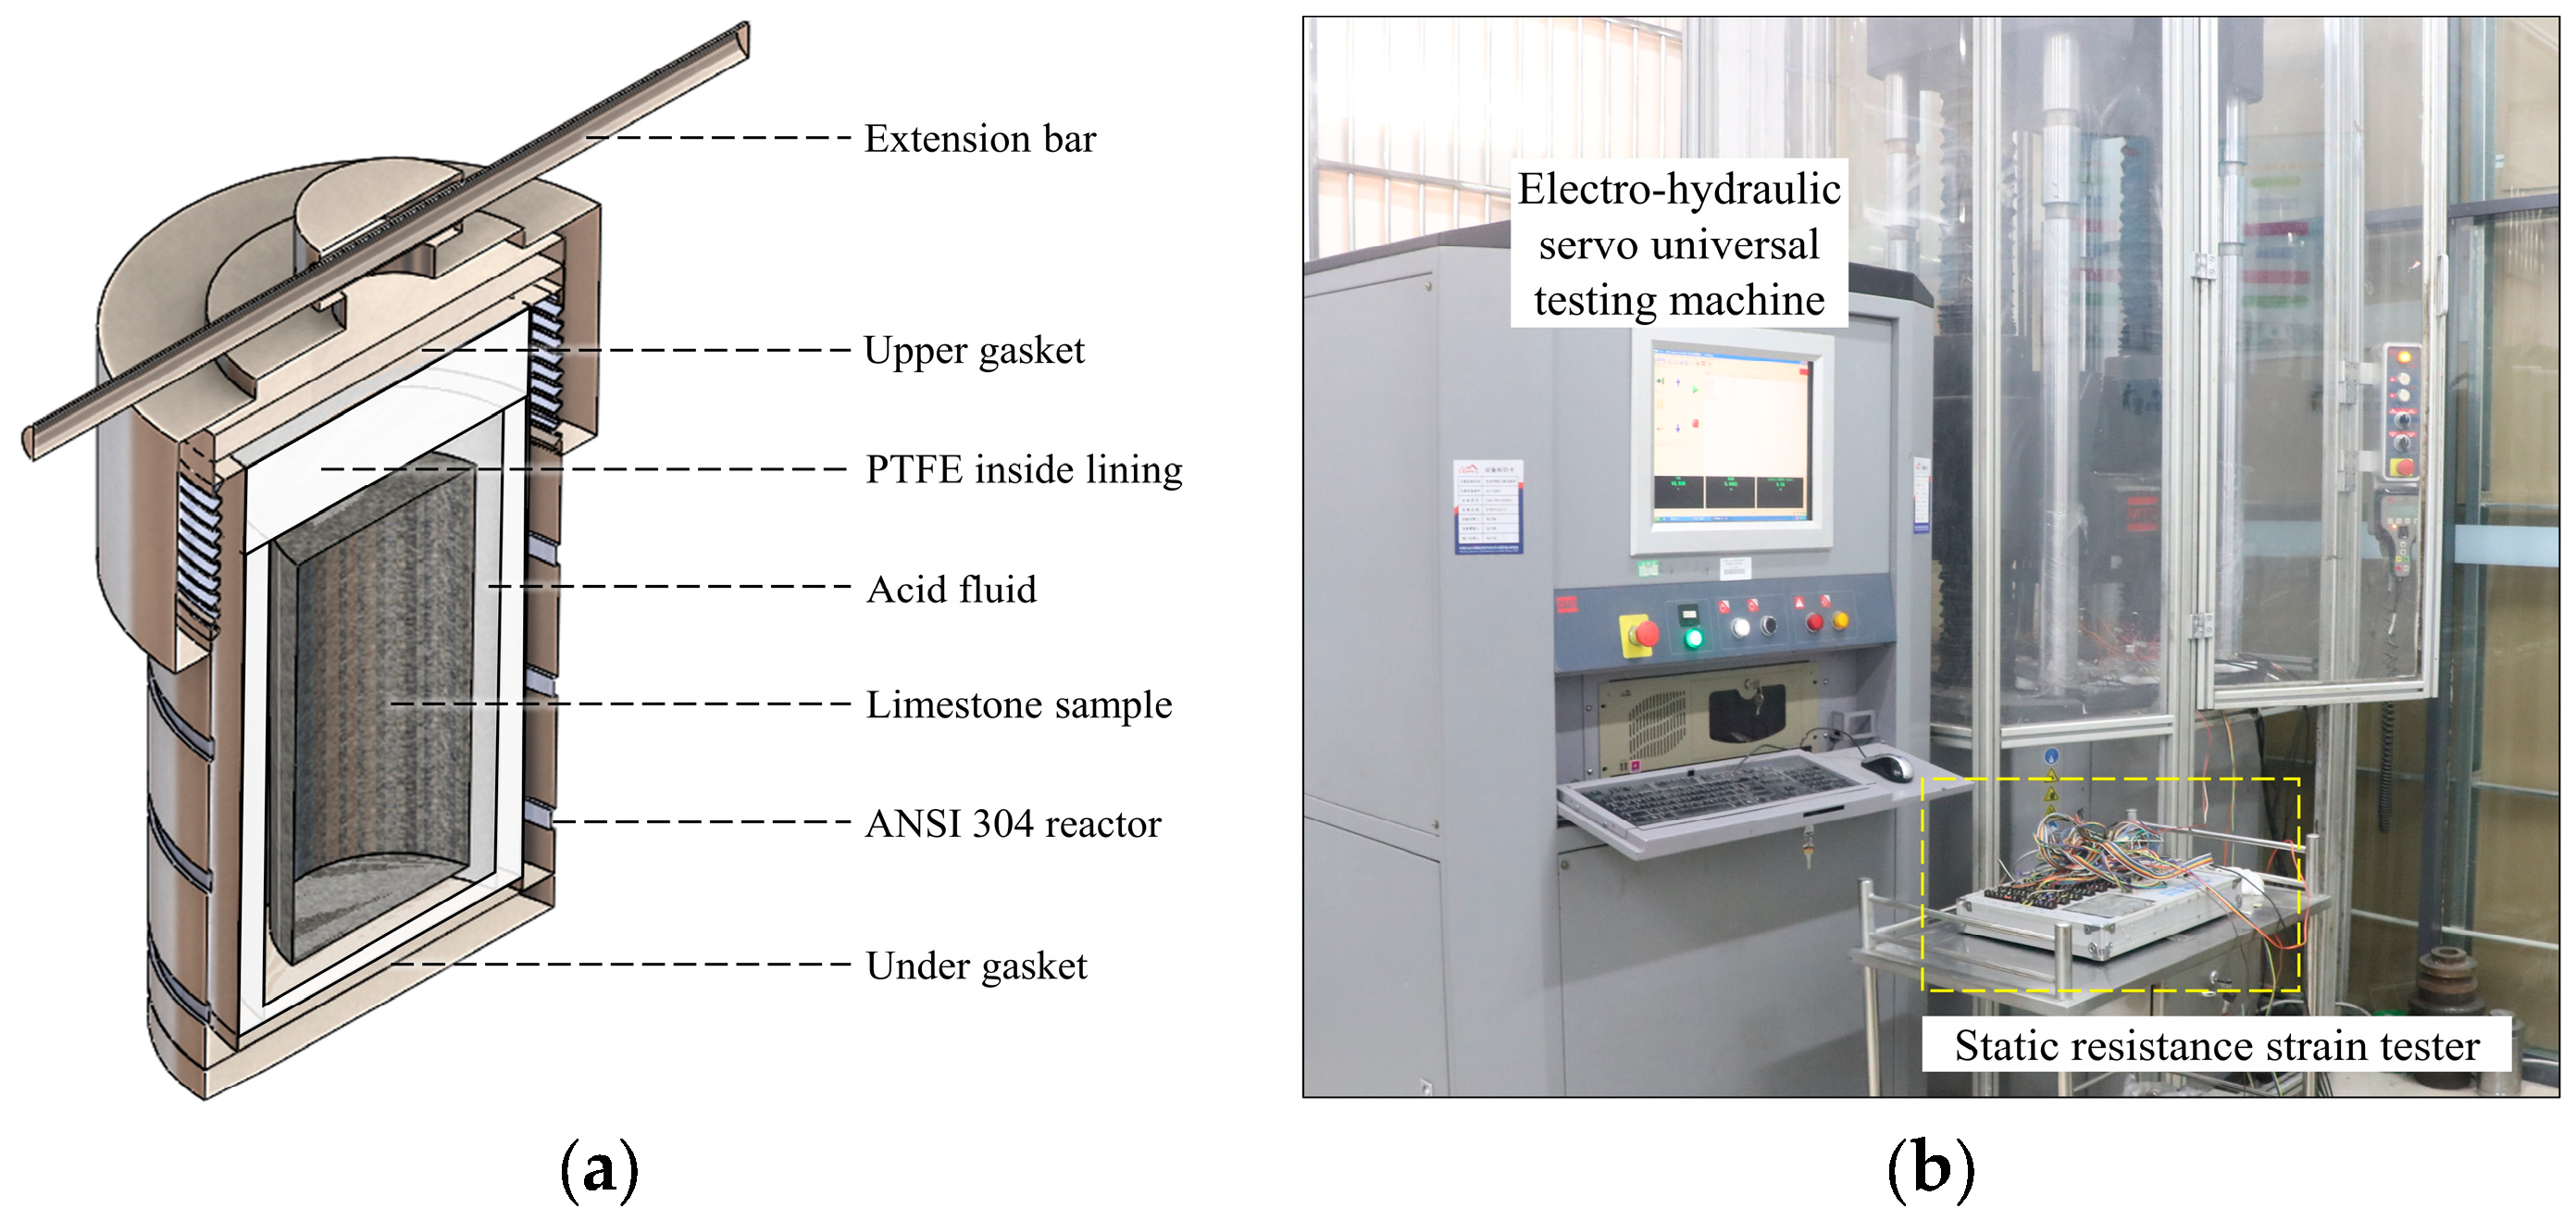
2.2. Specimen Preparation and Experimental Device

The specimens were taken from the hard limestone roof strata on the longwall working face of a coal mine in Gaoping City, Shanxi Province, China (rock density was 2.72 g/cm3, water content was 0.49%). In order to reduce the influence of specimen dispersion on the experimental results, the standard rock specimens with a diameter of 50 mm and a height of 100 mm were prepared by dense drilling in the same rock block (Figure 1).
Figure 2a is the reaction device of the acidizing modification test. The surface and lining materials of the device were an ANSI stainless steel with high pressure resistance and polytetrafluoroethylene (PTFE) with strong acid corrosion resistance, which can be used for long-term simulated experiments of limestone acidification reformation under confined and high temperature environment.
The rock strength characteristic test system included MTS C64.106 electro-hydraulic servo universal testing machine and YBY-2001 static resistance strain gauge (Figure 2b), which is used to test the strength index of acidified specimens. The MTS testing machine has a high strength six-column load frame configuration, with beam displacement limit protection, force overload protection, overheating protection, voltage overload protection, and other functions. The matching TestWork software can realize the monitoring of parameters such as ReH (upper yield strength), ReL (lower yield strength), Rp0.2 (specified non-proportional extension strength), and Rt0.5 (specified total extension strength). The maximum loading pressure of the test machine was 1000 kN, the load accuracy was 0.5%, and the sampling frequency was 1000 Hz. The YBY-2001 resistance strain gauge was used to record the strain values during the strength test. The strain gauge adopts a 24-bit A/D resolution, the maximum sampling frequency of 10 Hz, and the maximum range of measured strain of ±19,999 με. The strain gauge met the test environment of −20 °C to 50 °C, and collected all the data of up to 20 channels at the same time.

2.3. Orthogonal Experimental Design

This experiment was a three-factor three-level parameter test (Table 1), and the empty column was set as a random error column for subsequent significance analysis. Based on the Taguchi orthogonal method, the L9(34) orthogonal design was established. The three acid types were selected as hydrochloric acid, formic acid, and mud acid (4%–12% HCl + 1%–3% HF), respectively.

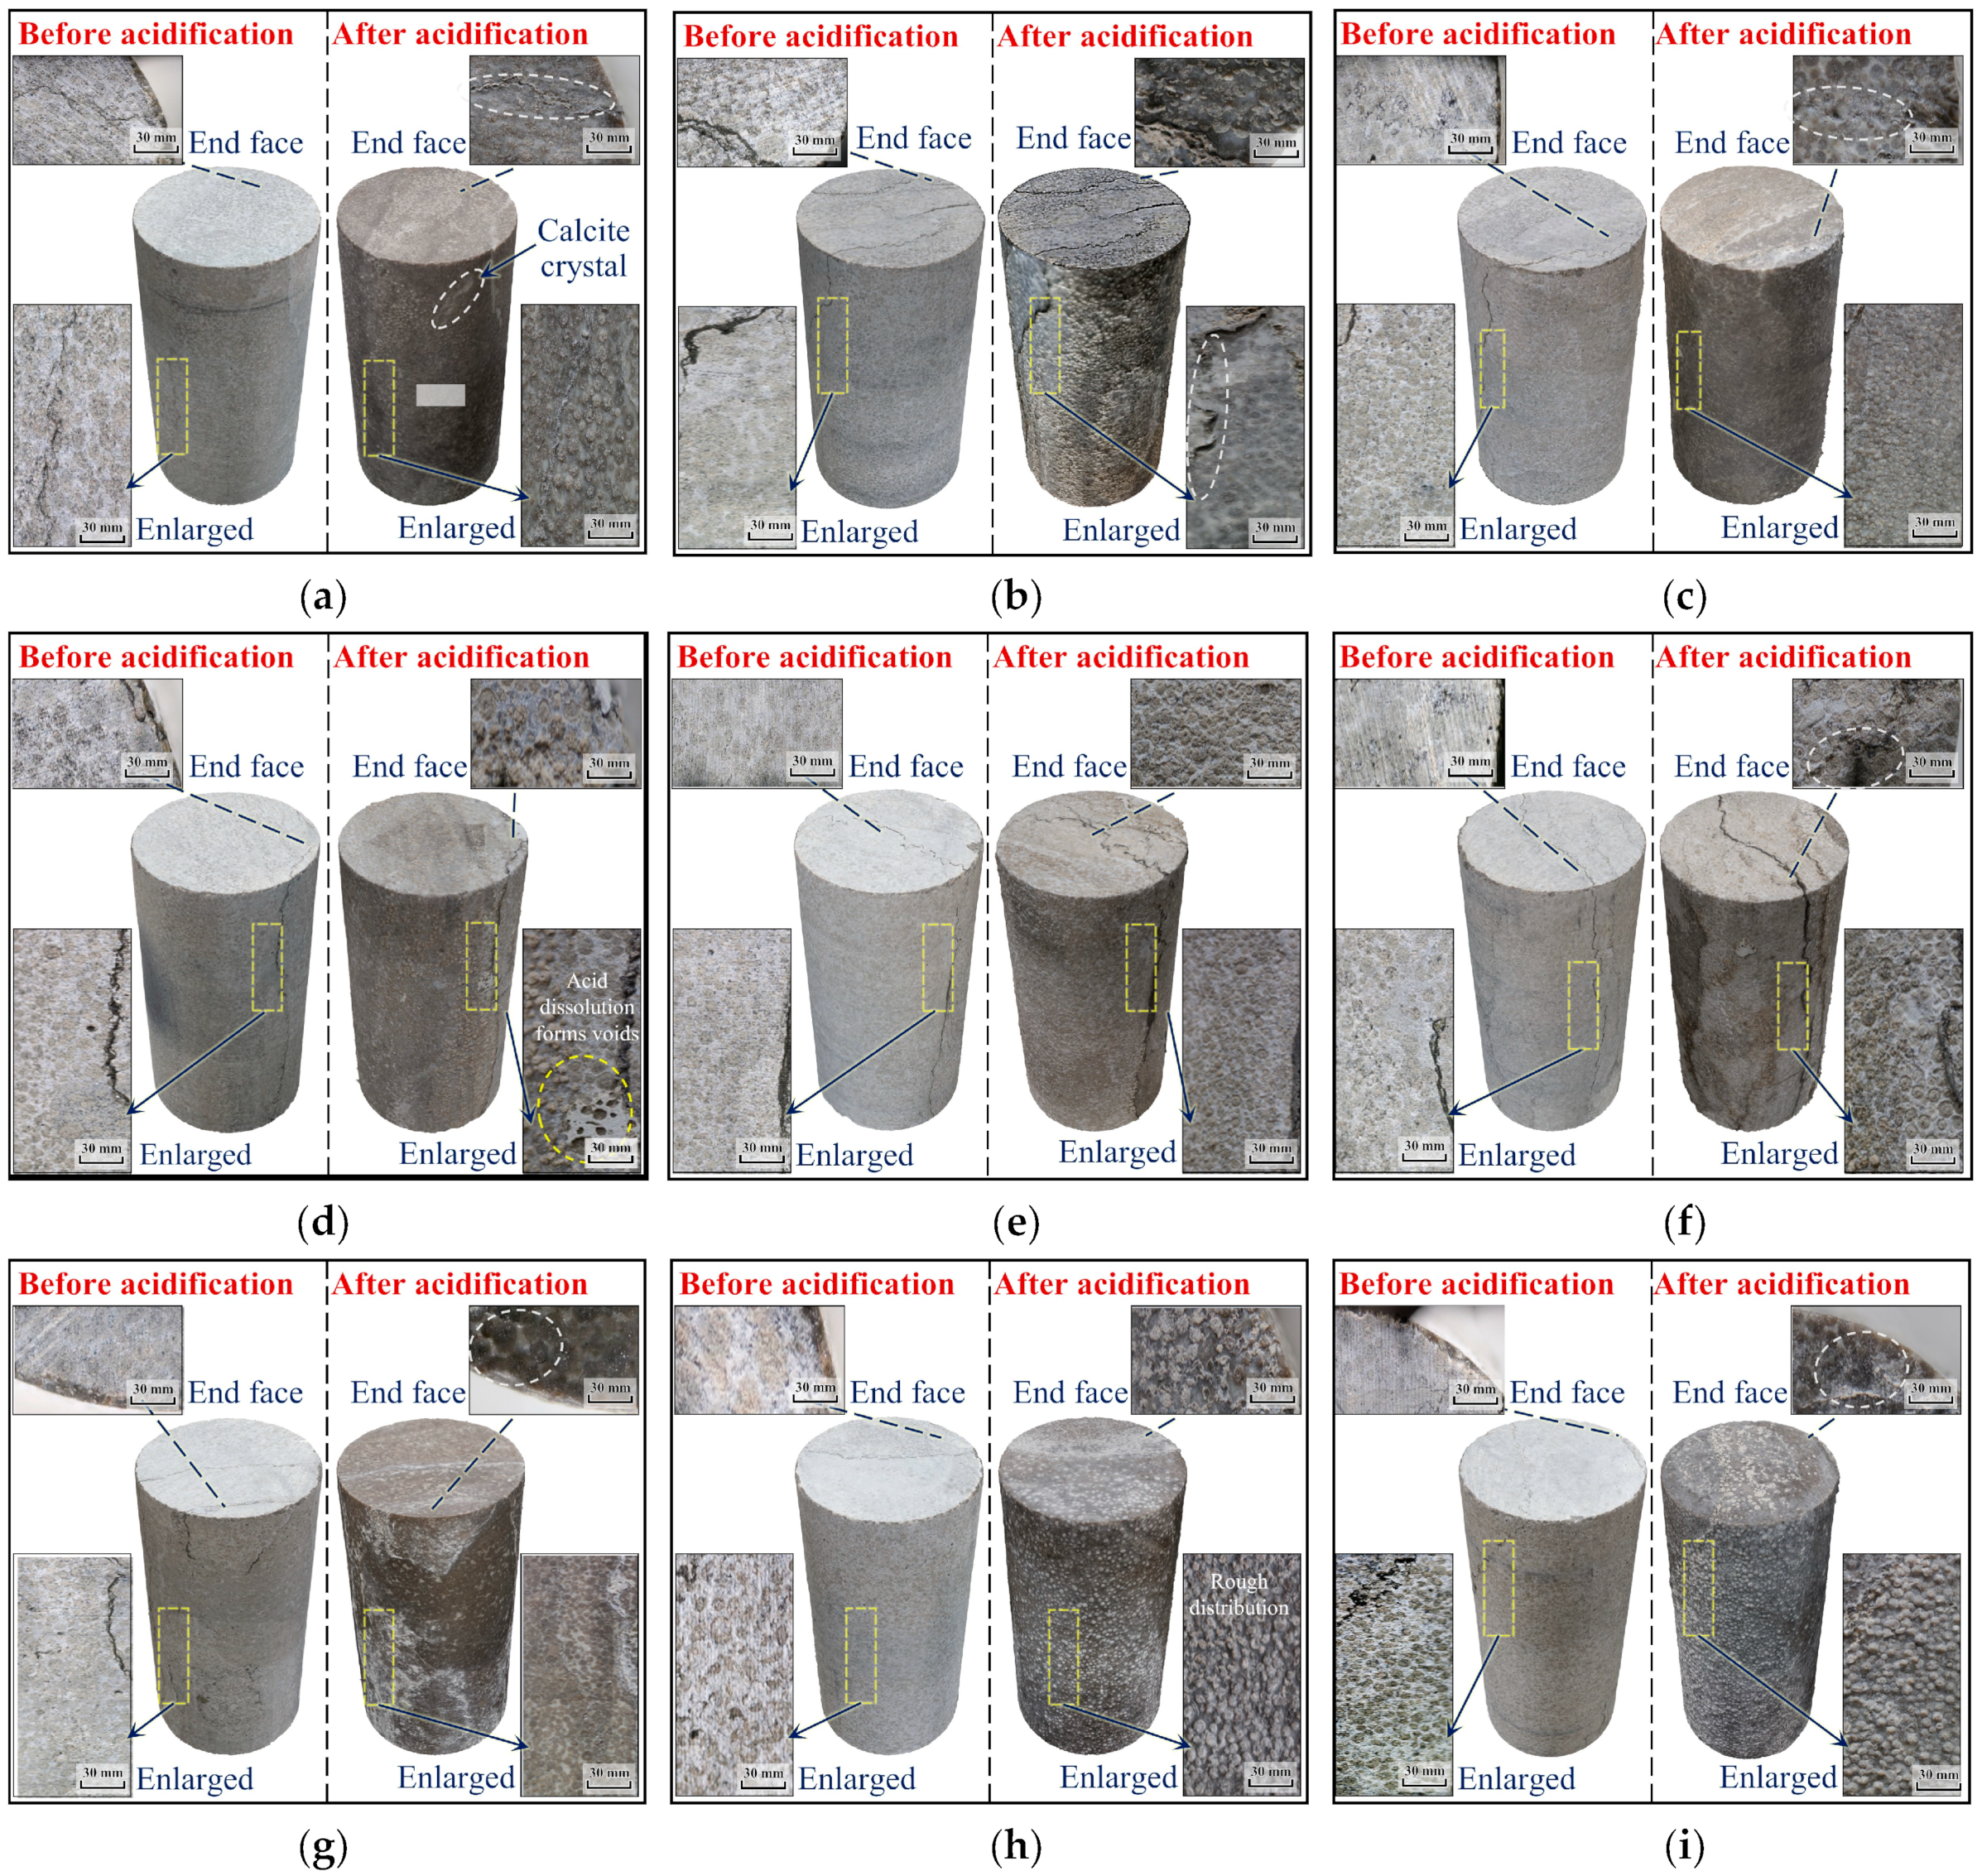
2.4. Experimental Process

To carry out the limestone acidizing reformation experiment, the limestone standard sample was dried and weighed in advance. After photographing and recording the morphological characteristics of the rock sample, the specimen was placed in the PTFE lining of the acidizing reformation experimental device. According to the scheme, the acid reaction liquid was prepared in the lining to ensure that the specimen could be completely immersed, and then the reactor cover was closed to seal the device well. The mass of the specimen and the concentration of acid solution were measured at intervals. The mass of the specimen at each time i was recorded as Mi, and the acid dissolution rate of limestone at time i was calculated according to Equation (3). According to Equation (4), the acid–rock reaction rate constant K (used to reflect the speed of the acid–rock reaction rate) was calculated. After acidification, the specimen was taken out from the device, the residual acid and residue on the surface were carefully cleaned, and then placed in a drying oven at 105 °C for 24 h. Finally, the specimen was naturally cooled to room temperature for later use.
ω i = ( M 0 M i 1 ) × 100 %
where M0 represents the initial mass of the specimen.
K = J C n
where K represents the reaction rate constant, J is the reaction rate at time t, C is the corresponding acid solution concentration at time t, and n is the reaction order.
Due to the influence of acid etching behavior of limestone, the surface of the specimen was polished and corrected in advance before the strength test, so as to ensure that the flatness and parallelism of the specimen met the standard. Two sets of strain gauges were symmetrically arranged on the central surface of the specimen at 1/2 height. Each group was composed of two foil strain gauges that were vertically distributed along the lateral and axial directions of the specimen. The substrate size of the strain gauge was 9.5 × 4.0 mm, the resistance value was 120 Ω, and the sensitivity was 2.0 mV/V. The strain gauge was connected to the static resistance strain gauge channel to monitor the axial and lateral strain values of the specimen under load. In order to reduce the influence of the end effect, grease was evenly applied to the upper and lower surfaces of the specimen. Then, the specimen was placed in the center of the test bench, and the spherical bearing plate was covered to make the specimen uniformly stressed during compression. The testing machine adopted displacement loading mode, and the loading rate was set to 0.5 mm/min. The loading system and strain gauge were started synchronously, after that, the loading was stopped until the specimen was completely destroyed. Finally, the experimental data were saved, the maximum failure load was recorded, and the mechanical parameters such as uniaxial compressive strength, strain value, and elastic modulus were calculated.

3. Orthogonal Experiment Results and Analysis

Through the acidizing reformation and strength test of hard limestone, the acid reaction data and macroscopic mechanical parameters of limestone were obtained, including the acidification indexes of the limestone acid dissolution rate ω and acid–rock reaction rate constant K, as well as the strength indexes of uniaxial compressive strength σc, elastic modulus E, peak strength corresponding to the axial strain εca, and lateral strain εcl, as detailed in Table 2. Furthermore, the influencing factors were analyzed based on the test results of the parameters.

3.1. Sensitivity Analysis

The range analysis method is widely used in the sensitivity analysis of influencing factors. The arithmetic mean values of the observed variables (limestone acidizing parameters and strength indexes) of the influencing factors (A, B, C) at different levels were obtained, respectively, and the range was calculated by the maximum and minimum mean values. The larger the range value, the greater the influence degree of the factor under the same conditions. Therefore, the influence order of factors can be determined according to the range analysis, and the optimal level of each factor can be selected. According to the mean value and range at each level, Figure 3 shows the influence of A, B, and C on the acidizing reformation and strength characteristics of limestone.
For the factor sensitivity analysis of the limestone acidizing reformation effect, it can be seen that the influence order of the factors on the acid dissolution rate ω and the acid–rock reaction rate constant K are: B (acid concentration) > A (acid type) > C (acidification time). Among them, hydrochloric acid as an acid reaction solution is more effective than other acids for limestone acidizing reformation, specifically, ω increased by 49.07% and 16.38% compared to formic acid and mud acid, and K was 129.74% and 45.14% higher than formic acid and mud acid. The limestone acidizing parameters tend to increase uniformly with increasing mass concentration, specifically, ω from 3.59% (5% concentration) to 7.18% (15% concentration) and K from 6.80 × 10⁻⁴ mol(1−n)·L(n−1)·s−1 (5% concentration) to 26.12 × 10⁻⁴ mol(1−n)·L(n−1)·s−1 (15% concentration), indicating that high concentration acid reactants have a better ability to reform limestone. When the acidification time was 120 min, the acidification effect of limestone is significantly improved compared with that of 60 min. However, when the acidification time is increased to 180 min, the degree of limestone acid etching only slightly increases, and the acid–rock reaction rate decreases. This is because the hydrogen ions ionized in the acid–rock reaction system have been consumed in large quantities after 120 min, and the concentration of reactants have significantly reduced, resulting in a decrease in the reaction rate with carbonate minerals. Correspondingly, the acid dissolution efficiency of limestone also slowed down.
For the factor sensitivity analysis of the strength characteristics of the limestone after acidification, it can be seen that the influence order of the factors on uniaxial compressive strength σc, peak axial/lateral strain εca/εcl, and elastic modulus E are also: B (acid concentration) > A (acid type) > C (acidification time). Among them, the strength parameters of limestone after formic acid reaction were the highest, followed by mud acid, and hydrochloric acid being the lowest, indicating that the strength weakening effect of hydrochloric acid on limestone after acidification was better than that of formic acid and mud acid. Specifically, σc decreased by 18.83% and 11.08%, respectively, εca decreased by 9.90% and 2.41%, respectively, εcl decreased by 12.21% and 5.08%, respectively, and E decreased by 12.26% and 5.49%, respectively. The acid concentration was positively correlated with the weakening degree of acidified limestone strength. Specifically, σc decreased from 65.96 MPa (5% concentration) to 40.29 MPa (15% concentration), εca decreased from 1.49 × 10⁻² (5% concentration) to 1.09 × 10⁻² (15% concentration), εcl decreased from 0.84 × 10⁻² (5% concentration) to 0.53 × 10⁻² (15% concentration), and E decreased from 8.23 GPa (5% concentration) to 5.93 GPa (15% concentration), indicating that the strength of limestone was more weakened after the action of high concentration acidic reactants. With the increase of acid reaction time, the strength weakening degree of limestone increased slightly. The uniaxial compressive strength, peak strain, and elastic modulus of limestone with acid reaction for 180 min were the lowest (σc was 47.81 MPa, εca was 1.22 × 10⁻², εcl was −0.64 × 10⁻², E was 6.45 GPa).

3.2. Significance Analysis

The range analysis method is widely used in the sensitivity analysis of influencing factors.
Variance analysis can be used to study whether the control variables can have a significant impact on the observed variables (dependent variables). Specifically, by analyzing the contribution of different sources of variation in the observed variables to the total variation, the significance of the influence of controllable factors on the research results is determined. Multivariate analysis of variance first identifies the observed variables and several control variables, and on this basis, gives the original hypothesis that the control variables do not have a significant impact on the observed variables. In this experiment, the total variation of each observed variable value (limestone acidizing parameters and strength index) was composed of four parts: factor A (acid type), factor B (acid mass concentration), factor C (acidification time), and the variation caused by random factor error. Therefore, the decomposition of sum of squared deviations and degree of freedom in variance analysis is:
S S T = S S A + S S B + S S C + S S e
where SST represents the sum of the total squared deviations of the observed variables; SSA, SSB, and SSC are the sum of squared deviations of factors A, B, and C, respectively; and SSe is the sum of squared deviations of the error (sum of squared deviations within the group).
d f T = d f A + d f B + d f C + d f e
where d f T represents the total degree of freedom of the observed variable; d f A , d f B , and d f C are the degrees of freedom of factors A, B, and C, respectively; and d f e is the freedom of error.
S S T = 1 r s t i = 1 r j = 1 s k = 1 t ( X i j k X ¯ ) 2 X ¯ = 1 r s t i = 1 r j = 1 s k = 1 t X i j k
S S A = s t i = 1 r ( X ¯ i · · X ¯ ) 2 = i = 1 r 1 s t X i · · 2 n X ¯ 2 X ¯ i · · = 1 s t j = 1 s k = 1 t X i j k
S S B = r t j = 1 s ( X ¯ · j · X ¯ ) 2 = j = 1 s 1 r t X · j · 2 n X ¯ 2 X ¯ · j · = 1 r t i = 1 r k = 1 t X i j k
S S C = r s k = 1 t ( X ¯ · · k X ¯ ) 2 = k = 1 t 1 r s X · · k 2 n X ¯ 2 X ¯ · · k = 1 r s i = 1 r j = 1 s X i j k
S S e = i = 1 r j = 1 s k = 1 t ( X i j k X ¯ i · · X ¯ · j · X ¯ · · k + 2 X ¯ ) 2 = S S T S S A S S B S S C
where r, s, and t represent the level numbers of factor A, B and C respectively (in this experiment, r, s, and t are all 3); Xijk is the sample value corresponding to the i level of factor A, the j level of factor B, and the k level of factor C; X ¯ is the mean value of the overall observed variables; X ¯ i · · is the mean value of the observed variables at the ith level of factor A; X ¯ · j · is the mean of the observed variables at the jth level of factor B; and X ¯ · · k is the mean of the observed variables at the kth level of the C factor.
After calculation, the analysis of variance table (Table 3) was listed, and the homogeneity of variance test (F test) was performed on the statistics. According to the comparison between the F value of each factor and the quantile F1−α at different significance levels α, if the factor F value is greater than F1−α, the null hypothesis should be rejected. It is considered that there are significant differences in the mean values of the observed variables at different levels of the factor; that is, the different levels of the factor have a significant impact on the observed variables. On the contrary, it is considered that different levels of the factor have no significant effect on the results.
Table 4 shows the significance characteristics of three influencing factors A, B, and C of limestone acidification and strength characteristics based on variance analysis. According to the significant analysis of the effect of limestone acidizing reformation, the confidence of the three influencing factors in the F test of limestone acidizing parameters (ω, K) was above 90%, indicating that the different influencing factors set up in this experiment have an impact on the characteristics of limestone acidification. Among them, the confidence of factor A and factor B was between 95% and 99%, showing that the difference of acid type and acid mass concentration had a significant impact on limestone acidizing parameters. The confidence of factor C was between 90% and 95%, showing that the acidification time had a certain influence on the limestone acidizing parameters. The significance analysis of the influencing factors of the strength characteristics of limestone after acidification showed that, consistent with the statistical results of the acidizing reformation F test, the confidence levels of the three types of influencing factors A, B, and C of the strength indices of acidified limestone were also above 90%. Among them, the level difference of acid mass concentration had a very significant effect on the strength indices of acidified limestone. The level difference of acid type and acidification time had a significant effect and a certain effect on the strength indices, respectively. The acidification time also had a certain effect. In general, the effect of acid mass concentration on the acidification and strength weakening of limestone was particularly significant.

4. Evaluation Analysis of Limestone Acidizing Reformation and Strength Characteristics

4.1. Model Establishment

Based on the results of factor sensitivity and significance analysis, it was confirmed that factors A, B, and C as parameter variables had a significant impact on the evaluation index of limestone acidification and strength characteristics, and the relationship between each factor and different response values did not satisfy the general linear law. Therefore, the nonlinear multivariate polynomial solution was used to determine the relationship between the response parameters and the level values of each factor, and then the multiple regression model of limestone acidification and strength characteristics considering the influencing factors of the acid reaction system was established. The model can evaluate and predict the strength of acidified limestone, determine the optimal level of factors through model optimization, and analyze the acidification and strength response under different parameter combinations.
As the establishment of the regression model needs to quantify the acid type of the influencing factors, the definition of the acidity coefficient pKa in the acid–base proton theory was introduced to characterize the degree of difficulty in converting acid into hydrated hydrogen ion H3O+ and conjugated base by proton transfer, which can be used to reflect the strength of acid solution. The smaller the pKa value is, the stronger the acidity is. The pKa values of hydrochloric acid, formic acid, and mud acid selected in this experiment were –8.00, 3.75, and 0.346, respectively. Combined with the relationship between the response value of limestone acidification and strength characteristics with the change of each factor level in the sensitivity analysis, there was a nonlinear relationship between factors A, B, and C on different response values, and, in addition, there was an interaction effect between factors B and C (acid mass concentration decreases with acidification time). In summary, the multiple nonlinear regression model based on the least squares method was established:
y = β 0 + β 1 x 1 + β 2 x 2 + β 3 x 3 + β 4 x 1 2 + β 5 x 2 2 + β 6 x 3 2 + β 7 x 2 x 3
where y represents the response value of the regression equation, βi is the regression coefficient of least squares estimation (i = 0, 1, 2, 3, 4), and x1, x2, and x3 are the assignment of factors A, B, and C, respectively.
The regression analysis was carried out based on the results in Table 2, and according to the principle of the least square method, the parameter value that minimizes the sum of squared deviations of the function was selected as the estimation of the regression coefficient. The results of the obtained regression model parameters are shown in Table 5. The regression model analysis showed that the effect of limestone acidizing was negatively correlated with factor A; that is, the greater the acidity coefficient, the weaker the acidity, resulting in a decrease in the degree of acid dissolution and acid–rock reaction rate. It was positively correlated with factors B, C, and their interaction, showing that the greater the acid mass concentration or the longer the acid–rock reaction time, the more favorable the full interaction between more acid ions and limestone minerals in the reaction system, which strengthens the acid etching ability and efficiency. The correlation between the coefficient of the strength characteristic model of limestone after acidification was opposite to the result of acidification; that is, it was positively correlated with factor A, and negatively correlated with factor B, C, and the interaction, showing that the acid with a smaller acidity coefficient had a greater degree of weakening of the mechanical properties of limestone. At the same time, the content and time of reaction acid were beneficial to rock damage, which weakened the ability of limestone to resist deformation, and also confirmed that acidification will promote the deterioration of limestone strength.

4.2. Model Validation

The credibility of the model was tested, and the goodness of fit of the regression model with different evaluation indexes for the observed values was obtained. The statistical measure of goodness of fit is called the coefficient of determination R2, which is the overall relationship between the dependent variable and all the independent variables. R2 is equal to the ratio of the regression sum of squares in the total sum of squares; that is, the percentage of the variability of the dependent variable that the regression model can explain. Table 6 is the credibility test of each index, and it can be seen that the calculated value R2 of the goodness of fit of each evaluation index model is close to 1, indicating that the credibility of the regression model was high, and the regression model fitted the observed value better.
In addition, the model was verified by the research results of Huang et al. [10]. The test results of Huang’s repetitive experimental schemes 7 to 9 on limestone acidification reformation were selected. The test reaction acid was 10% hydrochloric acid and the reaction time was 360 min. As it was a repetitive experiment, the average value of the experimental results of each measured parameter were calculated and compared with the model output, and the results are shown in Table 7. It can be seen that the relative error between the acidification experimental results and the model outputs was within 10%. The credibility test and experimental verification confirmed that the obtained limestone reformation and strength evaluation model based on acidic effect was reliable.

4.3. Optimal Analysis of the Model

In order to explore the optimal level of influencing factors of the strength weakening effect after limestone acidification, it is urgent to analyze the optimal value of the model. It can be seen from Table 5 that the acidification strength model is a quaternary high-order equation, which is not suitable for general partial derivative solution and local optimization method. A simulated annealing (SA) algorithm is an optimization algorithm based on Metropolis iterative solution strategy. The algorithm has probabilistic global optimization performance in theory. It has been widely used in control engineering, machine learning, neural network, and other engineering fields [30]. The essence of the SA algorithm is based on the physical principle of solid annealing where the internal energy of the solid in the high temperature state is large. At this time, the internal particles of the solid are in a fast disordered motion behavior. In the process of slowly decreasing the temperature, the internal energy of the solid will decay, and the internal particles will gradually become orderly, until the internal energy of the solid reaches the minimum at room temperature, and the particles are in a stable ground state.
In this study, the process of parameter optimization based on the SA algorithm was the process of finding the minimum value of the objective function in the solution space (the minimum value of the strength after acidification). The starting point of the algorithm was based on the similarity between the annealing process of the solid material in physics and the optimization of the strength weakening effect after the acidification of limestone. A higher initial value (set initial temperature) is given to the acidification strength model by the SA algorithm, with the continuous decline (cooling) of the control parameters, combined with the Metropolis criterion as the probability jump criterion to randomly find the solution (particle state) of the objective function in the solution space (state space). That is, it can jump out of the local optimal solution interval and eventually tend to the global optimal solution (minimum energy). Equation (13) is the specific probability jump algorithm, and the optimization problem min f(i) is set, where S is the set of feasible solutions of the objective function f(i). If a new solution j is generated from the current solution I; whether i is accepted as the current solution is determined by the transition probability shown. Therefore, it can ensure a higher solution accuracy under the condition of satisfying the function constraints.
P t ( i j ) =   1 f ( i ) < f ( j )   exp f ( i ) f ( j ) T f ( i ) f ( j )
where T represents the control parameter, which is used to simulate the temperature in the SA algorithm, set at an initial value T0 of 100, then slowly decreased to Tk (k = 1, 2,…). Each T value needs to perform the Lk times Metropolis criterion, and then transition to the next control parameter Tk+1. That is, to fully simulate the molecular thermal motion and detect the region with search potential, the number of iterations Lk was 1000.
The acidification strength model was introduced into the SA algorithm by MATLAB programming, and the annealing attenuation coefficient α was set to 0.95. The SA algorithm is independent of the initial value, and the solution obtained by the algorithm is independent of the initial solution state (the starting point of the algorithm iteration). Therefore, the initial value is random, and the boundary conditions need to be determined. According to the actual engineering background and acid–rock reaction characteristics, the boundary value conditions of independent variable parameters were determined, in which the value interval of acidity coefficient x1 was −10 to 10 (between perchloric acid HClO4 and silicic acid H2SiO3), the value interval of acid mass concentration x2 was 0% to 20%, and the value interval of acidification time x3 was 0 min to 300 min. The iterative calculation of the model shows that the minimum compressive strength output of limestone after acidification was 28.28 MPa, the elastic modulus was 4.27 GPa, the corresponding acidity coefficient was −6.45, the acid mass concentration was 15.06%, and the acidification time was 249.41 min.
Figure 4 shows the response surface of acidified limestone strength under different acid reaction parameter combinations based on the limestone acidification strength model. It can be found that regardless of the acidity coefficient and acid reaction time, the acidified limestone strength σc decreased with the increase of the acid mass concentration. Therefore, the acid mass concentration is the optimal parameter of σc, which is consistent with the conclusion of the above factor significance analysis. The change of σc with the acidity coefficient was stronger than that of acidification time, and the response trend of σc was more obvious when the acidity coefficient exceeded 0 (weak acid). The change level of σc decreased when the acidity coefficient was between −5 and −10. In addition, the decrease rate of σc was faster in the early stage of limestone acid reaction (acidification time from 0 min to 120 min). With the extension of the acidification reaction time, the trend of σc gradually tended to be stable, and basically remaind constant after 240 min.

5. Analysis of Acidification Control Mechanism of Hard Limestone Strata

To discuss the influence of acidification control on limestone strata, it is necessary to first understand the essence of macroscopic fracture of limestone strata under external force. According to Griffith strength theory [31], the failure of brittle rock depends on the stress state around the microcracks in rock. Therefore, the essence of macroscopic fracture of hard limestone strata is the mechanical behavior and damage activity of mineral crystals under load, which is mainly reflected in the dislocation movement of grains in limestone polycrystals. In fact, due to the existence of the Hall–Petch relationship in microscopic crystals, the effect of external force on limestone polycrystals not only needs to overcome the hindering slip stress, but also produce dislocation pile-up in the mineral grains of polycrystals [32]. This part of the force mainly acts on dislocations, so that the grains can maintain equilibrium in the pile-up group. Specifically, under the action of applied stress, the dislocation source in the most favorable position of the mineral grain in the limestone crystal first starts. Due to the strong hindrance effect of the grain boundary on the dislocation movement, the leading dislocation emitted by the dislocation source encounters resistance after approaching the grain boundary and stops moving. Subsequently, the emitted dislocation will accumulate on the slip surface of the favorable position in turn to form the dislocation pile-up phenomenon. As shown in Figure 5, stress concentration occurs at the top of the pile-up of grain 1 and penetrates through the grain boundary. When the critical stress required for the dislocation activation of adjacent grain 2 is reached, the adjacent grain 2 activates again near the grain boundary dislocation, and the dislocation pile-up is formed in grain 2 and drives the dislocation in the next grain to activate. In this way, the limestone crystal is deformed under the cycle. The essence of crack initiation and propagation in limestone is that the stress accumulation at the dislocation pile-up in the grain boundary reaches a critical value, causing intergranular separation or cleavage development. Under the external force, the potential energy accumulated in the hard limestone rock mass gradually expands (local fracture) after exceeding the critical value. Multiple cracks collude with each other to form the macroscopic failure of rock mass. Therefore, the initiation and propagation of microcracks in hard limestone polycrystals is the key to the failure of rock strata.
According to the model, the acid reaction parameters involved weakened the mechanical characteristics of limestone, and the strength response law after acidification obtained by the model also confirms the effectiveness of acidification control of hard limestone strata. The essence of the strength deterioration of acidified limestone lies in the influence of the acidic effect on the crystal structure of minerals. The acidic effect causes multiple crystal defects in limestone minerals, which are more prone to induce the rapid expansion of microcracks under external force. This phenomenon can be confirmed by the acid corrosion morphology of hard limestone surface under different acid treatment conditions (Figure 6). It can be seen from the AO-5870 electron microscope of AOSVI company that under the local magnification of 50 times, the surface of limestone before acidification is smooth and has few primary fissures, and the limestone mineral composition is dominated by calcite minerals with lighter color and doped with some darker dolomite minerals. Due to the close cementation of mineral particles on the surface of natural limestone, and the high density of mineral particles at the meso-level, the overall distribution is continuous and uniform, so the natural limestone has a fine texture and good structural integrity. After acidification, the surface morphology of limestone tends to be complex and rough, and the dissolution traces of minerals by acid reaction are obvious. There are fissures and gullies along the boundary between the minerals (circled in white), and the exposed transparent calcite crystals are clearly visible on the surface of some specimens. Therefore, under the acidic effect, many minerals in limestone are dissolved to form voids, which change the original continuous cementation structure, and some areas produce flake subsidence due to the large-scale acidic effect, so that the mineral grains show irregular distribution. In summary, the acidic effect promotes the destruction of the crystal structure of limestone minerals and forms a range of defects, which are more likely to induce the initiation and expansion of mineral crystals under load. The deformation degree required for the destruction of internally damaged limestone is reduced, and the bearing capacity of hard limestone strata is weakened.
In addition, the high strength of hard limestone is the reason why the strata are difficult to control; the fracture cracks of deep rock masses are also easy to re-close under the action of strong ground stress. Due to the difference of acid reactions between various minerals contained in limestone, the cracks in limestone can maintain a certain degree of opening under acidic effects, which effectively improves this phenomenon. Carbonate minerals basically account for more than 90% of the limestone mineral components, among which are mainly calcite minerals and dolomite minerals. Limestone acidification does not produce new mineral species, but the reaction efficiency of calcite (CaCO3) and dolomite (CaMg(CO3)2) is different. Figure 7 shows that the two minerals have similar lattice models (both belong to the trigonal system) and contain the same cation valence and charge number. However, according to the Born–Lander lattice energy formula, the ionic bond strength is inversely proportional to the ionic radius, so the bond energy of dolomite with larger cationic particle size is lower than that of calcite, and the corresponding lattice structure is more compact and stable. The dolomite with a chemical bond that is difficult to break has a lower reaction efficiency with acid, while the acid reaction process of calcite is more efficient. Therefore, during the process of slow acid etching of dolomite crystals in limestone, the surrounding calcite crystals have obvious defects under the influence of large-scale acidification. This phenomenon promotes the formation of an uneven corrosion surface in the limestone rock mass, and the acid corrosion cracks in the rock mass can still maintain a certain degree of opening even under the action of load, effectively preventing the occlusion of the rock blocks on both sides of the cracks, which is more conducive to the weakening and destruction of the hard limestone strata.

6. Conclusions

In this paper, through the orthogonal simulation test of hard limestone acidification, the variation of limestone reaction parameters and strength indexes under different acidification factors were analyzed. The optimized acid reaction system suitable for hard limestone weakening is given, and the damage mechanism of the acidic effect on hard limestone strata was discussed. The following conclusions are drawn.
(1)
The influence order of various factors on the acid reaction results and strength indexes of limestone under acidic effect was confirmed: mass concentration > acid type > acidification time. The level difference of acid concentration had a particularly significant effect on the acidification and strength weakening of limestone. The reason is that an appropriate increase in acid concentration supplements the reaction amount of active ions in the system, and the large-scale acid action is more conducive to promoting the limestone to generate defects and weakening.
(2)
The evaluation model of limestone reformation and strength weakening based on acid reaction parameters was established, and the validity was demonstrated according to the credibility test and model verification. The SA algorithm is used to give the optimal acidification system suitable for the strength weakening of hard limestone: the acidity coefficient is −6.45, the acid mass concentration is 15.06%, and the acidification time is 249.41 min. Through the optimal analysis of the model, it was concluded that strength response trend is more obvious when the acidity coefficient exceeds 0 (weak acid), and the strength weakening behavior for limestone acidification time from 0 min to 120 min is the most prominent.
(3)
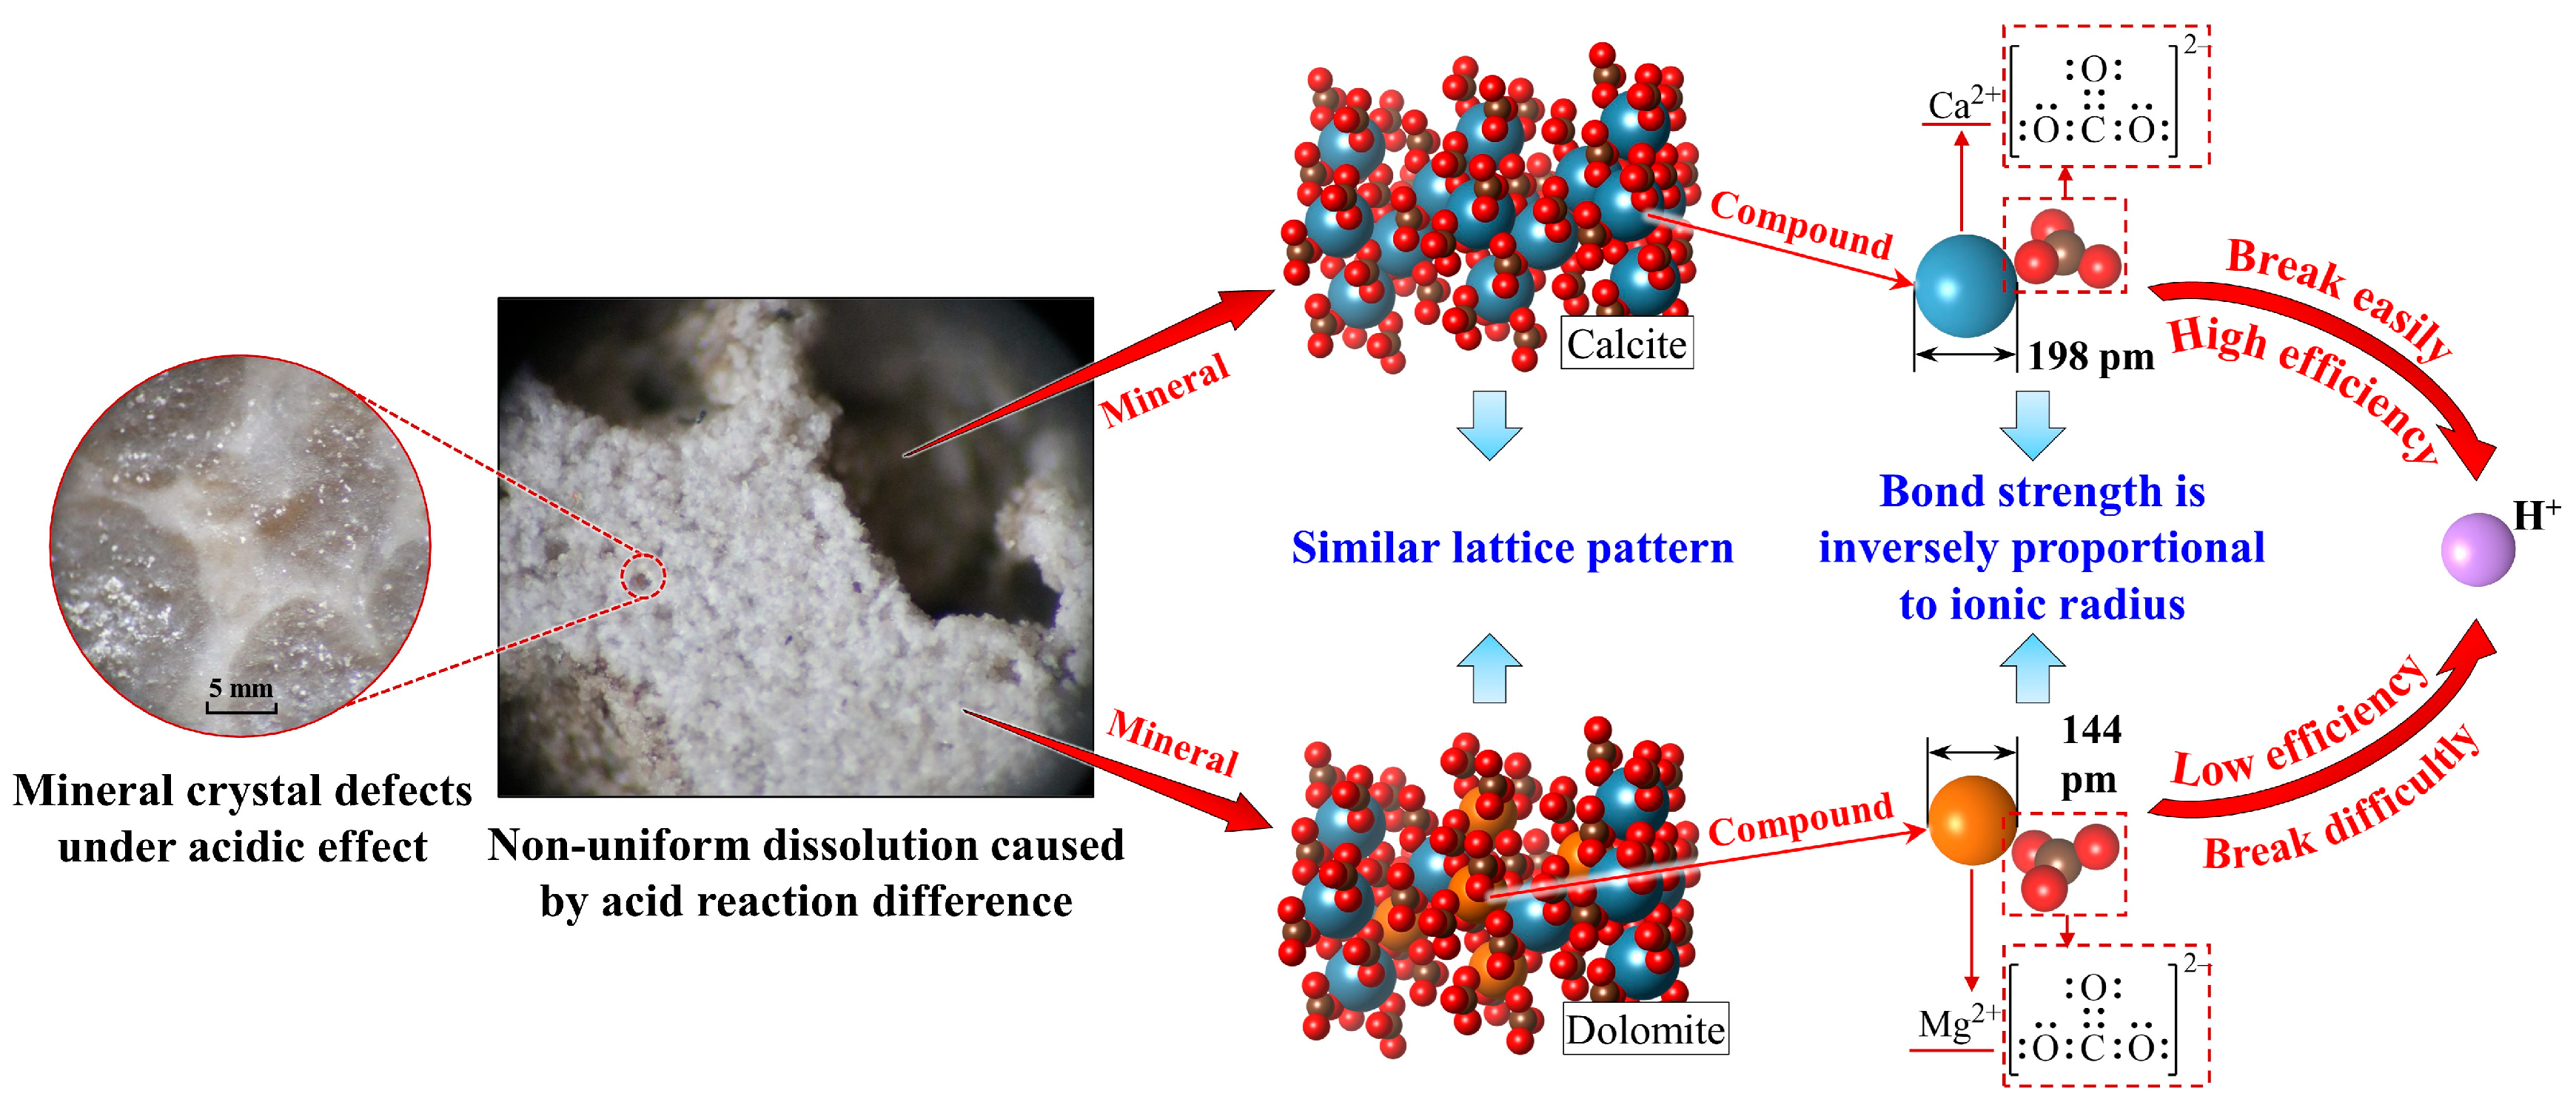
The acidification control mechanism of hard limestone strata was revealed to be the change of mineral crystal characteristics. The acidic effect is beneficial to improve the shortcomings of high strength of hard limestone rock mass and easy closure of cracks in deep underground mining. On the one hand, the crystal defects caused by the acidic effect can induce the initiation and propagation of mineral microcracks under load, and the bearing capacity of the internal damaged limestone rock mass is weakened macroscopically. On the other hand, the acid reaction difference of various minerals will promote the fracture to maintain a certain degree of opening under in situ stress and reduce the occlusion of rock blocks on both sides of the fracture, which is conducive to the destruction of hard limestone strata.

Author Contributions

Conceptualization, M.H. and B.H.; methodology, X.Z.; software, M.H. and X.J. (Xuejie Jiao); validation, X.J. (Xufei Jiang), and Z.S.; formal analysis, M.H.; investigation, M.H; resources, B.H. and X.Z.; data curation, M.H.; writing—original draft preparation, M.H.; writing—review and editing, B.H. and X.Z.; visualization, X.J. (Xuejie Jiao); supervision, X.J. (Xufei Jiang), and Z.S.; project administration, B.H.; funding acquisition, B.H. and X.Z. All authors have read and agreed to the published version of the manuscript.

Funding

This research was supported by the National Key Research and Development Program of China (2021YFC2902102), and the Young Talent Support Project of Jiangsu Association for Science and Technology (JSTU-2022-066).

Data Availability Statement

Data associated with this research are available and can be obtained by contacting the first author.

Acknowledgments

The authors would like to thank the hydraulic fracturing team of the State Key Laboratory of Coal Resources and Safe Mining, China University of Mining and Technology, for their assistance.

Conflicts of Interest

The authors declare no conflict of interest.

References

  1. Xie, C.; Nguyen, H.; Bui, X.N.; Nguyen, V.T.; Zhou, J. Predicting roof displacement of roadways in underground coal mines using adaptive neuro–fuzzy inference system optimized by various physics–based optimization algorithms. J. Rock Mech. Geotech. 2021, 13, 1452–1465. [Google Scholar] [CrossRef]
  2. Li, J.; Liu, S.; Ren, W.; Liu, H.; Li, S.; Yan, K. Research on Engineering Practice and Effect Evaluation Method of Pressure Relief in Deep Rock Burst Danger Area of Coal Mine. Minerals 2023, 13, 570. [Google Scholar] [CrossRef]
  3. Zhang, Q.; Wang, E.; Feng, X.; Wang, C.; Qiu, L.; Wang, H. Assessment of Rockburst Risk in Deep Mining: An Improved Comprehensive Index Method. Nat. Resour. Res. 2021, 30, 1817–1834. [Google Scholar] [CrossRef]
  4. Xie, P.; Hower, J.C.; Nechaev, V.P.; Ju, D.; Liu, X. Lithium and redox–sensitive (Ge, U, Mo, V) element mineralization in the Pennsylvanian coals from the Huangtupo coalfield, Shanxi, northern China: With emphasis on the interaction of infiltrating seawater and exfiltrating groundwater. Fuel 2021, 300, 120948. [Google Scholar] [CrossRef]
  5. Pan, C.; Xia, B.; Zuo, Y.; Yu, B.; Ou, C. Mechanism and control technology of strong ground pressure behaviour induced by high–position hard roofs in extra–thick coal seam mining. Int. J. Min. Sci. Technol. 2022, 32, 499–511. [Google Scholar] [CrossRef]
  6. Wang, F.; Tu, S.; Yuan, Y.; Feng, Y.; Chen, F.; Tu, H. Deep–hole pre–split blasting mechanism and its application for controlled roof caving in shallow depth seams. Int. J. Rock Mech. Min. Sci. 2013, 64, 112–121. [Google Scholar] [CrossRef]
  7. Xu, J.; Zhu, W.; Xu, J.; Wu, J.; Li, Y. High–intensity longwall mining–induced ground subsidence in Shendong coalfield, China. Int. J. Rock Mech. Min. Sci. 2021, 141, 104730. [Google Scholar] [CrossRef]
  8. Chen, D.; Li, N.; Wang, E.Y. Reliability Assessment of the Hydraulic Fracturing Process in Coal Mine Based on the Analysis of Micro–Seismic Source Parameters. Nat. Resour. Res. 2021, 30, 2317–2332. [Google Scholar] [CrossRef]
  9. Zhang, X.; Pak, R.Y.; Gao, Y.; Liu, C.; Zhang, C.; Yang, J.; He, M. Field experiment on directional roof presplitting for pressure relief of retained roadways. Int. J. Rock Mech. Min. Sci. 2020, 134, 104436. [Google Scholar] [CrossRef]
  10. Huang, B.; Hou, M.; Zhao, X.; Xing, Y. Experimental investigation on the reformation and strength weakening of hard limestone by acidizing. Int. J. Min. Sci. Technol. 2022, 32, 965–979. [Google Scholar] [CrossRef]
  11. Mustafa, A.; Aly, M.; Aljawad, M.S.; Dvorkin, J.; Solling, T.; Sultan, A. A green and efficient acid system for carbonate reservoir stimulation. J. Petrol. Sci. Eng. 2021, 205, 108974. [Google Scholar] [CrossRef]
  12. Jafarpour, H.; Aghaei, H.; Litvin, V.; Ashena, R. Experimental optimization of a recently developed matrix acid stimulation technology in heterogeneous carbonate reservoirs. J. Petrol. Sci. Eng. 2021, 196, 108100. [Google Scholar] [CrossRef]
  13. Ali, M.; Ziauddin, M. Carbonate acidizing: A mechanistic model for wormhole growth in linear and radial flow. J. Petrol. Sci. Eng. 2020, 186, 106776. [Google Scholar] [CrossRef]
  14. Nierode, D.; Kruk, K. An evaluation of acid fluid loss additives retarded acids, and acidized fracture conductivity. In Proceedings of the Fall Meeting of the Society of Petroleum Engineers of AIME, Las Vegas, NV, USA, 30 September–3 October 1973. [Google Scholar]
  15. Sarmah, A.; Ibrahim, A.F.; Nasr–El–Din, H.; Jackson, J. A new cationic polymer system that improves acid diversion in heterogeneous carbonate reservoirs. SPE J. 2020, 25, 2281–2295. [Google Scholar] [CrossRef]
  16. Shi, W.; Yao, Y.; Cheng, S.; Shi, Z. Pressure transient analysis of acid fracturing stimulated well in multilayered fractured carbonate reservoirs: A field case in Western Sichuan Basin, China. J. Petrol. Sci. Eng. 2020, 184, 106462. [Google Scholar] [CrossRef]
  17. Gangi, A.F. Variation of whole and fractured porous rock permeability with confining pressure. Int. J. Rock Mech. Min. Sci. Geomech. Abstr. 1978, 15, 249–257. [Google Scholar] [CrossRef]
  18. Walsh, J. Effect of pore pressure and confining pressure on fracture permeability. Int. J. Rock Mech. Min. Sci. Geomech. Abstr. 1981, 18, 429–435. [Google Scholar] [CrossRef]
  19. Tsang, Y.W.; Witherspoon, P. Hydromechanical behavior of a deformable rock fracture subject to normal stress. J. Geophys. Res.-Sol. Earth 1981, 86, 9287–9298. [Google Scholar] [CrossRef]
  20. Gong, M.; Lacote, S.; Hill, A. New model of acid–fracture conductivity based on deformation of surface asperities. SPE J. 1999, 4, 206–214. [Google Scholar] [CrossRef]
  21. Mou, J.; Zhu, D.; Hill, A.D. Acid–etched channels in heterogeneous carbonates—A newly discovered mechanism for creating acid–fracture conductivity. SPE J. 2010, 15, 404–416. [Google Scholar] [CrossRef]
  22. Jirankova, E.; Konicek, P. Ground surface uplift during hardcoal longwall mining. Int. J. Rock Mech. Min. Sci. 2022, 153, 105099. [Google Scholar] [CrossRef]
  23. Wang, B.; Feng, G.; Gao, Z.; Ma, J.; Zhu, S.; Bai, J.; Li, Z.; Wu, W. Study on the Mechanism and Prevention of Frequent Mine Seismic Events in Goaf Mining under a Multi-Layer Thick Hard Roof: A Case Study. Minerals 2023, 13, 852. [Google Scholar] [CrossRef]
  24. Qian, D.; Jiao, H.; Deng, J.; Yang, J.; Jiao, M.; Xian, G.; Yu, C.; Zhu, Y.; Liu, J.; Huang, S.; et al. Instability Mechanism, Pressure Relief, and Long Anchorage Control Countermeasures for Surrounding Rock of Strong Mining Roadway at Large Mining Height Working Face. Minerals 2023, 13, 391. [Google Scholar] [CrossRef]
  25. Liu, X.; Fan, D.; Tan, Y.; Ning, J.; Song, S.; Wang, H.; Li, X. New detecting method on the connecting fractured zone above the coal face and a case study. Rock Mech. Rock Eng. 2021, 54, 4379–4391. [Google Scholar] [CrossRef]
  26. Wei, C.; Zhang, C.; Canbulat, I.; Huang, W. Numerical investigation into impacts of major fault on coal burst in longwall mining—A case study. Int. J. Rock Mech. Min. Sci. 2021, 147, 104907. [Google Scholar] [CrossRef]
  27. Mi, C.; Zuo, J.; Sun, Y.; Zhao, S. Investigation on Rockburst Mechanism Due to Inclined Coal Seam Combined Mining and its Control by Reducing Stress Concentration. Nat. Resour. Res. 2022, 31, 3341–3364. [Google Scholar] [CrossRef]
  28. Zhang, W.Q.; Lv, C. Effects of mineral content on limestone properties with exposure to different temperatures. J. Petrol. Sci. Eng. 2020, 188, 106941. [Google Scholar] [CrossRef]
  29. Cengel, Y.A.; Boles, M.A.; Kanoğlu, M. Thermodynamics: An Engineering Approach; McGraw–Hill Education Press: New York, NY, USA, 2011. [Google Scholar]
  30. Abdel–Basset, M.; Ding, W.P.; El–Shahat, D. A hybrid Harris Hawks optimization algorithm with simulated annealing for feature selection. Artif. Intell. Rev. 2021, 54, 593–637. [Google Scholar] [CrossRef]
  31. Griffith, A.A. The phenomena of rupture and flow in solids. Philos. Trans. R. Soc. Lond. Ser. A 1921, 221, 163–198. [Google Scholar]
  32. Liu, G.; Winwood, S.; Rhodes, K.; Birosca, S. The effects of grain size, dendritic structure and crystallographic orientation on fatigue crack propagation in IN713C nickel–based superalloy. Int. J. Plast. 2020, 125, 150–168. [Google Scholar] [CrossRef]
Figure 1. Limestone specimens.
Minerals 13 01101 g001
Figure 2. Experimental devices, (a) acidification reaction device and (b) rock strength characteristic test system.
Minerals 13 01101 g002
Figure 3. Influence of various factors on limestone acidification and strength characteristics.
Minerals 13 01101 g003
Figure 4. Strength response surface of acidified limestone under different acid reaction parameter combinations, (a) 5% mass concentration; (b) 10% mass concentration; (c) 15% mass concentration.
Minerals 13 01101 g004
Figure 5. Diagram of dislocation pile-up.
Minerals 13 01101 g005
Figure 6. Acid etching characteristics of hard limestone, (a) Specimen 1; (b) Specimen 2; (c) Specimen 3; (d) Specimen 4; (e) Specimen 5; (f) Specimen 6; (g) Specimen 7; (h) Specimen 8; (i) Specimen 9.
Minerals 13 01101 g006
Figure 7. Non-uniform dissolution principle of limestone minerals under the acidic effect.
Minerals 13 01101 g007
Table 1. Factors and levels of the orthogonal experimental design.
FactorA: Acid TypeB: Acid Concentration (%)C: Acidification Time (min)
Level
1Hydrochloric acid (HCl)560
2Formic acid (HCOOH)10120
3Mud acid (4%–12%HCl + 1%–3%HF)15180
Table 2. Results of the orthogonal experiment.
No.Factorsω/%K/mol(1−n)·
L(n−1)·s−1·10−4
σc/MPaεca/10−2εcl/10−2E/GPa
AB/%C/minNull
111113.698.5163.011.46−0.837.97
212226.6534.0441.941.17−0.565.94
313339.0736.2232.191.01−0.485.2
421232.923.6371.501.59−0.898.81
522315.2920.8047.861.25−0.636.23
623124.819.8649.591.20−0.616.74
731324.168.2463.381.41−0.817.91
832134.8613.7751.761.25−0.656.47
933217.6532.2739.091.07−0.515.84
Table 3. Analysis of variance table.
SourceSum of Squared Deviations SSDegree of
Freedom df
Mean Square MSF-Value
ASSAdfA = r − 1MSA = SSA/dfAFA = MSA/MSe
BSSBdfB = s − 1MSB = SSB/dfBFB = MSB/MSe
CSSCdfC = t − 1MSC = SSC/dfCFC = MSC/MSe
ErrorSSedfe = dfTdfAdfBdfCMSe = SSe/dfe
Total TSSTdfT = n − 1
Table 4. Significance analysis of influencing factors of limestone acidification and strength characteristics.
Observation VariableSource of VarianceSum of Squared Deviations SSDegree of Freedom dfMean Square MSF-Value
Acid dissolution rate ωA6.84723.42324.084 *
B19.39929.69968.240 *
C4.79322.39616.861 °
Error0.28420.142
Total2.4608
Acid–rock reaction rate constant KA331.0122165.50619.297 *
B642.2762321.13837.444 *
C282.9192141.46016.494 °
Error17.15328.577
Total1273.3608
Uniaxial compressive strength σcA168.958284.47927.681 *
B1059.2472529.624173.539 **
C73.425236.71212.029 °
Error6.10423.052
Total1307.7348
Peak axial strain εcaA0.02920.01526.959 *
B0.24120.120221.286 **
C0.01020.0059.143 °
Error0.00120.001
Total0.2818
Peak lateral strain εclA0.01120.00624.571 *
B0.15520.078333.000 **
C0.00520.00311.286 °
Error0.00020.000
Total0.1738
Elastic modulus EA1.19920.60021.241 *
B9.45424.727167.434 **
C0.58820.29410.421 °
Error0.05620.028
Total11.2998
** indicates extremely significant effect (F > F0.01(2,2)), * indicates significant effect (F0.05(2,2) < F < F0.01(2,2)), ° indicates certain effect (F0.1(2,2) < F < F0.05(2,2)). F-test threshold: F0.01(2,2) = 99, F0.05(2,2) = 19, F0.1(2,2) = 9.
Table 5. Regression model coefficient and reliability test.
Evaluating Indicatorβ0β1β2β3β4β5β6β7
Acidizing reformationω0.010 −0.256 0.384 1.569 −0.025 −0.009 −0.360 0.074
K (10−4)−36.082 −1.556 6.570 12.970 −0.098 −0.264 −2.577 0.325
Strength characteristicsσc104.3811.143−6.977−7.3500.0730.2361.373−0.155
εca (10−2)2.014 0.021 −0.096 −0.114 0.002 0.003 0.014 0.002
εcl (10−2)−1.292 −0.012 0.094 0.032 −0.001 −0.003 0.002 −0.001
E12.4540.109−0.864−0.7250.0110.0340.172−0.024
Table 6. Credibility test of the model.
Regression ModelRegression Sum of SquaresResidual Sum of SquaresR2
Acidizing reformationy (ω)32.5020.0170.999
y (K)1288.44952.5770.959
Strength characteristicsy (σc)1309.2016.7710.995
y (εca)0.2830.0020.992
y (εcl)0.2300.0010.995
y (E) 11.6790.1970.983
Table 7. Results comparison.
Measured Parametersω/%K/mol(1–n)
·L(n−1)·s−1·10−4
σc/MPaεca/10−2εcl/10−2E/GPa
Huang’s scheme 74.6019.5041.071.15−0.446.83
Huang’s scheme 84.1411.5348.441.00−0.378.16
Huang’s scheme 93.9912.1352.221.41−0.486.88
Average experimental results4.2414.3947.241.19−0.437.29
Model outputs4.3013.9149.751.23−0.417.40
Error/%1.433.425.052.974.301.53
Disclaimer/Publisher’s Note: The statements, opinions and data contained in all publications are solely those of the individual author(s) and contributor(s) and not of MDPI and/or the editor(s). MDPI and/or the editor(s) disclaim responsibility for any injury to people or property resulting from any ideas, methods, instructions or products referred to in the content.

