Article

Densification Mechanisms and Pore Evolution Analysis of a Tight Reservoir: A Case Study of Shan-1 Member of Upper Paleozoic Shanxi Formation in SW Ordos Basin, China

1
School of Earth Science and Engineering, Xi’an Shiyou University, Xi’an 710065, China
2
Shaanxi Key Laboratory of Petroleum Accumulation Geology, Xi’an Shiyou University, Xi’an 710065, China
3
No. 2 Oil Production Plant, PetroChina Changqing Oilfield Company, Qingyang 735100, China
*
Author to whom correspondence should be addressed.
Minerals 2023, 13(7), 960; https://doi.org/10.3390/min13070960
Submission received: 23 May 2023 / Revised: 5 July 2023 / Accepted: 15 July 2023 / Published: 19 July 2023

Abstract

:
This comprehensive analysis investigated the causes of formation densification in the Shan-1 Member tight reservoir in the southwestern Ordos Basin. The study aimed to mitigate exploration and development risks by examining petrological characteristics, reservoir performance, pore characteristics, and pore evolution. Various techniques were employed, including thin-section casting, scanning electron microscopy, and analysis of porosity and permeability. By establishing the relationship between visualized reservoir porosity and thin slice porosity, along with employing mechanical compaction correction methods and the principle of “back stripping by inversion,” the recovery of paleophysical properties in tight sandstone reservoirs was conducted. Additionally, the research integrated diagenetic evolution sequences and the recovery of paleophysical properties to analyze the origins of reservoir densification and pore evolution in the Shan-1 Member. The results suggest that compaction is the primary factor contributing to reservoir densification, with burial depth playing a crucial role in determining the intensity of compaction. Cementation, particularly associated with illite, emerged as a significant influence on reservoir densification, while low dissolution also contributed to the densification process. The densification of the Shan-1 reservoir in the study area was estimated to have occurred during the Early Jurassic, approximately 195 Ma. These research findings not only enhance the understanding of the Shan-1 reservoir but also provide valuable insights for predicting tight reservoirs and improving the efficiency of oil and gas production.

1. Introduction

Oil and gas exploration practices have demonstrated that tight sandstone gas reservoirs are crucial targets for natural gas exploration [1,2,3]. The Shan-1 Member of the Permian Shanxi Formation in the Southwest (SW) Ordos Basin represents a tight reservoir. The distribution of gas in tight reservoirs is constrained, posing a significant challenge to oil and gas exploration and development. Understanding pore evolution and densification, which are focal points in the study of reservoir characteristics [2], is essential.
Previous studies have devised an integrated model for predicting porosity, incorporating sedimentary, diagenetic, and structural factors [4,5,6]. However, all porosity loss due to compaction has been attributed to early diagenetic stages. This approach has resulted in discrepancies between porosity evolution models and the actual porosity evolution processes, directly impacting the accuracy of porosity prediction for clastic reservoirs and consequently constraining oil and gas exploration and resource development. Exploration and development outcomes have shown the potential formation of “sweet spots” in deeply buried tight sandstones, underscoring the direct relationship between reservoir quality and diagenesis. Therefore, comprehending pore evolution and reservoir densification mechanisms during diagenesis is crucial for identifying resource “sweet spots” [7].
In recent years, significant progress has been made in regional exploration with the successful extraction of industrial gas flow from the first member of the Upper Paleozoic Shanxi Formation in the SW Ordos Basin. This achievement marks a substantial breakthrough in regional exploration, paving the way for other natural gas exploration [8]. The Upper Paleozoic geology in this area exhibits sedimentation, reservoirs, and accumulation complexities. However, there has been relatively limited research on natural gas exploration, and studies have primarily focused on regional sedimentation, reservoir characteristics, reservoir formation conditions, and oil–gas enrichment mechanisms [9,10,11]. Notably, studies have yet to investigate the formation of reservoir densification in the local Shan-1 Member of the Shanxi Formation.
In this study, the authors analyzed the influence of diagenesis on reservoir densification by examining rock composition, mineral distribution, clay mineral assemblage, and evolutionary characteristics. We provided a geological foundation for reservoir prediction in the member above.

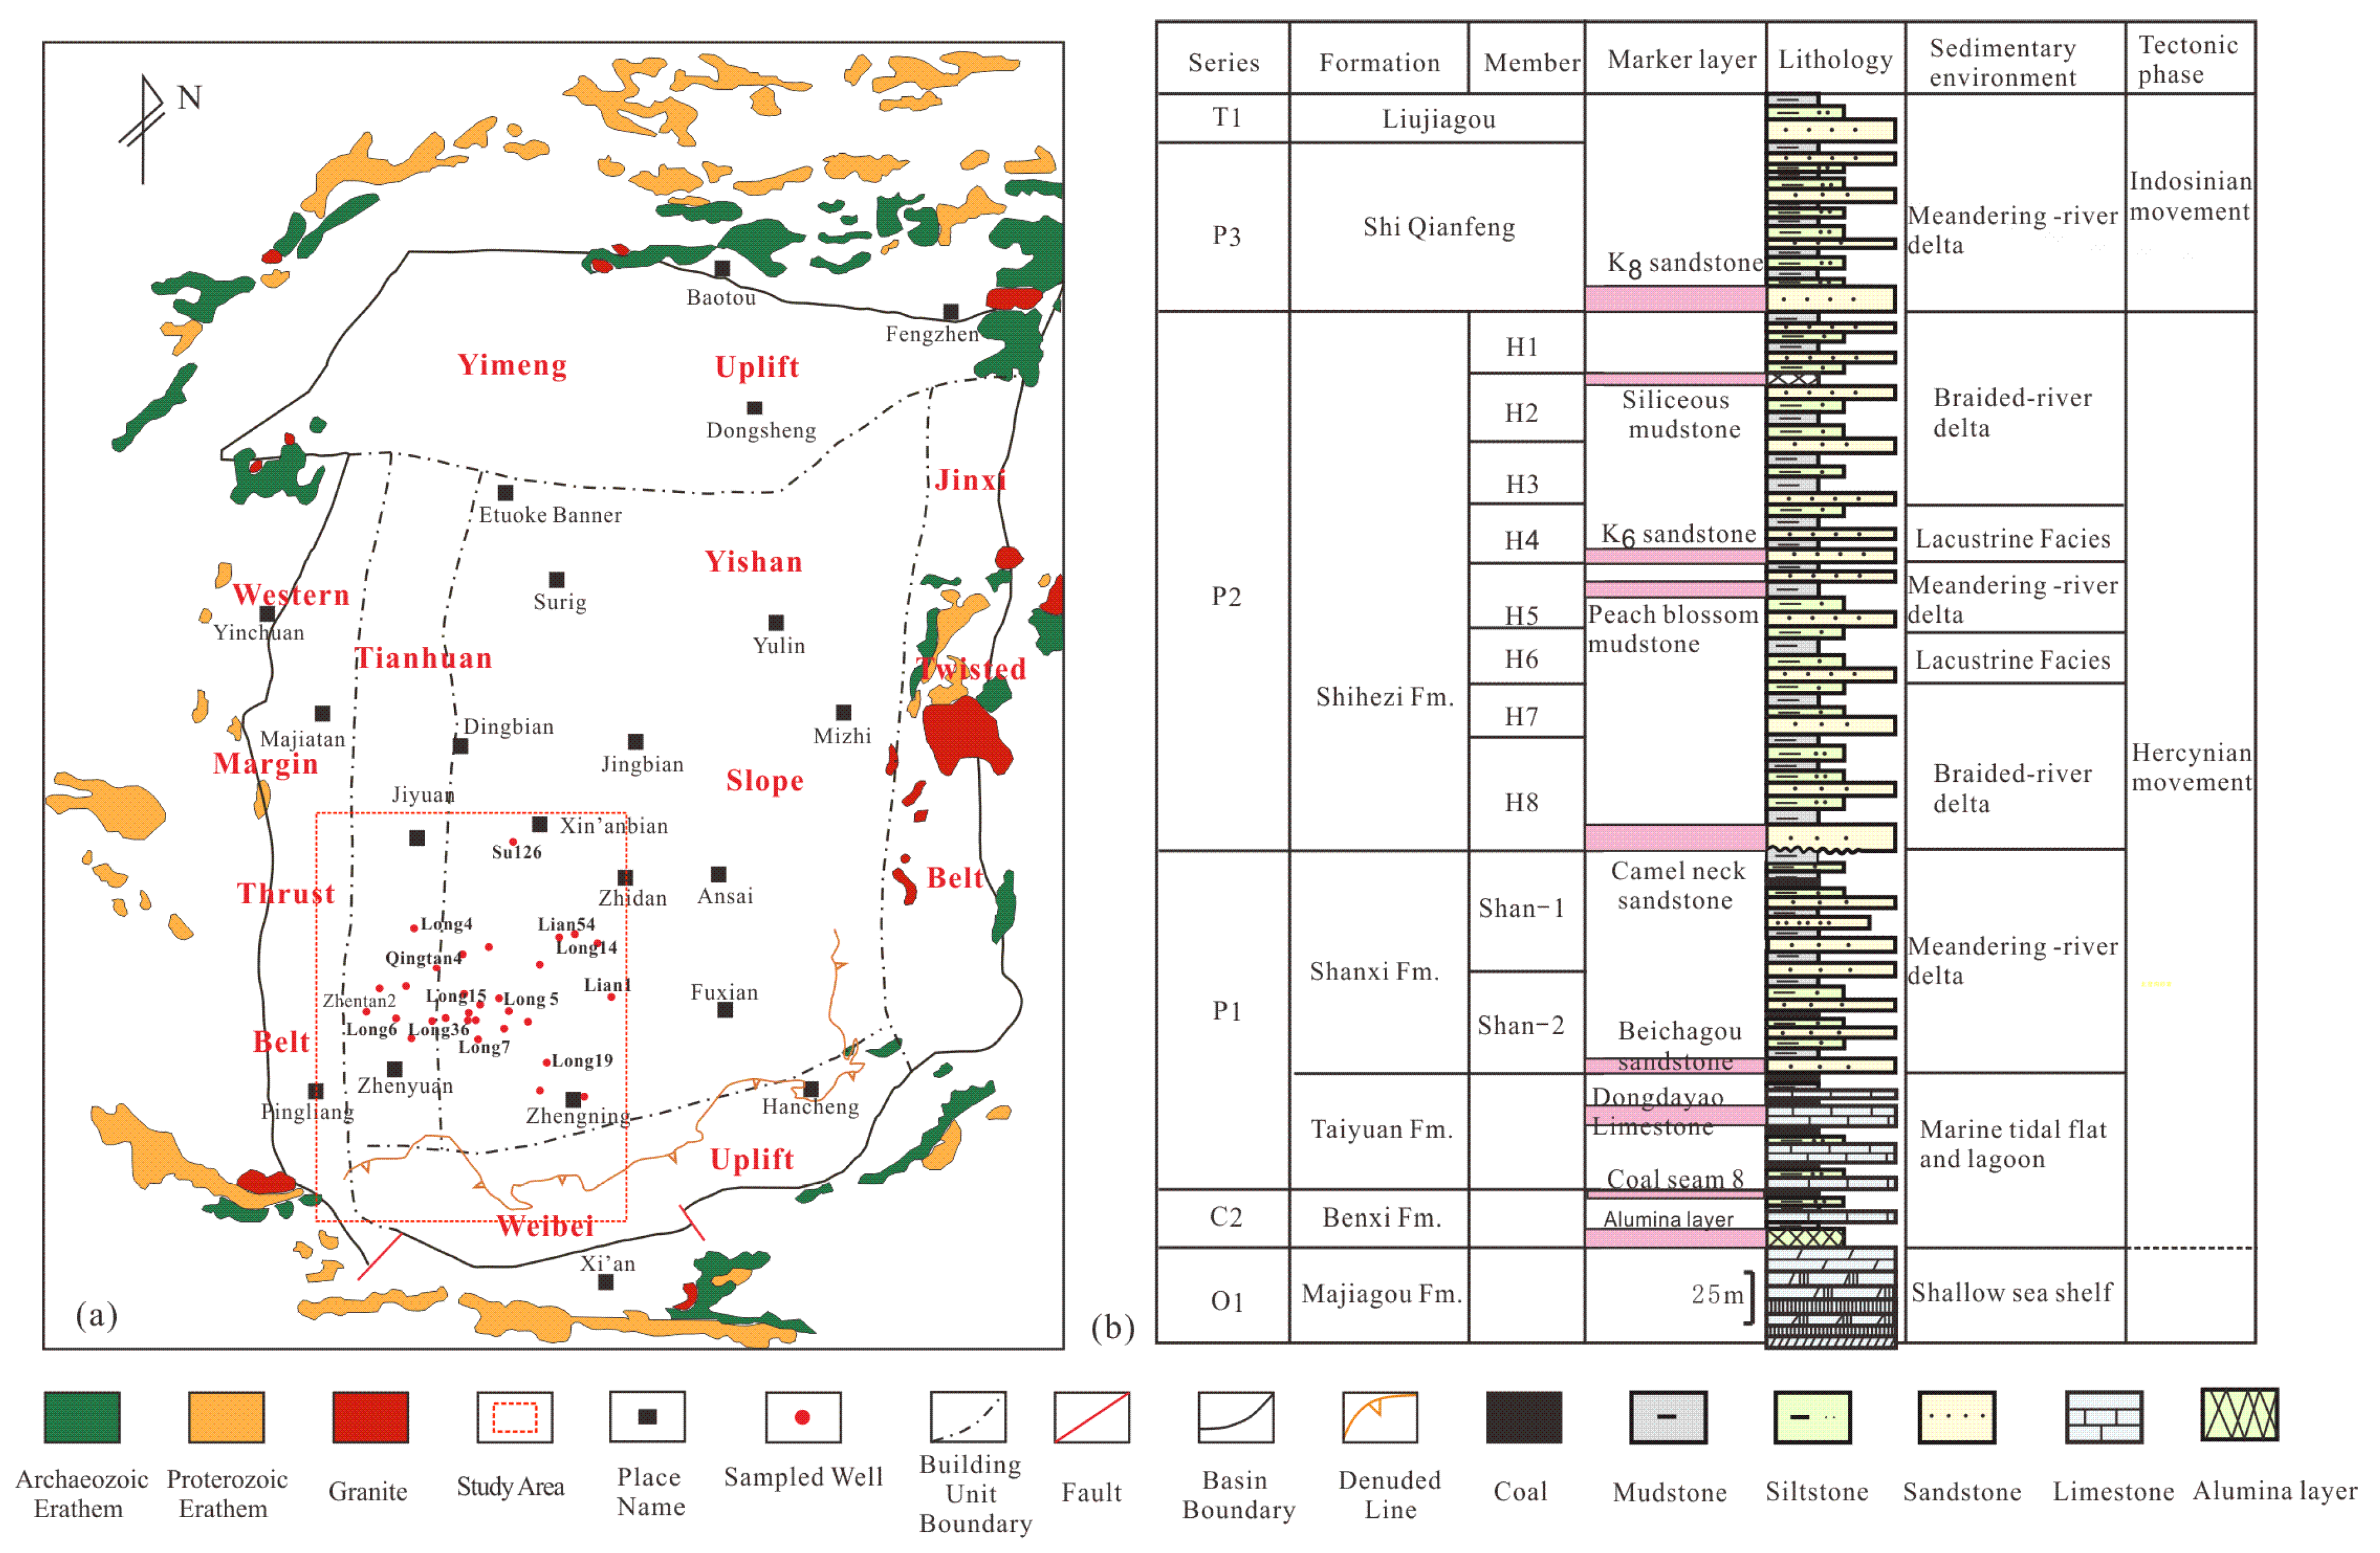
2. Geological Setting

The research area is in the southwestern part of the Ordos Basin, with the main body located southwest of the Yishan Slope (Figure 1a). The present-day structure exhibits a large monocline feature, with higher elevations in the east and south and lower elevations in the west and north. The Upper Paleozoic succession comprises the Carboniferous Benxi Formation, Permian Taiyuan Formation, Shanxi Formation, Shihezi Formation, and Shiqianfeng Formation [2]. These formations represent a transitional sequence of continental to marine clastic rock deposits.
Based on lithological variations, the Shanxi Formation can be divided into two sections, namely Shan-2 and Shan-1. The Shan-1 section is in contact with the overlying Middle Permian Shihezi Formation through a regional erosion surface. The main lithologies in the Shan-2 section include black mudstone, coal seams, carbonaceous shale, and gray-white quartz sandstone. The Shan-1 section has a thickness ranging from approximately 35 m to 60 m, which is predominantly composed of dark gray mudstone interbedded with light gray fine sandstone, argillaceous quartz sandstone, gray-white medium-grained quartz sandstone, and gray-white coarse-grained quartz sandstone (Figure 1).
The southwestern part of the Ordos Basin is a promising area for natural gas storage and production. The Shan-1 section of the Permian Shanxi Formation serves as the primary reservoir. The skeleton sand bodies within the main sand body belt of the Shan-1 section are formed by distributary channels or underwater distributary channels in a meandering river delta (Figure 1b).
During the Middle Ordovician Majiagou period of the early Paleozoic, the Ordos Basin underwent a significant marine transgression, resulting in the deposition of extensive shallow-water epicontinental sea sediments. In the Late Carboniferous, during the deposition of the Benxi Formation, the sedimentary environment exhibited an east–west differentiation influenced by the central paleo-uplift. The western region featured lagoonal and tidal flat deposits, whereas shallow marine continental shelf deposits characterized the eastern region. During the deposition of the Taiyuan Formation in the Early Permian, seawater intruded and expanded its influence on both the eastern and western sides, connecting the North China Sea with the Qilian Sea. Consequently, the overall sedimentary environment in the basin became predominantly coastal shallow seas. During the Early Permian deposition of the Shanxi Formation, the tectonic movement associated with the Hercynian orogeny significantly influenced the basin [9]. This movement led to the uplift of the northern margin of the North China Platform and resulted in differential uplift and subsidence in the north–south direction. By this time, the early central ancient uplift had submerged below sea level, eliminating the east–west differences. As a result, the entire region experienced extensive sedimentation of shallow lakes and deltas (Figure 1b).

3. Materials and Methods

3.1. Main Experimental Methods

All experimental samples and data were obtained from the first member of the Shanxi Formation in the Permian system within the Southwest (SW) Ordos Basin. A total of 631 porosity and permeability data points were collected from 33 wells in the Changqing Oilfield. Subsequently, 289 thin sections from 28 wells were prepared by filling them with blue epoxy resin and staining them with alizarin red S. These thin sections were observed using a Leica Microsystems DM4500p microscope. Additionally, 11 tight sandstone samples underwent preparation and gold plating, and their microscopic pores and autogenic minerals in the reservoir were examined using a 15.00 kV working voltage and a working distance of approximately 29.6 mm via a Coxem EM-30 scanning electron microscope (SEM) equipped with an E-T secondary electron detector. Inclusions were analyzed using a LINKAM THMS 600 model heating and freezing platform, following the industry standard of the People’s Republic of China (SY/T6010-2011). The observations of thin sections, SEM imaging, and inclusion analyses were conducted at the Shaanxi Key Laboratory of Oil and Gas, Xi’an Shiyou University.

3.2. Methods of Reservoir Quantitative Evaluation

The back-stripping method, which utilizes the diagenetic evolution sequence as a constraint, is a primary technique for recovering paleophysical properties and restoring the porosity evolution of reservoirs. The method’s fundamental concept is that porosity = original porosity—compaction loss porosity—early cementation loss porosity + dissolution increased porosity—late cementation porosity [12]. The reservoir porosity observed represents the outcome of pore evolution after sedimentation and diagenesis. It is crucial to determine the original porosity to quantify the porosity’s evolutionary history accurately.
For unconsolidated sandstone, a value of 40% is typically assigned to the original porosity. In specific areas, the original sandstone porosity can be calculated using the empirical formula established by Bear (1973) and Scherer (1987) [3], as shown in Equation (1):
Original porosity (Φ)0 = 20.9 + 22.91/So
So represents the Trask separation coefficient, which can be derived from the cumulative particle size probability curve. So = (P25/P75)0.5, where P25 and P75 correspond to the particle diameters at 25% and 75% on the particle probability cumulative curve, respectively.
During the study, the back-stripping method was employed to restore paleophysical properties, considering various controlling factors and aiming to accurately recover the porosity evolution of sandstone reservoirs throughout their geological history, which involves investigating the reservoir’s sedimentary characteristics and diagenetic evolution sequence. The quantitative analysis of diagenetic processes such as cementation and dissolution on reservoir porosity was performed based on the observed pore features in thin sections and the functional relationship between visual reservoir porosity and thin-section porosity. As a constraint, porosity inversion back stripping was carried out while adhering to the cementation dissolution sequence. Subsequently, mechanical compaction correction was applied to the inversion-stripped porosity using the standard compaction chart. This process establishes the porosity evolution curve for the Shan-1 Member of the Upper Paleozoic tight reservoir in the Southwest (SW) Ordos Basin.

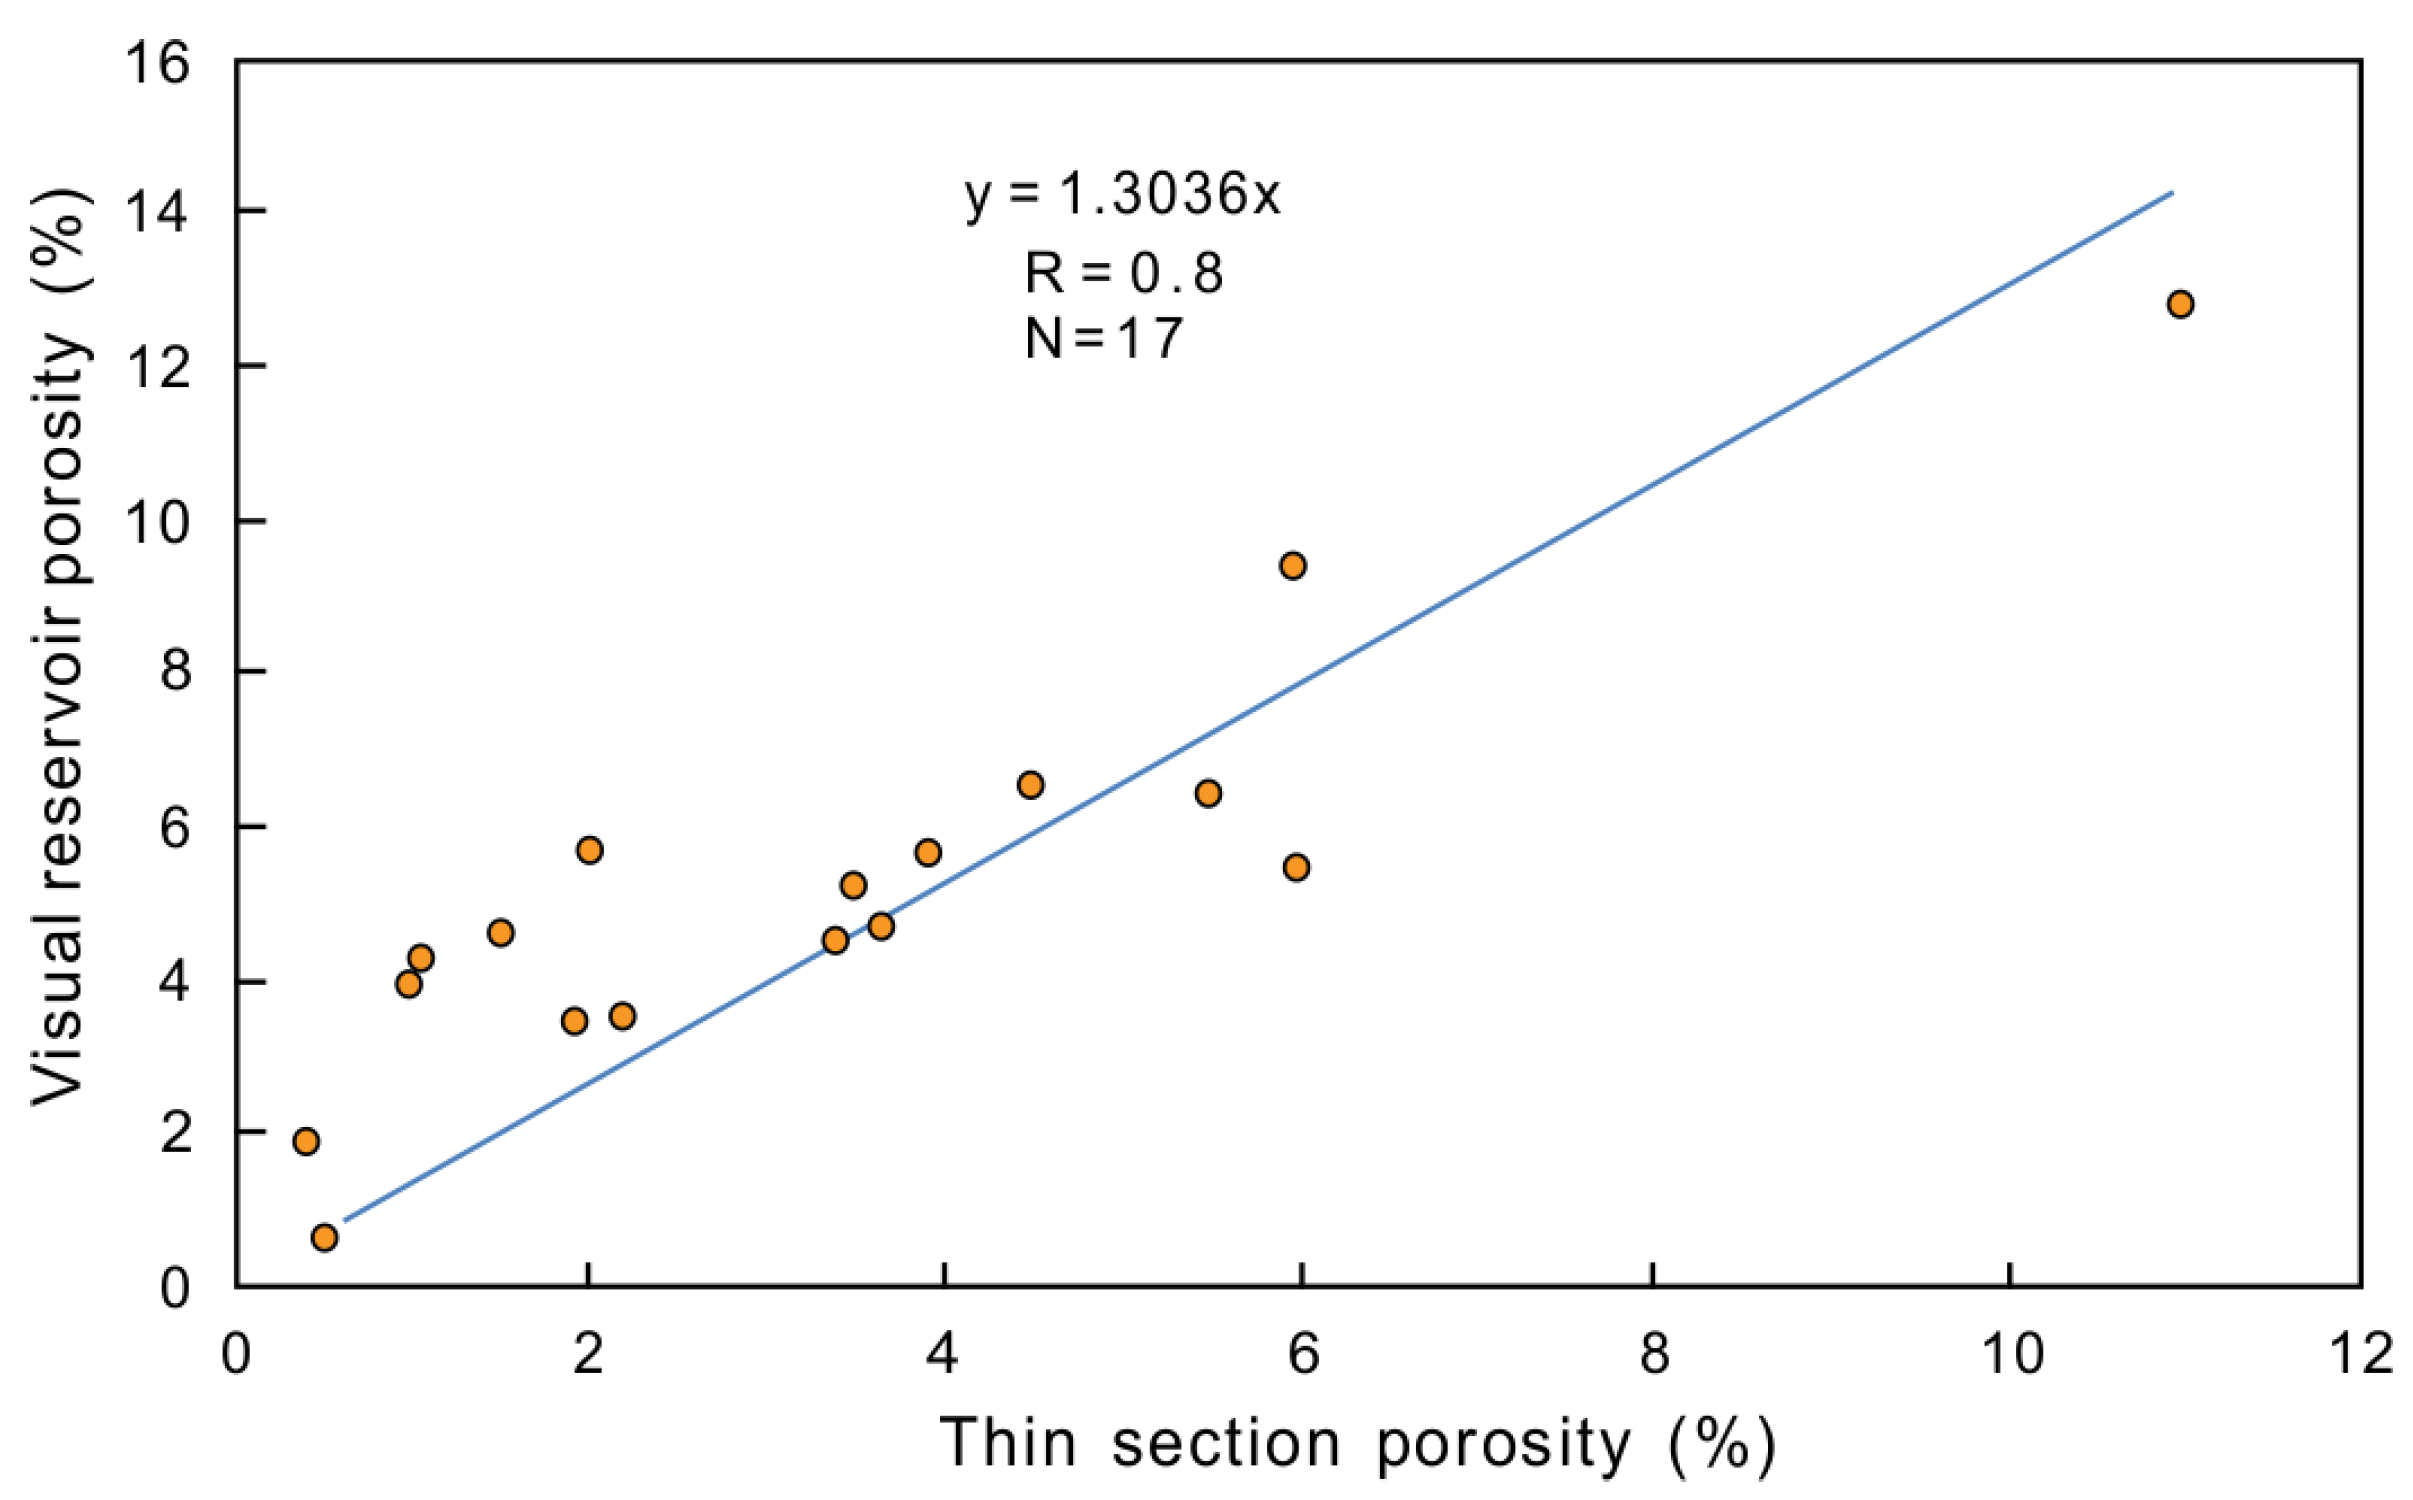
3.2.1. Functional Relationship between Visual Reservoir Porosity and Thin-Section Porosity

The study of porosity evolution in tight reservoirs primarily relies on casting thin sections, which enables the calculation of porosity contributions from authigenic minerals and dissolved pores. It is important to note that thin-section porosity does not equate to reservoir porosity, and accurate transformation between the two is crucial for precisely recovering reservoir porosity evolution.
Based on physics principles, the minimum linear distance discernible to the naked eye is approximately 0.1 mm. Therefore, when a linear distance of 0.5 μm is magnified 200 times under a microscope, it can be visually determined by the naked eye. In other words, the pore radius distinguishable to the naked eye under a 200-times magnification microscope is 0.25 μm. Hence, pores with a pore radius of less than 0.25 μm under a 200-times microscope are considered micropores. The relationship between thin-section porosity and visual reservoir porosity is not considered.
By utilizing mercury injection data, the porosity content with a radius greater than 0.25 μm in the reservoir could be determined, and the visual reservoir porosity discernible to the naked eye under a 200-times microscope could be obtained. The thin-section porosity was quantified and correlated with the corresponding visual reservoir porosity using a polarizing microscope and computer image analysis technology, which established a functional relationship between thin-section porosity and visible reservoir porosity (Figure 2).

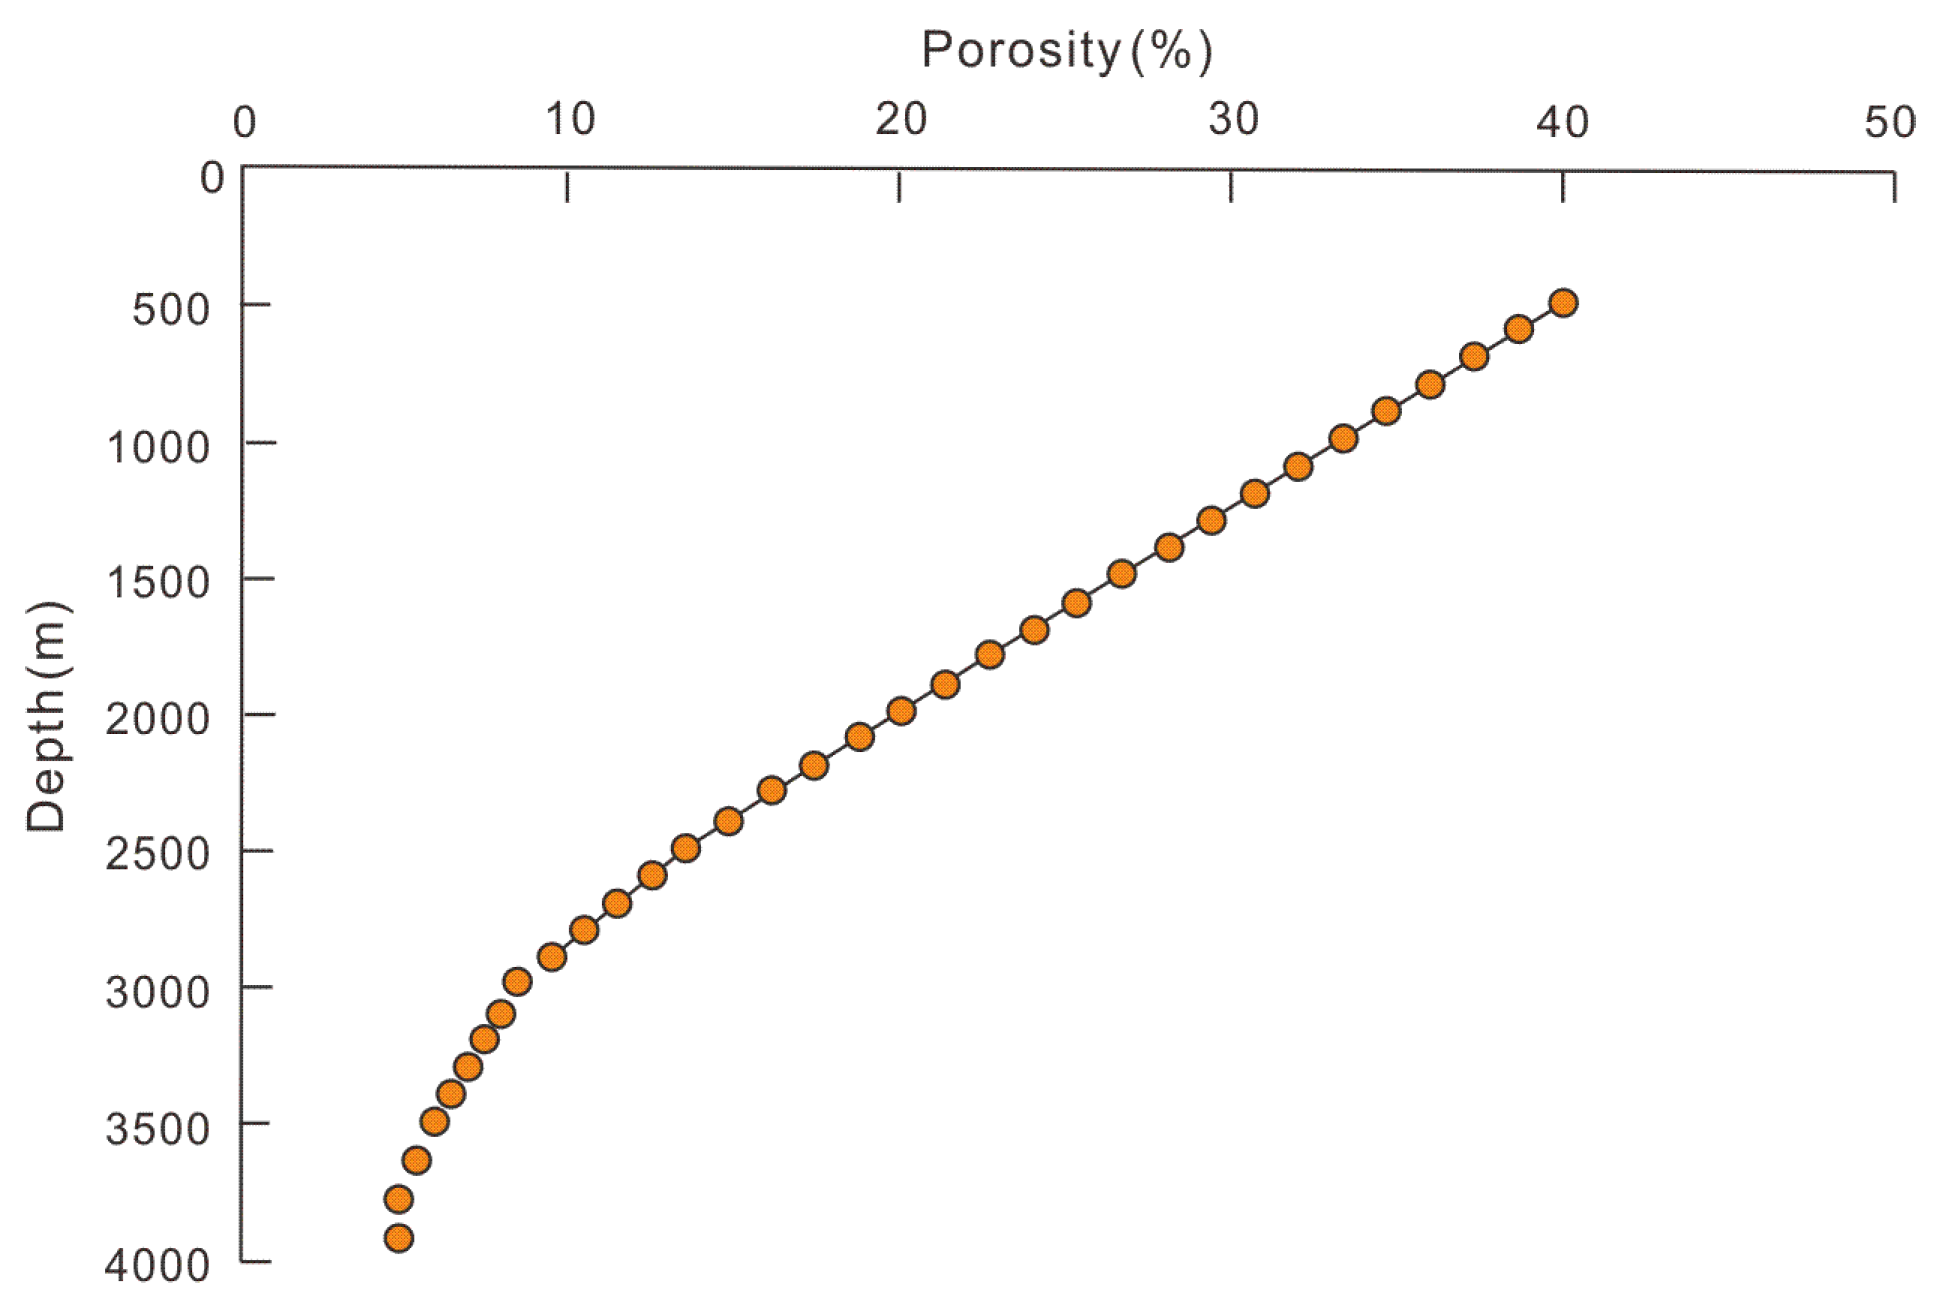
3.2.2. Compaction Correction

The total porosity lost due to mechanical compaction can be calculated using Equation (2) [13]:
Φp = Φ0 − Φm − Φc + Φv
Here, Φp represents the total porosity lost due to mechanical compaction (%), Φ0 denotes the original porosity (%), Φm represents the current measured porosity of the sample, Φc indicates the total porosity lost due to cementation (%), and Φv represents the total porosity increased due to dissolution holes (%).
The relationship depicted in Figure 1 demonstrates how the entire cement content and total dissolved porosity were converted into the total porosity loss due to cementation and the total porosity increase due to dissolution. If the porosity lost by compaction was solely attributed to the early diagenetic stage, the porosity evolution analysis would have had a significant error. To accurately recover the porosity evolution process throughout geological history, correcting the total porosity lost due to compaction during the porosity inversion stripping for each diagenesis stage is essential. The mechanical compaction correction allocates the porosity lost due to compaction to each diagenesis stage based on specific correction rules.
Following the diagenetic sequence, the sample underwent normal compaction before the primary cementation phase. The compaction loss porosity at each burial depth was determined by referring to the standard compaction curve. Once the cement content exceeded 10% during the primary cementation period, cementation inhibited further compaction. The compaction loss porosity during the primary cementation period was allocated based on the proportion of compaction loss porosity measured in each period on the standard compaction chart. Subsequently, the compaction loss porosity correction for each diagenetic period was determined, and the inversion-stripped porosity obtained was corrected using mechanical compaction (Figure 3).

4. Results

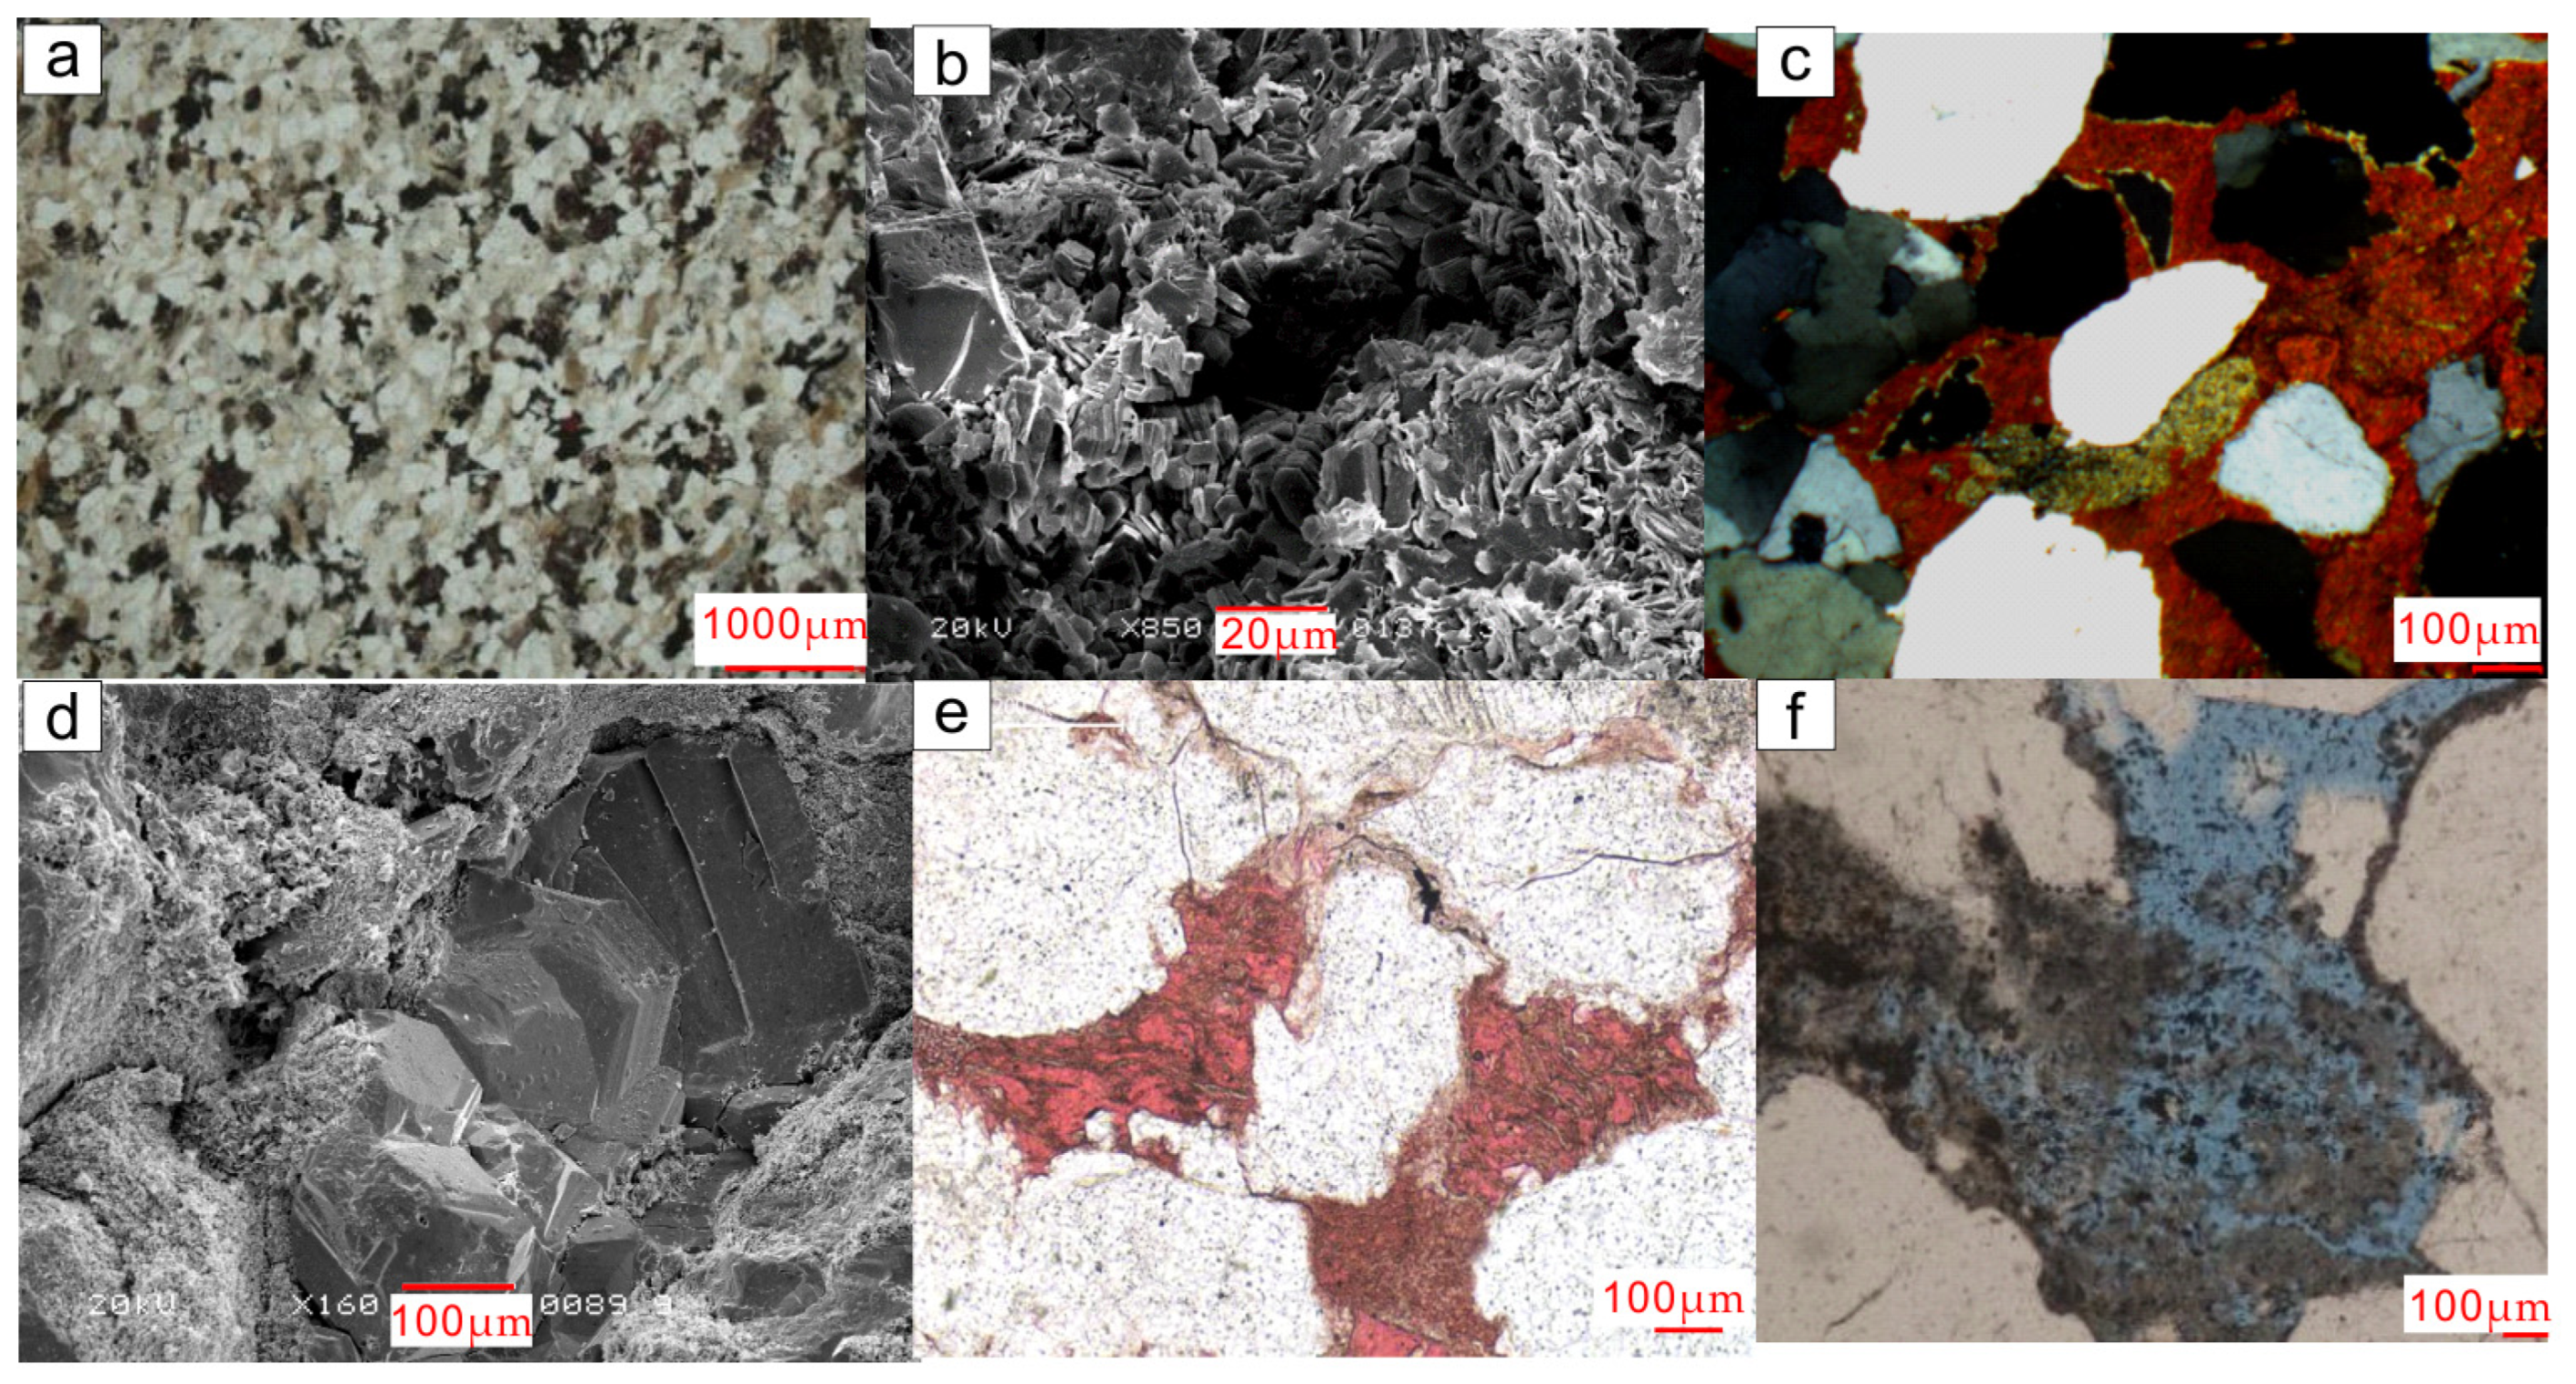
4.1. Petrological Characteristics

The thin-section analysis revealed that the predominant rock types within the Shan-1 Member are lithic quartz sandstone and lithic sandstone, followed by quartz sandstone and feldspar lithic sandstone. Smaller quantities of lithic arkose and arkose were also observed. The average quartz content was 60.64%, feldspar content was 1.89%, and rock fragment content was 17.2%.
The Shan-1 Member reservoir within the study area exhibits diverse types and significant variations in interstitial materials. The primary interstitial materials include clay mineral cement (such as kaolinite, chlorite, and illite), carbonate cement (such as ferrocalcite), and siliceous cement (Table 1).

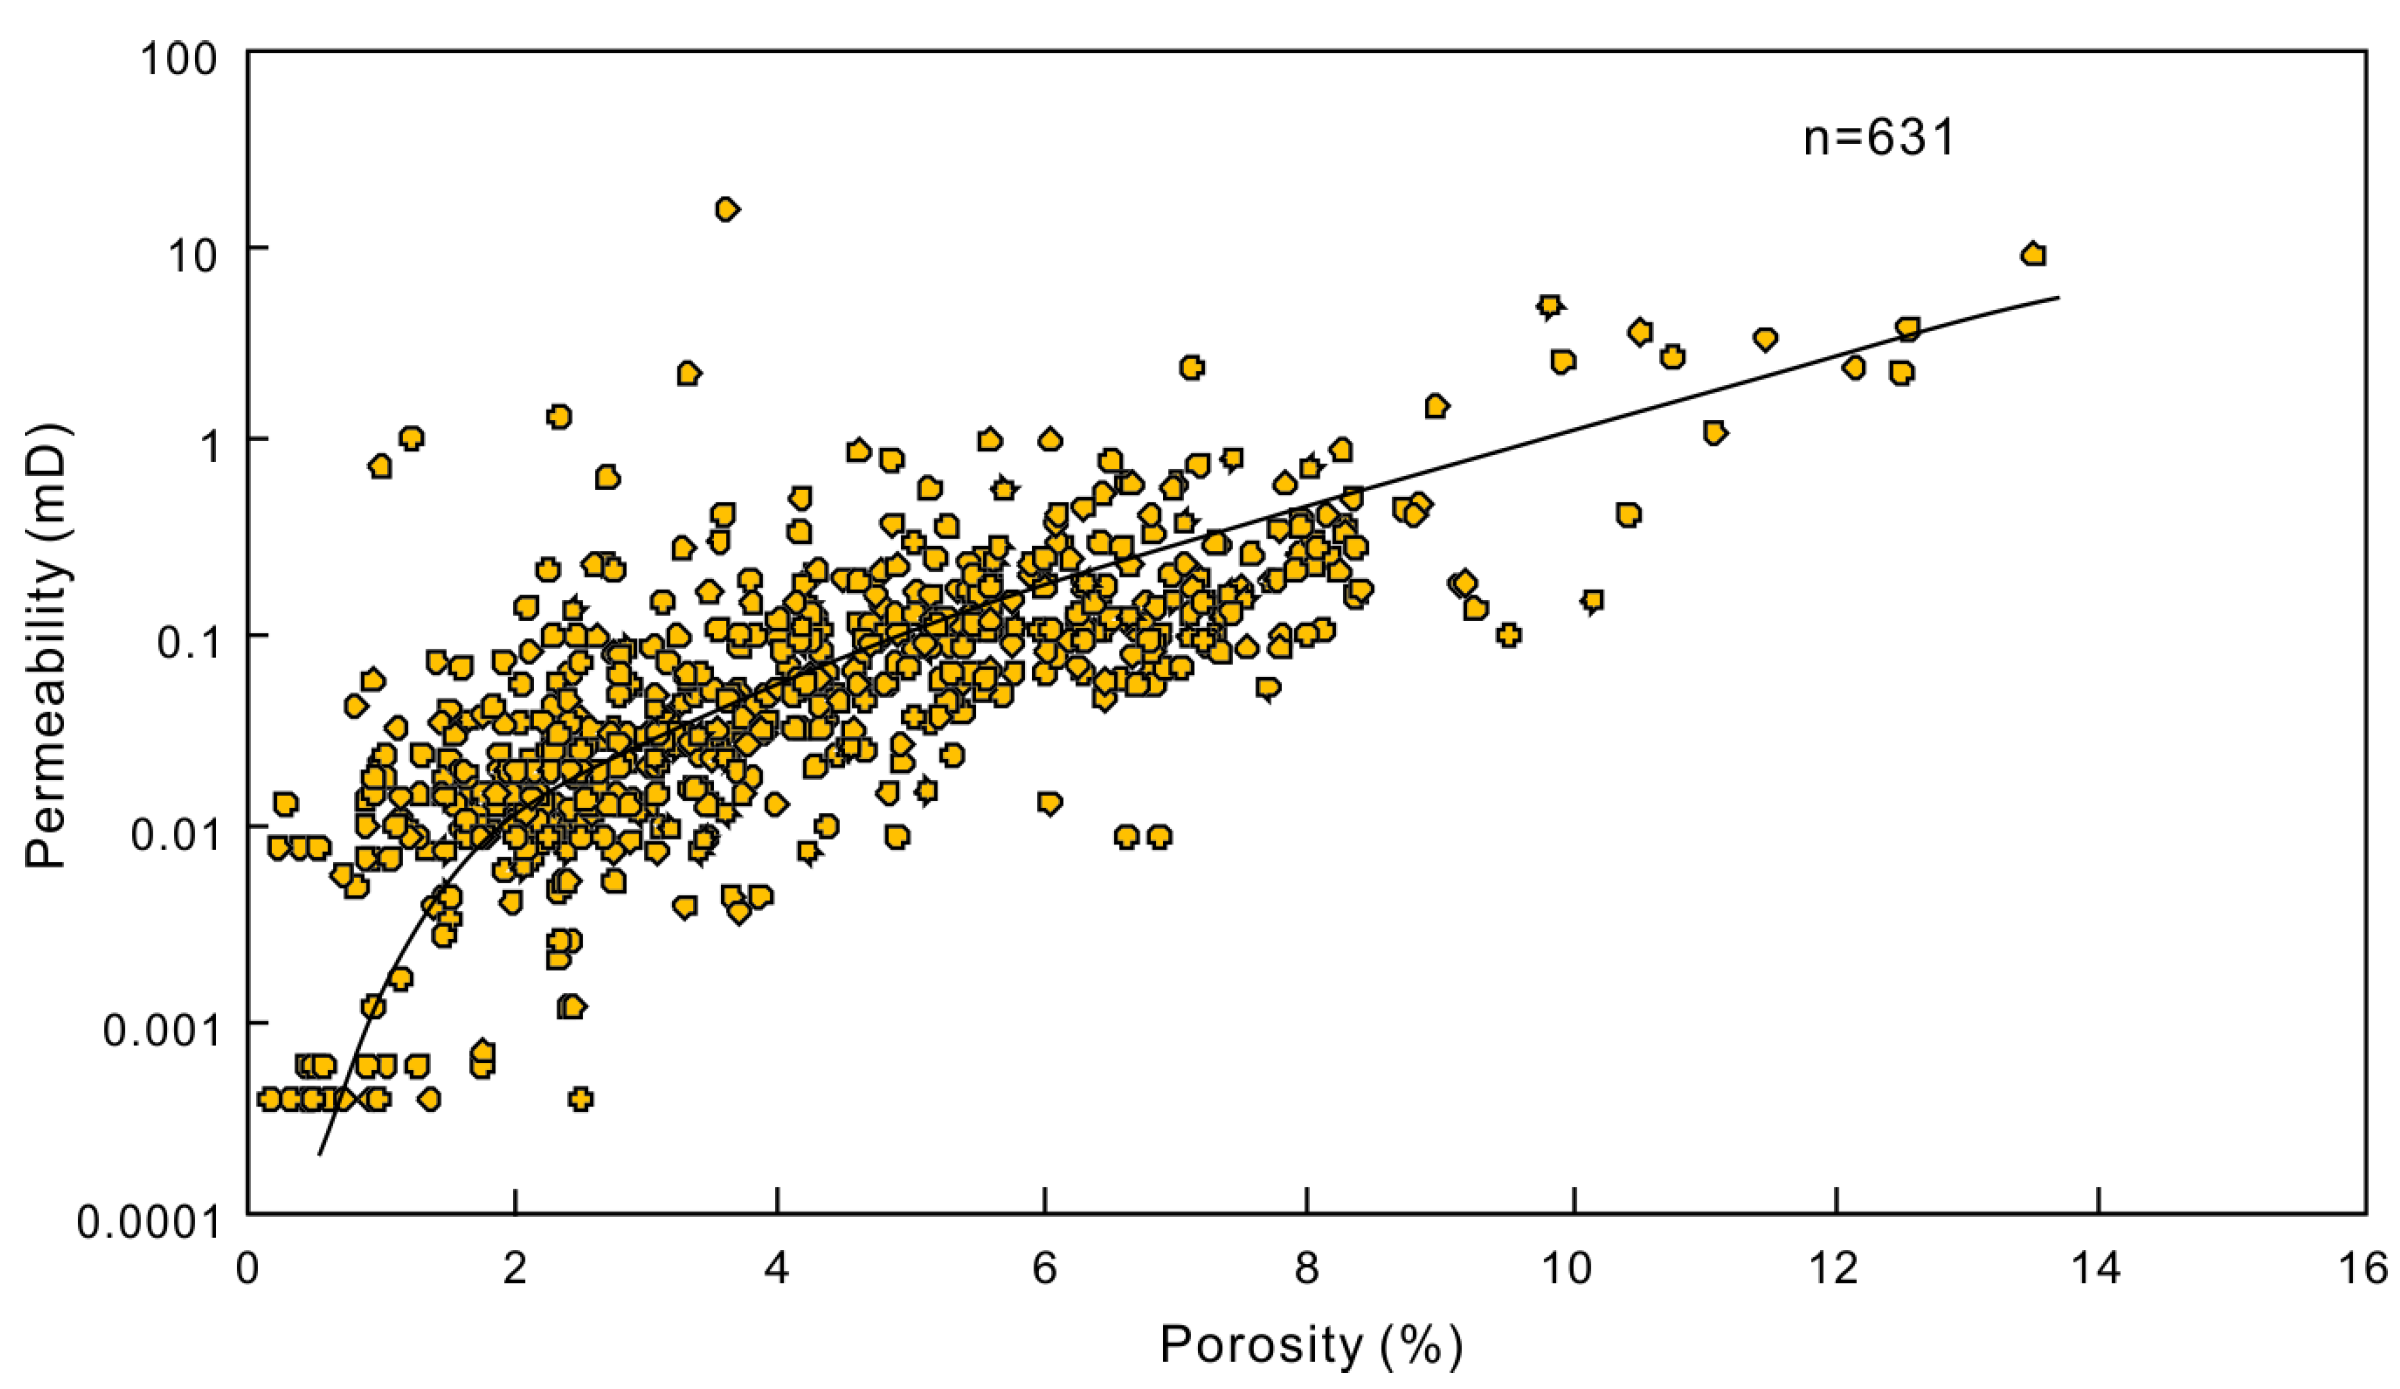
4.2. Reservoir Physical Characteristics

The Shan-1 Member reservoir’s porosity exhibits a unimodal pattern, with the majority of values ranging between 2% and 8% and an average porosity of 4.79%. The permeability distribution displays a bimodal feature, with the dominant values being ≥ 0.05 × 10⁻³ μm2 and an average permeability of 0.31 mD (Figure 4). A general correlation between porosity and permeability was observed in the Shan-1 Member reservoir, indicating that permeability also tended to increase as porosity increased. This correlation suggests that the storage and permeability characteristics of the sandstone primarily rely on the pores and throats within the matrix. The low porosity and permeability values reflect the prevalence of highly narrow throats and pores in the study area. However, microfractures were found to play a role in enhancing reservoir permeability.

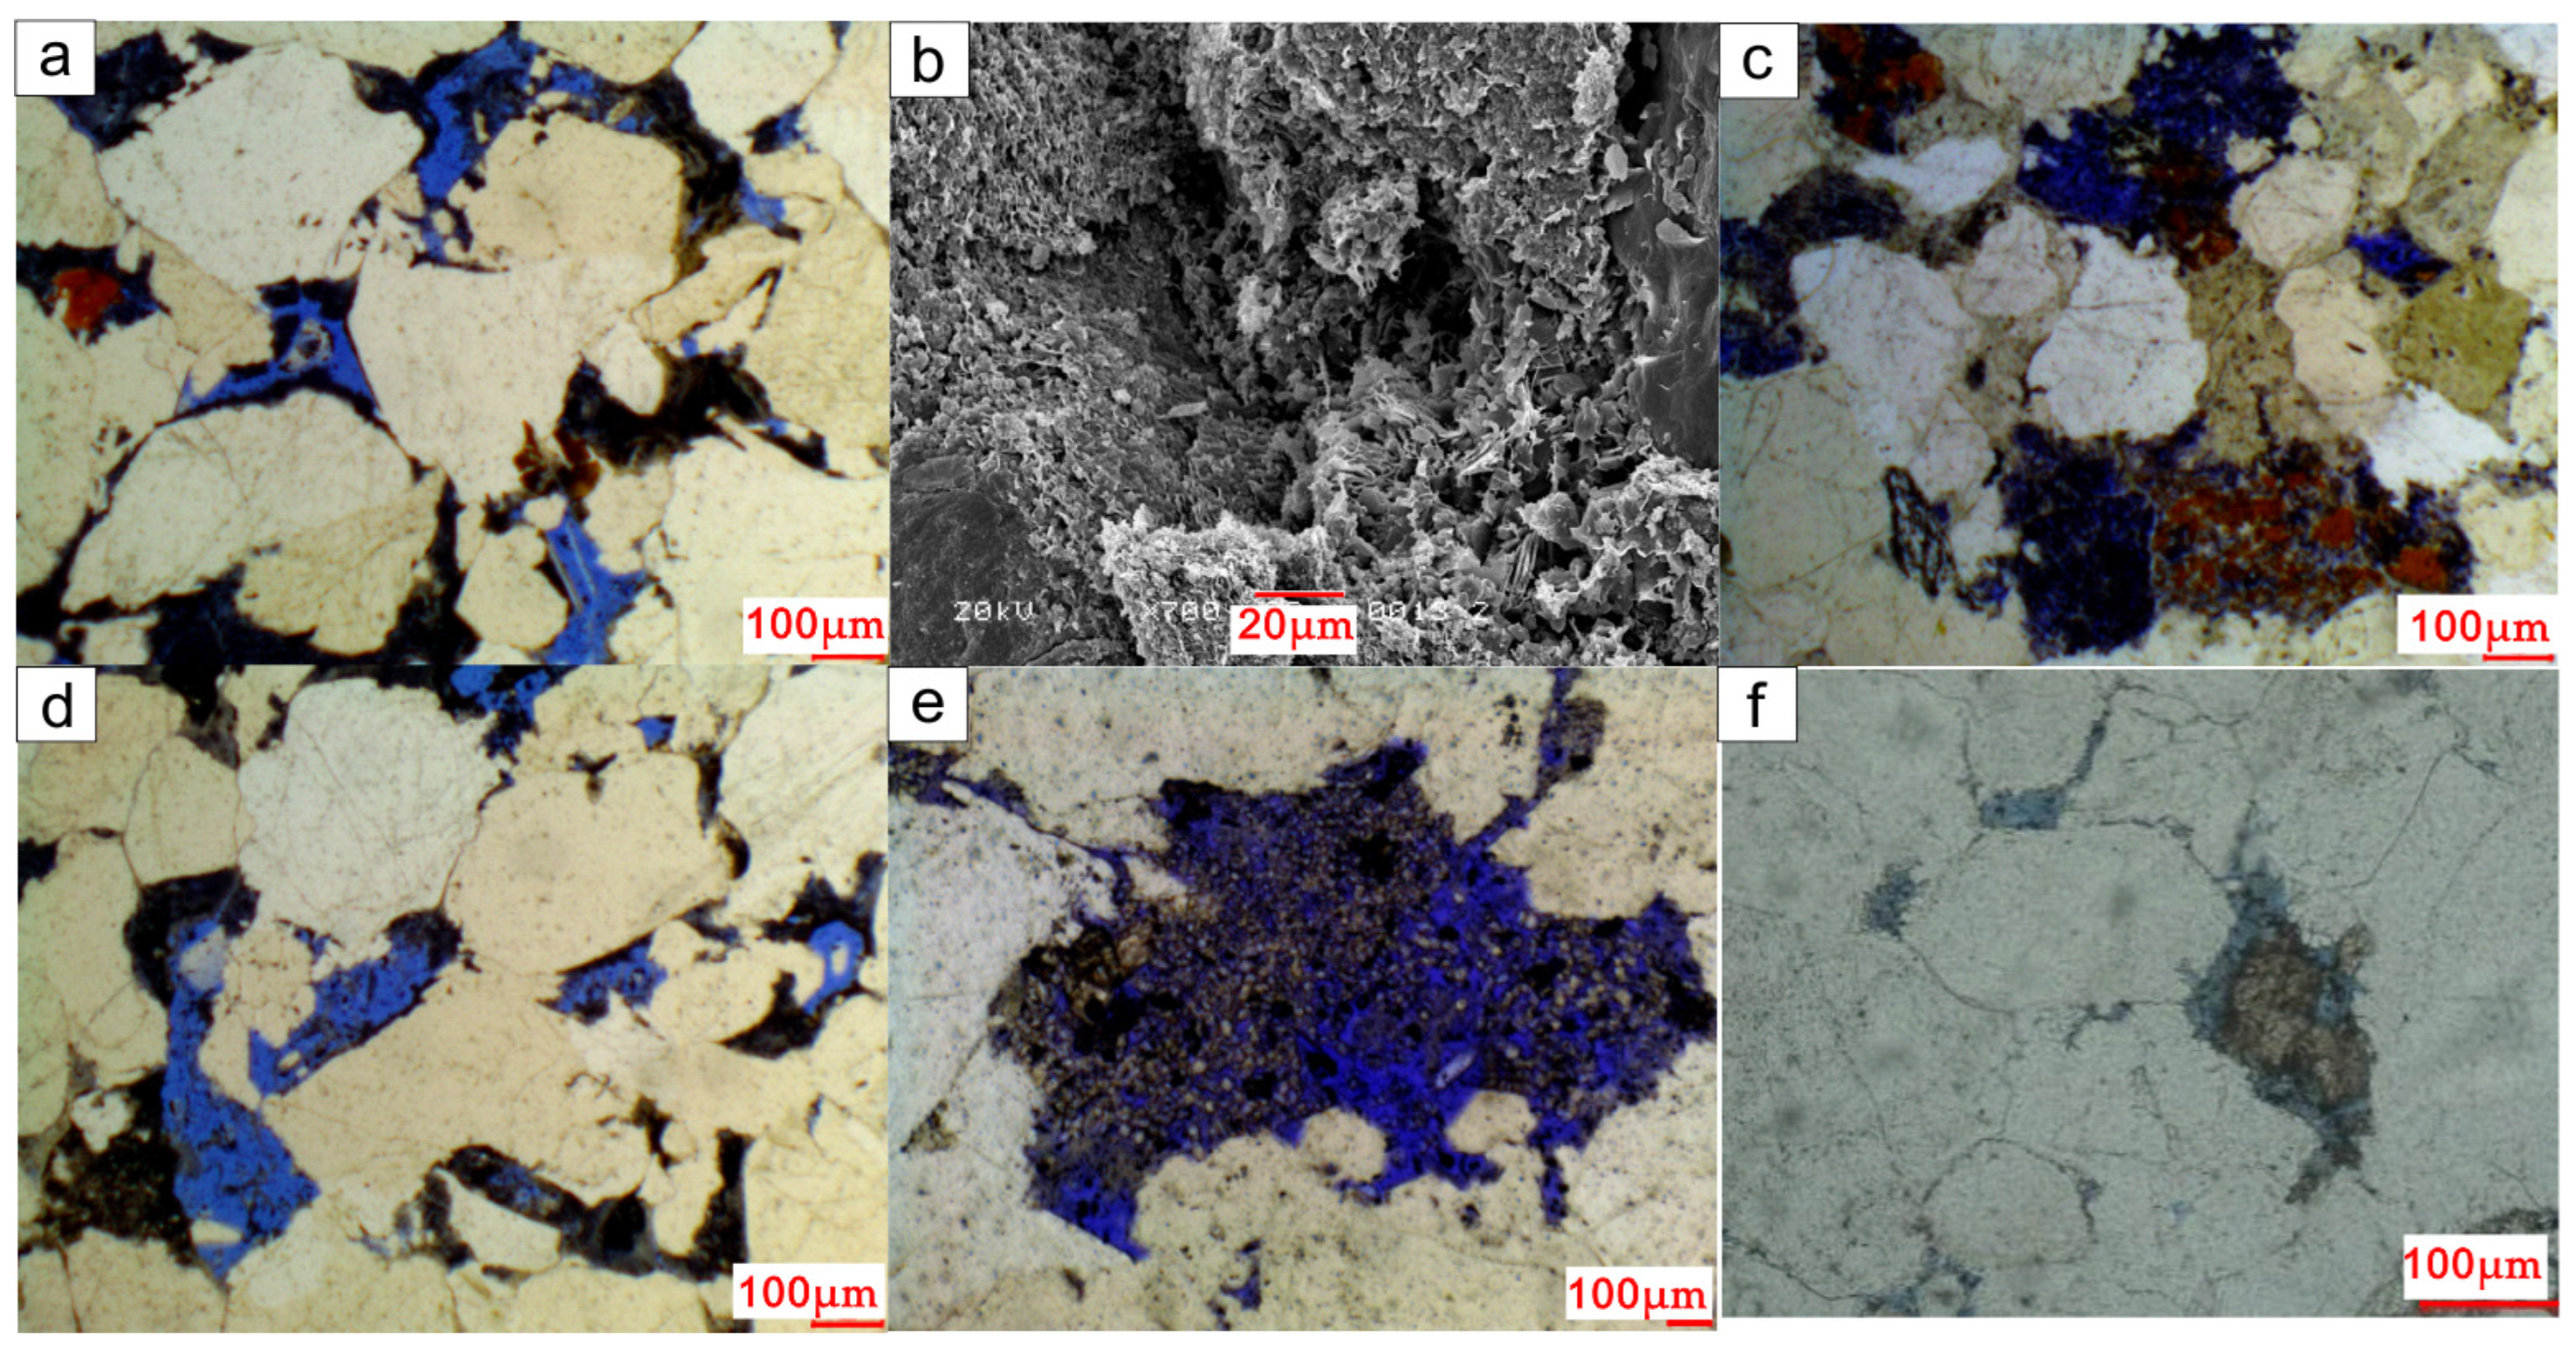
4.3. Reservoir Pores

A comprehensive investigation of reservoir pore types in the study area was conducted through a detailed examination of cast thin sections and SEM analyses. The results revealed a complex and diverse reservoir pore geometry. Based on their origins, the pores were classified into several categories, including primary intergranular pores, intragranular dissolution pores, intergranular dissolution pores, mold pores, intergranular pores, and grain adhesion cracks. Among these, the secondary dissolution pores encompassed all pore types except primary intergranular pores, with the highest content observed in debris-dissolved pores (Figure 5).

4.4. Main Diagenesis

4.4.1. Compaction

The sandstones in the study area have undergone significant compaction, resulting in a low proportion of primary pores within the reservoir. However, despite this compaction, well-connected pore networks have allowed for the circulation of pore fluids, creating a favorable environment for the development of secondary pores through the dissolution of clastic particles. Under high compaction levels, pressure solution processes occurred, causing particles to come into close contact or exhibit sutured contact (Table 1 and Figure 6a)—consequently, the overall sediment volume and pore space decreased.

4.4.2. Cementation

Cementation plays a crucial role in sediment consolidation and diagenesis; however, it hinders the formation of favorable reservoirs [15]. During the intermediate diagenetic stage B, the disappearance of organic acids and the alkalinity of pore water, resulting from the organic matter’s maturation, occur. This stage is primarily responsible for forming late carbonate cement, such as iron-bearing calcite, iron-bearing dolomite, and illite cement.
Based on thin-section identification, the main types of cementation in the Shan-1 Member of the study area include clay minerals, siliceous materials, and carbonates (Figure 6c). Clay minerals, including kaolinite, illite, chlorite, and illite/montmorillonite, are commonly observed in cement, with kaolinite and illite as the predominant clay minerals filling the pores. Chlorite cement is mainly present as coatings and partially fills the pores. The development of chlorite, characterized by disordered plate-like arrangements of clastic particles, is attributed to the transformation of early mechanically infiltrated montmorillonite (Figure 6b).
Quartz overgrowth is often associated with authigenic kaolinite and is formed concurrently or subsequently. The homogenization temperature of inclusions within quartz overgrowth ranges from 80 to 140 °C. It is evident that most of the overgrowth formed during the early diagenetic stage B and continued into the middle diagenetic stage B. The carbonate mineral cement primarily consists of iron-bearing calcite, calcite, and siderite (Table 1). This cementation process occurred from the early diagenetic stage to the late diagenetic stage, and late carbonate mineral sedimentation occurred after the formation of quartz overgrowth and dissolution (Figure 6d).

4.4.3. Dissolution

Dissolution plays a constructive role in enhancing reservoir quality. During the middle diagenetic stage, organic matter undergoes decarboxylation, generating organic acids and creating an acidic diagenetic environment. Under burial conditions, this acidic medium promotes dissolution processes. Soluble components, such as volcanic debris and a small amount of feldspar present in the sandstone, undergo varying degrees of dissolution, forming secondary pores (Figure 6e,f and Figure 7). Altered kaolinite in quartz sandstone can also contribute to developing intergranular pores, thereby improving reservoir performance.

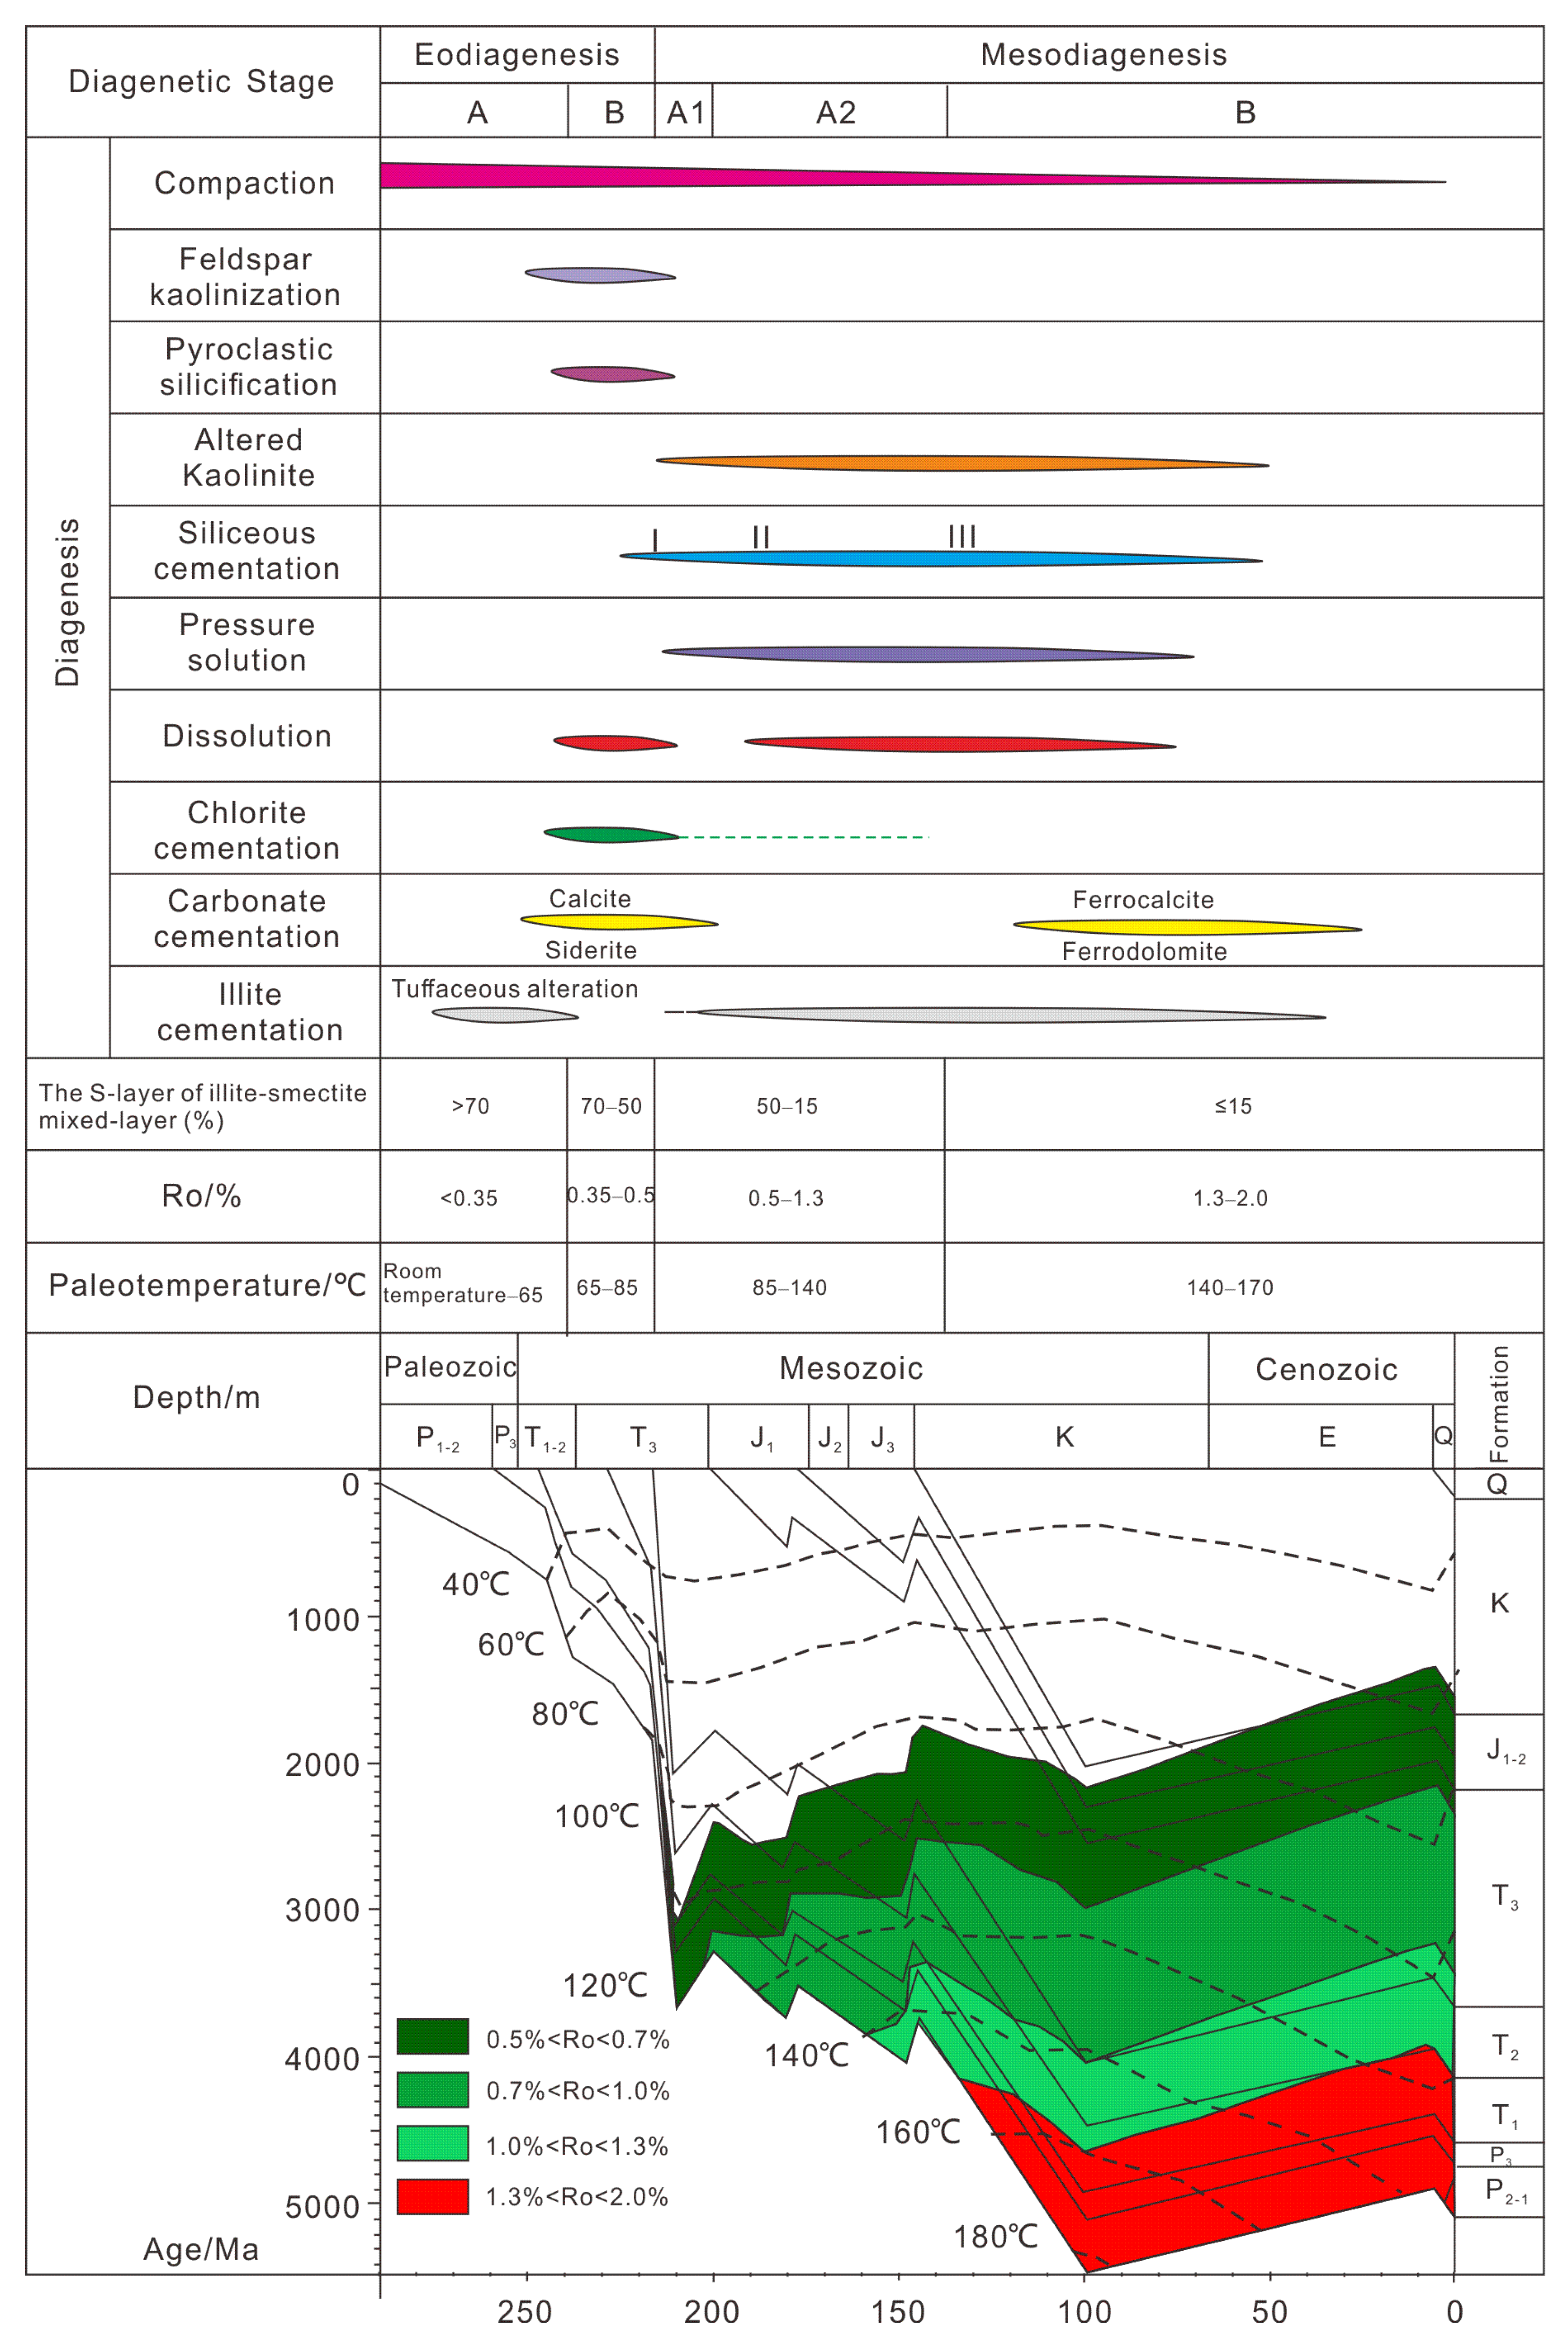
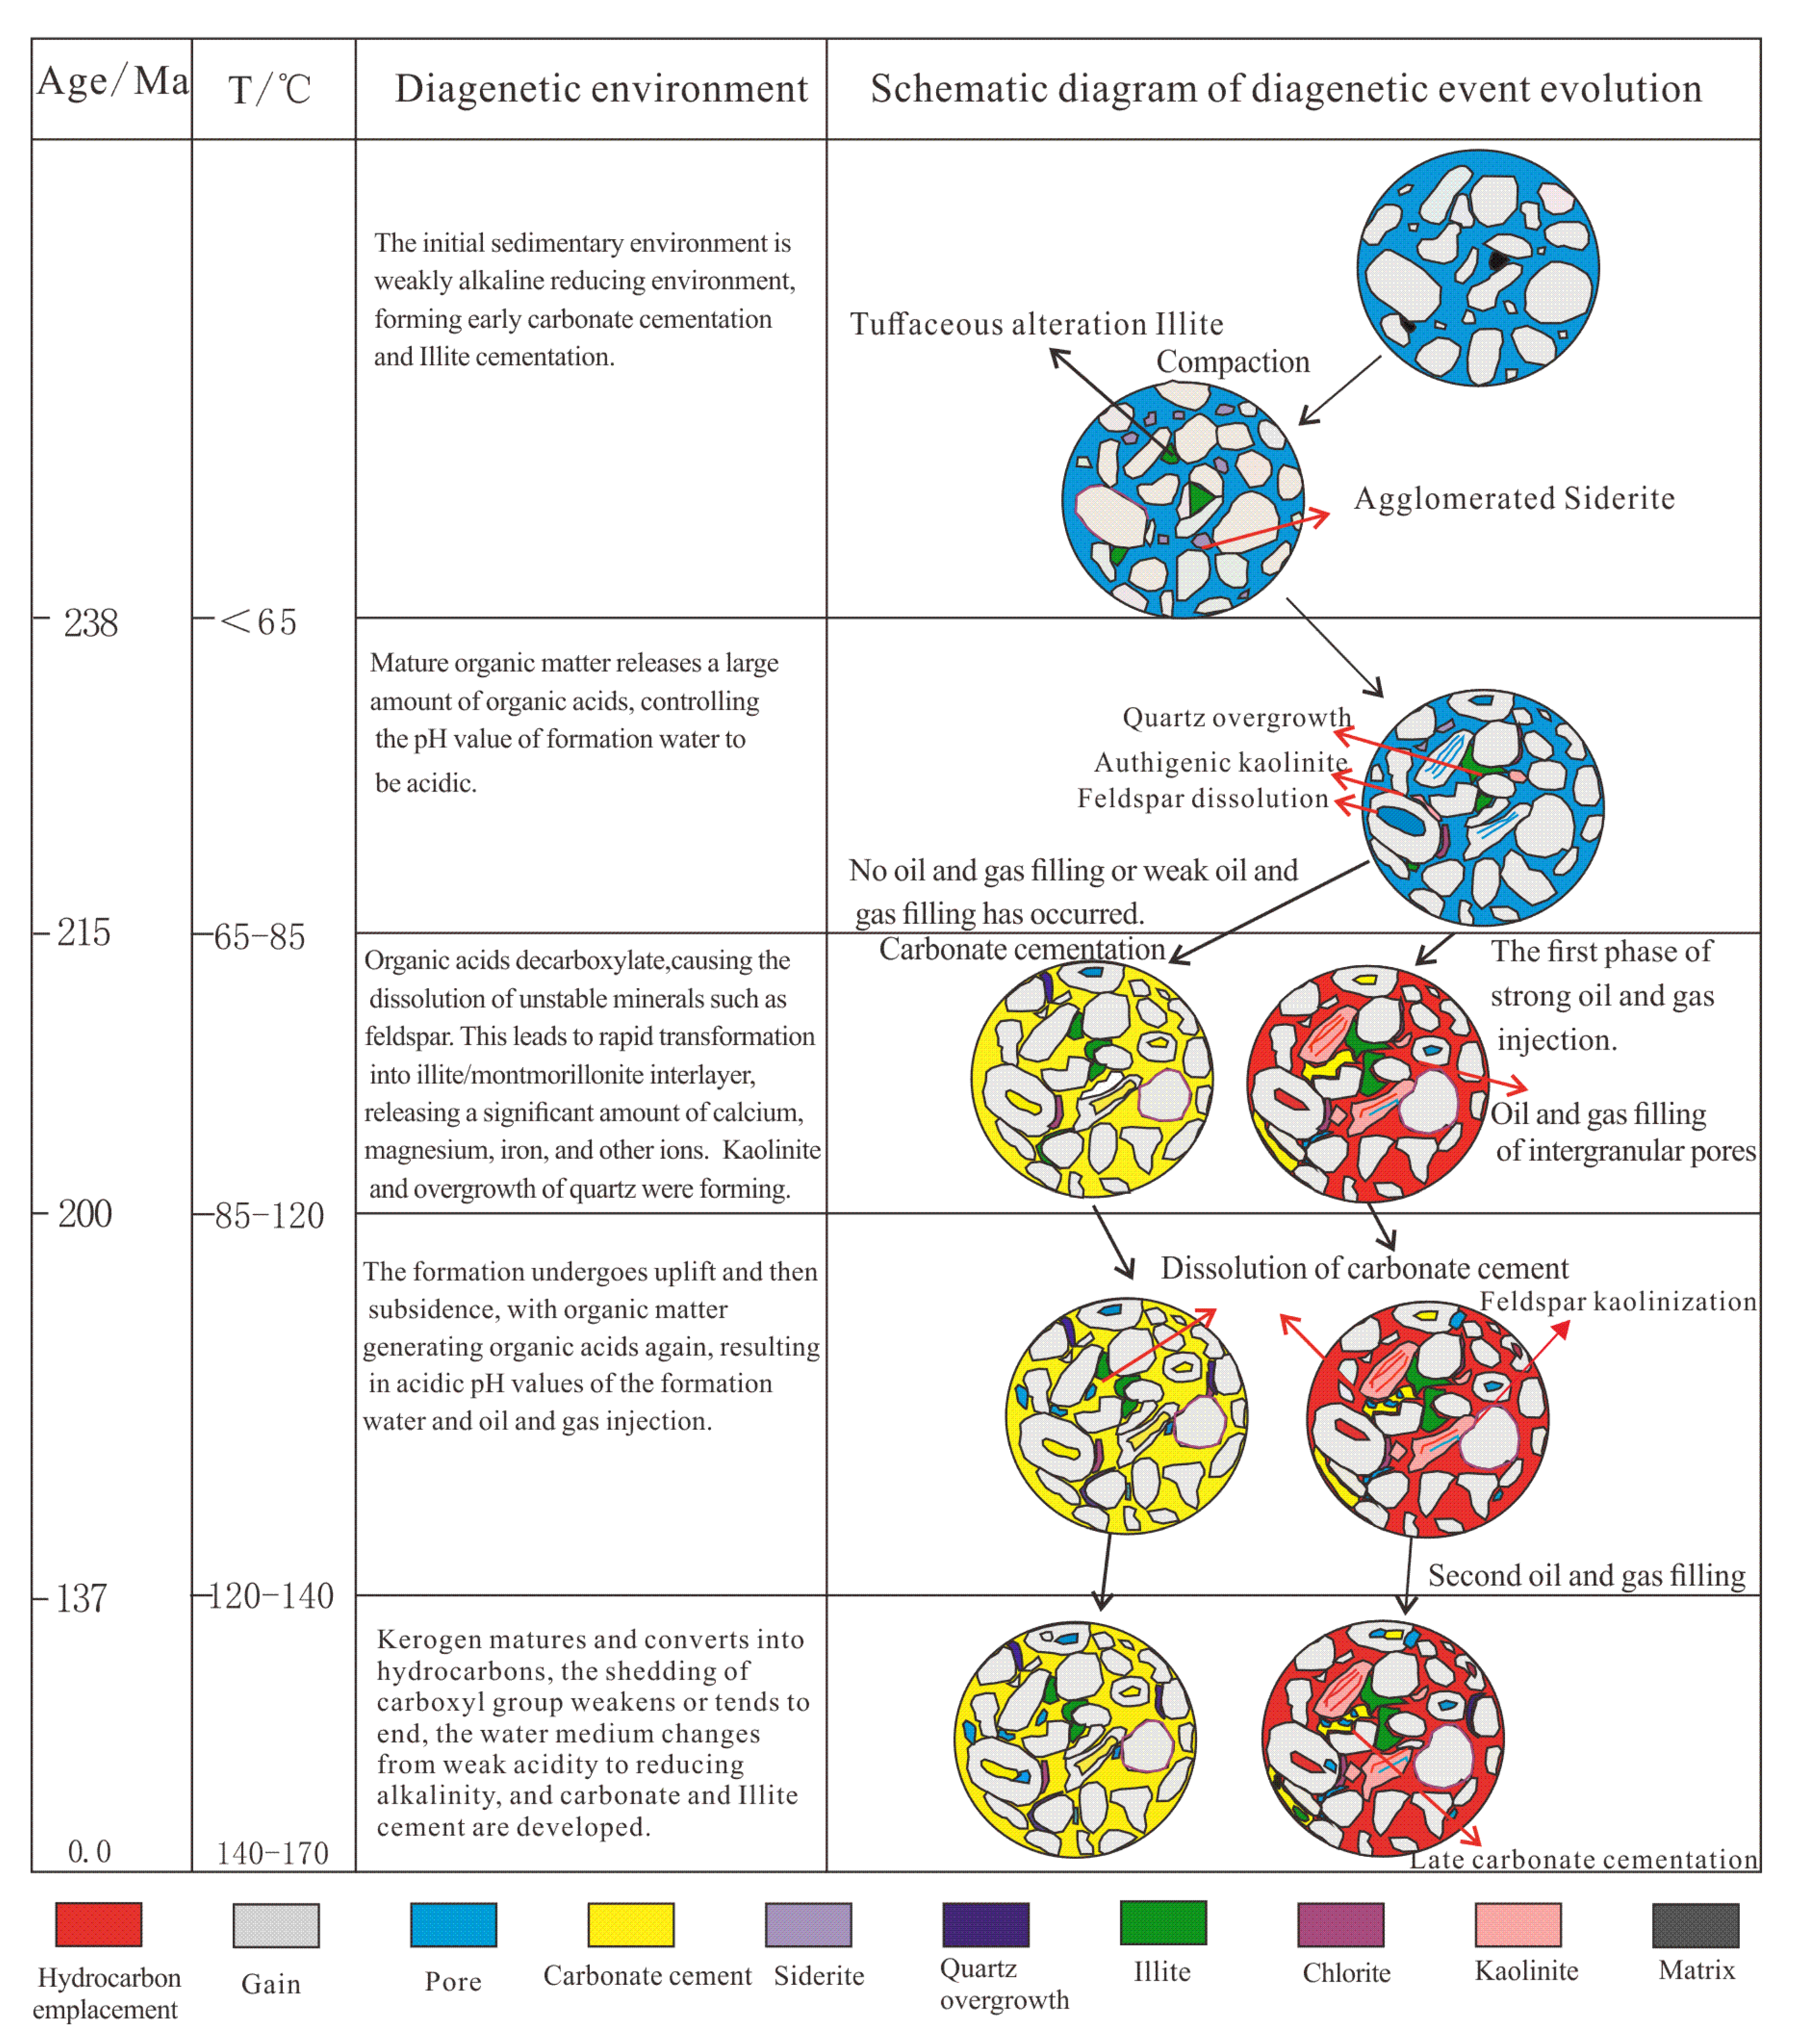
4.5. Diagenetic Evolution Sequence

The typical burial depth of the target layer in the study area ranges from 3400 to 4500 m. The reflectance of vitrinite, a type of organic matter, varies between 1.5 and 2.2. Additionally, the homogenization temperature of authigenic quartz inclusions falls within the 80 to 150 °C range. Applying China’s criteria for classification of diagenetic stages of clastic rocks (SY/T 5477-2003) [16], it has been determined that the reservoir of Shan-1 mainly exhibits diagenetic characteristics corresponding to the B stage of intermediate diagenesis (Figure 7).
A comprehensive analysis of thin cast sections, scanning electron microscopy, X-ray diffraction analysis data, and the generation sequence and interspersed relationship of authigenic minerals, along with the structural characteristics of debris and interstitial materials, allowed for the identification of the diagenetic evolution sequence of various minerals. The relative order of diagenetic evolution reveals that the diagenetic changes in the clastic rocks of the Shan-1 Member can be divided into four stages: early diagenetic phase A, early diagenetic phase B, middle diagenetic phase A, and middle diagenetic phase B. Figure 7 illustrate the diagenetic evolution paragenesis sequence.
During the early diagenetic stage A (C2–T2), the basin experiences stable subsidence with a burial depth of less than 1200 m and a temperature below 65 °C (Figure 8). At this stage, the reflectance of vitrinite (Ro) is below 0.35%, indicating an immature stage of organic matter evolution. Mechanical compaction results in particles becoming closely packed, while hydrous alteration causes the expansion of plastic rock fragments like biotite. Consequently, the pores are filled with pseudo-heterogenization. Volcanic stucco, microcrystalline quartz, and detrital particles infiltrate, forming a montmorillonite lining. The decomposition of biotite and volcanic rock debris generates Mg2+ and Fe2+ ions, precipitating mud crystal calcite and siderite aggregates along the cleavage surfaces of expanded biotite.
Early diagenesis stage B (T2–mid-stage of T3): The burial depth ranges from 1200 to 2000 m, with a paleotemperature of approximately 85 °C (Figure 8). The reflectance of vitrinite (Ro) remains below 0.5%, indicating a semi-mature stage of organic matter evolution. The primary pore content diminishes as the burial depth gradually increases, and the compaction effect strengthens. Within argillaceous rock, organic matter undergoes decay, forming a substantial amount of humic acid, which acidifies the pore fluid. Unstable silicate minerals like feldspar, biotite, and rock debris undergo alteration, resulting in the precipitation of SiO2 and kaolinite. Simultaneously, a significant amount of HCO3- is generated, further contributing to the weakly acidic nature of the pore water. The montmorillonite lining gradually transforms into the chlorite group and illite by forming the chlorite group/montmorillonite or illite/montmorillonite mixed layers.
Intermediate diagenetic stage A1 (mid-T3–T3): The burial depth ranges from 2000 to 3300 m, with a paleotemperature of approximately 120 °C (Figure 8). The reflectance of vitrinite (Ro) exceeds 0.6%, indicating that organic matter has reached the threshold for oil generation. During the transformation of organic matter into hydrocarbons within source rocks, the release of CO2 results in pore fluid acidity, leading to the dissolution of unstable components in sandstone and the formation of secondary pores. The authigenic chlorite group, kaolinite, and illite are formed and partially fill the pore space. Through the alteration of biotite and the catalytic effects of kaolinite and hydromica, chemical pressure solution action on quartz particles intensifies, gradually forming enlarged edges in secondary quartz. As a result, primary pores are significantly reduced.
Mesodiagenesis stage A2 (T3–J3): The burial depth ranges from 3300 to 4000 m, with a paleotemperature of 140 °C (Figure 8). The reflectance of vitrinite (Ro) remains below 1.3%, indicating mature organic matter and the peak of hydrocarbon generation. The H+ ions provided by organic acids continue to dissolve unstable components, developing numerous secondary pores. The increased CO2 content leads to a continuous decrease in pH value. Substantial amounts of the authigenic chlorite group, kaolinite, illite, and granular microcrystalline quartz are formed. Overgrowth of quartz grows into pore spaces, filling the pores and metasomatized intergranular kaolinite.
Middle diagenetic stage B (K1–Q): Burial depths exceed 4000 m, with a maximum depth reaching 5500 m. The paleotemperature ranges from 140 to 170 degrees Celsius (Figure 8), and vitrinite (Ro) reflectance ranges from 1.3% to 2.0%, indicating highly mature organic matter. Kerogen undergoes ripening and transformation into hydrocarbons, with a weakening or, near the conclusion of the carboxyl group, shedding and medium aqueous transitions from weakly acidic to reducing alkaline, facilitating the formation of carbonate cement. Almost all quartz grains exhibit overgrowth edges, and the interconnection of authigenic quartz crystals leads to their interlocking. The stability of kaolinite gradually weakens. In the presence of water rich in K+ and Al3+, kaolinite transforms into illite, while in the presence of Mg2+ and Al3+ rich water, it transforms into the chlorite group. Tectonic stress causes the formation of microcracks in the rocks.

4.6. Paleophysical Recovery of Tight Sandstone Reservoir

Based on the observation and analysis of diagenetic phenomena, the diagenetic evolution sequence of a tight reservoir in the Shan-1 Member of the study area was established by examining the characteristics of authigenic minerals, pore fillings, and inclusions (Figure 7 and Figure 8). The target layer in the study area is typically buried at depths ranging from 3400–4500 m, with vitrinite reflectance Ro values ranging from 1.5 to 2.2. The homogenization temperature of authigenic quartz inclusions falls between 80–160 °C. Based on comprehensive analysis, the diagenetic evolution stage of the reservoir in the first member of the study area corresponds to stage A–B of middle diagenesis, according to the classification standard of diagenetic stages in China (SY/T 5477-2003) (Figure 7).
Using the diagenetic evolution sequence and characteristics of the diagenetic environment, the age corresponding to the intersection of the homogenization temperature of quartz and calcite inclusions, the paleotemperature of the main diagenetic stage, and the absolute age from the burial depth thermal evolution curve served as the age constraint to calculate the geological history age and ancient burial depth of other cements.
Following the principle of “back stripping by inversion”, the pore characteristics were restored before each key diagenetic stage, which involved quantitatively determining the content of each cement and the percentage of dissolution porosity using a combination of manual drawing and computer image analysis with the assistance of a LEICA polarizing microscope DM4500P [12]. By establishing the functional relationship between thin-section porosity and visible reservoir porosity, thin-section porosity was converted to visible reservoir porosity. Guided by the diagenetic evolution sequence, the porosity at the beginning and end of each key diagenesis stage was restored using the principle of “back stripping by inversion”.
The paleo burial depth at the beginning and end of each stage was determined through the accurate projection of critical diagenesis times on the burial history map. This information was obtained by the back-stripping porosity under each paleo burial depth. After correction for mechanical compaction, the quantitative restoration of the porosity evolution process was achieved.
A case study was conducted on a 4368.37 m sandstone sample from the Long 36 well for paleophysical recovery, as presented in Table 1. Based on the statistical analysis of thin-section identification data, the primary interstitial materials in the reservoir are illite, siliceous, and kaolinite, with intergranular dissolution pores being the dominant corrosion pores (Table 1). The Trask sorting coefficient is 1.38, the current porosity is 5.3%, and the thin-section porosity is 4.1%. The original porosity of the sandstone, calculated using Formula 1, was 37.5%.
According to Formula (2), the total porosity lost due to compaction is 20.99%. The early diagenesis stage A, occurring from approximately 290 to 238 million years ago, was primarily a compaction stage, at a burial depth of 1200 m (Figure 6). The porosity loss caused by compaction during this period was 9.5%, reducing the porosity from 37.5% to 28%. From 238 million years ago to today, the total porosity lost amounts to 11.49%, with burial depths of 2000, 3200, 3900, and 4800 m, as determined in Figure 1. The compaction ratios for these depths were 0.44:0.22:0.06:0.02 (Table 2). The cementation or dissolution pores were converted into their corresponding porosity using the formula shown in Figure 1 (Table 1).
The diagenetic evolution stages and their corresponding inversion recovery porosities are as follows:
Approximately 290 million years ago, compaction, feldspar dissolution, and quartz overgrowth began, with a paleo-burial depth of approximately 0 m and an inversion recovery porosity of 37.50% (Figure 9).
Around 238 million years ago, feldspar dissolution, quartz overgrowth, authigenic kaolinite, and chlorite cementation occurred at a paleo-burial depth of approximately 1200 m, resulting in an inversion recovery porosity of 28.0%.
Approximately 215 million years ago, early carbonate cementation, quartz overgrowth, and kaolinite alteration occurred at a burial depth of approximately 2000 m. The inversion recovery porosity was 15.47% (28 − (20.49 − 14.79) − 6.83).
Around 200 million years ago, carbonate cement dissolution began at a paleo-burial depth of approximately 3200 m, resulting in an inversion recovery porosity of 10.77% (15.47 − (14.79 − 13.51) − 3.42).
Around 137 million years ago, late carbonate and illite cementation occurred at a paleo-burial depth of approximately 3900 m, resulting in an inversion recovery porosity of 7.74% (10.77 − (13.51 − 11.41) − 0.93).
After slight adjustments in the later stages, the current porosity is 5.3% (Figure 9).
The upper limit of porosity in tight sandstone is typically 10%, with a permeability of 0.1 mD [17]. This study examined the densification timing of the Upper Paleozoic reservoir. By reconstructing the paleophysical properties of the tight sandstone reservoir, it was determined that the Upper Paleo reservoir in the study area underwent densification during the early Jurassic, specifically 195 million years ago, with a porosity of 10% serving as the densification boundary (Figure 9).

5. Discussion

Pittman (1991) determined that without considering cementation, approximately 23% of pores could be preserved at a buried depth of 4500 m when the clastic component consisted of 75% quartz. However, if the quartz content accounted for 50%, only about 9% of the pores could be preserved [18]. In the Shan-1 Member, the clastic quartz content ranges from 50% to 70% (average: 60.84%). Despite the generally deep burial depths exceeding 4000 m, it is evident that compaction alone has not led to reservoir densification, which suggests that compaction is not the decisive factor in the formation of the Shan-1 Member. Extensive analysis of thin sections and SEM data has revealed that compaction and cementation were crucial factors contributing to reservoir densification.

5.1. Densification Caused by Compaction

Compaction occurring between deposition and epigenesis and has significantly influenced the studied reservoir of the Shan-1 Member (Figure 7 and Table 2). The physical properties of reservoirs formed during different periods exhibit a decrease as burial depth increases, albeit with varying rates. Compaction primarily affects reservoir properties during the early diagenetic stage, whereas its impact diminishes later. During the early diagenesis, sedimentary particles are relatively loose, allowing for particle rotation, rearrangement, displacement, and plastic deformation under the applied pressure.
Changes and rearrangement of grains and structures characterize the compaction process in the Shan-1 Member reservoir. As compaction intensifies, the contact relationship between sandstone particles transitions from free to point contact, line contact, concave–convex contact, and suture contact. Consequently, the original porosity of the sandstone decreases from high to low, leading to a subsequent decline in permeability, which is irreversible. This physical property deterioration becomes more significant with increasing burial depth. In our study samples, the total reduction in porosity caused by compaction accounts for 55.97% and is the primary factor influencing reservoir quality (Table 1).

5.2. Densification Caused by Cementation

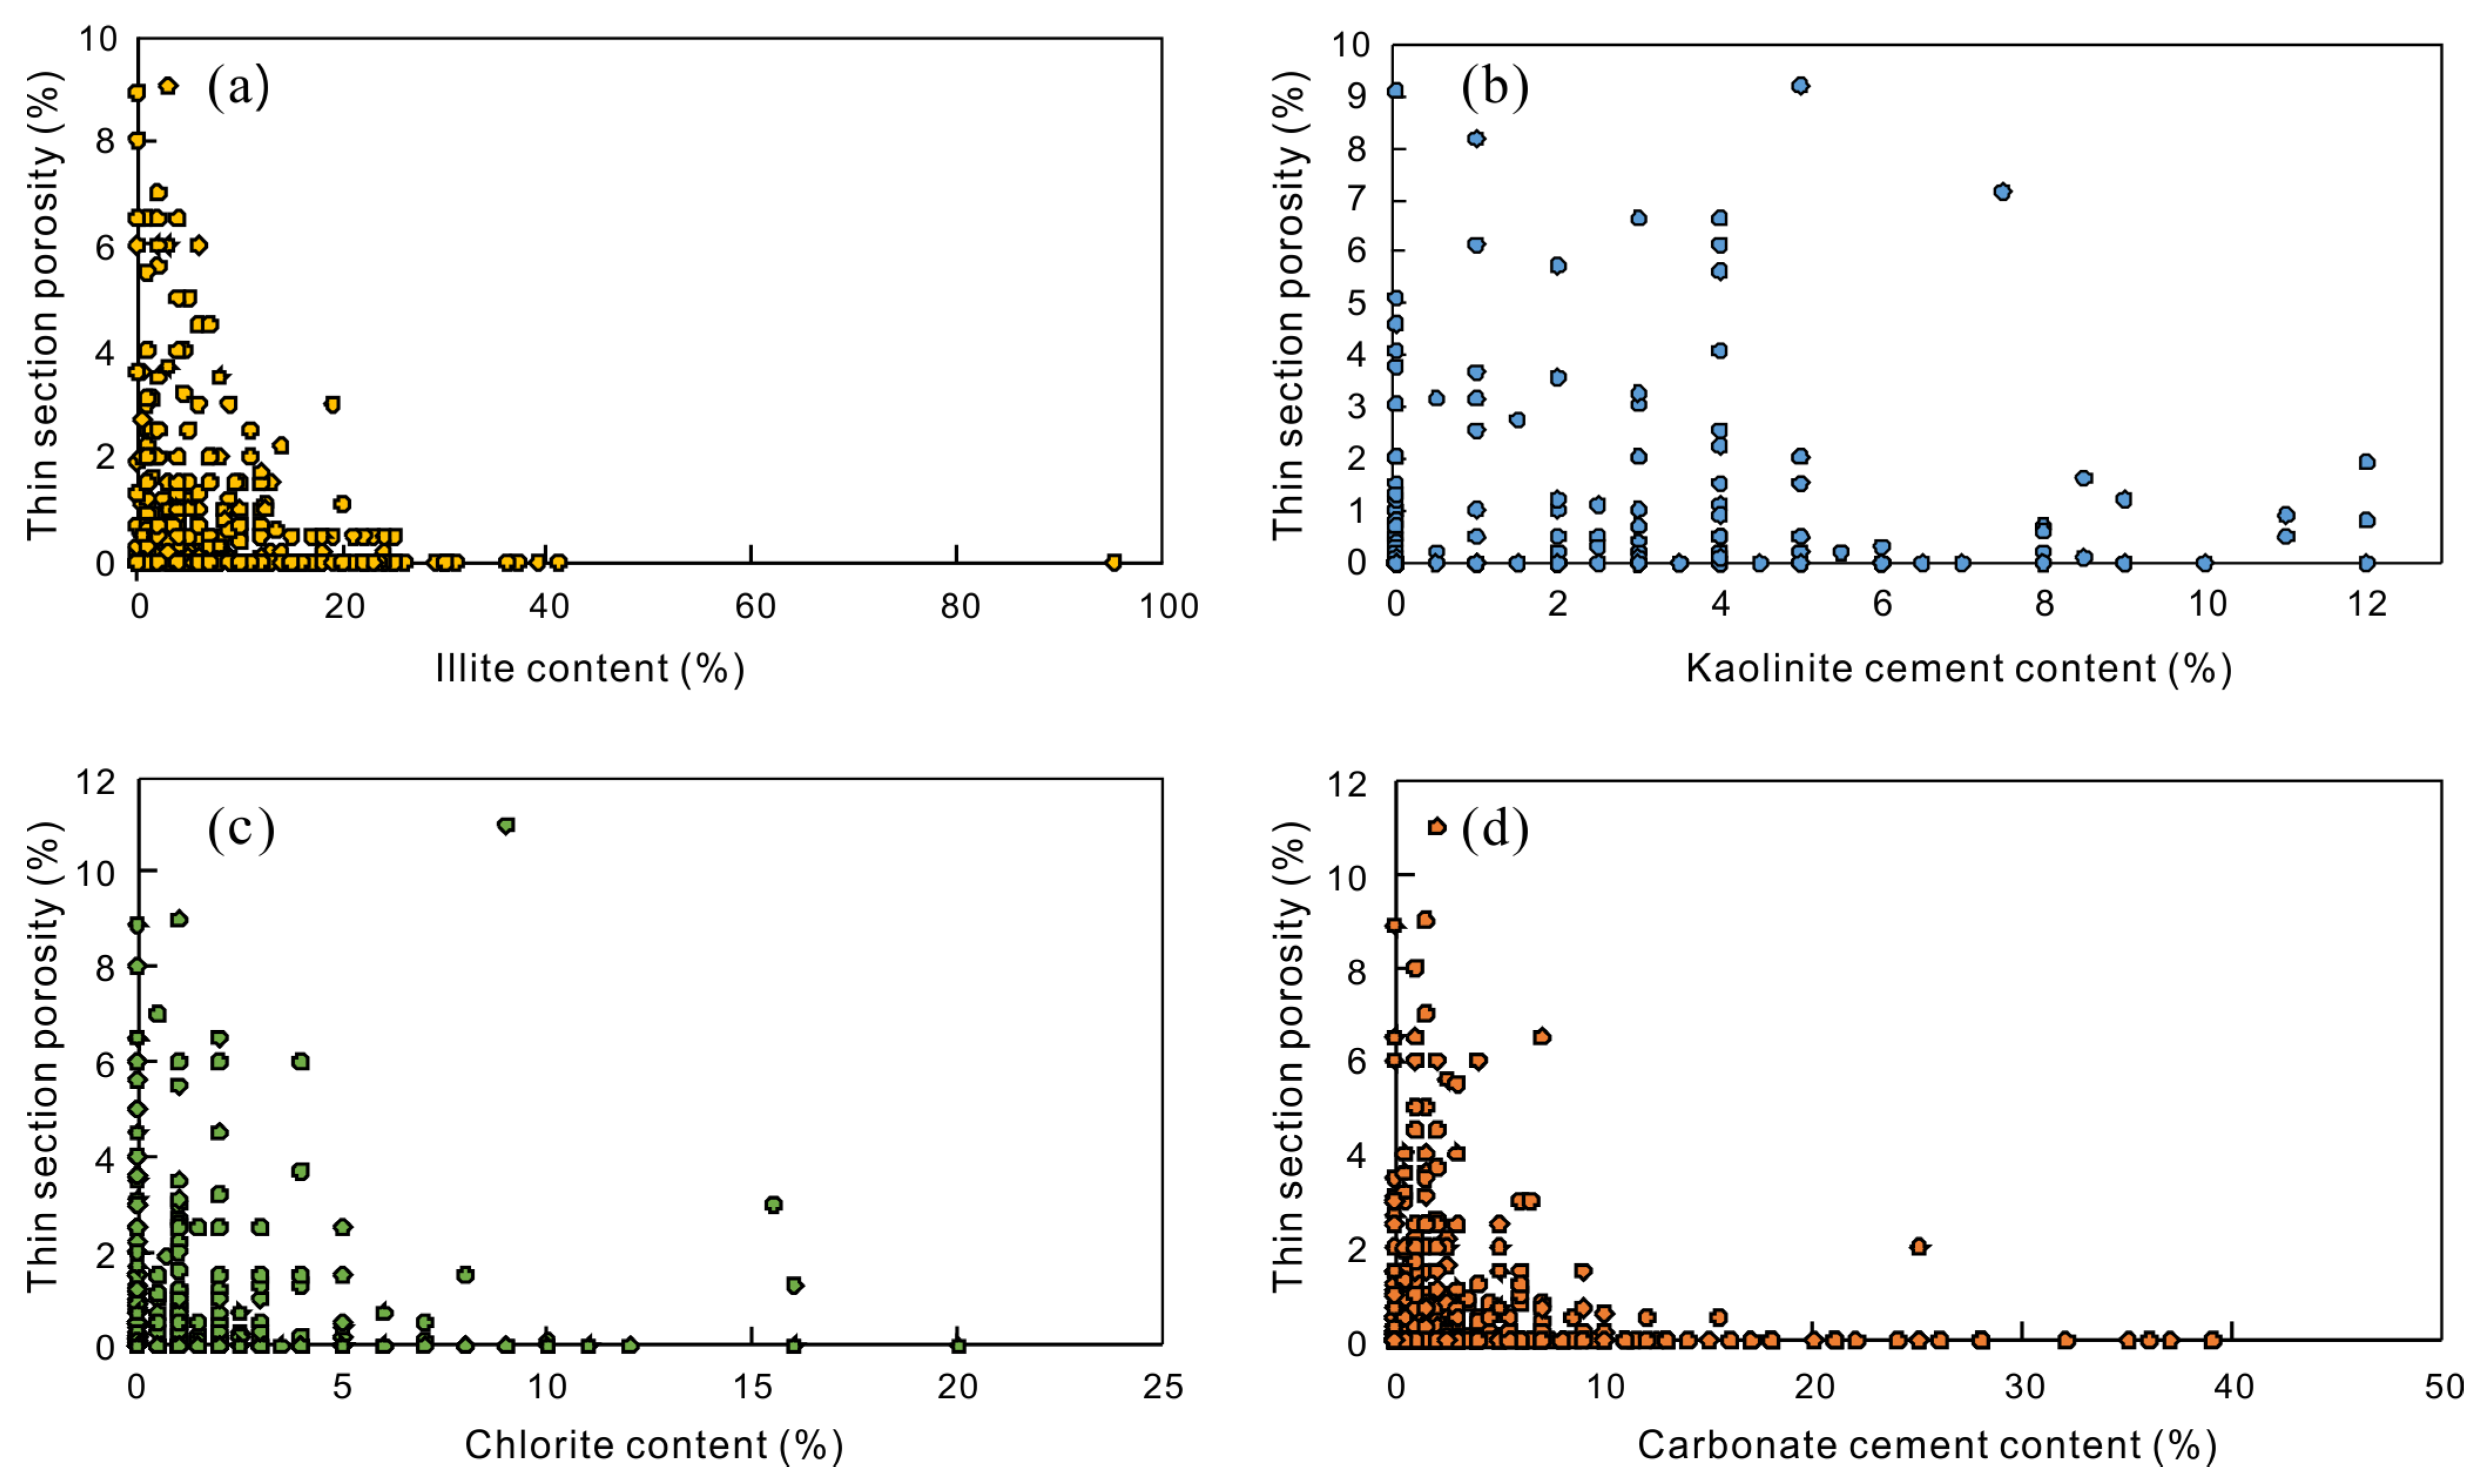
5.2.1. Influence of Clay Mineral Cementation

Clay minerals influence sandstone reservoirs, including their content, composition, and occurrence [19]. Illite content increases with greater burial depth, resulting in deteriorating physical properties of the sandstone and a decrease in thin-section porosity (Figure 10). Illite formation mainly depends on temperature, occurring predominantly at 120–140 °C, corresponding to a time frame of approximately 160 Ma to 130 Ma (Figure 11). This period coincides with reservoir densification, during which kaolinite or montmorillonite from the early stage transforms into illite. The porosity reduction rate attributed to illite is 12.43%, making it the primary factor affecting porosity within clay minerals.
Additionally, the occurrence of clay minerals has a specific impact on the physical properties of sandstone [20]. Illite shows a negative correlation with thin-section porosity, whereas kaolinite exhibits a weak positive correlation (Figure 10a). Due to differences in crystal morphology and occurrence between illite and kaolinite, their correlation varies. Clay minerals can generally be categorized as either liner types or filling types. Liner-type clay minerals typically develop as films and sheaths on particle surfaces, whereas filling-type clay minerals are distributed in various interstitial forms.
Liner-type clay minerals include montmorillonite/illite, montmorillonite-interstratified, illite, and chlorite. Autogenous liner types are initially distributed on particle surfaces in the form of montmorillonite. As the transformation to illite/montmorillonite interlayer minerals occurs, tongue-like and filiform illite/montmorillonite extend into the pores. This replacement occurs across grain surfaces and between grains, forming ribbons and wire meshes, leading to pore shrinkage and plugging. Illite can also bridge and seal off pore throats, observable under SEM in our samples, causing a significant reduction in rock permeability. Non-autogenous liner types consist of authigenic flake illite attached to particle surfaces, mainly distributed around the particle edges. The non-authigenic liner edges are generally smoother than authigenic liners, with a thickness ranging from seven μm to ten μm. Although non-autogenous liners have minimal impact on reservoir performance, they can somewhat inhibit the precipitation of non-clay authigenic minerals, thus protecting the pores.
Filling-type clay minerals mainly comprise kaolinite and illite. Kaolinite exhibits better permeability than other clay minerals, especially illite, due to its crystallization characteristics and filling mode. Kaolinite, predominantly in book pages and vermicular forms, fills the pores as a secondary skeleton with coarse particle size and better crystallinity. This results in numerous micropores between grains, enhancing pore connectivity and minimizing damage to reservoir properties compared to other clay minerals. When the kaolinite content is below 5%, it positively correlates with thin-section porosity. However, when the content exceeds 5%, it exhibits a weak negative correlation with plane porosity (Figure 10b). The occurrence of kaolinite is primarily of the filling type, occupying a certain amount of pore space. Consequently, when the kaolinite content is high, thin-section porosity cannot be too high, and the reduction rate of reservoir porosity accounts for 6.91%.
Chlorite typically forms as a rim and belongs to first-generation cement, primarily occurring in the early diagenetic stage. It plays a crucial role in the evolution of sandstone pores in two aspects. Firstly, it enhances the anti-compaction characteristic of sandstone, helping preserve the primary pores. Secondly, research results indicate that chlorite is particularly effective in inhibiting quartz. When the chlorite group content is below 3%, it positively correlates with thin-section porosity. However, when the chlorite group content exceeds 3%, it negatively correlates with thin-section porosity (Figure 10c).

5.2.2. Influence of Carbonate Cementation

Carbonate cementation, whether through precipitation or replacement, has dual effects on reservoir physical properties, which depend on its content and the timing of its formation [21]. While some carbonate cements can inhibit compaction and pressure dissolution to a certain extent, they can also provide materials for secondary pore formation [22]. However, when the carbonate content is excessively high, especially significantly when a basal cemented texture forms in the reservoir, it can completely block pores and throats. In that case, this interference hinders reservoir transformation facilitated by the later-stage mixing of acid pore water, forming a low-permeability reservoir. Hence, the relationship between carbonate cement content and porosity or permeability is complex.
In general, when the carbonate content is less than 5%, the thin-section porosity of sandstone is typically above 2%. However, when the carbonate content exceeds 5%, the thin-section porosity of sandstone is usually below 1.5%—and often below 0.5%. A negative correlation exists between carbonate content and thin-section porosity (Figure 10d). The reduction in porosity caused by carbonate cement is 10.37%. In our study area, siderite caused a porosity reduction of 1.73% from the early diagenetic stage B to the middle diagenetic stage A1. In comparison, iron calcite and iron dolomite caused a reduction of 8.64% in the intermediate diagenetic stage B.

5.2.3. Influence of Quartz Overgrowth

Quartz overgrowth is a common diagenetic phenomenon observed in the Upper Paleozoic Shan-1 Member reservoir in the SW Ordos Basin, with a content ranging from 0.5% to 13%. This quartz overgrowth primarily occurred during the B stage of middle diagenesis and significantly impacts reservoir porosity. Typically, the porosity is reduced by 3.23%, resulting in a porosity reduction rate of 8.61%.
When the quartz cement content is low, it can enhance the compressive strength of sandstone and preserve primary pores. However, the dissolution and alteration processes are relatively weak, leading to a reduction in secondary pores. Conversely, when the quartz cement content is high, it can block the pore throats between clastic particles, forming a mosaic structure that disrupts the primary pores of the sandstone. As a result, the permeability of the reservoir is significantly reduced. Nevertheless, later dissolution and alteration processes can form more secondary pores. The interaction between these two aspects complicates the relationship between quartz cement and the physical properties of sandstone. Additionally, there is a negative correlation between quartz content and thin-section porosity.

5.3. Influence of Low Dissolution on Reservoir Densification

Another significant factor contributing to the tight reservoir characteristics in the studied Shan-1 Member reservoir in the study area is the limited occurrence of dissolution. Only a small amount of feldspar and debris have undergone dissolution. The total dissolution has increased the porosity by 2.96%, contributing 7.89% to the overall porosity.
On the one hand, many primary pores have been destroyed due to compaction, and the remaining primary pores exhibit a poor structural arrangement, which hinders fluid entry for dissolution during later stages. The only favorable location where well-preserved residual primary pores are found is within layers containing a high proportion of rigid particles, facilitating fluid entry for dissolution and selective dissolution of feldspar and debris.
On the other hand, hydrocarbon expulsion primarily occurred between 150–100 Ma (Figure 11), with a source rock conversion rate ranging from 35% to 84.75%. However, due to reservoir densification, it has been challenging for organic acids to extensively penetrate the tight reservoir and dissolve unstable components on a large scale.
Dissolution is a significant diagenetic process that enhances the porosity and permeability of reservoirs. However, due to limited dissolution in the Shan-1 reservoir, only slight improvements have been observed in its initially compacted and cemented form, indirectly reflecting the impact of early diagenesis on reservoir damage. This initial weakness has been further exacerbated by the inadequate reaction space available in later stages (between acidic pore fluids and the rock) to enhance reservoir dissolution.

6. Conclusions

(1)
Compaction is an essential factor contributing to reservoir densification, but is not the sole determining factor. Cementation also plays a significant role in reservoir densification. Furthermore, limited dissolution is a critical factor contributing to reservoir densification.
(2)
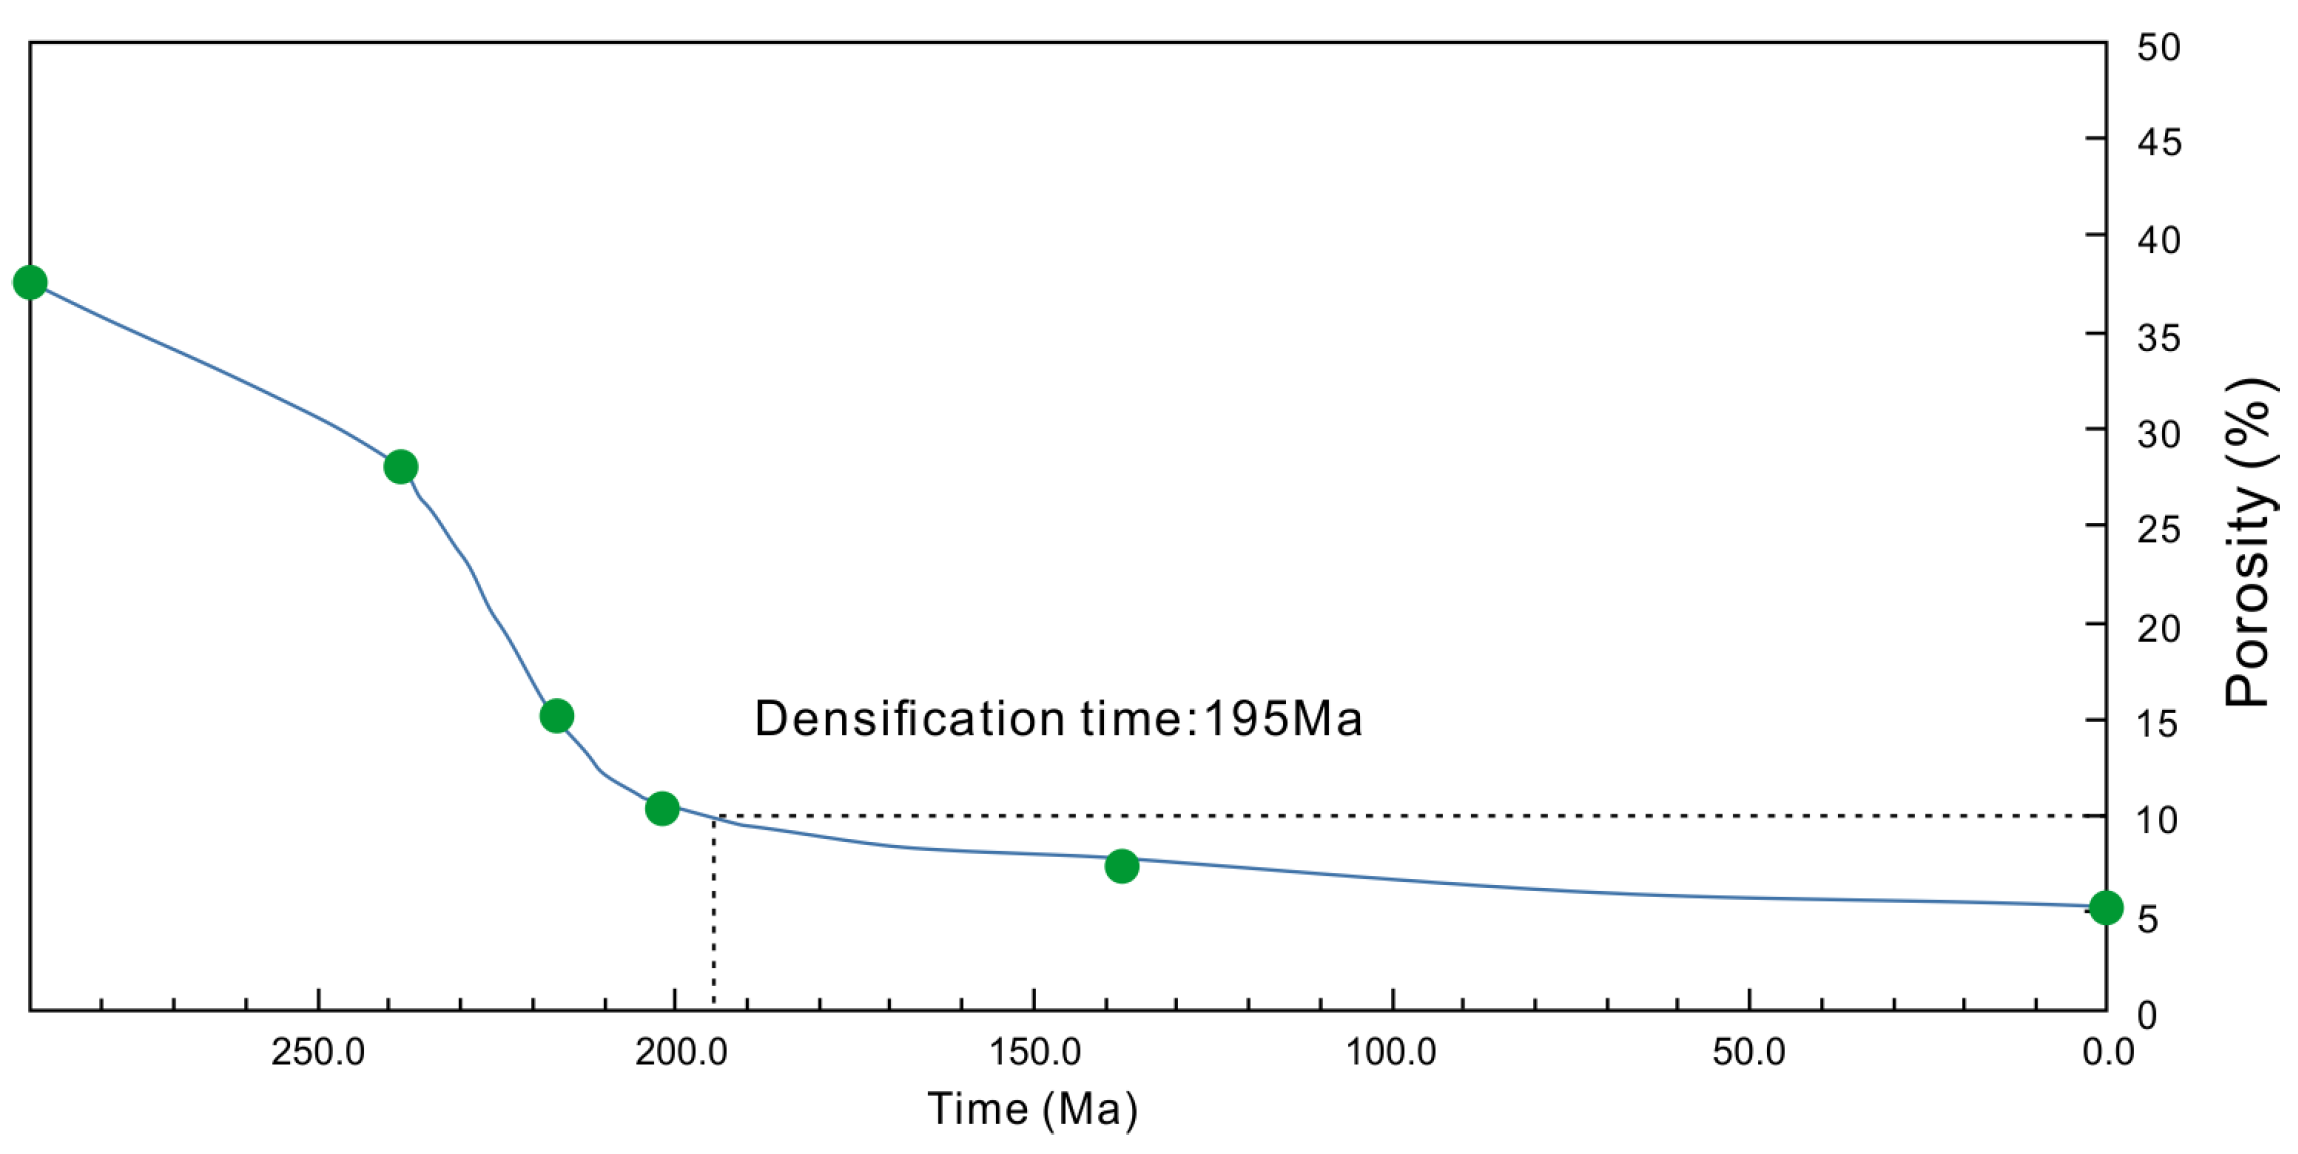
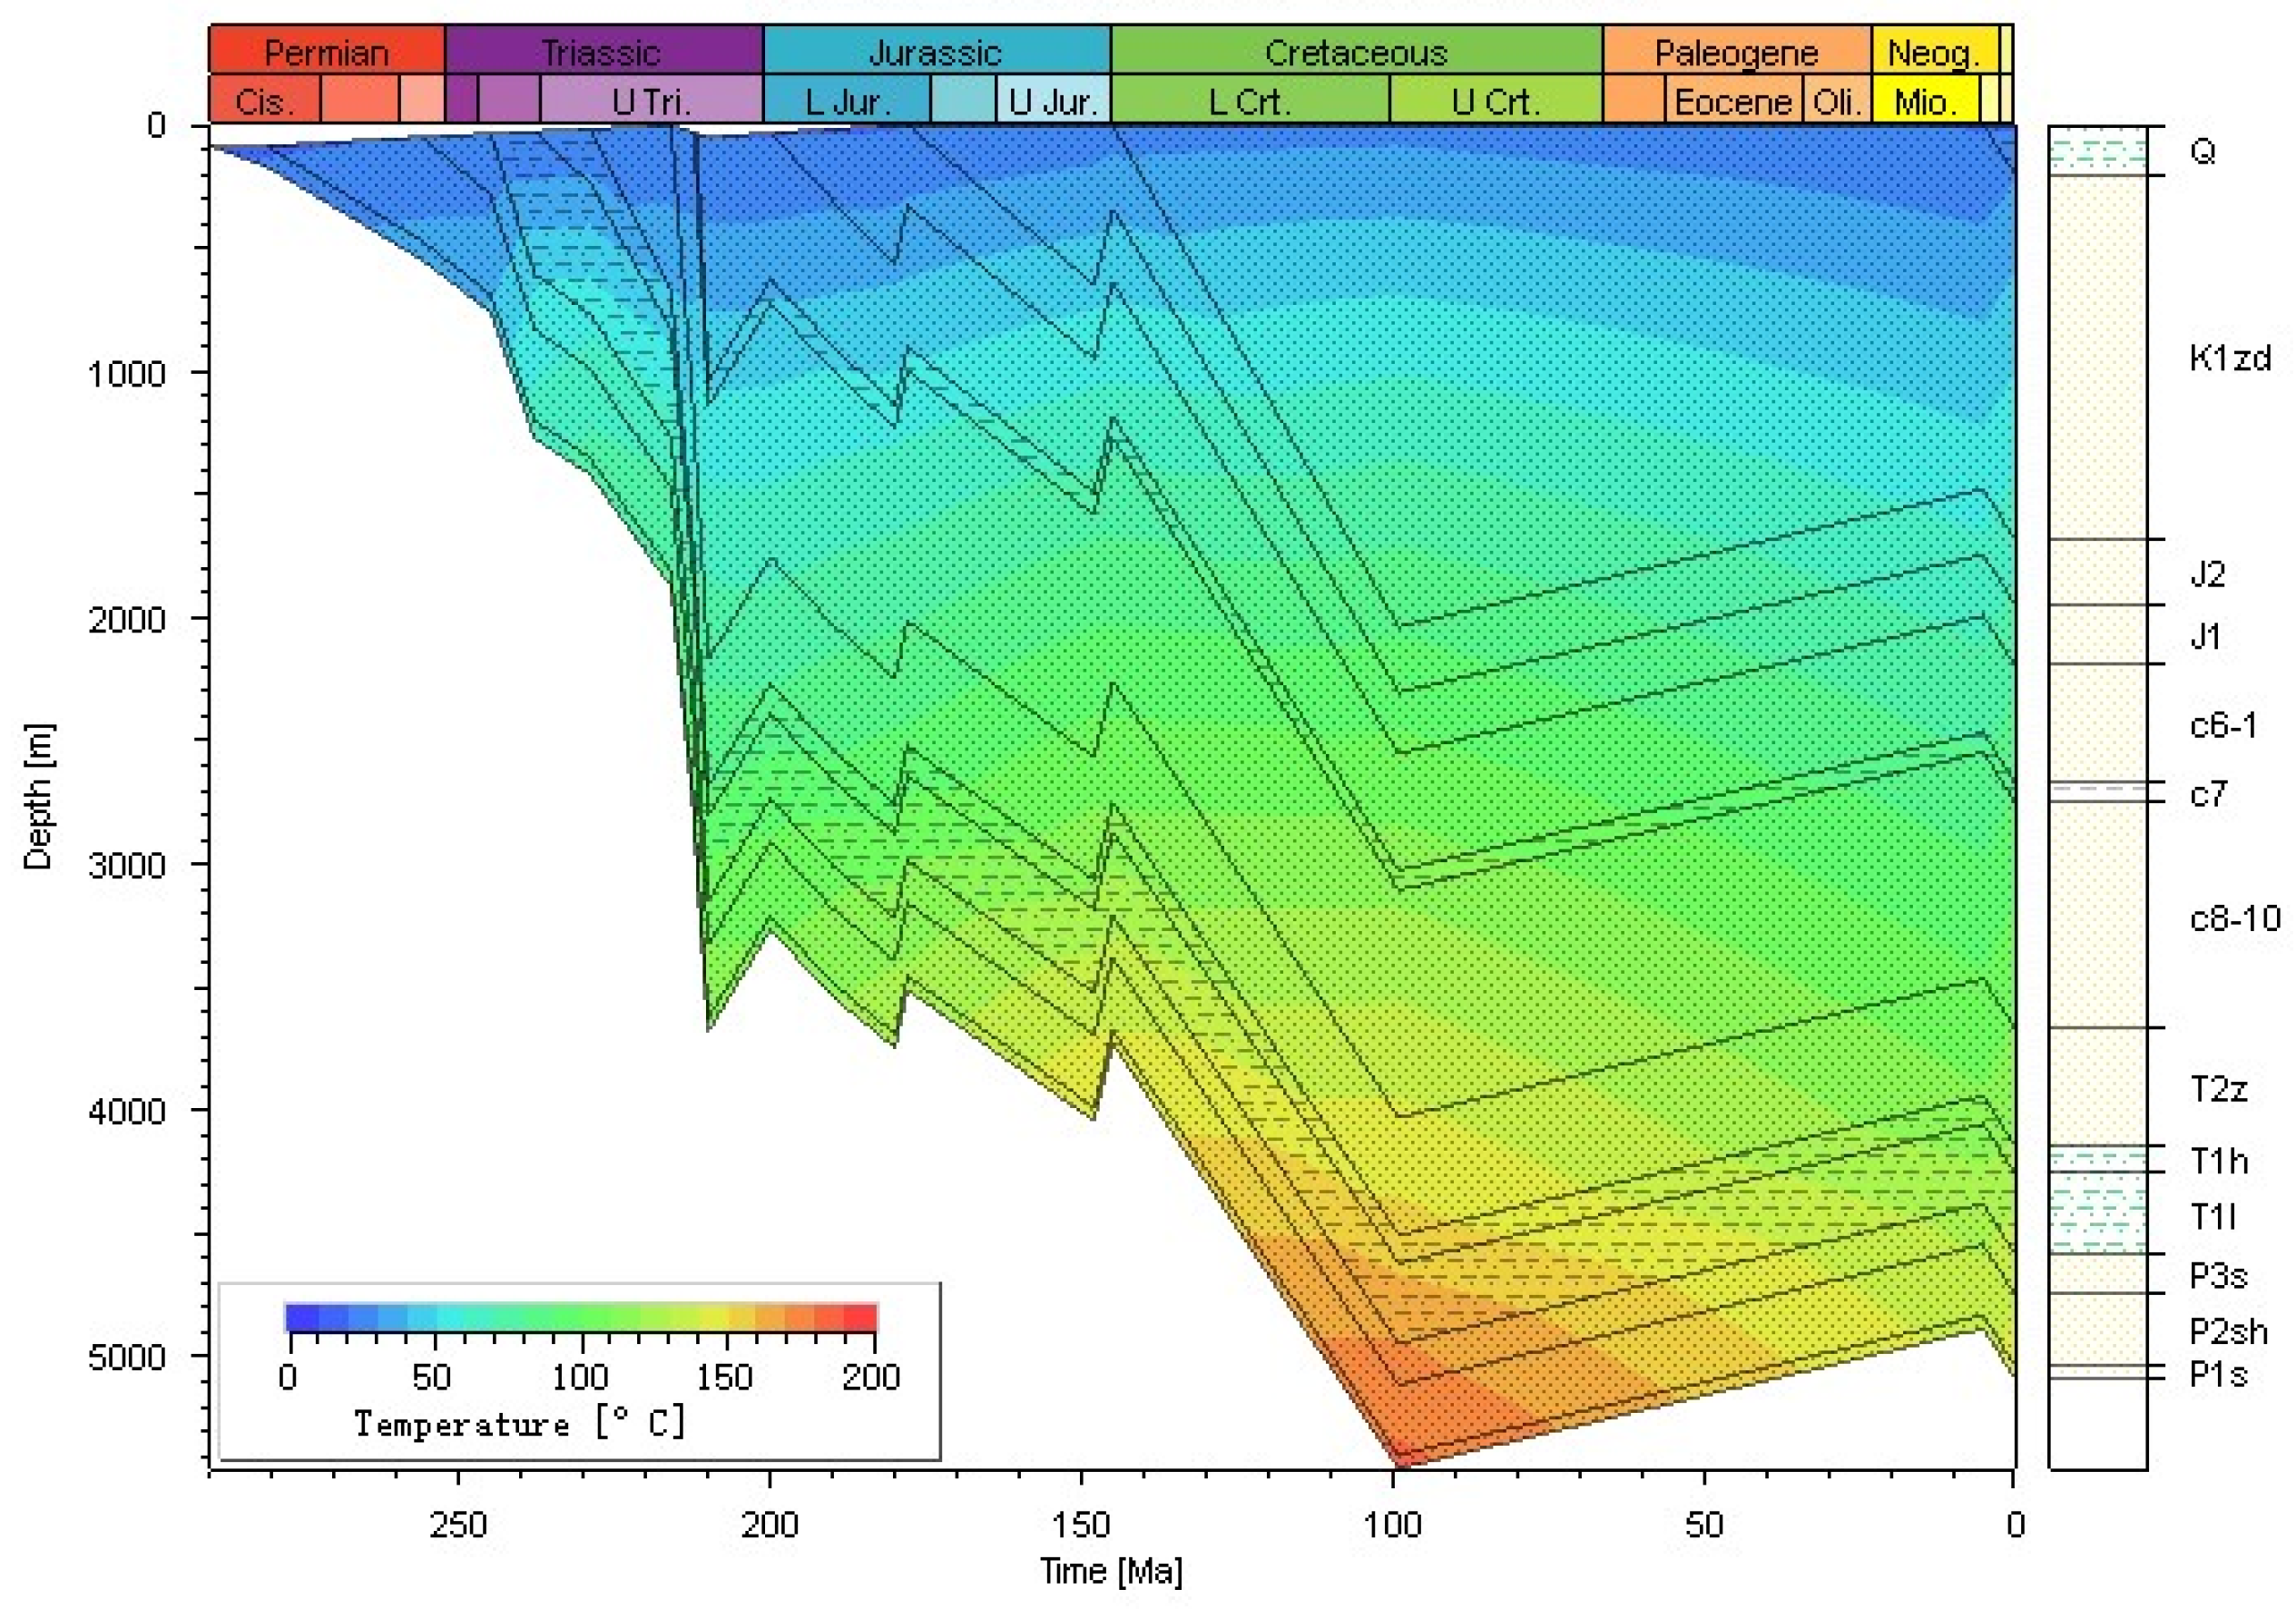
By applying the “back stripping” principle and utilizing the mechanical compaction correction method, the paleophysical tight reservoir properties of the Shan-1 Member of the study area have been restored. The evolution of pore characteristics in the tight reservoir was analyzed. It is concluded that reservoir densification occurred around 195 million years ago during the early Jurassic period.
(3)
Illite cementation primarily occurred through the transformation of kaolinite or montmorillonite during the B stage of middle diagenesis, which coincides with the time of reservoir densification. Illite cementation is identified as the primary factor influencing reservoir densification among all cement types.

Author Contributions

Conceptualization, L.X. and Q.W.; software, L.Y.; validation, L.X. and Q.W.; formal analysis, L.Y.; investigation, L.Y.; resources, X.Z. and X.G.; writing—original draft preparation, L.X.; writing—review and editing, Q.W. All authors have read and agreed to the published version of the manuscript.

Funding

This project was financially supported by the National Science and Technology Major Program (2016zx00500).

Data Availability Statement

Data not available due to commercial restrictions.

Conflicts of Interest

The authors declare no conflict of interest.

References

  1. Lou, T.Y.; Feng, C.J.; Sun, M.S.; Chen, Z.Q. The Upper Triassic Braided River Thin-Bedded Tight Sandstone in the Yanchang Formation, Ordos Basin: Sedimentary Characteristics, Seismic Forecasting Method, and Implication. Processes 2023, 11, 1303. [Google Scholar] [CrossRef]
  2. Wei, Q.L.; Mei, J.H.; Tian, J.C.; Chen, X.; Xiao, L. Pore structure analysis of tight reservoirs in the He-8 Member of Upper Paleozoic in the southwestern Ordos Basin, China. Interpretation 2022, 10, 681–692. [Google Scholar] [CrossRef]
  3. Xiao, L.; Bi, L.; Yi, T.; Lei, Y.T.; Wei, Q.L. Pore Structure Characteristics and Inflfluencing Factors of Tight Reservoirs Controlled by Different Provenance Systems: A Case Study of the Chang 7 Members in Heshui and Xin’anbian of the Ordos Basin. Energies 2023, 16, 3410. [Google Scholar] [CrossRef]
  4. Wang, M.; Yang, Z.M.; Shui, C.J.; Yu, Z.; Wang, Z.F.; Cheng, Y.L. Diagenesis and its influence on reservoir quality and oil-water relative permeability: A case study in the Yanchang Formation Chang 8 tight sandstone oil reservoir, Ordos Basin, China. Geosciences 2019, 11, 37–47. [Google Scholar] [CrossRef]
  5. Olson, J.E.; Laubach, S.E.; Lander, R.H. Natural fracture characterization in tight gas sandstones: Integrating mechanics and diagenesis. AAPG Bull. 2009, 93, 1535–1549. [Google Scholar] [CrossRef]
  6. Lai, J.; Wang, G.W.; Wang, S.; Cao, J.T.; Li, M.; Pang, X.J. Review of diagenetic facies in tight sandstones: Diagenesis, diagenetic minerals, and prediction via well logs. Earth-Sci. Rev. 2018, 185, 234–258. [Google Scholar] [CrossRef]
  7. Wang, S.L.; Yang, X.R.; Lu, Y.Y.; Su, P.D.; Liu, D.; Meng, L.J.; Wang, Q.; Li, L.; Radwan, A.E. Densification mechanism of deep low-permeability sandstone reservoir in deltaic depositional setting and its implications for resource development: A case study of the Paleogene reservoirs in Gaoshangpu area of Nanpu sag, China. Front. Earth Sci. 2022, 10, 996167. [Google Scholar] [CrossRef]
  8. Li, Y.; Yang, J.H.; Pan, Z.J.; Meng, S.Z.; Wang, K.; Niu, X.L. Unconventional Natural Gas Accumulations in Stacked Deposits: A Discussion of Upper Paleozoic Coal-Bearing Strata in the East Margin of the Ordos Basin, China. Acta Geol. Sin. (Engl. Ed.) 2019, 93, 111–129. [Google Scholar] [CrossRef] [Green Version]
  9. Li, Y.; Fan, A.P.; Yang, R.C.; Sun, Y.P.; Lenhardt, N. Sedimentary facies control on sandstone reservoir properties: A case study from the permian Shanxi Formation in the southern Ordos basin, central China. Mar. Pet. Geol. 2021, 129, 105083. [Google Scholar] [CrossRef]
  10. Li, Y.Y.; Guo, S.B. Sedimentary response and restoration of paleoshoreline of Taiyuan-Shanxi Formations in North China basin. Mar. Pet. Geol. 2023, 152, 106218. [Google Scholar] [CrossRef]
  11. Zhang, Q.; Qiu, Z.; Zhang, L.F.; Wang, Y.M.; Xiao, Y.F.; Liu, D.; Liu, W.; Li, S.X.; Li, X.T. Characteristics and controlling factors of transitional shale gas reservoirs:An example from Permian Shanxi Formation, Daning-Jixianblock, OrdosBasin, China. J. Nat. Gas Geosci. 2022, 7, 147–157. [Google Scholar] [CrossRef]
  12. Xi, K.L.; Cao, Y.C.; Wang, Y.Z.; Haile, B.G.; Zhang, X.X.; Zhang, J.H.; Jin, J.H.; Dong, X.Y. Diagenesis and porosity-permeability evolution of low permeability reservoirs: A case study of Jurassic Sangonghe Formation in Block 1, central Junggar Basin, NW China. Pet. Explor. Dev. 2015, 42, 475–485. [Google Scholar] [CrossRef]
  13. Wang, J.; Cao, Y.C.; Liu, K.Y.; Liu, J.; Kashif, M. Identification of sedimentary-diagenetic facies and reservoir porosity and permeability prediction: An example from the Eocene beach-bar sandstone in the Dongying Depression, China. Mar. Pet. Geol. 2017, 82, 69–84. [Google Scholar] [CrossRef]
  14. Ramm, M.; BjØrlykke, K. Porosity/depth trends in reservoir sandstones: Assessing the quantitative effects of varying pore-pressure, temperature history and mineralogy, norwegian shelf data. Clay Miner. 1994, 29, 475–490. [Google Scholar] [CrossRef]
  15. Xu, W.G.; Deng, H.W.; Wang, Y.T. The sandstone reservoir characteristics and controlling factors of Shanxi Formation and Lower Shihezi Formation in Southeastern Ordos Basin. Geol. J. 2021, 56, 1673–1698. [Google Scholar] [CrossRef]
  16. Su, N.N.; Song, F.; Qiu, L.W.; Zhang, W. Diagenetic evolution and densification mechanism of the Upper Paleozoic tight sandstones in the Ordos Basin, Northern China. J. Asian Earth Sci. 2021, 205, 104613. [Google Scholar] [CrossRef]
  17. Cui, H.Y.; Zhong, N.N.; Li, J.; Wang, D.L.; Li, Z.S.; Hao, A.S.; Liang, F. Study on the lower limits of petrophysical parameters of the Upper Paleozoic tight sandstone gas reservoirs in the Ordos Basin, China. J. Nat. Gas Geosci. 2017, 2, 21–28. [Google Scholar] [CrossRef]
  18. Pittman, E.D.; Larese, R.E. Compaction of lithic sands: Experimental results and application. Am. Assoc. Pet. Geol. Bull. 1991, 75, 1279–1299. [Google Scholar] [CrossRef]
  19. Yu, Z.C.; Wang, Z.Z.; Ademutsi, G.D. Genesis of authigenic clay minerals and their impacts on reservoir quality in tight conglomerate reservoirs of the Triassic Baikouquan formation in the Mahu Sag, Junggar Basin, Western China. Mar. Pet. Geol. 2023, 148, 106041. [Google Scholar] [CrossRef]
  20. Gao, Y.; Wang, Z.Z.; She, Y.Q.; Lin, S.G.; Lin, M.P.; Zhang, C.L. Mineral characteristic of rocks and its impact on the reservoir quality of He 8 tight sandstone of Tianhuan area, Ordos Basin, China. J. Nat. Gas Geosci. 2019, 4, 205–214. [Google Scholar] [CrossRef]
  21. Zhao, S.J.; Fu, Q.; Fu, J.H.; Liu, X.Y.; Li, S.X.; Zhang, G.Y.; Teng, J. DEffect of authigenic clay minerals and carbonate cements on quality of tight sandstone reservoirs: Insight from Triassic tight sandstones in the Huaqing area, Ordos Basin, Northern China. J. Asian Earth Sci. 2022, 229, 105099. [Google Scholar] [CrossRef]
  22. Morad, S. Carbonate Cementation in Sandstone: Distribution Patterns and Geochemical Evolution. Spec. Publ. Int. Assoc. Sedimentol. 1998, 26, 1–26. [Google Scholar] [CrossRef]
Figure 1. Location of the research area and target horizon. (a) is the location map of the research area; (b) is the lithological histogram of Shan-1.
Minerals 13 00960 g001
Figure 2. Intersection diagram of visual reservoir porosity and thin-section porosity in the SW Ordos Basin in the Shan-1 Member reservoir.
Minerals 13 00960 g002
Figure 3. The depth–porosity relationship under mechanical compaction in the SW Ordos Basin [14].
Minerals 13 00960 g003
Figure 4. Permeability–porosity crossplot of the Shan-1 Member reservoir in the SW Ordos Basin.
Minerals 13 00960 g004
Figure 5. Microscopic views of pore types from the Shan-1 Member in the SW Ordos Basin. (a) Coarse quartz sandstone with well-developed intergranular pores, Lian 54, at a depth of 3949.8 m. (b) Intergranular pores filled with flake kaolinite aggregates and flake filiform illite, along with intergranular dissolution pores, Long 19, at a depth of 3879.1 m. (c) Debris dissolution pores observed in Long 14 at a depth of 3939.86 m. (d) Mold pores identified in Lian 54 at a depth of 3949.8 m. (e) Intercrystalline pores containing kaolinite minerals in Qingtan 4, located at a depth of 4374.8 m. (f) Residual intergranular pores and secondary enlargement of quartz observed in Long 36 at a depth of 4368.37 m.
Minerals 13 00960 g005
Figure 6. Microscopic views of reservoir diagenesis from the Shan-1 Member in the SW Ordos Basin. (a) The particles in Zhengtan 2, at a depth of 5020.1 m, exhibited long–side contact or concave–convex contact, with dense structure, and siderite is evenly distributed in the form of cryptocrystalline agglomerates. (b) Intergranular pores in Long 5, at a depth of 4028 m, were filled with flake kaolinite aggregates, along with intergranular dissolution pores. (c) Coarse-crystalline calcite, including even flaky continuous crystals, was observed in Long 5 at a depth of 4028 m. (d) Quartz overgrowth in Long 36, at a depth of 4368.37 m, exhibited a tendency towards automorphism. Chlorite was attached to the surfaces of clastic particles in a film structure. (e) Rich clay minerals were present in feldspar dissolution pores, debris dissolution pores, and tuffaceous dissolution pores in Lian 1, at a depth of 3470.03 m. (f) Mold holes by dissolution of feldspar particles were observed in Lian 54, at a depth of 3949.8 m.
Minerals 13 00960 g006
Figure 7. Diagenetic evolution sequence from the Shan-1 Member of Upper Paleozoic in the SW Ordos Basin.
Minerals 13 00960 g007
Figure 8. Diagenetic evolution sequence of tight reservoir in Shan-1 Member.
Minerals 13 00960 g008
Figure 9. A porosity evolution diagram of tight sandstone reservoir from the Shan-1 Member.
Minerals 13 00960 g009
Figure 10. The relationship between plane porosity and the content of various types of cements from the Shan-1 Member. (a) Scatter diagram of porosity and Illite content; (b) Scatter diagram of porosity and Kaolinite cement content; (c) Scatter diagram of porosity and Chlorite contente; (d) Scatter diagram of porosity andCarbonate cement content.
Minerals 13 00960 g010
Figure 11. Buried history for the Zhentan-2 Well in the SW Ordos Basin.
Minerals 13 00960 g011
Table 1. Main parameters of thin section and influence of diagenesis in the Southwest Ordos Basin (Long 36, 4368.37 m).
Types of DiagenesisSymbolPlane Porosity
(%)
Reservoir Porosity
(%)
Reduction or Increase Rate of Reservoir Porosity
(%)
Carbonate cementSideriteΦc0.50.65−1.73
Calcite0.60.78−2.08
Ferrocalcite0.70.91−2.43
Ferrodolomite1.21.55−4.13
Siliceous cementationΦsi2.53.23−8.61
Kaolinite cementationΦkln22.59−6.91
Illite cementationΦill3.64.66−12.43
Chlorite cementationΦchl2.43.11−8.29
Feldspar dissolution poreΦf0.20.260.69
Debris dissolution poreΦr1.41.814.83
Carbonate cement dissolution poreΦcl0.050.060.16
Intergranular dissolution poreΦil0.640.832.21
CompactionΦp20.99−55.97
Table 2. Quantitative restoration results of pore evolution of Upper Paleozoic reservoirs of the Longdong area (Long 36, 4368.37 m).
Key DiagenesisBP
(Ma)
Paleo-Burial
Depth
(m)
Porosity Inversion
(%)
Mechanical Correction Porosity
(%)
Actual Porosity
(%)
Deposition and compaction290037.50 37.50
Feldspar dissolution/
Quartz overgrowth, Authigenic kaolinite, Chlorite/Illite alteration, Siderite
238120021.489.5028.0
Early carbonate cementation/
Middle quartz overgrowth/
Altered kaolinite/
Debris dissolution
215200016.054.9317.64
Carbonate cement dissolution/
Advanced Quartz overgrowth
200320012.212.4611.34
Advanced carbonate cement, Illite137390010.670.629.19
0.04368.35.300.215.30
Disclaimer/Publisher’s Note: The statements, opinions and data contained in all publications are solely those of the individual author(s) and contributor(s) and not of MDPI and/or the editor(s). MDPI and/or the editor(s) disclaim responsibility for any injury to people or property resulting from any ideas, methods, instructions or products referred to in the content.

