Article

Magnetostratigraphy of the Tuotuohe Formation in the Tuotuohe Basin, Central-Northern Tibetan Plateau: Paleolatitude and Paleoenvironmental Implications

1
State Key Laboratory of Loess and Quaternary Geology, Institute of Earth Environment, Chinese Academy of Sciences, Xi’an 710061, China
2
Xi’an Institute for Innovative Earth Environment Research, Xi’an 710061, China
3
Yunnan Key Laboratory of Earth System Science, Yunnan University, Kunming 650500, China
4
CAS Center for Excellence in Quaternary Science and Global Change, Xi’an 710061, China
5
Graduate School of Maritime Sciences, Kobe University, Kobe 658-0022, Japan
6
College of Earth and Planetary Sciences, University of Chinese Academy of Sciences, CAS, Beijing 100049, China
7
Xi’an Center of Geological Survey, Northwest China Center of Geoscience, China Geological Survey, Xi’an 710054, China
*
Author to whom correspondence should be addressed.
Minerals 2023, 13(4), 533; https://doi.org/10.3390/min13040533
Submission received: 28 February 2023 / Revised: 24 March 2023 / Accepted: 31 March 2023 / Published: 10 April 2023

Abstract

:
Paleolatitude evolution could provide a general paleo-location framework for explaining the paleoclimate change and tectonic deformation in geological time. Strengthening the paleolatitude study of the Tuotuohe Basin is important for understanding the history and mechanism of the tectonic uplift process in the north-central Tibetan Plateau. In this study, we introduced the magnetostratigraphy for the Tuotuohe-D (TTH-D) section in the Tuotuohe Basin, central-northern Tibetan Plateau, in order to constrain the chronology and to reconstruct the paleolatitude of the basin during the deposition of the Tuotuohe Formation. The results indicated that the Tuotuohe Formation in the TTH-D section was deposited between 38.5 and ~36.7 Ma. Combining this age with the results from the Tuotuohe section indicates that the age of the Tuotuohe Formation spans the interval from >38.5 Ma to ~33 Ma. Additionally, other paleomagnetic data of the Tuotuohe Formation from the Tuotuohe section, combined with the data from this study, indicate that the paleolatitude of the Tuotuohe Basin during the late Eocene was 25.9 ± 4.2°. That means that the Tuotuohe Basin was located in a subtropical anticyclonic zone and that the paleoenvironment during the late Eocene might be controlled by subtropical high pressure. Additionally, paleomagnetic results from the Qiangtang terrane and the bordering regions are combined with the results of our study, which suggest that the paleolatitude of the Tuotuohe Basin at ~26 Ma coincides well with the Eurasian apparent polar wander path for that interval, and that the N-S India–Asia convergence was reduced or ceased at ~26 Ma in the Tuotuohe Basin.

1. Introduction

The Cenozoic uplift of the Tibetan Plateau (TP), induced by the collision of the Indian and Asian plates, is one of the most significant global tectonic events [1,2]. Tibet is often called Earth’s “third pole” on account of its low temperatures and the fact that is the largest store of ice outside the polar regions [3]. It is also termed the “Asian water tower” due to its high average altitude, plentiful glaciers, and importance as a water resource for large parts of Asia. The regional and global climatic effects of the uplift of TP affect the water supply of billions of people in the surrounding regions, by altering the atmospheric circulation and ecosystems across Asia or even across much of the planet [4,5,6,7,8,9,10,11].
The significance of the climate, water supply, and ecosystems of the TP highlights the importance of understanding its tectonic evolution during the Cenozoic, which may improve our understanding of past and present environmental processes and hence help provide a basis for the sustainable development of the region [12]. Studies of the Cenozoic tectonic evolution of the TP are spatially imbalanced, with research focusing on the southern and northern parts with comparatively little research conducted on central TP because of its high average elevation, harsh conditions, and the logistical difficulty of conducting field work. However, more research on central TP is essential for understanding the evolution of TP as a whole, although several previous studies have been conducted [13,14,15,16,17,18,19,20,21]. In addition, a poorly constrained stratigraphic chronological framework may lead to contradictory conclusions regarding the paleoelevation history of central-northern TP and thus regarding the uplift mechanism; examples include a paleoelevation controversy in the Lunpola Basin [22,23,24,25] and debate about the age of the Fenghuoshan Group and its stratigraphic relationship with the Tuotuohe Formation in the Hoh Xil Basin [13,14,15,20,21,26]. Additionally, paleoenvironmental reconstruction and analysis of a particular location require accurate knowledge of its paleolatitude, because the paleo-configuration partially determines the energy distribution [27], and the location of the terrane or a particular location at different times will result in climatic influences from specific atmospheric circulation patterns. It is therefore essential to accurately constrain the paleogeographical position, such as the paleolatitude, of a sedimentary sequence at the time of deposition.
Here, we reported a new age constraint for the Tuotuohe Formation based on the magnetostratigraphy of a sedimentary sequence in the Tuotuohe Basin, a sub-basin of the Hoh Xil Basin, distributed beneath the Tuotuohe (TTH) section (Figure 1) [28]. The results provide a clarification of the age of the Tuotuohe Formation and its stratigraphic relationship with the Fenghuoshan Group. Additionally, the paleolatitude of the Tuotuohe Basin was reconstructed based on the red beds of the Tuotuohe Formation. Our results were integrated with a regional compilation of paleolatitude records which was applied to the Tuotuohe Basin as a reference, enabling a consideration of the drift history of the basin and its climatic implications.

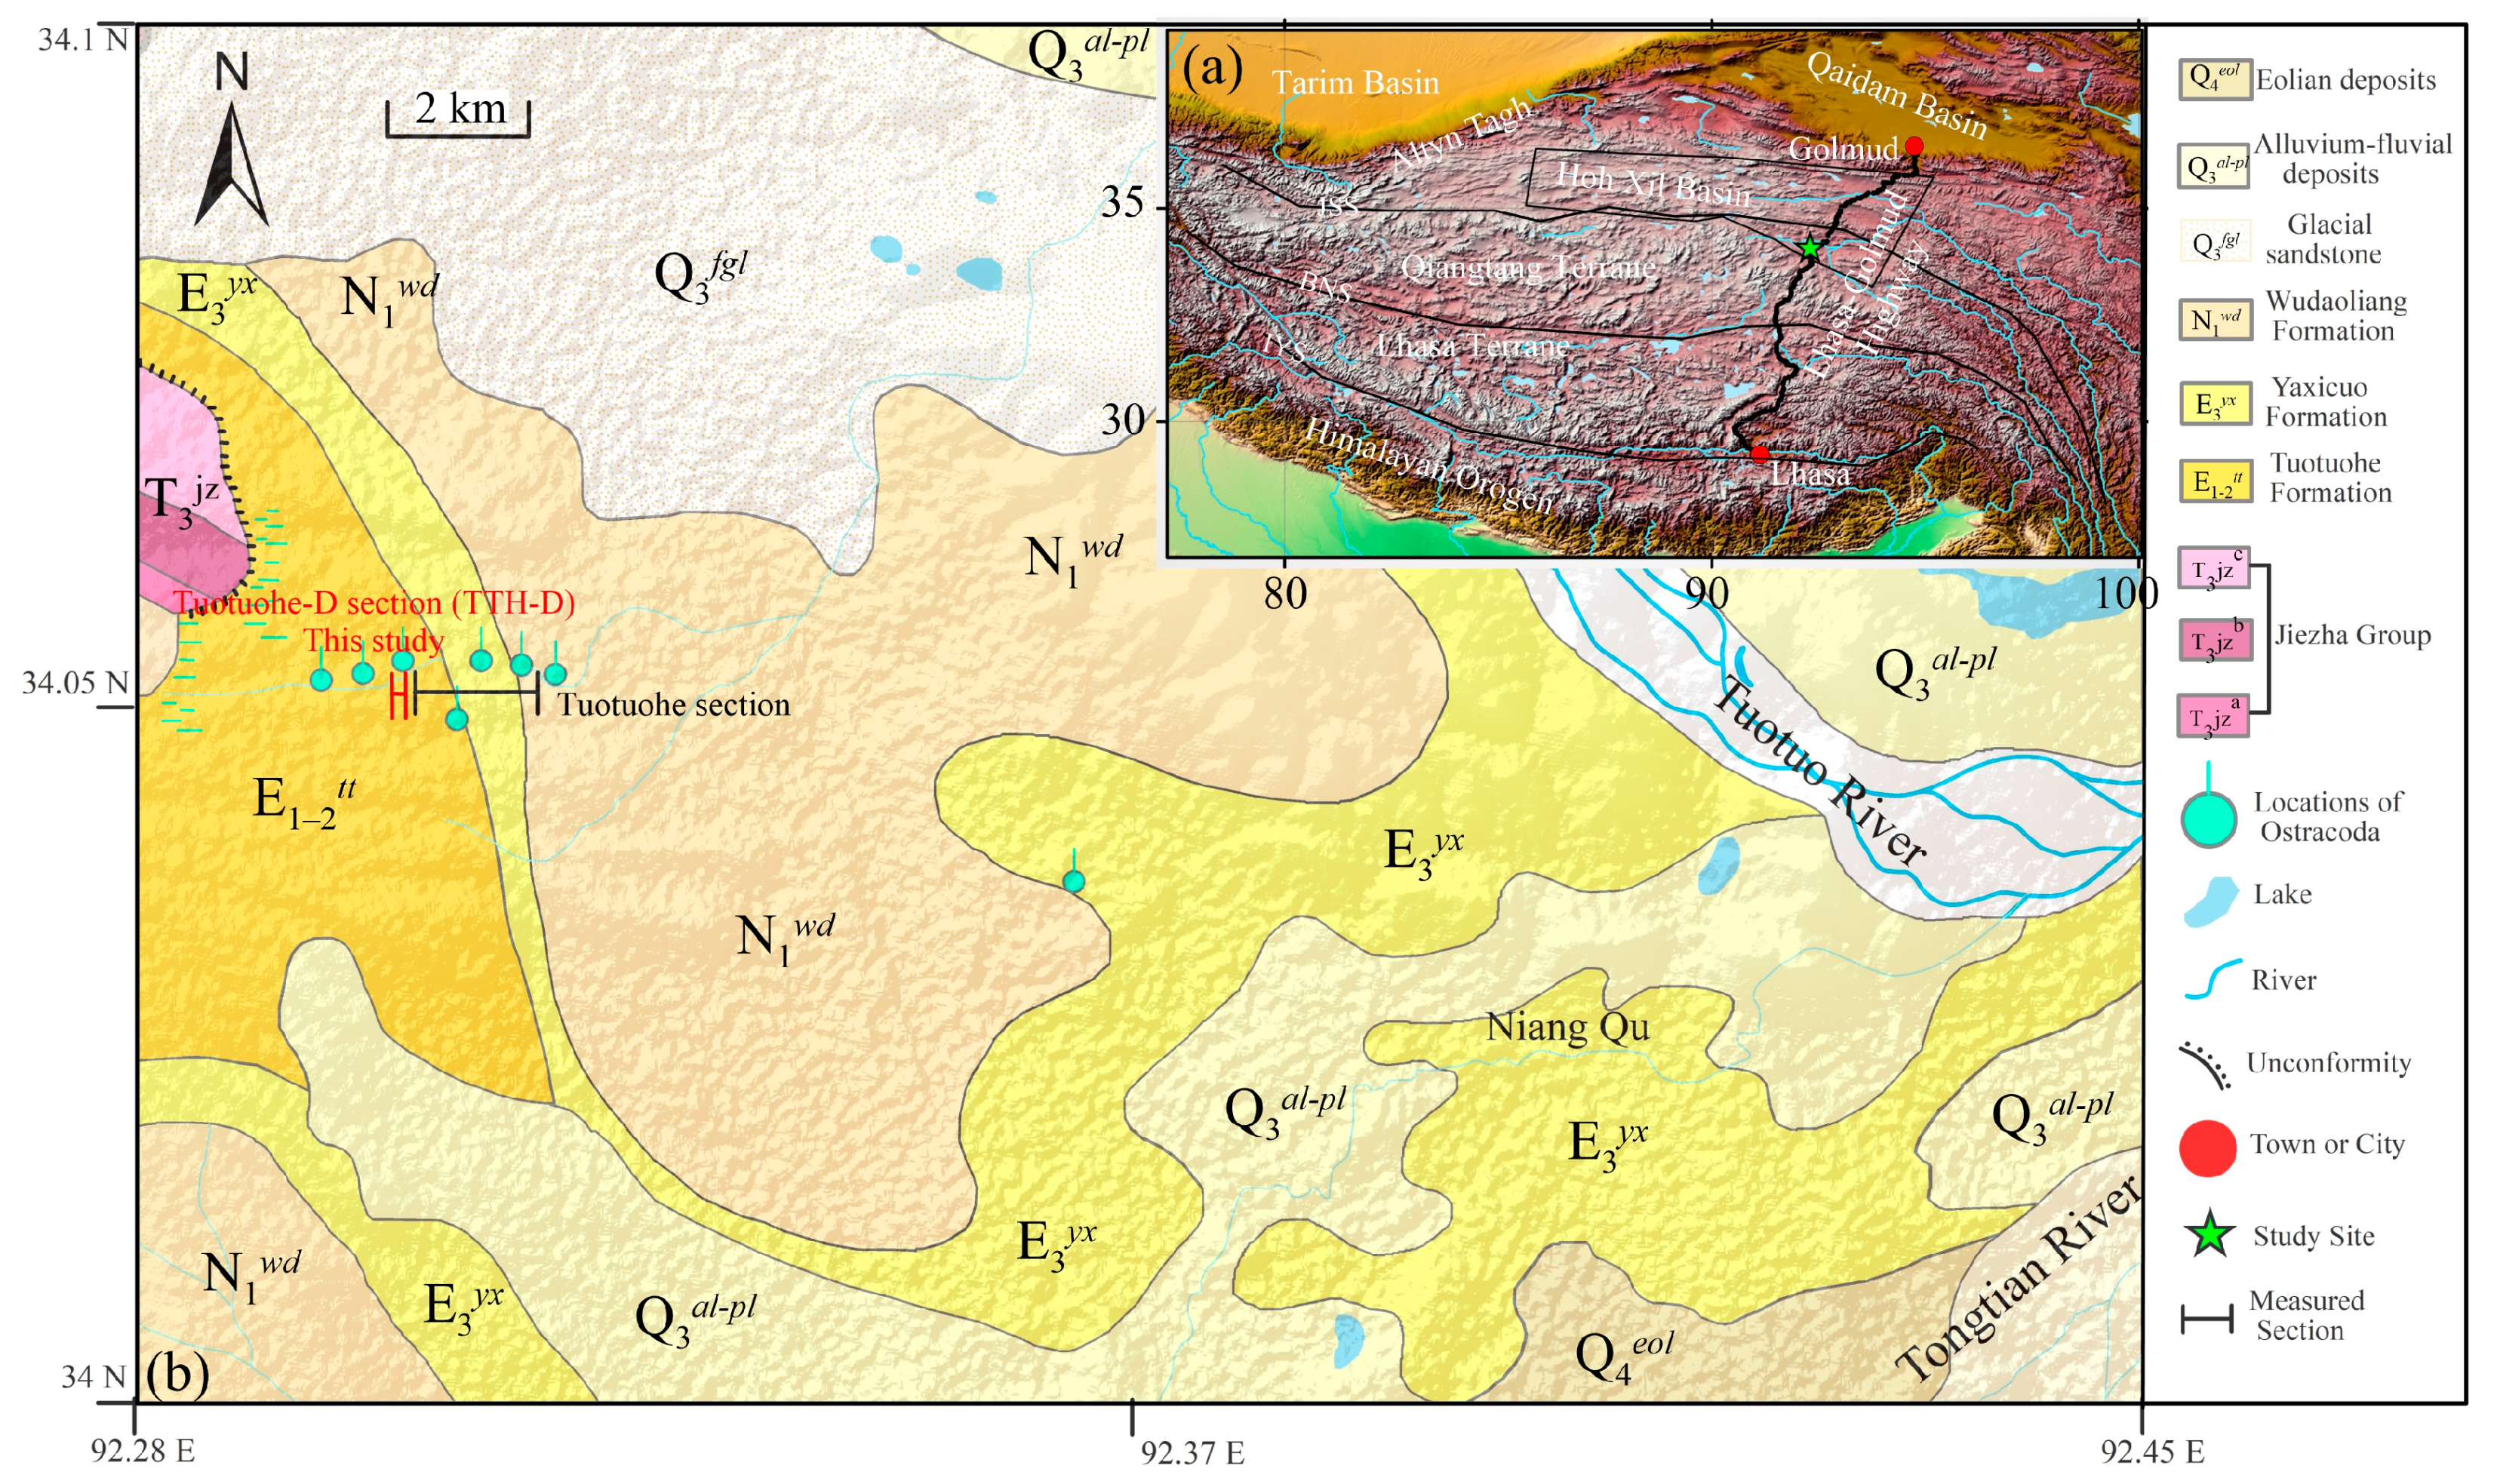
2. Geological Setting and Stratigraphy

The Hoh Xil Basin is bounded by the East Kunlun Range to the north and the Tanggula Range to the south and is a part of the northern Qiangtang and Songpan-Ganzi terranes. The Tuotuohe Basin is a sub-basin of the Hoh Xil Basin, located to the south, and, importantly, it spans the northeastern part of the Qiangtang terrane and crosses the Jinshajiang suture zone (Figure 1a).
The basement of the Hoh Xil Basin is composed of the Carboniferous Xijinwulan Group, comprising gray–green quartz sandstone, feldspar quartz sandstone, and gray–white siliceous limestone; and the Permian–Triassic and Triassic Hantaishan Group, comprising light gray–green feldspar quartz sandstone, with a variable grain size, and interbedded silty slate and siltstone intercalated with sandy limestone [30]. The Cenozoic strata from old to young comprise the Fenghuoshan Group, Tuotuohe Formation, Yaxicuo Formation, and Wudaoliang Formation. The Fenghuoshan Group is mainly located in the central to southern parts of the Hoh Xil Basin, extending from the Tanggula Shan northward to the eastern Kunlun Shan, and consists of gray–violet sandstone, mudstone, and conglomerate, intercalated with gray–green Cu-bearing sandstone, dark gray bioclastic limestone, and gray gypsum [13]. The Tuotuohe Formation mainly consists of brownish–red to grayish–green sandstone with pebbly sandstone, and is characterized by large-scale cross-bedding, normal graded bedding, stratified structures, and ripple marks [28]. The Yaxicuo Formation is composed primarily of interbedded brownish–red sandstone and brownish–red to gray mudstone, with interspersed stratified gray argillaceous limestone with climbing-ripple cross laminations. The lacustrine Wudaoliang Formation is dominated by light gray and pale blue mudstone, marlstone, argillaceous limestone and calcareous mudstone, with interbedded gypsum layers [28,31]. Contacts among the Tuotuohe Formation, Yaxicuo Formation and Wudaoliang Formation are conformable in the southern part of the Hoh Xil Basin, such as the Tuotuohe Basin. However, the Yaxicuo Formation is unconformable with the overlying Wudaoliang Formation in the northern part of the basin, such as in the Fenghuoshan and Erdaogou area [13,28] (Figure 1b).
The Tuotuohe-D section (TTH-D) is located ~20 km southeast of the Tanggula town, where the Lhasa-Golmud highway crosses the Tuotuo River (Figure 1). In the TTH-D section, 125 m of strata is exposed, comprising the Tuotuohe Formation according to color, lithology, sedimentary structures, contact relationships, and comparison with the regional stratigraphy. The Tuotuohe Formation is dominated by brick red sandstone and conglomerate, interbedded with bioclastic and sandy micrite. The age of the top of the Tuotuohe Formation in the Tuotuohe section has been cross-determined by a variety of chronological methods [28]. Here, the Tuotuohe Formation is the lower extension of the Tuotuohe Formation in the Tuotuohe section, but the true base of the Tuotuohe Formation has still not been reached because the stratigraphy is heavily overlain. In addition, the junction (~5 m) between the top of the TTH-D section and the bottom of the Tuotuohe section [28] is heavily covered by vegetation and detrital sediments (Figure 2). Because the stratigraphy is heavily overlain, the contact relationship at the stratigraphic contact is not obvious and a fault may exist. Because of the consistent lithology and attitude of the Tuotuohe Formation in both sections, this fault probably formed after the formation of the Tuotuohe Formation and should not have a large effect on the integrity of the recorded palaeomagnetic polarity.

3. Materials and Methods
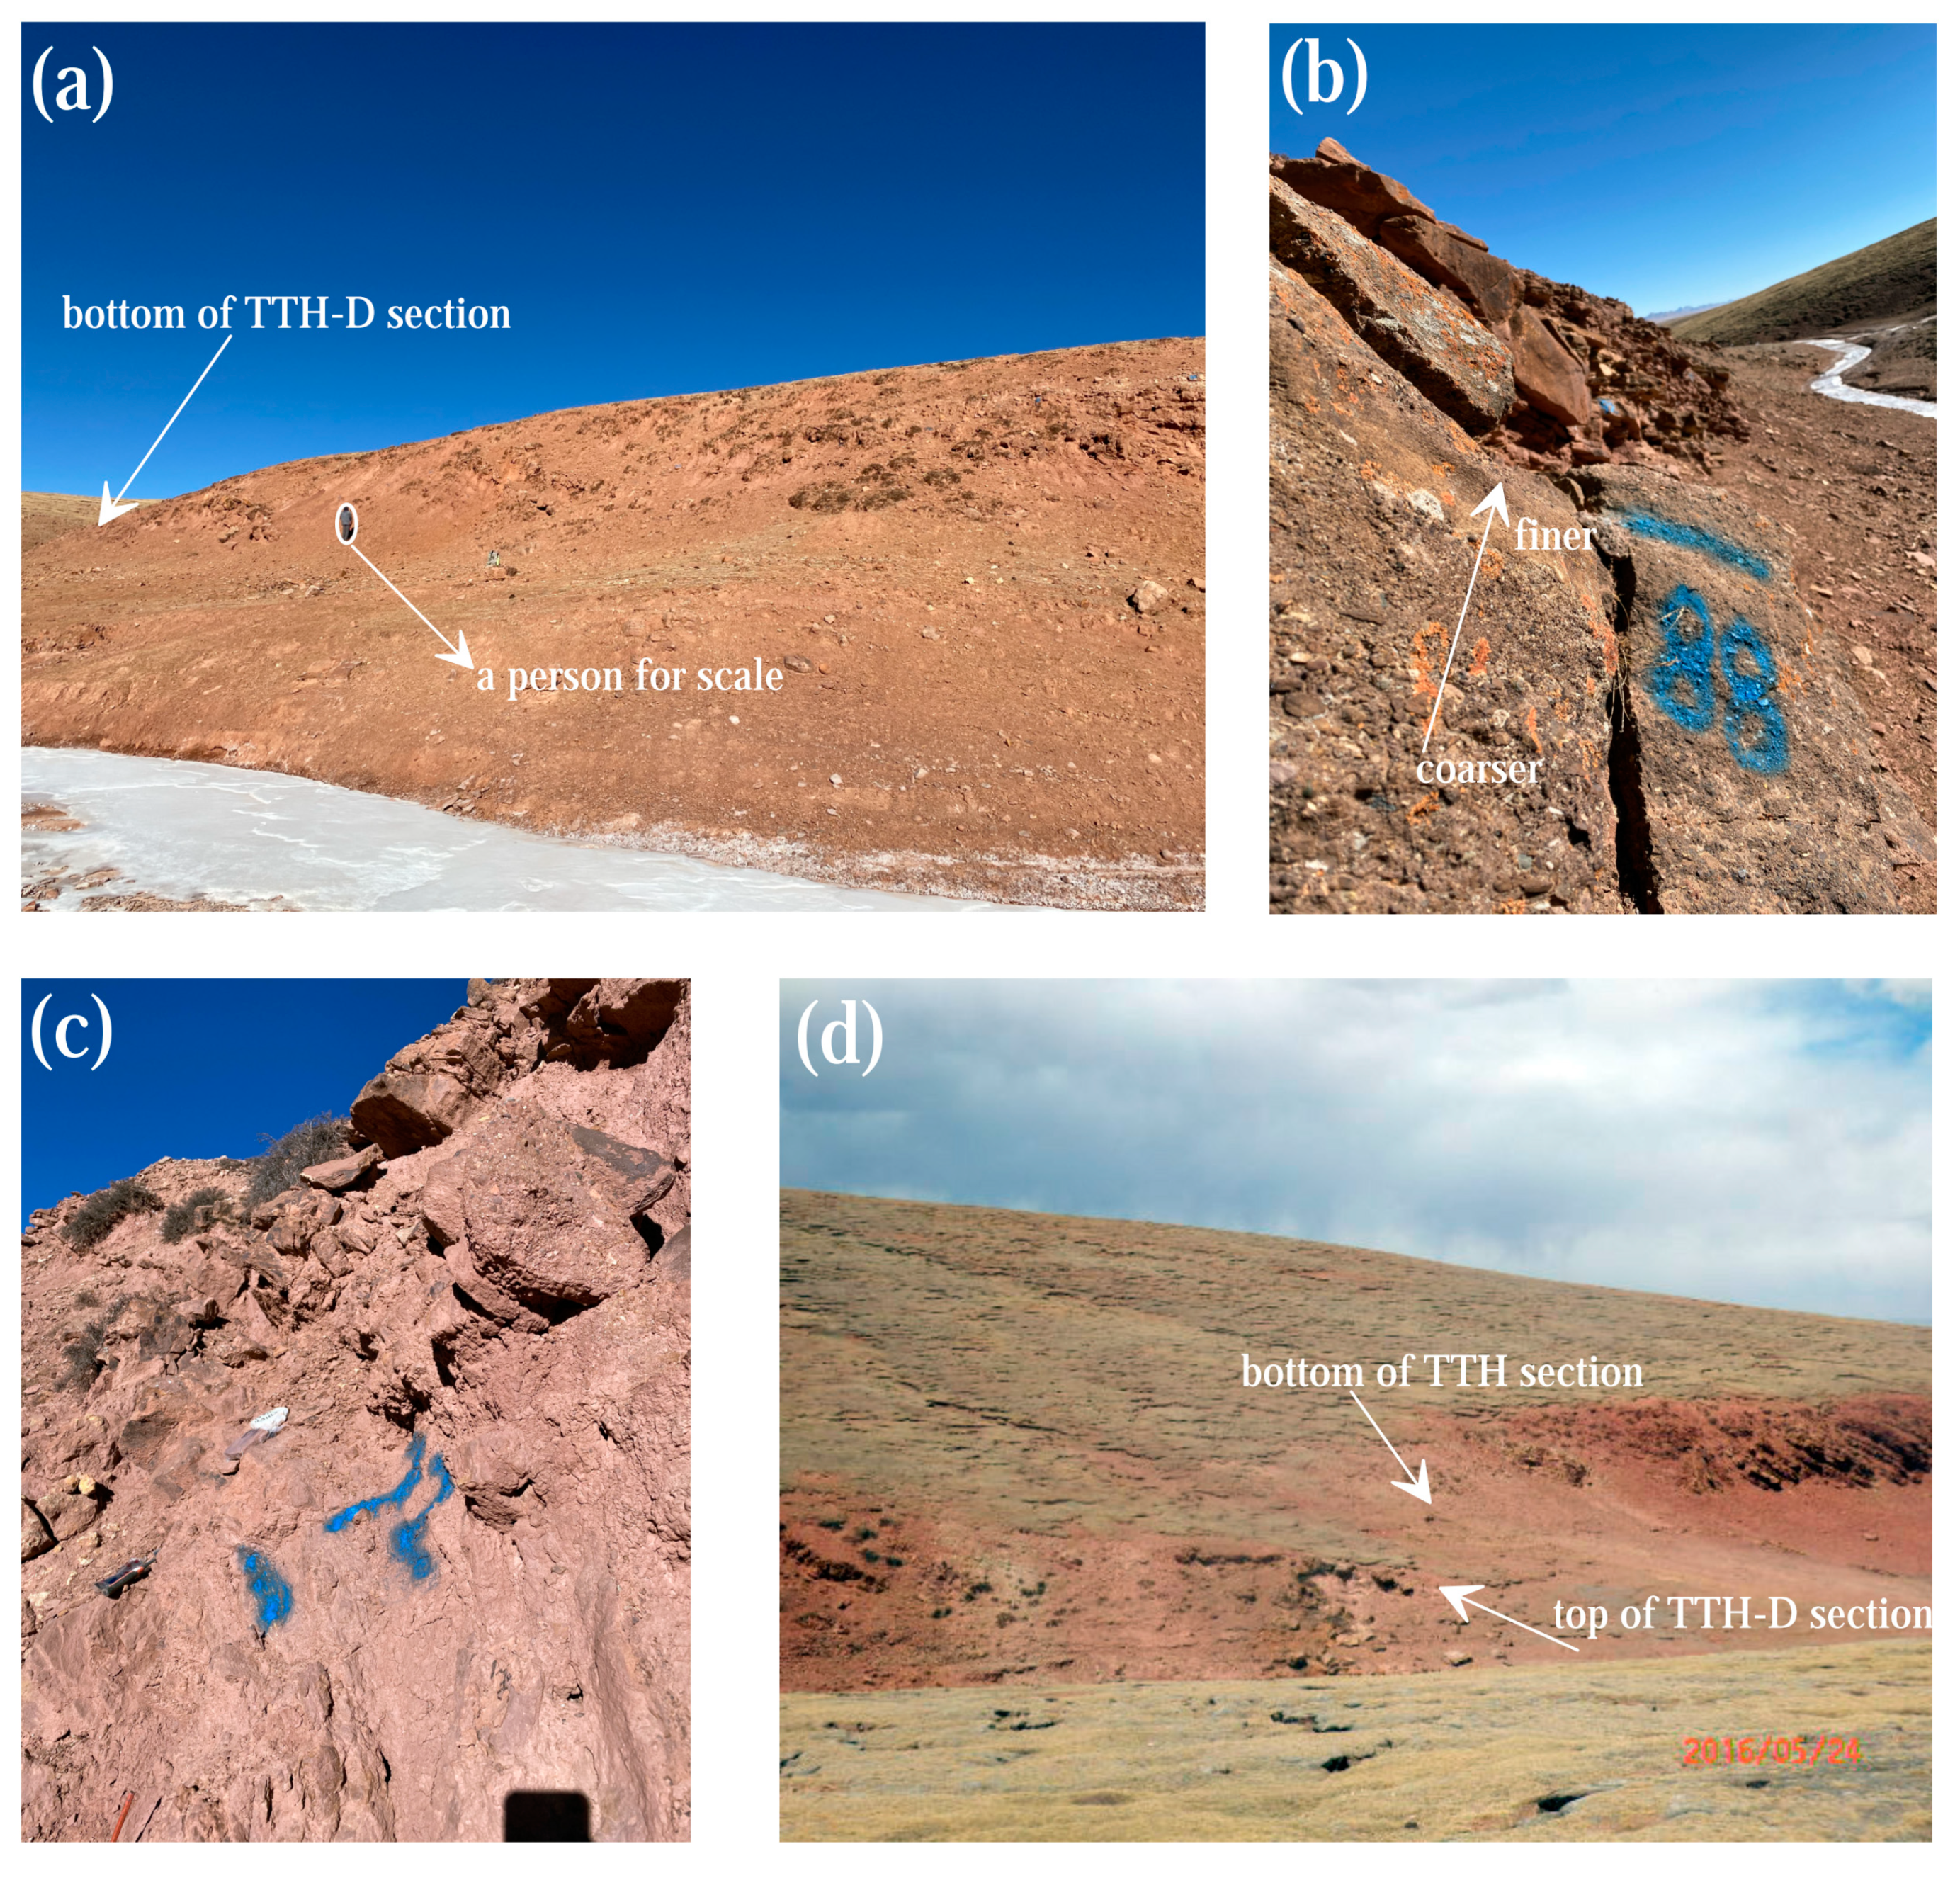
3.1. Sampling

A total of 120 paleomagnetic samples were collected as hand specimens (~6 × 6 cm2) and oriented with a magnetic geological compass in the field. These samples were fashioned in the laboratory into two sets of 2 cm3 paleomagnetic samples for experimental analysis. The largest stratigraphic gap in sampling is 2 m and the smallest is 1 m. The lithology of the section mainly consists of sandstone and there was no specific lithology targeted.

3.2. Rock Magnetic Measurements

The temperature-dependent magnetic susceptibility of representative samples was measured in an argon atmosphere using an MFK1-FA Kappabridge with a CS3 high- temperature furnace (AGICO, Brno, Czech). The measurements were executed from room temperature (∼20–25 °C) up to 700 °C, with the following measuring parameters: sensitivity to susceptibility change is 2 × 10⁻⁸ SI, at a frequency of 976 Hz; and slow heating rate (c.a. 6.5 °C/min). The final temperature-dependent magnetic susceptibility was obtained by subtracting the measured background susceptibility for the empty furnace tube using Cureval 8.0 software. Isothermal remanent magnetization (IRM) was measured using a Princeton Measurements Corporation (State of New Jersey, U.S.A.) A VSM3900 vibrating sample magnetometer, with the maximum applied field of 2.5 T. In order to determine the relative contribution of magnetite and hematite in the samples, IRM acquisition curves were processed using cumulative log Gaussian analysis [32]. Hysteresis loops were also measured using the VSM3900 at room temperature with the maximum applied magnetic field of 1 T and relevant parameters were obtained after slope correction.

3.3. Paleomagnetic Measurements

All specimens from the TTH-D section were subjected to stepwise thermal demagnetization up to a maximum temperature of 680 °C, at 20–50 °C intervals below 600 °C and at 10–20 °C intervals above 600 °C. A TD-48 thermal demagnetizer was used. The natural remanent magnetization (NRM) was measured using a 2 G Enterprises Model 755-R cryogenic magnetometer installed in a magnetically shielded room (<300 nT). The characteristic remnant magnetization (ChRM) of the samples was determined using principal component analysis [33]. These measurements were conducted in the Environmental Magnetism Laboratory of the Institute of Earth Environment, Chinese Academy of Sciences (Xi’an, China).

4. Results

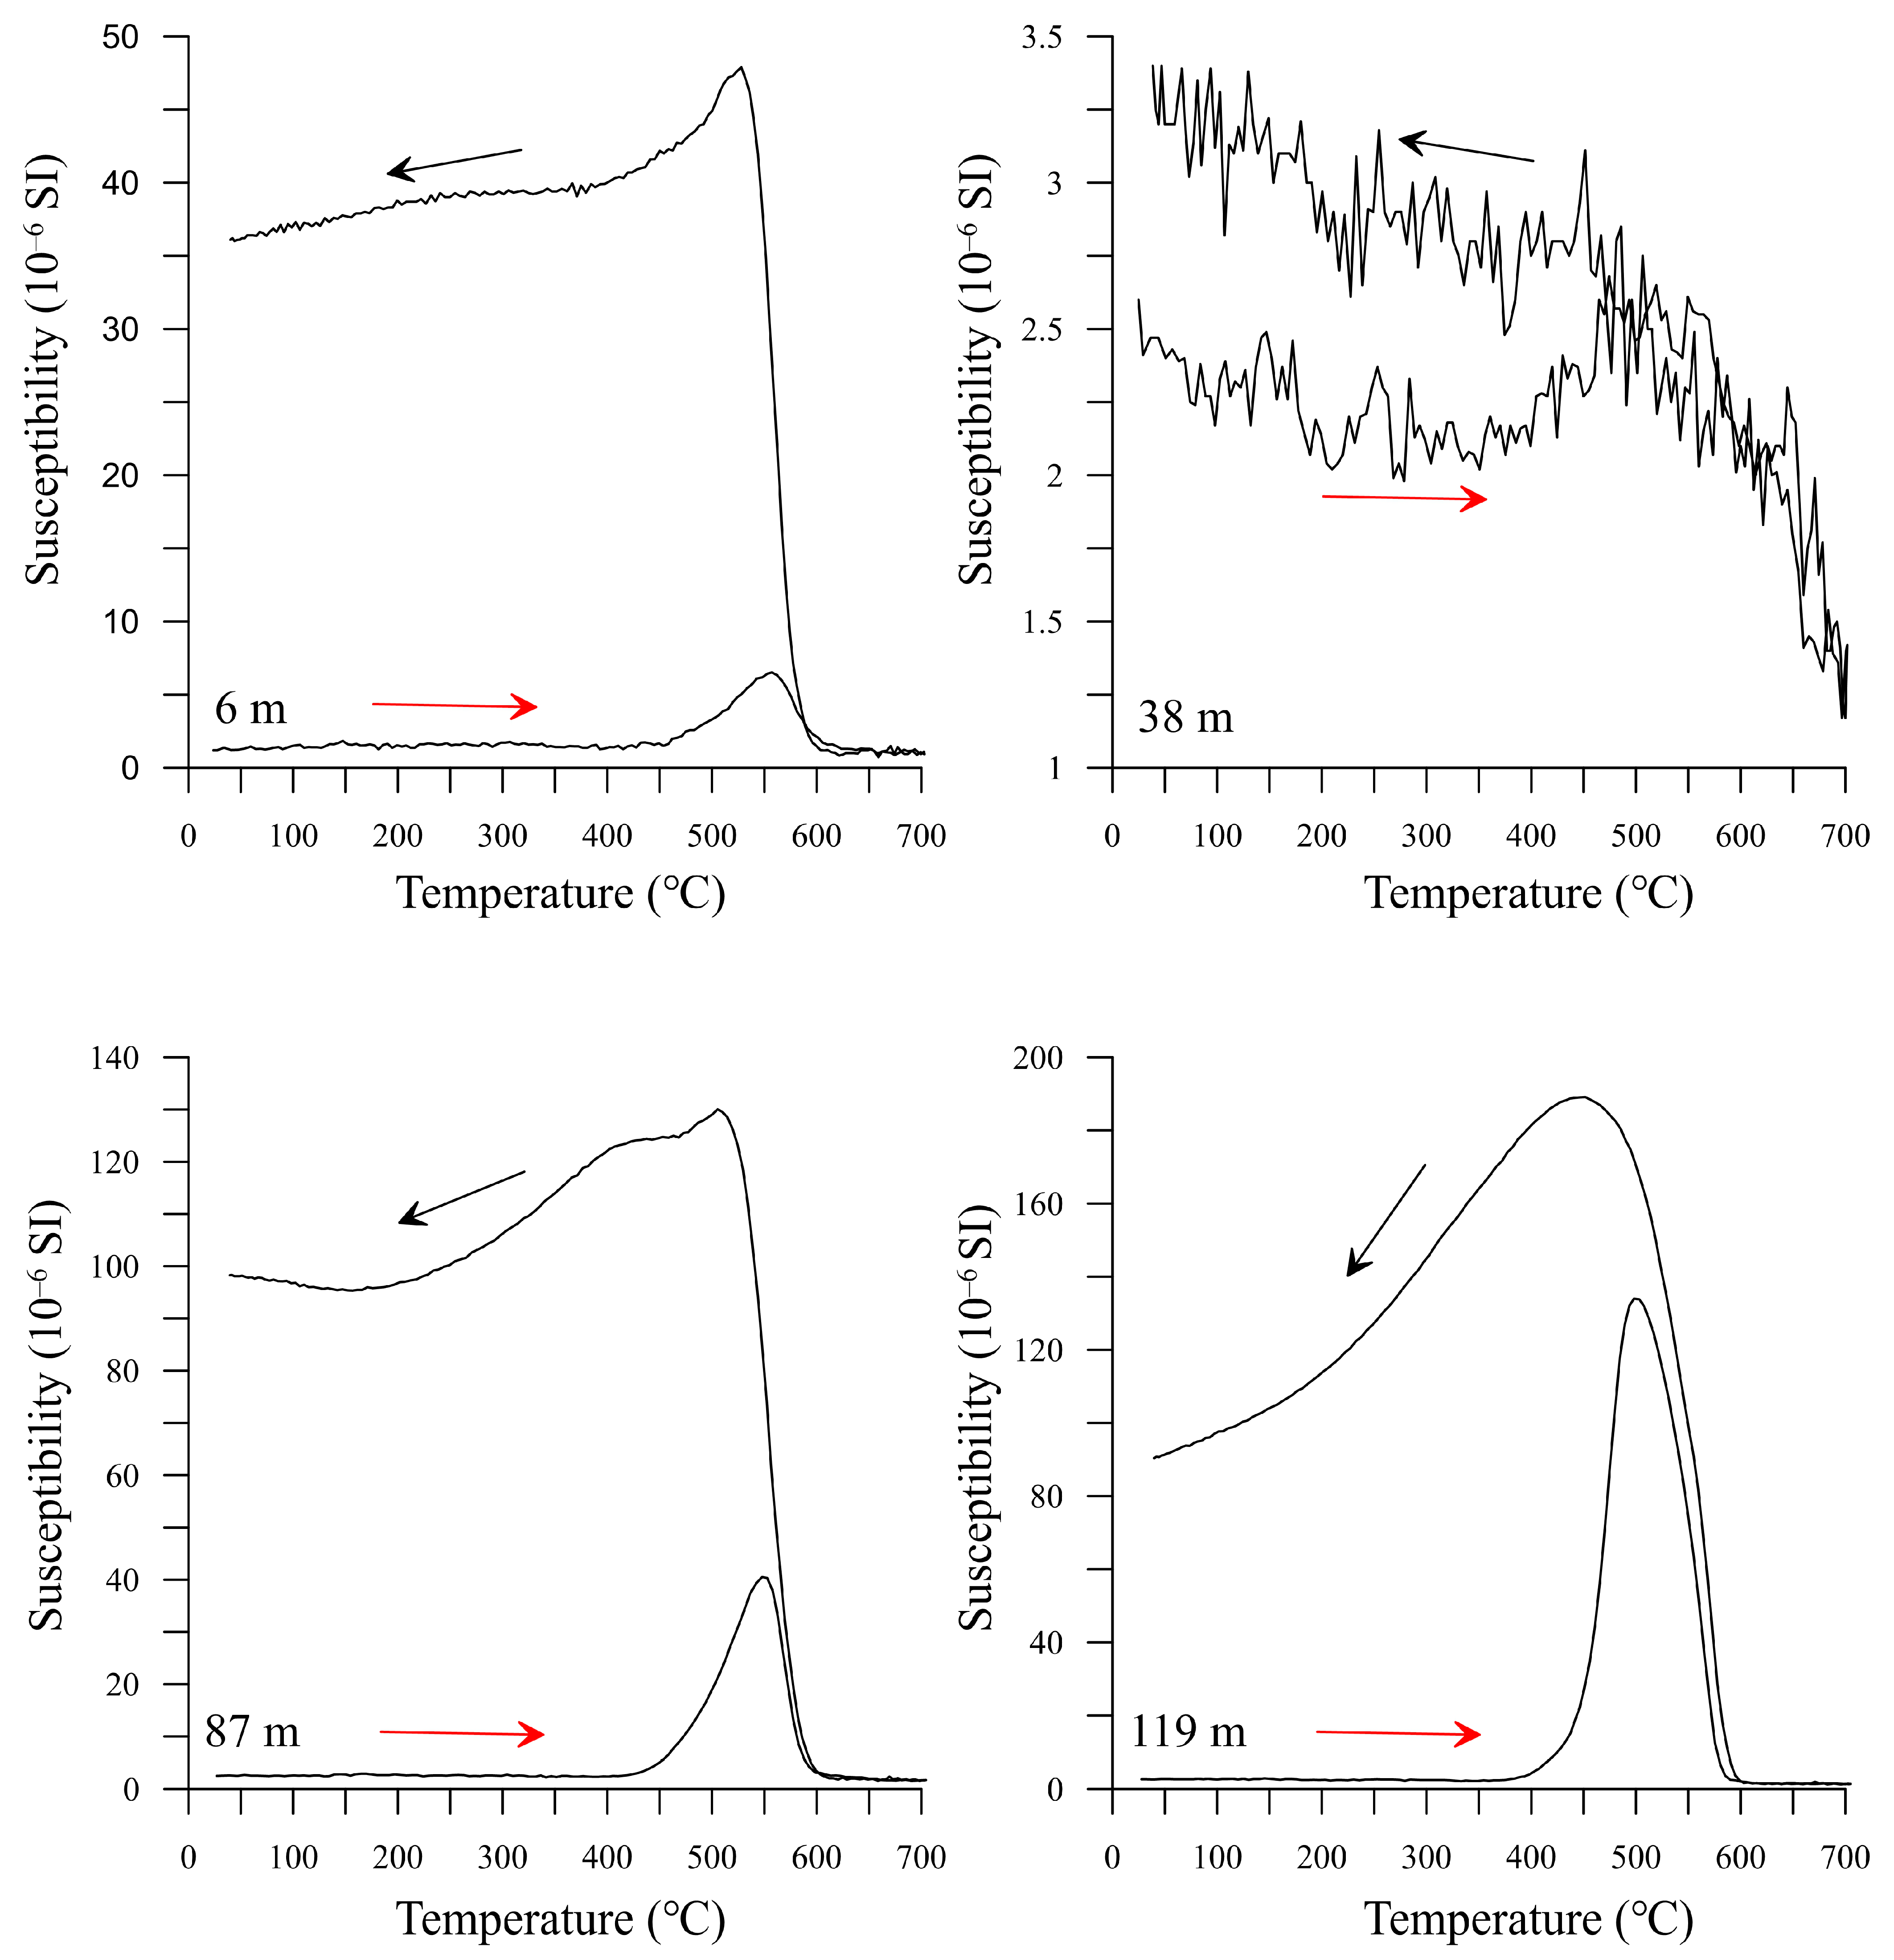
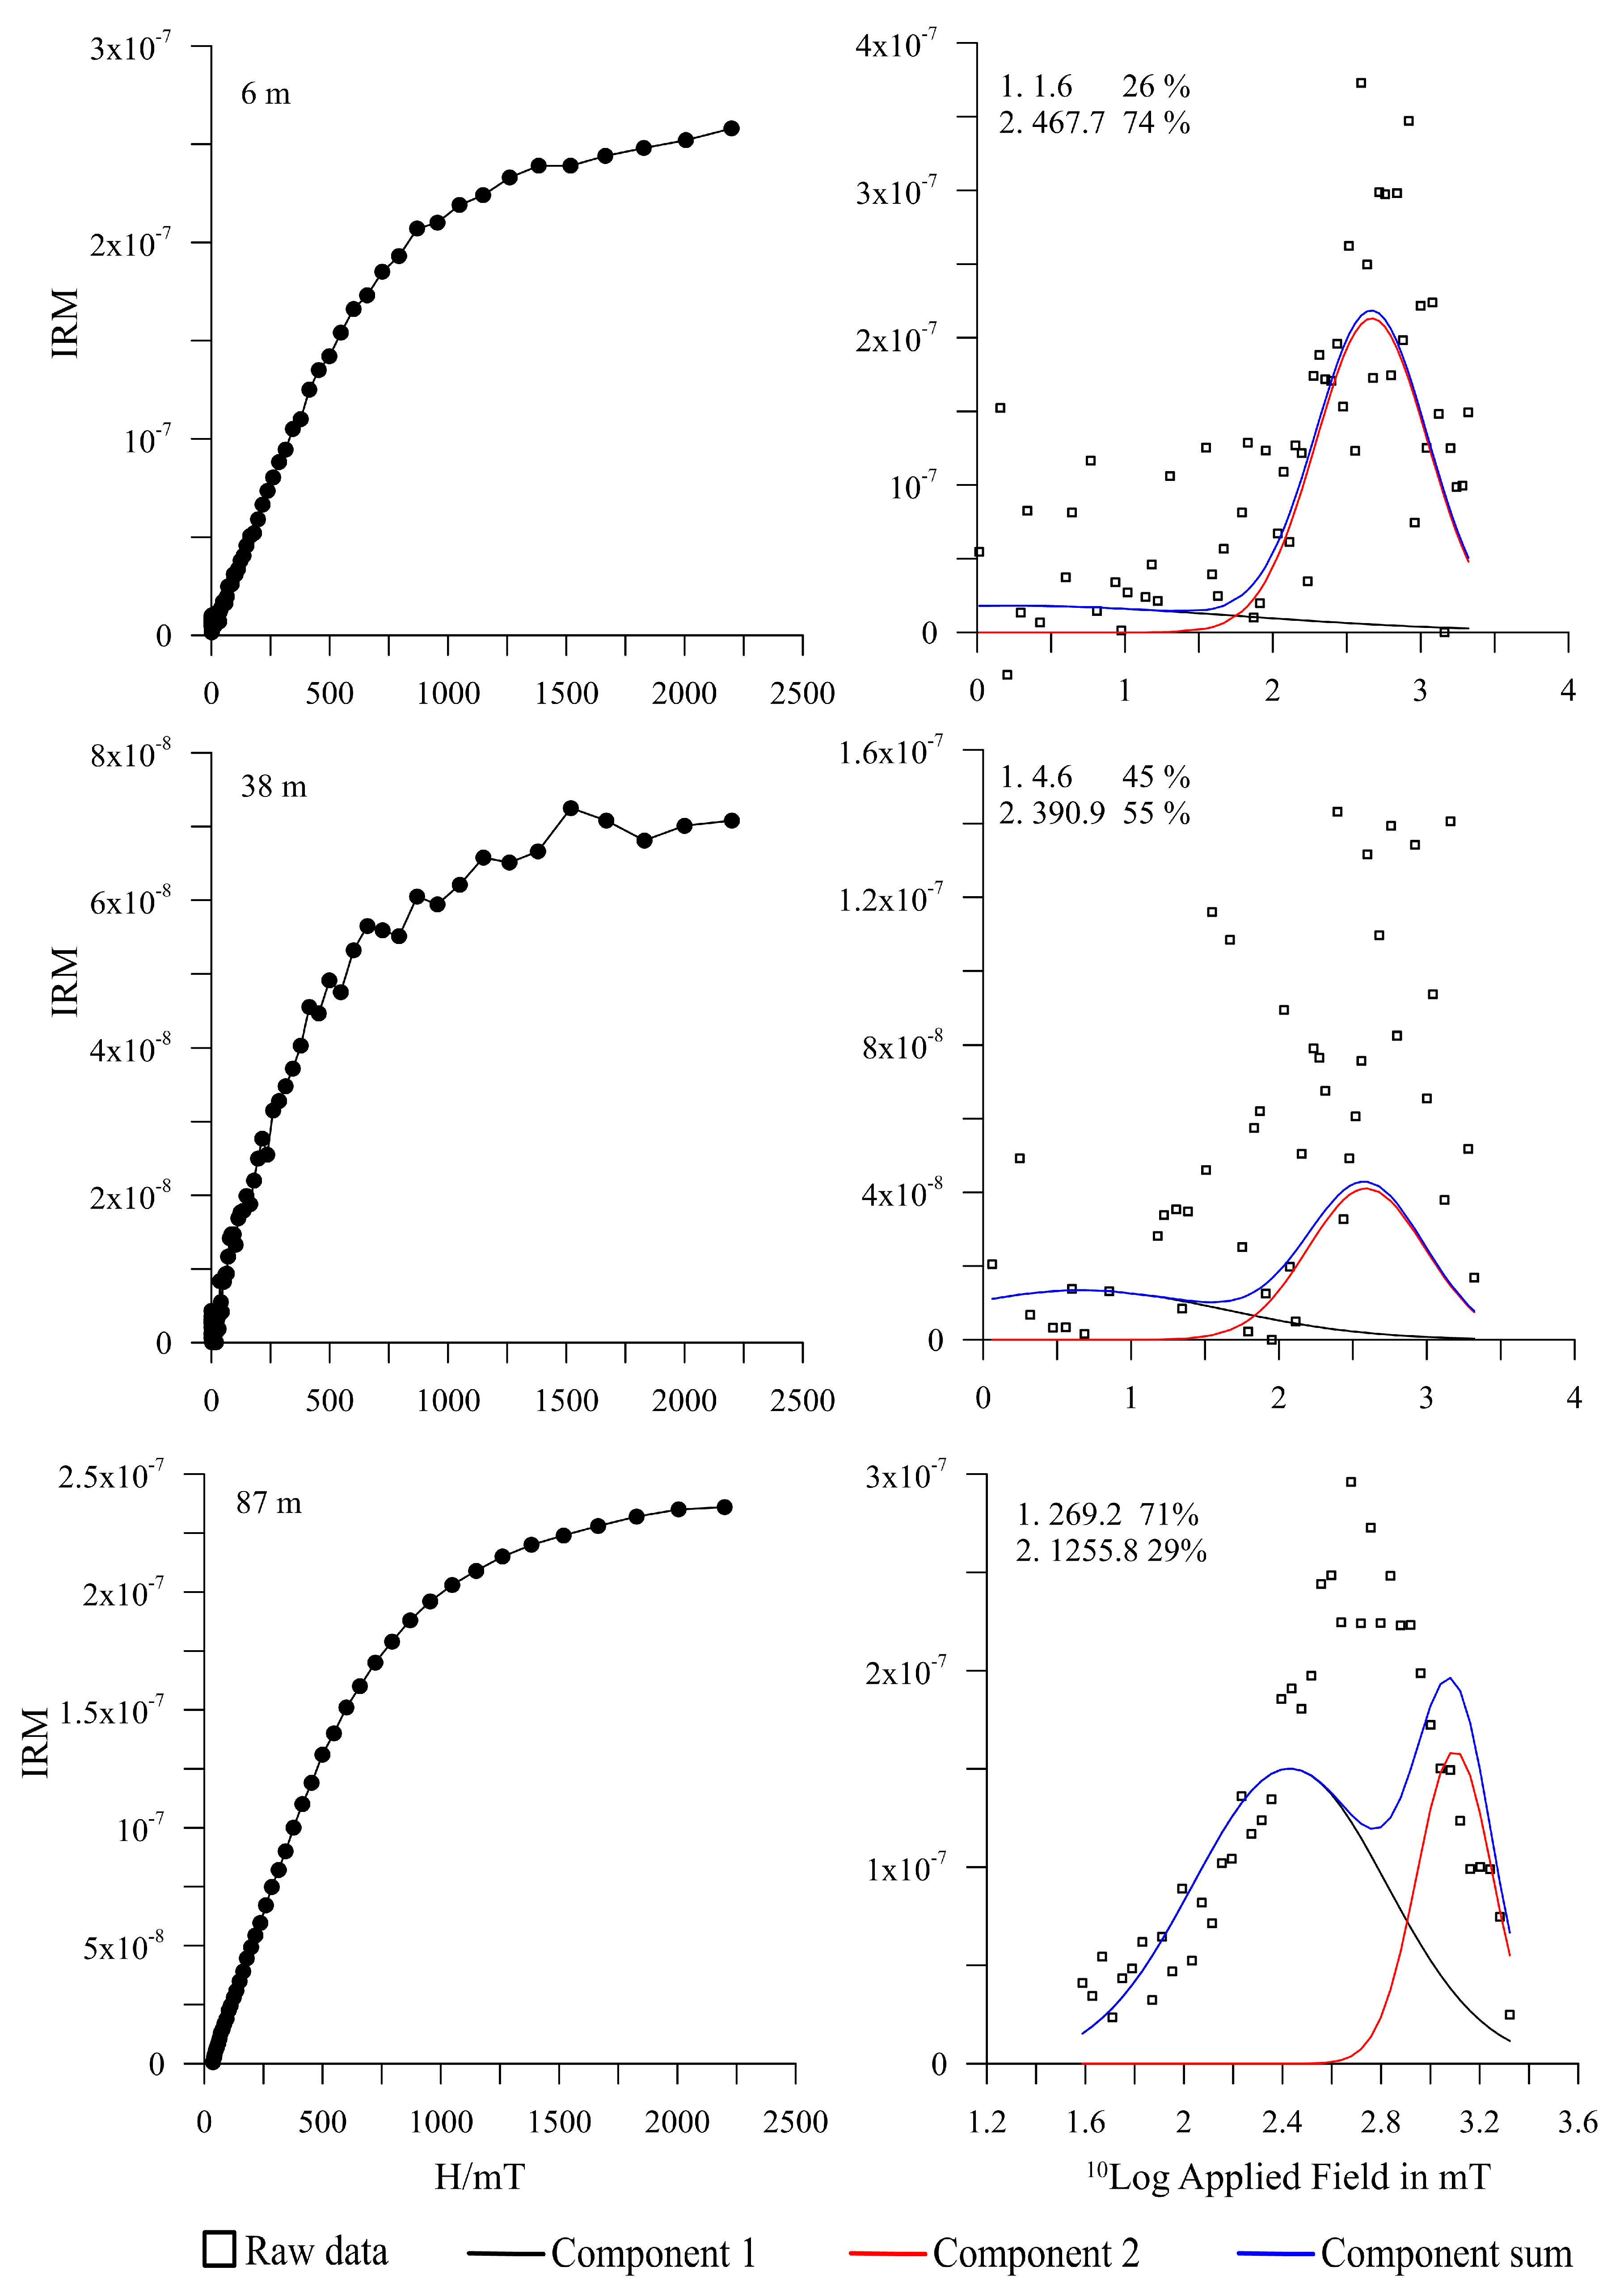
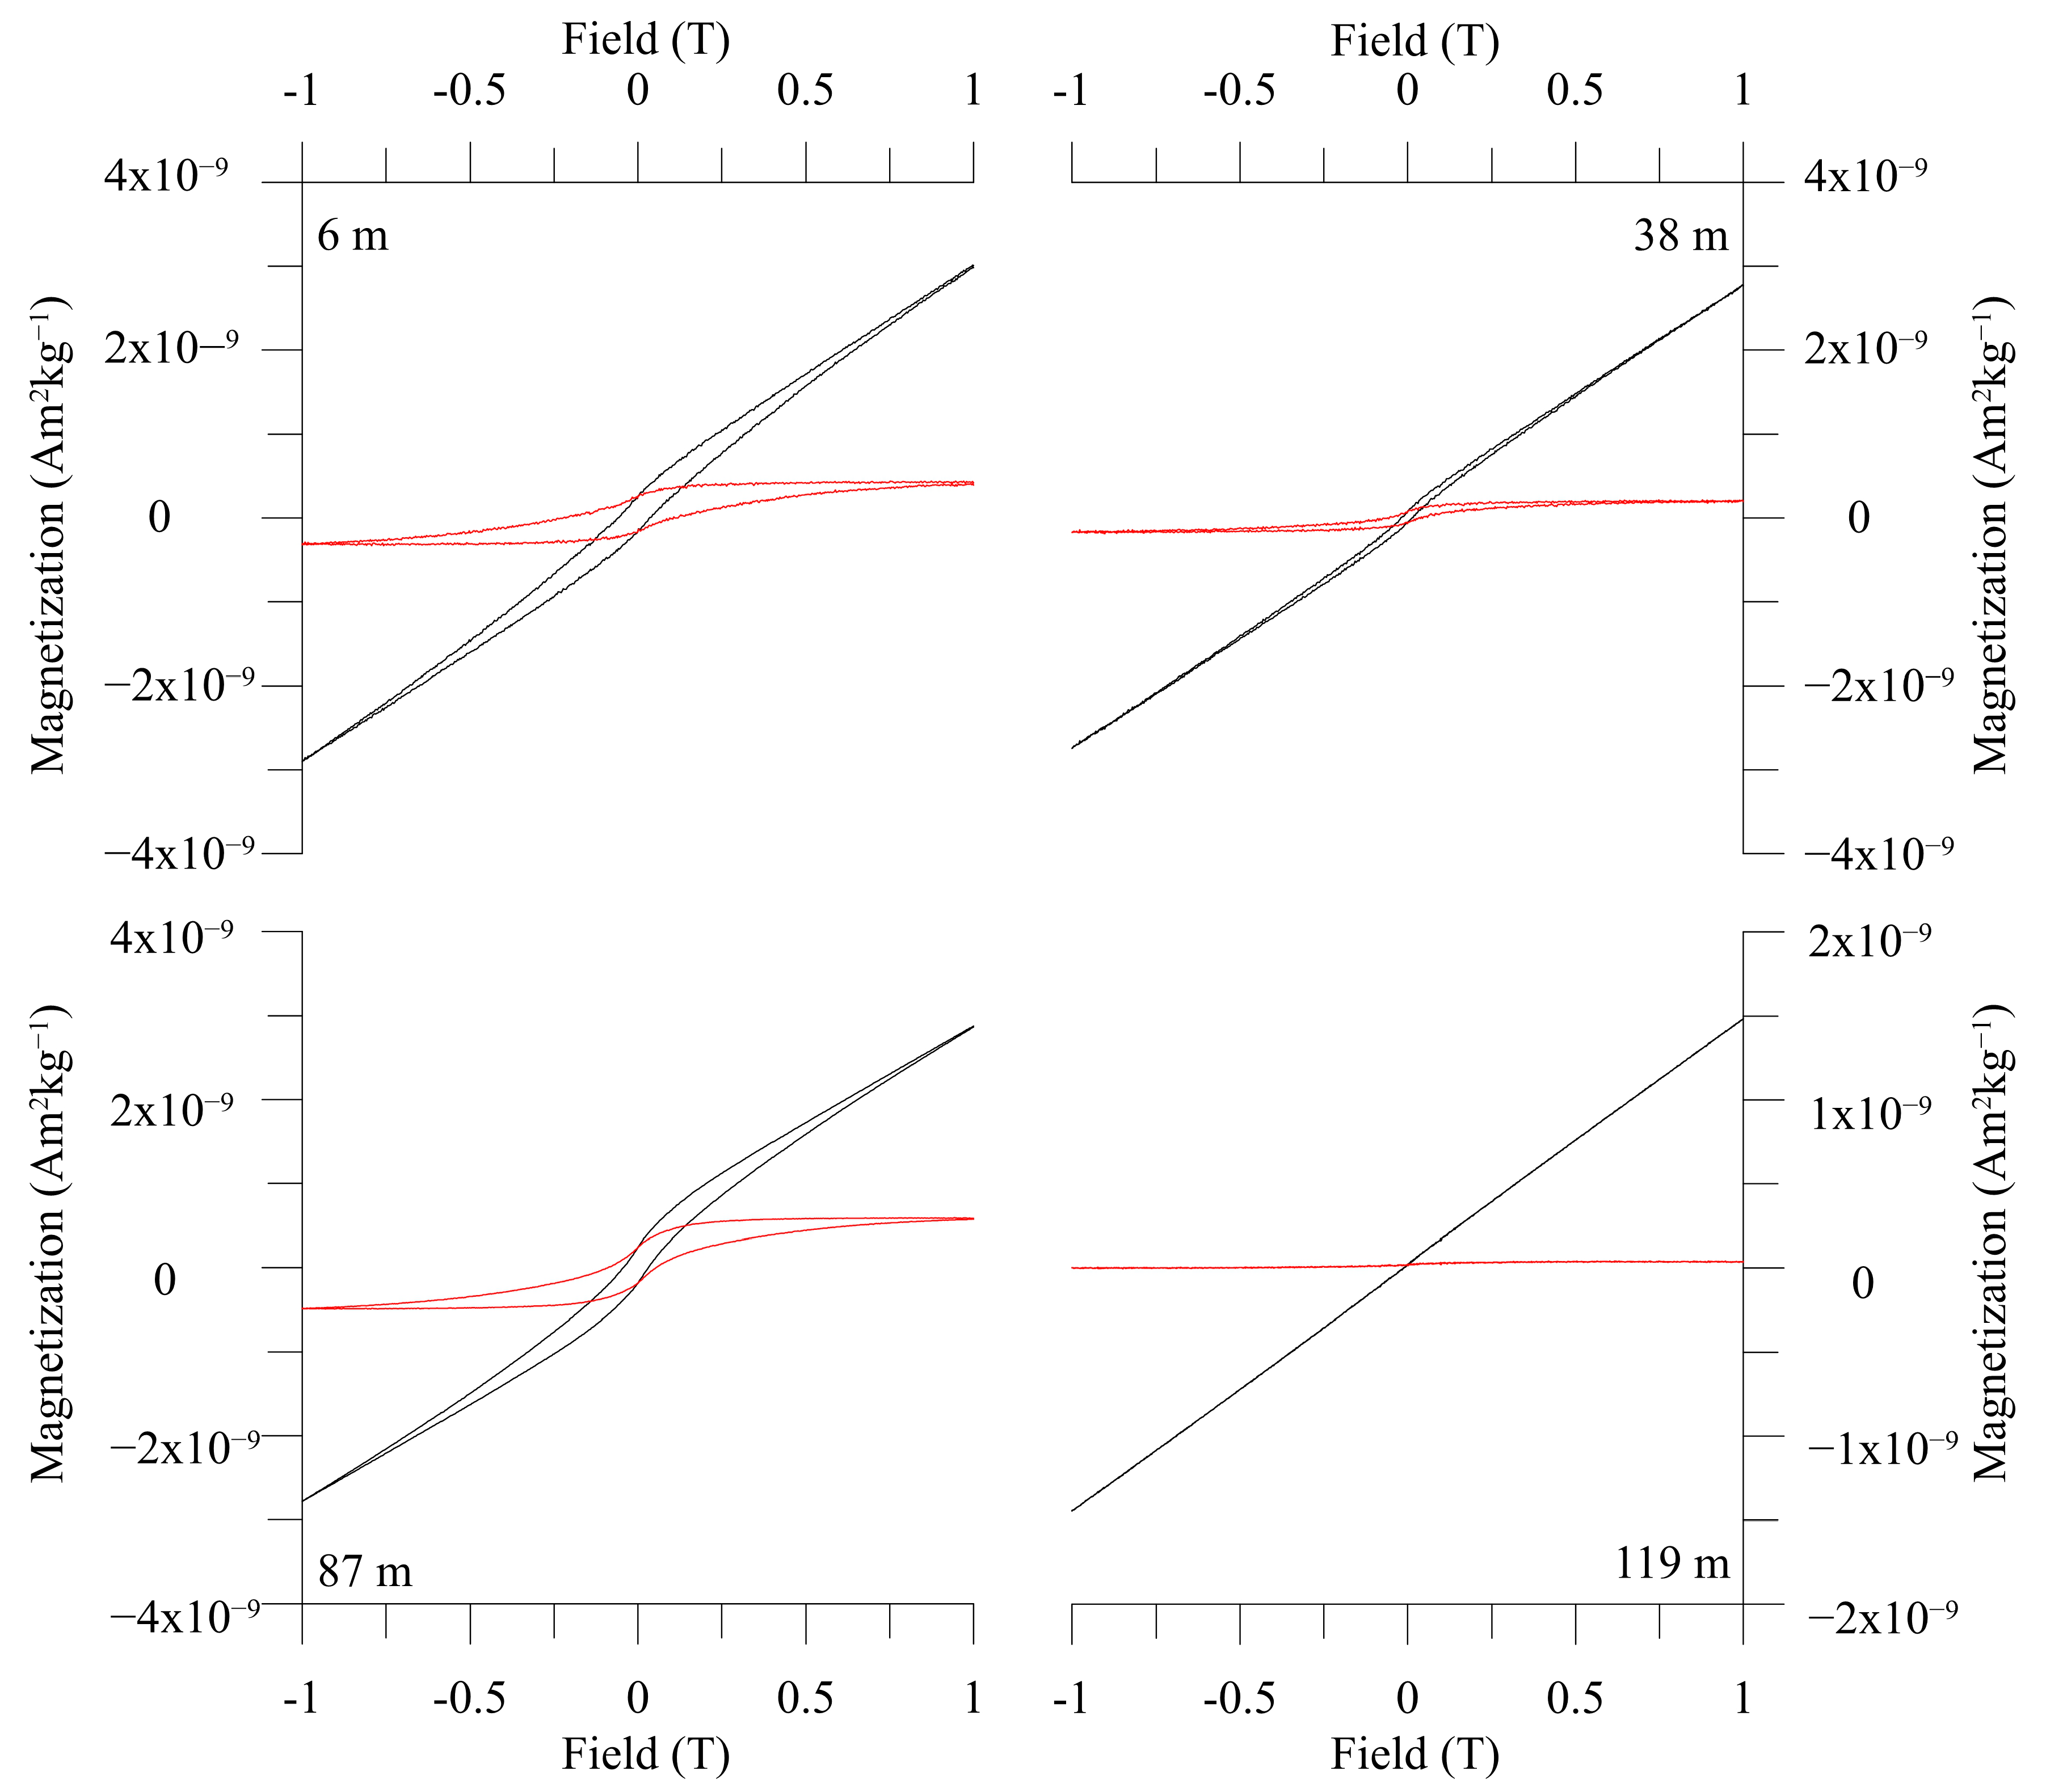
4.1. Magnetic Mineralogy

Temperature-dependent magnetic susceptibility has been commonly used to determine the magnetic mineral composition in various geological materials from various time periods [34,35]. The heating curves of pilot samples showed a characteristic peak at about 550 °C (Figure 3). This behavior can be interpreted as the result of the new formation of some higher-susceptibility minerals, such as magnetite, reduced from low-susceptibility hematite in an oxygen-free environment [36], and/or the Hopkinson peak, related to fine particles with relatively wide grain size distribution [37]. A common characteristic in all heating curves is a drop of the susceptibility at ~580 °C and a decrease to zero at ~680 °C, suggesting the existence of magnetite and hematite, respectively. Because the susceptibility of magnetite is about two orders of magnitude higher than hematite, the susceptibility decrease above 600 °C indicates the presence of a substantial amount of hematite. In addition, all the pilot samples had irreversible heating and cooling curves; specifically, the susceptibility of the samples was much higher after cooling, which is generally attributed to the alteration of paramagnetic contributors (e.g., clay minerals) and the formation of strongly magnetic minerals during heating [38].
IRM acquisition curves can also be used to identify magnetic minerals according to their coercivities [39]. The IRM acquisition curves of the samples from 6 m, 38 m, and 87 m only acquired ~30% of their saturation IRM at ~300 mT and were only saturated in applied fields > 1.5 T, indicating the dominance of high-coercivity minerals such as hematite. To assess this interpretation, IRM acquisition curves were unmixed following [32]. The IRM component analyses identified the following two components in all the samples [32,40,41] (Figure 4): a low-coercivity and high-coercivity component. For low-coercivity component 1, the B1/2 (the field at which half of the saturation IRM is reached) of the samples was <10 mT, which could be maghemite, fine-grained, c.a., <1 um hematite, or magnetite [42]. For the high-coercivity component, the B1/2 of the samples was between ~391 and ~468 mT, which is consistent with the magnetic properties of hematite [42]. The sample from 87 m is an exception in that the coercivity of component 1 reached ~270 mT, which is indicative of hematite.
For the hysteresis loops, the magnetization of all the samples decreased after paramagnetic correction, suggesting the existence of abundant paramagnetic and/or clay minerals. For the samples at 6 m, 38 m and 87 m (Figure 5), the hysteresis loops were generally wasp-waisted and remained saturated within a 1 T field, indicating combinations of magnetic minerals with low and high coercivities, for example, magnetite and abundant hematite [43,44]. For the sample at 119 m, the hysteresis loop of magnetization was closed at ~150 mT, indicating the paramagnetic may be the main contributor to the susceptibility [45,46].
Combining all the rock magnetic experiments, we conclude that there are two main components, hematite and magnetite, which may define the magnetic parameters of the samples. On account of the magnetite has an IRM that is about two orders of magnitude stronger than hematite [47], this means large hematite concentrations are necessary for hematite to contribute substantially to the remanence when magnetite is also present. Therefore, hematite minerals may mainly control the magnetic properties of these samples in the TTH-D section and the experiments also indicate the appearance of paramagnetism.

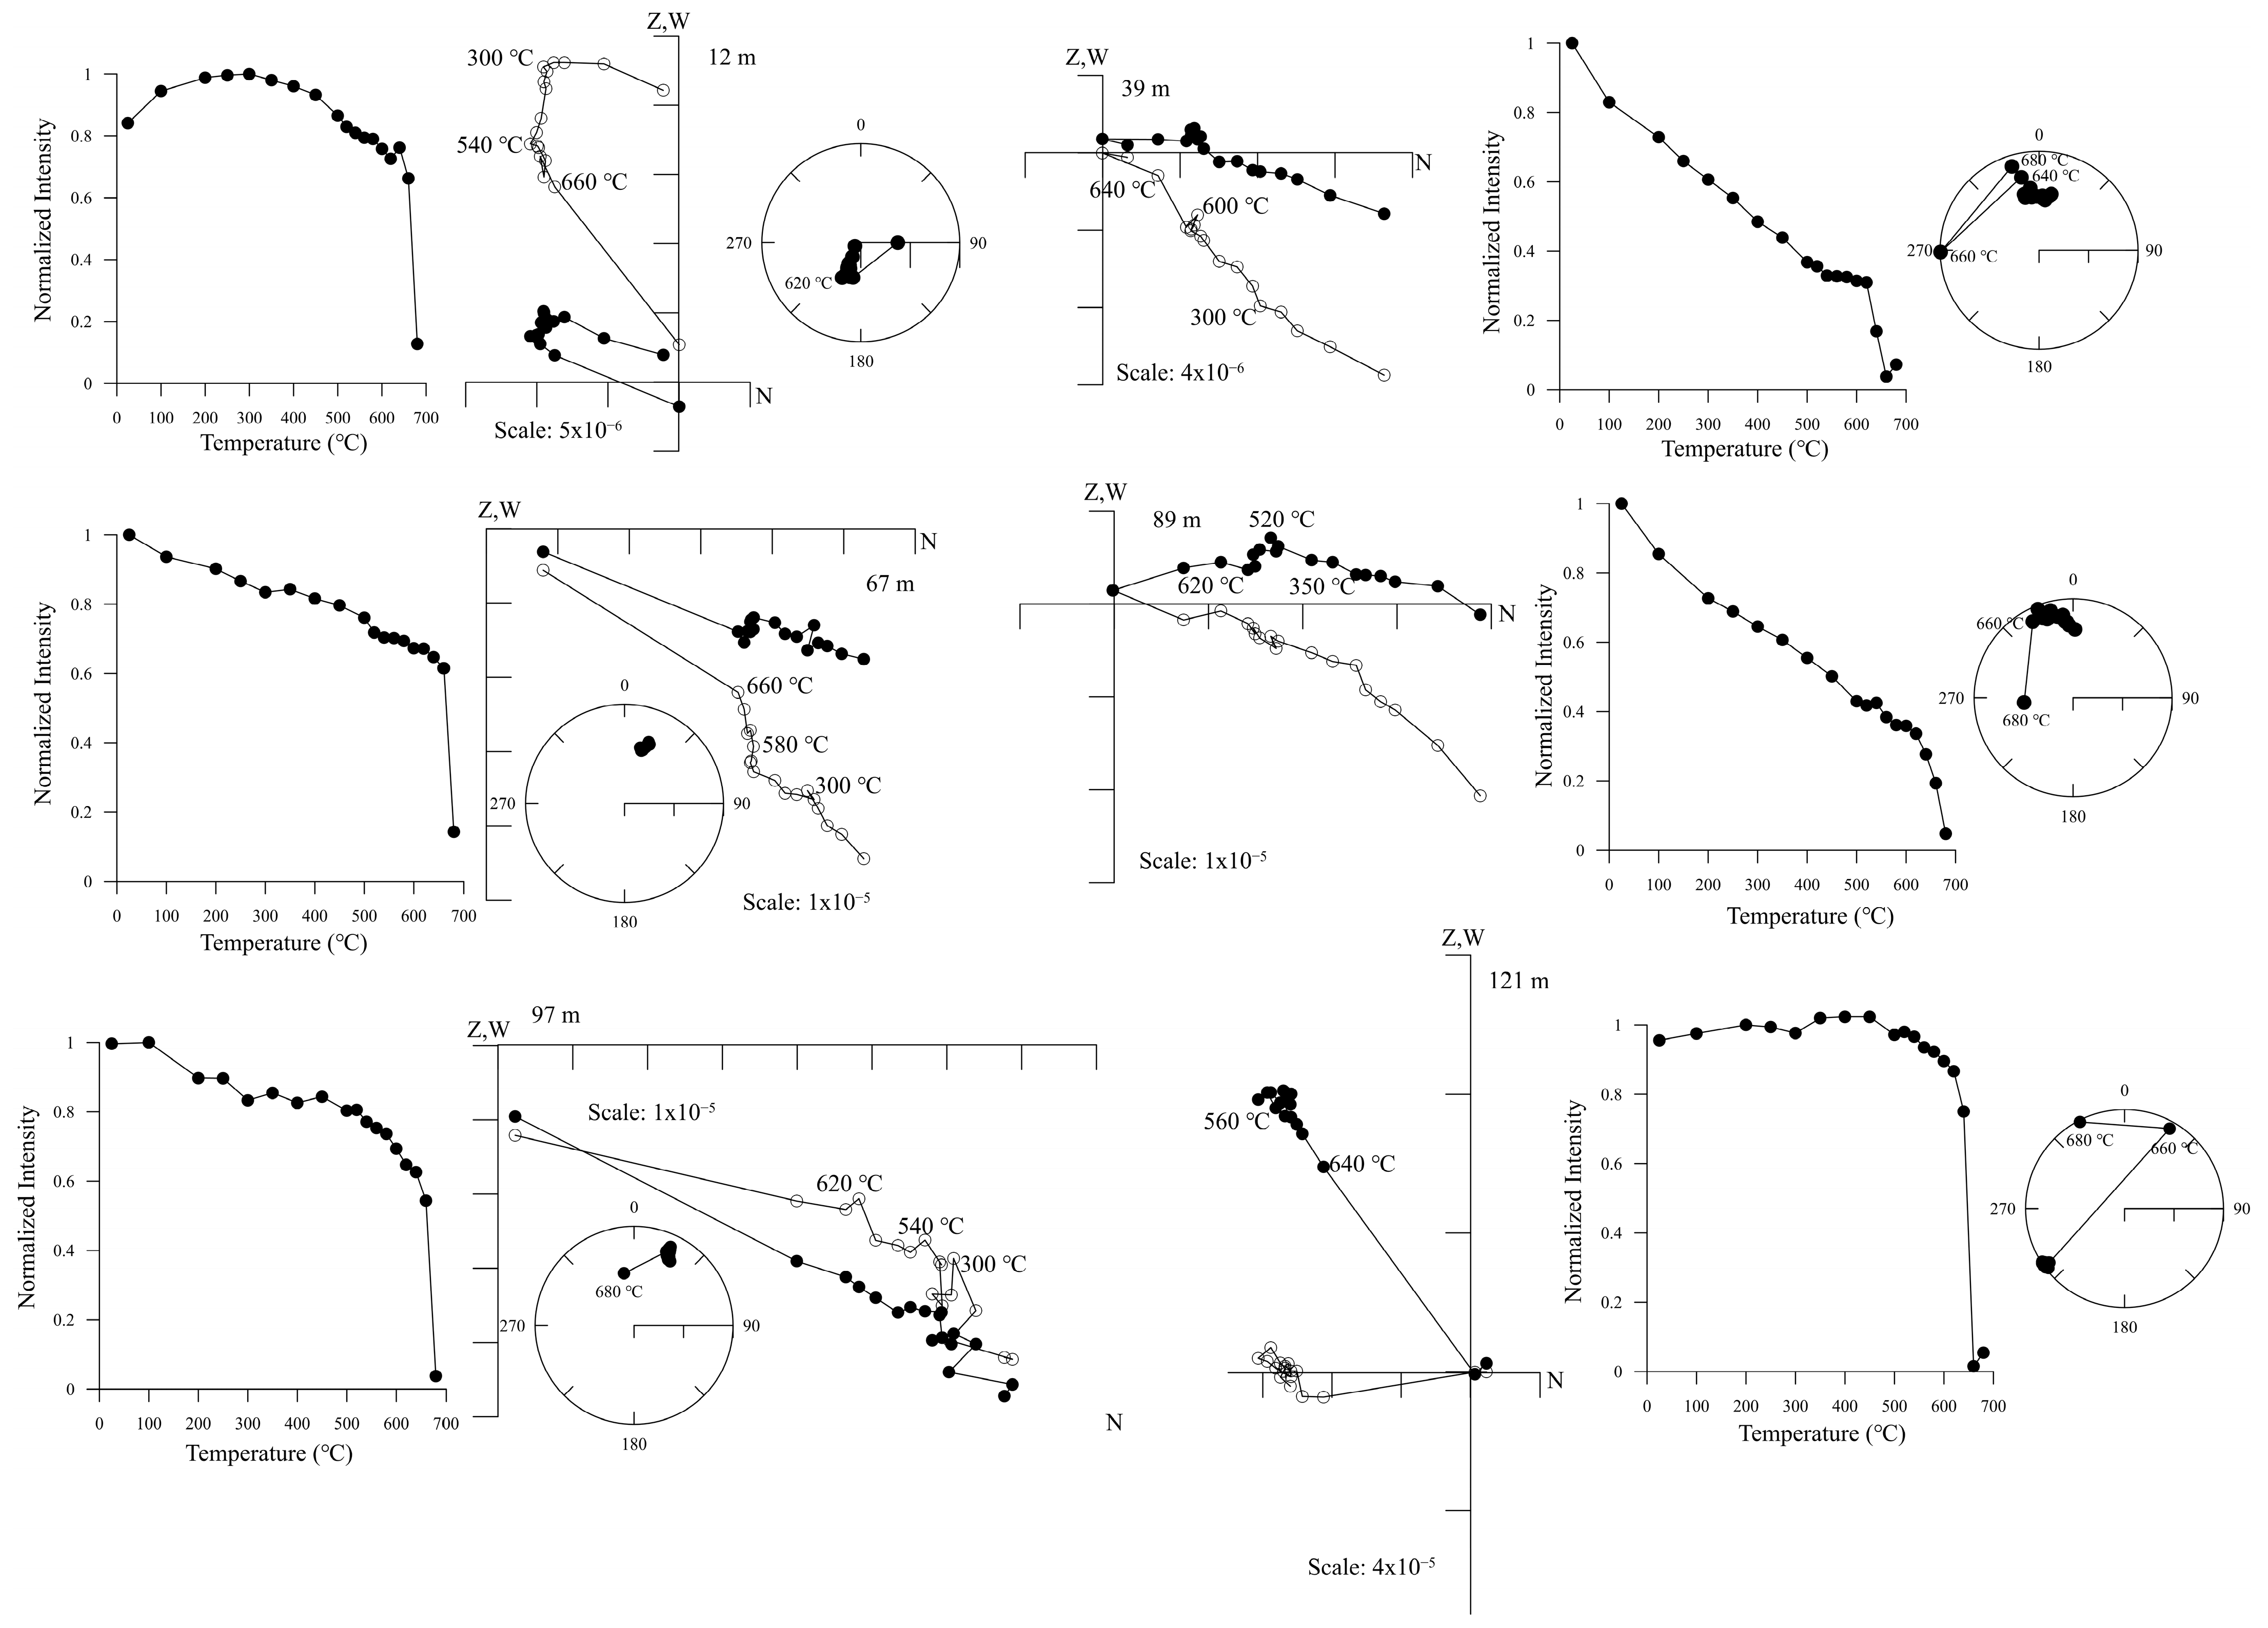
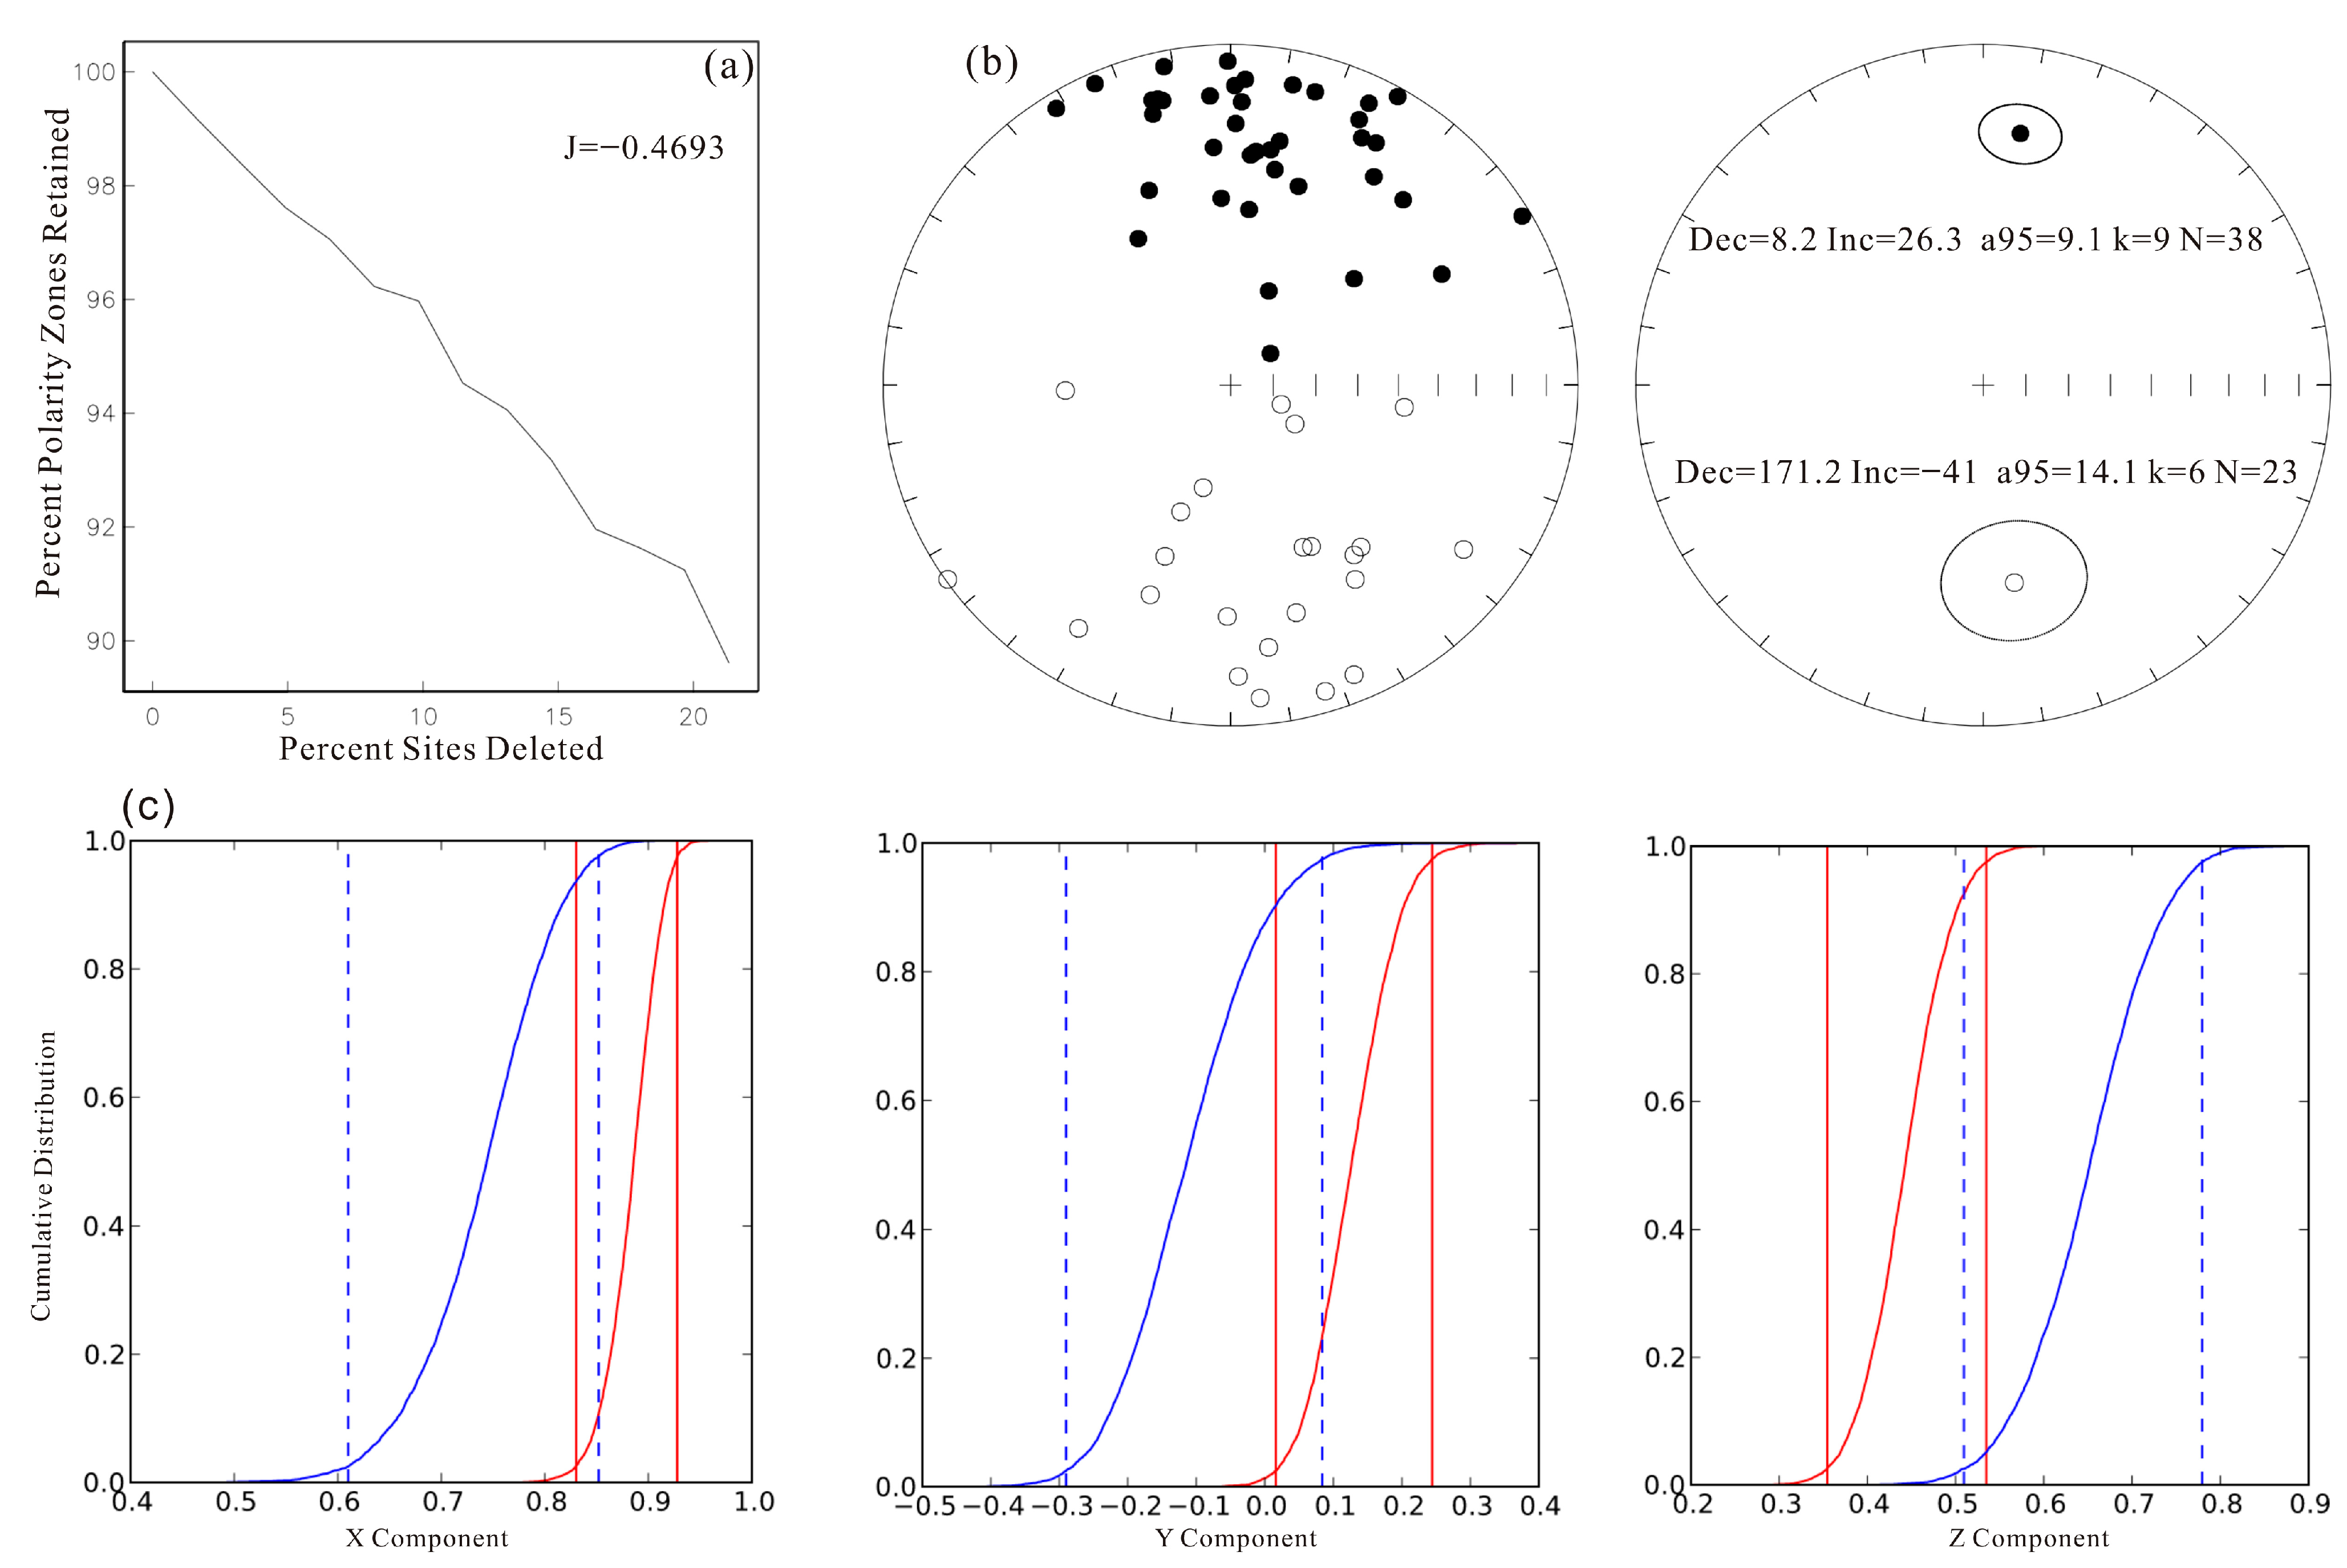
4.2. Paleomagnetic Results

Orthogonal projections (so-called Zijderveld diagrams) of the demagnetization results for representative samples are shown in Figure 6, and demagnetization behavior indicated three characteristic types. The first type was a low-temperature component that was removed within the temperature range of 300–500 °C; above this temperature range, a high-temperature magnetic component decayed univectorally towards the origin (e.g., the samples from 12 m and 89 m). The second type had a component that decayed univectorally towards the origin between 600 °C and 680 °C, which is characteristic of hematite (e.g., the samples from 121 m). The third type was a demagnetization component that decayed univectorally at temperatures approaching the unblocking temperature of 680 °C (e.g., the samples from 39 m and 97 m). Combining these results with the rock magnetic results, we conclude that the dominant magnetic carriers of the ChRM for the TTH-D section are hematite and magnetite. However, given the brick red color of the Tuotuohe Formation and the differences between the magnetizations of magnetite and hematite, we conclude that the most abundant magnetic mineral in the Tuotuohe Formation is hematite.
After thermal demagnetization and principal component analysis, a total of 61 out of 120 samples were used to construct a magnetostratigraphy on the basis of the following four criteria. (1) ChRM directions could not be determined. (2) ChRM directions could be revealed, but the maximum angular deviation is >15°. (3) Specimens with virtual geomagnetic pole (VGP) latitude values less than 25°. (4) Polarities of the inclination and declination are not matched. To evaluate the reliability of the paleomagnetic results, ChRM directions were evaluated using a Jackknife test to assess the reliability of the polarity determinations [48]. The result was J = −0.4693, which falls within the range of 0 to −0.5 (Figure 7a). This indicates that 95% of the true number of polarities has been recovered. The equal area projection for the tilt-corrected ChRM yielded means of Ds = 8.2°, Is = 26.3°, α95 = 9.1, k = 9, and n = 38 for normal polarity directions, and Ds = 171.2°, Is = −41°, α95 = 14.1, k = 6, and n = 23 for reverse polarity directions (Figure 7b); hence, there is a positive reversal test [49]. A reversal test was also performed (Figure 7c) to evaluate whether the average normal and reversal poles were statistically antipodal within the 95% confidence limit [50]. The bootstrap reversal test result indicated that the components overlapped for both normal and reverse polarity directions at the 95% confidence level. Taken together, the tests demonstrated that the paleomagnetic results uncovered 95% of the true polarities, and that a secondary remnant magnetization was successfully removed. However, as shown in Figure 7, the equal-area projection and the mean values of the declination and inclination showed that the normal and reversal polarities were not exactly antipodal, a phenomenon that often occurs in the mid-latitudes (30–45°) of the Northern Hemisphere. The reasons for this phenomenon may be (1) the overlapping of components, which could change the relationship between the primary and secondary magnitudes, especially if the primary direction has an opposite polarity to the secondary one [51]; (2) a persistent, non-removed, present day field component or the contribution of an axial octupole; and (3) the influence of the fold thrust or vertical rotation [52,53]. The average value of the declination of the TTH-D section showed no significant rotation (Figure 7b and Figure S1 in Supplementary Materials), and the demagnetization curve showed that the intensity of some samples did not drop to zero even at about 680 °C (Figure 6), indicating that some high-coercivity components were not completely removed. Thus, we speculate the non-antipode nature of the TTH-D section probably due to the overlap of secondary components or the contribution of an axial octupole [54].

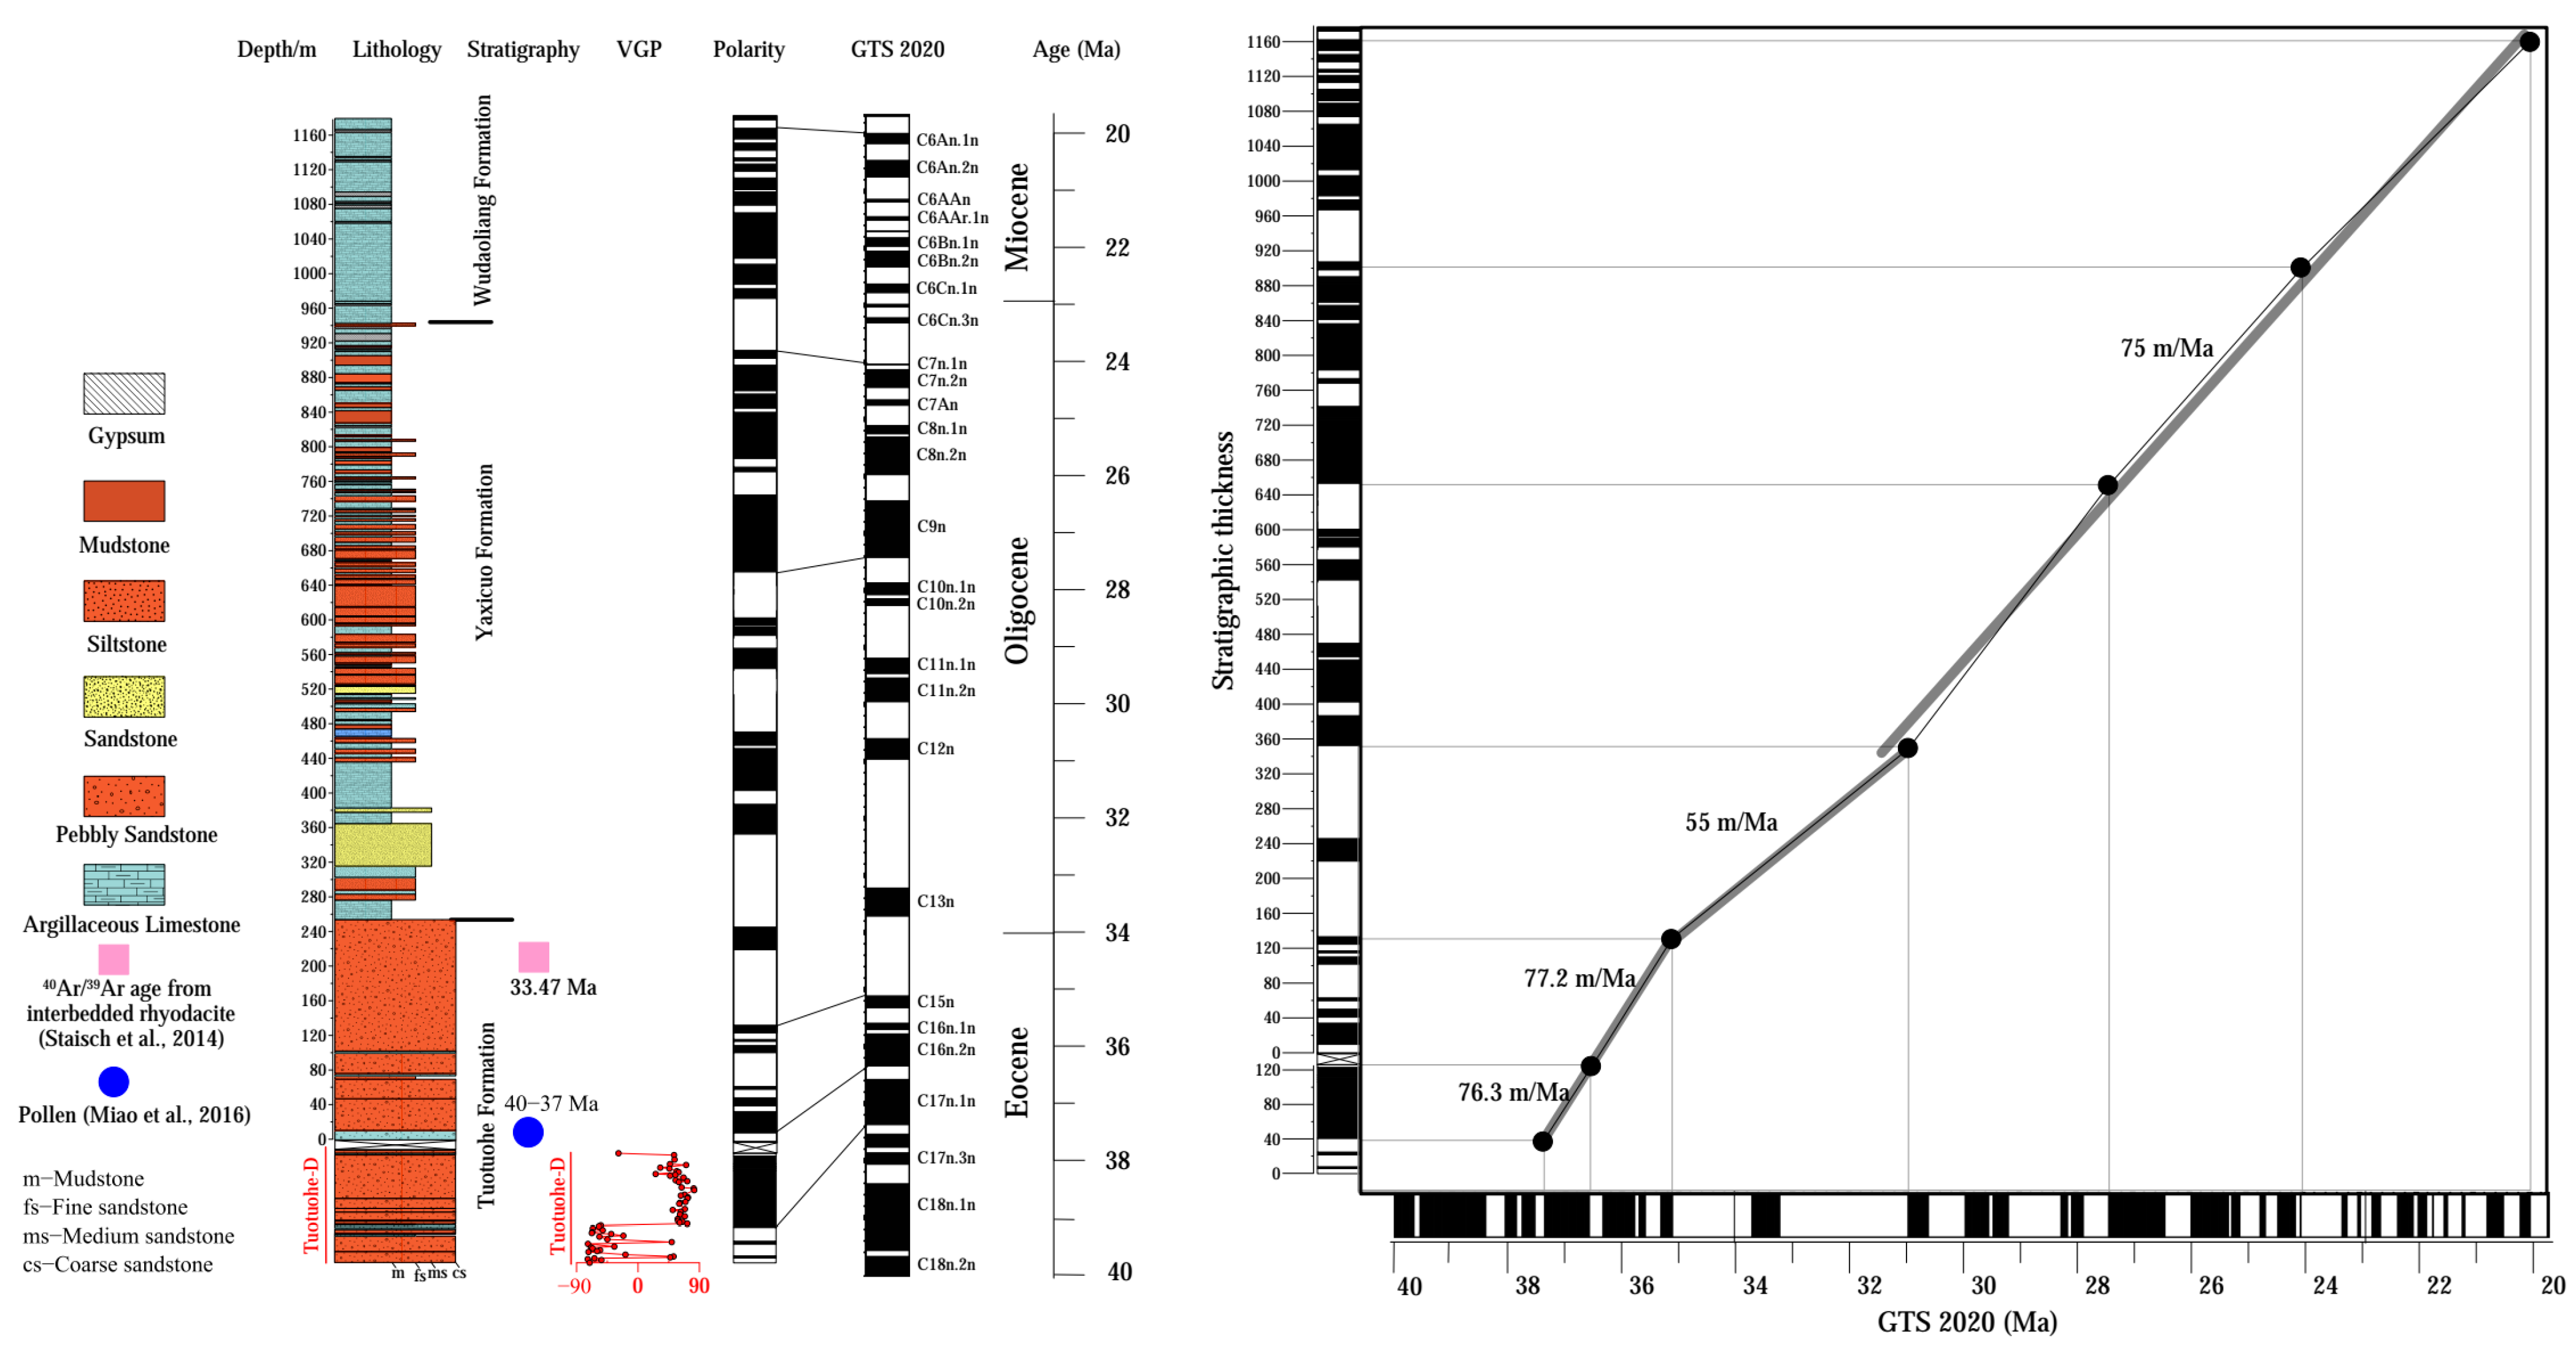
4.3. Correlation with the Magnetic Polarity Time Scale

The ChRM directions were used to obtain virtual geomagnetic pole (VGP) latitudes to construct the magnetostratigraphy of the TTH-D section. The studied section consists of four reversed and three normal polarity intervals (Figure 8). The resulting magnetostratigraphy was combined with the magnetostratigraphic result from the TTH section, which is constrained by multiple methods including analyses of pollen, ostracods, gastropods, charophyta, detrital zircons, and radiometric dating of a regional rhyodacitic lava flow [28]. With the additional part of the TTH section, the correlation of the magnetic polarity zones of the TTH-D section with the geomagnetic polarity time scale (GTS) [55] is relatively straightforward (Figure 8). The magnetostratigraphy was characterized by a long normal polarity which spans a stratigraphic interval of ~80 m, which could be matched with C17n.1n. The bottom two normal polarity intervals were correlated with C17n.2n and C17n.3n. Based on this polarity correlation scheme, the basal age of the Tuotuohe Formation was constrained to ~38.5 Ma. It is noteworthy that the basal age of the Tuotuohe Formation should be older than ~38.5 Ma because we were unable to sample down to the base of the formation where the strata have a heavy cover. Based on the results of the TTH and TTH-D sections, the age of the Tuotuohe Formation spans the interval from >38.5 Ma to ~33 Ma. Meanwhile, the sedimentation rate of the Tuotuohe Formation in the TTH-D section is basically consistent with that of the Tuotuohe Formation in the Tuotuohe section (Figure 8), which further supports the reasonableness of this kind of match with the geomagnetic polarity time scale (GTS) [55].

5. Discussion

5.1. Paleolatitude of the Tuotuohe Basin and Paleoclimate Implications

The use of proxy indexes for paleoclimatic, palaeobiological, and palaeoceanographic reconstruction depends on accurately constraining the paleogeographical location of a geological record [27]. Estimating the paleolatitude from paleomagnetic data from sedimentary rocks must consider inclination shallowing, which is well documented, especially in central Asia [56,57,58]. Inclination shallowing is widely observed in both hematite-bearing sedimentary red beds and in carbonate rocks [59], and it may lead to the underestimation of the primary paleomagnetic directions and the biasing of paleogeographic reconstructions [60]. Thus, it is necessary to correct for inclination shallowing before a pole from sedimentary rocks is used for paleogeographic reconstruction. The elongation/inclination (E/I) method is widely used to calculate inclination shallowing and it requires no additional rock magnetic experiments and is relatively easy to implement [61,62]. The method is particularly suited to magnetostratigraphic work because it requires large datasets (>100) to average out the paleosecular variation [63,64].
Recently, a set of quality criteria for the correction of paleomagnetic poles from sedimentary rocks for inclination shallowing was formulated based on the E/I method [58]. The criteria are as follows: the individual number of directions N is at least 100, the A95 cone of confidence falls within A95min and A95max, no negative reversal test is obtained, and no vertical axis rotation differences within the dataset exceed 15°. The general criteria conform to the reliability criteria of [53]. Three classification levels (A, B, and C) are proposed in the application of the criteria. Classification A represents reliable, inclination shallowin-corrected poles which can be used for tectonic interpretation. Classification B indicates less reliable but still useful estimates of the original inclination and paleolatitude. Classification C indicates data of inadequate quality which provide unreliable paleolatitudes [58].
We now evaluate our data against the reliability criteria of [58]. One of the criteria is that the number of individual paleomagnetic directions should be >100. Therefore, we combined the paleomagnetic data of the Tuotuohe Formation from the TTH section [28] and the data from the present study, resulting in a total of 132 individual paleomagnetic directions for the late Eocene. A 45° cutoff was used for data filtering, which is common practice for making the data more representative of the paleosecular variation (e.g., [57,64]). The data conformed to the general reliability criteria defined by [53] and there was a positive reversal test (Figure 9a). For N = 132, A95min and A95max are 2.41 and 3.78, respectively. The calculated A95 value of the 132 individual paleomagnetic directions was 3.4, falling within the A95min and A95max envelope [65]. The data were almost south–north antipodal and evidently do not record any vertical axis rotation of >15° (Figure 9b, Figure S1 in Supplementary Materials). Our data passed all of the criteria and hence were assigned a quality grade A and are therefore suitable for paleolatitude reconstruction.
The expected inclination from the Eurasia reference poles [66] was 54.5° 35 Ma (Figure 9b). It is evident that the observed mean inclination for the Tuotuohe Formation was more than 25.5° shallower than that expected in the Tuotuohe Basin (Figure 9b). After E/I correction [61], the mean inclination was 44.1° with the 95% confidence limits between 37.5° and 49.5° (Figure 9c,d). The corresponding paleolatitude for the Tuotuohe Basin was 25.9 ± 4.2° between 38.5 and 33 Ma [28 and this study]. The corrected inclination and corresponding paleolatitude are nearly identical to those previously obtained from lavas at Wulanwula Lake (34.54° N, 90.2° E) by [67]; for the assigned age of 38.6 ± 0.5 Ma, the inclination was 46.1 ± 7.6° and the reconstructed paleolatitude was 28.7 ± 3.7° (converted to TTH-D section is 26.9°). Volcanic rocks not affected by the inclination shallowing that may occur in sedimentary rocks and are thus they provide the most reliable paleolatitude estimates [67]. Therefore, the volcanic-rock-based palaeomagnetic data from nearby Wulanwula Lake provide valuable support for the occurrence, magnitude, and correction of the sedimentary inclination shallowing in the Tuotuohe Formation.
The reconstructed paleolatitude of 25.9 ± 4.2° during the period between 38.5 and 33 Ma indicates that the Tuotuohe Basin was located in the anticyclonic zone of a subtropical belt and that the paleoenvironment might be controlled by subtropical high pressure (Figure 10a). Therefore, an arid climate would be expected in the Tuotuohe Basin during the late Eocene, which is supported first by the occurrence of xerophytic pollen taxa Ephedripites, Nitrariadites (Nitrariapollis), and Chenopodipollis, together with a few ferns and conifers [68]; and second by the hematite-bearing red color of the rocks [69]. At almost the same time, the climate in the Lunpola and Bangor Basins and the Yunnan Plateau was wet and influenced by the tropical and sub-tropical monsoon, indicated by abundant plant fossils and by various other proxies [23,24,70,71,72] (Figure 10a). In addition, the palynoflora from Fenghuoshan Group (the top age is older than 44.6 to 40.1 Ma) in the northern slope of the Fenghuo Mountains, closely north of the Tuotuohe Basin, imply a warm, arid climate and subtropical forest shrub vegetation at the time of deposition [73,74]. This implies an overall aridity in the climate of the Tuotuohe Basin from the Late Cretaceous to ~33 Ma. The above results together demonstrate that the tropical monsoon did not intrude into the Tuotuohe Basin and no monsoon-dominated climate existed before ~33 Ma. This result is supported by the climatic records from the Nangqian Basin, eastern central TP, which demonstrate that monsoon-dominated climate was not established in the Nangqian Basin until at least ~35 Ma [75].

5.2. Implications for the Tectonic Intensity Change in the Tuotuohe Basin

In order to analyze the motion of the Tuotuohe Basin in response to the India–Asia collision, we compiled paleomagnetic poles and paleolatitude results from the Qiangtang terrane and surrounded regions. To better understand the Cenozoic evolution of the Tuotuohe Basin, all available paleomagnetic results are compiled in Supplementary Materials, Table S1. We applied the widely accepted seven-point data criteria method, quality index (Q index), to reevaluate the quality of the data (in Supplementary Materials, Table S1) [79]. Recently, Meert et al. (2020) [53] proposed a new reliability criterion, Reliability (R) indicator, by appropriately modifying the equal-weighted criterion proposed by Van der Voo (1990) according to the latest advances in paleomagnetic research. The new R index is not significantly different from the previous Q index, but several new judgment criteria have been added, such as the evaluation of the magnetic carrier minerals and the correction of the inclination of clastic sedimentary rocks. Here, we combine these two criteria (Q and R indexes) and select the paleomagnetic data based on the seven criteria (named 1–7) of [79] and add two more criteria based on [53]: correction for the inclination shallowing (named 8) and the determination of the magnetic carrier minerals (named 9). The high-quality results are listed in bold font in Table S1 (in Supplementary Materials).
Although this selection criteria approach is rigorous, some results fail to fulfill the nine criteria. Lin and Watts (1988) [80] and Halim et al. (1998) [81] carried out paleomagnetic studies in the Paleocene–Early Eocene strata of the Fenghuoshan-Erdaogou Basin, but the stratigraphy was not well dated and not corrected for inclination shallowing (Table S1 in Supplementary Materials); Liu et al. (2003) [13] carried out more detailed magnetostratigraphy of the Fenghuoshan Group in the Fenghuoshan–Erdaogou Basin and the Yaxicuo Formation in the Wudaoliang Basin, but the constrained stratigraphic chronology of the Fenghuoshan Group was subsequently revisited [15,20] and again no attempt was made to correct for inclination shallowing; the paleomagnetic work carried out by Chen et al. (2002) [82] in the Miocene strata of the Hoh Xil Basin, Dai et al. (2012) in the Kangtuo Formation of the Western Hoh Xil Basin [83], Ran et al. (2016) in the Yaxicuo and Wudaoliang Formations of the Tongtianhe Basin [84], and Yi et al. (2004) in the Fenghuoshan Group of the Wulanwula Lake [73] all suffer from the ambiguity and unreliability of stratigraphic ages and the lack of correction for the inclination shallowing. Although the Q + R values of the above-mentioned studies are all ≥5, however, considering the existence of the obvious inclination shallowing recorded by sedimentary rocks in Central Asia [56], it is especially necessary to correct the inclination of sedimentary rocks. Based on this, the nine above-mentioned paleomagnetic results (No: 11–19 in the Table S1 in the Supplementary Materials) were excluded from the Cenozoic paleolatitude reconstruction of the Tuotuohe Basin.
Finally, the data from the Nima Basin [77], Wulanwula Lake [67], Gonjo Basin [85,86], Gaize Basin [87], and Xialaxiu Basin [88] were used to reconstruct the Cenozoic paleolatitude evolution of the Tuotuohe Basin. The paleomagnetic poles obtained by these studies met reliability criteria 1–7 of [79]. Additionally, the results were corrected by the E/I and anisotropy-based inclination-shallowing correction methods [53,61,89]. The paleolatitudes were transformed assigning TTH-D as a reference location (34.1° N, 92.3° E).
The results indicated one obvious feature for the Cenozoic tectonic evolution of the Tuotuohe Basin: the corrected and transformed paleolatitude at ~26 Ma in the Tuotuohe Basin coincided well with coeval Eurasian apparent polar wander path [66] and was not significantly different from today (Figure 10b). This suggests that the N-S India–Asia convergence was considerably reduced at ~26 Ma in the Tuotuohe Basin, which is supported by several lines of evidence, as follows. (i) In the Wudaoliang Formation in the Tuotuohe Basin, with an age assignment starting at 23.6 Ma [28], the attitude of the strata is nearly horizontal and has remained so until the present, indicating a stable phase of tectonic convergence. (ii) The thermal histories of the north and south Fenghuoshan Thrust Belt constrained by apatite fission track and (U-Th)/He dating suggest that rapid cooling began at 48–44 Ma and ceased at 31–25 Ma [16]. (iii) The 40Ar/39Ar ages of the horizontal basalt flows that overlie the deformed Fenghuoshan Group near Erdaogou are 27.33 ± 0.1 Ma and 26.46 ± 0.23 Ma [15]. In addition, analysis of available Cretaceous and Cenozoic paleomagnetic data from volcanic rocks in central Asia suggests that no significant northward convergence has occurred north of Tibet during the last 20 Myr [90], which partly supports the result in the Tuotuohe Basin. Finally, this conclusion in the Tuotuohe Basin, although supported by evidence such as that from the Hoh Xil Basin, may still not be entirely correct and needs to be supported by further research.

6. Conclusions

We obtained a magnetostratigraphy for the TTH-D section, composed of the Tuotuohe Formation, in the Tuotuohe Basin. The results indicated that the Tuotuohe Formation in the TTH-D section was deposited between ~38.5 and ~36.7 Ma. Combining this age with the results from the TTH section indicates that the age of the Tuotuohe Formation spans the interval from >38.5 Ma to ~33 Ma. The paleomagnetic data of the Tuotuohe Formation from the Tuotuohe section and the data from the present study were integrated to reconstruct the paleolatitude of the Tuotuohe Basin during the late Eocene. Of the 132 individual paleomagnetic directions from the Tuotuohe Formation, the overall mean of the tilt-corrected data was Dec = 0.2°, Inc = 29°, a95 = 4.2° and k = 9. Elongation/inclination-corrected inclination data indicate that the paleolatitude of the Tuotuohe Basin was 25.9 ± 4.2° during 38.5–33 Ma. This result is nearly identical to the previously obtained paleolatitude from coeval lavas in the Wulanwula Lake area, and it indicates that during the Eocene the Tuotuohe Basin was located in an anticyclonic zone in a subtropical belt and that the paleoenvironment was controlled by the subtropical high-pressure system. Additionally, paleomagnetic or paleolatitude results from the Qiangtang terrane and the bordering regions were corrected and transformed. The results indicate that the paleolatitude at ~26 Ma for the Tuotuohe Basin coincides well with the coeval Eurasian apparent polar wander path, which is not significantly different from today. This means that the N-S India–Asia convergence was considerably reduced in the Tuotuohe Basin at ~26 Ma.

Supplementary Materials

The following supporting information can be downloaded at: https://www.mdpi.com/article/10.3390/min13040533/s1, Figure S1: Vertical axis rotation velocities of the Tuotuohe Basin from 38 Ma to 33 Ma; Table S1: Published Cenozoic paleomagnetic data distributed in the inner and marginal Qiangtang terrane and this study; Table S2. Paleomagnetic data of the TTH-D section [13,67,73,77,80,81,82,83,84,85,86,87,88].

Author Contributions

Conceptualization, L.L. and H.C.; methodology, L.L.; validation, L.L. and H.C.; formal analysis, L.L., H.C., X.L., B.B., J.S., X.Q. and C.G.; investigation, L.L., H.C. and J.S.; writing—original draft preparation, L.L.; writing—review and editing, L.L., H.C., X.L., B.B., J.S., X.Q. and C.G.; supervision, H.C.; funding acquisition, H.C. and L.L. All authors have read and agreed to the published version of the manuscript.

Funding

This research was funded by the National Natural Science Foundation of China [42102023]; the Second Tibetan Plateau Scientific Expedition and Research Program [2019QZKK0707]; the Open fund of Yunnan Key Laboratory of Earth System Science [ESS2022001], and the State Key Laboratory of Loess and Quaternary Geology, Institute of Earth Environment, CAS [SKLLQGPY1804].

Data Availability Statement

The data of TTH-D section are available in the supplementary material.

Acknowledgments

We are grateful to Jan for his valuable language refinement on the manuscript and the suggestions from the editor and the two anonymous reviewers.

Conflicts of Interest

The authors declare no conflict of interest.

References

  1. Molnar, P.; Tapponnier, P. Cenozoic tectonics of Asia: Effects of a continental collision. Science. 1975, 189, 419–426. [Google Scholar] [CrossRef]
  2. Yin, A.; Harrison, T.M. Geologic evolution of the Himalayan-Tibetan orogen. Annu. Rev. Earth Planet. Sci. 2000, 28, 211–280. [Google Scholar] [CrossRef] [Green Version]
  3. Qiu, J. China: The third pole. Nat. News 2008, 454, 393–396. [Google Scholar] [CrossRef] [Green Version]
  4. Raymo, M.E.; Ruddiman, W.F. Tectonic forcing of late Cenozoic climate. Nature 1992, 359, 117–122. [Google Scholar] [CrossRef]
  5. An, Z.; Kutzbach, J.E.; Prell, W.L. Evolution of Asian monsoons and phased uplift of the Himalaya Tibetan plateau since Late Miocene times. Nature 2001, 411, 62–66. [Google Scholar]
  6. Liu, X.; Yin, Z.Y. Sensitivity of East Asian monsoon climate to the uplift of the Tibetan Plateau. Palaeogeogr. Palaeoclimatol. Palaeoecol. 2002, 183, 223–245. [Google Scholar] [CrossRef] [Green Version]
  7. Molnar, P.; Boos, W.R.; Battisti, D.S. Orographic Controls on Climate and Paleoclimate of Asia: Thermal and Mechanical Roles for the Tibetan Plateau. Annu. Rev. Earth Planet. Sci. 2010, 38, 77–102. [Google Scholar] [CrossRef] [Green Version]
  8. Yao, T.; Thompson, L.; Yang, W.; Yu, W.; Gao, Y.; Guo, X.; Yang, X.; Duan, K.; Zhao, H.; Xu, B.; et al. Different glacier status with atmospheric circulations in Tibetan Plateau and surroundings. Nat. Clim. Change 2012, 2, 663–667. [Google Scholar] [CrossRef]
  9. Yao, T.; Wu, F.; Ding, L.; Sun, J.; Zhu, L.; Piao, S.; Deng, T.; Ni, X.; Zheng, H.; Ouyang, H. Multispherical interactions and their effects on the Tibetan Plateau’s earth system: A review of the recent researches. Natl. Sci. Rev. 2015, 2, 468–488. [Google Scholar] [CrossRef] [Green Version]
  10. Ding, L.; Kapp, P.; Cai, F.; Garzione, C.N.; Xiong, Z.; Wang, H.; Wang, C. Timing and mechanisms of Tibetan Plateau uplift. Nat. Rev. Earth Environ. 2022, 3, 652–667. [Google Scholar] [CrossRef]
  11. Wu, F.; Fang, X.; Yang, Y.; Dupont-Nivet, G.; Nie, J.; Fluteau, F.; Zhang, T.; Han, W. Reorganization of Asian climate in relation to Tibetan Plateau uplift. Nat. Rev. Earth Environ. 2022, 3, 684–700. [Google Scholar] [CrossRef]
  12. Yao, T. Tackling on environmental changes in Tibetan Plateau with focus on water, ecosystem and adaptation. Sci. Bull. 2019, 64, 417. [Google Scholar] [CrossRef] [PubMed] [Green Version]
  13. Liu, Z.; Zhao, X.; Wang, C.; Liu, S.; Yi, H. Magnetostratigraphy of Tertiary sediments from the Hoh Xil Basin: Implications for the Cenozoic tectonic history of the Tibetan Plateau. Geophys. J. Int. 2003, 154, 233–252. [Google Scholar] [CrossRef]
  14. Wang, C.; Zhao, X.; Liu, Z.; Lippert, P.C.; Graham, S.A.; Coe, R.S.; Yi, H.; Zhu, L.; Liu, S.; Li, Y. Constraints on the early uplift history of the Tibetan Plateau. Proc. Natl. Acad. Sci. USA 2008, 105, 4987–4992. [Google Scholar] [CrossRef] [PubMed] [Green Version]
  15. Staisch, L.M.; Niemi, N.A.; Hong, C.; Clark, M.K.; Rowley, D.B.; Currie, B. A Cretaceous-Eocene depositional age for the Fenghuoshan Group, Hoh Xil Basin: Implications for the tectonic evolution of the northern Tibet Plateau. Tectonics 2014, 33, 281–301. [Google Scholar] [CrossRef]
  16. Staisch, L.M.; Niemi, N.A.; Clark, M.K.; Chang, H. Eocene to late Oligocene history of crustal shortening within the Hoh Xil Basin and implications for the uplift history of the northern Tibetan Plateau. Tectonics 2016, 35, 862–895. [Google Scholar] [CrossRef] [Green Version]
  17. Fang, X.; Song, C.; Yan, M.; Zan, J.; Liu, C.; Sha, J.; Zhang, W.; Zeng, Y.; Wu, S.; Zhang, D. Mesozoic litho- and magneto-stratigraphic evidence from the central Tibetan Plateau for megamonsoon evolution and potential evaporites. Gondwana Res. 2016, 37, 110–129. [Google Scholar] [CrossRef]
  18. Yan, M.; Zhang, D.; Fang, X.; Ren, H.; Zhang, W.; Zan, J.; Song, C.; Zhang, T. Paleomagnetic data bearing on the Mesozoic deformation of the Qiangtang Block: Implications for the evolution of the Paleo- and Meso-Tethys. Gondwana Res. 2016, 39, 292–316. [Google Scholar] [CrossRef]
  19. Li, L.; Garzione, C.N.; Pullen, A.; Zhang, P.; Li, Y. Late Cretaceous–Cenozoic basin evolution and topographic growth of the Hoh Xil Basin, central Tibetan Plateau. GSA Bull. 2018, 130, 499–521. [Google Scholar] [CrossRef]
  20. Jin, C.; Liu, Q.; Liang, W.; Roberts, A.P.; Sun, J.; Hu, P.; Zhao, X.; Su, Y.; Jiang, Z.; Liu, Z.; et al. Magnetostratigraphy of the Fenghuoshan Group in the Hoh Xil Basin and its tectonic implications for India–Eurasia collision and Tibetan Plateau deformation. Earth Planet. Sci. Lett. 2018, 486, 41–53. [Google Scholar] [CrossRef]
  21. Dai, J.G.; Fox, M.; Shuster, D.L.; Hourigan, J.; Han, X.; Li, Y.L.; Wang, C.S. Burial and exhumation of the Hoh Xil Basin, northern Tibetan Plateau: Constraints from detrital (U-Th)/He ages. Basin Res. 2020, 32, 904–925. [Google Scholar] [CrossRef]
  22. Rowley, D.B.; Currie, B.S. Palaeo-altimetry of the late Eocene to Miocene Lunpola basin, central Tibet. Nature 2006, 439, 677–681. [Google Scholar] [CrossRef]
  23. Su, T.; Farnsworth, A.; Spicer, R.; Huang, J.; Wu, F.-X.; Liu, J.; Li, S.-F.; Xing, Y.-W.; Huang, Y.-J.; Deng, W.-Y.-D. No high Tibetan Plateau until the Neogene. Sci. Adv. 2019, 5, eaav2189. [Google Scholar] [CrossRef] [Green Version]
  24. Fang, X.; Dupont-Nivet, G.; Wang, C.; Song, C.; Meng, Q.; Zhang, W.; Nie, J.; Zhang, T.; Mao, Z.; Chen, Y. Revised chronology of central Tibet uplift (Lunpola Basin). Sci. Adv. 2020, 6, eaba7298. [Google Scholar] [CrossRef] [PubMed]
  25. Xiong, Z.; Liu, X.; Ding, L.; Farnsworth, A.; Spicer, R.A.; Xu, Q.; Valdes, P.; He, S.; Zeng, D.; Wang, C.; et al. The rise and demise of the Paleogene Central Tibetan Valley. Sci. Adv. 2022, 8, eabj0944. [Google Scholar] [CrossRef] [PubMed]
  26. Li, Y.; Wang, C.; Zhao, X.; Yin, A.; Ma, C. Cenozoic thrust system, basin evolution, and uplift of the Tanggula Range in the Tuotuohe region, central Tibet. Gondwana Res. 2012, 22, 482–492. [Google Scholar] [CrossRef]
  27. van Hinsbergen, D.J.; de Groot, L.V.; van Schaik, S.J.; Spakman, W.; Bijl, P.K.; Sluijs, A.; Langereis, C.G.; Brinkhuis, H. A Paleolatitude Calculator for Paleoclimate Studies. PLoS ONE 2015, 10, e0126946. [Google Scholar] [CrossRef] [Green Version]
  28. Li, L. Late Eocene—Early Miocene Paleoenvironment Evolution of the Tuotuohe Basin and Its Tectonic Uplift Implications for the Central—Northern Tibetan Plateau. Ph.D. Thesis, Institute of Earth Environment, Chinese Academy of Sciences, Xi’an, China, 2019. [Google Scholar]
  29. QBGMR. Qinghai Bureau of Geology and Mineral Resources. Geologic Map of Tuotuohe Region, Scale 1,200,000; Geological Press: Beijing, China, 1989. [Google Scholar]
  30. Zhang, Y.; Zheng, J. Geological Overview in Kokshili, Qinghai and Adjacent Areas; Seismic Publishing House: Beijing, China, 1994. [Google Scholar]
  31. Liu, Z.; Wang, C. Facies analysis and depositional systems of Cenozoic sediments in the Hoh Xil basin, northern Tibet. Sediment. Geol. 2001, 140, 251–270. [Google Scholar] [CrossRef]
  32. Kruiver, P.P.; Dekkers, M.J.; Heslop, D. Quantification of magnetic coercivity components by the analysis of acquisition curves of isothermal remanent magnetisation. Earth Planet. Sci. Lett. 2001, 189, 269–276. [Google Scholar] [CrossRef]
  33. Kirschvink, J.L. The least-squares line and plane and the analysis of palaeomagnetic data. Geophys. J. Int. 1980, 62, 699–718. [Google Scholar] [CrossRef]
  34. Deng, C.; Zhu, R.; Verosub, K.L.; Singer, M.J.; Yuan, B. Paleoclimatic significance of the temperature-dependent susceptibility of Holocene Loess along a NW-SE transect in the Chinese Loess Plateau. Geophys. Res. Lett. 2000, 27, 3715–3718. [Google Scholar] [CrossRef]
  35. Liu, Q.; Roberts, A.P.; Larrasoaña, J.C.; Banerjee, S.K.; Guyodo, Y.; Tauxe, L.; Oldfield, F. Environmental magnetism: Principles and applications. Rev. Geophys. 2012, 50, 1–50. [Google Scholar]
  36. Oches, E.A.; Banerjee, S.K. Rock-magnetic proxies of climate change from loess-paleosol sediments of the Czech Republic. Stud. Geophys. Geod. 1996, 40, 287–300. [Google Scholar] [CrossRef]
  37. Muxworthy, A.R.; Schmidbauer, E.; Petersen, N. Magnetic properties and Mössbauer spectra of urban atmospheric particulate matter: A case study from Munich, Germany. Geophys. J. Int. 2022, 150, 558–570. [Google Scholar] [CrossRef] [Green Version]
  38. Liu, Q.; Deng, C.; Yu, Y.; Torrent, J.; Jackson, M.J.; Banerjee, S.K.; Zhu, R. Temperature dependence of magnetic susceptibility in an argon environment: Implications for pedogenesis of Chinese loess/palaeosols. Geophys. J. Int. 2005, 161, 102–112. [Google Scholar] [CrossRef]
  39. Butler, R.F. Magnetic mineralogy of continental deposits, San Juan basin, New Mexico, and Clark’s Fork basin, Wyoming. J. Geophys. Res. Solid Earth 1982, 87, 7843–7852. [Google Scholar] [CrossRef]
  40. Heslop, D.; Dekkers, M.; Kruiver, P.; Van Oorschot, I. Analysis of isothermal remanent magnetization acquisition curves using the expectation-maximization algorithm. Geophys. J. Int. 2002, 148, 58–64. [Google Scholar] [CrossRef] [Green Version]
  41. Spassov, S.; Heller, F.; Kretzschmar, R.; Evans, M.; Yue, L.; Nourgaliev, D. Detrital and pedogenic magnetic mineral phases in the loess/palaeosol sequence at Lingtai (Central Chinese Loess Plateau). Phys. Earth Planet. Inter. 2003, 140, 255–275. [Google Scholar] [CrossRef]
  42. O’reilly, W. Rock and Mineral Magnetism; Springer Science & Business Media: Berlin, Germany, 1984. [Google Scholar]
  43. Roberts, A.P.; Cui, Y.; Verosub, K.L. Wasp-waisted hysteresis loops: Mineral magnetic characteristics and discrimination of components in mixed magnetic systems. J. Geophys. Res. Solid Earth 1995, 100, 17909–17924. [Google Scholar] [CrossRef]
  44. Tauxe, L.; Mullender, T.; Pick, T. Potbellies, wasp-waists, and superparamagnetism in magnetic hysteresis. J. Geophys. Res. Solid Earth 1996, 101, 571–583. [Google Scholar] [CrossRef]
  45. Bean, C.P. Hysteresis loops of mixtures of ferromagnetic micropowders. J. Appl. Phys. 1955, 26, 1381–1383. [Google Scholar] [CrossRef]
  46. Roberts, A.P.; Hu, P.; Harrison, R.J.; Heslop, D.; Muxworthy, A.; Oda, H.; Sato, T.; Tauxu, L.; Zhao, X. Domain state diagnosis in rock magnetism: Evaluation of potential alternatives to the Day diagram. J. Geophys. Res. Solid Earth 2019, 124, 5286–5314. [Google Scholar] [CrossRef] [Green Version]
  47. Dunlop, D.J.; Özdemir, Ö. Rock Magnetism: Fundamentals and Frontiers; Cambridge University Press: Cambridge, UK, 2001. [Google Scholar]
  48. Tauxe, L.; Gallet, Y. A jackknife for magnetostratigraphy. Geophys. Res. Lett. 1991, 18, 1783–1786. [Google Scholar] [CrossRef]
  49. Mcfadden, P.L.; Mcelhinny, M.W. Classification of the reversal test in palaeomagnetism. Geophys. J. Int. 1990, 103, 725–729. [Google Scholar] [CrossRef] [Green Version]
  50. Tauxe, L.; Butler, R.F.; Van der Voo, R.; Banerjee, S.K. Essentials of Paleomagnetism; University of California Press: Berkeley, CA, USA, 2010. [Google Scholar]
  51. Rodríguez-Pintó, A.; Ramón, M.J.; Oliva-Urcia, B.; Pueyo, E.L.; Pocoví, A. Errors in paleomagnetism: Structural control on overlapped vectors—Mathematical models. Phys. Earth Planet. Inter. 2011, 186, 11–22. [Google Scholar] [CrossRef] [Green Version]
  52. Pueyo, E.L.; Sussman, A.J.; Oliva-Urcia, B.; Cifelli, F. Palaeomagnetism in fold and thrust belts: Use with caution. Geol. Soc. Lond. Spec. Publ. 2016, 425, 259–276. [Google Scholar] [CrossRef]
  53. Meert, J.G.; Pivarunas, A.F.; Evans, D.A.; Pisarevsky, S.A.; Pesonen, L.J.; Li, Z.-X.; Elming, S.-Å.; Miller, S.R.; Zhang, S.; Salminen, J.M. The magnificent seven: A proposal for modest revision of the quality index. Tectonophysics 2020, 790, 228549. [Google Scholar] [CrossRef]
  54. Parés, J.M.; Van der Voo, R. Non-antipodal directions in magnetostratigraphy: An overprint bias? Geophys. J. Int. 2013, 192, 75–81. [Google Scholar] [CrossRef] [Green Version]
  55. Gradstein, F.M.; Ogg, J.G.; Schmitz, M.D.; Ogg, G.M. The Geologic Time Scale 2012; Elsevier: Amsterdam, The Netherlands, 2012. [Google Scholar]
  56. Yan, M.; Van der Voo, R.; Tauxe, L.; Fang, X.M.; Parés, J. Shallow bias in Neogene palaeomagnetic directions from the Guide Basin, NE Tibet, caused by inclination error. Geophys. J. Int. 2005, 163, 944–948. [Google Scholar] [CrossRef] [Green Version]
  57. Dupont-Nivet, G.; Lippert, P.C.; Van Hinsbergen, D.J.J.; Meijers, M.J.M.; Kapp, P. Palaeolatitude and age of the Indo-Asia collision: Palaeomagnetic constraints. Geophys. J. Int. 2010, 182, 1189–1198. [Google Scholar] [CrossRef] [Green Version]
  58. Vaes, B.; Li, S.; Langereis, C.G.; van Hinsbergen, D.J. Reliability of palaeomagnetic poles from sedimentary rocks. Geophys. J. Int. 2021, 225, 1281–1303. [Google Scholar] [CrossRef]
  59. Muttoni, G.; Visconti, A.; Channell, J.E.; Casellato, C.E.; Maron, M.; Jadoul, F. An expanded Tethyan Kimmeridgian magneto-biostratigraphy from the S’Adde section (Sardinia): Implications for the Jurassic timescale. Palaeogeogr. Palaeoclimatol. Palaeoecol. 2018, 503, 90–101. [Google Scholar] [CrossRef]
  60. Torsvik, T.H.; Van der Voo, R.; Preeden, U.; Mac Niocaill, C.; Steinberger, B.; Doubrovine, P.V.; van Hinsbergen, D.J.J.; Domeier, M.; Gaina, C.; Tohver, E.; et al. Phanerozoic polar wander, palaeogeography and dynamics. Earth-Sci. Rev. 2012, 114, 325–368. [Google Scholar] [CrossRef] [Green Version]
  61. Tauxe, L.; Kent, D.V. A simplified statistical model for the geomagnetic field and the detection of shallow bias in paleomagnetic inclinations: Was the ancient magnetic field dipolar. Timescales Paleomagn. Field 2004, 145, 101–116. [Google Scholar]
  62. Tauxe, L.; Shaar, R.; Jonestrask, L.; Swanson-Hysell, N.; Minnett, R.; Koppers, A.; Constable, C.; Jarboe, N.; Gaastra, K.; Fairchild, L. PmagPy: Software package for paleomagnetic data analysis and a bridge to the Magnetics Information Consortium (MagIC) Database. Geochem. Geophys. Geosyst. 2016, 17, 2450–2463. [Google Scholar] [CrossRef]
  63. Tauxe, L.; Kodama, K.P.; Kent, D.V. Testing corrections for paleomagnetic inclination error in sedimentary rocks: A comparative approach. Phys. Earth Planet. Inter. 2008, 169, 152–165. [Google Scholar] [CrossRef] [Green Version]
  64. Huang, W.; van Hinsbergen, D.J.J.; Maffione, M.; Orme, D.A.; Dupont-Nivet, G.; Guilmette, C.; Ding, L.; Guo, Z.; Kapp, P. Lower Cretaceous Xigaze ophiolites formed in the Gangdese forearc: Evidence from paleomagnetism, sediment provenance, and stratigraphy. Earth Planet. Sci. Lett. 2015, 415, 142–153. [Google Scholar] [CrossRef]
  65. Deenen, M.H.L.; Langereis, C.G.; van Hinsbergen, D.J.J.; Biggin, A.J. Geomagnetic secular variation and the statistics of palaeomagnetic directions. Geophys. J. Int. 2011, 186, 509–520. [Google Scholar] [CrossRef] [Green Version]
  66. Besse, J.; Courtillot, V. Apparent and true polar wander and the geometry of the geomagnetic field over the last 200 Myr. J. Geophys. Res. Solid Earth 2002, 107, EPM 6-1–EPM 6-31. [Google Scholar] [CrossRef] [Green Version]
  67. Lippert, P.C.; Zhao, X.; Coe, R.S.; Lo, C.-H. Palaeomagnetism and 40Ar/39Ar geochronology of upper Palaeogene volcanic rocks from Central Tibet: Implications for the Central Asia inclination anomaly, the palaeolatitude of Tibet and post-50 Ma shortening within Asia. Geophys. J. Int. 2011, 184, 131–161. [Google Scholar] [CrossRef] [Green Version]
  68. Miao, Y.; Wu, F.; Hong, C.; Fang, X.; Tao, D.; Sun, J.; Jin, C. A Late-Eocene palynological record from the Hoh Xil Basin, northern Tibetan Plateau, and its implications for stratigraphic age, paleoclimate and paleoelevation. Gondwana Res. 2016, 31, 241–252. [Google Scholar] [CrossRef]
  69. Maher, B.A. Magnetic properties of modern soils and Quaternary loessic paleosols: Paleoclimatic implications. Palaeogeogr. Palaeoclimatol. Palaeoecol. 1998, 137, 25–54. [Google Scholar] [CrossRef] [Green Version]
  70. Su, T.; Spicer, R.A.; Wu, F.-X.; Farnsworth, A.; Huang, J.; Del Rio, C.; Deng, T.; Ding, L.; Deng, W.-Y.-D.; Huang, Y.-J.; et al. A Middle Eocene lowland humid subtropical “Shangri-La” ecosystem in central Tibet. Proc. Natl. Acad. Sci. USA 2020, 117, 32989–32995. [Google Scholar] [CrossRef] [PubMed]
  71. Fang, X.; Yan, M.; Zhang, W.; Nie, J.; Han, W.; Wu, F.; Song, C.; Zhang, T.; Zan, J.; Yang, Y. Paleogeography control of Indian monsoon intensification and expansion at 41 Ma. Sci. Bull. 2021, 66, 2320–2328. [Google Scholar] [CrossRef]
  72. Zheng, H.; Yang, Q.; Cao, S.; Peter, C.; He, M.; Akihiro, K.; Aki, S.; Xu, H.; RyuJi, T.; Fred, J. From desert to monsoon: Irreversible climatic transition at ~36 Ma in southeastern Tibetan Plateau. Prog. Earth Planet. Sci. 2022, 9, 12. [Google Scholar] [CrossRef]
  73. Yi, H.; Zhao, X.; Lin, J.; Shi, Z.; Li, B.; Zhao, B. Magnetostratigraphic studies of Tertiary continental redbeds in Wulanwula Lake area of northern Tibetan Plateau and their geologic significance. Acta Geosci. Sin. 2004, 25, 633–638. [Google Scholar]
  74. Li, J.; Peng, J.; Batten, D.J. Palynomorph assemblages from the Fenghuoshan Group, southern Qinghai, China: Their age and palaeoenvironmental significance. Sci. Bull. 2015, 60, 470–476. [Google Scholar] [CrossRef] [Green Version]
  75. Fang, X.; Guo, Z.; Jiang, D.; Zhang, W.; Zhang, R.; Li, M.; Wang, Y.; Zhang, T.; Miao, Y. No monsoon-dominated climate in northern subtropical Asia before 35 Ma. Glob. Planet. Change 2022, 218, 103970. [Google Scholar] [CrossRef]
  76. Scotese, C.R.; Wright, N. Paleomap Paleodigital Elevation Models (PaleoDEMS) for the Phanerozoic. PALEOMAP Proj. Available online: https://www.earthbyte.org/paleodem-resource-scotese-and-wright-2018/ (accessed on 24 March 2023).
  77. Meng, J.; Coe, R.S.; Wang, C.; Gilder, S.A.; Zhao, X.; Liu, H.; Li, Y.; Ma, P.; Shi, K.; Li, S. Reduced convergence within the Tibetan Plateau by 26 Ma? Geophys. Res. Lett. 2017, 44, 6624–6632. [Google Scholar] [CrossRef]
  78. Li, L.; Chang, H.; Guan, C. Paleolatitude evolution of the Tuotuohe Basin, central northern Xizang (Tibet) during the Cenozoic and its tectonic, climate implications. Geol. Rev. 2022, 5, 1801–1816. [Google Scholar]
  79. Voo, R.V.D. The reliability of paleomagnetic data. Tectonophysics 1990, 184, 1–9. [Google Scholar]
  80. Lin, J.; Watts, D.R. Palaeomagnetic constraints on Himalayan-Tibetan tectonic evolution. Philos. Trans. R. Soc. London. Ser. A Math. Phys. Sci. 1988, 326, 177–188. [Google Scholar]
  81. Halim, N.; Cogné, J.P.; Chen, Y.; Atasiei, R.; Besse, J.; Courtillot, V.; Gilder, S.; Marcoux, J.; Zhao, R. New Cretaceous and Early Tertiary paleomagnetic results from Xining-Lanzhou basin, Kunlun and Qiangtang blocks, China: Implications on the geodynamic evolution of Asia. J. Geophys. Res. Solid Earth 1998, 103, 21025–21045. [Google Scholar] [CrossRef] [Green Version]
  82. Chen, Y.; Gilder, S.; Halim, N.; Halim, N.; Cogné, P.; Courtillot, V. New paleomagnetic constraints on central Asian kinematics: Displacement along the Altyn Tagh fault and rotation of the Qaidam Basin. Tectonics 2002, 21, 6-1–6-19. [Google Scholar] [CrossRef] [Green Version]
  83. Dai, J.; Zhao, X.; Wang, C.; Zhu, L.; Li, Y.; Finn, D. The vast proto-Tibetan plateau: New constraints from paleogene Hoh Xil basin. Gondwana Res. 2012, 22, 434–446. [Google Scholar] [CrossRef]
  84. Ran, B.; Zhao, X.; Liu, Z.; Wang, C.; Zhu, L.; Jin, W.; Li, Y. Cenozoic Vertical-Axis Rotations of the Hoh Xil Basin, Central–Northern Tibet. Acta Geol. Sin.-Engl. Ed. 2016, 90, 858–869. [Google Scholar]
  85. Tong, Y.; Yang, Z.; Mao, C.; Pei, J.; Pu, Z.; Xu, Y. Paleomagnetism of Eocene red-beds in the eastern part of the Qiangtang Terrane and its implications for uplift and southward crustal extrusion in the southeastern edge of the Tibetan Plateau. Earth Planet. Sci. Lett. 2017, 475, 1–14. [Google Scholar] [CrossRef]
  86. Li, S.; van Hinsbergen, D.J.J.; Najman, Y.; Liu-Zeng, J.; Deng, C.; Zhu, R. Does pulsed Tibetan deformation correlate with Indian plate motion changes? Earth Planet. Sci. Lett. 2020, 536, 116144. [Google Scholar] [CrossRef]
  87. Ding, J. Paleomagnetism and Its Tectonic Implication of the Red Beds of Oligocene Kangtuo Formation in the Qinghai-Tibetan Plateau. Master’s Thesis, China University of Geosciences (Beijing), Beijing, China, 2014. [Google Scholar]
  88. Roperch, P.; Dupont-Nivet, G.; Guillot, S.; Goussin, F.; Huang, W.; Replumaz, A.; Yang, Z.; Guo, Z.; Song, B. Paleomagnetic Constraints on Early Collisional Deformation along the Eastern Margin of the Qiantang terrane (Tibetan plateau) at 50 and 37 Ma. In Proceedings of the 19th EGU General Assembly, EGU2017, Vienna, Austria, 23–28 April 2017; p. 9476. [Google Scholar]
  89. Hodych, J.P.; Buchan, K.L. Early Silurian palaeolatitude of the Springdale Group redbeds of central Newfoundland: A palaeomagnetic determination with a remanence anisotropy test for inclination error. Geophys. J. Int. 1994, 117, 640–652. [Google Scholar] [CrossRef] [Green Version]
  90. Huang, B.; Piper, J.D.A.; He, H.; Zhang, C.; Zhu, R. Paleomagnetic and geochronological study of the Halaqiaola basalts, southern margin of the Altai Mountains, northern Xinjiang: Constraints on neotectonic convergent patterns north of Tibet. J. Geophys. Res. 2006, 111, 1–16. [Google Scholar] [CrossRef] [Green Version]
Figure 1. Major tectonic terranes and orogen of the Tibetan Plateau and geological map of the Tuotuohe Basin. (a) Topographic map of the Tibetan Plateau showing sutures, major terranes, the Lhasa-Golmud Highway, the Hoh Xil Basin, and the study site. (b) Geological map of the Tuotuohe Basin based on regional geological mapping [29]. The Tuotuohe section is from [28]. Abbreviations: IYS, Indus–Yalong suture; BNS, Bangonghu–Nujiang suture; JSS, Jinshajiang suture; T3jz, late Triassic Jiezha Group; E1–2tt, Paleocene–Eocene Tuotuohe Formation; E3yx, Oligocene Yaxicuo Formation; N1wd, Miocene Wudaoliang Formation; Q3fgl, late Pleistocene glacial sandstone; Q3al-pl, late Pleistocene alluvium–fluvial deposits; Q4eol, Holocene eolian deposits.
Minerals 13 00533 g001
Figure 2. Field photographs of the TTH-D section. (a) The bottom of the TTH-D section. (b) Graded bedding of the Tuotuohe Formation. (c) The central part of the TTH-D section is composed of sandstone and conglomerate-containing sandstone. (d) The top of the TTH-D section and the bottom of the TTH section.
Minerals 13 00533 g002
Figure 3. Temperature-dependent magnetic susceptibility curves. Heating and cooling curves are indicated by red and black arrows, respectively.
Minerals 13 00533 g003
Figure 4. IRM acquisition curves (left) and corresponding IRM component analysis (right) of representative samples from the TTH-D section. Components 1 and 2 represent low and high coercivity, respectively, with B1/2 (the field at which half of the saturation IRM is reached) and relative contributions to saturation IRM.
Minerals 13 00533 g004
Figure 5. Hysteresis loops of representative samples from the TTH-D section. The black and red loops of each sample are the original and paramagnetic corrected loops, respectively.
Minerals 13 00533 g005
Figure 6. Orthogonal projections and magnetic intensity of the thermal demagnetization of the NRM of representative specimens from the TTH-D section. Solid (open) dots represent projections onto the horizontal (vertical) plane.
Minerals 13 00533 g006
Figure 7. Paleomagnetic field tests of the results for the TTH-D section. (a) Jackknife test for the studied section. (b) Equal-area stereographic projection with the accepted ChRM directions after tilt correction. Solid/open circles represent downward/upward inclinations. (c) Bootstrap reversal test of the section and the overlap of 95% confidence intervals for the X, Y, and Z components, indicating a positive reversal test.
Minerals 13 00533 g007
Figure 8. Magnetostratigraphic results for the TTH-D section and their correlation with the GTS [55] and the sedimentation rate. This correlation is constrained with the additional part of the TTH section [28].
Minerals 13 00533 g008
Figure 9. (a) Results of the reversal test of the paleomagnetic data of the Tuotuohe Formation from the TTH section [28] and the data from this study. (b) Equal area projection of the data from (a) and the principal direction of the normal and reverse polarities; also shown is the principal direction of the expected mean direction at 35 Ma (red rectangle) for the Tuotuohe Formation. (c) Plots of the cumulative distribution of the corrected inclination calculated in 2000 bootstrap runs (red). The black and green vertical lines show the uncorrected and corrected inclination, respectively. Confidence bounds containing 95% of the bootstrap results are shown as two dashed blue lines. (d) Application of the E/I method to the directional dataset. The red curves show the elongation versus inclination upon stepwise unflattening of the dataset by gradually decreasing the flattening factor (f). The dark green curve is the elongation versus inclination curve predicted by the TK03.GAD model [61]. The intersection between these two curves provides the flattening factor used in the correction for inclination shallowing, as indicated in the plots.
Minerals 13 00533 g009
Figure 10. (a) Paleogeography and paleoclimatic configuration of Asia at ~35 Ma. The Lunpola and Bangor Basins and the Yunnan Tibetan Plateau are influenced by the tropical monsoon and sub-tropical monsoon [23,70,71,72]. BN indicates the Bangonghu–Nujiang lowland between the Gangdese Mts. and the Tanggula Mts. The red rectangle indicates the location of the study region. The Nangqian Basin record is from [75]. The paleogeography is modified from [71,76]. In addition, we moved the paleolatitude location of the Tibet reconstructed by [76] northward to a latitude of about 25° N, mainly based on the following reasons: ① the Tuotuohe Basin is the foreland basin of Tanggula Mountains [26], and the latitudinal distance between Tanggula Mountains and Tuotuohe Basin is too far according to the latitudinal location of the Tibetan Plateau reconstructed by [76]; ② paleomagnetic studies show that the latitude of the Bangonghu–Nujiang suture was ~25° N during late Eocene [77]. (b) Summary of the paleolatitude evolution of the Tuotuohe Basin during the Cenozoic (Modified from [78] with newly updated data). Numbers correspond to paleolatitude results of the Qiangtang terrane and the adjacent regions in Table S1 (in Supplementary Materials). Observed and expected paleolatitudes of the above results are all translated to the TTH-D section as the reference site. Apparent polar wander paths of the paleolatitudes for Eurasia and India are from [66]. The light blue line represents the location where the Tuotuohe Basin drifted to its present location at ~26 Ma.
Minerals 13 00533 g010
Disclaimer/Publisher’s Note: The statements, opinions and data contained in all publications are solely those of the individual author(s) and contributor(s) and not of MDPI and/or the editor(s). MDPI and/or the editor(s) disclaim responsibility for any injury to people or property resulting from any ideas, methods, instructions or products referred to in the content.

