Article

The Influence of Static Pressure on Bubble Size and Contact Angle of Quartz: Mimicking What May Happen Inside a Hypothetical Flotation Column

by
Alexandre Vale Oliveira
1,
José Tadeu Gouvêa Junior
1,*,
Thiago Cesar Souza Pinto
2 and
Laurindo de Salles Leal Filho
1
1
Department of Mining and Petroleum Engineering, Polytechnic School, University of São Paulo, 2373 Cidade Universitária, São Paulo, SP 05508-900, Brazil
2
Vale S.A., Mineral Development Center, BR381 km450, Santa Luzia, MG 33040-900, Brazil
*
Author to whom correspondence should be addressed.
Minerals 2023, 13(3), 417; https://doi.org/10.3390/min13030417
Submission received: 4 February 2023 / Revised: 2 March 2023 / Accepted: 10 March 2023 / Published: 16 March 2023

Abstract

:
This paper addresses the influence of hydrostatic pressure ( P h y d ) on bubble diameter ( d b ) and contact angle ( θ ) of quartz in pure water versus collector solution (Flotigam® EDA, γ L G = 57 mN/m) at 20 °C. The pressure range (0–300 kPa) applied against the bubbles’ walls mimics what may happen along the vertical axis of a hypothetical flotation column (HFC) that processes iron ore slurry via cationic reverse flotation of quartz. From the column’s bottom ( P h y d 300 kPa) to its top ( P h y d  0 kPa), a continuous relief of P h y d occurs steadily. Results indicate that a decrease of P h y d promotes a decrease of θ from 47° to 16° in pure water and from 61° to 42° in the presence of collector. Likewise, d b increases approximately 60% from the column’s bottom to its top and, consequently promoting an increase in bubble ascending velocity ( v b ). Values of v b and d b were used to assess the bubble Eötvos number (Eo) and the Weber number (We) aiming at characterizing bubble hydrodynamics. It was found that inertial forces dominate surface forces (We > 1) as d b > 1.86 mm. This dominance constitutes a preliminary indication of a greater likelihood of coarse particles (diameter > 100 μ m) detaching from bubbles. This situation is typically found in the upper parts of the HFC addressed in this paper.

1. Introduction

Inside most flotation cells, air bubbles are generated at the bottom of the equipment and ascend to the top of the collecting zone under the effect of buoyancy. In addition, the rising bubbles undergo a continuing release of hydrostatic pressure along the vertical axis (height) of the equipment and such a pressure relief can influence bubble dynamics, size, and shape. Such a phenomenon and its consequences are more noticeable in flotation columns than in mechanical cells, because the height of the former is very much greater than its diameter [1]. Aggregates formed by hydrophobic particles attached to bubbles may also undergo a continuing pressure relief along the height of the flotation cells. The higher the aggregate’s ascending velocity, the higher the magnitude of inertial forces (as shear stresses) that may cause particle/bubble detachment if the magnitude of the contact angle is not sufficiently high to endure them [2,3], mainly under the highest rising velocities that are expected to occur in the upper parts of water columns [4]. This paper addresses the influence of hydrostatic pressure on bubble size and contact angle of quartz in the presence of a traditional cationic collector (Flotigam® EDA) in basic medium (pH 10), under a wide range of hydrostatic pressure (0–300 kPa) which typically occurs along the vertical axis (height) of industrial columns that concentrate iron ore in Brazil via reverse cationic flotation of quartz.

2. Background

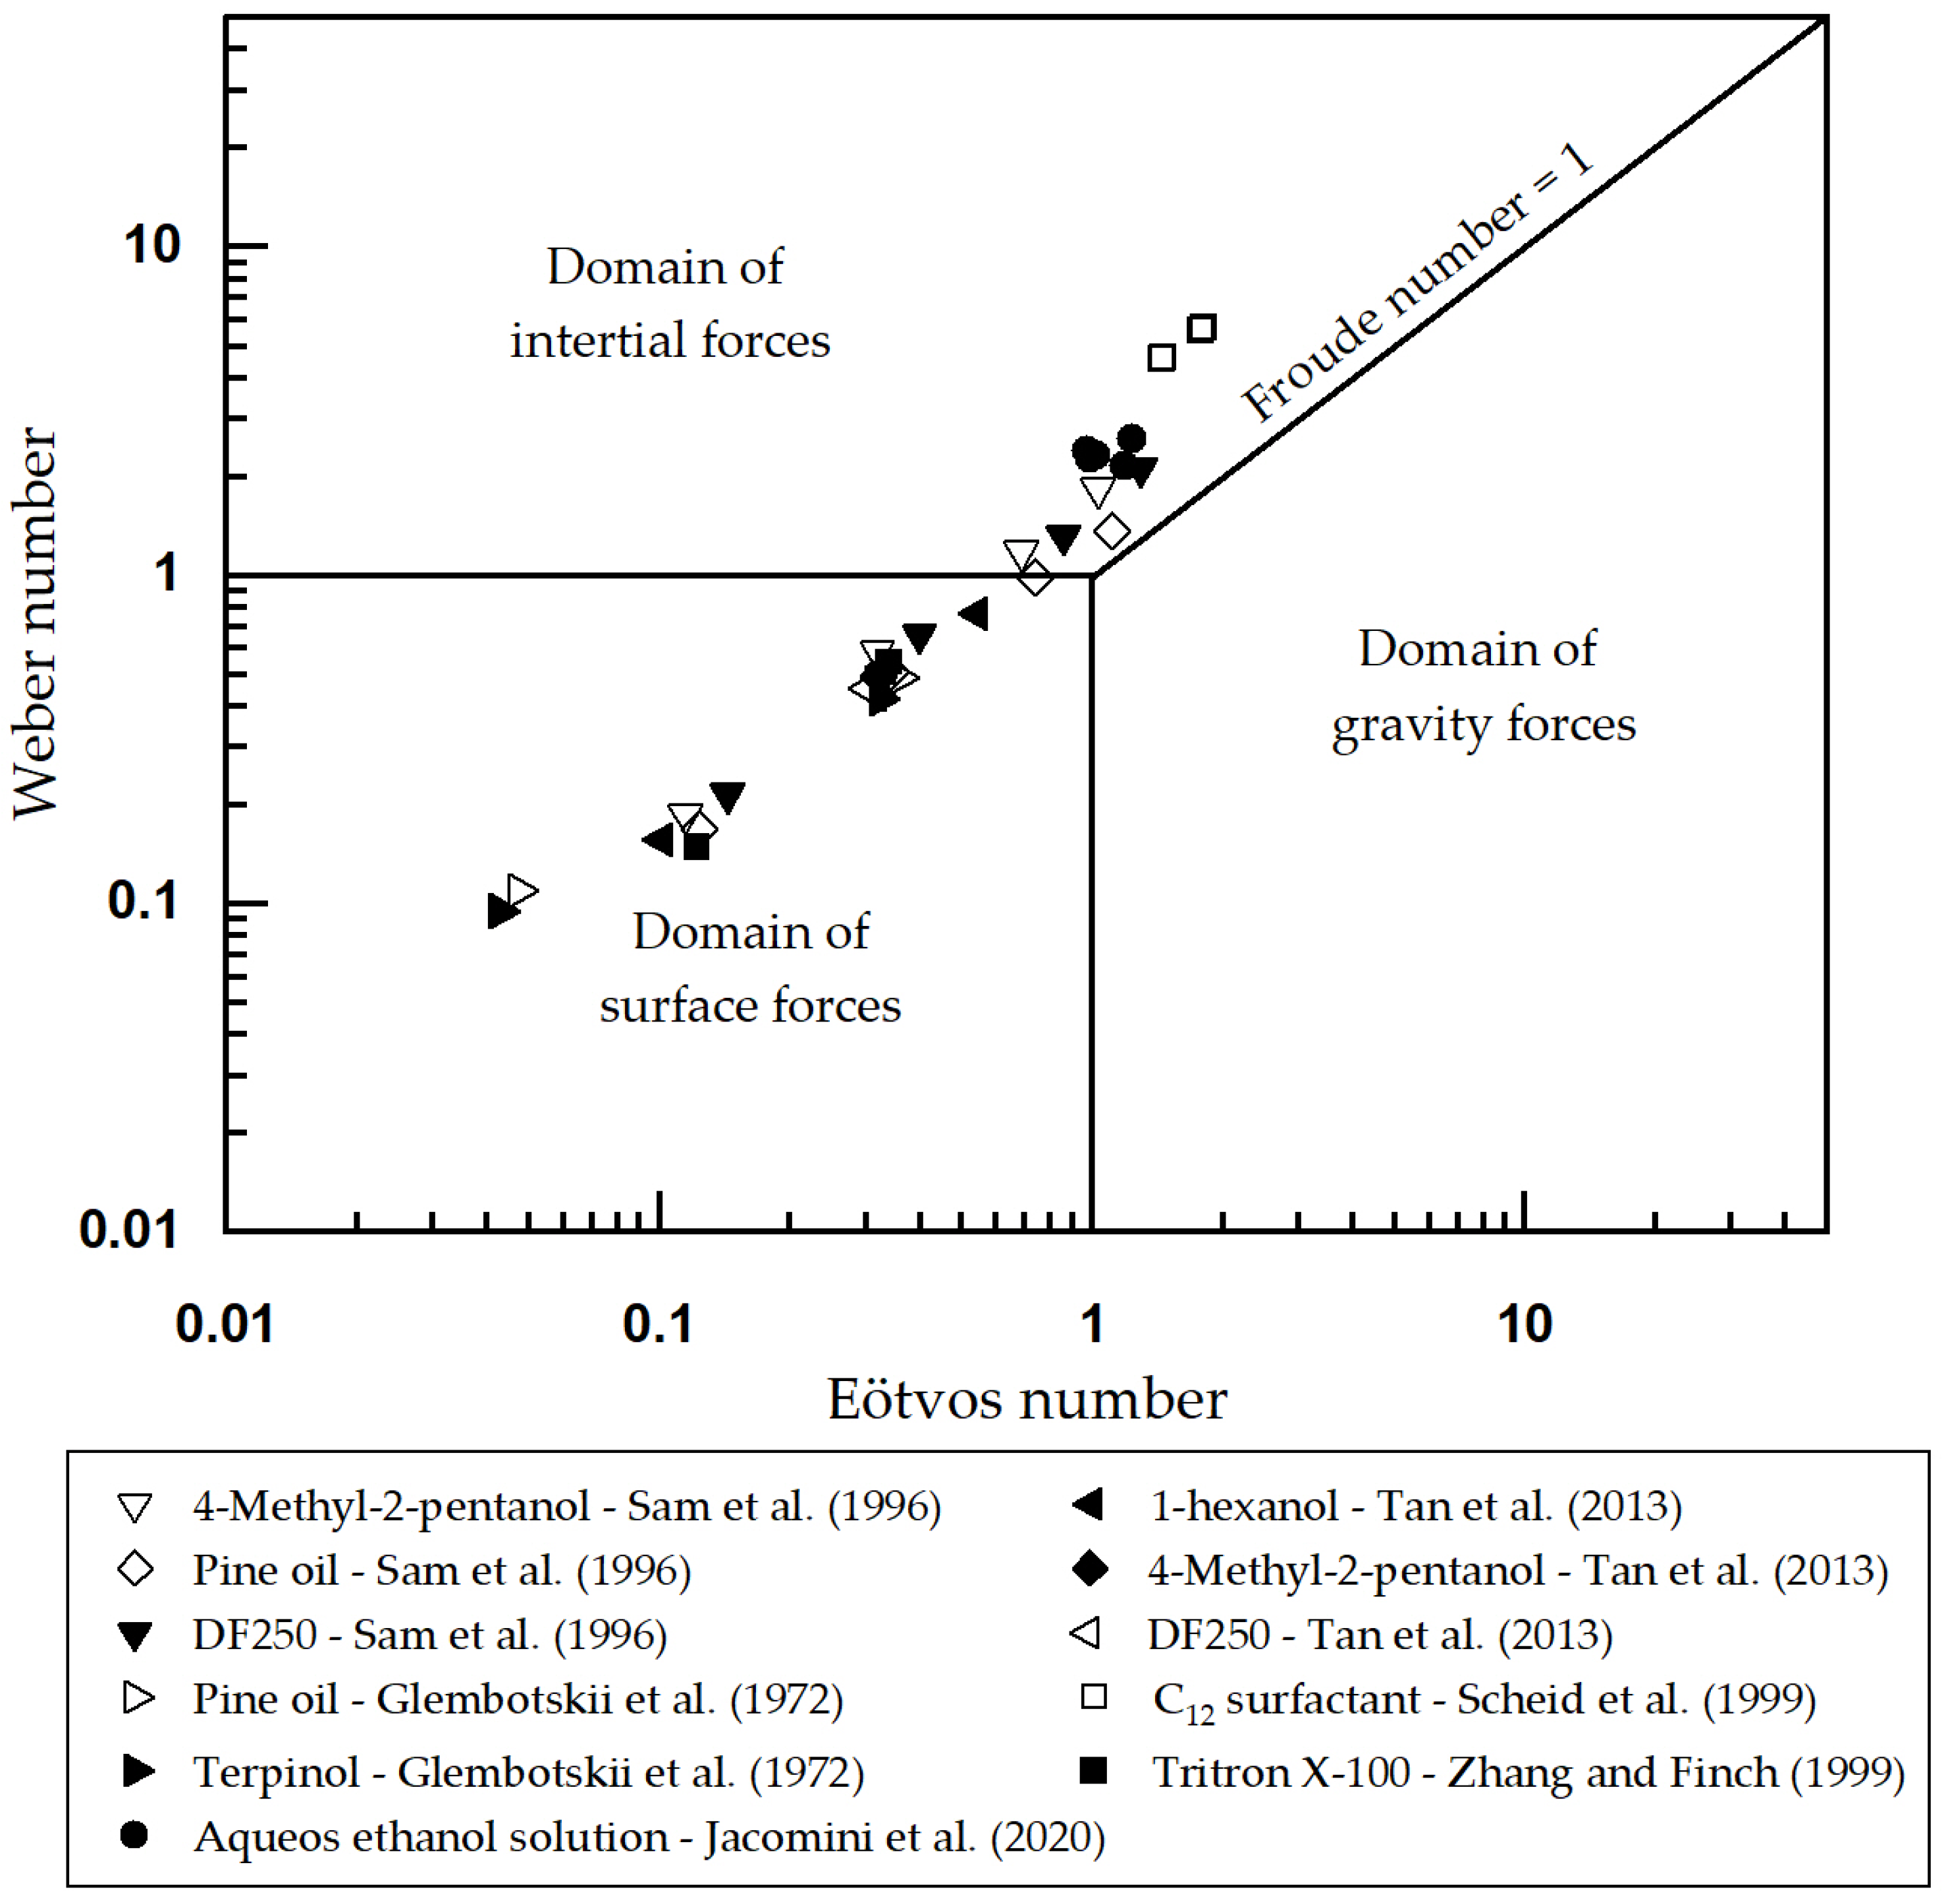
2.1. Bubble Size, Shape and Velocity in Flotation Cells

When an air bubble is immersed in water, its shape and radii result from the balance between the surface tension ( γ L G )   of the aqueous solution versus the existing pressure drop ( Δ P ) across the curved liquid–gas interface, according to Equation (1); where R1 and R2 are the highest and the lowest radii of an ellipsoidal bubble, respectively. However, when R1 = R2, the bubble assumes the spherical shape [5]. Furthermore, for a bubble to exist, the pressure exerted by the confined gas on its inner walls (internal pressure, Pi) must be greater than the pressure exerted by the liquid phase (slurry) on the bubble’s outer walls (external pressure, Pe), resulting in Δ P > 0 [5,6]. According to Equation (2), the static pressure ( P e ) on the external walls of a bubble positioned at a certain height of a flotation column is the sum of the atmospheric pressure (Patm) plus the hydrostatic pressure ( P h y d ) exerted by the slurry column on the bubble´s external wall. Therefore, P e represents the overall static load, whereas P h y d is the product of the slurry density ( ρ s l ) times the acceleration due to gravity (g) and the height of the slurry column (z) that exists above the bubble [5,6].
Δ P = ( P i P e ) =   γ L G   ( 1 R 1 + 1 R 2 )
P e = P a t m + P h y d = P a t m + ρ s l g z
As a bare bubble ascends from the bottom to the top of a flotation column, it undergoes a continuing release of hydrostatic pressure ( P h y d ) because the height (z) of the slurry column above the bubble decreases continually. Such a relief causes an expansion of the bubble´s volume and diameter ( d b ) which promotes an increase in the bubble´s rising velocity ( v b ) due to buoyancy [4], and also shape distortion from a pristine spherical shape to an ellipsoidal form and even a spherical cap [7]. On the other hand, increasing values of and v b contribute to increasing the bubble’s drag coefficient (CD), which is the resistance posed by the aqueous medium to bubble motion [4,8,9]. Rodrigue [8] maintains an increase of CD when bubble’s Reynolds number and Morton number are greater than 50 and 10−8, respectively. Further resistance posed by the liquid phase to the bubble ascending velocity is the Bernoulli’s dynamic pressure, whose contribution to P e may be assessed by adding the term 1 2 ρ v b 2 to the pressure balance depicted by Equation (2).
Clift and co-workers [4] published sets of data relating d b versus v b in either pure or “contaminated” (sic) water. They clustered the behavior of bubbles ( v b   versus d b ), according to their flow regime, in three distinct groups characterized by the dimensionless “bubble Eotvos number” (Eo), which represents the ratio of gravitational forces ( d b 2 ρ *   g ) to surface forces ( γ L G ), as depicted by Equation (3). The first flow regime (Eo < 0.13 for pure water and Eo < 0.4 for “contaminated” water) is characterized by smaller and spherical bubbles, indicating the dominance of surface forces (capillarity) over gravity. Under the second flow regime (0.13 < Eo < 40 for pure water and 0.4 < Eo < 40 for “contaminated” water), bubbles exhibit intermediate sizes and ellipsoidal shapes, whereas under the third flow regime (Eo > 40) bubbles are larger than 17 mm and exhibit a shape which resembles a spherical cap. Under the second and third flow regimes, bubble shape deviates from the pristine spherical pattern, indicating the dominance of gravitational forces over surface forces [4].
E o = d b 2 ρ *   g γ L G
where ρ * is the difference between the specific gravity of the liquid and gaseous phases.
The approach pursued by Clift and co-workers [4] did not consider the role played by inertial forces on bubble flow regime and shape. According to Schulze [3], shear stresses created by bubble motion can also provoke shape deviation from spheric to ellipsoidal. The balance between inertial forces and surface forces is represented by the Weber number (We), as depicted in Equation (4). Moreover, the ratio We/Eo is called the Froude Number (Fr) and represents the balance between inertial forces versus gravitational forces.
W e = v b 2   ρ *   d b γ L G
A large variety of values of bubble ascending velocity ( v b ) versus bubble size ( d b ) are described by several authors either in the absence [4,10,11,12,13,14,15,16,17] or in the presence [9,18,19,20,21,22] of surfactants. Particularly interesting are the results published by Sam, Gomez and Finch [9] because some of their results of d b and v b were obtained with bubbles immersed in aqueous solutions containing typical flotation reagents and exhibiting surface tension values (   γ L G = 55 mN/m) close to those used in the experiments of this paper (57 mN/m). The existing large amount of published data about a single bubble´s diameter ( d b ) and ascending velocity ( v b ) in water columns contrasts with the lack of information on the diameter and ascending velocity of bubbles attached to particles (particle–bubble aggregates). Therefore, in this paper, a very preliminary prediction on the likely occurrence of particle/bubble detachment in columns (dominance of inertial forces over surface forces/capillarity) is developed based on the behavior of single bubbles rising in water columns in the presence of surfactants, according to a hydrodynamic condition (We < 1 plus Eo < 1) which indicates the dominance of surface forces over those which are capable of promoting the detachment of particles from bubbles (inertial and gravitational forces). Such a phenomenon plays a major role in the flotation of coarse particles [23,24].

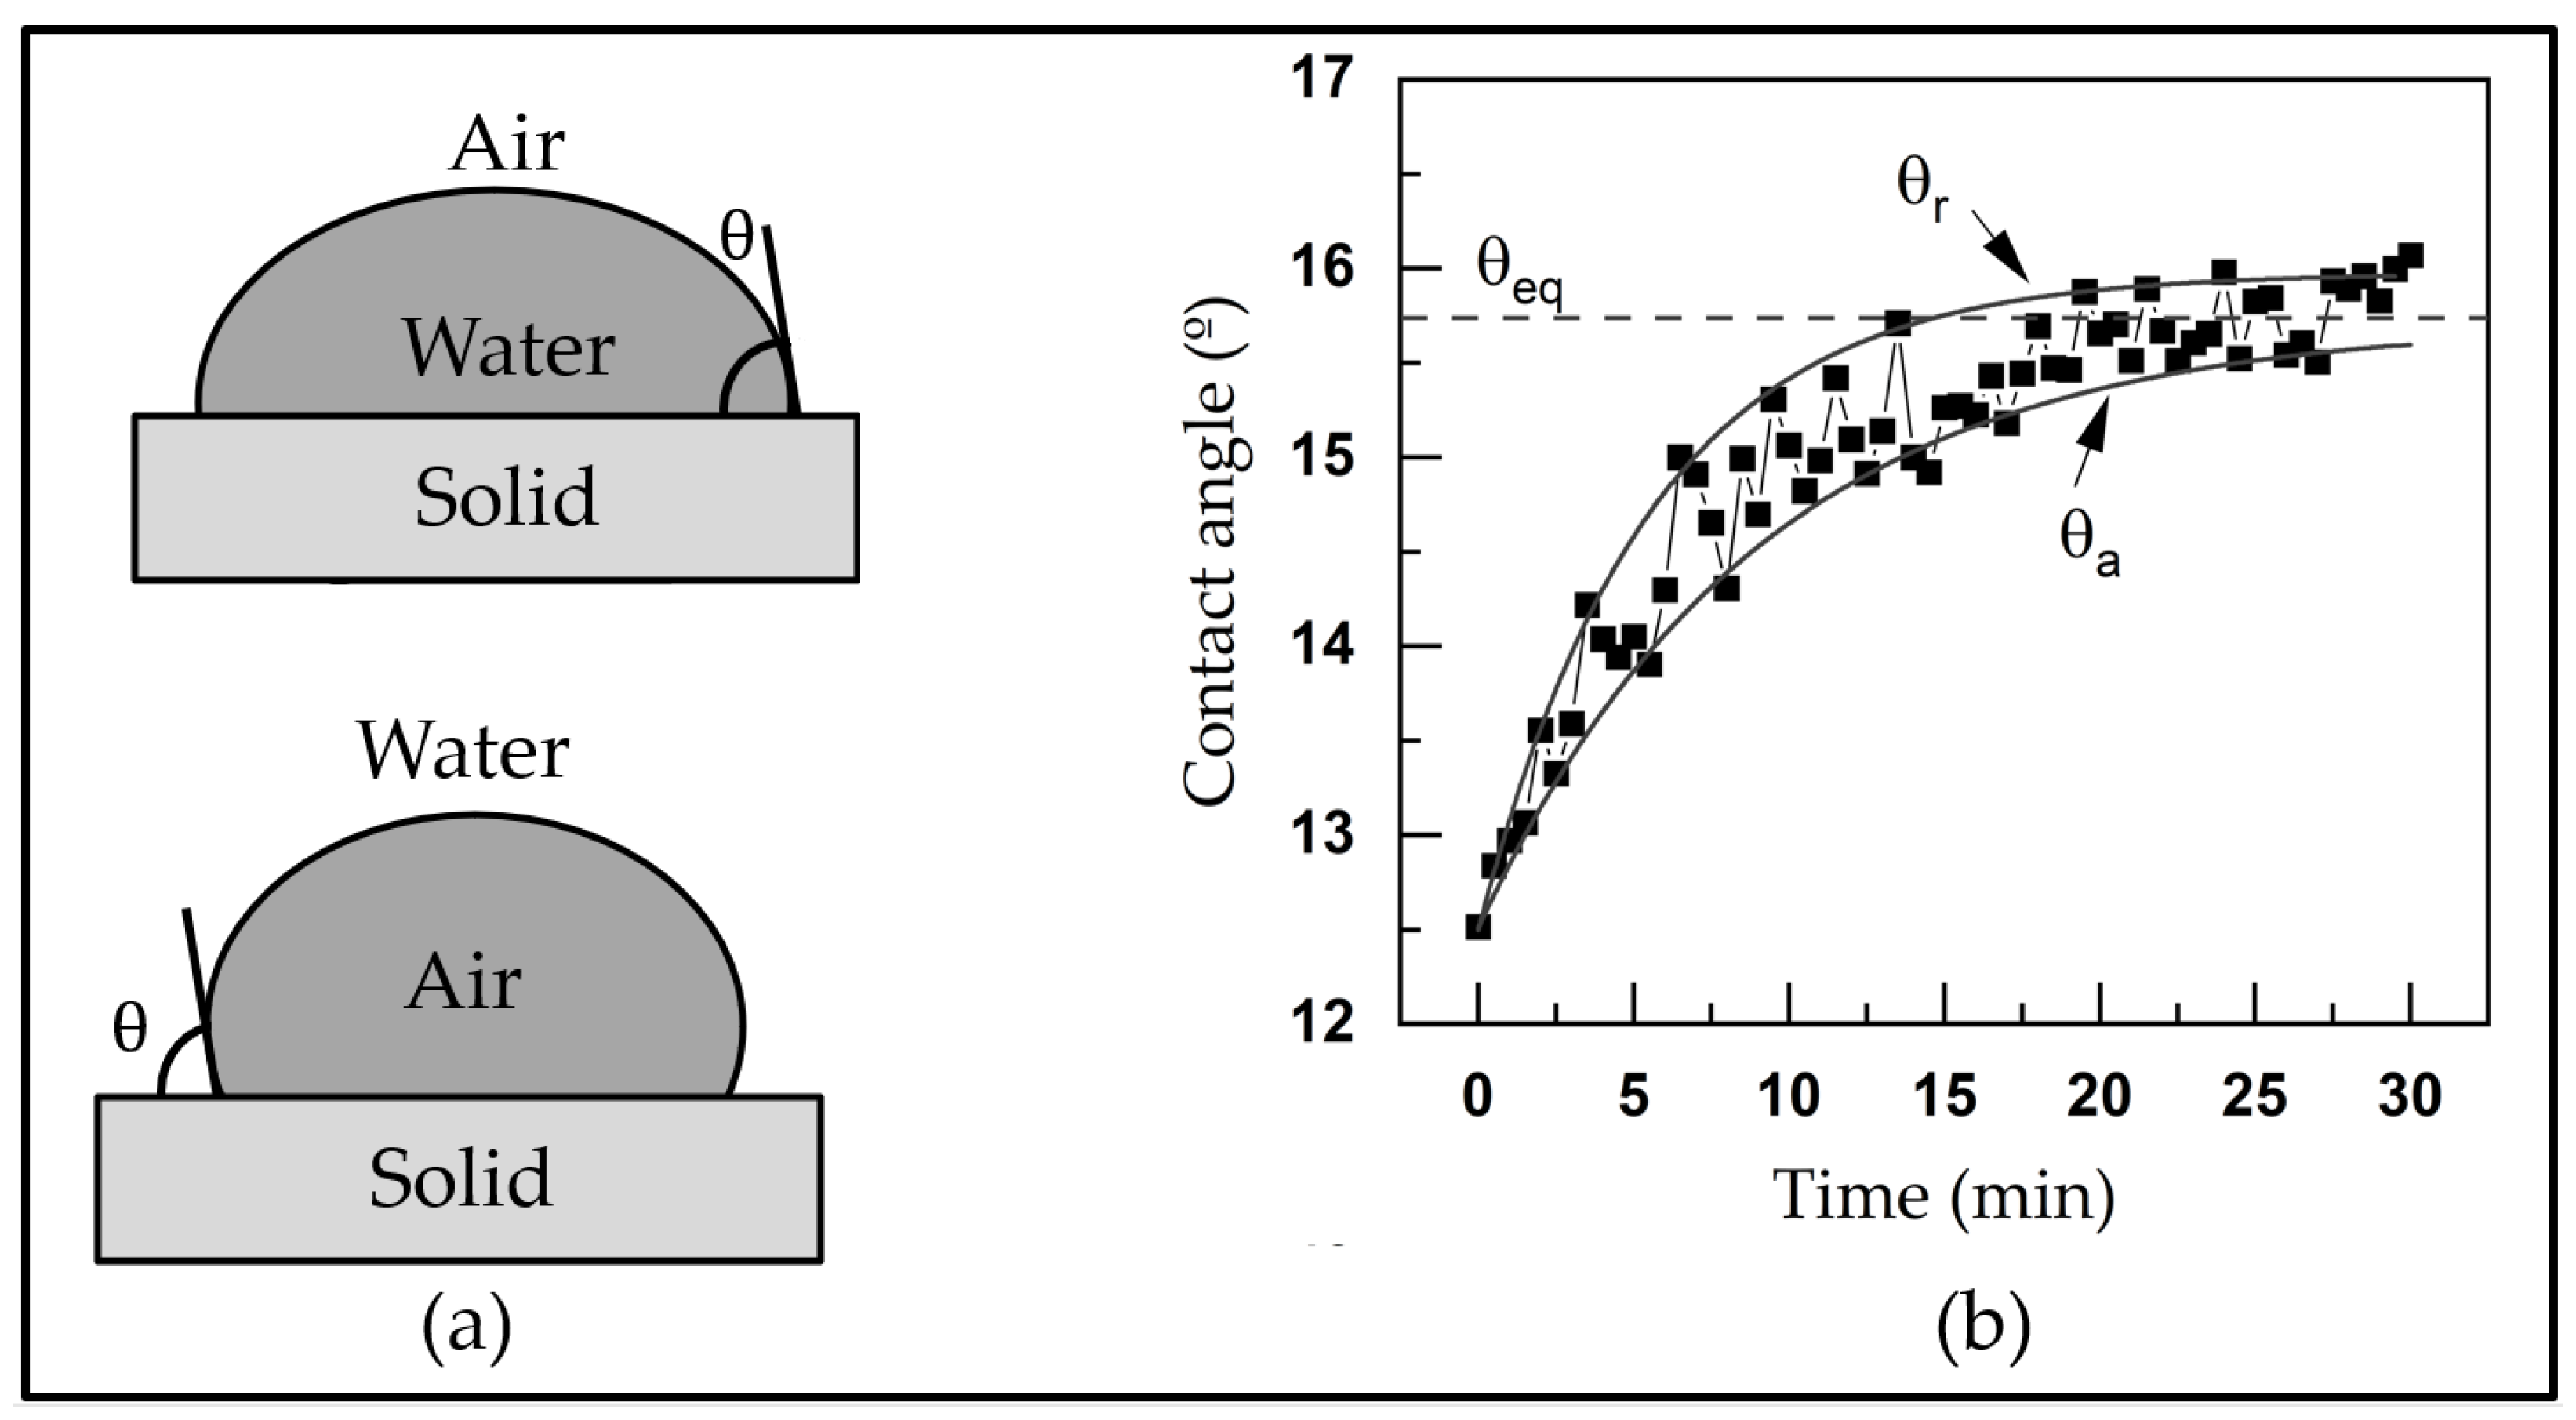
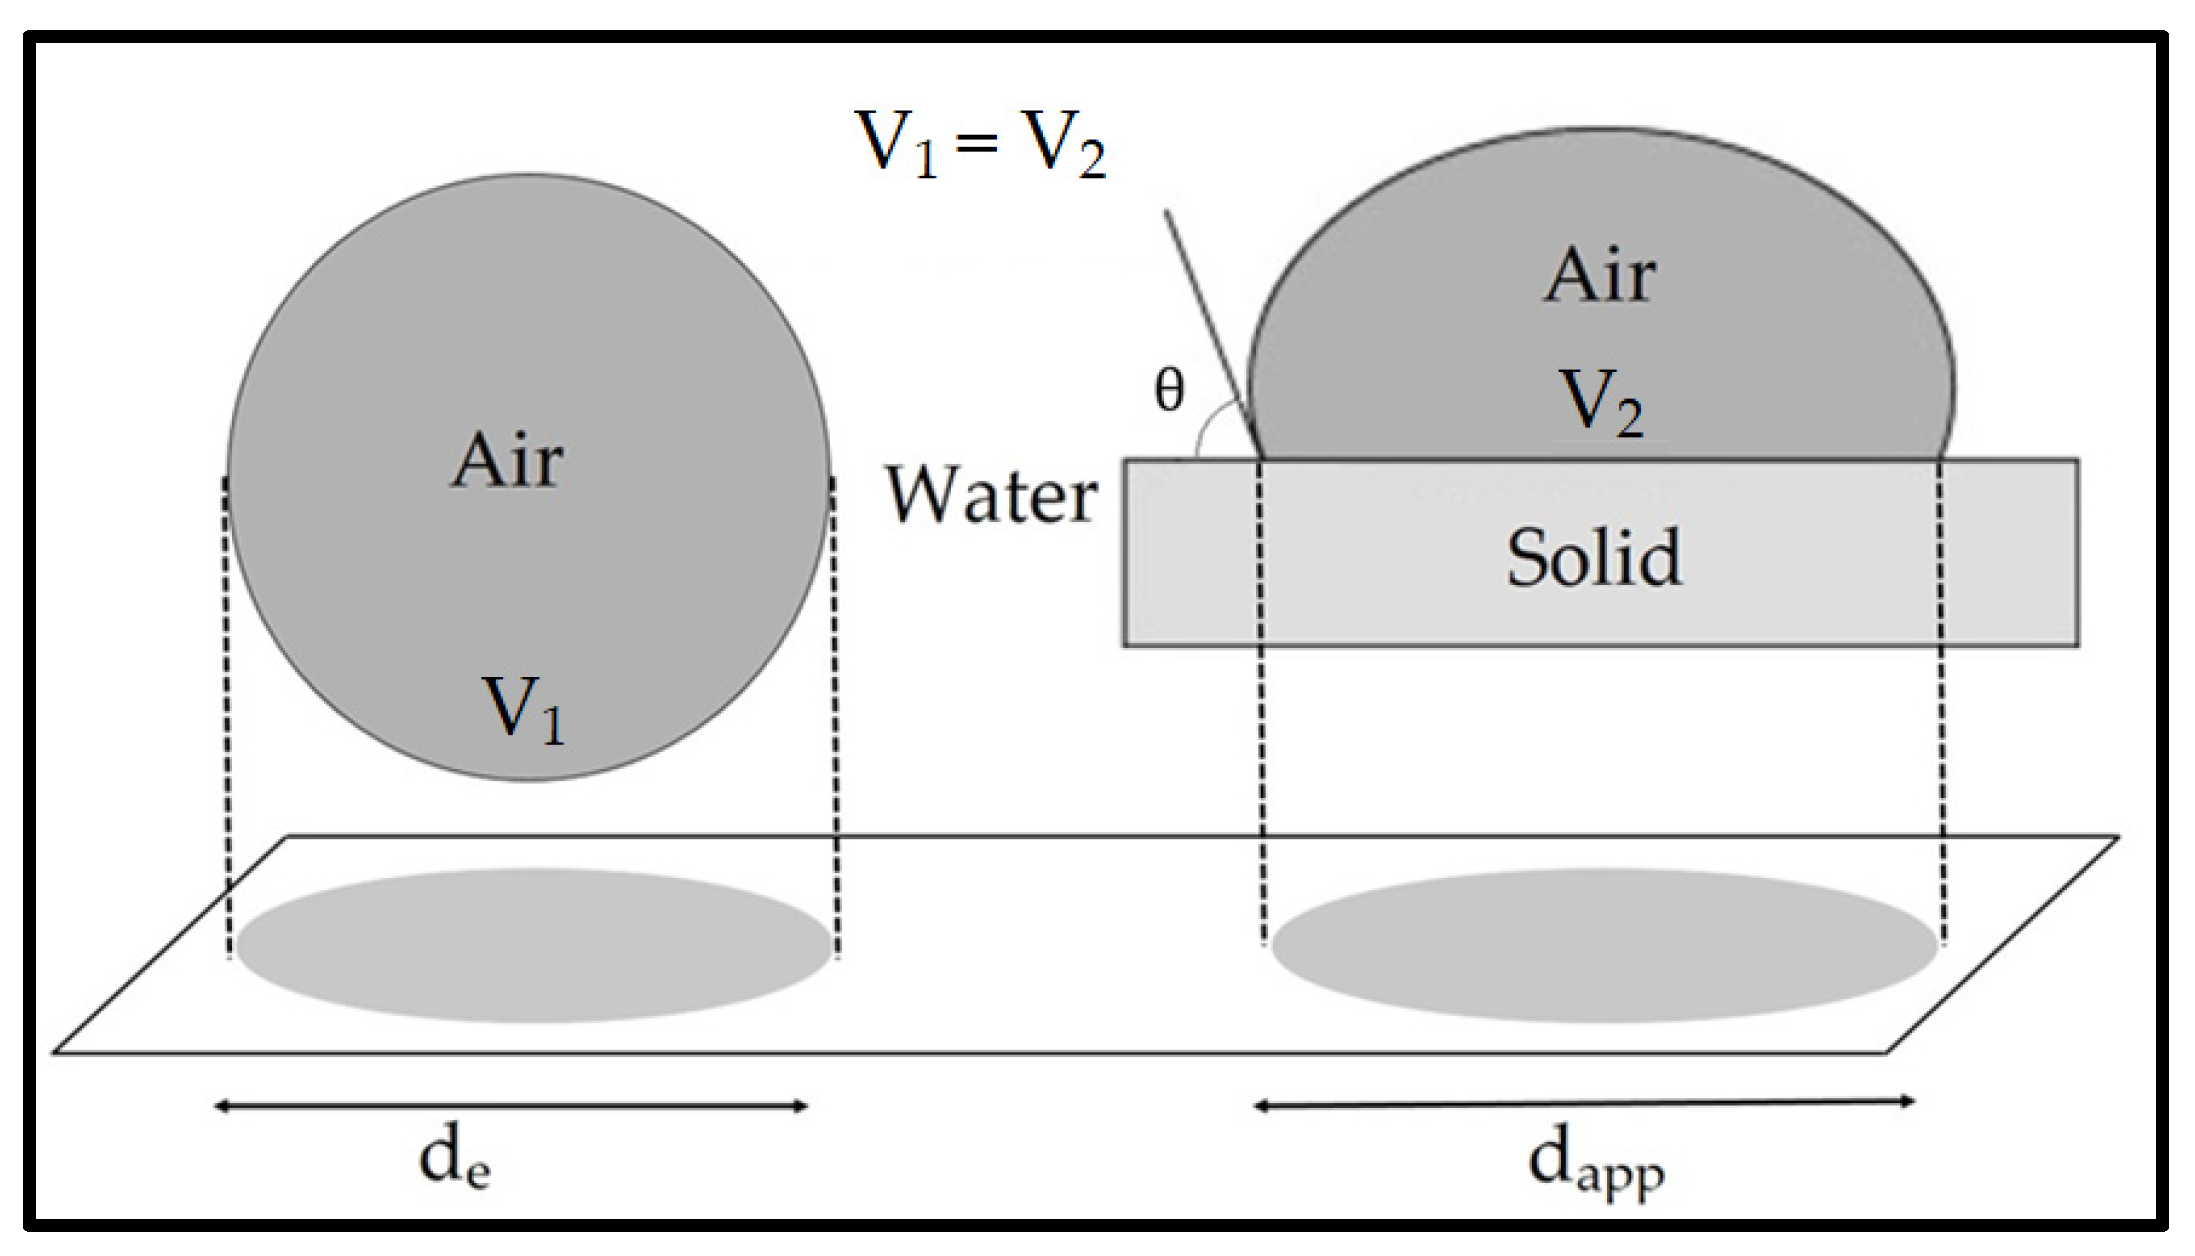
2.2. The Influence of Pressure on Contact Angle

As illustrated in Figure 1a, when a flat mineral surface is in contact with air and an aqueous solution, the angle between the mineral surface and the gaseous phase, depicted across the liquid phase, is named contact angle (θ). In this way, the value of θ indicates the extent at which water wets the surface of the mineral: higher values of θ indicate a lower wettability of the mineral surface by water (hydrophobic character), whereas the lower ones indicate that water wets the surface of the mineral more effectively [5,25,26]. In froth flotation, information about a mineral species’ magnitude of θ allows the prediction of its individual floatability and also the selectivity of the separation between floatable versus non-floatable minerals under key process conditions, such as temperature, solution pH, type and concentration of selected reagents, and conditioning time [5,25]. When measuring the magnitude of contact angle by using a goniometer, one must account for hysteresis between the “advancing water contact angle” ( θ a ) and “receding water contact angle” ( θ r ). According to Figure 1b, after a length of time, both θ a and θ r tend to reach an equilibrium value ( θ e q ) [26].
Within flotation cells, after particle/bubble collision and successful adhesion, the capillary force allied to the buoyancy of the immersed part of the particle plus the hydrostatic pressure ( P h y d ) have the duty to keep the particle attached to the bubble [24]. According to Equation (5), the magnitude of the capillary force ( F C a p ) acting on a particle positioned at a liquid–gas interface depends on particle diameter ( d p ), contact angle (θ) and the central angle of the particle (ω), as displayed in Figure 2. The greater the contact angle, the greater F C a p . This way, the more water repellent a surface is, the greater the strength of particle/bubble attachment, a phenomenon that largely influences the flotation recovery of coarse particles [23,24].
F C a p = π   d p   sin ω   sin ( ω + θ )
Since the magnitude of θ varies with the surface tension ( γ L G ) of the flotation solution, it is informative to couple results from contact angle measurements with the value of the surface tension of the aqueous solution which partially wets the surface of the mineral. Under constant temperature and pressure, plots of cos θ versus γ L G are straight lines with negative slope: the higher γ L G , the smaller cos θ (higher θ) [27,28]. Due to the well-established temperature dependence of the surface free energy [5,6], the effect of temperature on γ L G and θ, is straightforward: the higher the temperature, the lower the γ L G and θ. On the other hand, the influence of pressure on γ L G has so far not been clearly settled. Results maintained by Kundt [29] and Rice [30] indicate a decrease in the value of γ L G as pressure increases. In this regard, Adamson [6] argues that one cannot subject the surface of a liquid to an increased pressure without introducing a second component into the experimental system (as an inert gas) which increases the density of the gaseous phase, promoting gas adsorption onto the liquid surface in an amount formally corresponding to a volume change that forces γ L G to decrease. On the other hand, according to Adamson [6], because the pressure effect on γ L G is related to the change in molar volume when a molecule moves from the bulk to the liquid–gas interface, one expects the density of the surface region to be less than that of the interior of the liquid and, therefore, any increase in pressure would increase the magnitude of γ L G . This rationale pursued by Adamson [6] seems to be true in systems composed of two immiscible liquids. McCaferry [31] measured the interfacial tension ( γ L L ) between brine and hydrocarbons (dodecane or octane) under a wide range of pressure (up to 34,000 kPa), and similarly observed that an increase in pressure promotes an increase in γ L L . In this case, an external pressure was exerted on the system without introducing an inert gas. The influence of pressure on the magnitude of the contact angle has not been approached so far by authors in the froth flotation domain, but scarce information on this subject is found in the literature devoted to enhanced oil recovery, a subject of paramount interest in the petroleum industry. Wang and Gupta [32] measured θ for the crude oil–brine–quartz system at oil reservoir conditions (1379 kPa < pressure < 20,684 kPa and 22.5 °C < temperature < 93.3 °C) and reported an increase in the value of θ as pressure increased.

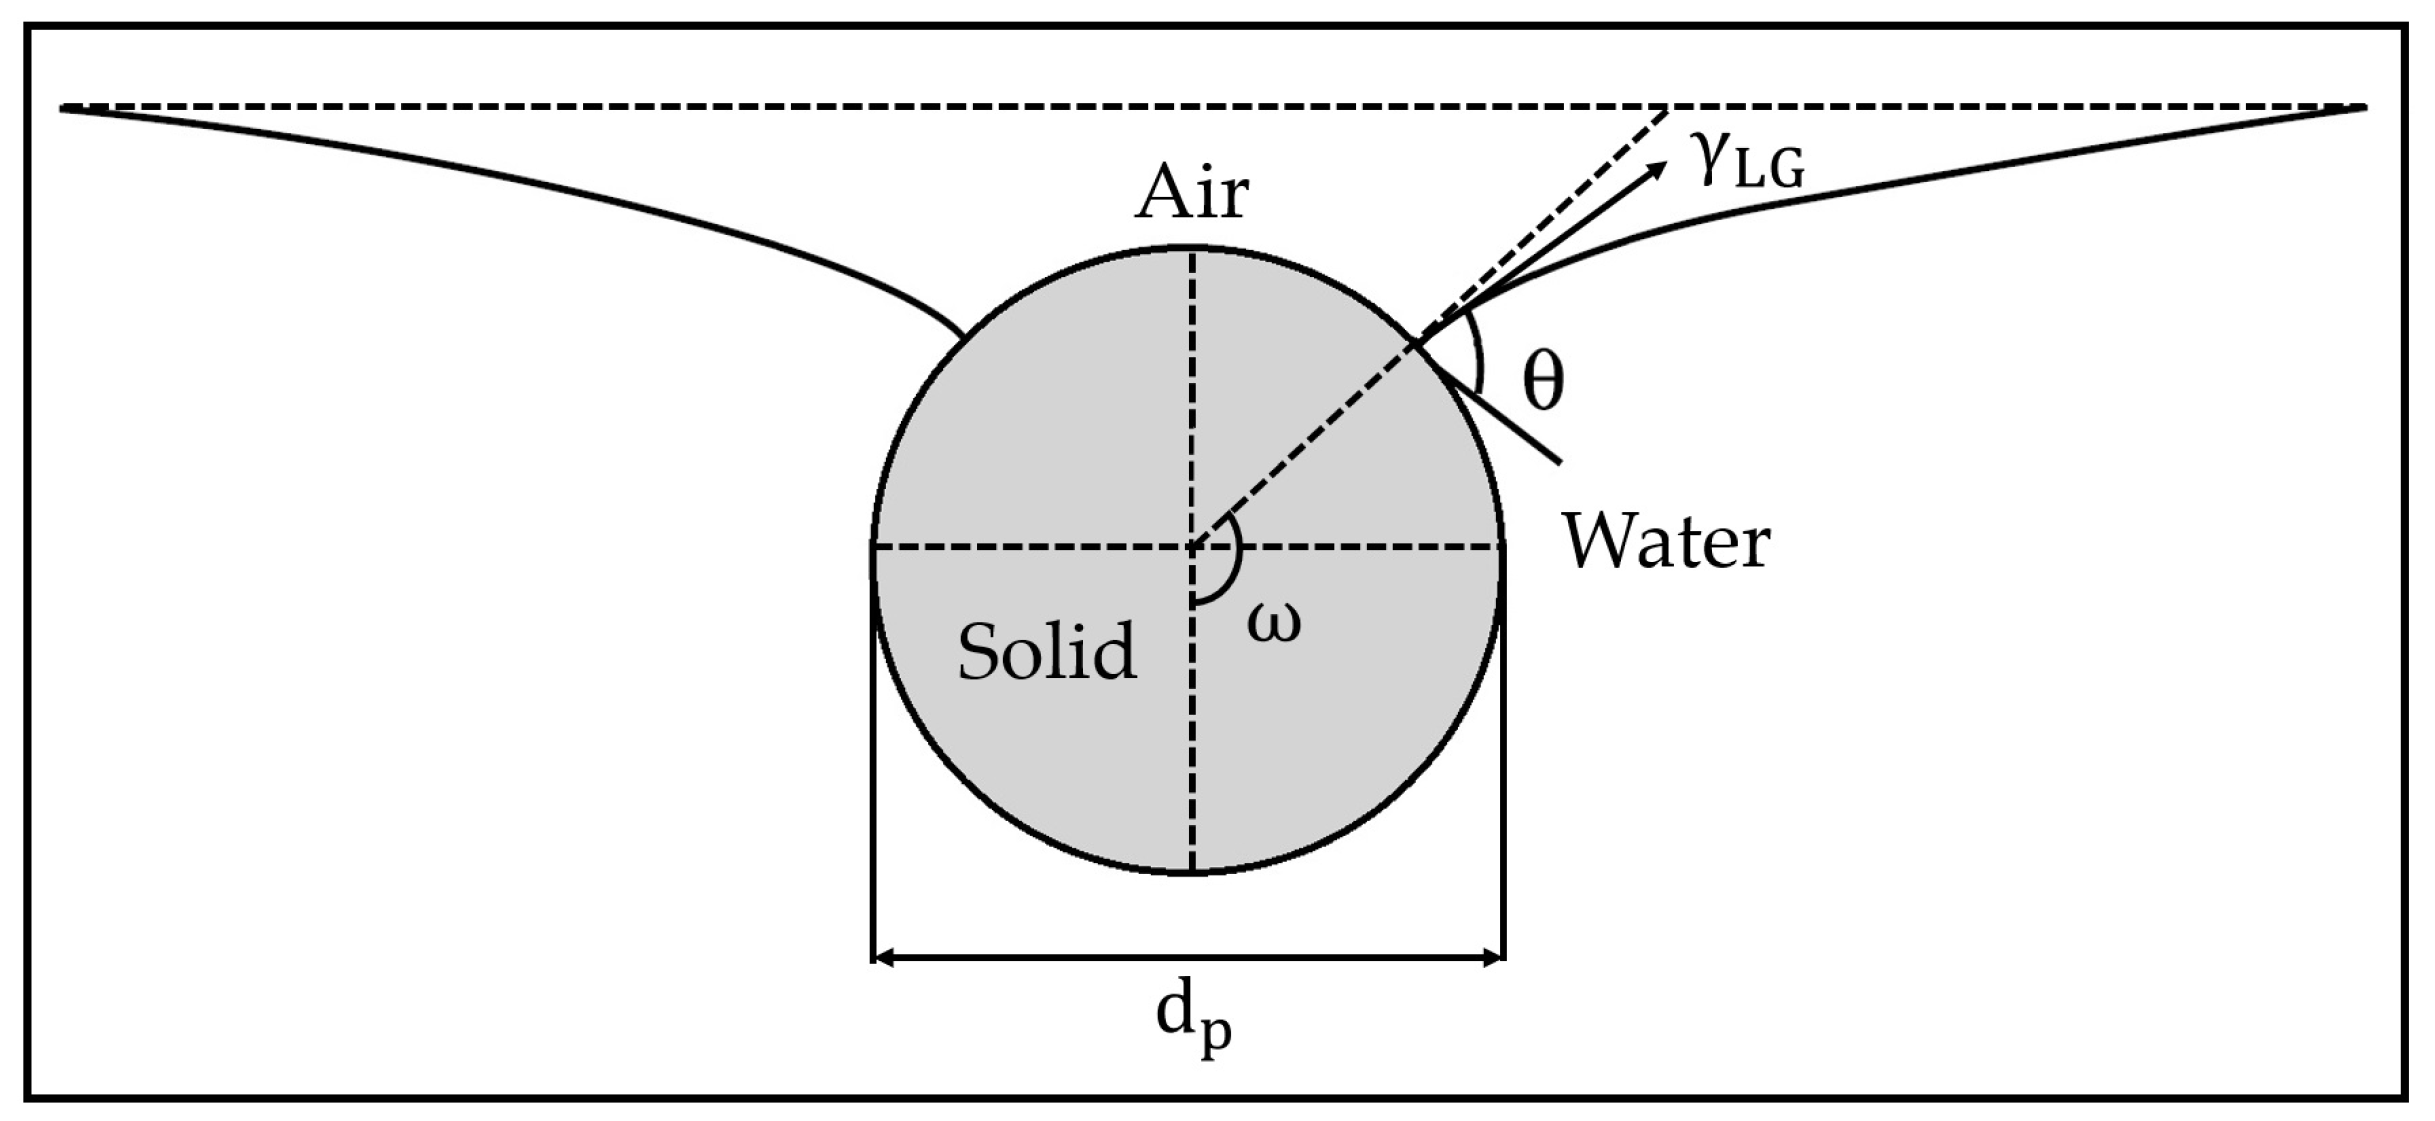
2.3. Size, Velocity and Stability of Particle–Bubble Aggregates in Flotation Cells

Results from many studies approaching the movement of bare bubbles in water columns are commonly found in the current literature [4,7,8,9,10,11,12,13,14,15,16,17,18,19,20,21,22], but there is a lack of information about the rising velocity of particle–bubble aggregates versus their size. On the other hand, the literature provides a consistent theoretical basis for approaching the stability of particle–bubble aggregates [2,3,23,24,33], although those models consider the solid phase as a perfect sphere, disregarding the irregular shape exhibited by mineral particles. According to Schulze [2,3], the sum of forces acting on a spherical particle at a static liquid/gas interface is represented by Equation (6), where forces due to buoyancy ( F b ), hydrostatic pressure ( F h y d ), and capillarity ( F c a ) contribute to particle–bubble attachment; whereas forces due to gravity/particle weight ( F g ), capillary pressure ( F c a ) in the bubble acting on the contact area of the particle, plus the force due to external acceleration ( F a ) contribute to detachment.
F = F g + F b + F h y d + F c a + F p + F a  
Since F a   depends greatly on the structure and intensity of the turbulent flow field that surrounds particle–bubble aggregates in a given volume of the flotation cell, the dimensions of particle–bubble aggregates were assumed by Schulze [2,3] to correspond to those of the turbulent vortices moved by the existing centrifugal acceleration. Such a theoretical approach suits the hydrodynamics of mechanical flotation cells: mixing reactors in which a rotating impeller promotes highly turbulent flow. Regarding flotation columns operating in a one-dimensional (axial) plug flow regime, mixing (a consequence of the existing turbulence in the system) is expected to happen to a considerably lower extent [1]. In this particular case, the influence of F a (force due to external acceleration) on particle–bubble detachment depends on the magnitude of the squared rising velocity ( v 2 ) of the particle–bubble aggregates plus the resistance posed by the mineral slurry to their vertical motion, as the drag coefficient [4,8,9].

3. Materials and Methods

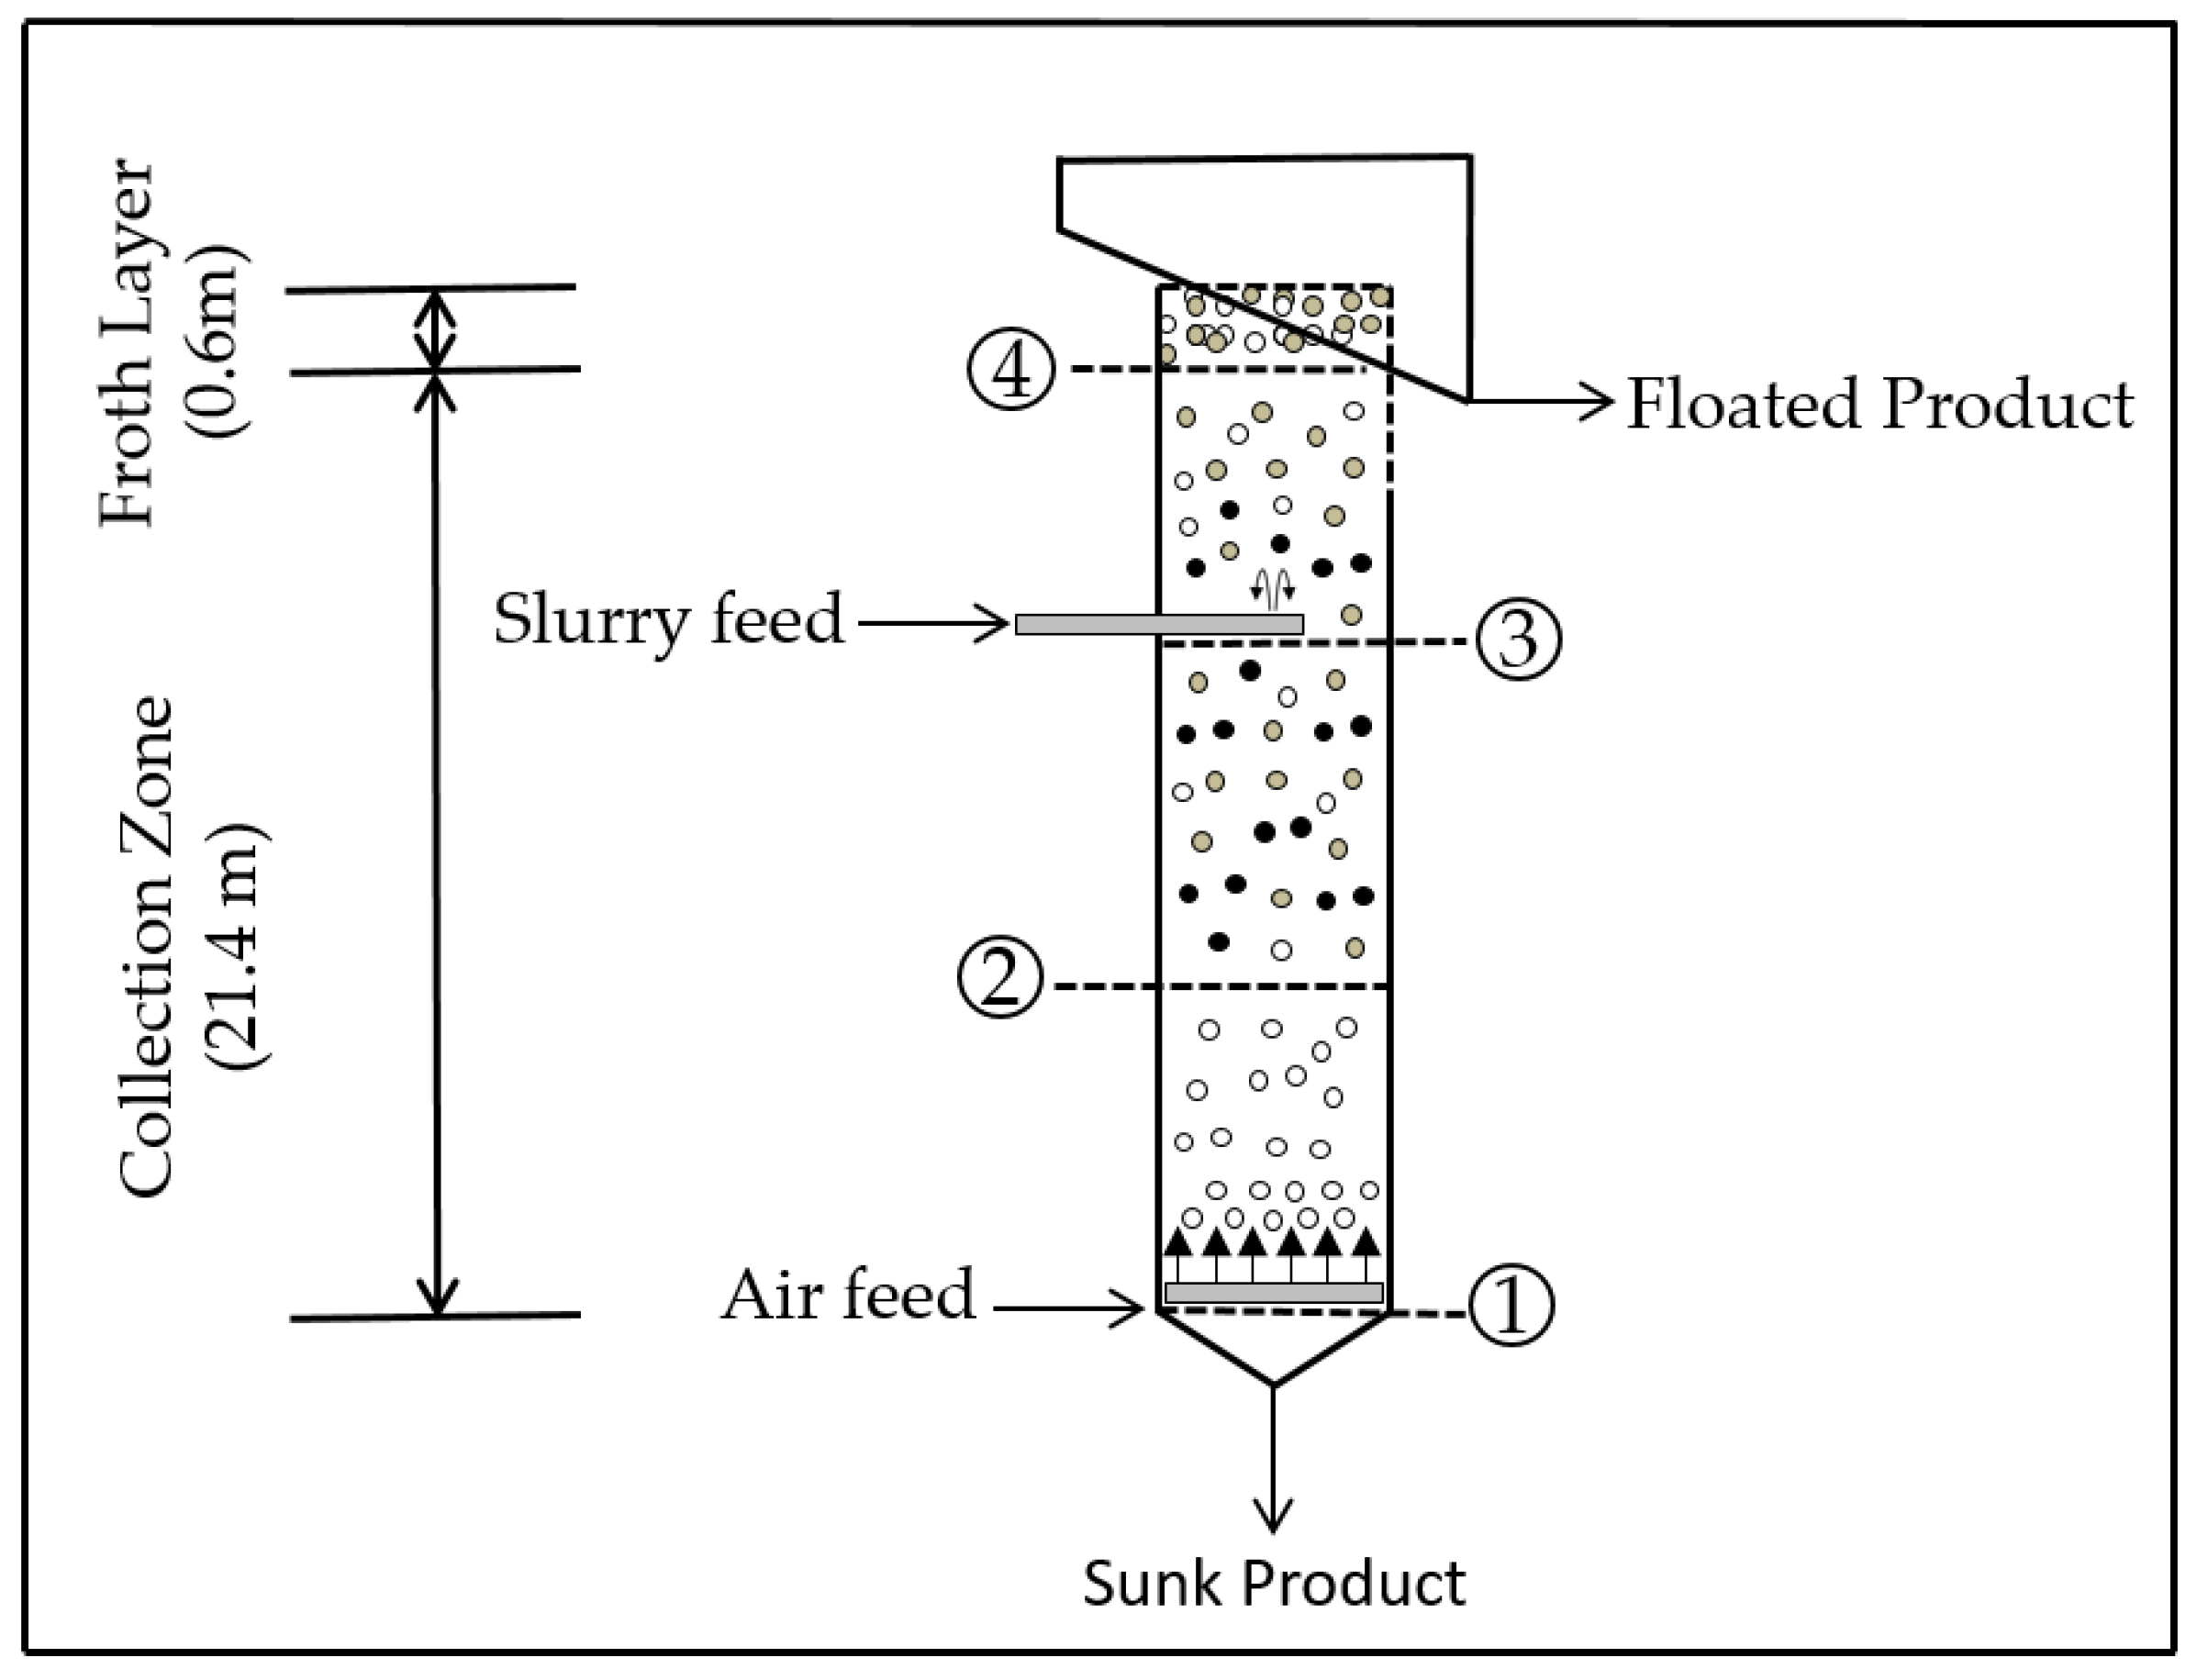
3.1. Boundary Contidions Used to Design the Experiments

A hypothetical flotation column (Figure 3) located at an altitude where the average atmospheric pressure ( P a t m ) is 93 kPa processes an iron ore slurry containing 50% of solids (w/w), gas holdup of 10% and the aerated slurry exhibits specific gravity of 1430 kg/m3. The overall height of the column is 22 m, which represents the sum of the height of the collection zone (21.4 m) plus the thickness of the froth layer (0.6 m). Four levels (Level-1, Level-2, Level-3, and Level-4) are marked along the vertical axis of the column. According to the values displayed in Table 1, any level is characterized by its distance from the base of the flotation column (x) and by the height of the slurry column (z) above it. Since Level-1 is positioned at the entrance of the air feed located on the bottom of the column, it is considered the reference level, which is characterized by x = 0 and z = 21.4 m. Level-4, located on top of the collection zone, is characterized by x = 21.4 m and z = 0. Accordingly, Level-2 (x = 7.13 m and z = 14.26 m) and Level-3 (x = 14.26 m and z = 7.13 m) show intermediate values of x and z.
Values of hydrostatic pressure ( P h y d ) and the total static pressure ( P e ) at Level-1 to Level-4 are displayed in Table 1. They were calculated by Equation (2). As depicted in Table 1, P h y d continuously decreases from Level-1 (300 kPa) to Level-4 (0 kPa), as the height of the slurry column above those levels decreases from z = 21.4 m (Level-1) to z = 0 m (Level-4). Based on those boundary conditions, the measurement of contact angle ( θ ) and the assessment of bubble equivalent diameter ( d b e ) were conducted under manometer pressures varying from 0 to 300 kPa.

3.2. Materials

A chunk of quartz from Descalvado-SP was carefully polished to prepare a flat plate (diameter = 30 mm) which was used to measure contact angle and assesses bubble equivalent diameter. The purity of the quartz sample was tested by X-ray diffraction and chemical analysis via X-ray fluorescence (Table 2). All the measurements were performed with Milli-Q water (resistivity = 18 MΩ.cm) and aqueous solutions (5 mg/L) of a cationic collector (Flotigam® EDA, supplied by Clariant, São Paulo, Brazil) traditionally used in the reverse cationic flotation of quartz. Sodium hydroxide of analytical grade (concentration of 1% w/w) was used for pH adjustment. Nitric acid and hydrochloric acid (molar ratio = 1:3) of analytical grade were mixed to produce aqua regia, a liquid used to clean the surface of the quartz plate after any experiment. Analytical grade ethanol and distilled water were used to wash the quartz plate after cleaning with aqua regia.

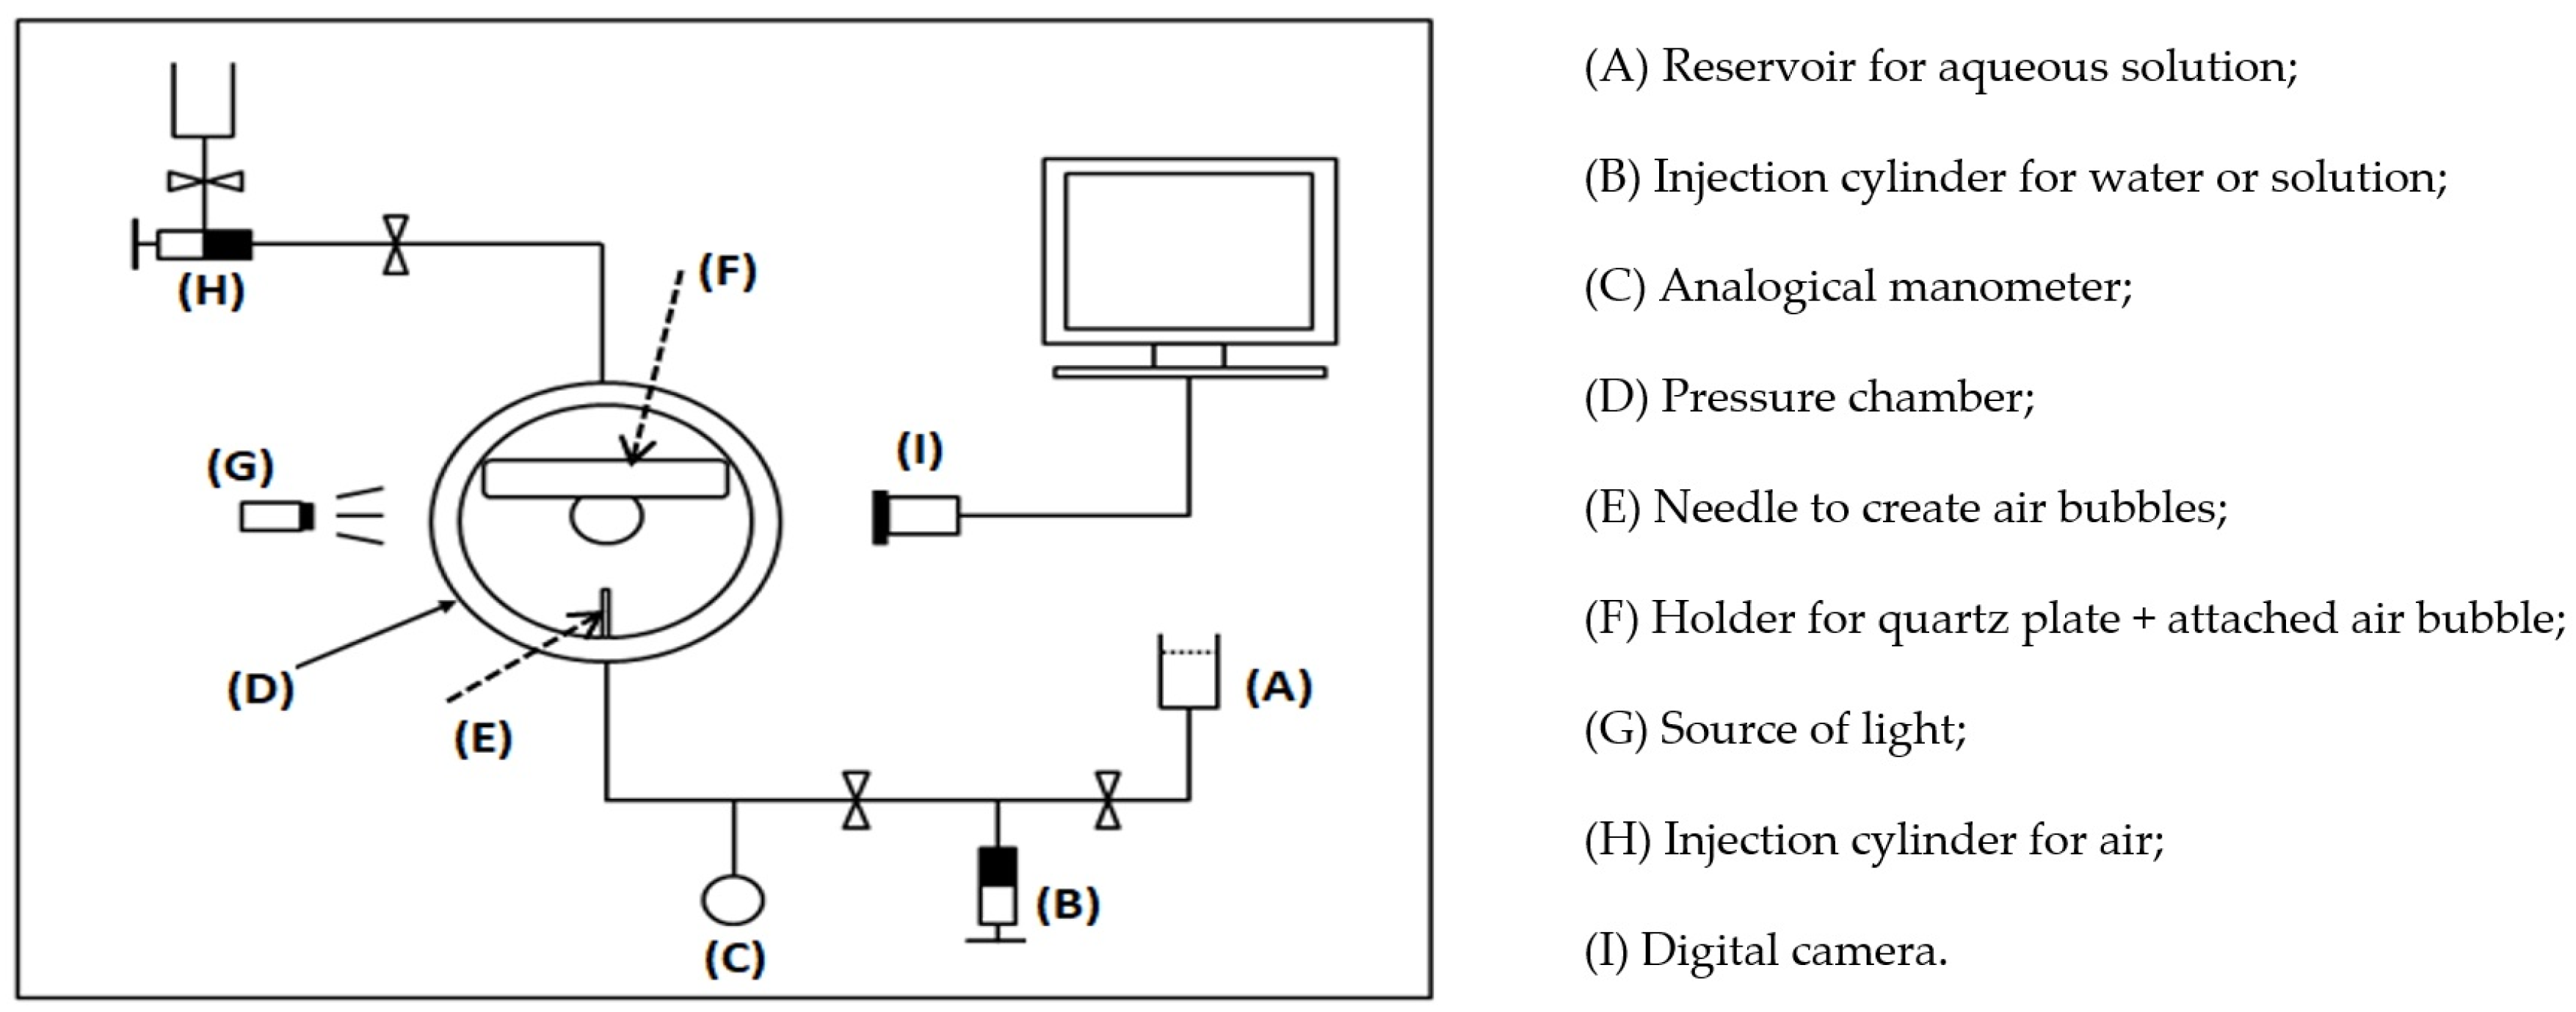
3.3. Equipment and Facilities

Measurement of contact angle ( θ )   and apparent bubble diameter ( d a p p ) were performed by the tensiometer DSA100HP (Kruss GmbH, Hamburg, Germany), which allows the application of a desired pressure on an air bubble attached to a plate. Schematics on how the equipment works is depicted in Figure 4.
According to Figure 4, the tensiometer DSA100HP is composed of a pressure chamber (D) endowed by a sample holder (F) to receive the quartz plate and air bubbles. Water or solution is stocked in a reservoir (A) and injected into the pressure chamber by a cylinder (B). The chamber is filled with water or collector solution under controlled temperature. Air is injected into the pressure chamber by a cylinder (H) and passes through a needle (E) whose internal diameter is 0.8 mm, aimed at generating a single bubble. After being released, the bubble rises until reaching the quartz plate attached to the sample holder positioned upwards. The pressure applied to the chamber (D) is set by a pressure gauge. Just after bubble/plate attachment, images versus time are captured by a digital camera (I) assisted by a light source (G). Image analysis was carried out by the software ADVANCE supplied by Kruss GmbH (Hamburg, Germany), which provided values of contact angle versus time (as depicted in Figure 1b), bubble volume (V1) and apparent bubble diameter ( d a p p ) . The latter was determined by the software ADVANCE by means of the Young–Laplace method. The values of d a p p obtained in the presence of collector solution (5 mg/L) are related to a bubble attached to the quartz plate ( θ > θ o ) and not to a free bubble. In this case, to assess the diameter of the free bubble, Karamanev and co-authors [34] used a method based on the concept of equivalent bubble diameter ( d b e ), i.e., the diameter of a free bubble which bears the same volume (V2) of the attached bubble (V1), as depicted in Figure 5. Following the approach proposed by Karamanev and co-authors [34], the values of d a p p   were converted into d b e by using a relation ( d b e = 0.62   d a p p ) based on a model maintained by Rodrigue [8]. Surface tension ( γ ) of collector solution was measured via the Wilhelmy Plate Method at 20 ±   1 °C by using Force Tensiometer Kruss K100C (supplied by Kruss, Hamburg, Germany).

3.4. Experimental Procedures

Before any measurement of θ and d a p p were performed, the quartz plate was placed in contact with aqua regia for 5 min, followed by 5 min of conditioning with distilled water in an ultrasound bath. At the end of this first cleaning procedure, the quartz plate was thoroughly washed with ethanol (analytical grade) and water following this sequence.
To perform the measurement of θ , the quartz plate was placed in the sample holder located at the top of the tensiometer DSA100HP’s pressure chamber of, which was filled with water ( γ = 72.8 mN/m) or Flotigam® EDA solution ( γ L G = 57.0 mN/m) at pH 10.5 and temperature of 20 ±   1   ° C . Manometer pressures varying from 0 kPa to 300 kPa were applied to the pressure chamber aiming at mimicking the values of P h y d that characterize the hypothetical column depicted in Figure 3. During the experiments involving manometer pressures (100–300 kPa) higher than room pressure (0 kPa), the bubbles were released at room pressure (manometer pressure = 0 kPa, atmospheric pressure = 93 kPa) and then submitted to the desired load before starting the process of measurement. After bubble attachment to the quartz plate, the ADVANCE software conducted sequential contact angle measurements by means of the Captive Bubble Method at each 30 s until a constant value was reached ( θ e q ). Figure 1b depicts the typical profile of the variation of contact angle versus time in our experimental system. Accordingly, before the system reached the steady state, water advanced and receded continuously on the quartz surface (hysteresis), yielding sets of values of θ a and θ r until an equilibrium value ( θ e q ) was achieved. Therefore, when discussing the results, any value of contact angle ( θ ) represents the mean average of three measurements of θ e q obtained after a length of time of 30 min.
Images of air bubbles attached to the quartz plate (immersed in water or Flotigam® EDA solution) were captured by the DSA100HP’s digital camera under manometer pressure varying from 0 kPa to 300 kPa. At any manometer pressure, 20 images were captured by the digital camera and processed by the software ADVANCE. In the presence of ether amine solution ( γ L G =  57.0 mN/m), the bubble was not perfectly spherical due to the attachment to the quartz plate. For this reason, bubble volume provided by the software ( V 1 ) allowed the determination of the bubble equivalent diameter (dbe), whose volume ( V 2 ) is equal to  V 1 . Thus, dbe is the diameter of an ideal free bubble which bears the same volume of the actual bubble attached to the flat plate (Figure 5).

3.5. Assessment of Bubble Rising Velocity

Values of bubble diameter ( d b ) and their corresponding values of rising velocity ( v b ) were obtained by Sam and co-authors [9] in the presence of a surfactant (DF250) aqueous solution of known surface tension ( γ L G   = 55 mN/m). Those results fit (R2 = 0.98) an exponential model represented by Equation (5). Because our measurements of bubble diameter versus pressure were carried out in the presence of a surfactant (Flotigam® EDA) solution which exhibits surface tension ( γ L G   = 57 mN/m) very close to those used by Sam and co-authors [9], Equation (5) was used to assess the values of v b related to the equivalent bubble diameter ( d b e ) generated by our experimental system.
v b = 23.85   ( 1 e 0.71 d b )

4. Results and Discussion

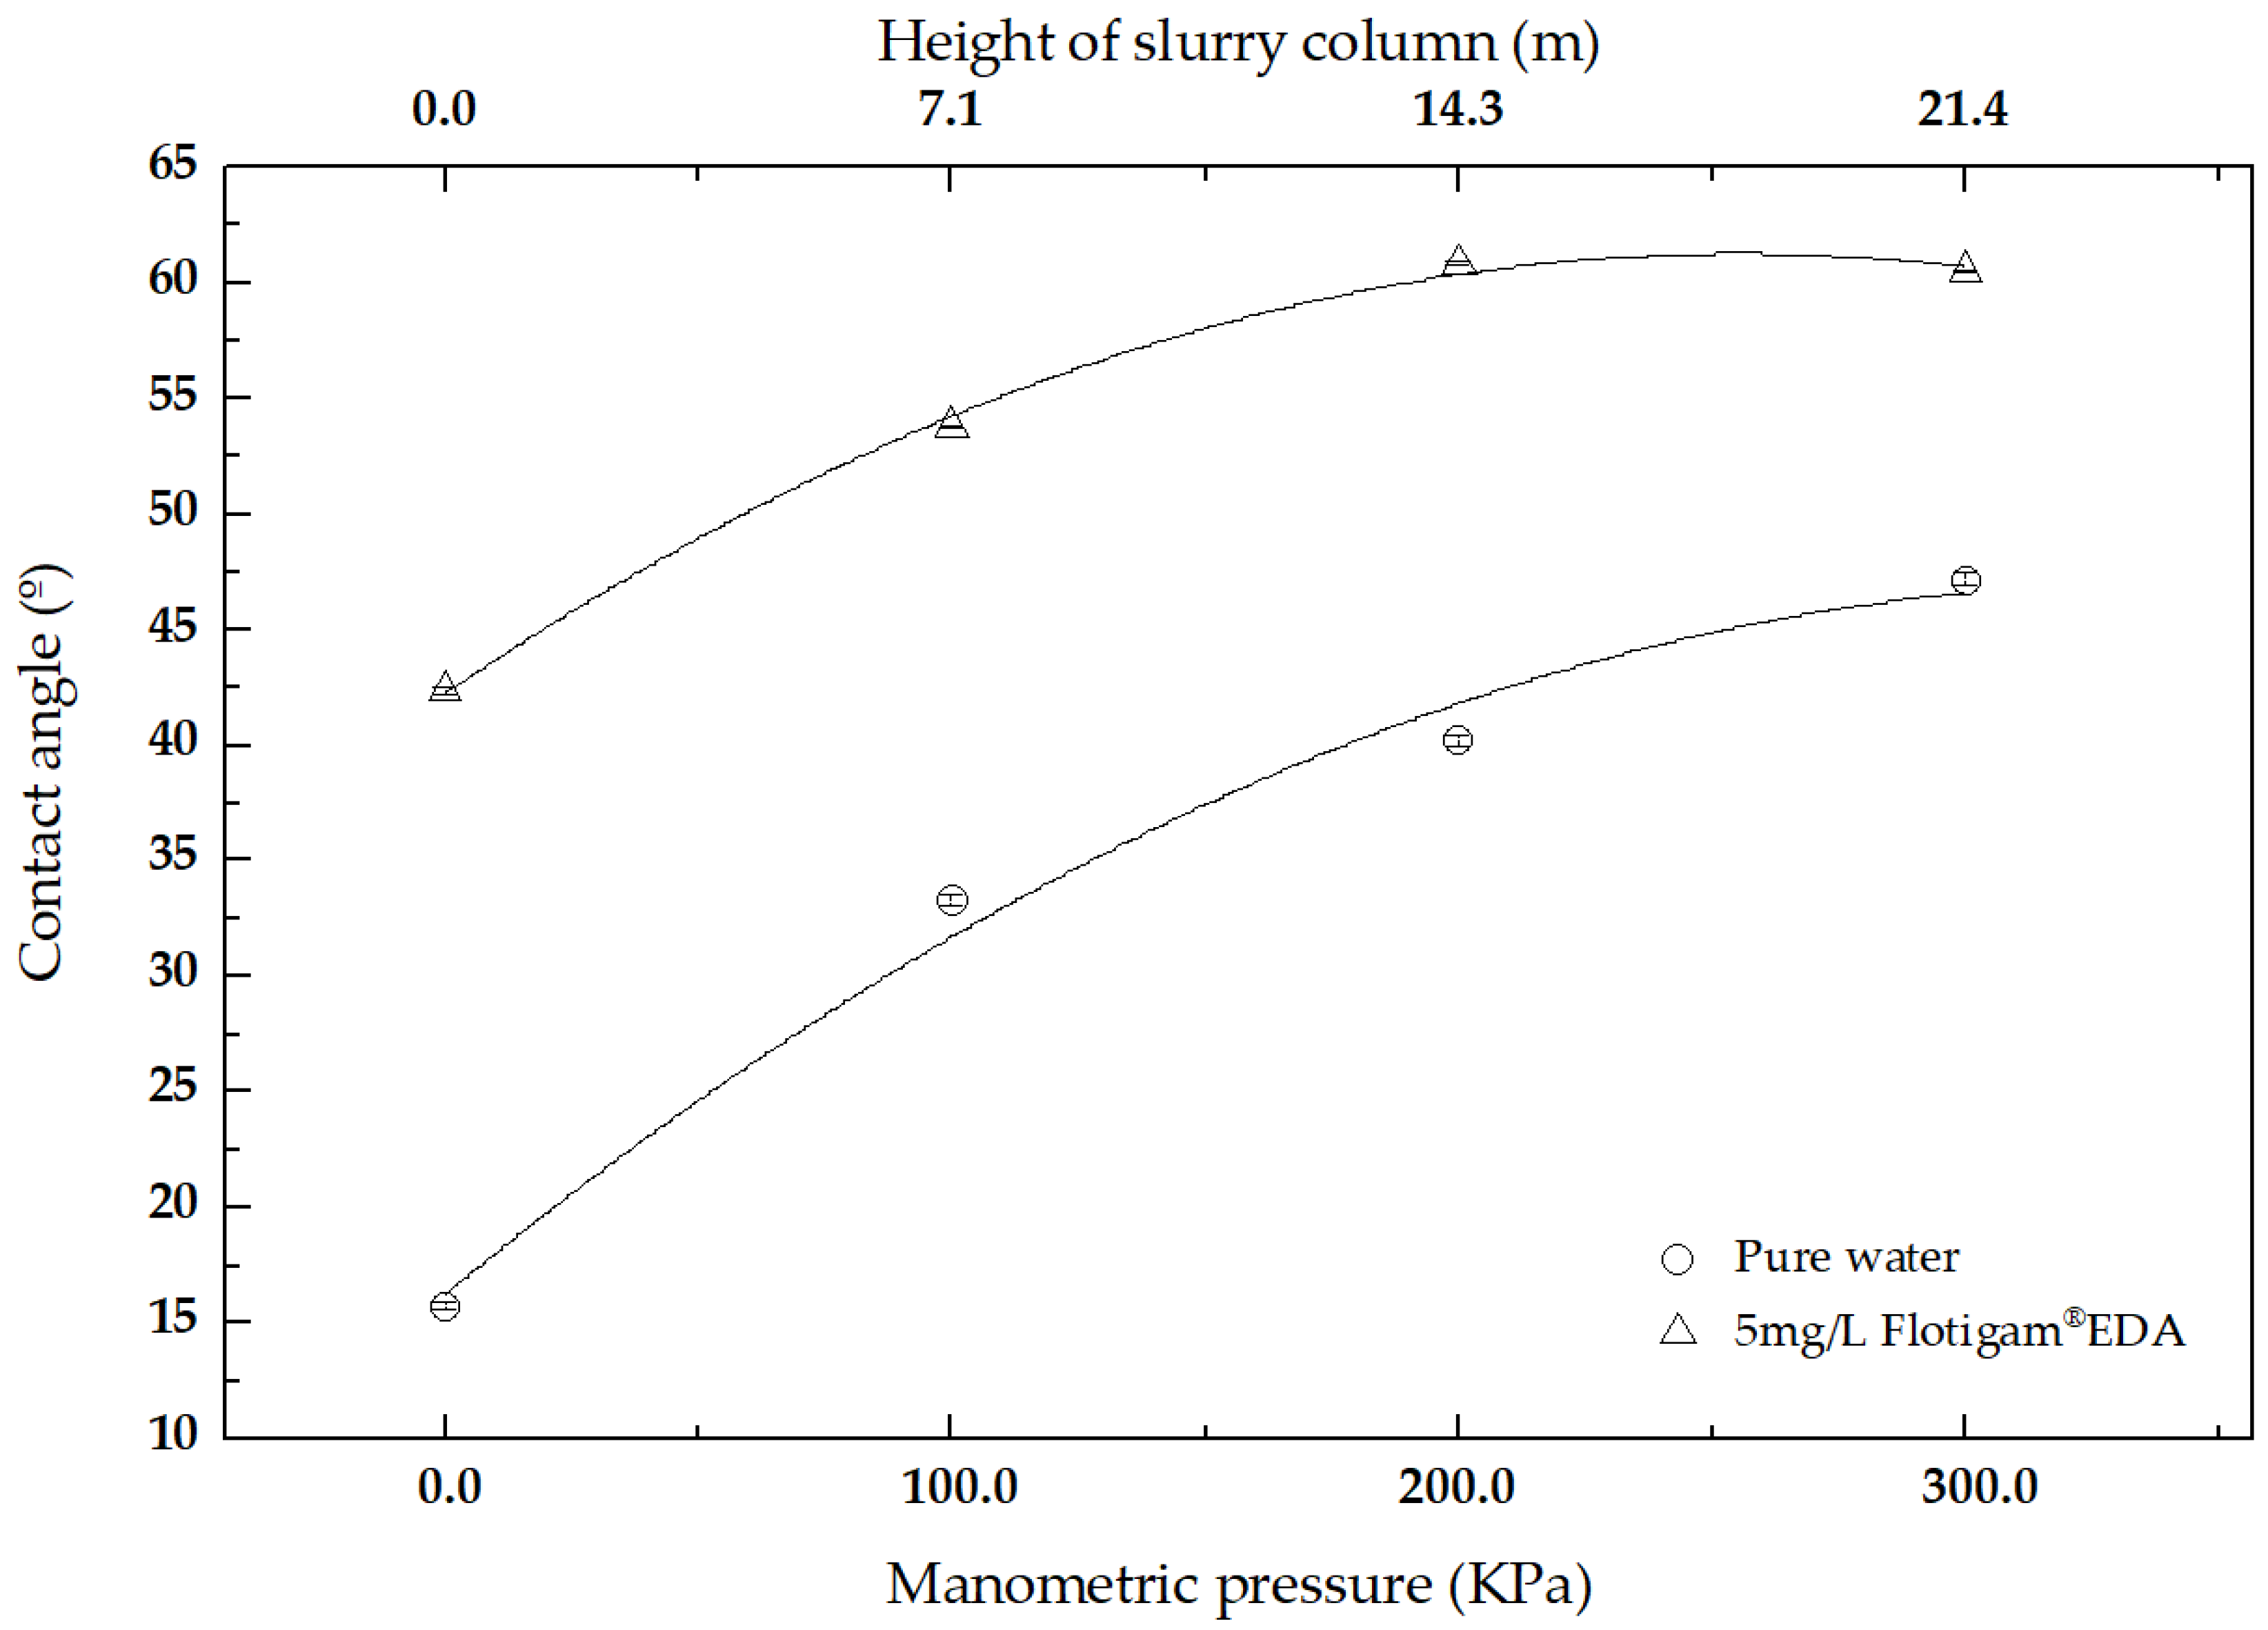
4.1. The Influence of Pressure on the Contact Angle of Quartz

The hydrostatic pressure exerted by a slurry column ( P h y d ) on the external walls of air bubbles positioned at four levels along the vertical axis of the hypothetical flotation column (HFC) displayed in Figure 3 was mimicked in our experimental system by applying manometer pressure varying from 0 kPa (as at Level-4 of the HFC) to 300 kPa (as at Level-1 of the HFC) on a single bubble in contact with a flat quartz plate immersed in pure water versus collector solution (5 mg/L of Flotigam® EDA, γ L G = 57 mN/m). Under a manometer pressure of 0 kPa (ambient pressure), contact angle of quartz in pure water ( θ = 15.7 o ± 0.2 o ) is not far from the value of θ = 11.1 o ± 0.5 o maintained by Tohry and co-workers [35] using the same bubble captive method. According to Figure 6, in the absence of surfactant (pure water), the magnitude of θ increases steadily from θ = 15.7 o ± 0.2 o to θ = 47.1 o ± 0.3 o , as the manometer pressure increases from 0 kPa to 300 kPa. This behavior indicates that an increasing pressure applied to a bubble´s external wall enhances particle/bubble attachment even though quartz is a naturally hydrophilic mineral. The same tendency is observed in the presence of 5 mg/L of collector, as the value of θ increases from 42.4 o ± 0.2 o (at 0 kPa) to 60.5 o ± 0.1 o (at 300 kPa). When applying this tendency to the HFC depicted in Figure 3, it is reasonable to expect a continuous loosening of the particle–bubble attachment, as particle–bubble aggregates float from the bottom (Level-1) to the top (Level-4) of the HFC. Furthermore, in the presence of Flotigam® EDA solution (5 mg/L, γ L G = 57 mN/m), the value of θ = 42.4 o measured at 0 kPa (related to the top of the HFC) is very close to the minimum value of contact angle ( θ 40 o ) which allows the flotation of quartz coarse particles (particle diameter > 100 μ m) [33], and also considerably lower than the critical contact angle ( θ = 51 o ) for quartz coarse (particle diameter > 90   μ m ) particles to float [36]. Conversely, the magnitude of the contact angle ( 60.5 o 60.2 o ) measured under the highest values of manometer pressure (200–300 kPa) which are typically found at the lower parts of the HFC (Level-1 and Level-2), are sufficiently high for coarse particles to float [24,33,36].

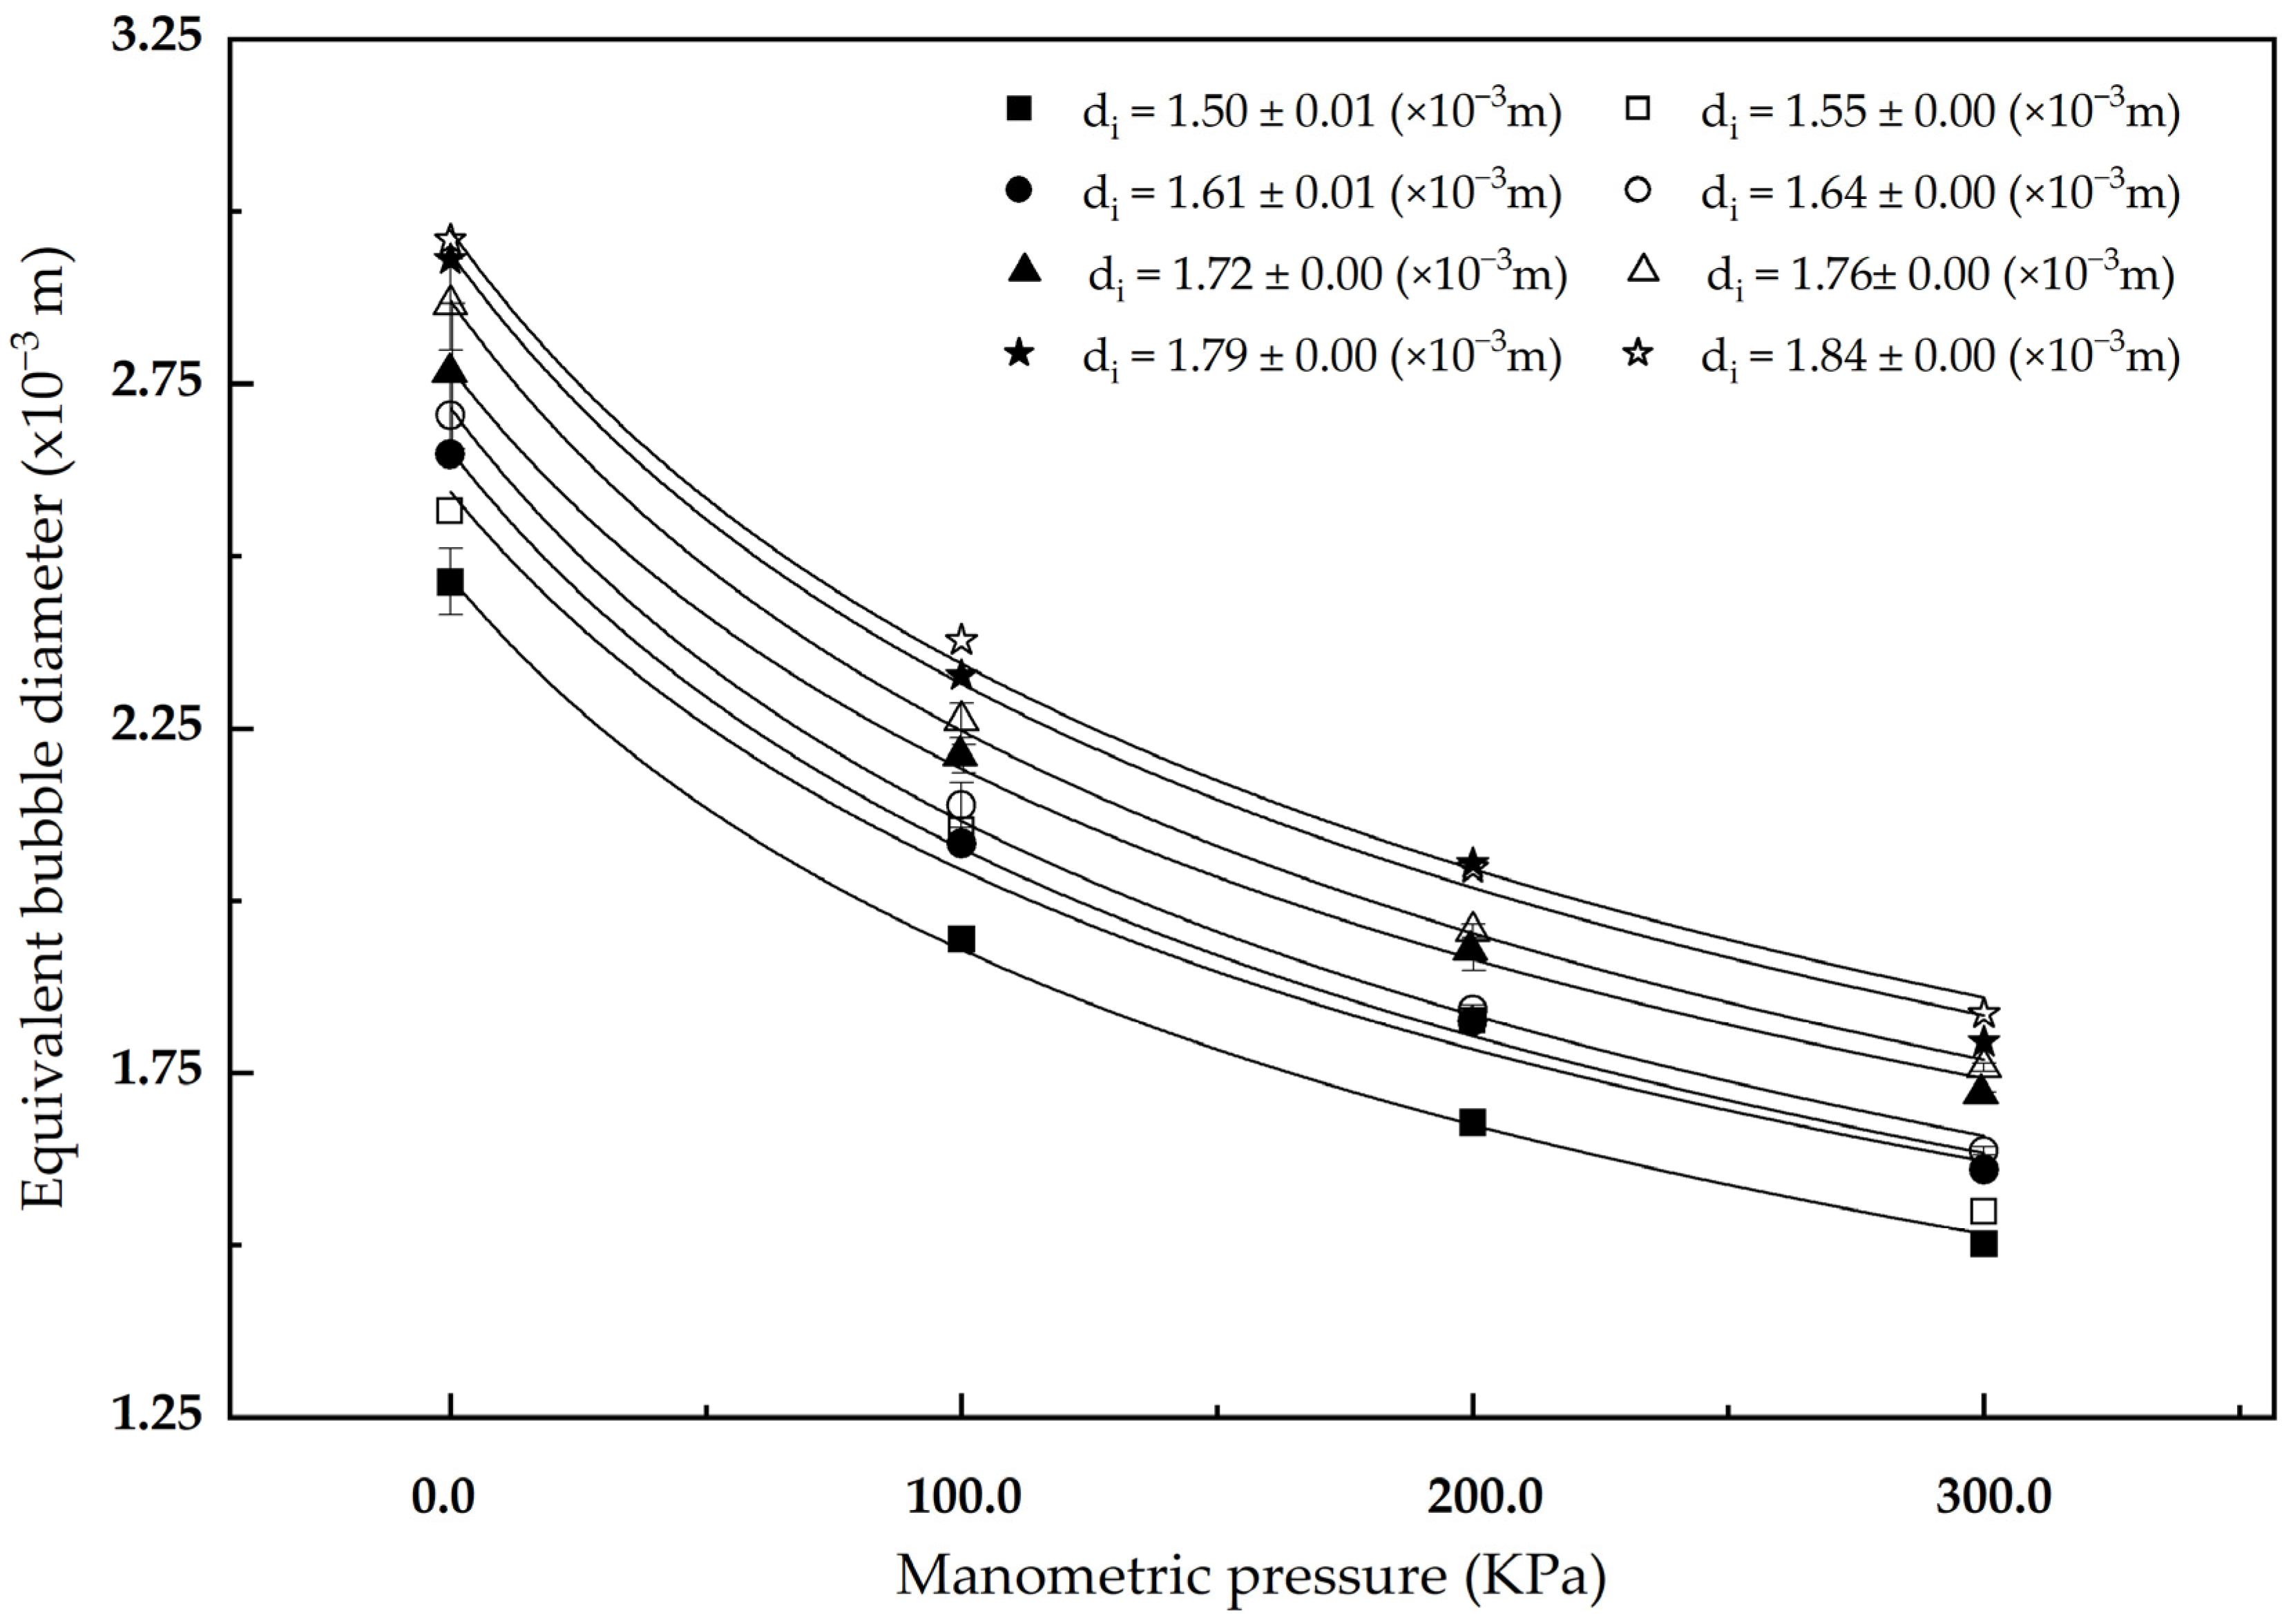
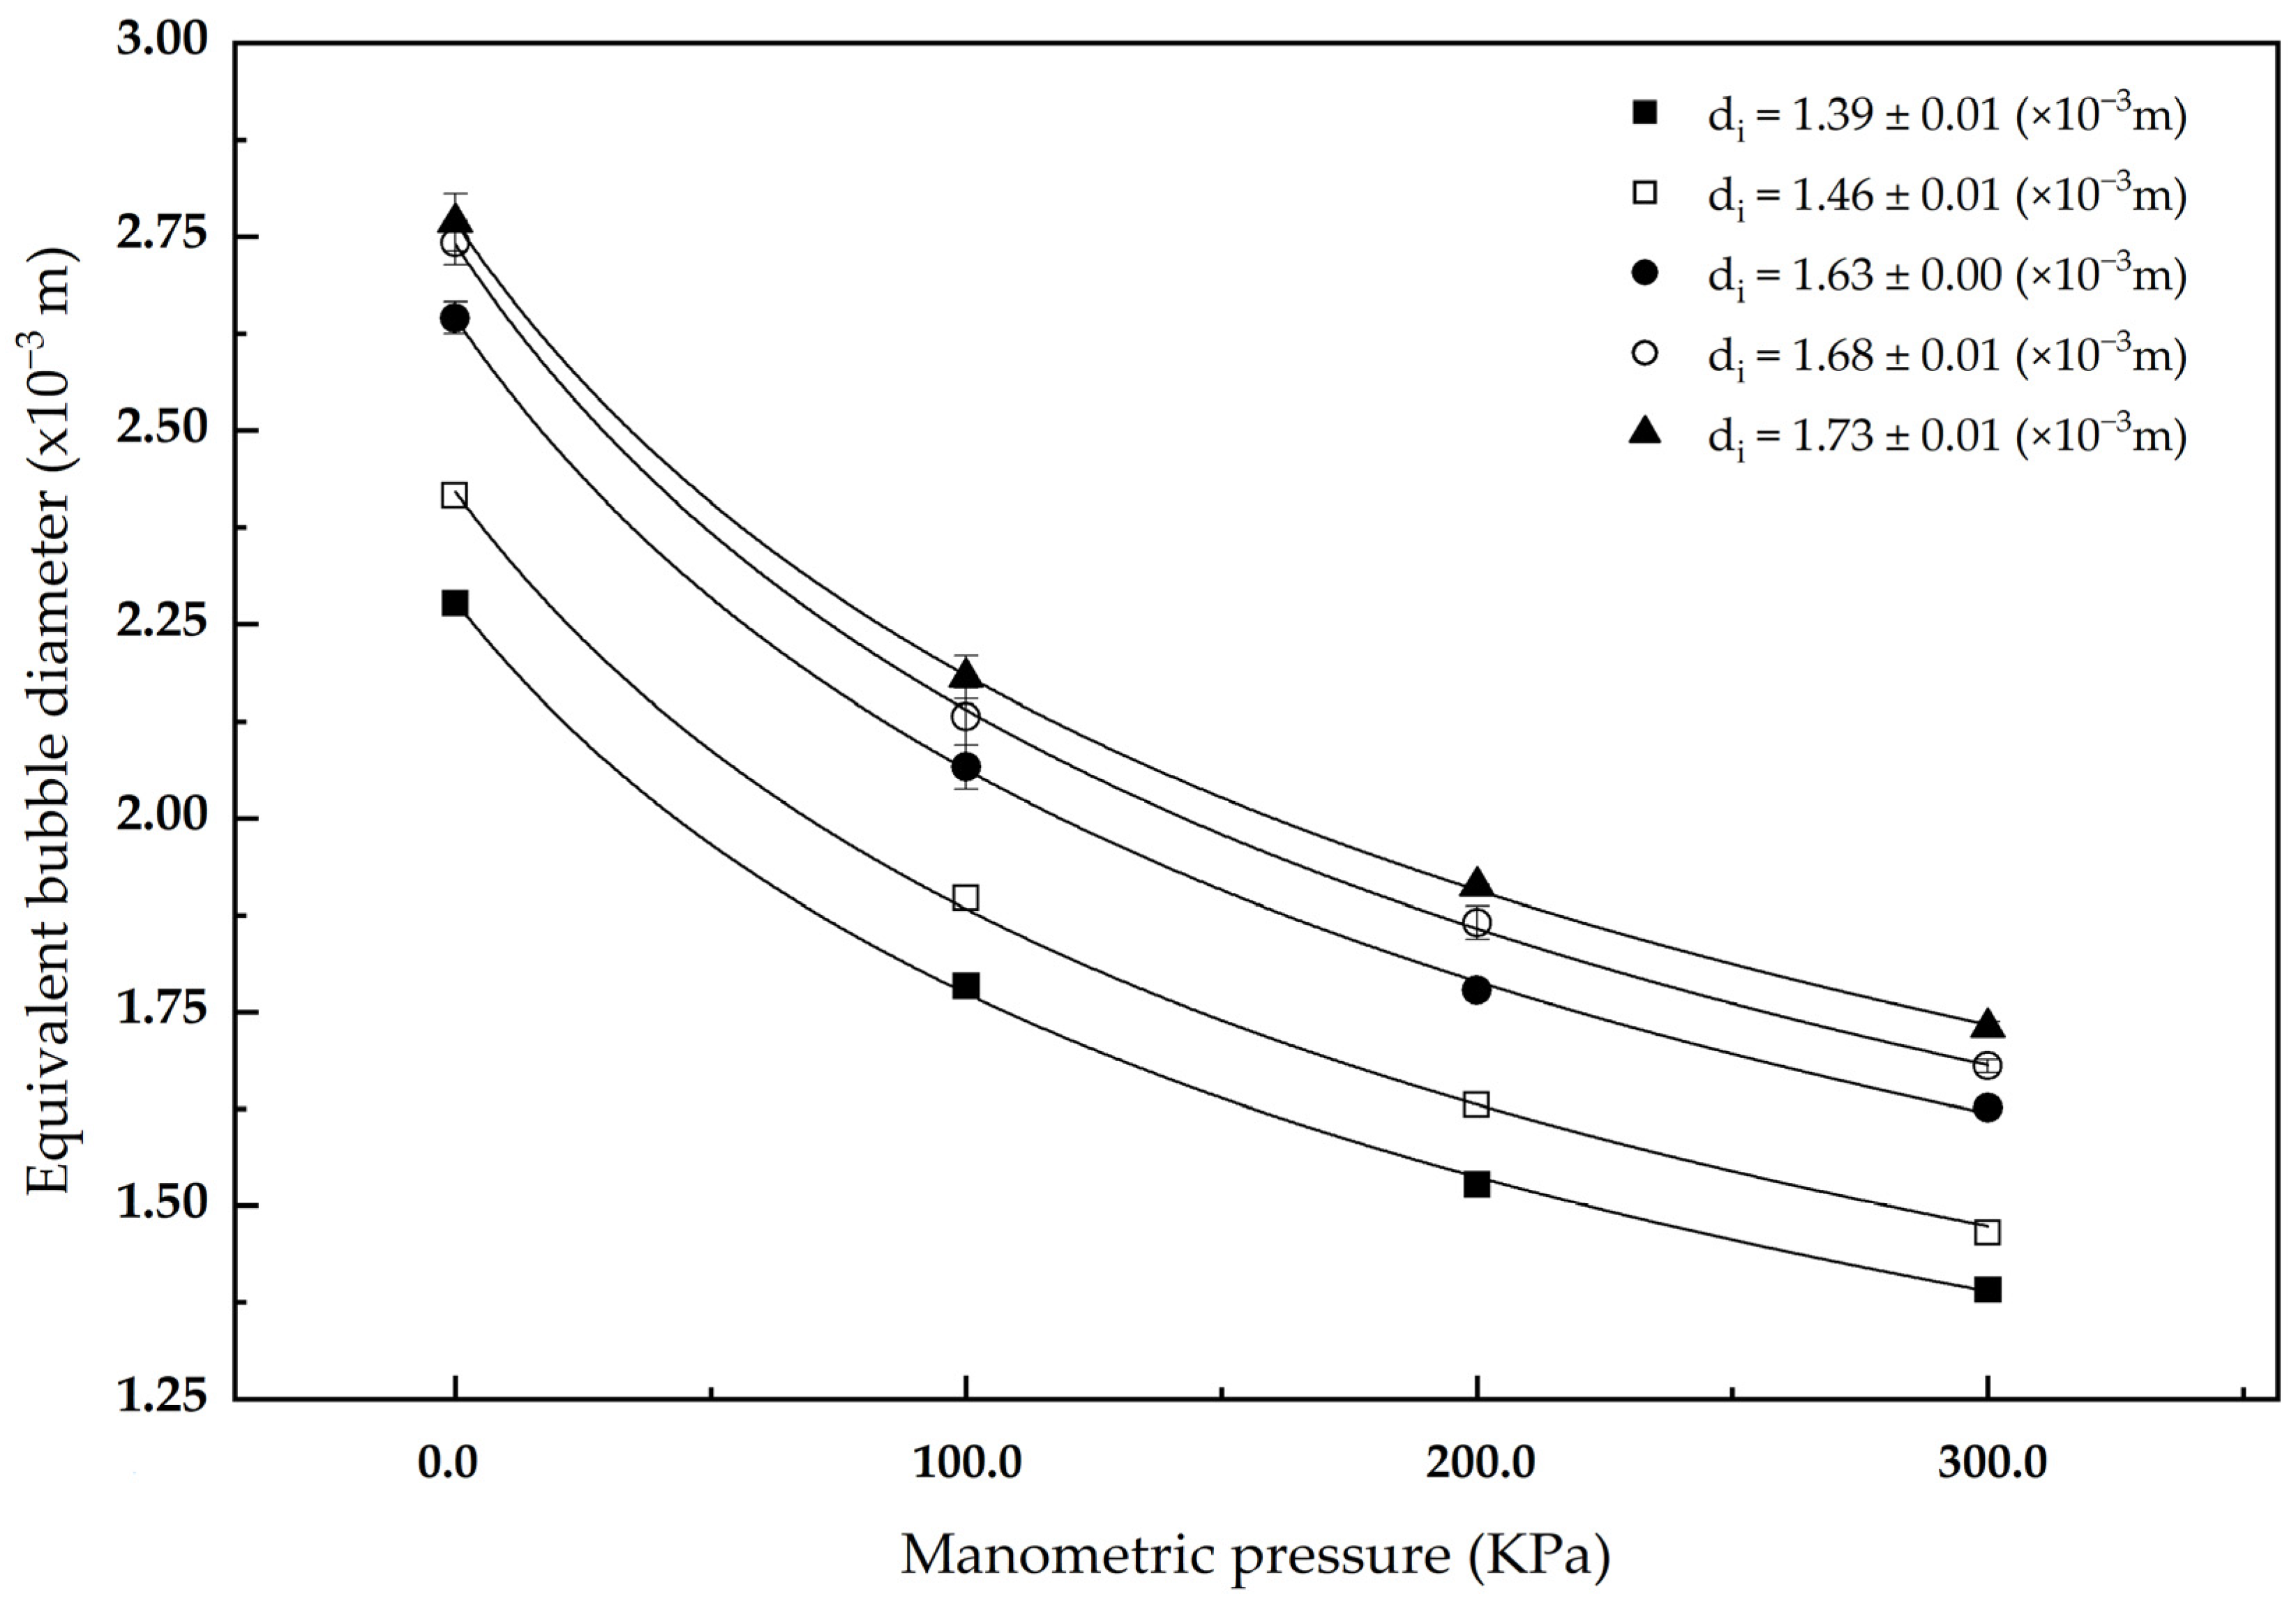
4.2. Effect of Pressure on the Equivalent Bubble Diameter

In the hypothetical flotation column (HFC) displayed in Figure 3, when a bubble ascends from Level-1 (bottom) to Level-4 (top), it experiences a continuous pressure relief that was mimicked in our experiments by conducting bubble diameter measurements during which the highest manometer pressure (300 kPa) was initially applied on the bubble walls and followed by a smooth pressure relief until reaching the manometer pressure of 0 kPa (ambient pressure). According to results depicted in Figure 7 (pure water, γ L G = 73 mN/m) and Figure 8 (solution of Flotigam® EDA, 5 mg/L, γ L G = 57 mN/m), as the manometer pressure decreases from 300 kPa to 0 kPa, the bubble equivalent diameter ( d b e ) increases 60% due to the expansion of the confined air. According to Cho and Laskowski [37], when a bubble is generated under constant air flowrate by an air sparger endowed with a single orifice (as the needle used to generate bubbles in our experiments), bubble size depends only on the internal diameter of the sparger and not on the concentration of surfactant in aqueous solution. In our experiments, we used a needle of internal diameter of 0.8 mm to generate single bubbles, but it was not possible to keep the air flowrate constant. Therefore, for any curve depicted in Figure 7 and Figure 8, the initial values of equivalent bubble diameter ( d i ), measured under a manometer pressure of 300 kPa, were randomly generated, although they lay in the range of 1.50 mm <   d i   < 1.89 mm for pure water and 1.39 mm <   d i   < 1.73 mm for Flotigam® EDA solution (5 mg/L, γ L G =  57 mN/m). Values of d b e measured at 20 °C under manometer pressure varying from 300 kPa to 0 kPa for two bubbles of similar initial diameter d i  1.5 mm in pure water ( γ L G = 73 mNm) versus in the presence of collector solution ( γ L G = 57 mNm) are presented in Table 3. The bubble immersed in collector solution exhibits values of d b e systematically lower than the bubble immersed in pure water. Because bubble diameter results from the balance between the surface tension ( γ L G )   of the aqueous solution versus the existing pressure drop ( Δ P ) across the curved liquid–gas interface, such a difference is justified [5,6].

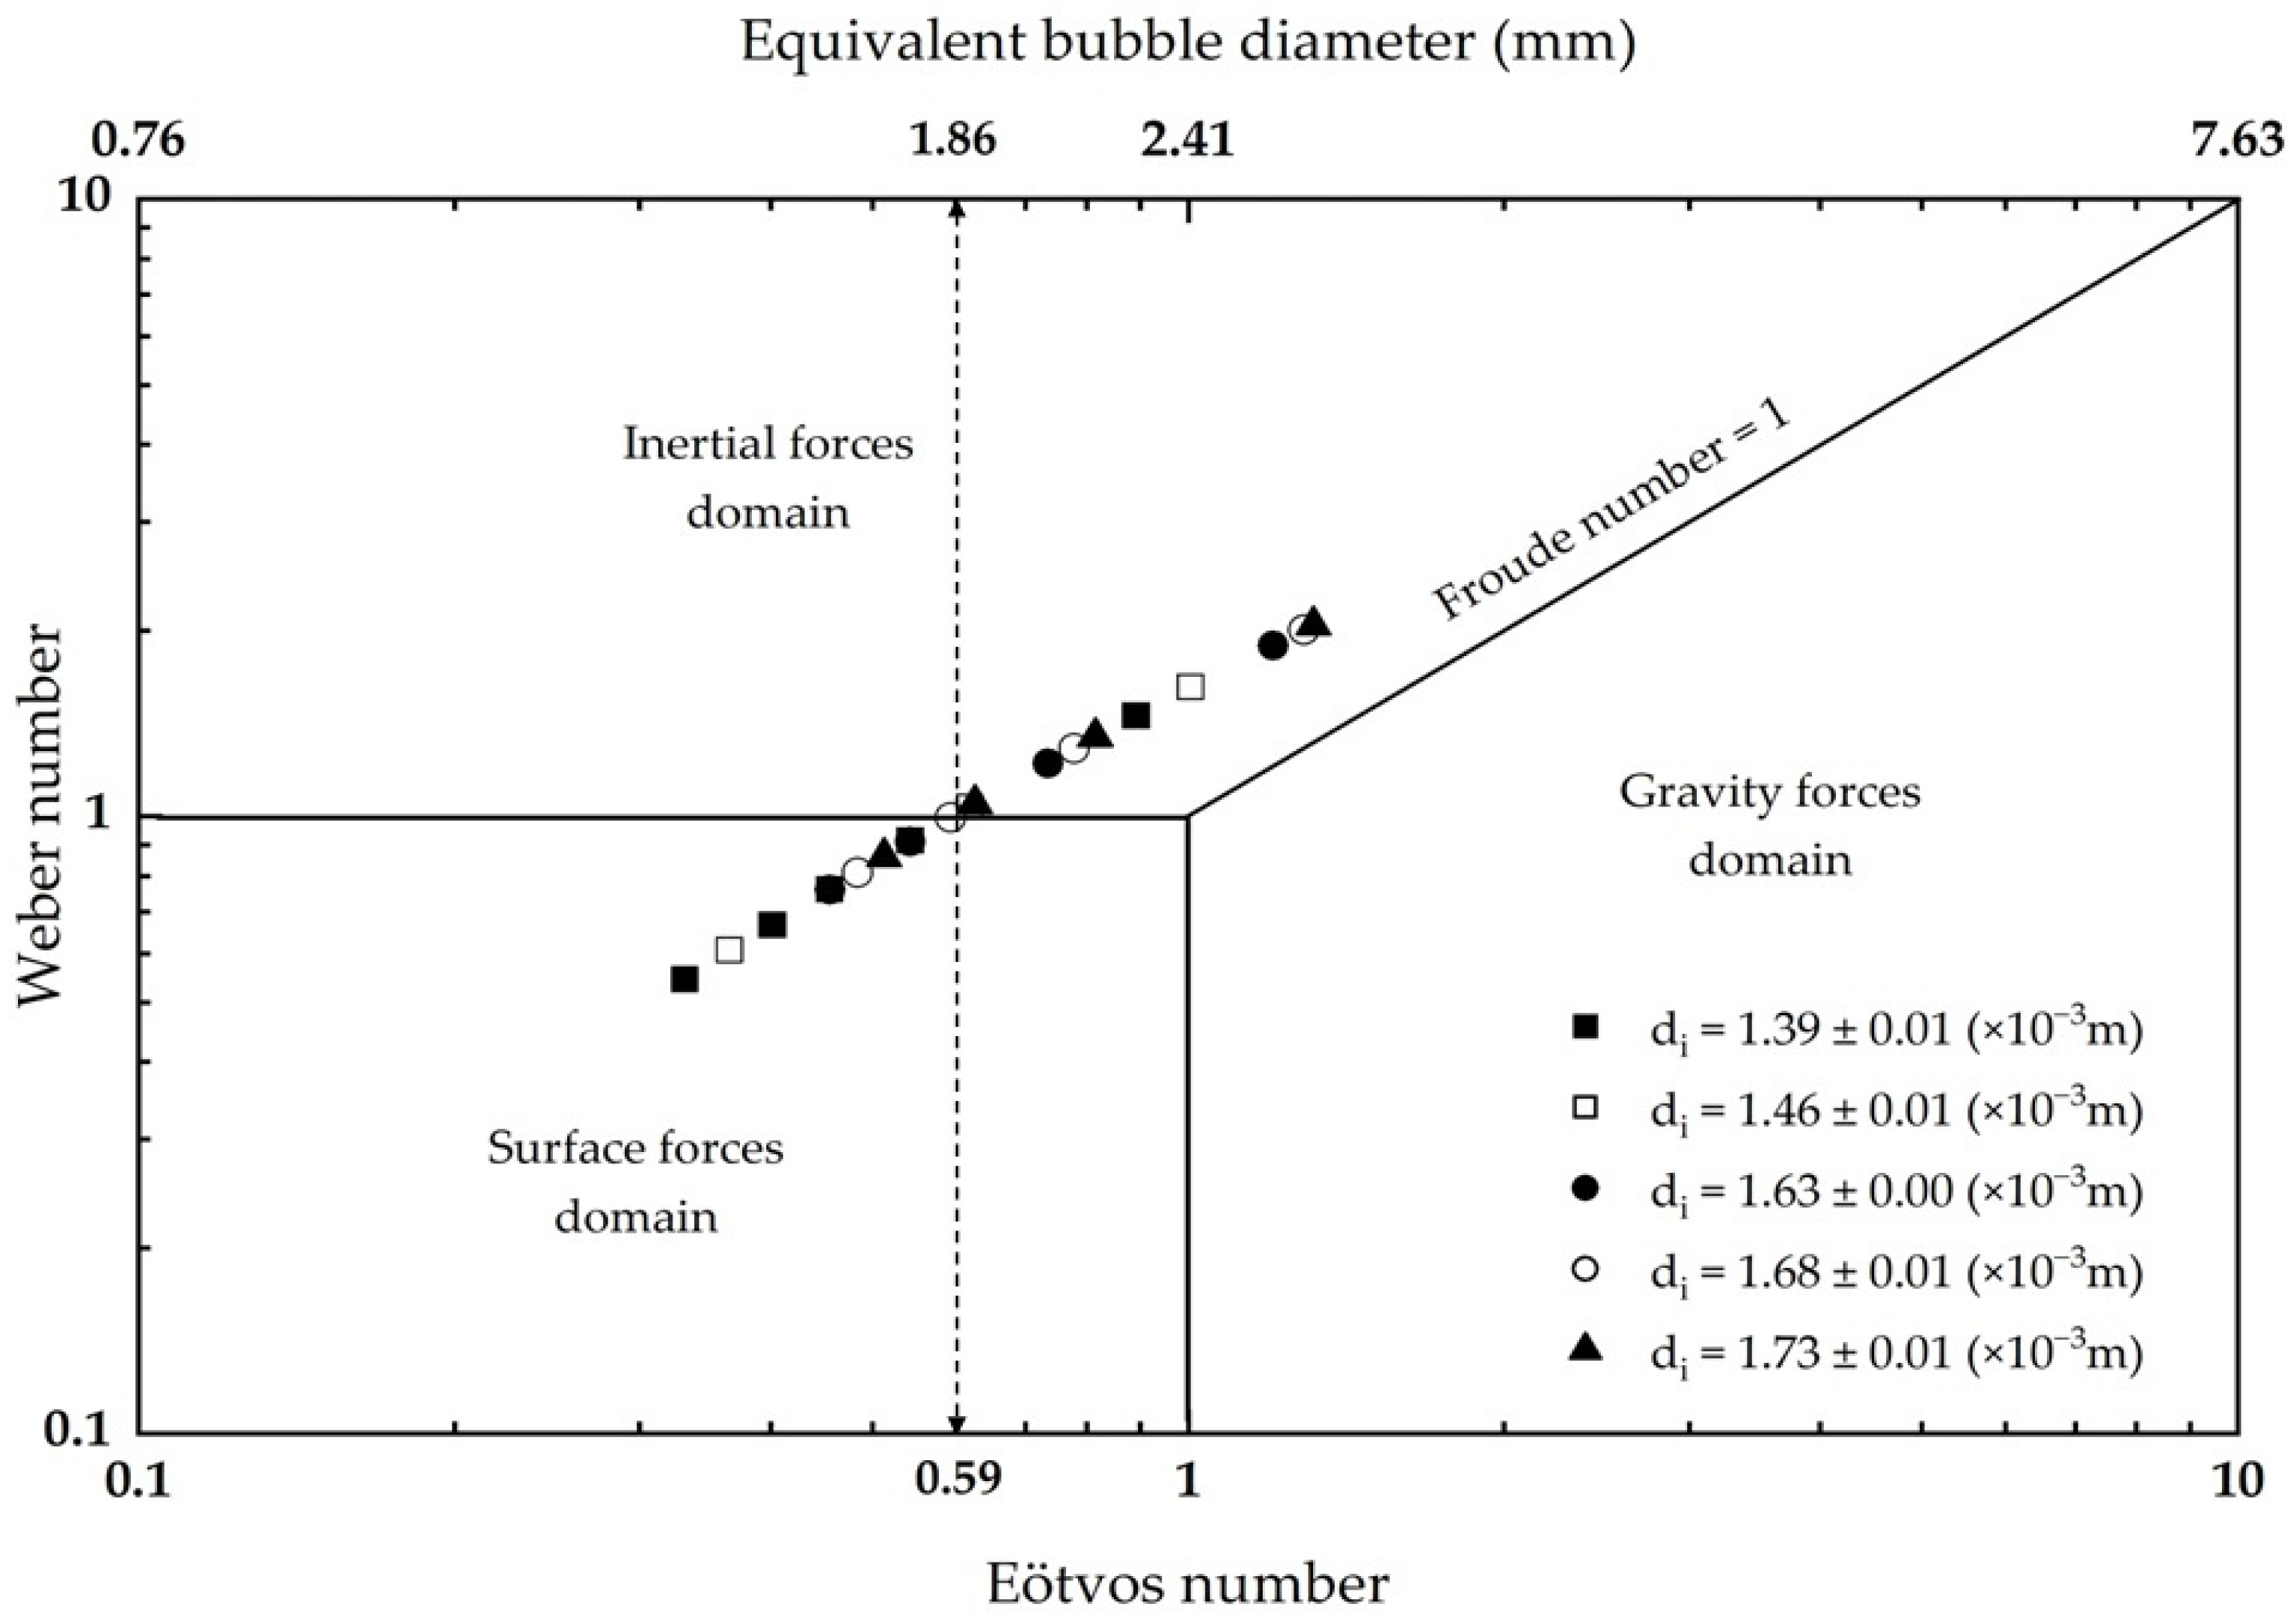
4.3. Effect of Pressure on Bubble Dynamics

As bubbles rise from the bottom to the top of water columns, they undergo a continuous pressure relief which causes an increase in bubble diameter ( d b ) and, consequently, an increase in bubble ascending velocity ( v b ) due to buoyancy. To characterize bubble dynamics, one can use information about d b and its corresponding value of v b to calculate the ratio between gravitational forces and surface forces (bubble Eötvos number = Eo) by using Equation (3), as well as the ratio between inertial forces/surface forces (bubble Weber number = We) by using Equation (4). Figure 9 displays We versus Eo for bubbles that rise in water columns in the presence of miscellaneous surfactants [9,18,19,20,21,22]. It indicates that ascending bubbles leave the domain of surface forces and enter the domain of inertial forces when Eo > 0.7 and We > 1. Under the domain of inertial forces, shear stresses are intensive enough to distort bubble diameter from spherical to ellipsoidal [3,7]. In addition, harsh hydrodynamic conditions may promote particle–bubble detachment [23].
To simulate bubble dynamics in the hypothetical flotation column (HFC) depicted in Figure 3, a diagram composed of We versus Eo was produced (Figure 10) based on data displayed in Table 4, where any value of d b e related to our experimental system corresponds to a value of v b that was assessed by using the exponential model presented in Equation (5), based on results published by Sam and co-authors [9]. As depicted in Figure 10, in the HFC used in this study, a bubble leaves the domain of surface forces (We > 1, Eo > 0.59) as its equivalent diameter ( d b e ) is higher than 1.86 mm, regardless of its initial diameter ( d i ) at Level-1, where bubbles enter the flotation column. On the other hand, any bubble which shows an initial diameter ( d i ) at the bottom of the HFC and rises along its vertical axis to the top will experience an increase in both diameter ( d b e ) and ascending velocity ( v b ), which may be sufficiently high that bubble dynamics are no longer dominated by surface forces, but by inertial forces. This critical condition is reached under a certain Column Critical Height (CCH), which depends on the initial value of  d i , according to Figure 11. Bubbles showing initial diameters ( d i )   of 1.39 mm, 1.46 mm, 1.63 mm, 1.68 mm, and 1.73 mm will no longer be dominated by surface forces (We > 1) when positioned at a column height greater than CCH, which is 15.7 m, 13.5 m, 9.8 m, 7.7 m and 5.9 m, respectively.

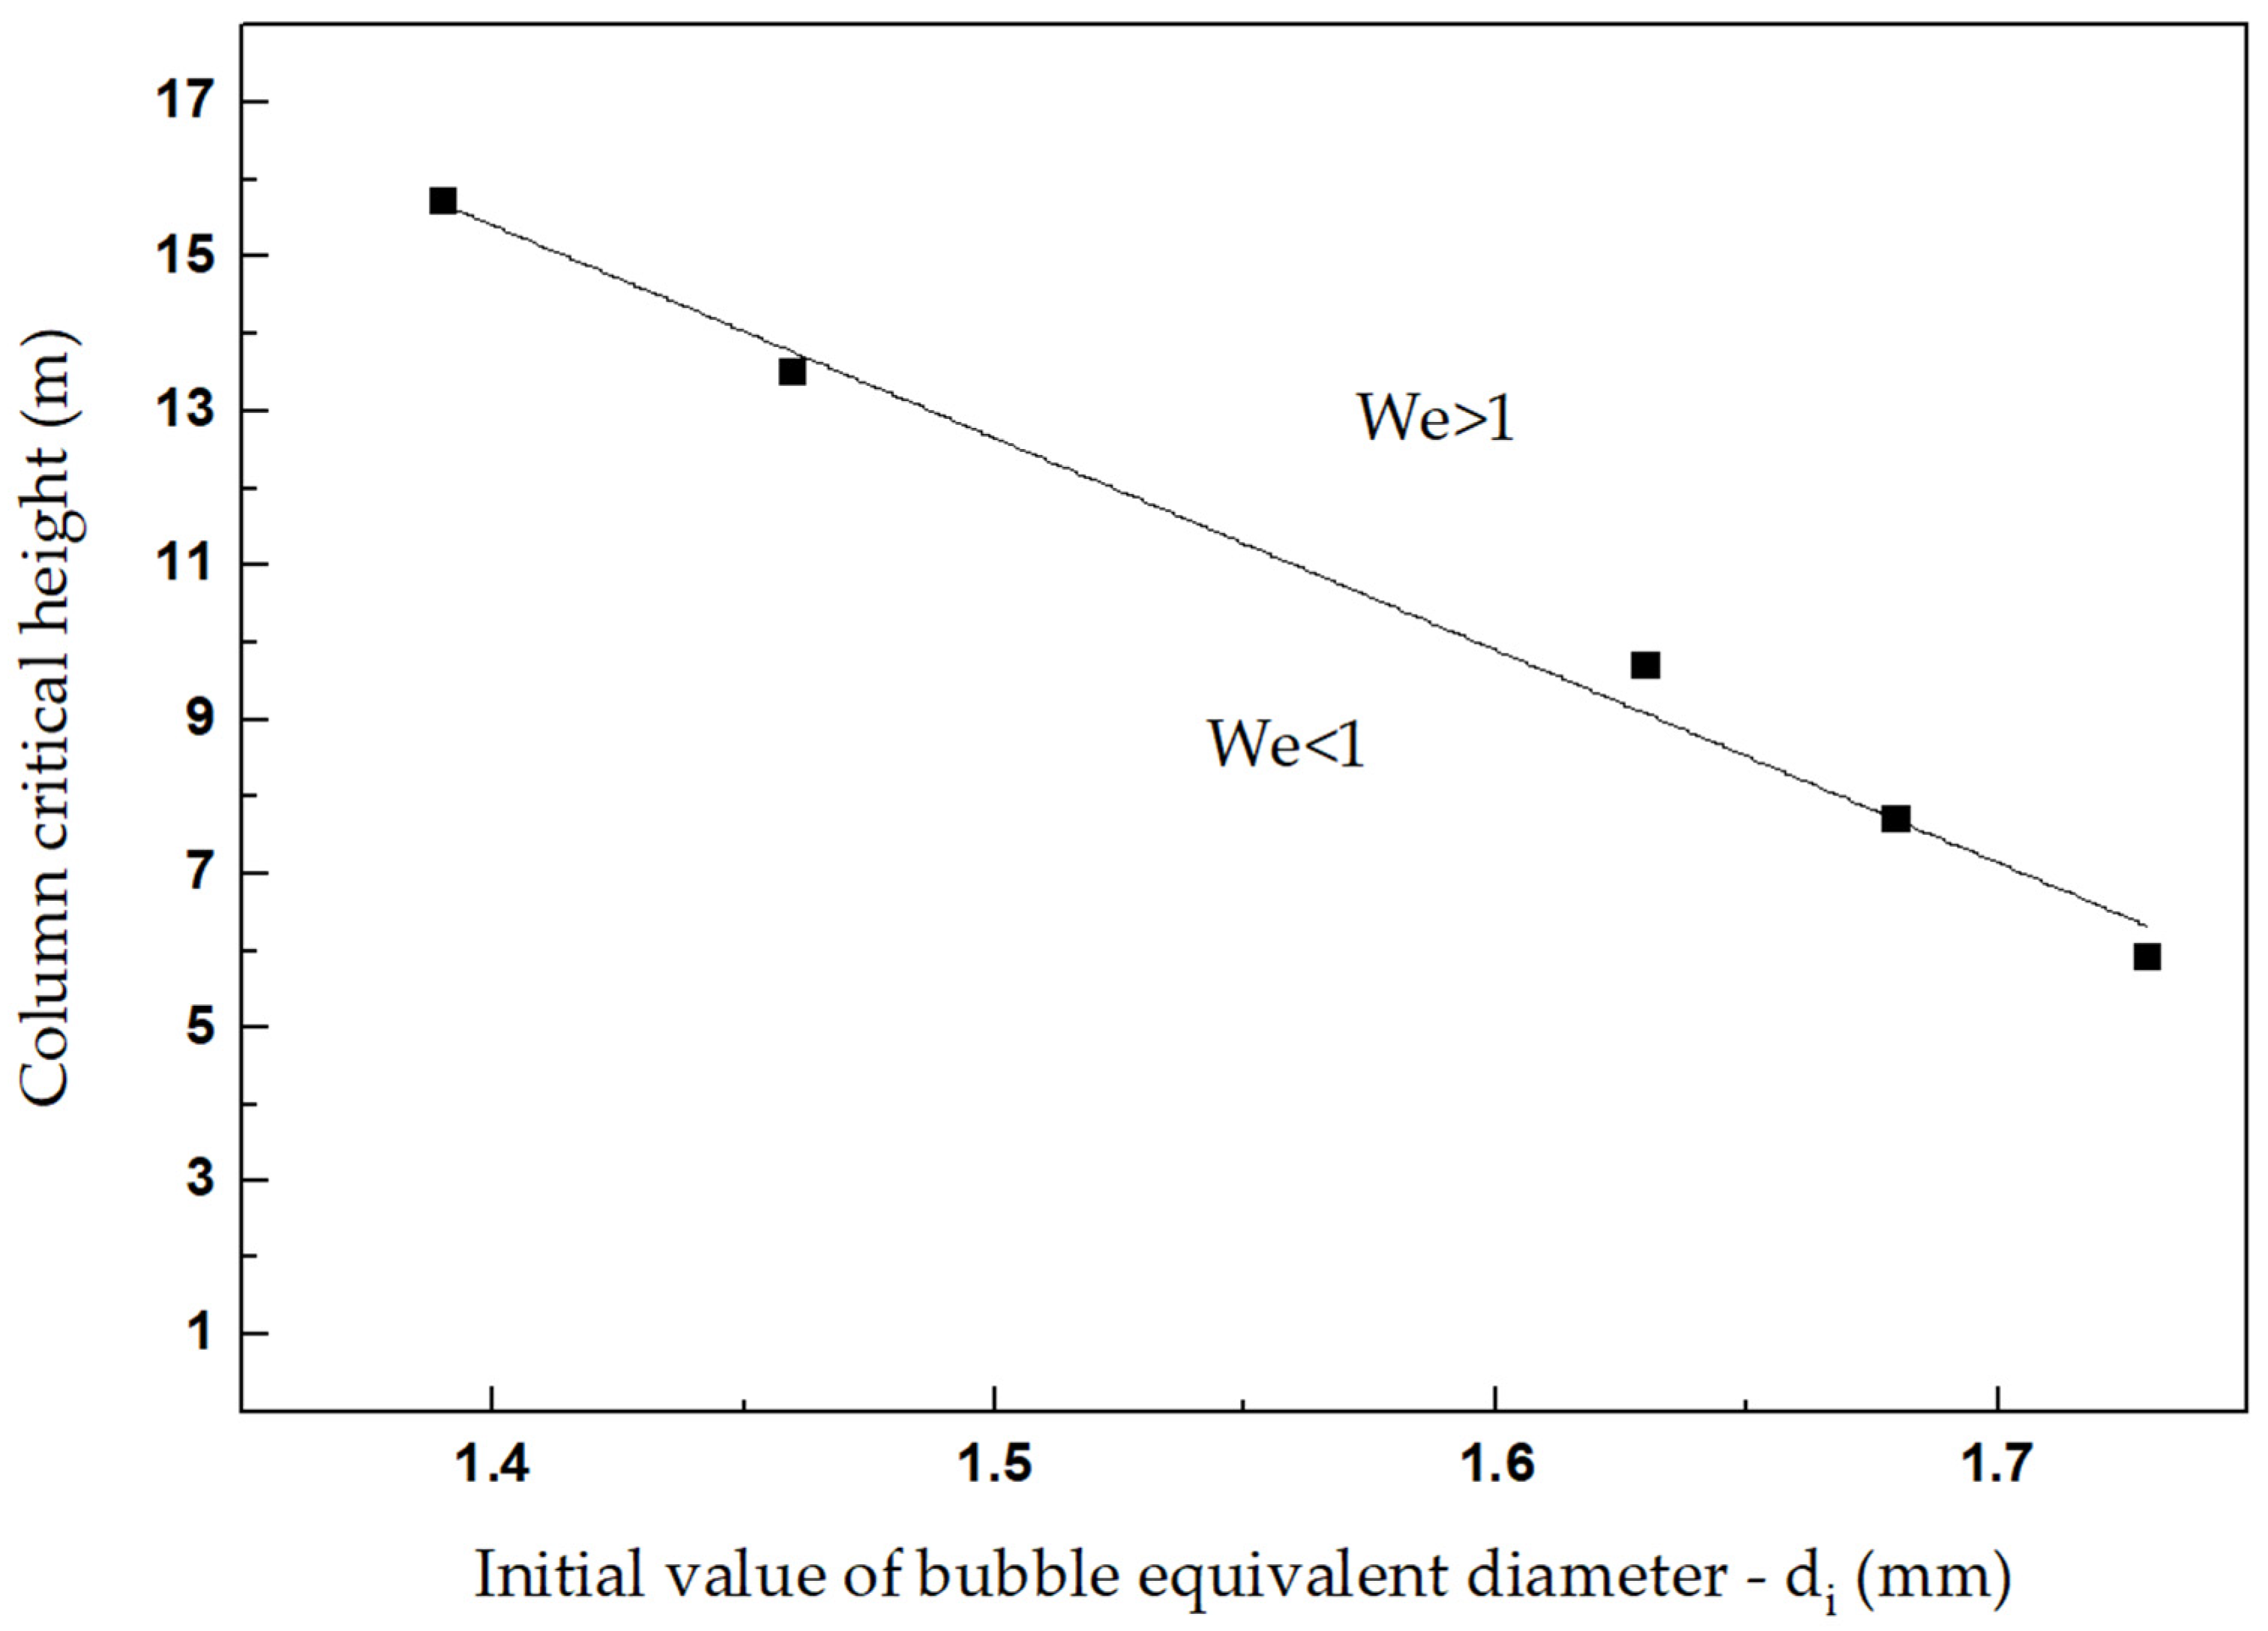
4.4. Insights on the Flotation of Coarse Particles in Columns

It is well known that coarse particles (particle diameter > 100 μ m) exhibit poor flotation performance due to particle–bubble detachment provoked by harsh hydrodynamic conditions (turbulence intensity, mean energy dissipation) that occur within flotation equipment [23,24,33,38,39]. In this regard, at a first thought, columns operating in one-dimensional (axial) plug flow regime would offer a more quiescent environment for coarse particle flotation than mechanical cells because the latter are mixing reactors in which a rotating impeller promotes highly turbulent flow (impeller Reynolds number > 105) [40,41]. This paper contributes towards this comparison by providing experimental evidence that the continuous relief of hydrostatic pressure experienced by ascending bubbles in columns is capable of decreasing the magnitude of contact angle (mainly in the upper parts of the column) and, thus, loosening particle–bubble attachment. Furthermore, values of d b e   and v b typically found in the upper parts of a hypothetical flotation column (at a column’s height greater than CCH) may create hydrodynamic conditions under which inertial forces overwhelm surface forces, a situation that favors particle–bubble detachment [3]. Since coarse particles are likely to detach from bubbles either in mechanical cells or in columns, the former is more suitable to float them because it allows for recurrent slurry recirculation within its whole volume (tanks-in-series), whereas in a flotation column the slurry passes through its volume just once. Therefore, after particle–bubble detachment happens inside flotation cells, particles and bubbles have many more opportunities to collide and reattach in mechanical cells than in columns.

5. Conclusions

After applying a manometer pressure of 300 kPa against air bubbles in contact with a quartz plate (at 20 °C), followed by a smooth and continuous pressure relief passing by 200 kPa and 100 kPa until reaching ambient pressure (manometer pressure = 0 kPa), the results from measurements of contact angle ( θ ) by captive bubble method indicated a decrease in the magnitude of θ from 47° (at 300 kPa) to 16° (at 0 Kpa) in pure water and from 61° (at 300 kPa) to 42° (0 kPa) in the presence of collector solution (Flotigam® EDA, γ L G = 57 mN/m). Likewise, bubble equivalent diameter ( d b e ) experienced an increase in 60% as pressure decreased from 300 kPa to 0 kPa, regardless of the aqueous medium used in the experiments (pure water versus surfactant solution). The range of manometer pressure adopted in the experiments (0 kPa–300 kPa) attempted to mimic what may happen within a hypothetical flotation column (HFC) that processes iron ore slurry via cationic reverse flotation of quartz. Along the vertical axis of the HFC, from its bottom ( P h y d 300 kPa) to the top ( P h y d 0 kPa), a continuous relief of P h y d occurs naturally, allowing bubbles to expand. Such an increase in d b e promotes an increase in the bubble ascending velocity ( v b ) due to buoyancy. Values of v b (assessed from the literature) and d b e (measured under 0 kPa to 300 kPa) were used to calculate the Eötvos number (Eo) and the Weber number (We) aiming at characterizing bubble hydrodynamics in the HFC. It was found that inertial forces dominate over surface forces (We > 1) as d b > 1.86 mm. This value is associated with a critical value of column’s height (CCH) in which inertial forces dominate surface forces. According to our results, bubbles showing initial diameter ( d i )   of 1.39 mm, 1.46 mm, 1.63 mm, 1.68 mm and 1.73 mm will no longer be dominated by surface forces (We > 1) when positioned at a column height greater than CCH values of 15.7 m, 13.5 m, 9.8 m, 7.7 m and 5.9 m, respectively. Therefore, in the upper parts of the HFC assessed in this study, a harmful combination of lower contact angle coupled with harsher hydrodynamic conditions (We > 1) may promote the detachment of coarse particles from bubbles, even though, at first glance, columns do not work under the high levels of turbulence typically found in mechanical cells.

Author Contributions

A.V.O. and J.T.G.J.: experimental work, data curation and writing original draft; T.C.S.P. and L.d.S.L.F.: conceptualization, funding acquisition and supervision. All authors have read and agreed to the published version of the manuscript.

Funding

This research received funding from Vale S.A., Vale Institute of Technology (ITV) and the Brazilian government—CAPES.

Data Availability Statement

Acknowledgments

The authors are grateful to the mining company Vale SA and Vale Institute of Technology (ITV) for providing equipment and and M.Sc. scholarship (grant FUSP-3153).

Conflicts of Interest

The authors declare no conflict of interest.

References

  1. Finch, J.A.; Dobby, G.S. Column Flotation; Pergamon Press: New York, NY, USA, 1990; p. 180. [Google Scholar]
  2. Schulze, H.J. New theoretical and experimental investigations on stability of bubble/particle aggregates in flotation: A theory on the upper particle size of floatability. Int. J. Miner. Process. 1977, 4, 241–259. [Google Scholar] [CrossRef]
  3. Schulze, H.J. Physico-Chemical Elementary Processes in Flotation; Elsevier: Amsterdam, The Netherlands, 1984; Volume 152, p. 320. [Google Scholar]
  4. Clift, R.; Grace, J.R.; Weber, M.E. Bubbles, Drops and Particles; Academic Press: New York, NY, USA, 1978; p. 380. [Google Scholar]
  5. Leja, J. Surface Chemistry of Froth Flotation; Plenum Press: New York, NY, USA, 1982; p. 758. [Google Scholar]
  6. Adamson, A.W. Physical Chemistry of Surfaces; Interscience Publishers: New York, NY, USA, 1964; p. 629. [Google Scholar]
  7. Liu, L.; Yan, H.; Zhao, G.; Zhuang, J. Experimental studies on the terminal velocity of air bubbles in water and glycerol aqueous solution. Exp. Therm. Fluid Sci. 2016, 78, 254–265. [Google Scholar] [CrossRef]
  8. Rodrigue, D. Drag coefficient-Reynolds number transition for gas bubbles rising steadily in viscous fluids. Can. J. Chem. Eng. 2001, 79, 119–123. [Google Scholar] [CrossRef]
  9. Sam, A.; Gomez, C.O.; Finch, J.A. Axial velocity profiles of single bubbles in water/frother solutions. Int. J. Miner. Process. 1996, 47, 177–196. [Google Scholar] [CrossRef]
  10. Datta, R.L.; Napier, D.H.; Newitt, D.M. The properties and behavior of gas bubbles formed at a circular orifice. Trans. Inst. Chem. Eng. 1950, 14, 3–16. [Google Scholar]
  11. Peebles, F.N.; Garber, H.J. Studies on the motion of gas bubbles in liquids. Chem. Eng. Prog. 1953, 49, 88. [Google Scholar]
  12. Houghton, G.; Ritchie, P.D.; Thomson, J.A. Velocity of rise of air bubbles in sea-water, and their types of motion. Chem. Eng. Sci. 1957, 7, 111–112. [Google Scholar] [CrossRef]
  13. Davenport, W.G.; Richardson, F.D.; Bradshaw, A.V. Spherical cap bubbles in low density liquids. Chem. Eng. Sci. 1967, 22, 1221–1235. [Google Scholar] [CrossRef]
  14. Calderbank, P.H.; Johnson, D.S.L.; Loudon, J. Mechanics and mass transfer of single bubbles in free rise through some Newtonian and non-Newtonian liquids. Chem. Eng. Sci. 1970, 25, 235–256. [Google Scholar] [CrossRef]
  15. Govier, G.W.; Aziz, K. (Eds.) Vertical flow of gas-liquid and liquid-liquid mixtures. In The Flow of Complex Mixtures in Pipes; Van Nostrand-Reinhold Company: New York, NY, USA, 1972; pp. 362–387. [Google Scholar]
  16. Lakshmanan, P.; Ehrhard, P. Marangoni effects caused by contaminants adsorbed on bubble surfaces. J. Fluid Mech. 2010, 647, 143–161. [Google Scholar] [CrossRef]
  17. Peters, F.; Els, C. An experimental study on slow and fast bubbles in tap water. Chem. Eng. Sci. 2012, 82, 194–199. [Google Scholar] [CrossRef]
  18. Glembotskii, V.A.; Klassen, V.I.; Plaksin, I.N. Flotation; Primary Sources: New York, NY, USA, 1972; p. 620. [Google Scholar]
  19. Scheid, C.M.; Puget, F.P.; Halasz, M.R.T.; Massarani, G. Fluid dynamics of bubbles in liquid. Braz. J. Chem. Eng. 1999, 16, 351–358. [Google Scholar] [CrossRef]
  20. Zhang, Y.; Finch, J.A. Single bubble terminal velocity-experiment and modelling. In Advances in Flotation Technology; Parekh, B.K., Miller, J.D., Eds.; Society of Mining, Metallurgy and Exploration, Inc.: Littleton, CO, USA, 1999; pp. 83–94. [Google Scholar]
  21. Tan, Y.H.; Rafiei, A.A.; Elmahdy, A.; Finch, J.A. Bubble size, gas holdup and bubble velocity profile of some alcohols and commercial frothers. Int. J. Miner. Process. 2013, 119, 1–5. [Google Scholar] [CrossRef]
  22. Jacomini, H.H.; Batista, J.N.; Béttega, R. Análise do diâmetro e da velocidade de bolhas de ar sob diferentes tensões superficiais: Estudo experimental e simulação numérica cfd. J. Eng. Exact Sci. 2020, 6, 0221–0227. [Google Scholar] [CrossRef]
  23. Ralston, J.; Fornasiero, D.; Hayes, R. Bubble-particle attachment and detachment in flotation. Int. J. Miner. Process. 1999, 56, 133–164. [Google Scholar] [CrossRef]
  24. Gontijo, C.d.F.; Fornasiero, D.; Ralston, J. The limits of fine and coarse particle flotation. Can. J. Chem. Eng. 2007, 85, 739–747. [Google Scholar] [CrossRef]
  25. Chau, T.T.; Bruckard, W.J.; Koh, P.T.L.; Nguyen, A.V. A review of factors that affect contact angle and implications for flotation practice. Adv. Colloid Interface Sci. 2009, 150, 106–115. [Google Scholar] [CrossRef] [PubMed]
  26. Neumann, A.W.; Good, R.J. Techniques of measuring contact angles. In Surface and Colloid Science; Good, R.J., Stromberg, R.R., Eds.; Plenum Press: New York, NY, USA, 1979; pp. 31–91. [Google Scholar]
  27. Yarar, B.; Kaoma, J. Estimation of the critical surface tension of wetting of hydrophobic solids by flotation. Colloids Surf. 1984, 11, 429–436. [Google Scholar] [CrossRef]
  28. Ozcan, O. Classification of minerals according to their critical surface tension of wetting values. Int. J. Miner. Process. 1992, 34, 191–204. [Google Scholar] [CrossRef]
  29. Kundt, A. Physik. In International Critical Tables; McGraw-Hill Book Co., Inc.: New York, NY, USA, 1928; Volume 4, p. 475. [Google Scholar]
  30. Rice, O.K. The effect of Pressure on Surface Tension. J. Chem. Phys. 1947, 15, 333–335. [Google Scholar] [CrossRef]
  31. McCaferry, F.G. Measurement of the Interfacial Tensions and Contact Angle at High Temperature and Pressure. J. Can. Pet. Technol. 1972, 11, 26–32. [Google Scholar] [CrossRef]
  32. Wang, W.; Gupta, A. Investigation of the Effect of Temperature and Pressure on Wettability Using Modified Pendant Drop Method. In Proceedings of the SPE Annual Technical Conference and Exhibition, Dallas, TX, USA, 22–25 October 1995; pp. 117–126. [Google Scholar]
  33. Crawford, R.; Ralston, J. The influence of particle size and contact angle in mineral flotation. Int. J. Miner. Process. 1988, 23, 1–24. [Google Scholar] [CrossRef]
  34. Karamanev, D.; Dewsbury, K.; Margaritis, A. Comments on the free rise of gas bubbles in non-Newtonian liquids. Chem. Eng. Sci. 2005, 60, 4655–4657. [Google Scholar] [CrossRef]
  35. Tohry, A.; Dehghan, R.; Oliveira, A.V.; Chelgani, S.C.; Leal Filho, L.S. Enhanced Washburn method (EWM): A comparative study for the contact angle measurement of powders. Adv. Powder Technol. 2020, 31, 4665–4671. [Google Scholar] [CrossRef]
  36. Gontijo, C.F. Adsorção de amina em quartzo para flotação reversa de minério de ferro. In Proceedings of the 41° Seminário de Redução e 12° Seminário de Minério de Ferro da ABM (Associação Brasileira de Metalurgia), Belo Horizonte, Brazil, 2011. (In Portuguese). [Google Scholar]
  37. Cho, Y.S.; Laskowski, J.S. Effect of flotation frothers on bubble size and foam stability. Int. J. Miner. Process. 2002, 64, 69–80. [Google Scholar] [CrossRef] [Green Version]
  38. Cheng, T.W.; Holtham, P.N. The particle detachment process in flotation. Miner. Eng. 1995, 8, 883–891. [Google Scholar] [CrossRef]
  39. Leal Filho, L.S.; Rodrigues, W.J.; Lima, O.A.; Barros, L.A.F. The role of hydrodynamics in coarse apatite flotation (chapter 3). In Beneficiation of Phosphates—Technology and Sustainability; Zhang, P., El-Shall, H., Miller, J., Stana, R., Eds.; American Society of Mining, Metallurgy and Exploration: Littleton, CO, USA, 2006; pp. 25–36. [Google Scholar]
  40. Rodrigues, W.J.; Leal Filho, L.S.; Masini, E.A. Hydrodynamic dimensionless parameters and their influence on flotation performance of coarse particles. Miner. Eng. 2001, 14, 1047–1054. [Google Scholar] [CrossRef]
  41. Nagata, S. Mixing: Principles and Applications; John Wiley & Sons: New York, NY, USA, 1975; pp. 1–65. [Google Scholar]
Figure 1. (a) Illustration of contact angle; (b) water advancing contact angle ( θ a ), water receding contact angle ( θ r ), and equilibrium contact angle ( θ e q ) versus time (results generated by the authors of this paper).
Minerals 13 00417 g001
Figure 2. Illustration of a spherical particle located at the liquid–gas interface, emphasizing the contact angle ( θ ), the central angle of the particle (ω) and a vector representing the surface tension ( γ L G ) of the liquid (adapted from [24]).
Minerals 13 00417 g002
Figure 3. Schematics of a hypothetical column used to concentrate iron ore via a cationic reverse flotation of quartz.
Minerals 13 00417 g003
Figure 4. Schematics on how the tensiometer DSA100HP works.
Minerals 13 00417 g004
Figure 5. Relationship between the apparent bubble diameter (dapp) and equivalent bubble diameter (de) (adapted from Karamanev [34]).
Minerals 13 00417 g005
Figure 6. The influence of pressure on the magnitude of contact angle at 20 °C.
Minerals 13 00417 g006
Figure 7. The influence of manometer pressure on bubble equivalent diameter in the presence of pure water at 20 °C.
Minerals 13 00417 g007
Figure 8. The influence of manometer pressure on bubble equivalent diameter in the presence of collector solution (Flotigam® EDA, 5 mg/L, γ L G = 57 mN/m) at 20 °C.
Minerals 13 00417 g008
Figure 9. Weber number versus Eötvos number for bubbles rising in solutions containing surfactants [9,18,19,20,21,22].
Minerals 13 00417 g009
Figure 10. Simulation of bubble dynamics in a hypothetical flotation column that processes iron ore via reverse cationic flotation of quartz (specific gravity of the aerated slurry = 1430 kg/m3, gas holdup = 10%, solids concentration = 50%, surface tension of flotation solution = 57 N/m).
Minerals 13 00417 g010
Figure 11. Column critical height (CCH) versus initial value of bubble equivalent diameter ( d i ).
Minerals 13 00417 g011
Table 1. Static load at four levels along the vertical axis of a hypothetical flotation column (HFC) that concentrates iron ore ( P a t m  93 kPa).
MarksDistance (x) from the Base Line (m)Height (z) of the Slurry Column Above(m)Static Load (kPa)
P h y d P e
Level-10.0021.40300393
Level-27.1314.26200293
Level-314.267.13100193
Level-421.400.00093
Table 2. Chemical composition of a quartz sample determined by XRF (elements with content > 0.01%).
ElementsSiO2Fe2O3L. I. (*)TiO2Cr2O3ZrO2MnOTotal
Content98.8%0.90%0.13%0.03%0.02%0.01%0.01%99.9%
(*) Loss by ignition.
Table 3. The influence of surface tension ( γ L G ) of the liquid phase on bubble equivalent diameter ( d b e ) for bubbles exhibiting d i   1.5 mm.
Surface Tension (mN/m)Manometer Pressure (kPa)
0100200300
732.46 ± 0.051.94 ± 0.001.68 ± 0.001.50 ± 0.01
572.42 ± 0.011.90 ± 0.001.63 ± 0.011.46 ± 0.01
Table 4. Hydrostatic pressure ( P h y d ) applied to bubbles, equivalent bubble diameter ( d b e ), bubble ascending velocity ( v b ), bubble Eötvos number (Eo) and bubble Weber number (We) related to a hypothetical column which processes iron ore slurry via reverse cationic flotation of quartz.
Manometer Pressure (kPa)Equivalent Bubble Diameter (*)
(mm)
Bubble Ascending Velocity (**)
(cm/s)
Eo
(#)
We
(+)
3001.3914.960.780.47
2001.5315.780.950.57
1001.7817.121.310.78
02.2819.102.081.28
3001.4615.410.870.52
2001.6316.341.090.65
1001.9017.631.480.89
02.4219.552.311.44
3001.6316.321.090.65
2001.7817.091.300.78
1002.0718.341.741.05
02.6520.192.701.72
3001.6816.601.160.69
2001.8617.491.420.85
1002.1318.591.841.11
02.7420.442.861.84
3001.7316.861.230.73
2001.9117.701.500.90
1002.1818.771.921.17
02.7720.502.911.88
(*) Reported in Figure 8; (**) calculated by Equation (7); (#) calculated by Equation (3); (+) calculated by Equation (4).
Disclaimer/Publisher’s Note: The statements, opinions and data contained in all publications are solely those of the individual author(s) and contributor(s) and not of MDPI and/or the editor(s). MDPI and/or the editor(s) disclaim responsibility for any injury to people or property resulting from any ideas, methods, instructions or products referred to in the content.

