Article

Origin of Disseminated Gold-Sulfide Mineralization from Proximal Alteration in Orogenic Gold Deposits in the Central Sector of the Yana–Kolyma Metallogenic Belt, NE Russia

by
Valery Yurievich Fridovsky
1,*,
Lena Idenenovna Polufuntikova
1,2 and
Maxim Vasilievich Kudrin
1
1
Diamond and Precious Metal Geology Institute, SB RAS, 677000 Yakutsk, Russia
2
Faculty of Geology and Survey, M.K. Ammosov North-Eastern Federal University, 677000 Yakutsk, Russia
*
Author to whom correspondence should be addressed.
Minerals 2023, 13(3), 394; https://doi.org/10.3390/min13030394
Submission received: 18 January 2023 / Revised: 1 March 2023 / Accepted: 7 March 2023 / Published: 11 March 2023
(This article belongs to the Special Issue Native Gold as a Specific Indicator Mineral for Gold Deposits)

Abstract

:
The Yana–Kolyma metallogenic belt, NE Russia, is a world-class gold belt with resources numbering ~8300 tons of gold. The belt is localized in the central part of the Verkhoyansk–Kolyma orogen, formed by a collage of diverse terranes. The Tithonian-to-Early-Cretaceous orogenic gold deposits are hosted in a sequence of Permian–Triassic and Jurassic clastic rocks and altered Late Jurassic andesite, dacite, granodiorite, trachyandesite, and trachybasalt dykes. High-fineness gold (800–900‰) in quartz veins and invisible gold in disseminated arsenian pyrite-3 (Py3) and arsenopyrite-1 (Apy1) are present in ores. Here, we present new data about microtextures; the chemical composition and stable sulfur isotopes of auriferous pyrite-3 and arsenopyrite-1 from proximal alterations in sediment-hosted (Malo–Taryn, Badran, Khangalas); and intrusion-hosted (V’yun, Shumniy) orogenic Au deposits in the central sector of the Yana–Kolyma metallogenic belt to better constrain the ore-forming process and tracking their evolution. Detailed petrography defined the following generations of pyrite: syn-sedimentary/diagenetic Py1, metamorphic Py2 and hydrothermal Py3, and Apy1. Hydrothermal Py3 and Apy1 are localized in the proximal pyrite–arsenopyrite–sericite–carbonate–quartz alteration in ore zones and make a major contribution to the economic value of the veinlet-disseminated mineralization with “invisible” gold in the orogenic deposits of the Yana–Kolyma metallogenic belt. Electron microprobe analysis (EMPA) of Py3 in both types of deposits shows concentrations of As (up to 3.16 wt%), Co, Ni, Cu, Sb, and Pb. Py3 in intrusion-hosted orogenic gold deposits reveals elevated concentrations of Co (up to 0.87 wt%), Ni (up to 3.52 wt%), and Cu (up to 2.31 wt%). The identified negative correlation between S and As indicates an isomorphic substitution of sulfur by As1−. Py3 from igneous rocks is characterized by a high degree of correlation for the pairs Fe2+→ Co2+ and Fe2+→ Ni2+. For hydrothermal Apy1, Co (up to 0.27 wt%), Ni (up to 0.30 wt%), Cu (up to 0.04 wt%), and Sb (up to 0.76 wt%) are typomorphic. According to atomic absorption spectrometry, the concentration of Au in Py3 reaches 159.5 ppm; in Apy1, it reaches 168.5 ppm. The determination of the precise site of the invisible gold within Py3 and Apy1 showed the predominance of solid-solution Au+ in the crystal lattice. The values of δ34S in Py3 and Apy1 (from −6.4 to +5.6‰, mean value of about +0.6‰), both from sediment-hosted and from intrusion-hosted deposits, display a relatively narrow range and are characteristic of the hydrothermal ore stage. Our analytical results showed no systematic differences between the chemical and stable sulfur isotope compositions of both auriferous pyrite-3 and arsenopyrite-1 from the proximal alteration in sediment-hosted (Malo–Taryn, Badran, Khangalas) and intrusion-hosted (V’yun, Shumniy) orogenic Au deposits, indicating that the primary source of sulfur, gold, and mineralizing fluids was likely from subcrustal and metamorphic systems in the Late-Jurassic-to-Early-Cretaceous Verkhoyansk–Kolyma orogen.

1. Introduction

Orogenic gold deposits (OGDs) are an economically important source of gold in the world. According to estimates [1], the relative significance of OGDs (including intrusion-related OGDs) in past production and known reserves and resources is 32%. In addition, Goldfarb R.J. et al. [2] indicated that most (45%) of gold deposits worldwide containing more than 1 Moz of gold belong to orogenic gold deposits, much more than other types of deposits.
The Yana–Kolyma metallogenic belt (YKMB), NE Russia, is known for its large bulk-tonnage OGD at Natalka (1500 t Au), Degdekan (400 t Au), Pavlik (169 t Au), Drazhnoe (50 t Au), and other sites [3,4,5,6]. Similar Paleozoic-to-Mesozoic major deposits of this type are also known in Russia (Sukhoi Log), Uzbekistan (Muruntau), Kyrgyzstan (Kumtor), Australia (Bendigo, Ballarat), USA (Juneau, Treadwell), China (Jiaodong), and in other countries [5,6,7,8]. The endowment of the YKMB is ~8300 tons of gold [3,6]. However, the YKMB’s main gold production came from placer deposits, sourced from OGDs.
Gold in the orogenic gold deposits of the Yana–Kolyma metallogenic belt is mainly found as “visible” gold grains in quartz veins/veinlets and rarely as inclusions in the pyrite and arsenopyrite of the proximal alteration envelopes in the host rock. In disseminated pyrite and arsenopyrite (up to 5–8%) in carbonaceous clastic rocks with pyrite–arsenopyrite–sericite–carbonate-quartz alterations, there is also “invisible” gold, which is in the form of a solid solution or nanoparticles [6,9,10,11,12]. Currently, the greatest economic value in the YKMB is Au-quartz veins and/or the Au-sulfide–quartz-veinlet-disseminated styles of mineralization. The reserves and resources of bulk YKMB deposits can be estimated in the Au-sulfide–quartz-veinlet-disseminated type of mineralization [4,13]. The geological, mineralogical, geochemical, and geochronological characteristics of the vein and veinlet mineralization in the YKMB are described in detail elsewhere (see [14,15,16,17,18,19,20,21,22,23,24] and references therein), but the study of disseminated mineralization and its contribution to the overall gold content of orogenic deposits in the central sector of the YKMB is in its infancy [11,12,25,26]. In addition, there are not many detailed investigations of the mineralization processes.
Fridovsky V.Y. et al. [11,26] and Kudrin M.V. et al. [12] showed that pyrite grew in clastic rocks in the central sector of the YKMB from sedimentation due to late metamorphism and finally formed together with arsenopyrite from hydrothermal fluids. Recent geochemical studies [11,12,26] revealed different concentrations of trace elements (As, Co, Ni, Cu, Pb, and Sb) in pyrite generations. However, the origin and sources of ore-forming fluids and metals in gold-bearing, disseminated mineralization from proximal alterations in sediment-hosted and intrusion-hosted OGDs in the YKMB remain unclear. Several genetic models of gold-bearing quartz veins and disseminated ores in the YKMB have been discussed: (a) magmatic–hydrothermal [17]; (b) formation from metamorphic fluids and boiling during uplift and decompression [22]; (c) and juvenile and metamorphic sources [23,27]. This creates serious difficulties in generating representative models and identifying potential targets.
The microtextures and mineral chemistry of pyrite and arsenopyrite are very useful for studying the processes of Au mineralization (e.g., [11,12,28,29,30,31,32,33,34,35,36,37,38]). These minerals can incorporate various metals and semi-metals (As, Co, Ni, Cu, Pb, Sb, etc.), showing the chemical evolution of gold ores [11,15,22,39,40,41,42,43,44,45,46,47,48] and many others. It is equally important that gold is either in solid solutions or micro- to nano-sized inclusions (e.g., [11,12,48,49]). Our understanding of the sources of ore-forming metals and fluids and the processes that form OGDs are also constrained by sulfur isotope analyses on sulfide minerals that are co-genetic with gold [11,15,20,21,23,26,39,43,50,51,52,53,54,55,56]. Additionally, sulfur isotope analyses allow us to assess the role of intrusions adjacent to hosting orogenic gold deposits in the providing metals (e.g., [43]).
Here, we present new data about microtextures and analyses of the chemical composition and stable sulfur isotopes of auriferous pyrite and arsenopyrite from proximal alterations in sediment-hosted and intrusion-hosted orogenic gold deposits in the central sector of the YKMB. New characteristics and information about the origin and gold grade in disseminated mineralization from proximal alterations can contribute to the further development of prospecting programs and provide important data for the reassessment of known deposits and the discovery of new deposits in the central sector of the YKMB. Observations of microtextures using scanning electron microscopy (SEM) were combined with major and trace-element analyses performed using electron probe microanalysis (EPMA) and the sulfur isotope data of pyrite and arsenopyrite. This information was used to understand ore-forming events and to reinterpret the source of gold and the hydrothermal fluid-flow processes that formed the sediment-hosted and intrusion-hosted OGD orogenic Au systems in the YKMB.

2. Geological and Metallogenic Background

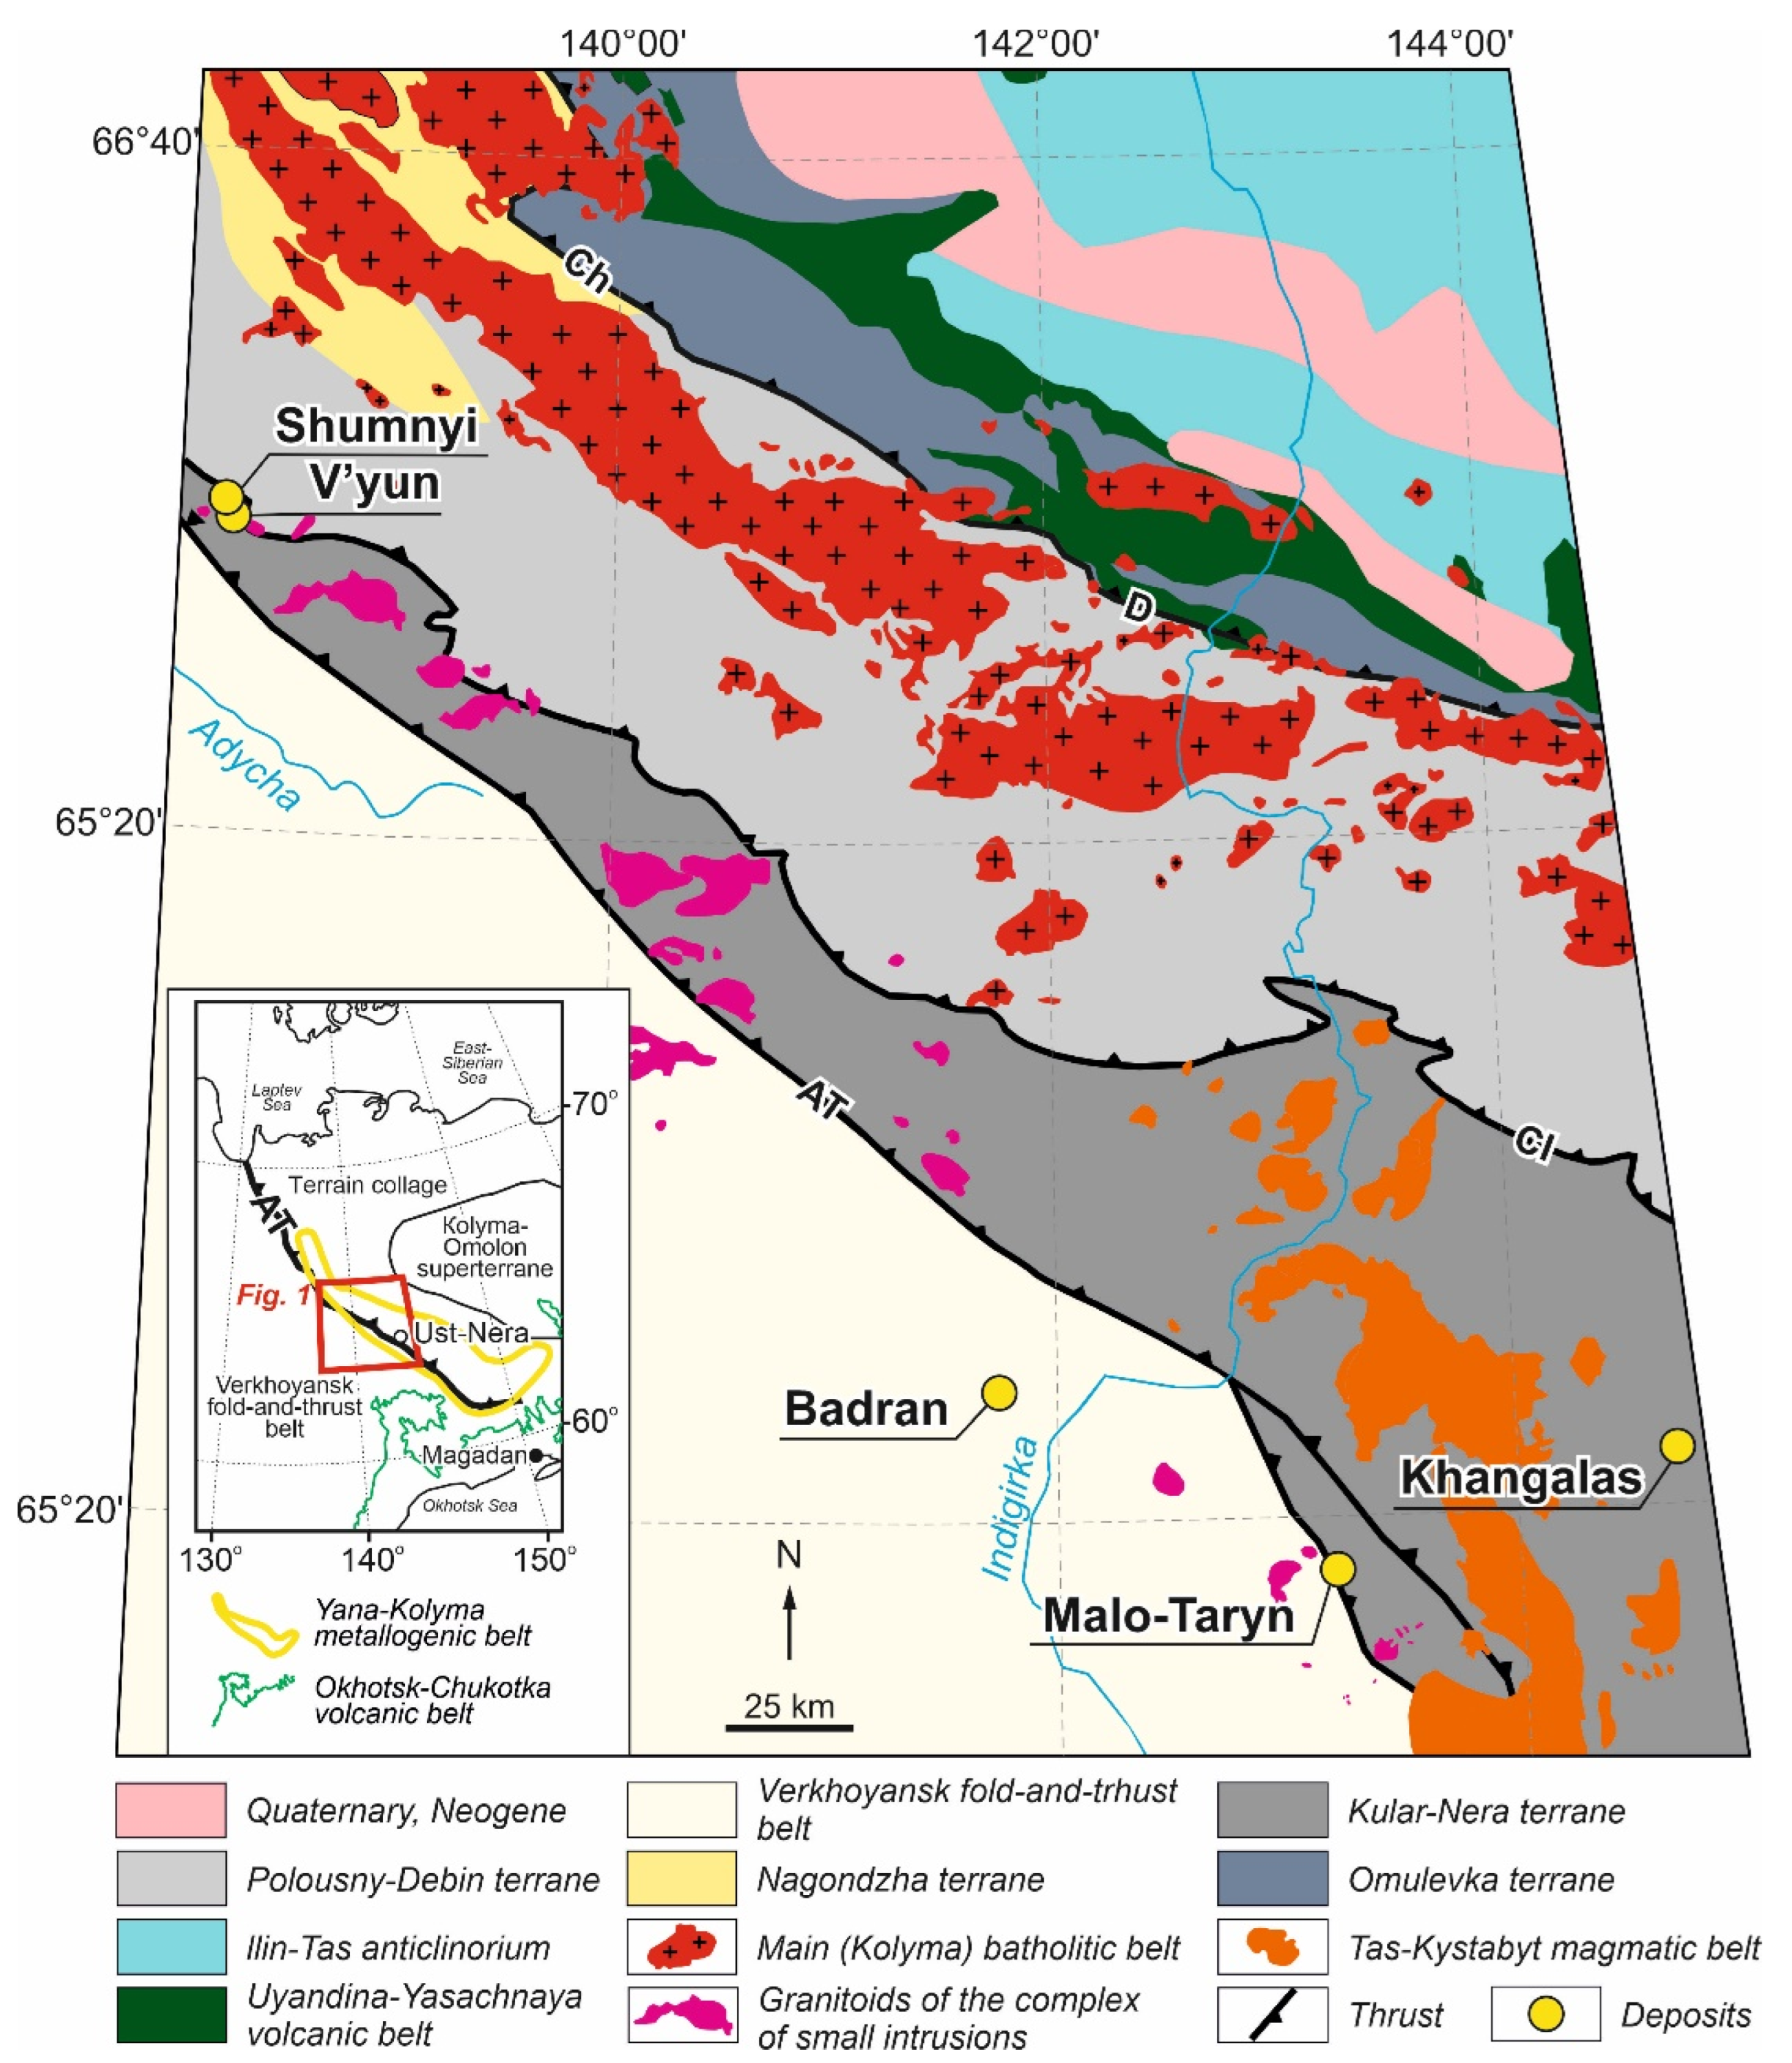
2.1. Regional Geological Setting

The Yana–Kolyma metallogenic belt is localized in the central part of the Verkhoyansk–Kolyma orogen, formed by a collage of diverse terranes [57]. Parfenov L.M. and Kuzmin M.I. [57], Parfenov L.M. [58], Parfenov L.M. et al. [59], Toro J. et al. [60], and Nokleberg W.J. et al. [61] provided detailed descriptions of terranes. The majority of OGDs in the YKMB are located in Upper Permian, Triassic, and Lower Jurassic clastic rocks and, less often, in Late Jurassic dykes of mafic, intermediate, and felsic composition, as well as granitoids of the small intrusions complexes in the Kular–Nera terrane, the adjacent Verkhoyansk fold-and-thrust belt, and the Polousny-Debin terrane [6,14,23,57,62] (Figure 1). Clastic rocks are represented by proximal and distal sediments in the eastern margin of the Siberian craton, metamorphosed under conditions no higher than the greenschist facies [57]. The rocks are deformed into the linear folds of the northwestern strike, fold-parallel faults, and transverse/oblique faults. The Adycha–Taryn and Charky–Indigirka faults are the longest faults, having an NW strike and limiting the terranes of the eastern margin of the Siberian craton. There are also cross-cutting faults in the NE and WE strikes.
Clastic rocks are intruded by granitoids from the main (Kolyma) batholitic belt (154–144 Ma, zircon, U-Pb SHRIMP-RG [63], SHRIMP-II [64]), volcanic rocks and intrusive rocks with intermediate and felsic compositions from the Tas–Kystabyt belt (151–148 Ma, zircon, U-Pb SHRIMP-II [64,65]), and Late-Jurassic-to-Early-Cretaceous granitoids from small massifs and dykes with basic-to-felsic compositions (151–143 Ma, zircon, U-Pb SHRIMP II [62,66]). Based on the geodynamic setting, structural geometry and control, host rocks, alterations, ore mineralogy, geochemistry, isotopes, and geochronological characteristics, the studied deposits have been classified as orogenic [5,6,21,23,67,68]. The morphological styles of the ore bodies are veins, breccias, and veinlet-disseminated. The deposits are localized mainly near the Adycha–Taryn and Charky–Indigirka thrusts and subsidiary faults.
As reviewed by [13,18,19,21,23,69], the ore formation of OGDs in the central sector of the YKMB occurred at pressures ranging from 1.2 to 0.25 kbar and temperatures ranging from 300 to 200 °C. Ore-forming fluids contained a dilute water–salt solution (salt concentration 0.5–9.3 wt% NaCl-eq.), carbon dioxide (8.5–15 mol%), and methane (up to 1 mol%). The hydrothermal fluid contained the following major micro-components: As, B, Sb, Zn, Fe, and Cu. The parameters and composition of the ore-forming fluids in the studied deposits are typical of Phanerozoic OGDs [43].
The combined structural observations of the central sector of the Yana–Kolyma metallogenic belt [57,70], including deposit-scale observations [20,21,67,68,69,71], new Ar-Ar and Re-Os dating of minerals from ore veins [21,27], and the U-Pb dating of igneous rocks [62,66], allowed us to decipher the sequence of deformation events and their connection with OGDs [67,68]. A three-stage deformation history is proposed. D1 compression led to the formation of folds and faults in the northwest strike. When these progressive deformations were completed at the turn of the Late-Jurassic-to-Early-Cretaceous and at the beginning of the Early Cretaceous, the formation of OGDs in the YKMB took place during accretion–collision events on the eastern margin of the Siberian craton and in the Verkhoyansk–Kolyma orogen. D2 sinistral strike-slip and D3 dextral strike-slip movements activated faults in the NW strike. The youngest events are a reflection of superimposed subduction–accretion processes at the rear of the active Cretaceous East Asian continental margin.
Figure 1. Geology of the central part of the Verkhoyansk–Kolyma orogen with main tectonic units, Jurassic–Cretaceous magmatism, and studied deposits. Faults: AT—Adycha–Taryn, CI—Charky–Indigirka, D—Darpir, Ch—Chibagalakh.
Minerals 13 00394 g001

2.2. Ore Deposit Geology

The studied sediment-hosted (Malo–Taryn, Badran, Khangalas) and intrusion-hosted (V’yun, Shumnyi) gold deposits are typical OGDs with vein–veinlet quartz and disseminated mineralization with proximal pyrite–arsenopyrite–sericite–carbonate–quartz alterations controlled by faults [6,21,67,72,73]. Geological sketches of individual deposits are shown in Figure 2 and Figure 3, and the common characteristics of the studied OGDs are presented in Table 1. Below is a brief geological description and information about the mineral composition of these ore deposits.

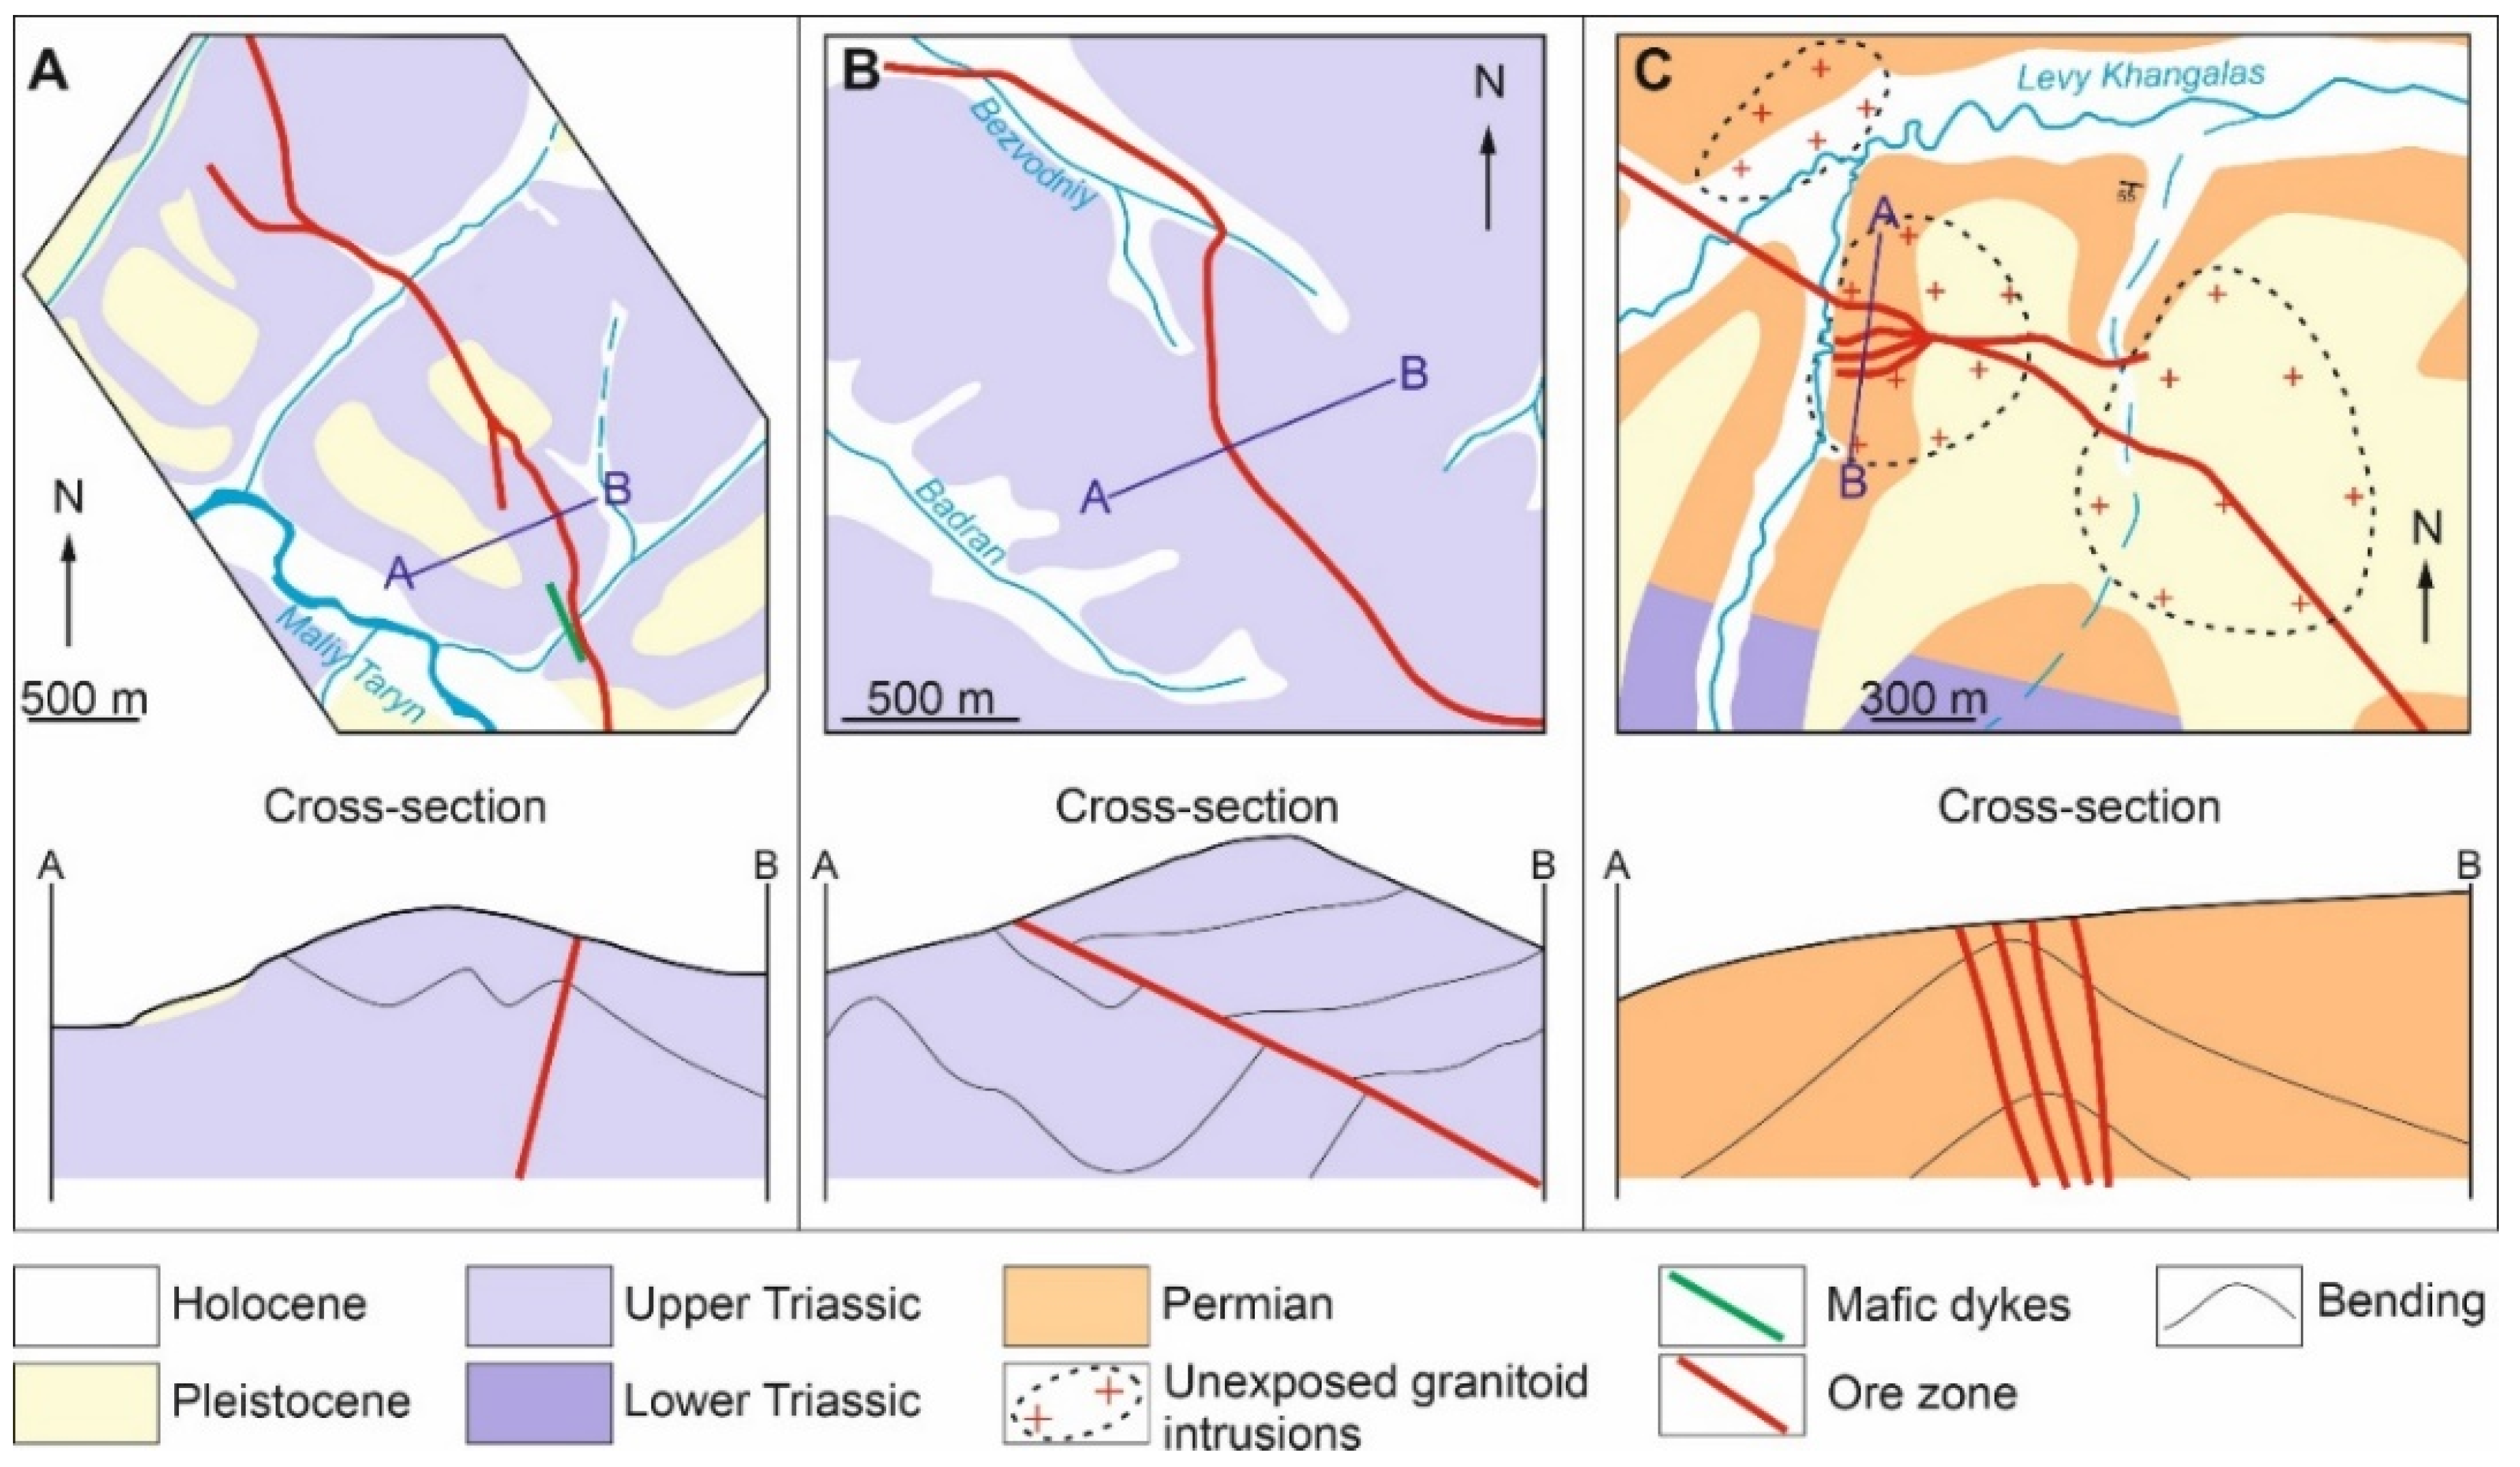
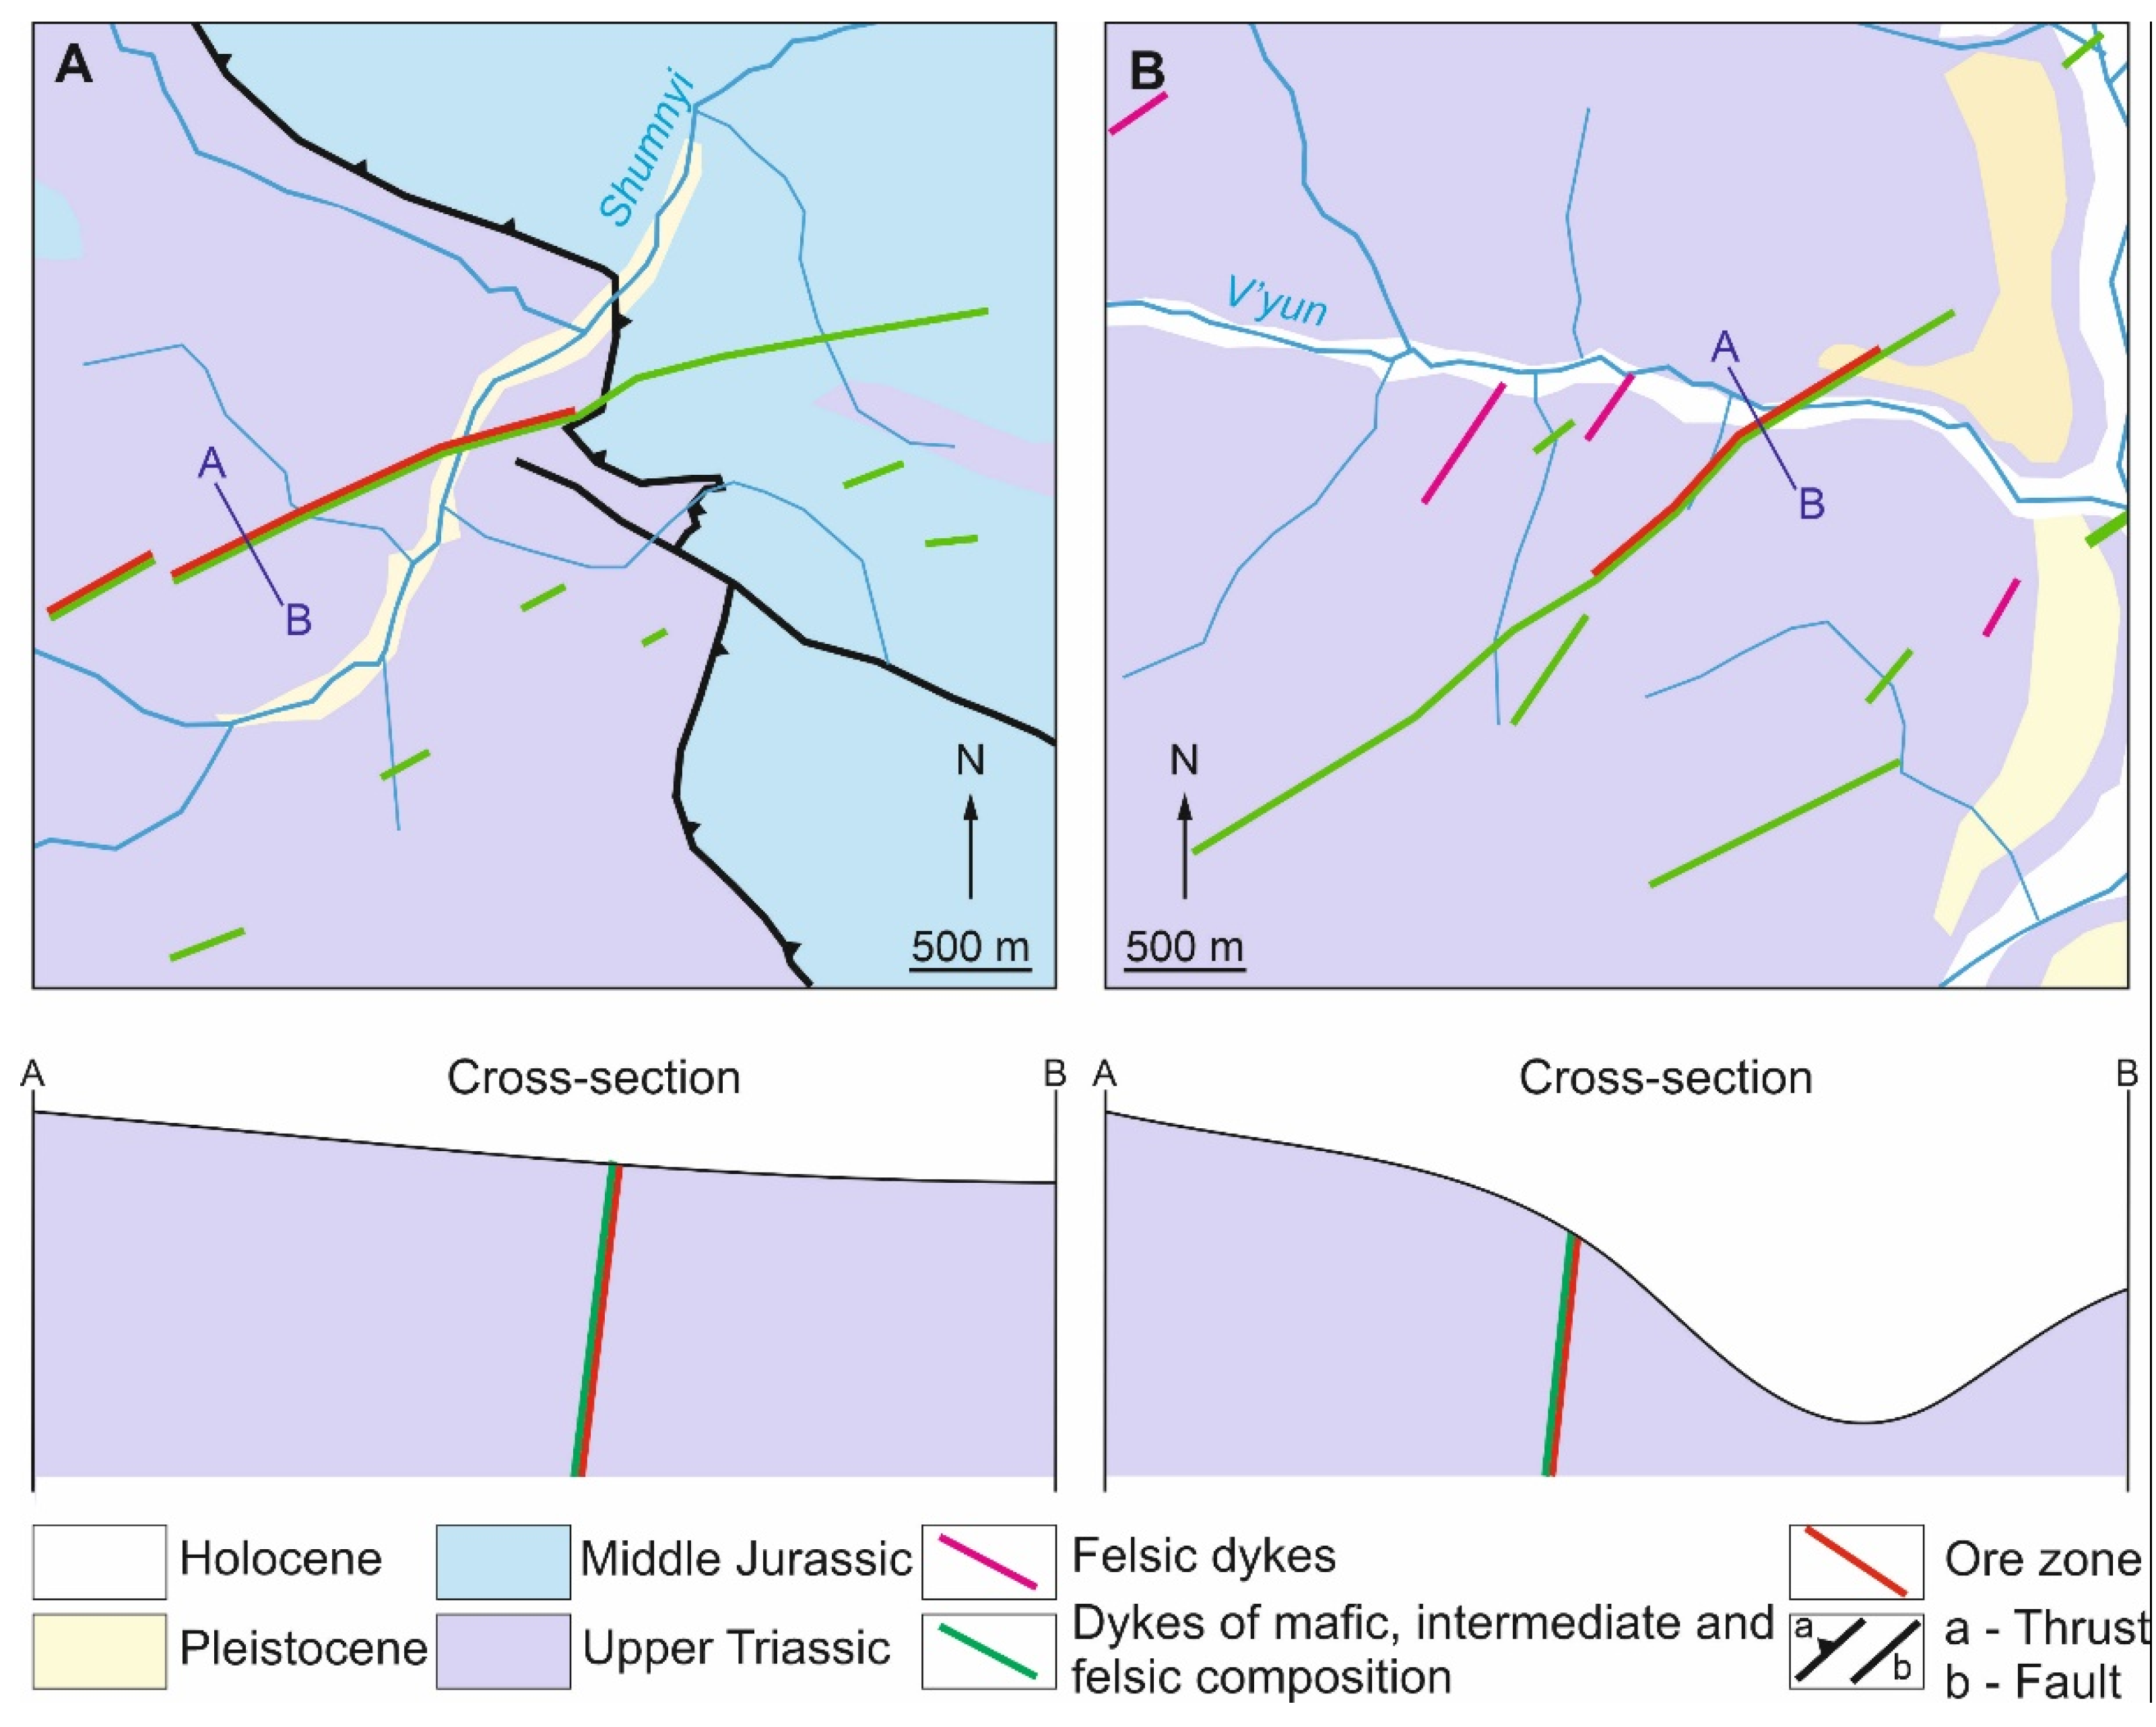
2.2.1. Geology and Mineralization of the Sediment-Hosted Orogenic Gold Deposits

Information about the geology, magmatism, and mineral composition of the Malo–Taryn deposit is provided in [27,62,76,77,84,85,87,88]. The deposit is located on the left bank of the Malo–Taryn River, 100 km southeast of the settlement of Ust-Nera. Tectonically, the deposit is localized along the border of the Verkhoyansk fold-and-thrust belt and the Kular-Nera terrane, in the axial part of the Malo–Taryn branch of the Adycha–Taryn fault. The host clastic Upper Triassic rocks (Figure 2A) are deformed into folds of several generations. The early ones associate with the NW-trending thrusts, and the later ones associate with sinistral and dextral movements along the reactivated NW thrusts. In the Malo–Taryn fault zone, the stratified rocks dip at 30°–55° to 60°–70°, including overturned beddings. The Early Cretaceous Samyr (144.5–143 Ma, zircon, U-Pb SHRIMP-II [62]), and Kurdat (141–137 Ma, biotite, 40Ar/39Ar [89]) granitoid massifs of the Tas–Kystabyt magmatic belt are located NW of the deposit at the intersection of the Malo–Taryn fault and the Kurdat transverse fault zone. Dykes of trachybasalts (145–160 Ma, Rb-Sr, rock [84,85]) are usually localized in the ore zones of the NW and NNW strikes. Their thickness is 0.1–2.0 m, and their lengths are up to the first tens of meters. The age of polychronous mineralization was constrained by different methods (40Ar/39Ar, K-Ar, Re-Os) at 148 to 126 Ma [21,27,87,90]. The ore bodies of the deposit occur along the faults of the NW and NS strikes with a dip to the SW and W at 30° to 85°. They are up to 40 m thick and can be traced 6 km along the strike.
The geological structure and mineral composition of the vein bodies and their localization at the Badran deposit have been studied in detail [74,91,92,93,94]. Underground gold mining at the deposit started in 1984. The deposit is located on the left bank of the Indigirka River, 130 km west of Ust-Nera in Upper Triassic clastic rocks (Figure 2B). The deposit is localized along the Badran–Egelyakh fault, up to 30 m wide, traceable for a distance of more than 5 km, and more than 1.2 km downdip. The northwestern and southeastern segments strike west–east and dip at 50°–60°. In the central segment, the fault dips at 24°–30° to the northeast. The quartz veins/veinlets and proximal pyrite–arsenopyrite–sericite–carbonate–quartz alteration are gold-bearing. The thickness of the quartz veins varies from tens of centimeters up to 4–5 m, with a length of up to 200 m. The gold content in altered rocks is at first grams per ton, reaching several kilograms per ton in the veins.
The structure and structural–tectonic setting of the formation and localization, as well as the mineralogical–geochemical and isotope–geochemical characteristics of the Khangalas deposit are described in [12,68,95,96,97]. The deposit is located on the left bank of the Nera River, 135 km southeast of the Ust-Nera settlement. Structurally, the deposit is confined to the Dvoinaya anticline (Figure 2C). The core of the anticline is composed mainly of Upper Permian sandstones; the limbs consist of Lower and Middle Triassic siltstones and mudstones. The Khangalas fault of the NW strike is the major ore-controlling fault. The ore bodies are represented by five extended (up to 1400 m) mineralized faults with quartz–carbonate veins/veinlets and pyrite–arsenopyrite-disseminated mineralization in the proximal alteration. The thickness of the faults is up to 32 m; their dip varies from SW to S and SE at 30°–50° to 70°–80° [67]. Re-Os data on the native gold from the quartz vein of the deposit showed that it was 137 million years old [27]. The gold content in the alteration is up to 5.29 ppm Au, with a mean of 0.73 ppm.
Figure 2. Geologic map and simplified cross-sections of the sediment-hosted OGDs, central YKMB: (A) Malo–Taryn; (B) Badran; (C) Khangalas.
Minerals 13 00394 g002
Figure 3. Ore bodies of (A,D,G,J) Malo–Taryn; (B,E,H,K) Badran; and (C,F,I,L) Khangalas orogenic gold deposits: (AC) veins; (DF) veinlets; (GJ,I,L) veinlet-disseminated; (K) disseminated. Abbreviations: Qz—quartz, Py—pyrite, Apy—arsenopyrite.
Minerals 13 00394 g003

2.2.2. Geology and Mineralization of the Intrusion-Hosted Orogenic Gold Deposits

Detailed geological, mineralogical, and geochemical characteristics for the V’yun and Shumnyi deposits are provided in [66,75,78,98]. Underground gold mining at the V’yun deposit started in 2020. The V’yun and Shumnyi deposits are located in the upper reaches of the Adycha River. The tectonic structure of the deposit is controlled by longitudinal NW fold-and-thrust structures and transverse NE faults activated by late strike-slip faults (Figure 4 and Figure 5). The Upper Triassic clastic rocks are crumpled into linear isoclinal and compressed asymmetric folds in the northwest strike. Mineralization is localized in the Late Jurassic dykes of trachybasalts, andesites, trachyandesites, dacites, and granodiorites (151–145 Ma, zircon, U–Pb SHRIMP-II [66]) and faults in the NE strike (Figure 4). Dykes are 2 to 8 m thick, extending for more than 2 km. The style of ore bodies is vein–stockwork and disseminated. In the veins and stockworks, the main minerals are quartz and carbonate made up of, at most, 1–3% sulfides, represented mostly by arsenopyrite. Rarer sulfides and sulfosalts are pyrite, galena, sphalerite, chalcopyrite, tetrahedrite, and argentotetrahedrite. There are insignificant quantities of bournonite and antimony. Gold in the veins is free and characterized by high grades of up to several hundred grams per tonne. The disseminated gold–sulfide mineralization is localized both in the fault zones up to several tens of meters thick and in dykes. The main ore minerals in them are auriferous pyrite and arsenopyrite. The host alteration is sericite–chlorite–quartz in composition.

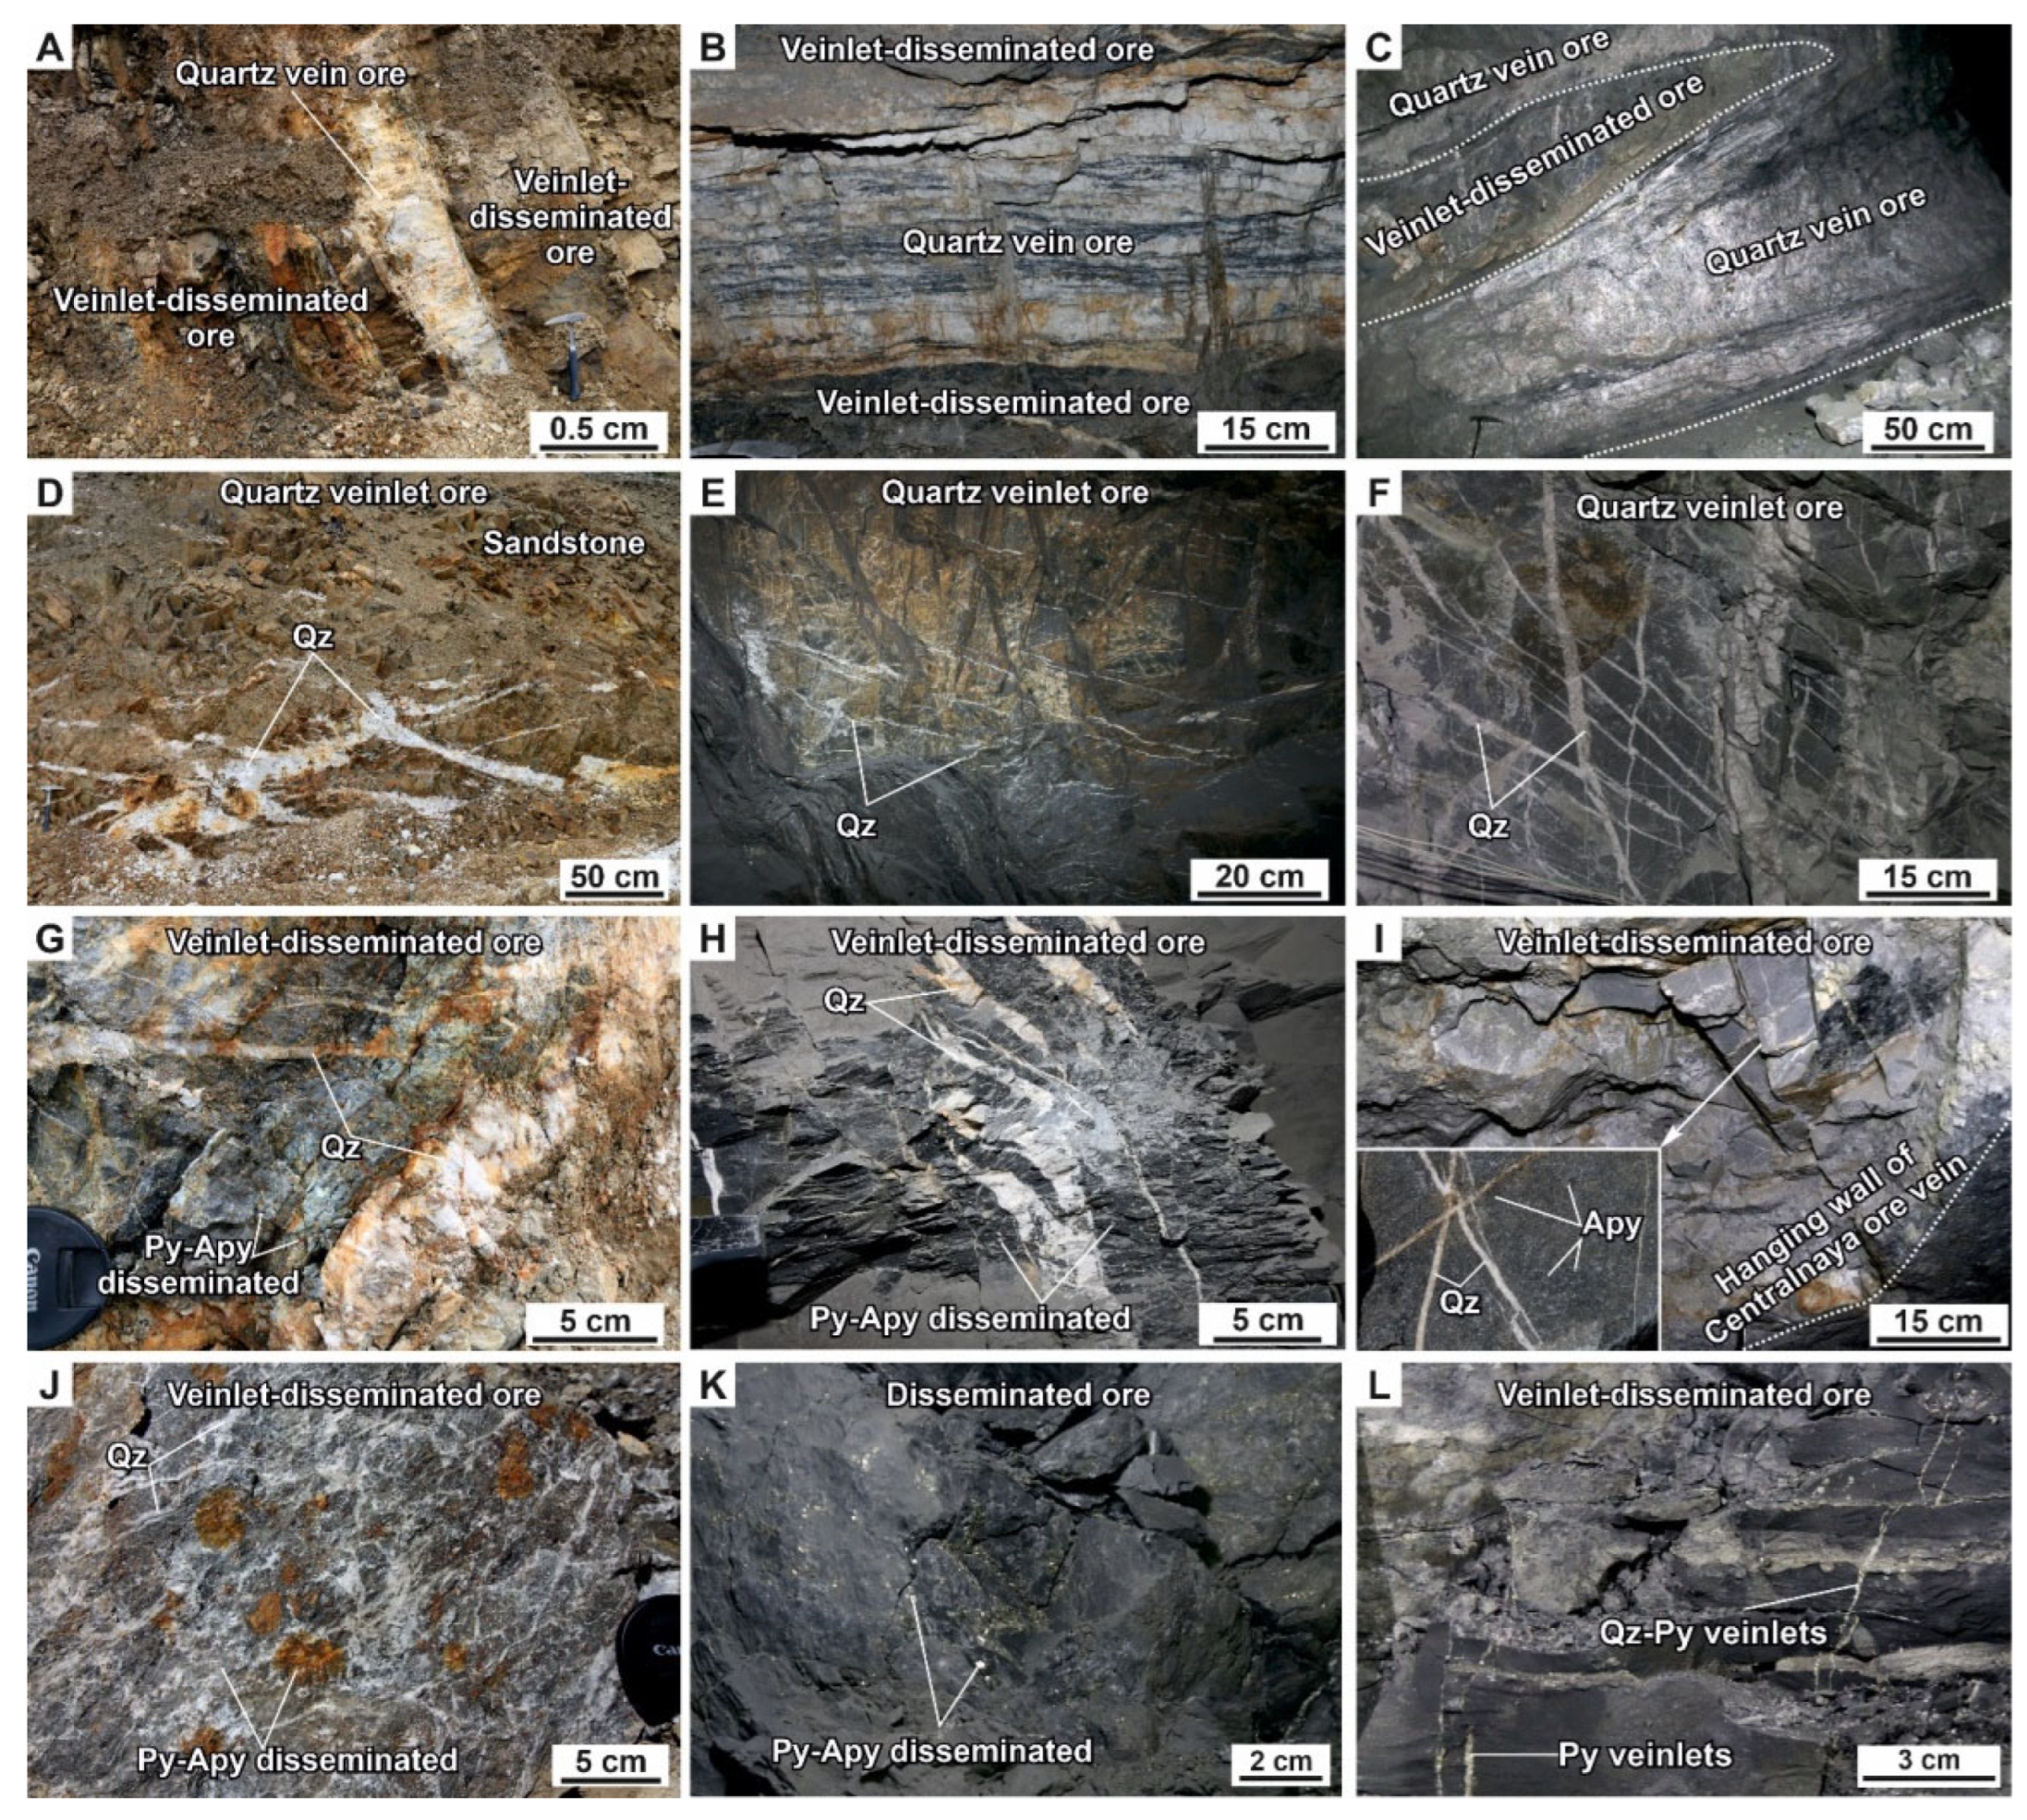
2.3. Mineral Composition of the Deposits and Mineralization Types

There are several types of mineralization at the Malo–Taryn, Badran, Khangalas, V’yun, and Shumnyi deposits: gold–quartz/gold–sulfide–quartz, stibnite, and silver–stibnite (Table 2) [23]. Gold–quartz mineralization developed in quartz veins and veinlets; gold is native here. Disseminated mineralization with “invisible” gold is localized in the proximal arsenopyrite–pyrite–sericite–carbonate–quartz alteration. Berthierite–stibnite and silver–stibnite mineralization is superimposed on OGDs sporadically.
Gold–quartz/gold–sulfide–quartz-type mineralization is characterized by a number of successively alternating paragenetic associations: arsenopyrite–pyrite–quartz alteration, pyrite-arsenopyrite–quartz veins, Au-polysulfide-quartz, and sulfosalt–carbonate [18,19,20,21,23]. The number of ore minerals takes up 1–3% or, less often, up to 5%. A detailed mineralogical–geochemical and isotopic characterization of the disseminated Py-Apy-Qz paragenesis is provided in Section 4 of this article.
The pyrite–arsenopyrite–quartz vein association is composed of coarse- and medium-grained subhedral and anhedral milky-white quartz (85–95%), carbonate, chlorite, albite, and sericite. The texture of the veins is massive, banded (Figure 6A–C), and breccia-like (Figure 6D,E); the structure is hypidiomorphoblastic (subhedral–blastic structure), and small veinlets are characterized by a comb structure. Pyrite4 and arsenopyrite2 occur in the form of individual crystals up to 1–2 mm in size; veinlets up to 1 mm in thickness; and nests up to 3–4 cm in size (Figure 6I) or, less often, 50–70 cm or more.
Pyrite4 and arsenopyrite2 form intergrowths and mutual inclusions (Figure 7A). The primary euhedral grains of early sulfides are cataclazed and corroded. Native gold, quartz, and sulfides from late mineral paragenesis occur in microcracks in arsenopyrite2 (Figure 7B,C) (Au-Qz-polysulfide and sulfosalt–carbonate).
Table 2. Mineral composition of ores and mineralization types of the studied OGDs, central YKMB.
MineralizationParagenesisMineralsMalo-TarynBadranKhangalasV’yun/
Shumnyi
Au-Qz/Au-
sulfide-Qz
Py-Apy-Qz
metasomatic
PyriteMinerals 13 00394 i001Minerals 13 00394 i002Minerals 13 00394 i003Minerals 13 00394 i004
ArsenopyriteMinerals 13 00394 i005Minerals 13 00394 i006Minerals 13 00394 i007Minerals 13 00394 i008
DanaiteMinerals 13 00394 i009
Fe-gersdorfiteMinerals 13 00394 i010 Minerals 13 00394 i011
Py-Apy-Qz
vein
QuartzMinerals 13 00394 i012Minerals 13 00394 i013Minerals 13 00394 i014Minerals 13 00394 i015
SericiteMinerals 13 00394 i016Minerals 13 00394 i017Minerals 13 00394 i018Minerals 13 00394 i019
Chlorite Minerals 13 00394 i020 Minerals 13 00394 i021
Albite Minerals 13 00394 i022 Minerals 13 00394 i023
PyriteMinerals 13 00394 i024Minerals 13 00394 i025Minerals 13 00394 i026Minerals 13 00394 i027
ArsenopyriteMinerals 13 00394 i028Minerals 13 00394 i029Minerals 13 00394 i030Minerals 13 00394 i031
Au-
polysulfid
GoldMinerals 13 00394 i032Minerals 13 00394 i033Minerals 13 00394 i034Minerals 13 00394 i035
GalenaMinerals 13 00394 i036Minerals 13 00394 i037Minerals 13 00394 i038Minerals 13 00394 i039
ChalcopyriteMinerals 13 00394 i040Minerals 13 00394 i041Minerals 13 00394 i042Minerals 13 00394 i043
SphaleriteMinerals 13 00394 i044Minerals 13 00394 i045Minerals 13 00394 i046Minerals 13 00394 i047
Sulfosalt-
Carbonate-
CarbonateMinerals 13 00394 i048Minerals 13 00394 i049Minerals 13 00394 i050Minerals 13 00394 i051
TetrahedriteMinerals 13 00394 i052Minerals 13 00394 i053Minerals 13 00394 i054Minerals 13 00394 i055
BoulangeriteMinerals 13 00394 i056Minerals 13 00394 i057Minerals 13 00394 i058
JamesoniteMinerals 13 00394 i059Minerals 13 00394 i060 Minerals 13 00394 i061
Bournonite Minerals 13 00394 i062 Minerals 13 00394 i063
StibniteBerthierite-
Stibnite
BerthieriteMinerals 13 00394 i064
StibniteMinerals 13 00394 i065Minerals 13 00394 i066 Minerals 13 00394 i067
QuartzMinerals 13 00394 i068Minerals 13 00394 i069 Minerals 13 00394 i070
Ag-
Stibnite
Ag-
Stibnite
QuartzMinerals 13 00394 i071 Minerals 13 00394 i072
PyriteMinerals 13 00394 i073
ArsenopyriteMinerals 13 00394 i074
TetrahedriteMinerals 13 00394 i075Minerals 13 00394 i076
Argentite Minerals 13 00394 i077
Acanthite Minerals 13 00394 i078
The width of the lines represents the relative abundance of minerals.
The Au-polysulfide-quartz association is composed of sphalerite, galena, and chalcopyrite, which, in the form of small aggregates and micro-veinlets, are confined to the minerals in earlier paragenetic associations (Py-Apy-Qz metasomatic and Py-Apy-Qz vein). The intergrowths of the minerals in the Au-polysulfide-Qz association are up to the first few millimeters. Anhedral–blastic structures and solid solutions (emulsions) developed (Figure 7D). When interacting with earlier sulfides, microtextures due to corrosion (Figure 7E,F) and crack-filling are formed. Native gold formed simultaneously with the sulfides in this association, as evidenced by their joint presence and close intergrowths (Figure 7E). Common native gold developed in interstitial quartz grains or filled microcracks in earlier minerals. The shape of the gold particles is mainly elongated–lumpy (Figure 7G), lumpy–branched, and dendritic (Figure 7H), fractions of a millimeter to the first millimeter. The fineness of native gold is 800–900‰.
In the sulfosalt–carbonate association, the leading mineral is carbonate. It is localized in the selvages of vein bodies and near clay interlayers (Figure 6F), and it forms nest-like clusters and fills cracks and voids in minerals in earlier associations (Figure 6G). In the fractured areas, carbonate is a cementing material and forms comb structures (Figure 6H). The amount of carbonate in the veins varies from 5 to 15%. Fahlores are represented by tetrahedrite (Figure 7I). They form anhedral grains in quartz veins in association with galena, sphalerite, and chalcopyrite. Carbonate minerals contain acicular crystals and microaggregates of boulangerite and jamesonite. At the Badran and V’yun deposits, bournonite is observed in intergrowths with galena (Figure 7J).
Berthierite–stibnite-type mineralization can be identified at the Malo–Taryn and Badran deposits [21,94]. Minerals occur in the form of individual aggregates and thin veinlets (up to 2–3 cm) in the gold–quartz veins. The superposition of late berthierite–stibnite mineralization on earlier gold–quartz/gold–sulfide–quartz mineralization leads to the development of corrosion (Figure 7K). The intensively cataclazed quartz experienced volumetric dissolution, and small (1–2 mm) euhedral crystals of regenerative quartz formed (Figure 7L) [20].
Figure 6. Photographs showing representative mineral assemblages and textures of the vein minerals in the studied OGDs, central YKMB: (A) Milky-white quartz with a massive texture; thread-like interlayers of siltstone composition separate the bands of subhedral quartz from the anhedral quartz; (B) banded texture of quartz vein; (C) Alternation of banded and massive quartz; (D) breccia-like texture of quartz vein, milky-white quartz forms overgrowth textures around the rock fragments; (E) spherulitic and cryptogranular quartz cement vein quartz (Qz1); (F) Fe-dolomite forms a rhythmically-banded texture in a quartz vein; (G) veinlets and nests of intensely oxidized dolomite–ankerite; (H) quartz with siltstone xenoliths overgrown with combed dolomite–ankerite with Mg-siderite inclusions; (I) in milky-white quartz, a nest of arsenopyrite with dendrite-like gold in cracks. Abbreviations: Gn—galena, Sp—sphalerite, Apy—arsenopyrite, Dol—dolomite, Ank—ankerite, Sd—siderite.
Minerals 13 00394 g006
Ag-stibnite-type mineralization is represented by spherulitic, cryptogranular, or collomorphic–nodular quartz with a slight dissemination of fine-grained pyrite with elevated concentrations of Au and Ag and individual crystals of arsenopyrite with an Sb admixture of up to 2–3%. Tetrahedrite, argentite, and acanthite are typomorphic minerals [21,94]. This epithermal mineralization is the latest in the YKMB [99]. It occurs at the Malo–Taryn, Badran, and Khangalas deposits.
Figure 7. Photomicrographs showing the representative mineral assemblages and microtextures of the ore minerals of each vein-type ((A)—backscattered electron images, (BL)—reflected light) of the studied OGDs, central YKMB: (A) pyrite and arsenopyrite intergrowths in a quartz vein; (B) cataclase structures in arsenopyrite grains; cracks are healed with quartz in the Au-polysulfide-quartz paragenesis; (C) in cataclazed arsenopyrite aggregate, native gold developed along cracks; (D) sphalerite–galena–chalcopyrite aggregate with an allotriomorphic blastic structure. Chalcopyrite emulsions in sphalerite aggregates with a solid solution decomposition structure; (E) microtexture from corrosion and substitution of pyrite (Py) crystal caused by minerals of the Au-polysulfide-quartz paragenesis; (G) native elongated lumpy gold in interstitial quartz grains; (H) lumpy-branched native gold in microcracks; (I) tetrahedrite aggregates intergrown with arsenopyrite; (J) intergrowths of burnonite with minerals from the Au-polysulfide-quartz paragenesis; (K) microtextures from berthierite corrosion due to pyrite crystals; (L) euhedral crystals made of regenerative quartz in stibnite aggregates. Abbreviations: Gn—galena, Sp—sphalerite, Ccp—chalcopyrite, Apy—arsenopyrite, Ttr—tetrahedrite, Bnn—burnonite, Brt—berthierite, Sbn—stibnite.
Minerals 13 00394 g007

3. Materials and Analytical Methods

3.1. Sample Preparation

Samples for mineralogical–geochemical and isotope–geochemical studies were collected from natural outcrops and the walls and dumps of surfaces and underground workings; 62 thin sections and 36 polished mounts were prepared for mineralogical and microtextural studies. For mineralogical, microtextural, and geochemical studies of disseminated sulfide mineralization, thick polished sections (74 in total) and epoxy-mounted grains (100 sulfide grains in 10 mounts) were prepared.
The microtextural and paragenetic features of the sulfides were studied using a Karl Zeiss Axio M1 optical microscope (Carl Zeiss AG, Jena, Germany) at the Diamond and Precious Metal Geology Institute, Siberian Branch, Russian Academy of Sciences, Yakutsk, Russia. The qualitative chemical and mineral compositions of the samples were studied with the use of a JEOL JSM-6480LV scanning electron microscope (SEM analysis, JEOL Ltd., Tokyo, Japan) equipped with an Energy 350 Oxford energy dispersive spectrometer (20 kV, 1 nA, beam diameter 1 µm) at the Diamond and Precious Metal Geology Institute, Siberian Branch, Russian Academy of Sciences (Yakutsk, Russia).

3.2. Electron Probe Micro-Analyzer (EPMA)

The major element compositions of pyrite and arsenopyrite were determined with standard X-ray spectral analysis on a Camebax-Micro microanalyzer (Cameca, Courbevoie, France) at the Diamond and Precious Metal Geology Institute, Siberian Branch, Russian Academy of Sciences (Yakutsk, Russia). The analytical conditions were as follows: accelerating voltage of 20 kV; beam current of 25 nA; measurement time of 10 s; K series for Fe, Co, Ni, Cu, and S; M series for Au and Pb; L series for As and Sb.; and wavelength-dispersive spectrometer (WDS) with LiF, PET, and TAP crystals. The standards used were FeS2 for Fe and S, FeAsS for As, Fe-Ni-Co alloy for Co, Ni, Au-Ag alloy for Au and Ag, CuSbS2 for Sb, and PbS for Pb. The detection limit was 0.01%. In each grain, 3 measurements were made: core, midway between core and rim, and rim. In total, 422 analyses were used, of which 293 were used for the first time and 129 were taken from earlier studies [11,12].

3.3. Determination of Gold and Silver Content

The Au and Ag contents were determined using powdery monomineral samples via atomic absorption spectrometry (AAS) with electrothermal atomization on a spectrometer MGA-1000 (LUMEX, St. Petersburg, Russia) at the Diamond and Precious Metal Geology Institute, Siberian Branch, Russian Academy of Sciences (Yakutsk, Russia). The detection limit for gold is 0.02 ppm. In total, 71 analyses were used, of which 34 were used for the first time and 37 taken were from earlier studies [11,12].

3.4. S isotope Analysis

The sulfur isotope composition was analyzed at the Laboratory of Stable Isotopes, Center for Collective Use, Far East Geological Institute, Far East Branch, Russian Academy of Sciences (Vladivostok, Russia). For sulfur isotope analysis of sulfides from the Malo–Taryn, Khangalas, V’yun, and Shumnyi deposits, we used pure sulfide fractions (54 samples) selected by hand and ground into powder. In total, 75 analyses were used, of which 30 were used for the first time and 45 were from earlier studies [11,12]. The analysis was performed using a Flash EA-1112 elemental analyzer (Thermo Scientific, Dreieich, Germany) in the S configuration according to the standard protocol for converting sulfur from sulfide to SO2. The sample preparation for mass spectrometric sulfur isotope analysis from the Badran deposit (20 samples) was carried out with the local laser method using an NWR Femto femtosecond laser ablation complex [100,101]. The 34S/32S isotope ratios were measured on a MAT-253 mass spectrometer (Thermo Fisher Scientific, Germany) in continuous He flux mode. The measurements were performed against a standard laboratory gas, SO2, calibrated according to international standards IAEA-S-1, IAEA-S-2, IAEA-S-3, and NBS-127. The results of the δ34S measurements are provided in reference to the international VCDT standard. Determination accuracy: δ34S ± 0.2‰ (1σ).

4. Results

4.1. Pyrite and Arsenopyrite Types and Textures

Our [12,26,78] and other works [10,102], beyond any known orebodies and in alteration of the OGDs in the central YKMB, have identified several generations of pyrite (Py1, Py2, Py3) and arsenopyrite (Apy1); a summary of the common textures and pyrite–arsenopyrite classifications for the central YKMB is shown in Table 3. Pyrite is the main and most common ore mineral in sedimentary strata, with diagenetic (Py1), metamorphic (Py2), and metasomatic (Py3) pyrites identified.

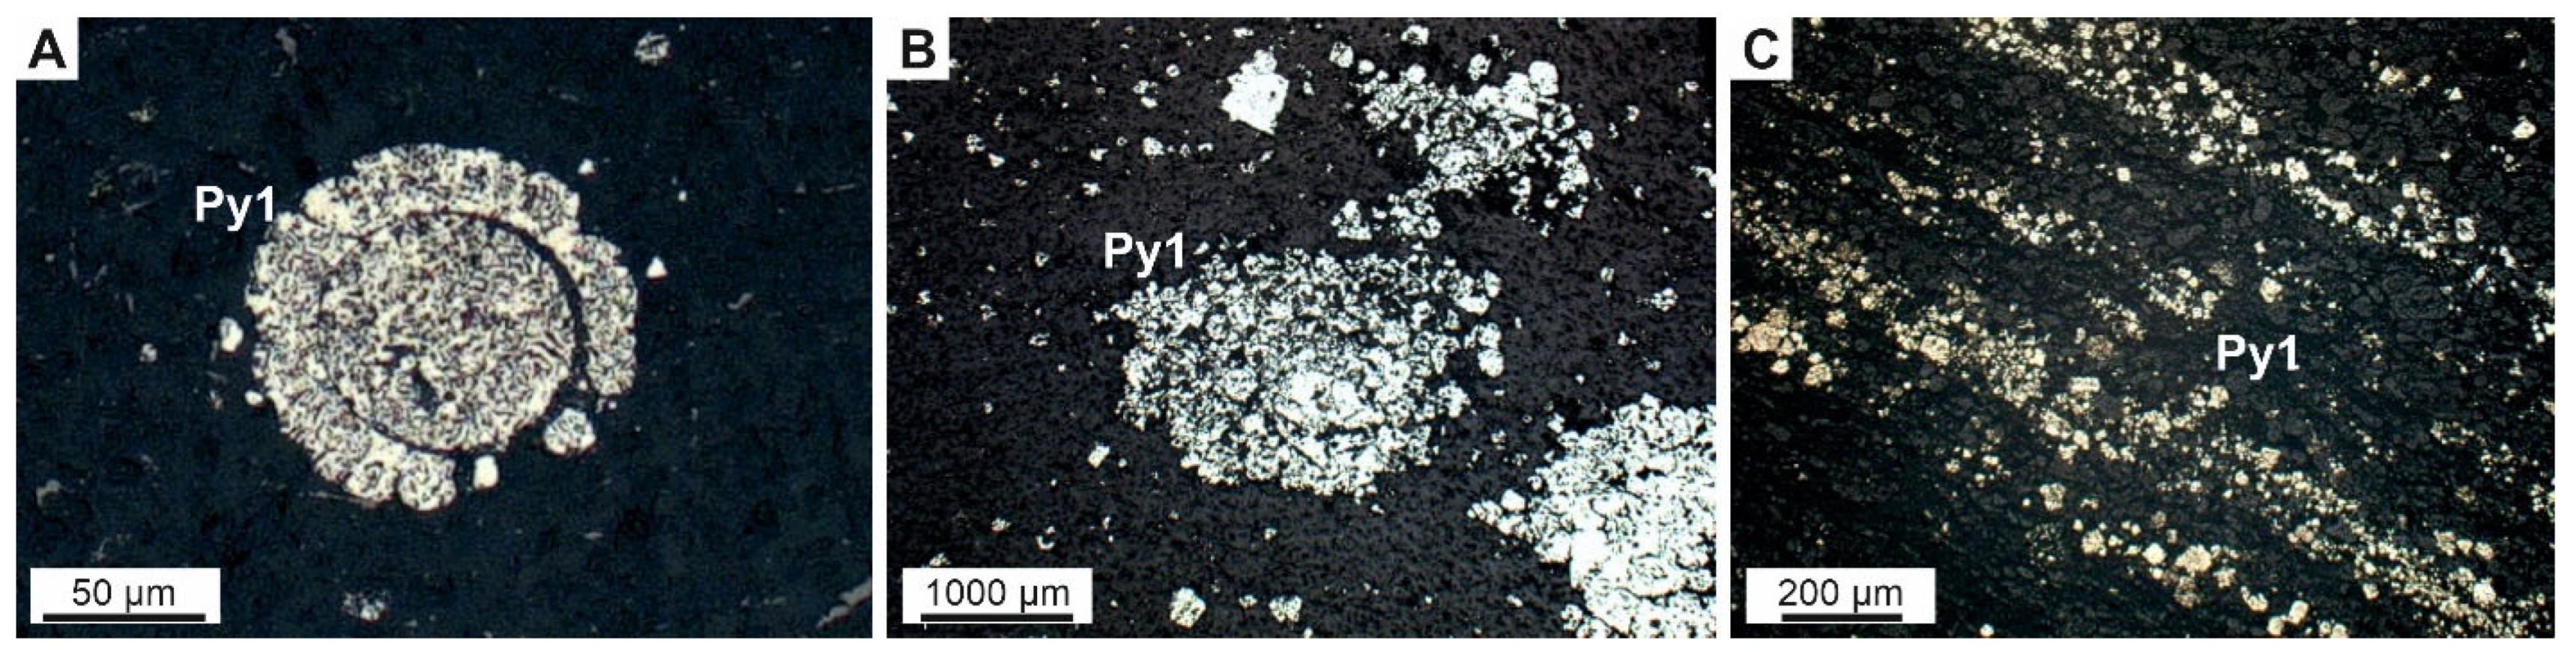
4.1.1. Syn-Sedimentary/Diagenetic Pyrite (Py1)

The earliest form of pyrite is observed in the Upper Paleozoic clastic sedimentary rocks (Figure 8). Pyrite1 is represented by dust-like and fine-grained spherical (framboidal) particles (Figure 8A) and nodular aggregates ranging in size from 10 to 100 microns (Figure 8B). They are composed of pyrite microcrystals with a zonal structure in a carboniferous–silicon matrix. Nodular aggregates often have a porous texture, which suggests the formation of minerals as a result of rapid crystallization [33]. In pyrite1, marcasite can be observed as anhedral-to-colloform grains. The location of Py1 follows the primary sedimentary texture of rocks (Figure 8C).

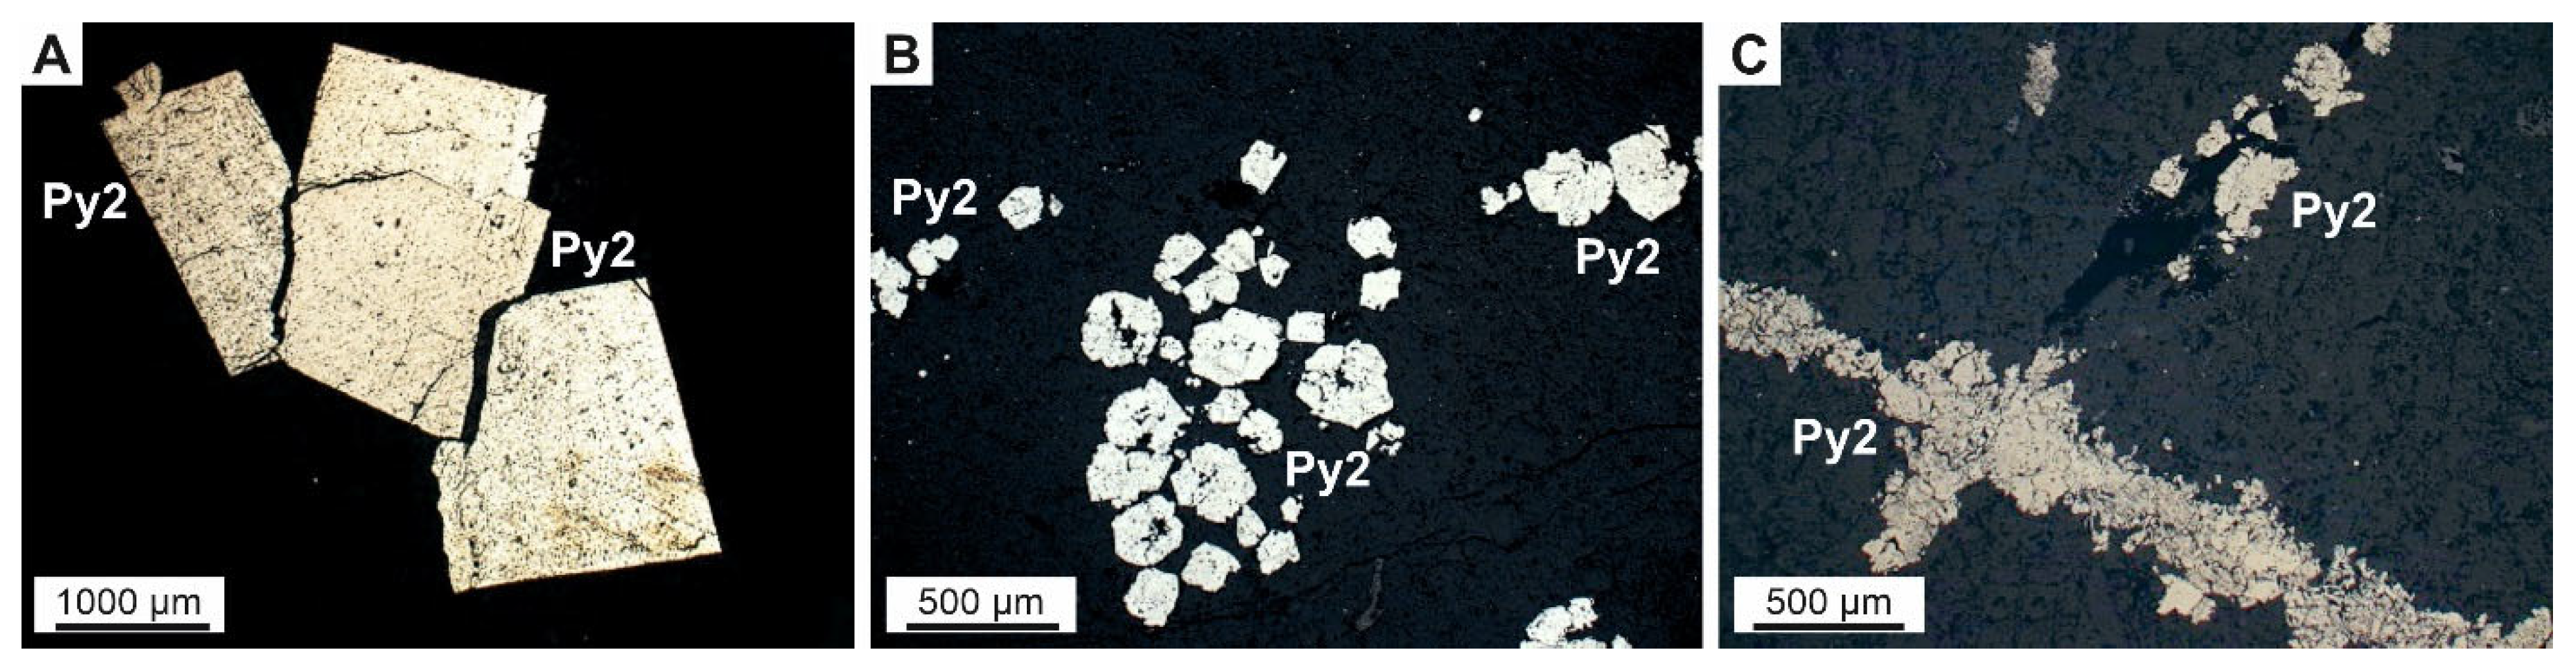
4.1.2. Metamorphic Pyrite2

Pyrite2 can be most widely observed in the zones of regional faults (Adycha–Taryn, Charky–Indigirka, Chai–Yureya). It is represented by crystals with subhedral and euhedral shapes, ranging in size from 2–3 microns to 2–4 mm, which form dissemination (Figure 9A), intergrowths, nests (Figure 9B), and thin veinlets (Figure 9C). In individual crystals and aggregates, a xenomorphic porous central part can be observed, formed during diagenesis, surrounded by an idiomorphic shell of metamorphogenic Py2 (Figure 9).

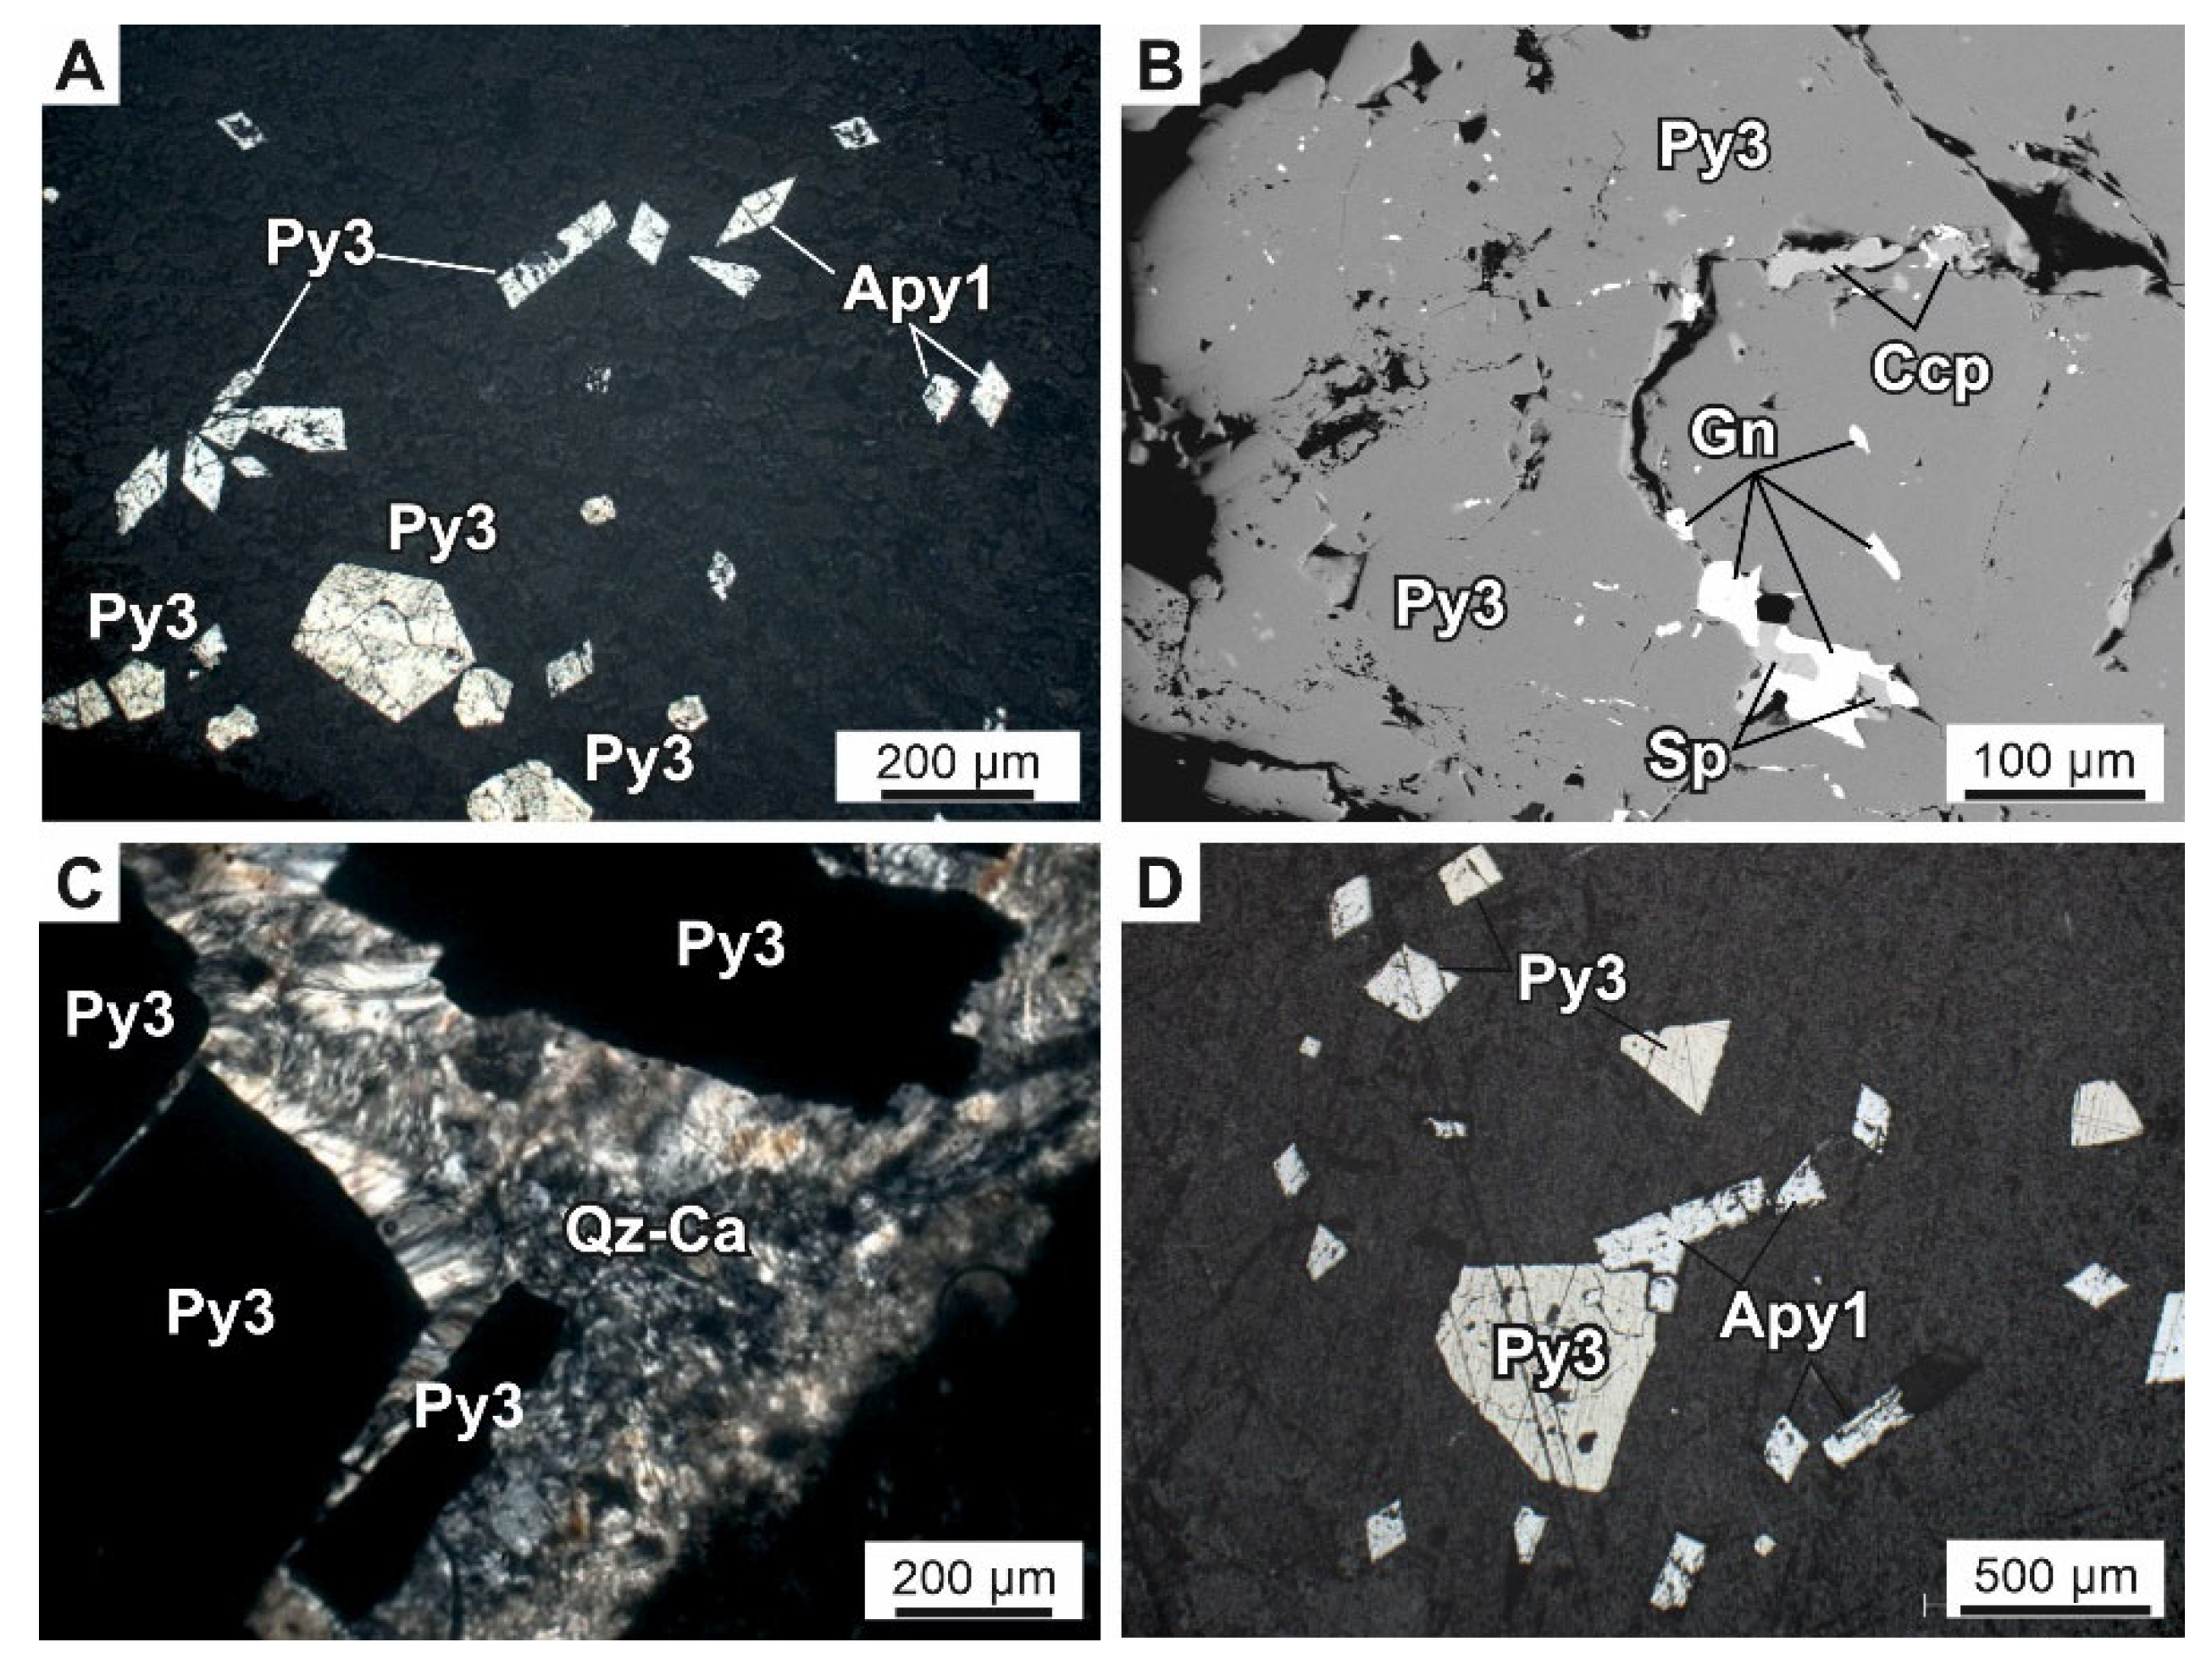
4.1.3. Hydrothermal Pyrite3 and Arsenopyrite1 from Proximal Alteration

Sulfides (Py3 and Apy1) are localized in the proximal sericite-carbonate–quartz alteration and make a major contribution to the economic value of the veinlet-disseminated mineralization containing “invisible” gold. A proximal alteration is characterized by various types of transformation in rocks. Sericitization, carbonation, and silicification developed in the clastic rocks (sandstones, siltstones). Carbonation, chloritization, and argillization manifested in the dykes of basic, intermediate, and felsic composition. The hydrothermal alteration of both clastic and intrusive rocks involves pyrite–arsenopyrite sulfidation. Py3 is cubic and pentagondodecahedral in shape and often has a zonal structure (Figure 10). The second typomorphic mineral of the association is arsenopyrite (Apy1) with a short-prismatic and pseudopyramidal form (Figure 10A). The size of Apy1 crystals ranges from fractions up to 1–1.5 mm or, less often, up to 2–3 mm. Microinclusions in the minerals of the Au-polysulfide-quartz and sulfosalt–carbonate associations can be noted in Py3 and Apy1 crystals (Figure 10B). These minerals are confined to pores, voids, and microcracks, as well as the growth zones of pyrite and arsenopyrite crystals. A rod-like quartz–carbonate rim is often formed at the edges of sulfide crystals (Figure 10C). The content of disseminated sulfide mineralization in proximal alteration can be up to 6–8%. Usually, pyrite prevails at a distance from quartz veins/veinlets, and arsenopyrite prevails near them.

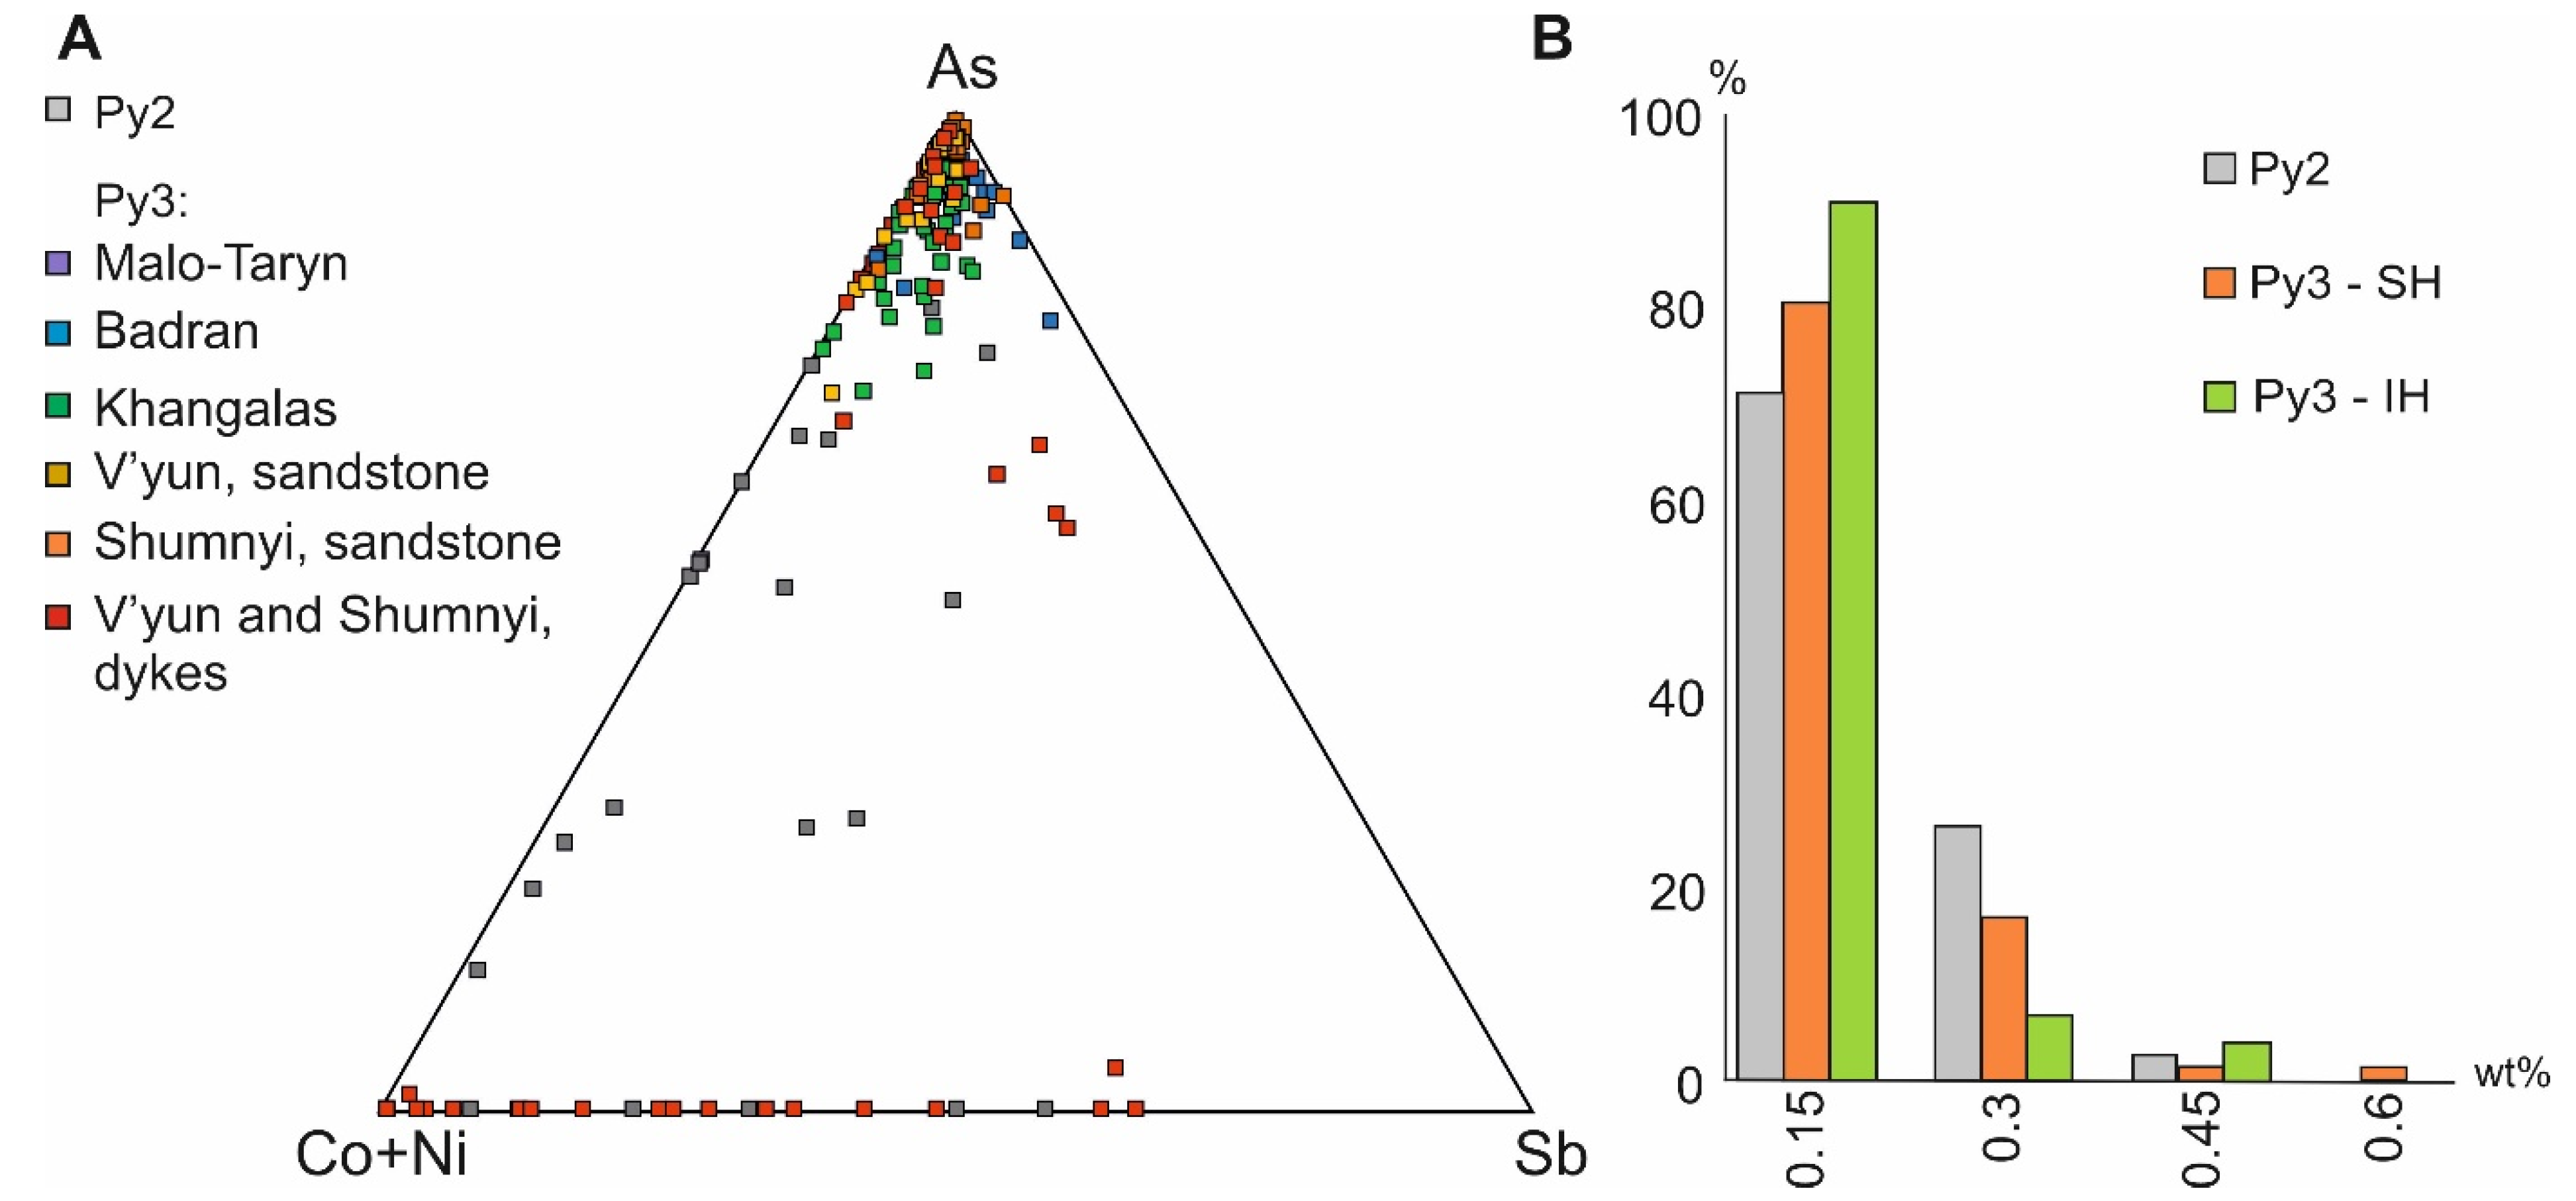
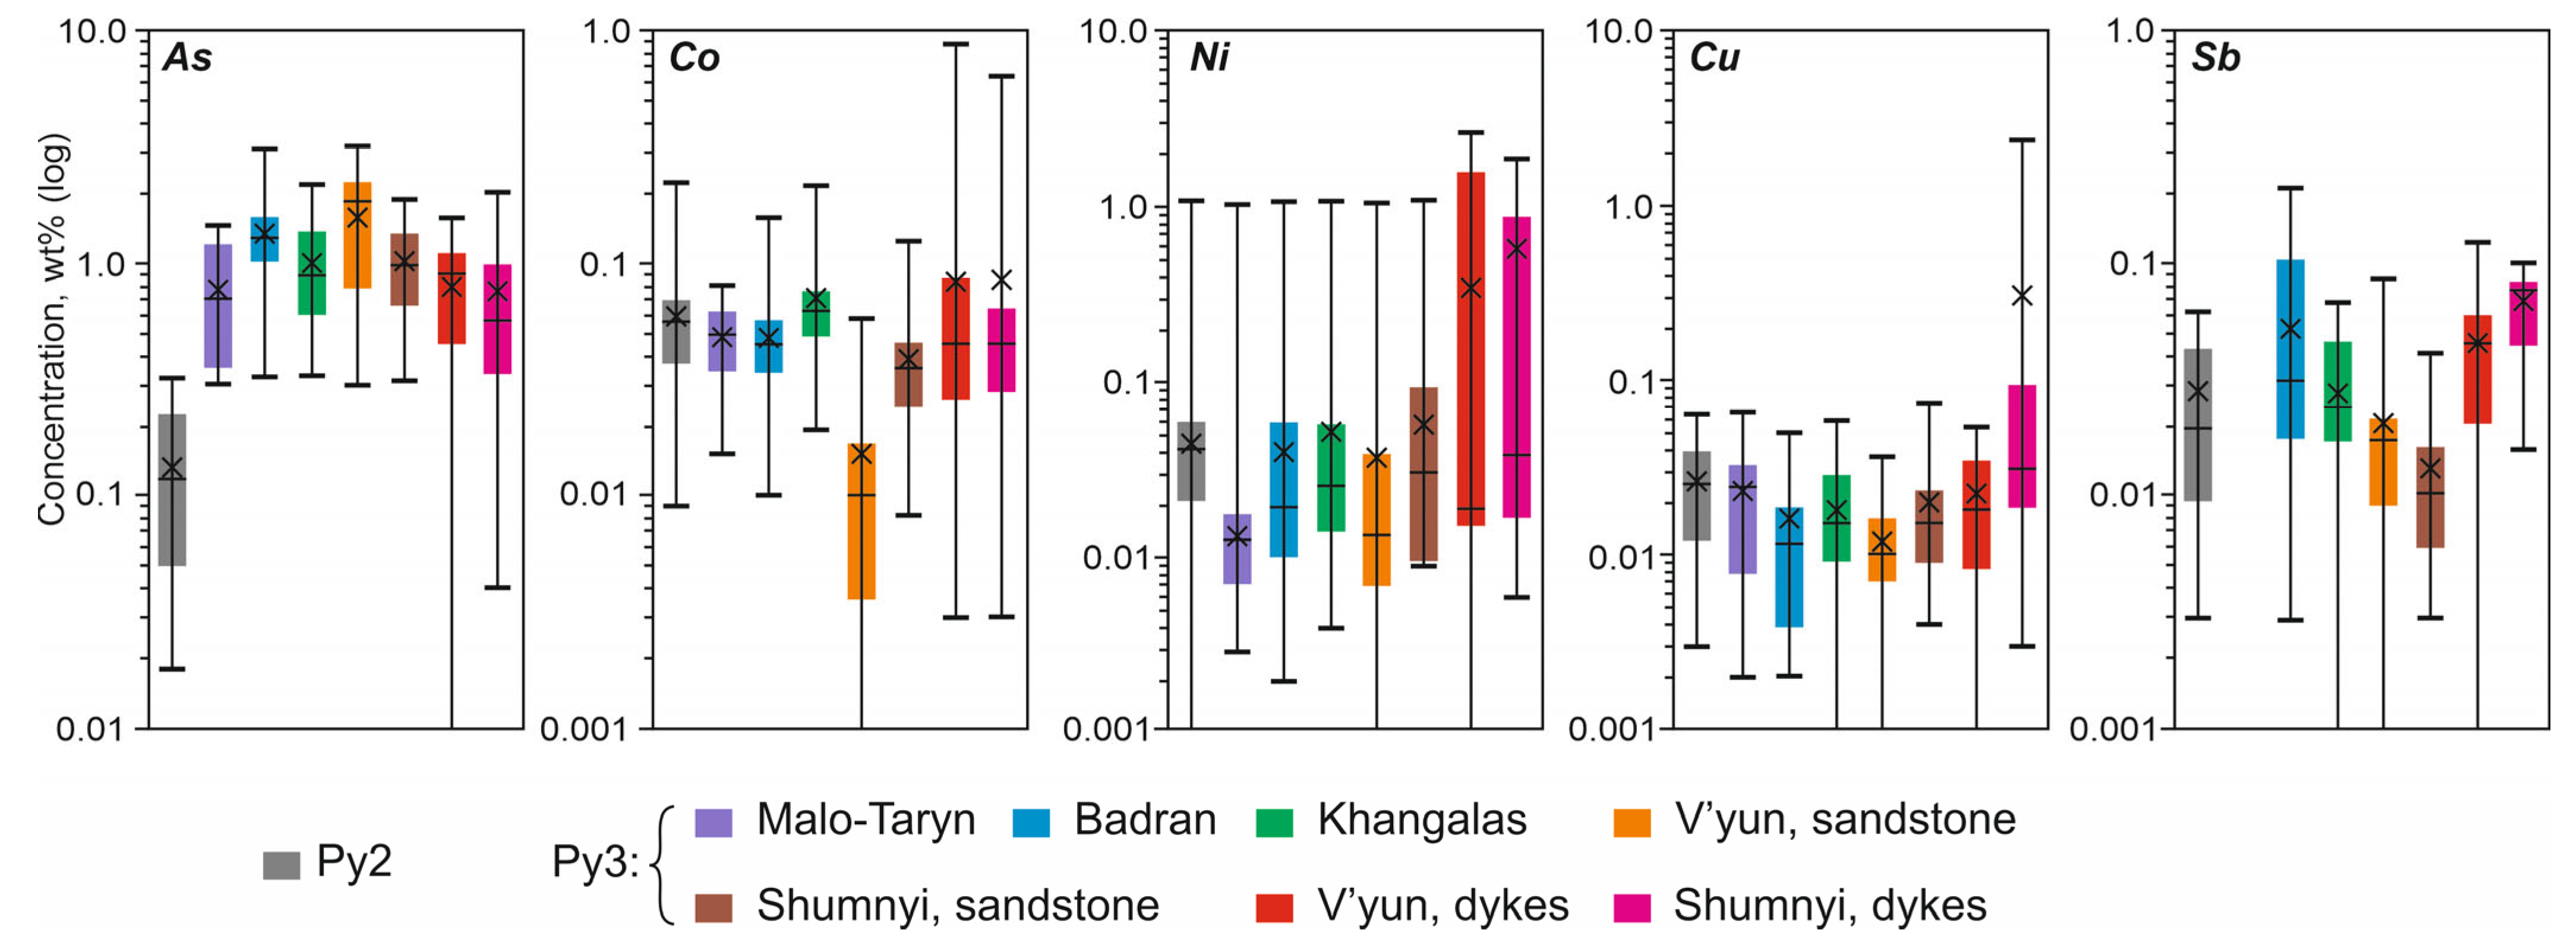
4.2. Chemical Composition of Pyrite and Arsenopyrite

The EPMA analyses revealed distinct trace-element abundances in the various generations of pyrite and arsenopyrite (for the full dataset, see Supplementary Tables S1 and S2).

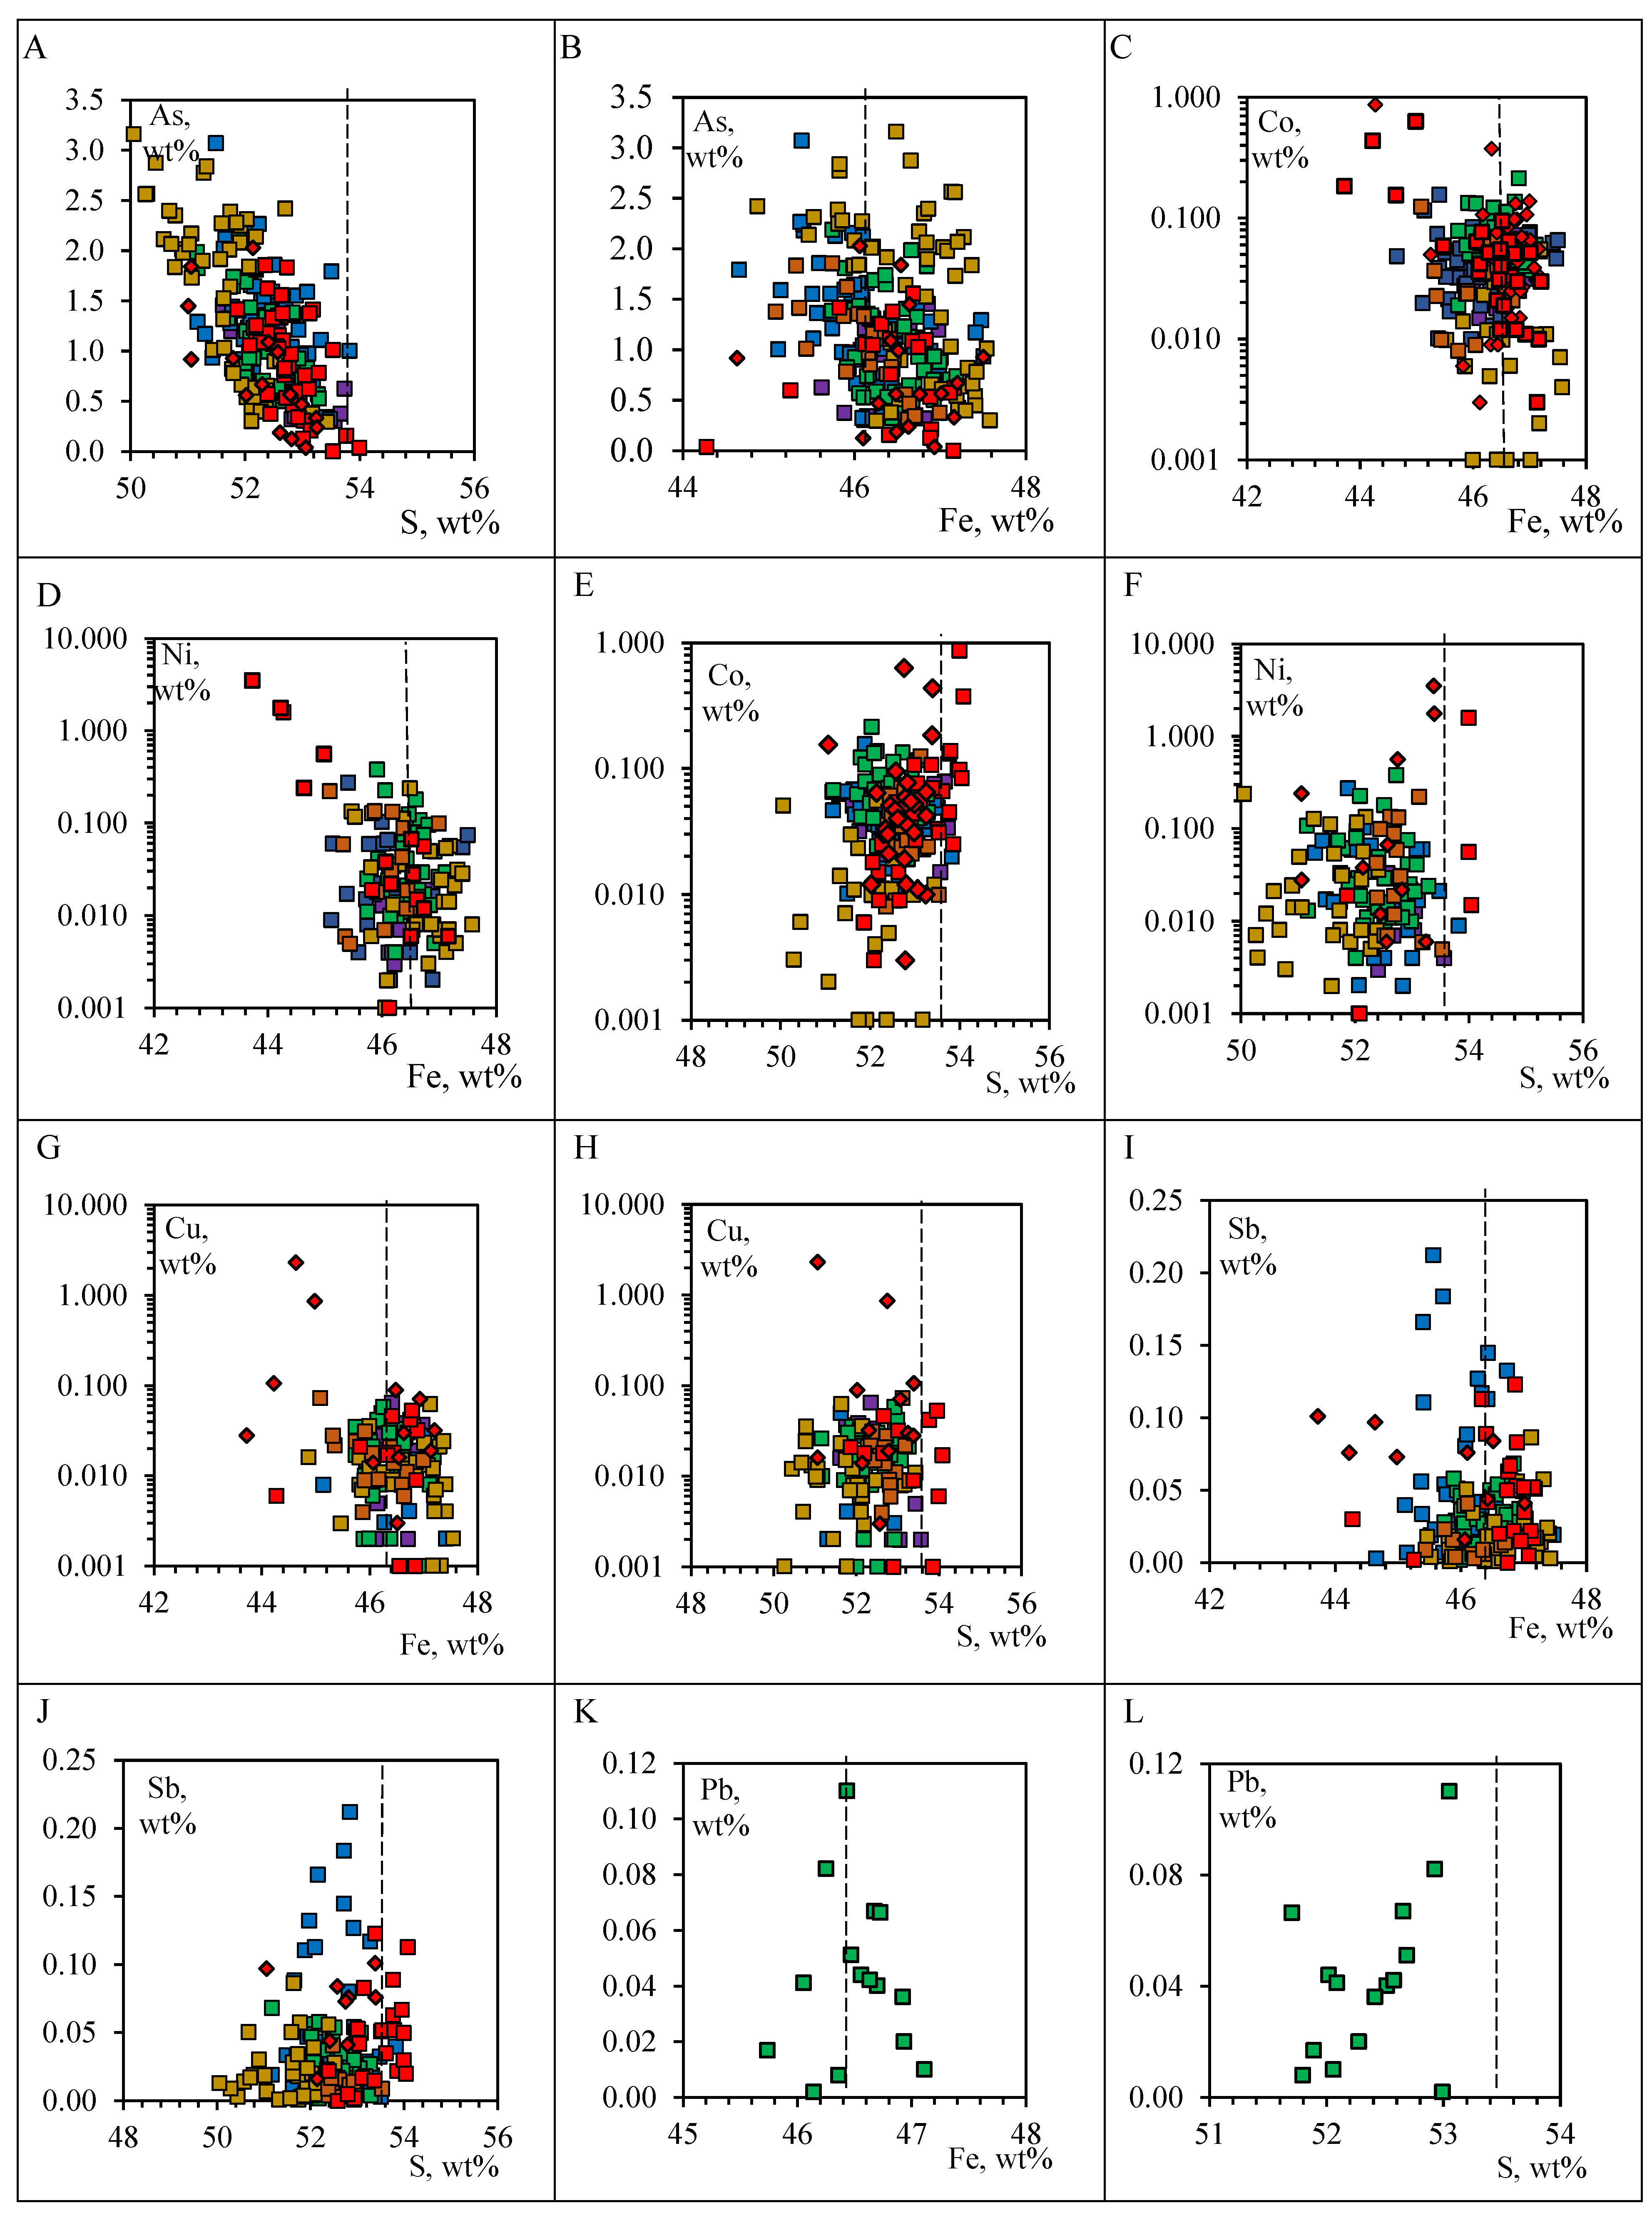
4.2.1. Chemical Composition of Pyrite in Sediment-Hosted Orogenic Gold Deposits

Most of the analyzed pyrites of the sediment-hosted orogenic gold deposits have a nonstoichiometric composition (in 63% of analyses, Fe/(S + As) ≠ 0.5) and the trace elements As, Co, Ni, Cu, and Sb, as well as, less often, Pb (Supplementary Table S1). Pyrite is characterized by a deficit of sulfur (in 75–95% of analyses, S/Fe < 2.0 at Cs = 51.16–53.82 wt%). Concentrations of trace elements vary within wide limits; the values of the coefficients of variation indicate the heterogeneity of the sample (Vσ from 38% to 138%).
Arsenian Py is an indicator. In the metamorphic Py2, CAs ≤ 0.32 wt%. In alteration Py3, the main trace element is As (from 0.31 to 3.16 wt%) (Figure 11A). For the majority (70%) of the analyzed grains, CAs < 1.5 wt%. The zonal distribution of As in pyrite crystals is typical. Core (CAs to 3.08 wt%), intermediate (CAs < 2.0 wt%), and rim (CAs to 2.20 wt%) zones were found.
Cobalt, Ni, Cu, Sb, and Pb are typomorphic trace elements in Py3 (Supplementary Table S1). Other elements are present in quantities below the detection limit of EPMA analyses. The total trace-element content varies from 0.01 to 0.55 wt%; the entire spectrum of elements can be found in 20% of crystals. Py3 Σ (Co, Ni, Cu, Sb, Pb) < 0.15 wt% prevails (Figure 11B). There is a decrease in the amount of trace-element content in Py3 compared with Py1 and Py2 (Figure 11B). The pyrites of the Badran deposits are characterized by an increase in the concentration of Sb, and at the Malo–Taryn deposit, the Sb is below the detection limit (Figure 12E). In Py3, the common trace element is Co (from 0.01 to 0.22 wt%; in 90% of analyses, CCo < 0.1 wt%). In zonal crystals, the maximum concentration of Co is characteristic of core Py3. Ni and Cu are present in 50% of the analyzed grains in quantities exceeding the detection limit. Ni (up to 0.46 wt%) can be observed in the rim Py3. There is no zoning in the distribution of Cu. The Py3 of the Khangalas deposit is characterized by Pb (to 0.11 wt%) in the core zone. The general formula of pyrite in the sediment-hosted orogenic gold deposit alteration (Py3) pyrite is Fe0.98–1.08(Ni0.0–0.01Co0.0–0.01)S1.95–2.00As0.01–0.05.

4.2.2. Chemical Composition of Pyrite in Intrusion-Hosted Orogenic Gold Deposits

Pyrite in the intrusion-hosted orogenic gold deposits is analyzed both in the host clastic rocks and in dykes of intermediate composition. Most of the pyrite analyzed had a nonstoichiometric composition (in 57% of analyses, Fe/S + As ≠ 0.5) and they showed a deficit of sulfur (in 75–95% of analyses, S/Fe < 2.0 at CS = 51.01–54.08 wt%) (Supplementary Table S1). The concentrations of trace elements vary within a large range; the values of the coefficient of variation indicate the heterogeneity of the samples (Vσ from 42 to 227%). The distributions of trace-element concentrations in Py3 from clastic rocks and from dykes are comparable, but a number of features can be observed.
In the alteration Py3 of the clastic rocks, As is the main trace element (from 0.30 to 3.16 wt%) (Figure 12A). Concentrations of CAs < 0.5 wt% are only in 14% of grains, for 60% CAs >1.0 wt%. High As contents are recorded in individual Py3 grains from dykes (CAs = 0.57–2.02 wt%); 34% of Py3 have CAs = 0.01–1.00 wt%, and 44% have non-arsenian varieties (Supplementary Table S1).
Cobalt, Ni, Cu, and Sb are typomorphic trace elements in Py3 from clastic rocks (Figure 12). The remaining trace elements are present in quantities below the detection limit of the EPMA analysis. The total content of these elements varies from 0.01 to 0.42 wt%, but the whole spectrum of elements is fixed in single crystals. Py3 grains of Σ (Co, Ni, Cu, Sb) < 0.15 wt% prevail (Figure 11B). Co, Ni, and Cu are typomorphic trace elements in Py3 from dykes. Antimony is determined in Py3 from some dykes; it is characterized by increased concentrations (to 0.10 wt%,) (Figure 12E). The total content of these elements varies widely from 0.003 to 3.97 wt%, but the whole spectrum of elements is fixed in single crystals. Elevated concentrations of Ni and Co can be observed in individual crystals (CNi = 3.52 wt%; CCu = to 2.31 wt%) (Supplementary Table S1). The remaining trace elements are present in quantities below the detection limit of EPMA analyses.
Figure 12. Boxplots showing the compositional difference in Py1-2 and Py3 acquired using an EPMA analysis of the studied OGDs, central YKMB. The lower border of the line shows the minimum value; the upper shows the maximum value. Horizontal lines in the boxes denote the median, the X marks in the boxes denote the mean, and the bottom and top of each box denote the first and third quartiles, respectively. Concentrations are on a logarithmic scale.
Minerals 13 00394 g012

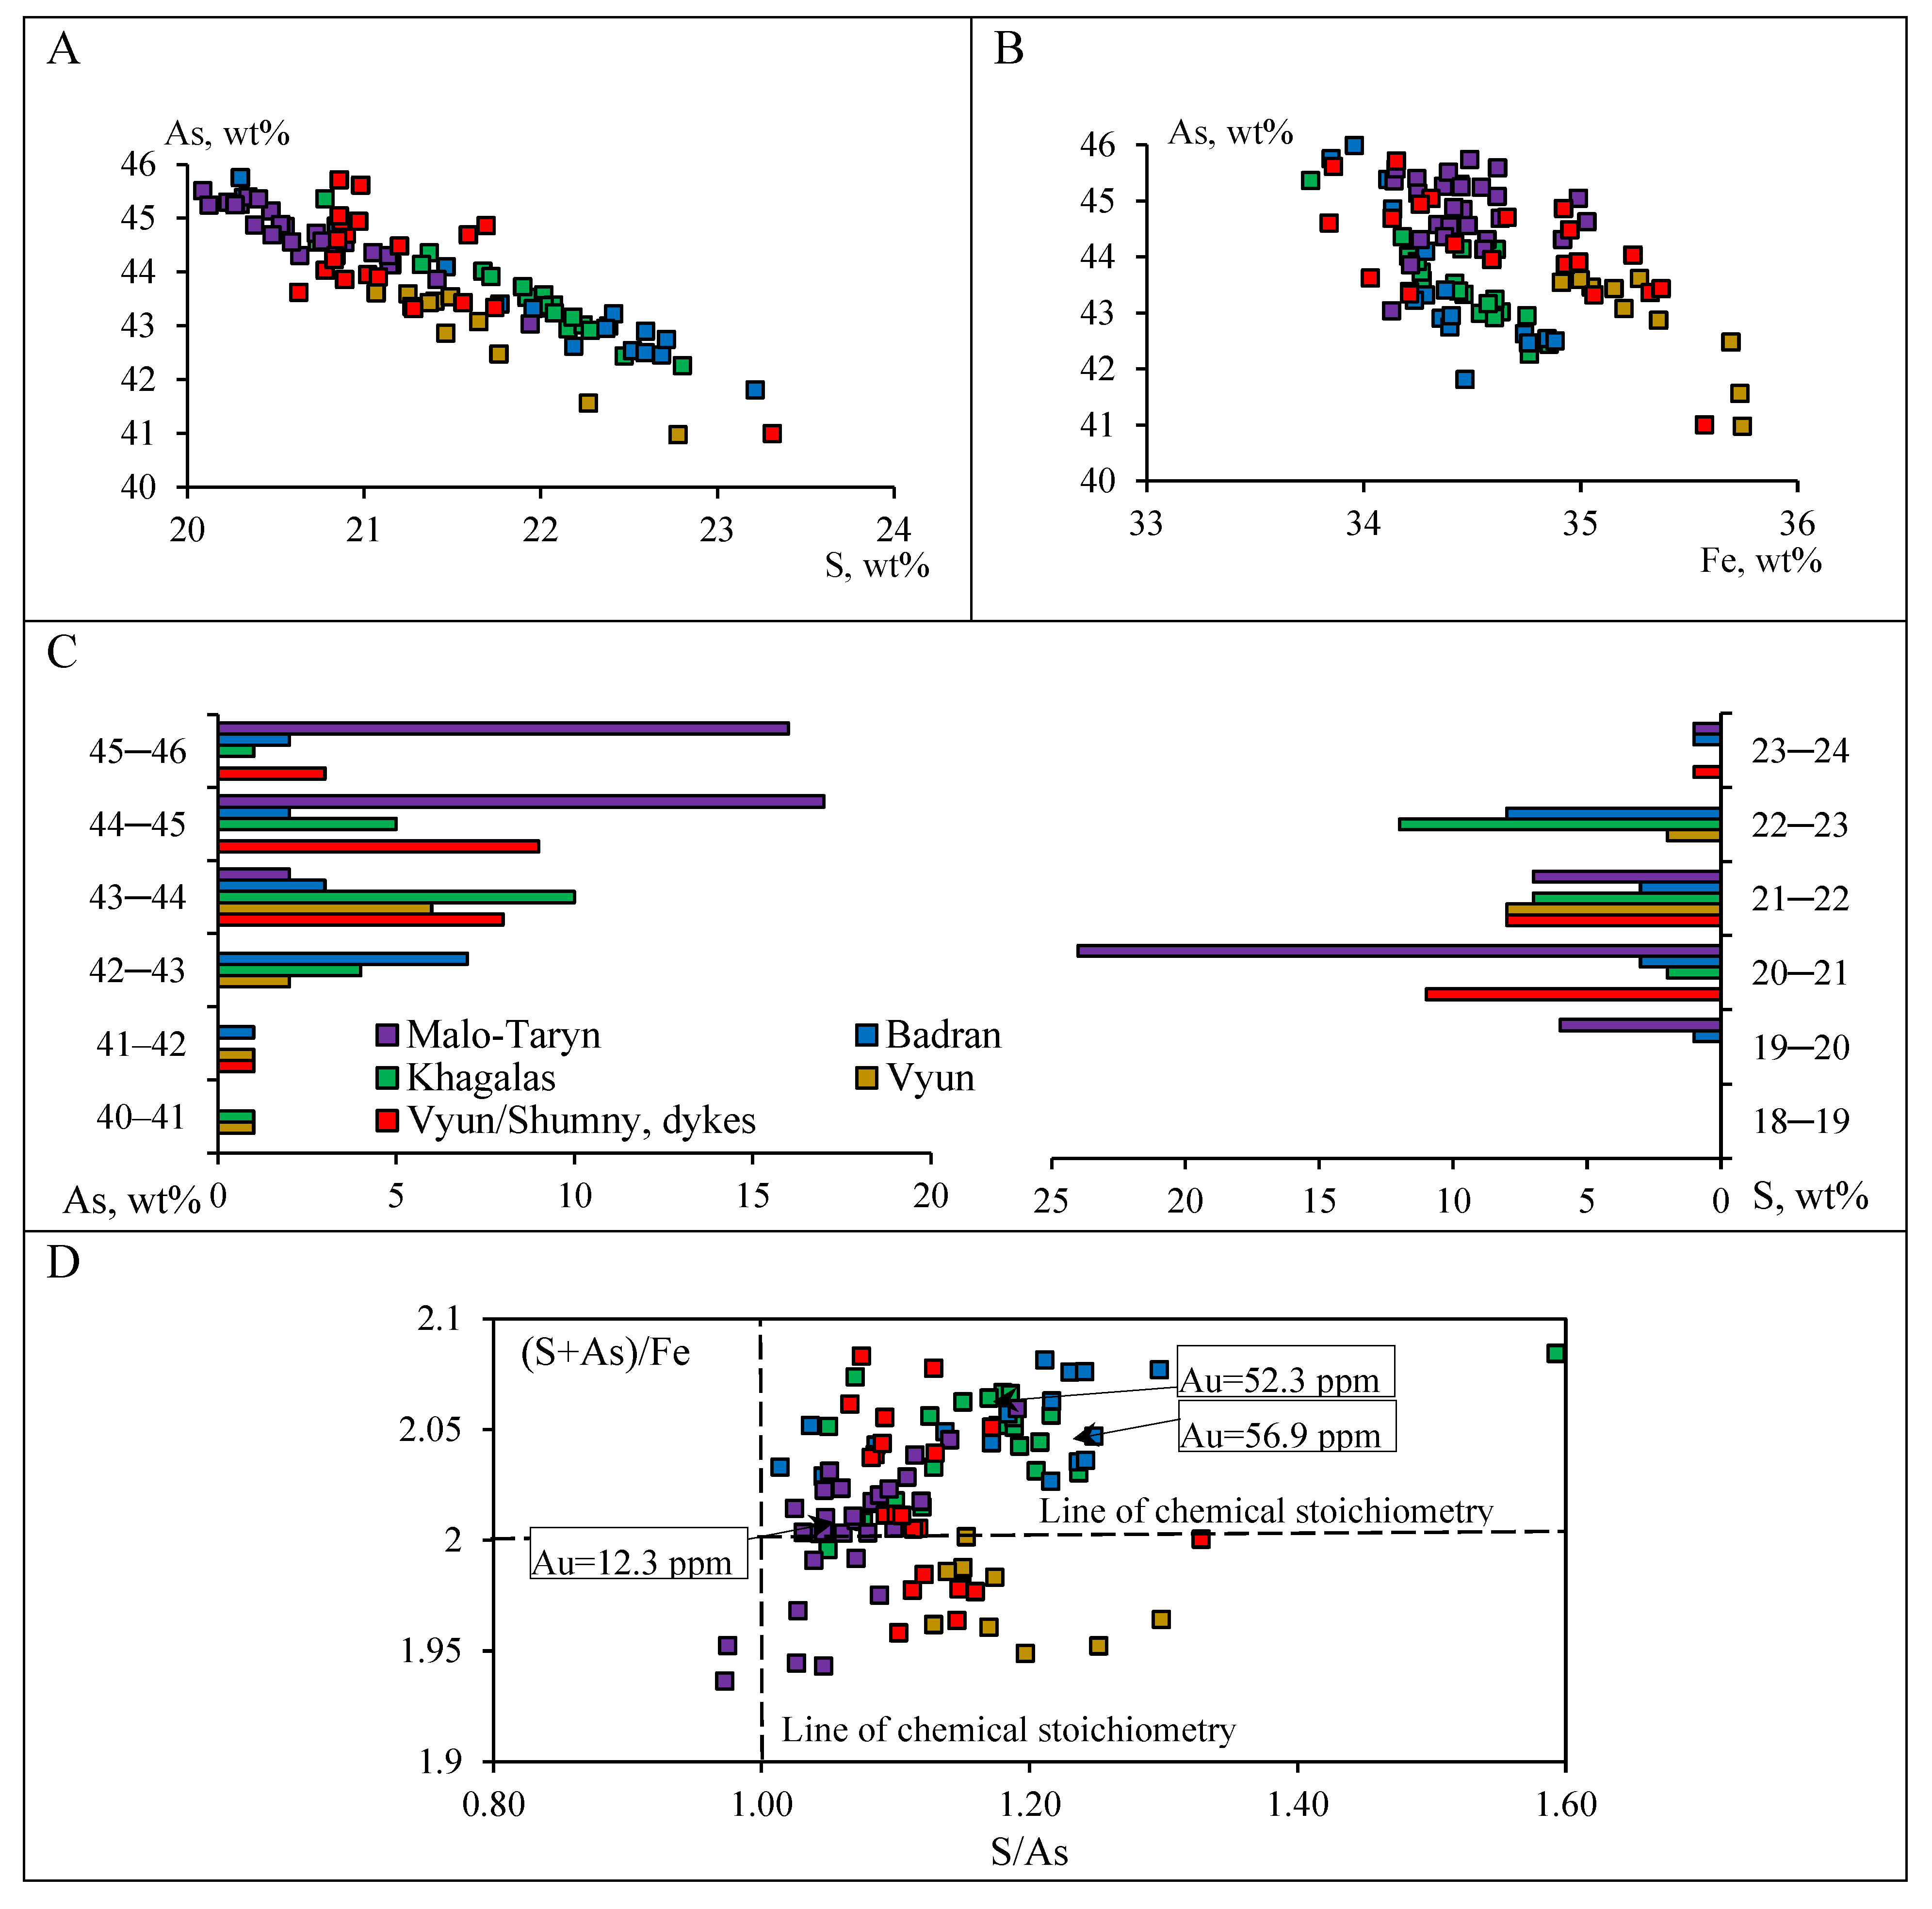
4.2.3. Chemical Composition of Arsenopyrite in Sediment-Hosted Orogenic Gold Deposits

Most of the analyzed Apy1 has a nonstoichiometric composition (in 72% of analyses, Fe/(S + As) ≠ 0.5) and is rich in sulfur (As/S from 0.77 to 0.99). In some cases, the ratio is As/S > 1.0. For Apy1, the trace elements Co, Ni, Cu, and Sb are typomorphic (Supplementary Table S2, Figure 13). Other elements are present in quantities below the detection limit of EPMA analyses.
The concentrations of typomorphic elements vary significantly, and in most of the analyzed grains, Σ (Co, Ni, Cu, Sb) is no more than 0.15 wt% (Figure 13A, Figure 14). The ratios of trace elements are individual for different deposits (Figure 13B). Thus, at the Malo–Taryn deposit, Sb accounts for 60% of the trace elements, and at the Khangalas deposit, 45% is Co. Antimony is found in all the analyzed grains; its content is not stable (Vσ up to 124%), but this is the main trace element in Apy1.
Figure 13. Distribution of trace elements in arsenopyrite1 of the studied OGDs, central YKMB: (A) content of Σ (Co, Ni, Cu, Sb); (B) the ratio of individual trace elements in the studied deposits.
Minerals 13 00394 g013

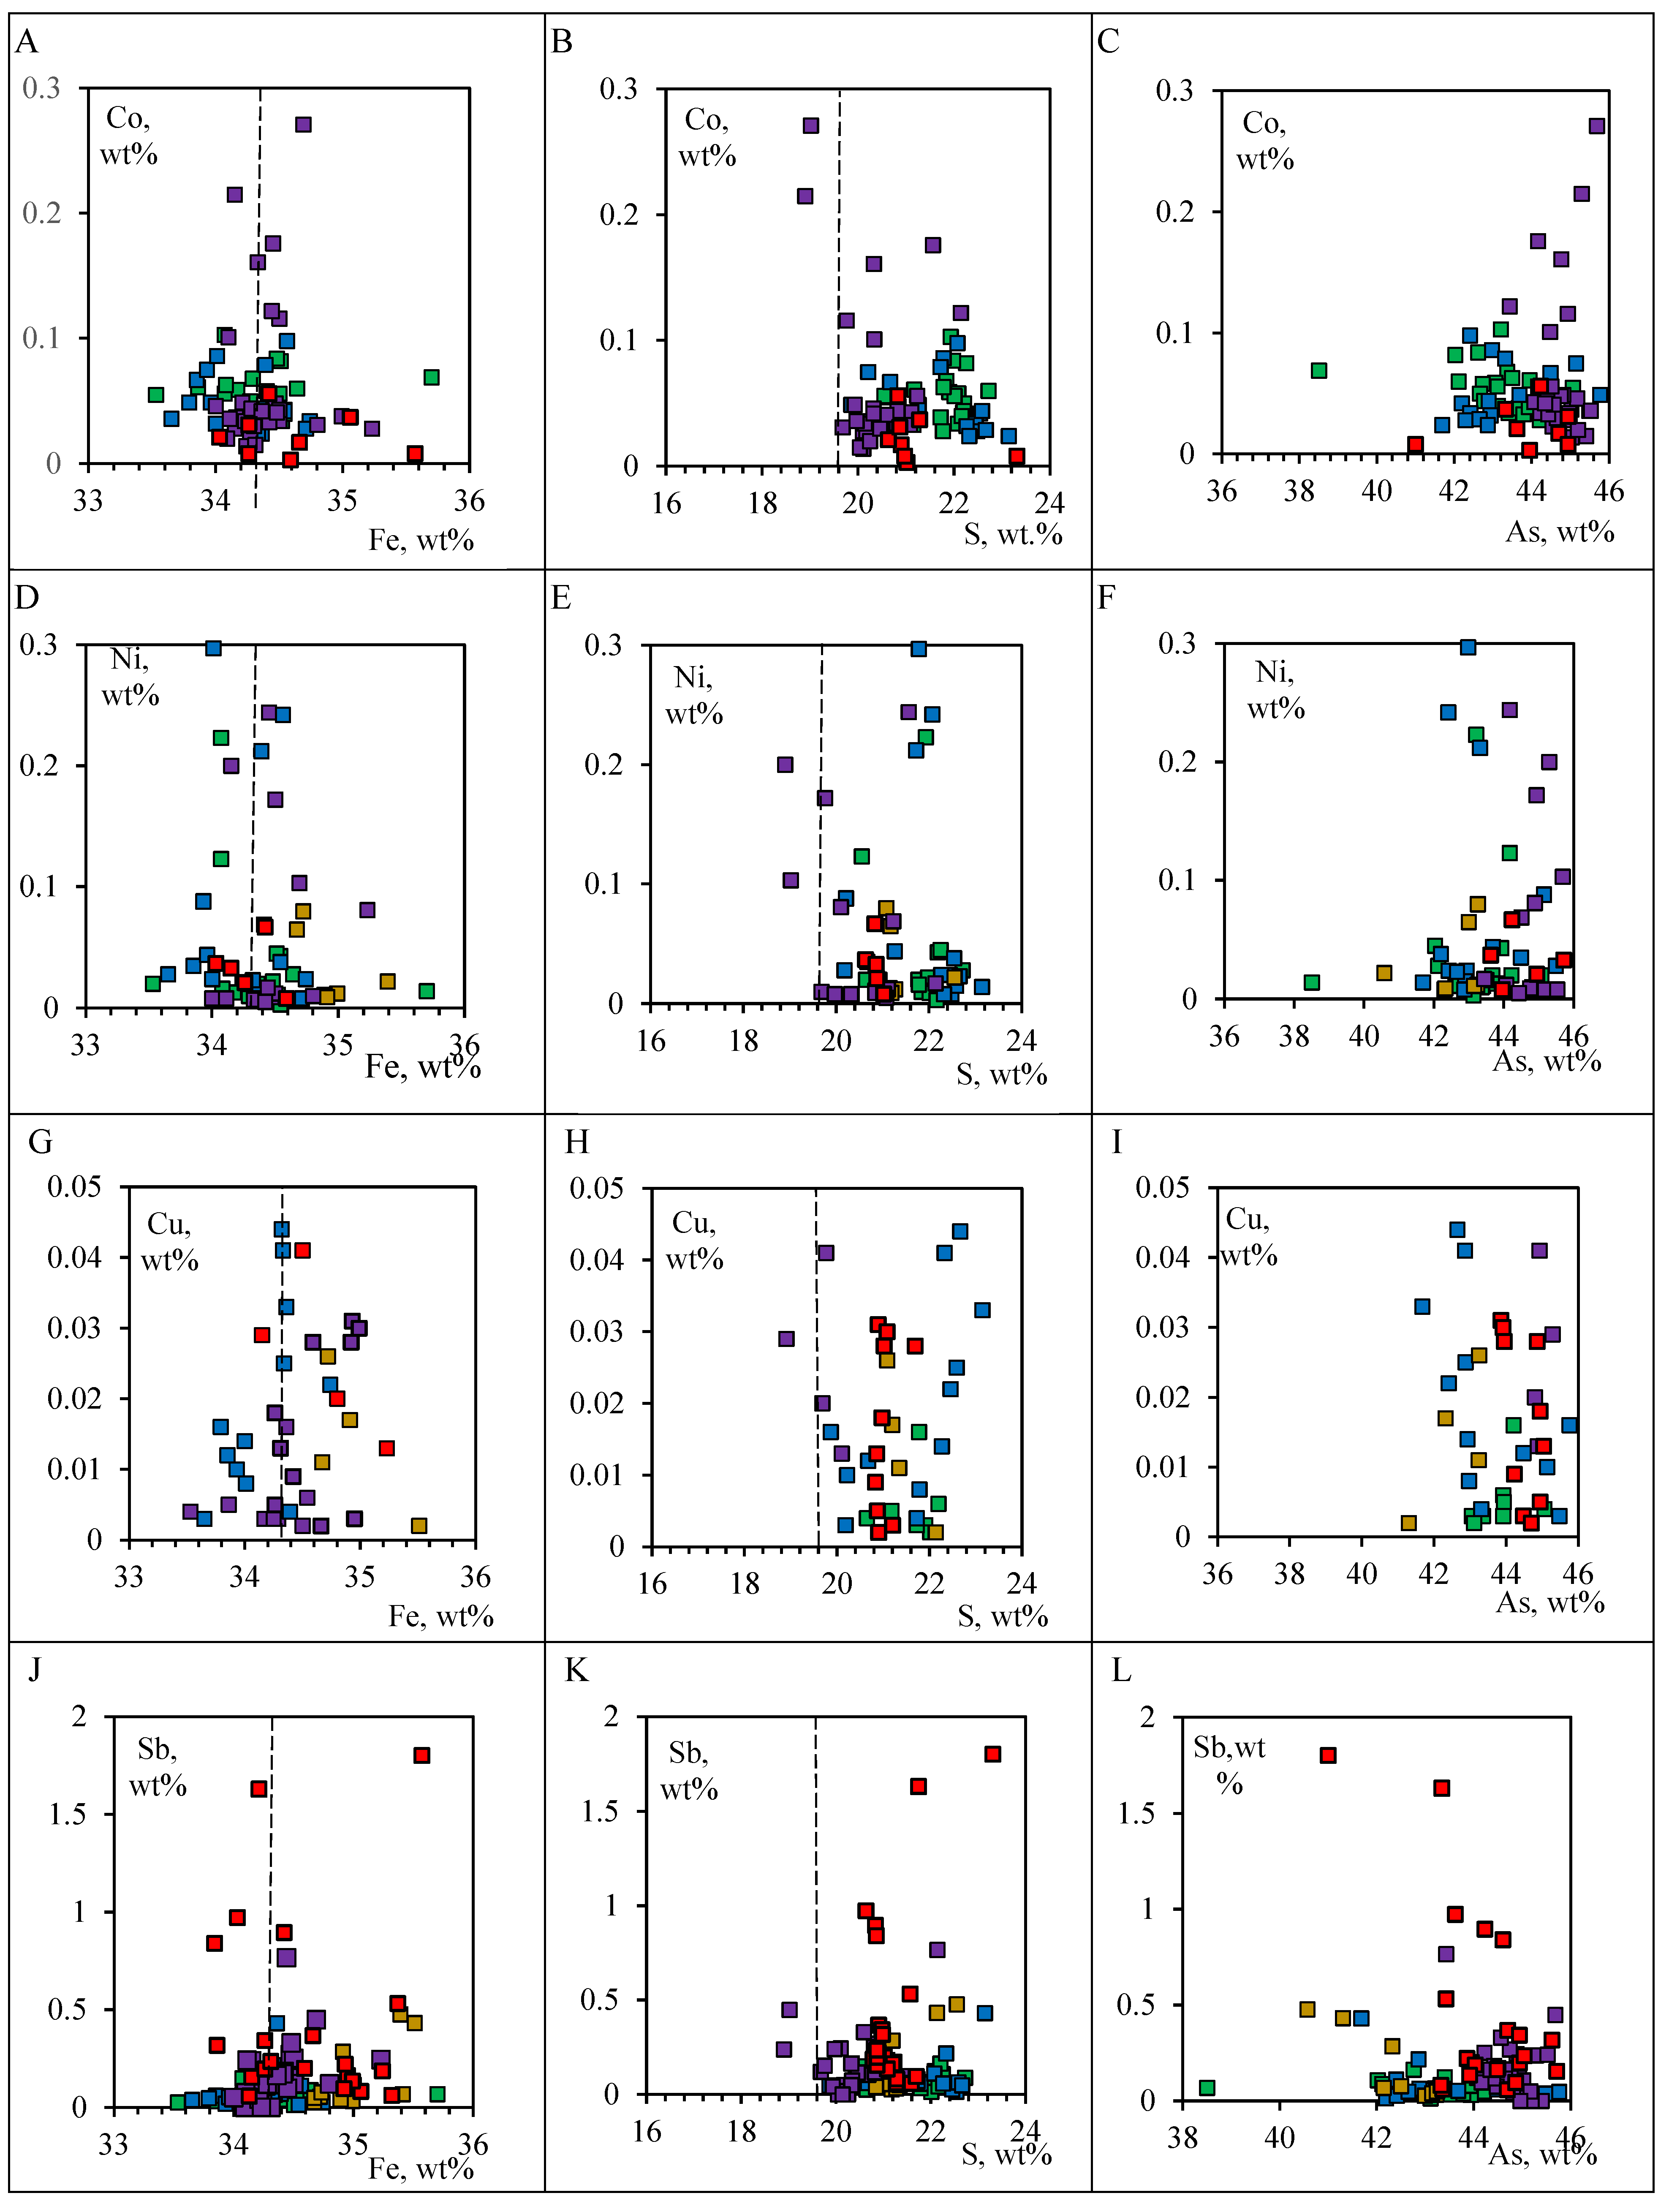
4.2.4. Chemical Composition of Arsenopyrite in the Intrusion-Hosted Orogenic Gold Deposits

Arsenopyrite1 in intrusion-hosted orogenic gold deposits is rare. Most of the analyzed arsenopyrites from the dykes of the V’yun deposit have a nonstoichiometric composition (in 67% of analyses, Fe/(S + As) ≠ 0.5) and are rich in sulfur (As/S from 0.75 to 0.94). For Apy1 intrusion-hosted orogenic gold deposits, the typomorphic element is Sb (Supplementary Table S2), averaging 85% of the total volume of the trace elements. In some samples, the Sb content reaches 1.03–1.8 wt%. Ni and Cu were determined in 65% of the analyzed grains; Co in the Apy1 of the dykes is present within CCo = 0.01–0.07 wt% and in clastic rocks in quantities below the detection limit of EPMA analyses.
Figure 14. Boxplots showing the compositional difference in the arsenopyrite1 of the studied OGDs, central YKMB, in this study acquired by EPMA. The lower border of the line shows the minimum value; the upper one shows the maximum value. Horizontal lines in the boxes denote the median, the X marks in the boxes denote the mean, and the bottom and top of each box denote the first and third quartiles, respectively. Concentrations are on a logarithmic scale.
Minerals 13 00394 g014

4.3. Gold and Silver Content of Sulfides from Proximal Alteration according to AAS Data

Data on the gold and silver content in pyrites and arsenopyrites from the proximal alteration are shown in Table 4 and illustrated in Figure 15.

4.4. Sulfur Isotopic Composition of Sulfides

The δ34S isotopic composition of pyrite and arsenopyrite from the Malo–Taryn, Badran, and Khangalas proximal alterations in the sediment-hosted deposits and the V’yun and Shumnyi proximal alterations in the intrusion-hosted deposit of the central YKMB is shown in Table 5.

4.4.1. Sediment-Hosted Orogenic Gold Deposits

In three analyses of Py grains from the alteration of the Malo–Taryn deposit, δ34S has a range from −5.5 to +1.4‰; two analyses of Apy grains provided a restricted δ34S range—−1.6 and −1.4‰. The δ34S values of Py and Apy from the alteration sampled at various depths (from 587 to 916 m) of the Badran deposit have a narrow range of values, from −1.1 to +1.9‰. The highest variations of δ34S are determined in 26 analyses of Py (from −0.7 to +1.9‰, mean +0.8‰, median +1.0‰), and 16 analyses yielded a δ34S Apy range of −1.1 to +0.1‰ (mean −0.4‰, median −0.3‰). The sulfur δ34S isotopic composition of sulfides from the alteration of the Khangalas deposit is characterized by a narrow range of negative δ34S values, from −2.1 to −0.6‰, according to seven analyses of Py (from −1.9 to −0.6‰, mean −1.2‰, median −1.3‰) and four analyses of Apy (from −2.1 to −1.1‰, mean −1.5‰, median −1.3‰).

4.4.2. Intrusion-Hosted Orogenic Gold Deposits

At the V’yun deposit, there is a heterogeneous δ34S in the sulfides. The highest variations in six analyses of δ34S are determined in Py from dykes (from −6.4 to +3.1‰, mean −1.9‰, median −3.3‰). The highest δ34S values are determined in Py (from +2.3 to +5.6‰, mean +4.0‰, median +4.1‰) and Apy (+4.4‰) from clastic rocks. Seven analyses of δ34S in Py from the alteration of the Shumnyi deposit yielded positive values from +2.1 to +5.1‰. There are no evident isotopic variations between δ34S in Py from sandstones (from +4.3 to +5.0‰) or from dykes (from +2.1 to +5.1‰, mean +3.4‰, median +2.5‰).

5. Discussion

5.1. Composition of Pyrite3 and Arsenopyrite1

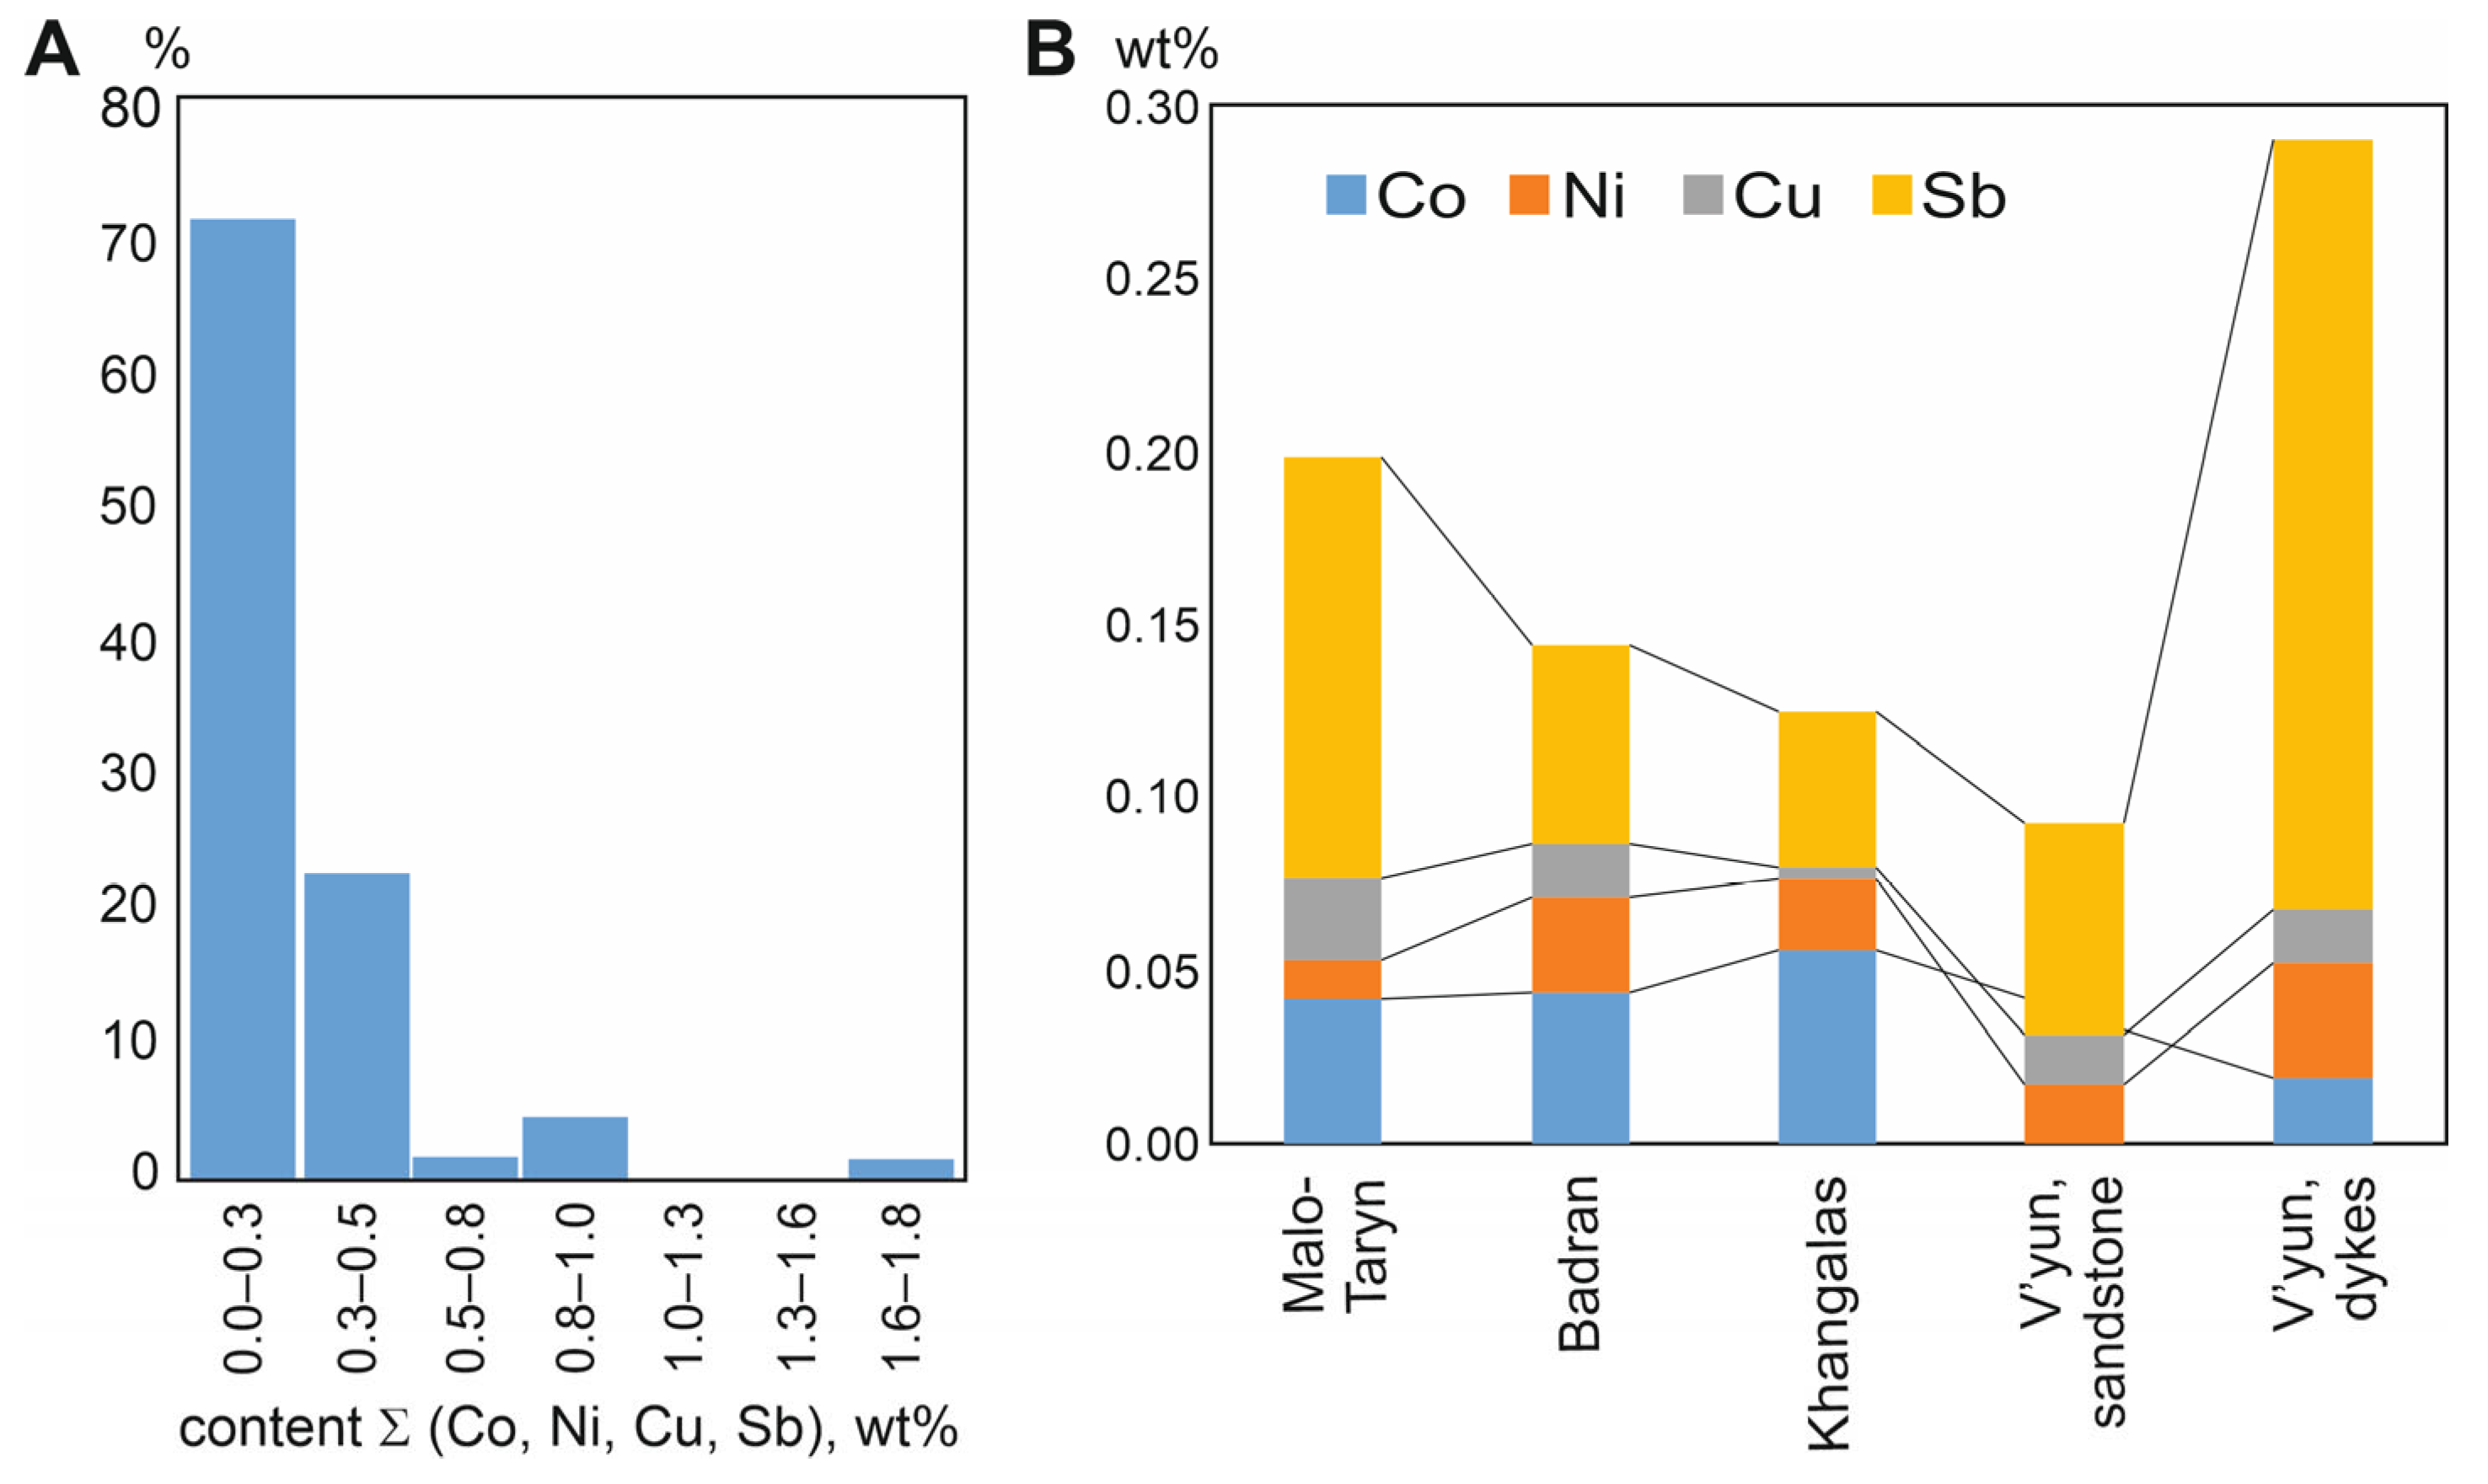
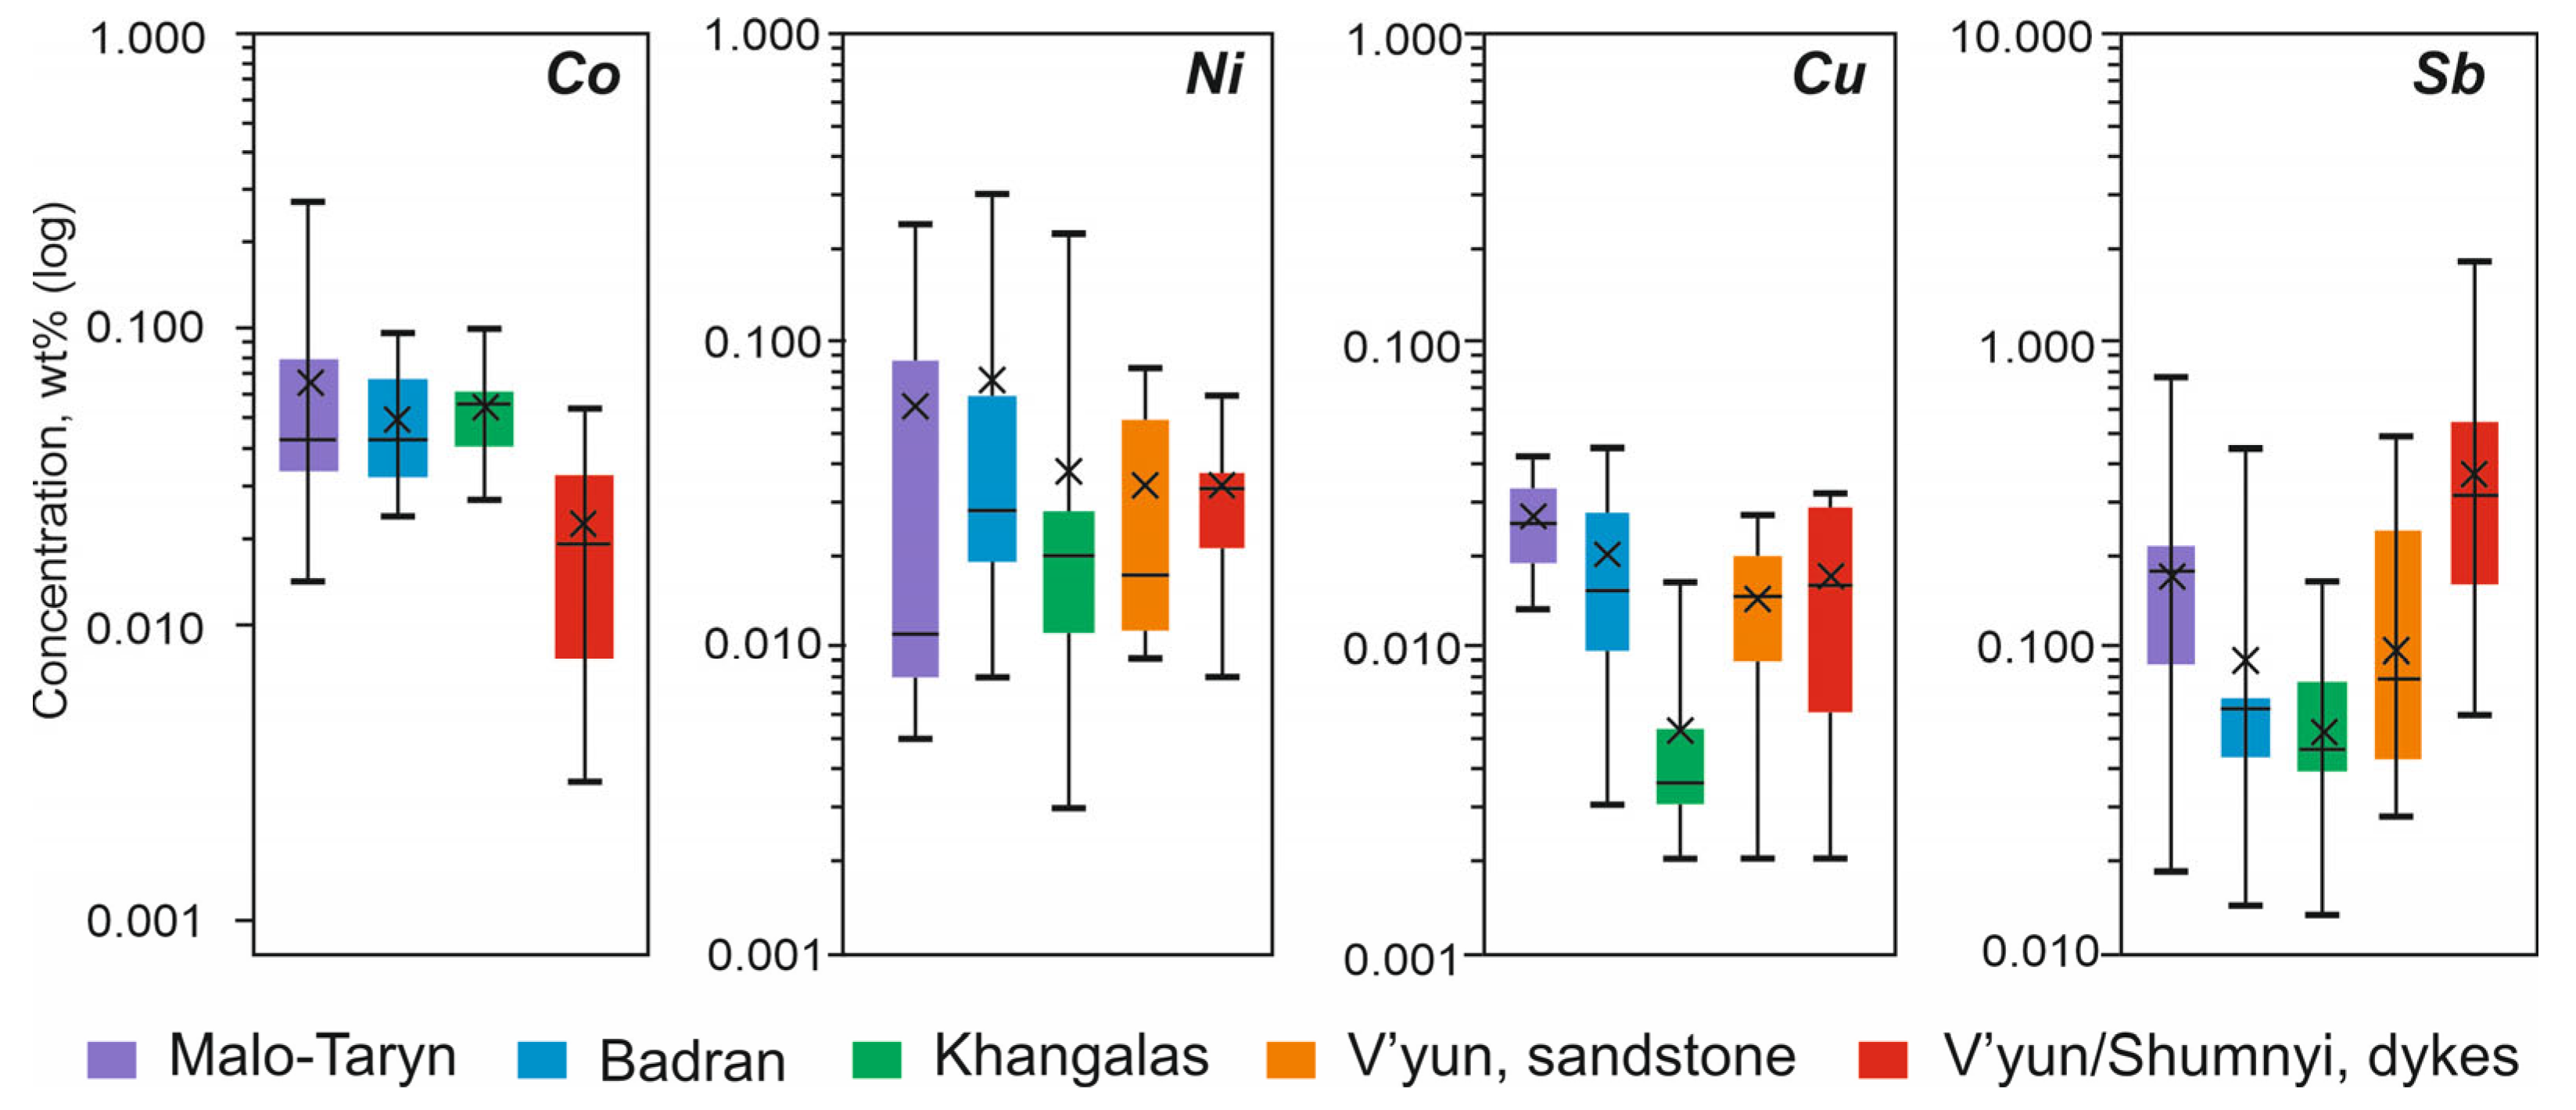
5.1.1. Incorporation of Metals and Metalloids in Pyrite3

Microelements in pyrite can be in the form of isomorphic trace elements and in the form of micro- and nanoinclusions. Concentrations of trace elements and their correlations with the major elements indicate the form and conditions of their accumulation in pyrite, as well as the evolution of the ore formation conditions.
Arsenic is the most informative in the composition of pyrite. A number of researchers, analyzing changes in the shape and concentration of As in pyrite from gold deposits of various types, suggest using As to explain the evolution of the hydrothermal system [103]. The chemical zoning of As in pyrites may be the result of physicochemical changes in the composition of the ore-forming fluid [104,105,106,107,108] and the effects of magmatic fluids (magmatic vapor plumes) [105].
It was mentioned in Section 4.2 that the Py3 from sediment-hosted (Malo–Taryn, Badran, Khangalas) and intrusion-hosted (V’yun, Shumnyi) gold deposits are characterized by nonstoichiometric compositions. The S/Fe ratio varies in individual deposits within sufficiently large ranges (V’yun, S/Fe = 1.87–2.04; Badran, S/Fe = 1.88–2.09). According to the obtained results from the EPMA analysis, Py3 differs from the calculated values (Fe = 46.55 wt% and S = 53.45 wt%) (Figure 16) and indicates the presence of vacant positions in the structure of pyrite, which are occupied by trace elements. The As-Fe-S ternary diagram demonstrates the possible variants of the occurrence of microelements in the composition of pyrite (Figure 16) [104]. Mainly, As isomorphically replaces S (As1−) (Figure 16), but it can replace Fe in the crystal lattice Fe (As2+ and As3+) [109,110] or may occur in the form of nanoinclusions (As0) [104]. The isomorphic substitution of Fe is the main mechanism for the inclusion of Co, Ni, Cu, Sb, and Pb (Me2+) in the composition of pyrite [33].
The negative trend between concentrations of elements also confirms the isomorphic substitutions. This is most clearly manifested for the S-As pair (Figure 17A): elevated As contents are characteristic of pyrites with a deficit of sulfur; for the entire sample population, rS-As = −0.68, and it increases in individual objects (Malo–Taryn, rS-As = −0.77; Vyun dykes, rS-As = −0.80). The correlations between Fe, S, and other trace elements are variable and are better expressed in individual objects (Malo–Taryn, rS-Cu = −0.54; Shumnyi, rFe-Cu = −0.65) (Figure 17). Pyrites from igneous rocks are characterized by a negative correlation for the pairs Fe2+→ Co2+ and Fe2+→ Ni2+(r = −0.7–−0.9) (Figure 17C,D). The similar incorporation of metals and metalloids in pyrite3 from sediment-hosted (Malo–Taryn, Badran, Khangalas) and intrusion-hosted (V’yun, Shumnyi) gold deposits indicates their unified nature.
Figure 16. Ternary diagram showing the As-Fe-S composition of pyrite in the studied OGDs, central YKMB. The demarcated fields are after [104].
Minerals 13 00394 g016

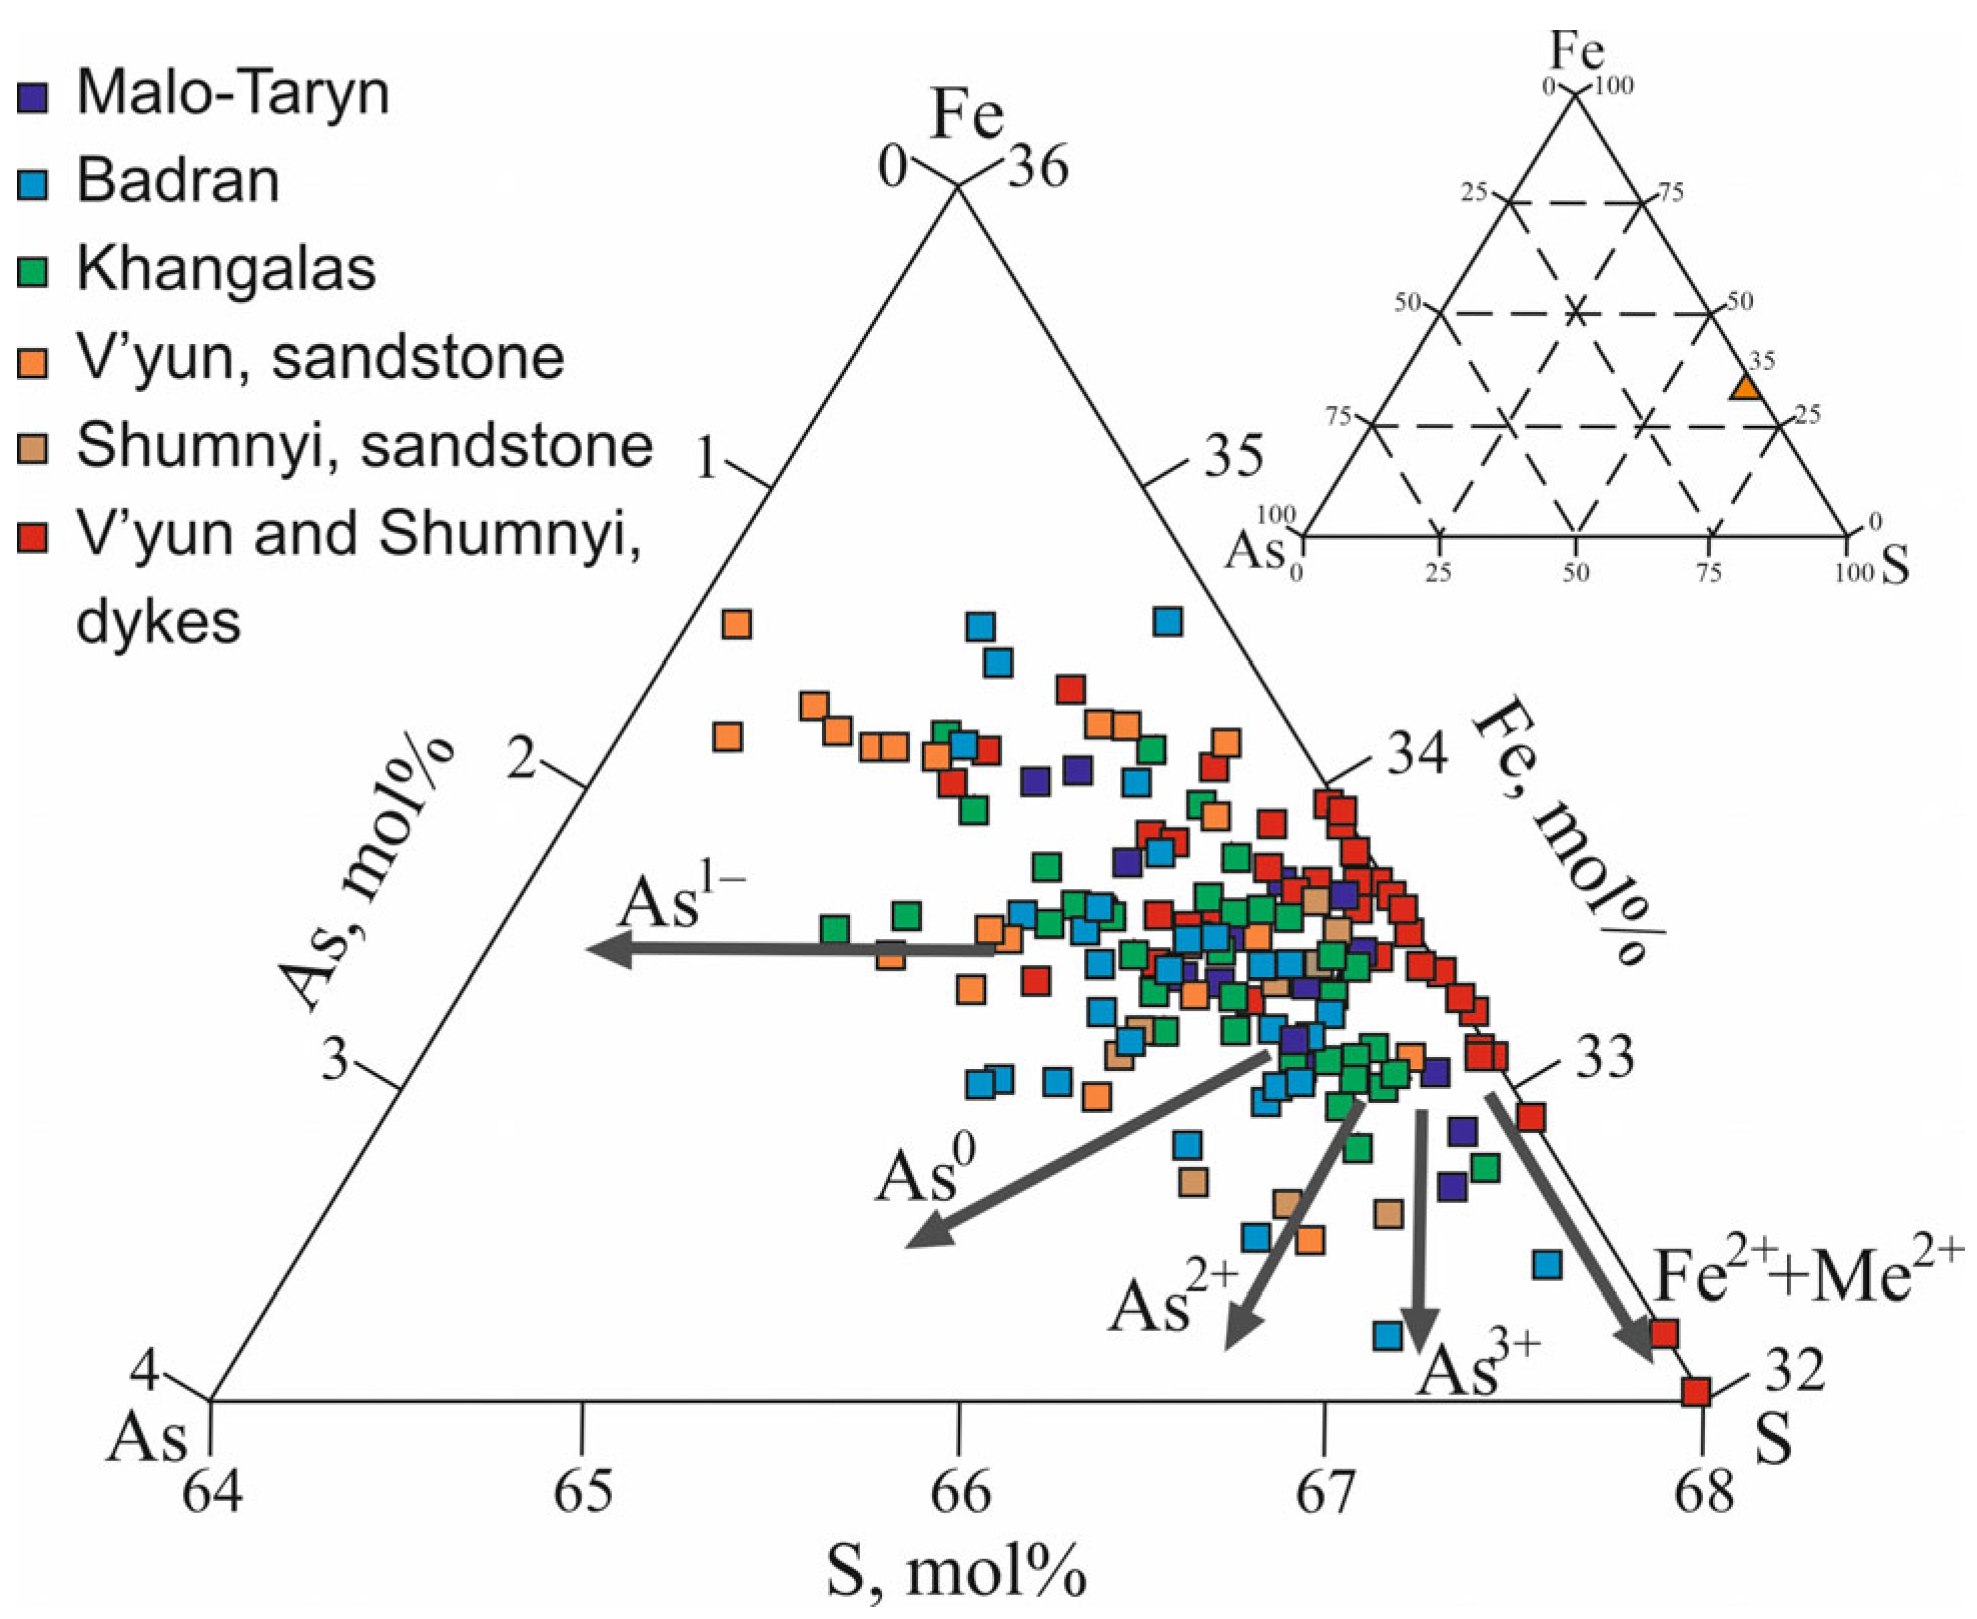
5.1.2. Incorporation of Metals and Metalloids in Arsenopyrite1

Arsenopyrite is a three-component system and the main isomorphic substitutions occur according to the scheme S1− → As1− (r = 0.92–0.99) (Figure 18A) and Fe2+(Fe3+)→ As2+(As3+) (Figure 18B) (r = 0.65–0.89). In the studied Apy1 grains, Fe is characterized by small variations in the content; in 75% of the analyzed grains, CApy = 33.8–34.8 wt%, which, in the mean, corresponds to stoichiometry. The sulfur content in all grains exceeds the stoichiometric composition (19.7 wt%), which varies between 19–24 wt%, with a mean content of CS = 21.3 wt%. The As content is less than the stoichiometric content (46.0 wt% with a mean content). Variations in the concentration of S and As are different in the individual deposits (Figure 18C). Arsenopyrite of the Malo–Taryn deposit is closest to the stoichiometric composition (Figure 18 C,D).
Figure 17. Diagrams of the ratios of concentrations of Fe, S, and trace elements in Py3 in the studied OGDs, central YKMB. (A) S vs. As; (B) Fe vs. As; (C) Fe vs. Co; (D) Fe vs. Ni; (E) S vs. Co; (F) Fe vs. Ni; (G) Fe vs. Cu; (H) S vs. Cu; (I) Fe vs. Co; (J) S vs. Cu; (K) Fe vs. Pb; (L) S vs. Pb. Negative correlation indicates isomorphic substitution. The lines Fe = 46.547 wt% and S = 53.453 wt% correspond to the stoichiometric composition of pyrite. See symbols in Figure 16.
Minerals 13 00394 g017
A diagram of S/As and (S+As)/Fe [111] clearly reflects both the nonstoichiometry and variability of the compositions, as well as the increased sulfur content of Apy3 in the studied deposits (Figure 18). The deficit of Fe and As is compensated by the trace elements (Co, Ni, Cu, Sb). They can occupy both anionic and cationic vacant positions in the crystal structure, and their distribution in arsenopyrite is less ordered than in pyrite. Slight and moderate negative correlations prevail between the main elements and trace elements (Figure 19). The connection between As and Sb is most clearly manifested (r = −0.45–−0.61) (Figure 19L). For alteration arsenopyrites with nonstoichiometric composition and a predominance (excess) of S, many researchers [39,112,113] specify the increased concentrations of Au. The following trend can also be observed in the deposits studied by us (Figure 18D). Significant variations in the S, As, and Fe and trace-element content in the arsenopyrite also indicate the crystallization of the mineral in an inhomogeneous temperature field [111]. This is reflected in the zonal distribution of both trace elements and the gold content of Apy3.

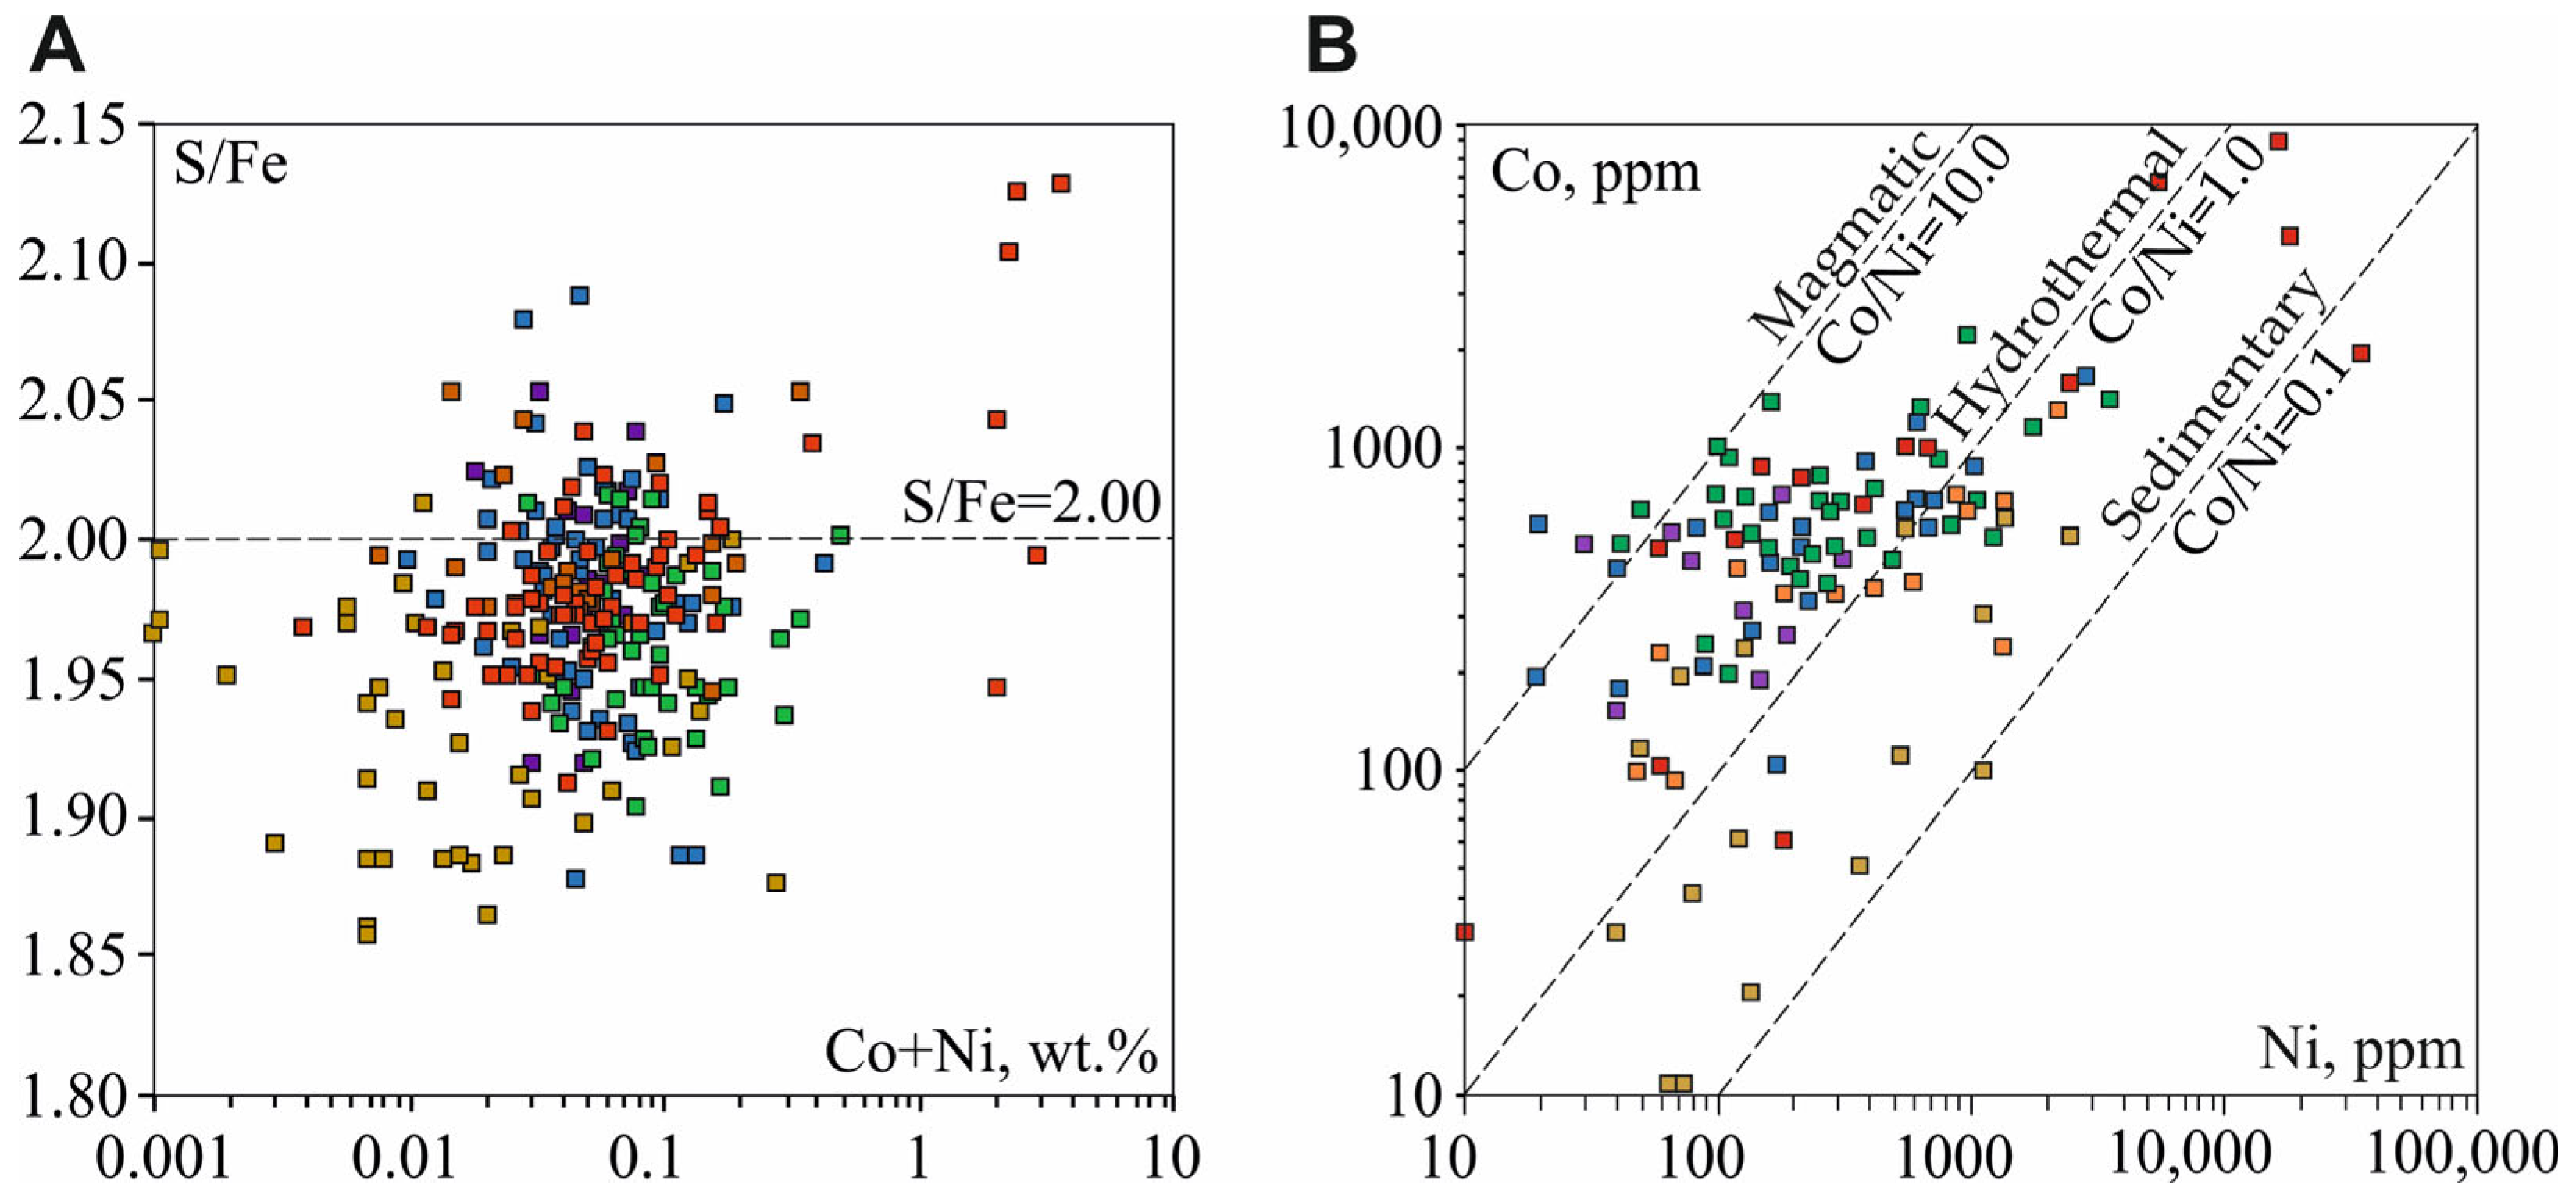
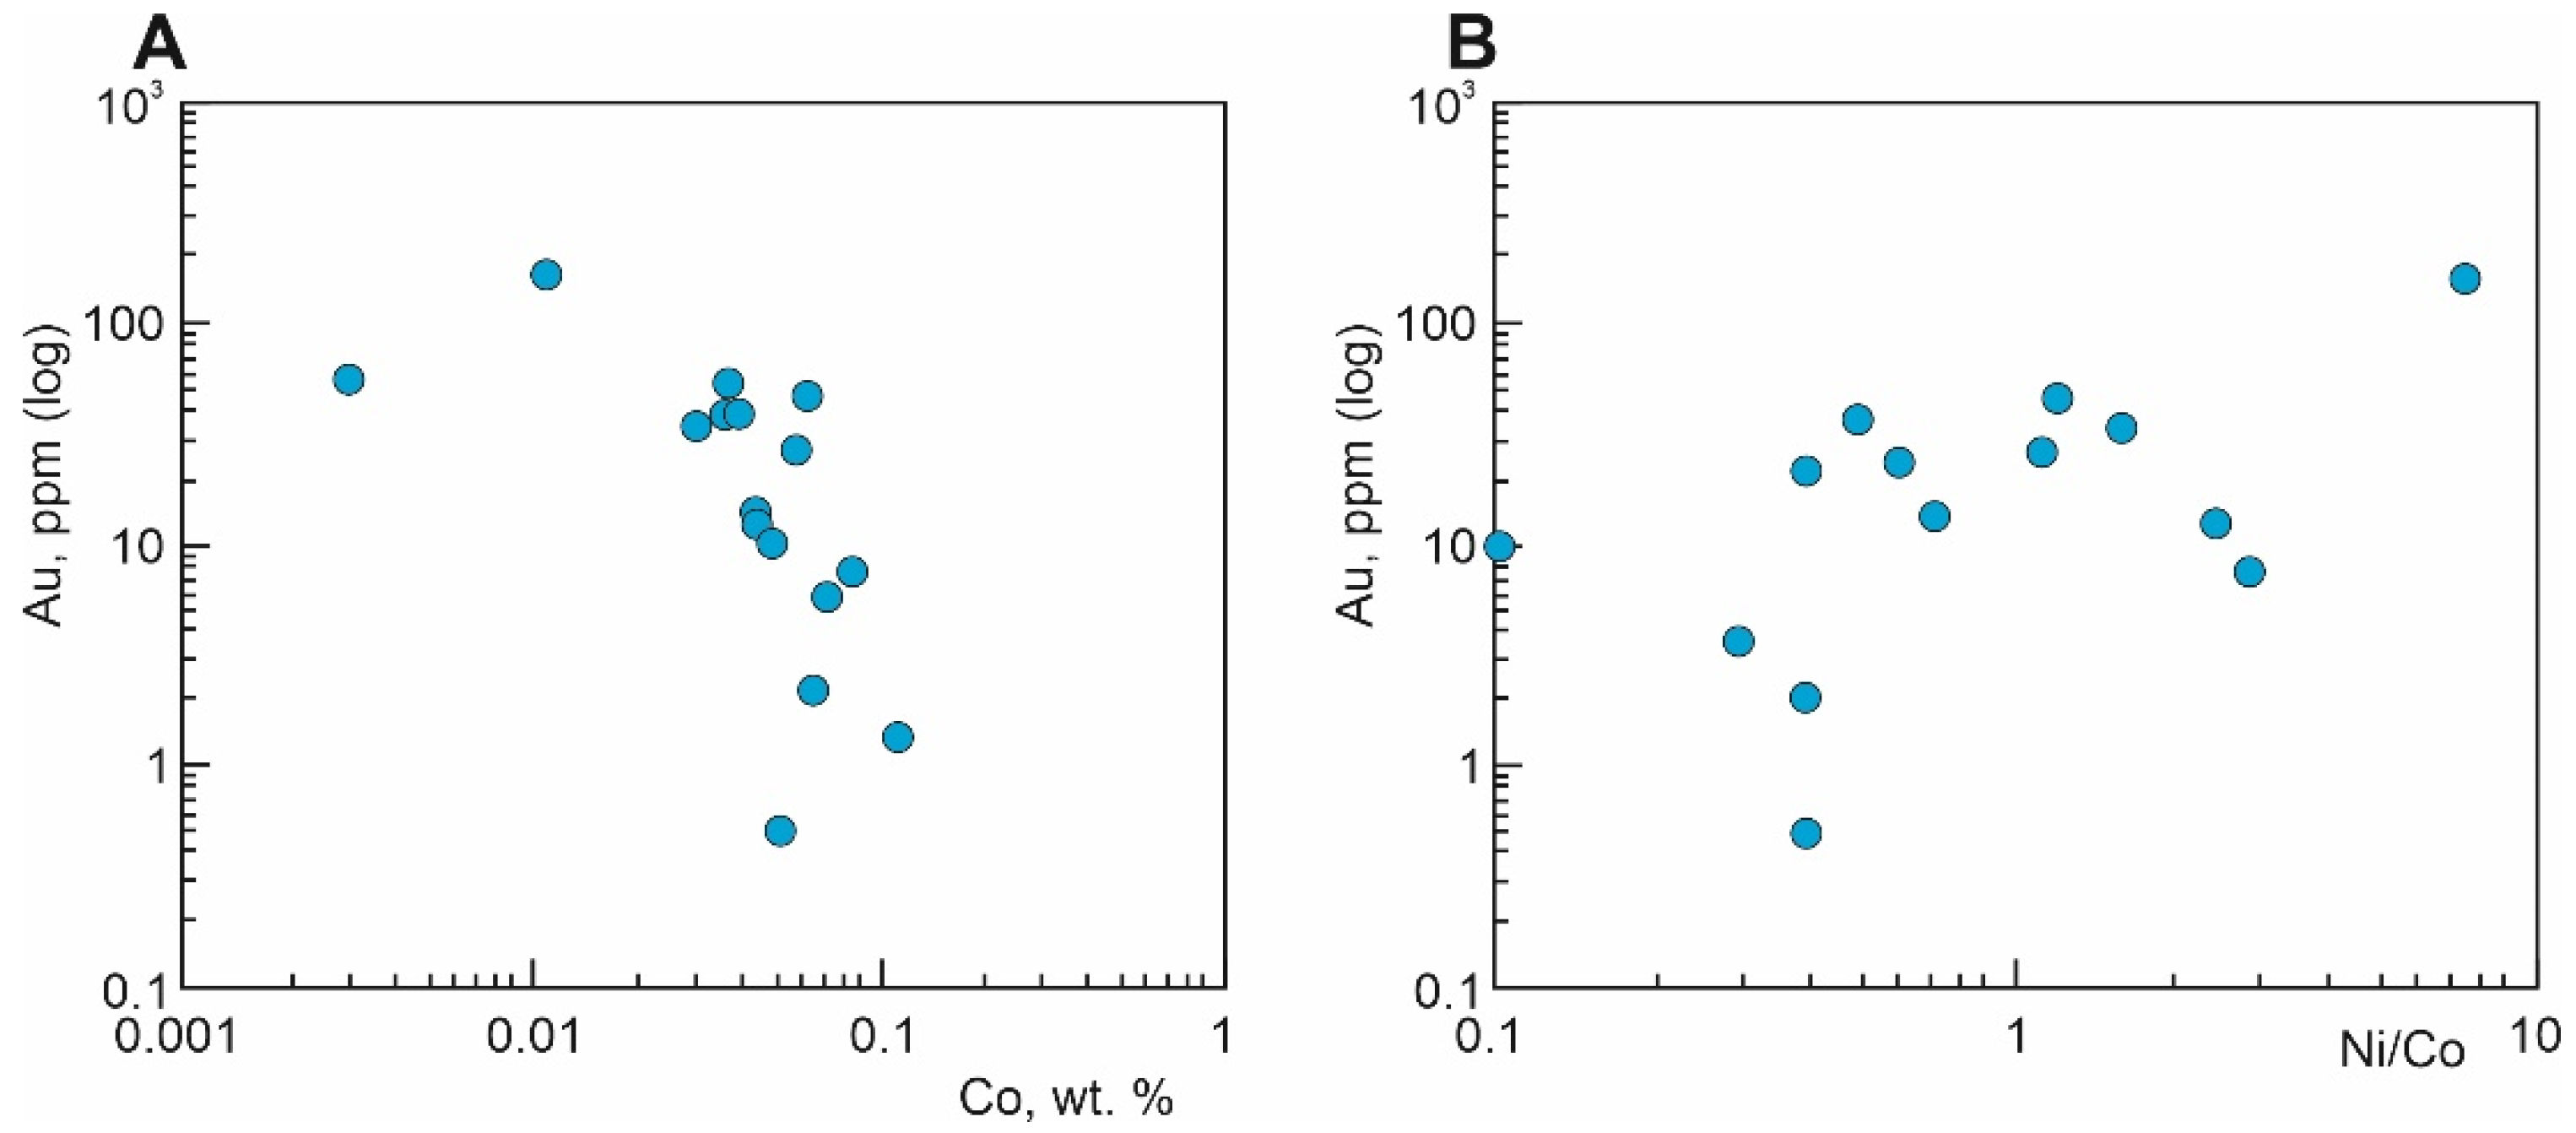
5.1.3. Gold–Cobalt–Nickel Relationships in Pyrite3

The analysis of the Co and Ni content and the ratios of these elements is important for determining the conditions of the formation and genesis of pyrite [29,33,106,114,115,116]. Py3 is characterized by S/Fe ≠ 2.00 (Figure 20A). In most analyses, pyrites are depleted in sulfur, the deficit of which is compensated by As. Co and Ni in the pyrite structure occur mainly as isomorphic replacements of the types Fe2+ → Co2+ and Fe2+ → Ni2+ [117]. Elevated concentrations of Co and Ni are characteristic of pyrites with Fe content of <46.547 wt%, which corresponds to the stoichiometric composition (Figure 17C,D). The deficit of Fe indicates the presence of cationic vacant positions in the pyrite structure, which are filled with Co and Ni [118]. In grains with high iron content, Co and Ni are part of the pyrite structure and are incorporated there via emplacement isomorphism.
Co concentrations vary markedly in the volume of a single grain. Elevated concentrations are characteristic of the central part of the zonal Py3, which can be formed before the formation of mineralization. There is an inverse correlation between Co and Au (r = −0.6) (Figure 21A), which, perhaps, is a temperature effect [119] and indicates the formation of gold-bearing pyrite in low-temperature conditions.
The Co/Ni ratio in Py3 of the studied deposits varies widely (0.1–28.0), but in most analyses, CCo > CNi, and in 90% of analyses, 10.0 > Co/Ni > 0.1, which is typical for hydrothermal pyrite (Figure 20B) [33,102]. High concentrations of Ni in sulfides may indicate [120] the participation of basic and ultrabasic components supplied into hydrothermal fluids and involved in the deposition of sulfides. The Ni/Co ratio can indirectly characterize the gold content of pyrite [119]. Gold is predominantly isomorphic in pyrite with conductivity (Ni/Co > 0.1), and cobalt-rich pyrite (Ni/Co < 0.1) is not gold-bearing (Figure 21B).
Figure 21. (A) Graph showing the relationship between the concentration of Co and Au in Py3 of the studied deposits; (B) graph showing the relationship between the concentration of Au and the Ni/Co indicator of the studied deposits.
Minerals 13 00394 g021

5.2. Gold Occurrence and Concentration in Sulfides from Proximal Alteration

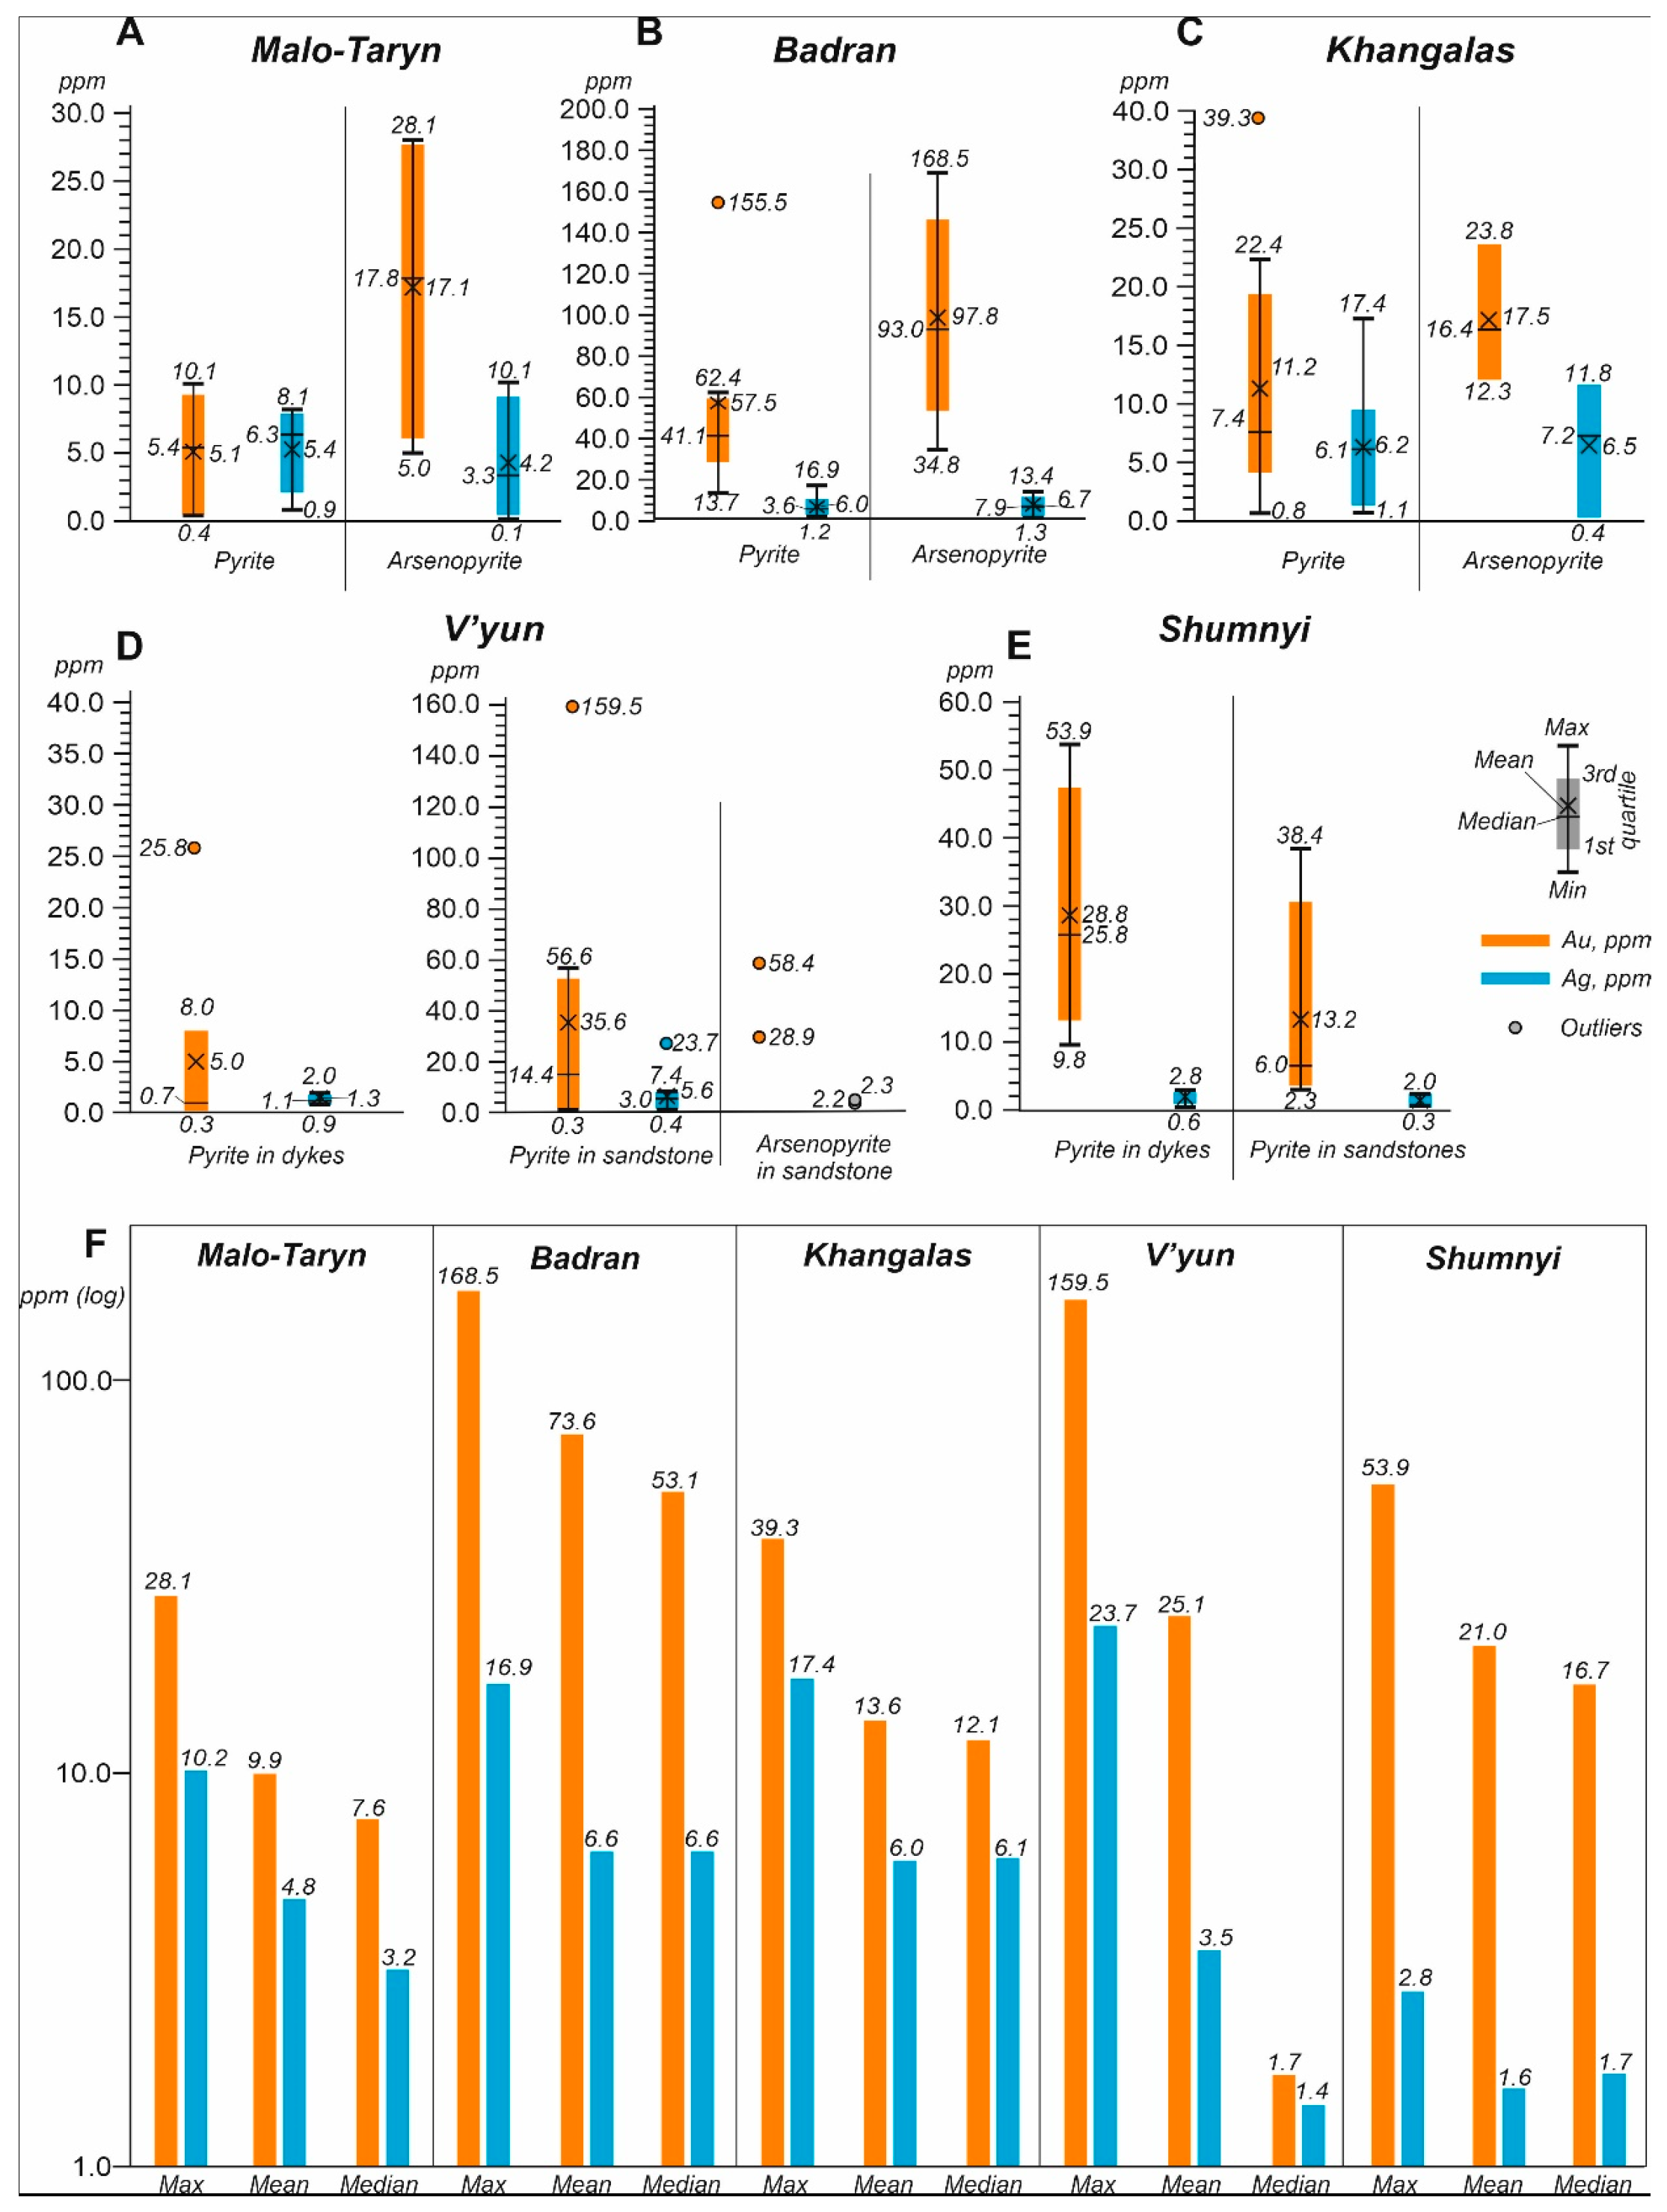
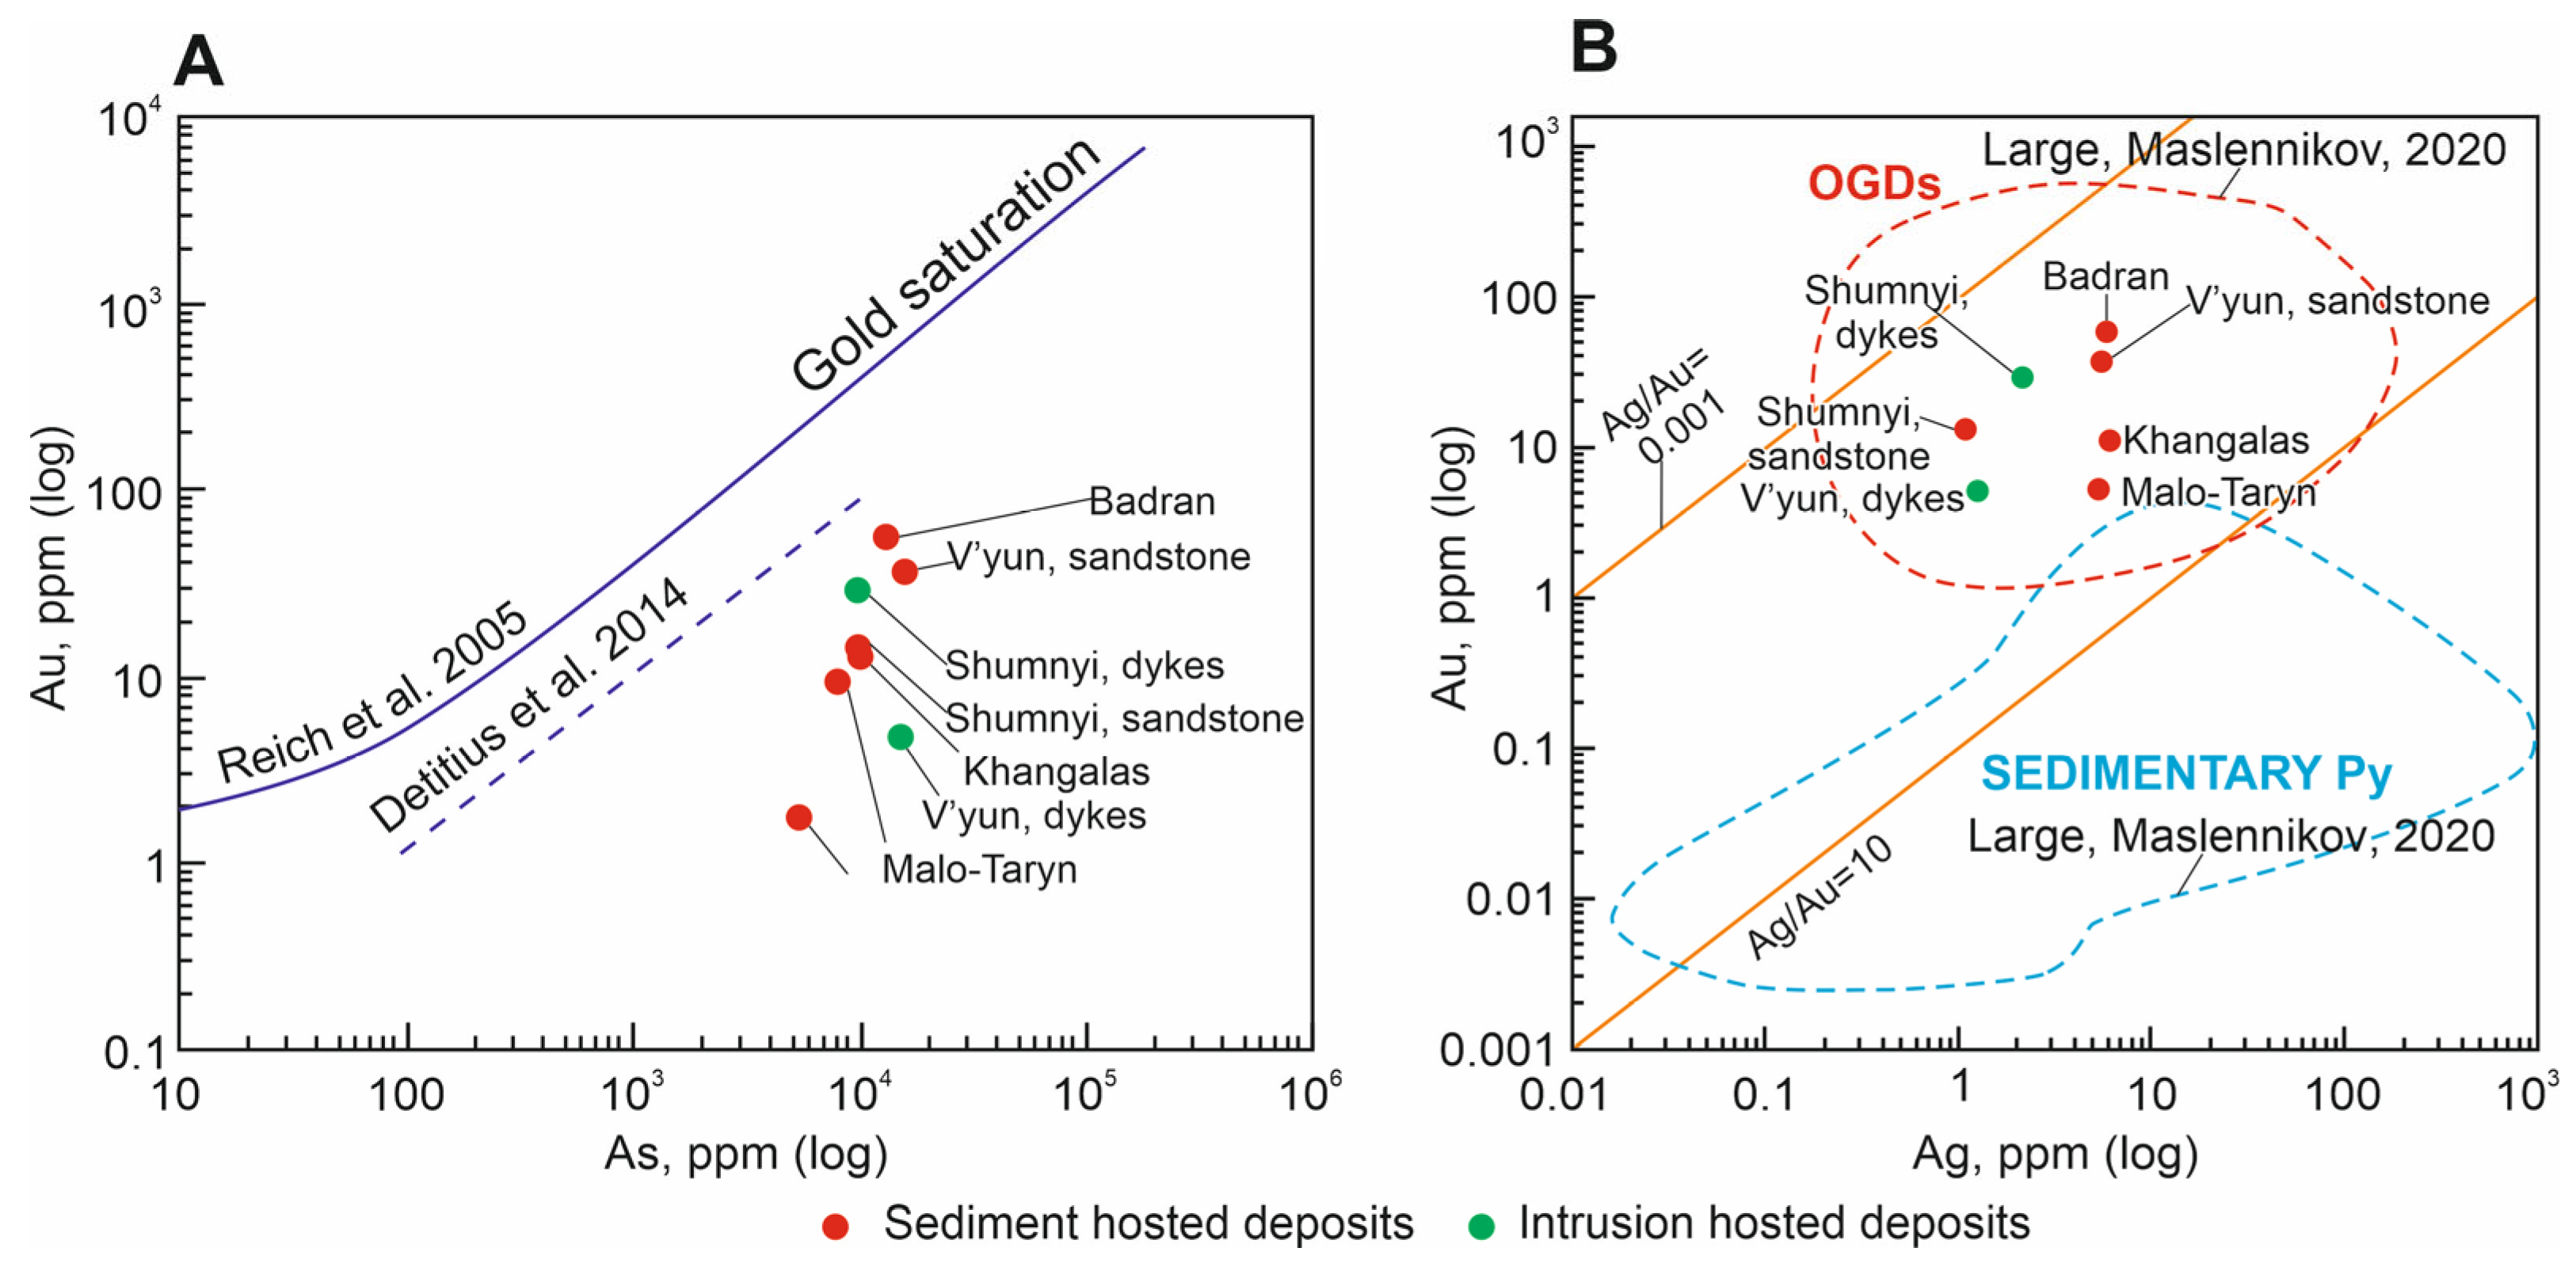
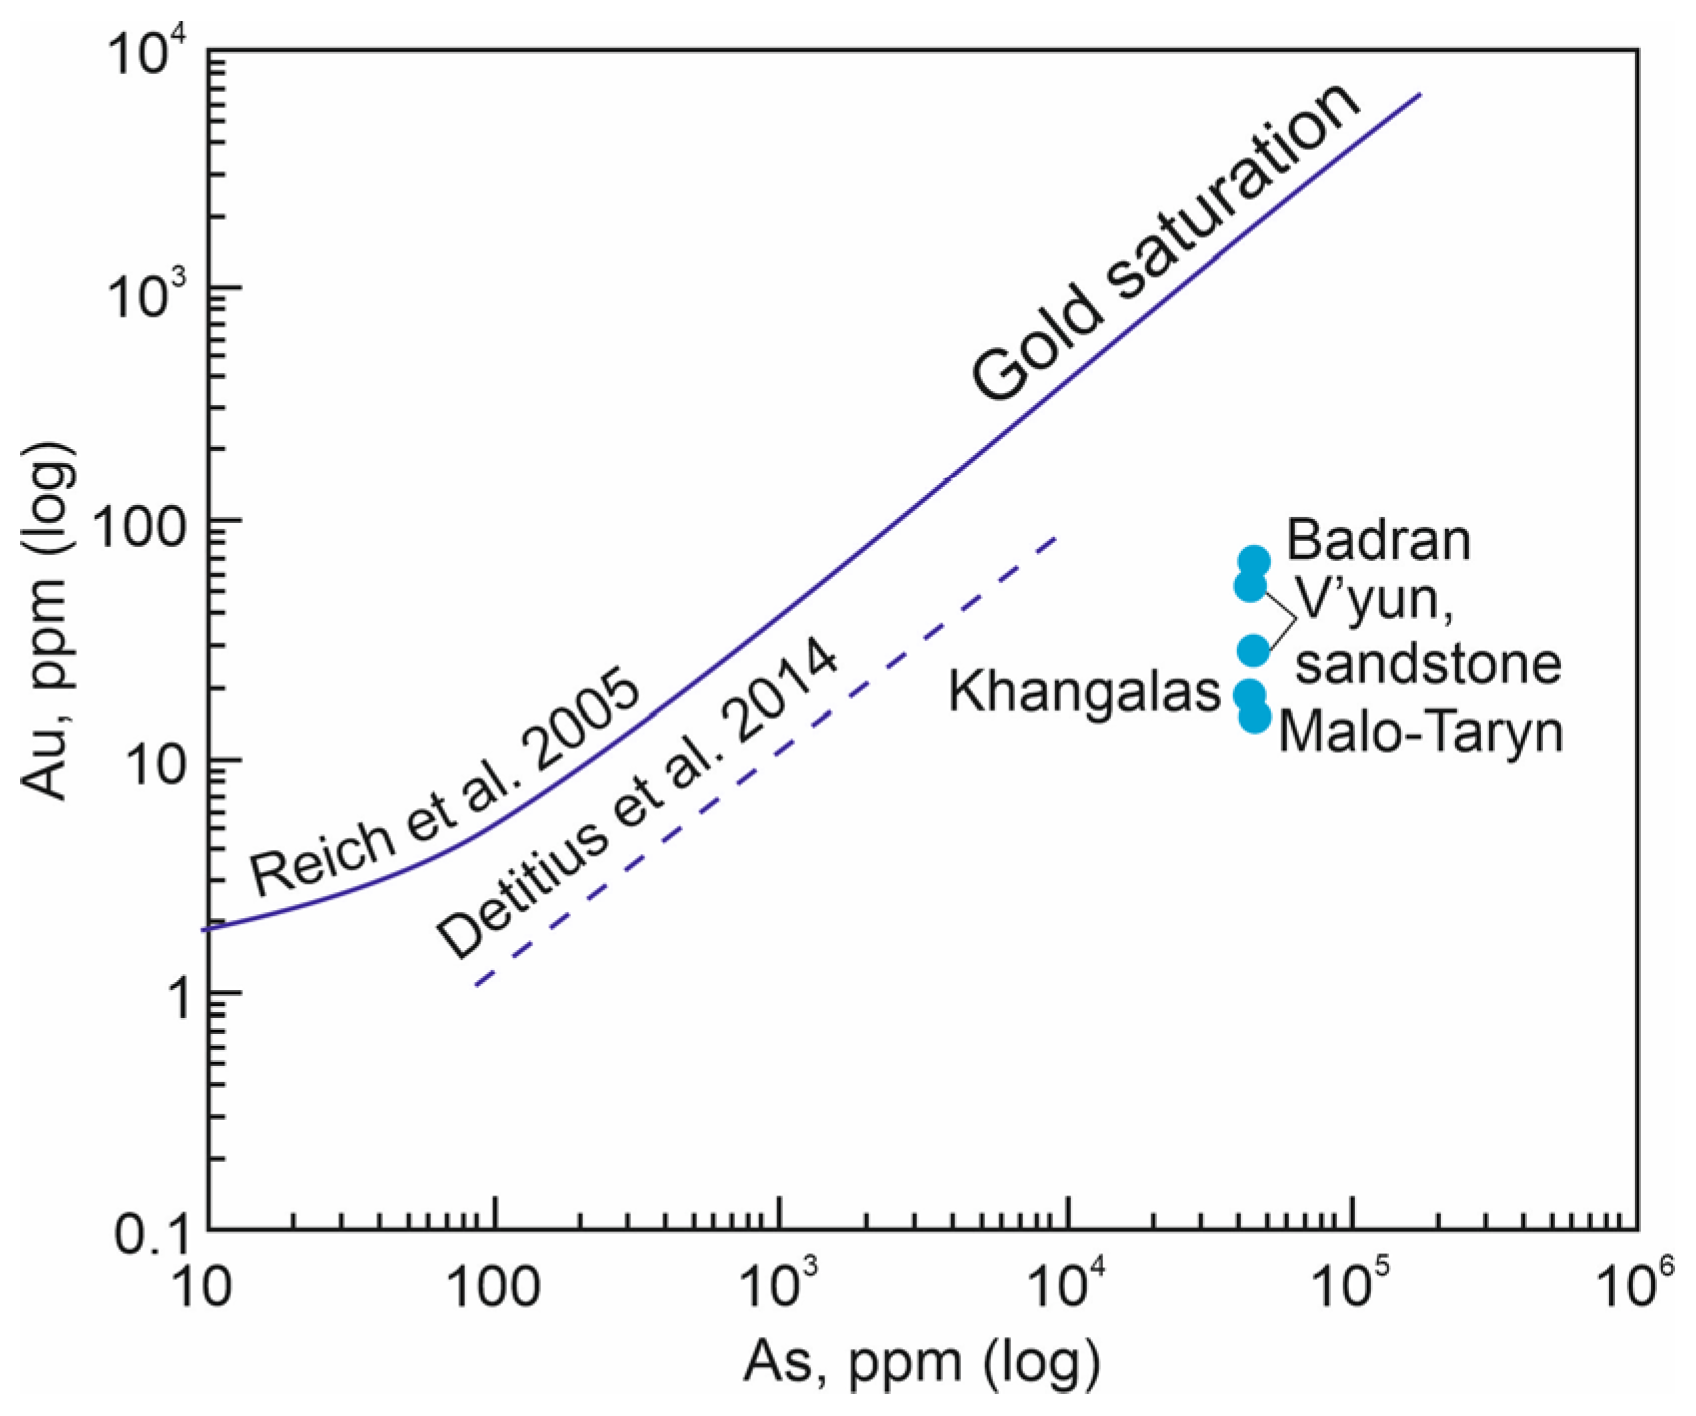
5.2.1. Gold Concentration

Data on the gold content in pyrite and arsenopyrite from the alteration of the studied sediment-hosted deposits are shown in Table 4 and Figure 15. Minimum mean values of Au were obtained for Py grains from the Malo–Taryn deposit (Au—5.1 ppm); the maximum mean values of Au are determined for arsenopyrite from the Badran deposit (66.9 ppm Au). For the proximal alteration of the V’yun and Shumnyi intrusion-hosted deposits, there are obvious differences between the gold contents in sulfides from clastic rocks compared with dykes. In alteration rocks from dykes in the V’yun deposit, the mean value of Au is 5.0 ppm, whereas, in Py from alterations in clastic rocks, the mean value of Au is 35.6 ppm. In two Apy samples from alterations in sandstones, the following values were obtained: 28.9 and 58.4 ppm Au. The Shumnyi deposit is characterized by the inverse value of variations in the Au content in Py. Thus, in Py from dykes, the mean value of Au is 28.8 ppm, and in Py from sandstones, the mean value of Au is 13.2 ppm.
In general, for all the studied deposits, gold contents in sulfides from proximal alterations were determined from fractions to be 168.5 ppm (Badran deposit, Apy). The highest gold content is found in Py, with 159.5 ppm (V’yun deposit) (Figure 15). Our results are comparable with data on the gold content in sulfides from alterations in many gold deposits in NE Russia, but they are noticeably lower compared with some large deposits with disseminated ores (Natalka—140–482.6 ppm Au, Mayskoe—300–1975 ppm Au [121], Nezhdaninskoe—up to 1400 ppm [28,112], Kyuchus—11.5–440 ppm Au [122]). Nevertheless, these results show the high economic potential of the disseminated mineralization in the studied deposits. For example, for the Khangalas deposit, it was shown that with a minimum gold content in alterations of 0.5 ppm, a length of 1.4 km, a thickness of 50 m, and a depth of 100 m for ore zones, reserves can be increased by 9.1 t Au [12].

5.2.2. Gold in Pyrite3

Gold in sulfides can occur in an isomorphic structurally bound form and in the form of native nano- and microinclusions [31,119,123,124,125]. The problem of invisible gold has been studied in the most detail in pyrite, which is related to the discovery of a large Carlin deposit in Nevada, where gold is closely associated with arsenian pyrite [126]. However, it is known that pyrite and arsenopyrite with invisible gold occur in deposits of various types (e.g., orogenic, epithermal, intrusion-related, porphyry-Cu, iron-oxide copper-gold, etc.) [32,119]. Over the past 15–20 years, with the advent of new analytical techniques and technologies, a lot of information has been obtained about invisible gold and its form of occurrence in sulfides [31,32,124,127]. It was shown that invisible gold is mainly concentrated in pyrite with a high solid-solution As content—arsenian pyrite [128]. Arsenic can replace either Fe or S in pyrite; at the same time, the highest concentration of As is 8–11% [105,126]. It is assumed that the Au+ ionic gold replaces Fe by entering distorted octahedral positions, and As replaces S in tetrahedral positions [129], but, nevertheless, the nature of invisible gold occurrence in sulfides is still debated [119]. A negative correlation between Fe and Au in pyrite may indicate the presence of Au in the lattice via the isomorphic substitution of Fe [130]. However, the ionic radius of Au+ differs from the ionic radius of Fe2+, which makes it impossible to replace Au+ with Fe2+ [131,132]. Chouinard et al. [133] proposed a mechanism of conjugate substitution for the Au3+ + Cu+ ↔ 2Fe2+ type. Gold nanoparticles in arsenian pyrite can be localized at the boundaries of block structures, both as a surface formation and in defects in the crystal lattice [122,129].
It is important to identify [31], for epithermal and Carlin-type deposits, an increase in the solubility of Au in the pyrite structure with an increase in As content and to determine the saturation line of Au on an As vs. Au graph. Based on the data from EMPA, laser ablation inductively coupled plasma mass spectrometry (LA-ICP-MS), secondary-ion mass spectrometry (SIMS), and particle induced X-ray emission with a microfocused beam (micro-PIXE) analyses, Deditius A.P. et al. [32] studied the origin of the inclusion of Au and As and the solubility of gold in pyrite based on Cu-porphyry, Cu-Au, orogenic (OGDs), volcanogenic–massive sulfide (VMS), iron-oxide copper–gold (IOCG), Au Witwatersrand, and coal deposits. They showed that Au1+ was the dominant form of Au in arsenian pyrite of the studied deposits, and the authors defined the empirical solid solubility of Au in As-pyrite as CAu = 0.004 × CAs + 2 × 10⁻⁷ for a range of temperature between ~150–250 °C (Figure 22). Our recent studies of gold-bearing arsenian pyrite and arsenopyrite from the proximal alteration of the Khangalas deposit have also shown the predominance of structurally related forms of gold Au+ in them [12]. These results were confirmed by rather low Au contents in the analyzed Py3. In most samples, Au does not exceed 2.5 ppm [12]. According to [124], the content of the structural form of Au in pyrite does not exceed ~ 5 ppm, and according to [32], it is less than 100 ppm Au. Higher concentrations are mainly related to the presence of nano- and microparticles [134]. The presence of native surface-bound (nano- or micro-) Au0 in alteration sulfides is registered in deposits of various types [31,119,122,124].
Table 6 shows the mean arsenic content according to EPMA data, gold, and silver according to AAS data and the Ag/Au ratio in pyrite from the deposits discussed in this study. We used these results to determine the form of gold in sulfides. In the diagrams of the As/Au (Figure 22A) and Ag/Au (Figure 22B) ratios, the mean values of As, Au, and Ag in pyrite from the studied deposits of both types (sediment-hosted and intrusion-hosted) fall into the field of orogenic deposits of different ages and locations, belonging to the Au-As association of the Earth [119].
The Ag/Au ratio in Py3 does not differ significantly in the studied deposits; in the mean, it ranges from 0.07 (1:13.4) to 1.06 (1:0.9) (Table 6). Figure 22B shows that the Ag/Au ratio in the Py3 of the studied deposits is in good conformity with the results [119], which determined that, for deposits of the Au-As association, the disseminated arsenian pyrite has small values for the Ag/Au ratio up to 1, and the sedimentary pyrite has a higher, up to 1000, Ag/Au ratio. Large R. and Maslennikov V. [119] showed that the value of the Ag/Au ratio is a useful criterion to help distinguish disseminated sedimentary pyrite from hydrothermal-alteration-disseminated pyrite in sedimentary rocks. The studied deposits are located in the field of orogenic deposits (Figure 22). The studied orogenic gold in sediment-hosted (Malo–Taryn, Badran, and Khangalas) and intrusion-hosted deposits (V’yun, Shumnyi) have similar ionic structurally bound Au+ gold contents in Py3 (Figure 22A).
Table 6. Mean values of As, Au, and Ag in pyrite from the studied OGDs, central YKMB.
DepositAs, ppm (EPMA)Au, ppm (AAA)Ag, ppm (AAA)Ag/Au
Malo–Taryn7800/27 *5.1/65.4/61.06
Badran13,340/6057.5/126.0/120.1
Khangalas10,140/4711.2/136.2/130.55
V’yun, dyke15,850/535.0/61.3/60.26
V’yun, sandstone15,850/5335.6/85.6/80.16
Shumnyi, dyke9970/2328.8/42.1/40.07
Shumnyi, sandstone9970/2313.2/41.1/40.08
* Mean values/number of analyses.
Figure 22. Plot of Py3. (A) Au vs. As, the lines of gold saturation after [32,49]; (B) Au vs. Ag of the studied OGDs, central YKMB. The demarcated fields are after [119].
Minerals 13 00394 g022

5.2.3. Gold in Arsenopyrite1

In arsenopyrite, as in pyrite, gold can be in a native or isomorphic form. The inverse correlation between As and S in Apy (Figure 23) may reflect their conjugate isomorphic substitution in the process of formation [120,135]. Arsenic in arsenopyrite plays an important role as an indicator of the mineralization of Au. The atomic ratio As/S is mainly sensitive to temperature in the sulfur–buffer group, which leads to a higher ratio with an increasing temperature [135,136,137]. For the arsenopyrite1 of the Vorontsovskoye deposit, rich with sulfur and depleted of gold, it was determined that the ratio is As/S ˂ 1, and for arsenopyrite2, depleted of sulfur and rich with gold, the ratio is As/S ˃ 1 [137]. It has been shown [137] that Apy1 crystallizes at a higher temperature and sulfur volatility, whereas for Apy2, these parameters are significantly lower. Our results do not align with these data. The atomic ratio of As/S for the gold-bearing Apy1 of all studied deposits shows that arsenopyrite is rich in sulfur, As/S ˂ 1: Malo–Taryn—from 0.84 to 0.98 (only in two samples: 1.03), mean 0.94; Badran—from 0.77 to 0.99, mean 0.86; Khangalas—from 0.63 to 0.93, mean 0.83; V’yun—from 0.77 to 0.89, mean 0.85; and Shumnyi—from 0.75 to 0.94, mean 0.89 (Table 7).
The relationship between Au and Fe may show the form of gold occurrence in arsenopyrite [136,137]. In our recent study [12], an inverse dependence of Au and Fe in the Apy1 of the Khangalas deposit was shown, a strong inverse correlation (r = −0.9) with increased contents Au of > 2 ppm was established, and with Au contents of <1 ppm, there is no correlation (r = −0.18).
To determine the form of gold occurrence in arsenopyrite from the alteration of the studied deposits, a correlation diagram with the saturation line Au was used according to [31]. In the diagram, the mean values of As and Au fall into the field of structurally bound Au+ in Apy1.
Table 7. Mean values of As, Au, and Ag in the arsenopyrite1 of the studied OGDs, central YKMB.
DepositAs, ppm (EPMA)Au, ppm (AAA)Ag, ppm (AAA)Au/AgAs/S
Malo–Taryn44,740/35 *17.1/44.2/455.70.94
Badran43,320/1673.6/96.6/917.40.86
Khangalas42,920/2217.5/36.5/311.10.83
V’yun, sandstone42,470/1028.9, 58.42.2, 2.312.8, 26.80.85
Shumnyi, dyke44,230/210.89
* Mean values/number of analyses.
Figure 24. Summary of δ34S values for orogenic gold deposits in the Yana–Kolyma metallogenic belt and the Nezhdaninskoe deposit, NE Russia. For comparison, materials according to [11,12,21,23,28,39]. Ranges of sulfur isotopic composition in various geological reservoirs according to [146]. In sudfigure: the left border of the line shows the minimum value; the right one shows the maximum value; vertical lines in the boxes denote the median, the X marks in the boxes denote the mean, and the left and right of each box denote the first and third quartiles, respectively.
Minerals 13 00394 g024
The qualitative linear scanning of an Apy1 grain from the Khangalas deposit showed that the concentrations of invisible Au, Pb, and Cu tend to decrease from the center to the rim, whereas the Co and Ni contents are noticeably higher in the central zones of the crystal [12]. It has been suggested that the increase in Au, Pb, and Cu is related to a portion of later fluids rich in the Au-polysulfide association.
Thus, the predominant form of invisible Au in the arsenopyrite1 and pyrite3 of the studied deposits is a solid solution of Au+ in their crystal lattices. Micro- and nanoparticles of native gold are present in a subordinate amount.

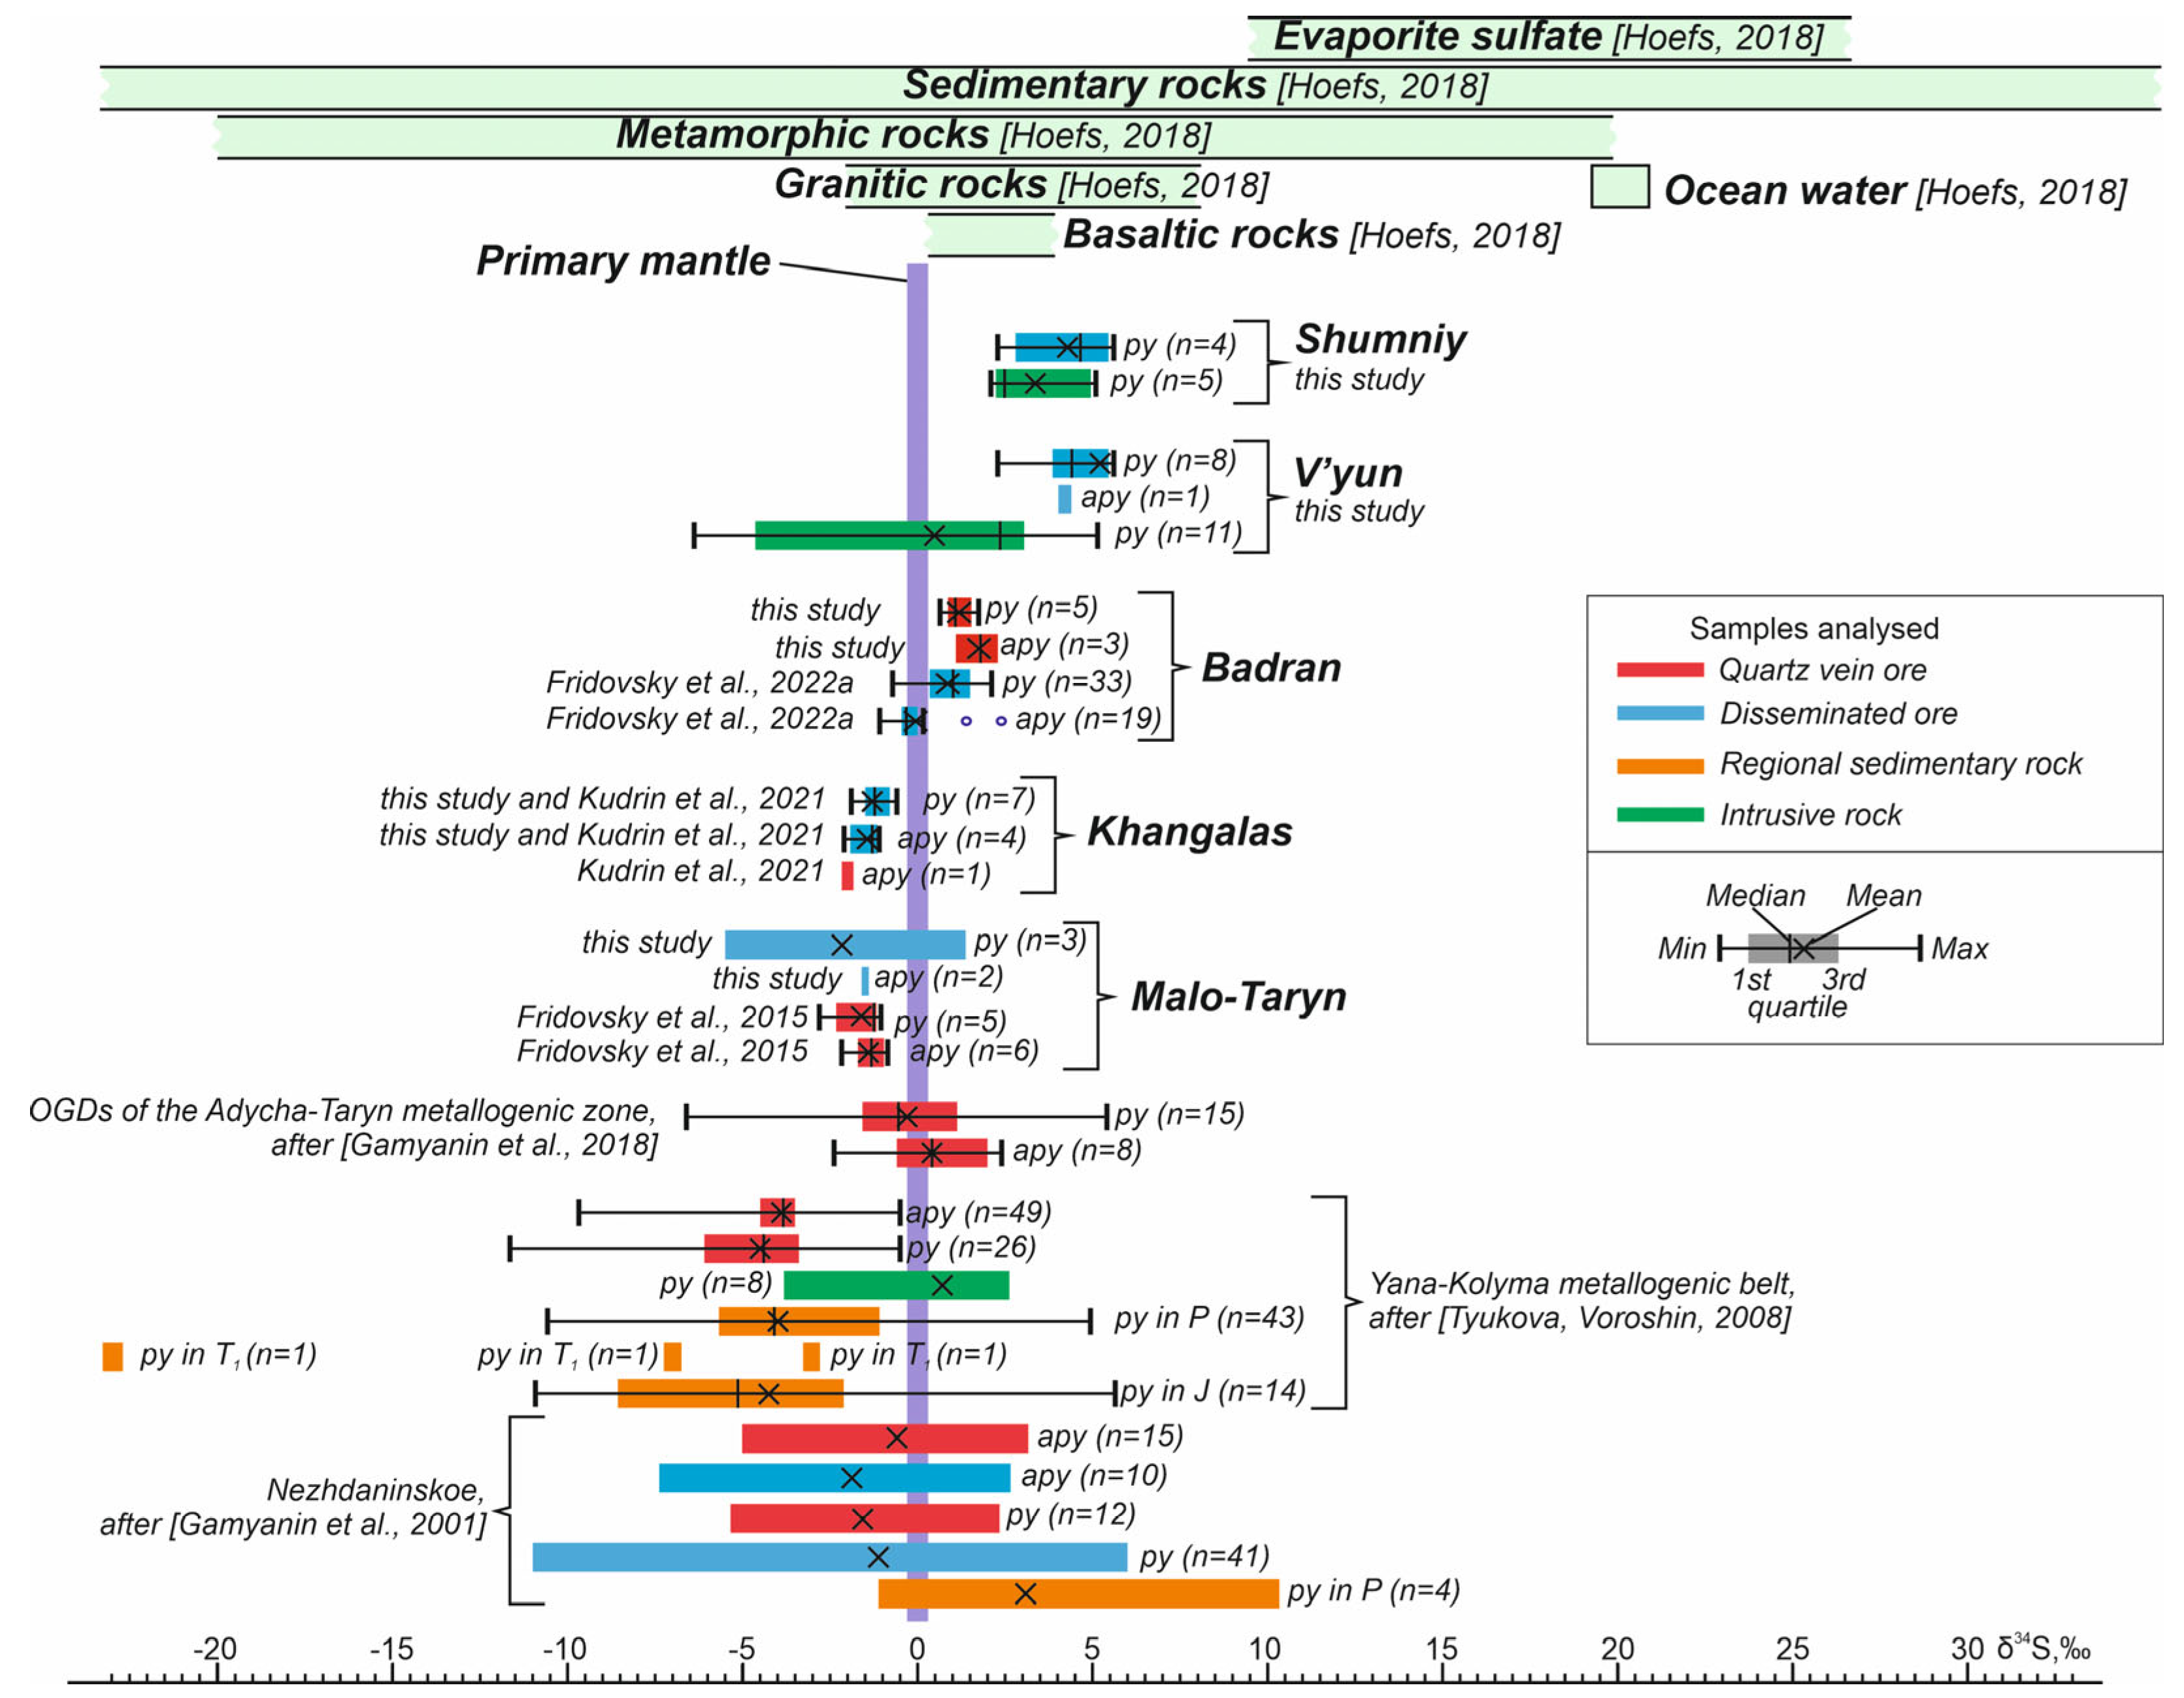
5.3. Sources of Components Based on Stable Isotopes S

There are different ideas about potential sources of OGD fluids and metals, such as in [43] and references therein. Their exhaustive review is given in [138]. The formation of OGDs from ore fluids with very diverse sources is discussed: some deposits have magmatic water components [28,139,140,141], but some or most of the ore fluid is supplied from metamorphic waters [23,29,54,142,143] and juvenile sources; for example, in [11,43] and references therein. There are data on the source of some metals in the ore-forming system from the host rocks [144]. Based on the example of deposits in the Juneau Gold Belt [145] and, later on, the a comprehensive analysis of the example of Jiaodong Province, China [43], it was shown that sulfur reached ore-forming fluids during the metamorphic transformation of pyrite into pyrrhotite. The sulfur source was supposed to be dispersed syngenetic/diagenetic pyrite in terranes, devolatilized at a depth from the sediment wedge above a subduction zone [138].
Studies of stable isotopes such as δ34S provide important insights into the fluid source and source(s) of S, which is important for the genetic interpretation of ore deposit formations; see [43,53,54,140,146] and references therein. In general, a large range of δ34S values in sulfides from −20.0 to +25.0‰ was obtained for the orogenic gold deposits [43]. The variation of δ34S is related to the involvement of various reservoirs in the formation of ores and variations in physical–chemical parameters during the evolution of ore-forming systems [147]. The values of sulfur sulfide isotopes in metamorphic terranes inside or near transcrustal faults of the Earth’s crust according to [2] range between 0 and 10‰, but both higher and lower values have been observed. In addition, the dependence of the isotopic sulfur composition of the Phanerozoic deposits on the age of the host rock should be emphasized [43,51] (Figure 24).
Most of the orogenic gold deposits of the Verkhoyansk–Kolyma orogen have values of δ34S ranging from −12 to +10‰ (Figure 24) (e.g., [11,15,21,23,39,148]). The mean values of the sulfur isotopes of the arsenopyrite, pyrite, and polysulfide associations from the ore veins of these deposits, as well as from clastic rocks at a distance from the ore-bearing structures, were in a range of −5.0–+6.0‰ (Figure 24). In some deposits, a heavier δ34S was identified due to the influence of sedimentary diagenetic sulfides from the host rocks [39].
Recently, Gamyanin G.N. et al. [23] have performed a lot of work in studying the conditions of the formation of precious metal mineralization in the Adycha–Taryn metallogenic zone, located in the central sector of the YKMB. In particular, the values of δ34S in sulfides from the proximal alteration and veins allow the sources of sulfur to be constrained. Thus, for OGD veins, a rather narrow range of values of δ34S, close to 0, can be set: for arsenopyrite, it is from −2.1 to +2.4‰ (mean +0.4‰); for pyrite, it is from −6.6 to +5.4‰ (mean of −0.3‰) (Figure 24) [23]. In our recent work, similar values of δ34S were obtained for pyrite and arsenopyrite from the alteration of the Badran deposit [11] and arsenopyrite from vein ores and the alteration of the Khangalas deposit [12] (Figure 24). The isotopic composition of sulfide sulfur from the alteration of the Badran deposit studied using the local method showed the value of δ34S in pyrite to be slightly heavier than in arsenopyrite [11] (Figure 24). Two crystal populations were established in pyrite based on the δ34S variations. The first population includes isotope-zonal pyrite with sulfur weighing from the center to the rim of the grains (mean in the center of the grains, 0.2‰; mean at the rim of the grains, 1.5‰). The difference in the value of δ34S is up to 2.1‰. Similar zoning was noted earlier at the Sukhoi Log deposit, where it is related to the evolution of fluid composition [148]. This can also be caused by variations in the fO2–pH conditions of ore-forming processes [149]. The second population, taking into account any analysis errors, is isotopically homogeneous pyrite; the values of δ34S in the center of the crystals differ slightly (0.01–0.33‰) from their rim. It was found that arsenopyrite with values of δ34S close to zero is more gold-bearing and indicates that sulfur minerals in sediment-hosted orogenic gold deposits were probably derived from the reduction of seawater sulfate [51].
New data on the isotopic composition of sulfide sulfur from the studied sediment-hosted and intrusion-hosted deposits, shown in Table 5 and in Figure 24, have a narrow range of δ34S values, from −6.4 to +5.6‰ (mean value of about 0‰). These data are consistent with the results of Gamyanin G.N. et al. [23] for OGD vein ores in the Adycha–Taryn metallogenic zone and our recent studies of disseminated sulfide mineralization [11,12]. Such values of δ34S for the gold deposits in the Yilgarn craton (Australia) are estimated to have a magmatic or mantle source of ore-forming fluid [52]. Similar results were obtained for a number of orogenic gold deposits in Kazakhstan (δ34S = 0.0…−3.3‰), the source of the ore substance of which was determined to be mantle with partial borrowing from crustal sulfur [150,151], and the Nezhdaninskoe OGD, for which the values of δ34S of pyrite and arsenopyrite from the vein and disseminated ores prevail from −6 up to +0.7‰ (a mean of about +0.6‰) [28].
The plots show that δ34S in sulfides in the V’yun, Shumnyi, Malo–Taryn, and Badran deposits does not depend on the age of the host rocks and does not correlate with the seawater sulfate curve through the geological time. Near zero mean values of δ34S, together with the mantle signatures for sulfides and native gold grains [11] from the YKMB sediment-hosted orogenic gold deposits, indicate subcrustal and metamorphic sources for the Au-bearing fluid and sulfur. The slightly heavier sulfur isotopic composition of sulfides from the Shumnyi and V’yun intrusion-hosted deposits may indicate a mixture of subcrustal, metamorphic, partially magmatic, and sedimentary sources (Figure 24). A similar isotopic composition of sulfur arsenopyrite and pyrite quartz in the vein ore [23] and disseminated ore may indicate their formation during a single homogeneous hydrothermal event.

6. Conclusions

This investigation of the chemical composition of disseminated sulfide mineralization from the proximal alteration of sediment-hosted (Malo–Taryn, Badran, Khangalas) and intrusion-hosted (V’yun, Shumnyi) orogenic Au deposits from the central part of the Yana–Kolyma metallogenic belt revealed that the gold endowment of these deposits is associated with pyrite3 and arsenopyrite1, and these minerals are an economically important source of gold. The determination of the precise site of invisible gold within Py3 and Apy1 showed the possible prevalence of solid solution Au+ in their crystal lattices. Py3 from clastic and igneous rocks has a consistent association of As, Co, Ni, Cu, and Sb, as well as, less often, Pb, and has high conductivity, Co/Ni, and Ag/Au ratio characteristics with respect to hydrothermal pyrites. Both Py3 and Apy1 exhibit a distinct statistical correlation between Au and As and Au and Co contents. In the intrusion-hosted orogenic gold deposits, elevated concentrations of Co and Ni in Py3 were registered, suggesting that the ore fluid reacted with altered volumes of basic dykes. In Apy1, Co, Ni, Cu, and Sb were identified.
A synthesis of the geological, geochemical, and stable isotope data suggests that the invisible gold in the disseminated arsenian pyrite3 and in the arsenopyrite1 is most likely formed from subcrustal and metamorphic hydrothermal systems in the Verkhoyansk–Kolyma orogen.

Supplementary Materials

The following supporting information can be downloaded at: https://www.mdpi.com/article/10.3390/min13030394/s1, Table S1: Compositions (wt%) for pyrite in the proximal alteration rock OGD Central YKMB, analyzed by EPMA.; Table S2: Compositions (wt%) for arsenopyrite in the proximal rock OGD Central YKMB, analyzed by EPMA.

Author Contributions

Conceptualization: V.Y.F.; methodology, V.Y.F., L.I.P. and M.V.K.; validation, V.Y.F., L.I.P. and M.V.K.; writing—original draft preparation, V.Y.F., L.I.P. and M.V.K., writing—review and editing, V.Y.F., L.I.P. and M.V.K.; visualization, M.V.K.; supervision, V.Y.F.; project administration, V.Y.F.; funding acquisition, V.Y.F. and M.V.K. All authors have read and agreed to the published version of the manuscript.

Funding

This work was supported by the Diamond and Precious Metals Geology Institute, Siberian Branch of the Russian Academy of Sciences (DPMGI SB RAS).

Data Availability Statement

Not applicable.

Acknowledgments

The authors are grateful to all engineers for their accurate, timely, and prompt analytical work and, especially, Tarasov Ya.A. for his help in the preparation and selection of the samples. We are sincerely grateful to Shulyak A.P. for translating the text and Dolgopolova A.V. for text editing and valuable comments, which contributed to the improvement of the manuscript.

Conflicts of Interest

The authors declare no conflict of interest.

References

  1. Frimmel, H.E. Earth’s continental crustal gold endowment. Earth Planet. Sci. Lett. 2008, 267, 45–55. [Google Scholar] [CrossRef]
  2. Goldfarb, R.J.; Baker, T.; Dube, B.; Groves, D.I.; Hart, C.J.R.; Robert, F.; Gosselin, P. Distribution, character, and genesis of gold deposits in metamorphic terranes. Econ. Geol. 2008, 407–450. 100th Anniversary Vol. [Google Scholar] [CrossRef]
  3. Mikhailov, B.K.; Struzhkov, S.D.; Aristov, V.V.; Natalenko, M.V.; Tsymbalyuk, N.V.; Tyamisov, N.E.; Uzunkoyan, A.A. Gold potential of the Yana-Kolyma province. Ores Met. 2007, 5, 4–17. (In Russian) [Google Scholar]
  4. Konstantinov, M.M. Gold Deposits of Russia; Konstantinov, M.M., Ed.; Aquarelle: Moscow, Russia, 2010; p. 385. (In Russian) [Google Scholar]
  5. Goldfarb, R.; Taylor, R.; Collins, G.; Goryachev, N.; Orlandini, O. Phanerozoic continental growth and gold metallogeny of Asia. Gondwana Res. 2014, 25, 48–102. [Google Scholar] [CrossRef]
  6. Goryachev, N.A.; Pirajno, F. Gold deposit and gold metallogeny of Far East Russia. Ore Geol. Rev. 2014, 59, 123–151. [Google Scholar] [CrossRef]
  7. Goldfarb, R.; Groves, D.I.; Gardoll, S. Orogenic gold and geologic time: A global synthesis. Ore Geol. Rev. 2001, 18, 1–75. [Google Scholar] [CrossRef]
  8. Goryachev, N.A. Gold deposits in the history of the Earth. Geol. Ore Depos. 2019, 61, 3–18. [Google Scholar] [CrossRef]
  9. Volkov, A.V.; Sidorov, A.A.; Goncharov, V.I.; Sidorov, V.A. Disseminated gold-sulfide deposits in the Russian Northeast. Geol. Ore Dep. 2002, 44, 159–174. [Google Scholar]
  10. Goryachev, N.A.; Sotskaya, O.T.; Ignatiev, A.V.; Velivetskaya, T.I.; Goryacheva, E.M.; Semyshev, F.I.; Berdnikov, N.V.; Malinovsky, M.A.; Alshevsky, A.V. About sulfide mineralization of the zones of large faults of the Yana-Kolyma orogenic belt. Bull. Northeast. Sci. Cent. FEB RAS 2020, 1, 11–29. (In Russian) [Google Scholar] [CrossRef]
  11. Fridovsky, V.Y.; Polufuntikova, L.I.; Kudrin, M.V.; Goryachev, N.A. Sulfur isotope composition and geochemical characteristics of gold-bearing sulfides of the Badran orogenic deposit, Yana-Kolyma metallogenic belt (North-East Asia). Dokl. Akad. Nauk 2022, 502, 3–9. [Google Scholar] [CrossRef]
  12. Kudrin, M.V.; Fridovsky, V.Y.; Polufuntikova, L.I.; Kryuchkova, L.Y. Disseminated Gold–Sulfide Mineralization in Metasomatites of the Khangalas Deposit, Yana–Kolyma Metallogenic Belt (Northeast Russia): Analysis of the Texture, Geochemistry, and S Isotopic Composition of Pyrite and Arsenopyrite. Minerals 2021, 11, 403. [Google Scholar] [CrossRef]
  13. Aristov, V.V.; Prokofiev, V.Y.; Imamendinov, B.N.; Kryazhev, S.G.; Alekseev, V.Y.; Sidorov, A.A. Features of ore formation at the Drazhnoe gold-quartz deposit (Eastern Yakutia, Russia). Dokl. Akad. Nauk 2015, 464, 879–884. [Google Scholar] [CrossRef]
  14. Goryachev, N.A. Geology of Mesozoic Gold–Quartz Vein Belts of Northeast Asia; NEISRI FEB RAS: Magadan, Russia, 1998; p. 210. (In Russian) [Google Scholar]
  15. Gamyanin, G.N. Mineralogical and Genetic Aspects of Gold Mineralization of the Verkhoyansk–Kolyma Mesozoids; GEOS: Moscow, Russia, 2001; p. 221. (In Russian) [Google Scholar]
  16. Amuzinsky, V.A. Metallogenic Epochs and Content of Ore Complexes of the Verkhoyansk Folded System; YSU Publishing House: Yakutsk, Russia, 2005; p. 248. (In Russian) [Google Scholar]
  17. Goryachev, N.A.; Vikentyeva, O.V.; Bortnikov, N.S.; Prokofiev, V.Y.; Alpatov, V.A.; Golub, V.V. The world-class Natalka gold deposit, northeast Russia: REE patterns, fluid inclusions, stable oxygen isotopes, and formation conditions of ore. Geol. Ore Depos. 2008, 50, 414–444. [Google Scholar] [CrossRef]
  18. Fridovsky, V.Y.; Gamyanin, G.N.; Polufuntikova, L.I. Dora-Pil ore field: Structure, mineralogy and geochemistry of ore formation environment. Ores Met. 2012, 5, 7–21. (In Russian) [Google Scholar]
  19. Fridovsky, V.Y.; Gamyanin, G.N.; Polufuntikova, L.I. The Sana Au–quartz deposit within the Taryn ore cluster. Razved. Okhrana Nedr 2013, 2, 3–7. (In Russian) [Google Scholar]
  20. Fridovsky, V.Y.; Gamyanin, G.N.; Polufuntikova, L.I. Gold-quartz and antimony mineralization in the Maltan deposit in northeast Russia. Russ. J. Geol. Pac. Ocean. 2014, 8, 276–287. [Google Scholar] [CrossRef]
  21. Fridovsky, V.Y.; Gamyanin, G.N.; Polufuntikova, L.I. The structure, mineralogy, and fluid regime of ore formation in the polygenic Malo-Taryn gold field, northeast Russia. Russ. J. Geol. Pac. 2015, 9, 274–286. [Google Scholar] [CrossRef]
  22. Voroshin, S.V.; Tyukova, E.E.; Newberry, R.J.; Layer, P.W. Orogenic gold and rare metal deposits of the Upper Kolyma region, Northeastern Russia: Relation to igneous rocks, timing, and metal assemblages. Ore Geol. Rev. 2014, 62, 1–24. [Google Scholar] [CrossRef]
  23. Gamyanin, G.N.; Fridovsky, V.Y.; Vikent’eva, O.V. Noble-metal mineralization of the Adycha–Taryn metallogenic zone: Geochemistry of stable isotopes, fluid regime, and ore formation conditions. Russ. Geol. Geoph. 2018, 59, 1271–1287. [Google Scholar] [CrossRef]
  24. Aristov, V.V.; Grigorieva, A.V.; Savchuk, Y.S.; Sidorova, N.V.; Sidorov, V.A. Forms of gold and some typomorphic characteristics of native gold of the Pavlik orogenic deposit (Magadan oblast). Geol. Ore Depos. 2021, 63, 1–33. [Google Scholar] [CrossRef]
  25. Aristov, V.V. Prospects for the discovery of large rich gold-quartz deposits in the Taryn ore-placer cluster. Prospect and protection of mineral resources. Razved. Okhrana Nedr 2009, 6, 3–11. [Google Scholar]
  26. Fridovsky, V.Y.; Polufuntikova, L.I.; Tarasov, Y.A. Mineralogy, geochemistry and localization of regional pyritization zones–constraints from early mesozoic deposition in the Chay–Yureya fault of the Kular-Nera Terrane, NE Russia. In Proceeding of the IOP Conference Series: Earth and Environmental Science; IOP Publishing: Prague, Czech Republic, 2020; Volume 609, p. 012016. [Google Scholar] [CrossRef]
  27. Fridovsky, V.Y.; Goryachev, N.A.; Krymsky, R.S.; Kudrin, M.V.; Belyatsky, B.V.; Sergeev, S.A. The age of gold mineralization in the Yana–Kolyma metallogenic belt, Northeastern Russia: First data of Re–Os isotope geochronology of native gold. Russ. J. Pac. Geol. 2021, 40, 18–32. [Google Scholar] [CrossRef]
  28. Gamyanin, G.N.; Bortnikov, N.C.; Alpatov, V.V. The Nezhdaninskoe Gold Ore Deposit Is a Unique Deposit in the North-East of Russia; GEOS: Moscow, Russia, 2001; p. 230. (In Russian) [Google Scholar]
  29. Large, R.R.; Danyushevsky, L.; Hollit, C.; Maslennikov, V.; Gilbert, S.; Bull, S.; Scott, R.; Emsbo, P.; Thomas, H.; Singh, B.; et al. Gold and trace element zonation in pyrite using a laser imaging technique: Implications for the timing of gold in orogenic and carlin-style sediment-hosted deposits. Econ. Geol. 2009, 104, 635–668. [Google Scholar] [CrossRef]
  30. Thomas, H.V.; Large, R.R.; Bull, S.W.; Maslennikov, V.; Berry, R.F.; Fraser, R.; Froud, S.; Moye, R. Pyrite and pyrrhotite textures and composition in sediments, laminated quartz veins, and reefs at Bendigo gold mine, Australia: Insights for ore genesis. Econ. Geol. 2011, 106, 1–31. [Google Scholar] [CrossRef]
  31. Reich, M.; Deditius, A.; Chryssoulis, S.; Li, J.W.; Ma, C.Q.; Parada, M.A.; Barra, F.; Mittermayr, F. Pyrite as a record of hydrothermal fluid evolution in a porphyry copper system: A SIMS/EMPA trace element study. Geochim. Cosmochim. Acta 2013, 104, 42–62. [Google Scholar] [CrossRef]
  32. Deditius, A.P.; Reich, M.; Kesler, S.E.; Utsunomiya, S.; Chryssoulis, S.L.; Walshe, J.; Ewing, R.C. The coupled geochemistry of Au and As in pyrite from hydrothermal ore deposits. Geochim. Cosmochim. Acta 2014, 140, 644–670. [Google Scholar] [CrossRef] [Green Version]
  33. Román, N.; Reich, M.; Leisen, M.; Morata, D.; Barra, F.; Deditius, A.P. Geochemical and micro-textural fingerprints of boiling in pyrite. Geochim. Cosmochim. Acta 2019, 246, 60–85. [Google Scholar] [CrossRef]
  34. Tauson, V.; Lipko, S.; Kravtsova, R.; Smagunov, N.; Belozerova, O.; Voronova, I. Distribution of “invisible” noble metals between pyrite and arsenopyrite exemplified by minerals coexisting in orogenic Au deposits of North-Eastern Russia. Minerals 2019, 9, 660. [Google Scholar] [CrossRef] [Green Version]
  35. Wu, Y.F.; Fougerouse, D.; Evans, K.; Reddy, S.M.; David, W.S.; Paul, G.; Li, J.W. Gold, arsenic, and copper zoning in pyrite: Record of fluid chemistry and growth kinetics. Geology 2019, 47, 641–644. [Google Scholar] [CrossRef]
  36. Ishida, M.; Romero, R.; Leisen, M.; Yasukawa, K.; Nakamura, K.; Barra, F.; Reich, M.; Kato, Y. Auriferous pyrite formed by episodic fluid inputs in the Akeshi and Kasuga high-sulfidation deposits, Southern Kyushu, Japan. Miner. Depos. 2021, 57, 129–145. [Google Scholar] [CrossRef]
  37. Yang, L.; Wang, Q.; Large, R.R.; Mukherjee, I.; Deng, J.; Li, H.; Yu, H.; Wang, X. Fluid source and metal precipitation mechanism of sediment-hosted Chang’an orogenic gold deposit, SW China: Constraints from sulfide texture, trace element, S, Pb, and He-Ar isotopes and calcite C-O isotopes. Am. Miner. 2021, 106, 410–429. [Google Scholar] [CrossRef]
  38. Ma, Y.; Jiang, S.; Frimmel, H. Deciphering multiple ore-forming processes of the Shuangqishan orogenic gold deposit, Southeast China by in situ analysis of pyrite. Ore Geol. Rev. 2022, 142, 104730. [Google Scholar] [CrossRef]
  39. Tyukova, E.E.; Voroshin, S.V. Isotopic composition of sulfur in sulfides from ores and host rocks of the Upper Kolyma region (Magadan region). Russ. J. Pac. Geol. 2008, 27, 29–43. (In Russian) [Google Scholar] [CrossRef]
  40. Sung, Y.H.; Brugger, J.; Ciobanu, C.L.; Pring, A.; Skinner, W.; Nugus, M. Invisible gold in arsenian pyrite and arsenopyrite from a multistage Archaean gold deposit: Sunrise Dam, Eastern Goldfields Province, Western Australia. Miner. Depos. 2009, 44, 765. [Google Scholar] [CrossRef]
  41. Large, R.; Thomas, H.; Craw, D.; Henne, A.; Henderson, S. Diagenetic pyrite as a source for metals in orogenic gold deposits, Otago Schist, New Zealand. N. Z. J. Geol. and Geoph. 2012, 55, 137–149. [Google Scholar] [CrossRef] [Green Version]
  42. Cook, N.J.; Ciobanu, C.L.; Meria, D.; Silcock, D.; Wade, B. Arsenopyrite-pyrite association in an orogenic gold ore: Tracing mineralization history from textures and trace elements. Econ. Geol. 2013, 108, 1273–1283. [Google Scholar] [CrossRef]
  43. Goldfarb, R.; Groves, D. Orogenic gold: Common or evolving fluid and metal sources through time. Lithos 2015, 233, 2–26. [Google Scholar] [CrossRef]
  44. Finch, E.G.; Tomkins, A.G. Pyrite-pyrrhotite stability in a metamorphic aureole: Implications for orogenic gold genesis. Econ. Geol. 2017, 112, 661–674. [Google Scholar] [CrossRef]
  45. Hazarika, P.; Mishra, B.; Pruseth, K.L. Trace-element geochemistry of pyrite and arsenopyrite: Ore genetic implications for late Archean orogenic gold deposits in southern India. Mineral. Mag. 2017, 81, 661–678. [Google Scholar] [CrossRef]
  46. Augustin, J.; Gaboury, D. Multi-stage and multi-sourced fluid and gold in the formation of orogenic gold deposits in the world-class Mana district of Burkina Faso-Revealed by LA-ICP-MS analysis of pyrites and arsenopyrites. Ore Geol. Rev. 2018, 104, 95–521. [Google Scholar] [CrossRef]
  47. Tarasova, Y.I.; Budyak, A.E.; Goryachev, N.A.; Tauson, V.L.; Skuzovatov, S.Y.; Bryukhanova, N.N.; Parshin, A.V.; Chugaev, A.V.; Abramova, V.D.; Gareev, B.I.; et al. Mineralogical and isotope-geochemical (δ13C, δ34S and Pb-Pb) characteristics of the Krasniy gold mine (Baikal-Patom Highlands): Constraining ore-forming mechanisms and the model for Sukhoi Log-type deposits. Ore Geol. Rev. 2020, 119, 103365. [Google Scholar] [CrossRef]
  48. Du, B.; Shen, J.; Santosh, M.; Liu, H.; Liu, J.; Wang, Y.; Xu, K. Textural, compositional and isotopic characteristics of pyrite from the Zaozigou gold deposit in West Qinling, China: Implications for gold metallogeny. Ore Geol. Rev. 2021, 130, 103917. [Google Scholar] [CrossRef]
  49. Reich, M.; Kesler, S.E.; Utsunomiya, S.; Palenik, C.S.; Chryssoulis, S.L.; Ewing, R.C. Solubility of gold in arsenian pyrite. Geochim. Cosmochim. Acta 2005, 69, 2781–2796. [Google Scholar] [CrossRef]
  50. Eremin, R.A.; Voroshin, S.V.; Sidorov, V.A.; Shakhtyrov, V.G.; Pristavko, V.A.; Gashtold, V.V. Geology and genesis of the Natalka gold deposit, Northeast Russia. Inter. Geol. Rev. 1994, 36, 1113–1138. [Google Scholar] [CrossRef]
  51. Goldfarb, R.J.; Miller, L.D.; Leach, D.L.; Snee, L.W. Gold deposits in metamorphic rocks of Alaska. Econ. Geol. 1997, 9, 151–190. [Google Scholar] [CrossRef]
  52. Xue, Y.; Campbell, I.H.; Ireland, T.R.; Holden, P.; Armstrong, R. No mass-independent sulfur isotope fractionation in auriferous fluids supports a magmatic origin for Archean gold deposits. Geology 2013, 41, 791–794. [Google Scholar] [CrossRef]
  53. Shanks, W. Stable Isotope Geochemistry of Mineral Deposits; Elsevier Ltd.: Amsterdam, The Nederland, 2014. [Google Scholar] [CrossRef]
  54. LaFlamme, C.; Sugiono, D.; Thébaud, N.; Caruso, S.; Fiorentini, M.L.; Selvaraja, V.; Jeon, H.; Voute, F.; Martin, L. Multiple sulfur isotopes monitor fluid evolution of an orogenic gold deposit. Geoch. Cosmoch. Acta 2018, 222, 436–446. [Google Scholar] [CrossRef]
  55. Seltmann, R.; Goldfarb, R.; Zu, B.; Creaser, R.; Dolgopolova, A.; Shatov, V. Muruntau, Uzbekistan: The World’s Largest Epigenetic Gold Deposit. Soc. Econ. Geol. 2020, 23, 497–521. [Google Scholar] [CrossRef]
  56. Zhen, S.; Wang, Q.; Wang, D.; Carranza, E.J.M.; Liu, J.; Pang, Z.; Cheng, Z.; Xue, J.; Wang, J.; Zha, Z. Genesis of the Zhangquanzhuang gold deposit in the northern margin of North China Craton: Constraints from deposit geology and ore isotope geochemistry. Ore Geol. Rev. 2020, 122, 103511. [Google Scholar] [CrossRef]
  57. Parfenov, L.M.; Kuzmin, M.I. Tectonics, Geodynamics and Metallogeny of the Territory of the Republic of Sakha (Yakutia); Parfenov, L.M., Kuzmin, M.I., Eds.; Nauka/Interperiodika: Moscow, Russia, 2001; p. 571. (In Russian) [Google Scholar]
  58. Parfenov, L.M. Continental Margins and Island Arcs of Mesozoides in Northeast Asia; Nauka: Novosibirsk, Russia, 1984; p. 192. (In Russian) [Google Scholar]
  59. Parfenov, L.M.; Badarch, G.; Berzin, N.A.; Khanchuk, A.I.; Kuzmin, M.I.; Nokleberg, W.J.; Prokopiev, A.V.; Ogasawara, M.; Yan, H. Summary of Northeast Asia geodynamics and tectonics. Stephan Mueller Spec. Publ. Ser. 2009, 4, 11–33. [Google Scholar] [CrossRef] [Green Version]
  60. Toro, J.; Miller, E.L.; Prokopiev, A.V.; Zhang, X.; Veselovskiy, R. Mesozoic orogens of the Arctic from Novaya Zemlya to Alaska. J. Geol. Soc. 2016, 173, 989–1006. [Google Scholar] [CrossRef]
  61. Nokleberg, W.J.; Parfenov, L.M.; Norton, I.O.; Khanchuk, A.I.; Stone, D.B.; Scholl, D.W.; Fujita, K. Phanerozoic Tectonic Evolution of the Circum-North Pacific; US Geological Survey, Professional Papers: Denver, CO, USA, 2001; p. 123, No. 1626. [Google Scholar]
  62. Fridovsky, V.Y.; Vernikovskaya, A.E.; Yakovleva, K.Y.; Rodionov, N.V.; Travin, A.V.; Matushkin, N.Y.; Kadilnikov, P.I. Geodynamic Formation Conditions and Age of Granitoids from Small Intrusions in the West of the Yana–Kolyma Gold Belt (Northeast Asia). Russ. Geol. Geophys. 2022, 63, 483–502. [Google Scholar] [CrossRef]
  63. Akinin, V.V.; Prokopiev, A.V.; Toro, J.; Miller, E.L.; Wooden, J.; Goryachev, N.A.; Alshevsky, A.V.; Bakharev, A.G.; Trunilina, V.A. U–PB SHRIMP ages of granitoids from the Main batholith belt (North East Asia). Dokl. Akad. Nauk 2009, 426, 216–221. [Google Scholar] [CrossRef]
  64. Gertseva, M.V.; Luchitskaya, M.V.; Sysoev, I.V.; Sokolov, S.D. Stages of formation of the main batholith belt in the Northeast of Russia: U–Th–Pb SIMS and Ar–Ar geochronological data. Dokl. Akad. Nauk 2021, 499, 5–10. [Google Scholar] [CrossRef]
  65. Prokopiev, A.V.; Borisenko, A.S.; Gamyanin, G.N.; Pavlova, G.G.; Fridovsky, V.Y.; Kondrat’eva, L.A.; Anisimova, G.S.; Trunilina, V.A.; Ivanov, A.I.; Travin, A.V.; et al. Age constraints and tectonic settings of metallogenic and magmatic events in the Verkhoyansk–Kolyma folded area. Russ. Geol. and Geoph. 2018, 59, 1237–1253. [Google Scholar] [CrossRef]
  66. Fridovsky, V.Y.; Yakovleva, K.Y.; Vernikovskaya, A.E.; Vernikovsky, V.A.; Matushkin, N.Y.; Kadilnikov, P.I.; Rodionov, N.V. Geodynamic emplacement setting of late jurassic dikes of the Yana–Kolyma gold belt, NE folded framing of the Siberian craton: Geochemical, Petrologic, and U–Pb Zircon Data. Minerals 2020, 10, 1000. [Google Scholar] [CrossRef]
  67. Fridovsky, V.Y. Structural control of orogenic gold deposits of the Verkhoyansk-Kolyma folded region, northeast Russia. Ore Geol. Rev. 2018, 103, 38–55. [Google Scholar] [CrossRef]
  68. Fridovsky, V.Y.; Kudrin, M.V.; Polufuntikova, L.I. Multi-stage deformation of the Khangalas ore cluster (Verkhoyansk–Kolyma folded region, northeast Russia): Ore-controlling reverse thrust faults and post-mineral strike-slip faults. Minerals 2018, 8, 270. [Google Scholar] [CrossRef] [Green Version]
  69. Fridovsky, V.Y.; Kryazhev, S.G.; Goryachev, N.A. Physicochemical conditions of quartz formation at the Bazov gold-ore deposit (East Yakutia, Russia). Russ. J. Pac. Geol. 2019, 13, 407–416. [Google Scholar] [CrossRef]
  70. Fridovsky, V.Y. Structures of gold ore fields and deposits of Yana–Kolyma ore belt. In Metallogeny of Collisional Geodynamic Settings; Mezhelovsky, N.V., Gusev, G.S., Eds.; GEOS: Moscow, Russia, 2002; Volume 1, pp. 6–241. (In Russian) [Google Scholar]
  71. Fridovsky, V.Y.; Kudrin, M.V.; Polufuntikova, L.I.; Goryachev, N.A. Ore-controlling thrust faults at the Bazov gold-ore deposit (Eastern Yakutia). Dokl. Akad. Nauk 2017, 474, 617–619. [Google Scholar] [CrossRef]
  72. Groves, D.I.; Goldfarb, R.J.; Gebre-Mariam, M.; Hagemann, S.G.; Robert, F. Orogenic gold deposits: A proposed classification in the context of their crustal distribution and relationship to other gold deposit types. Ore Geol. Rev. 1998, 13, 7–27. [Google Scholar] [CrossRef]
  73. Savchuk, Y.S.; Volkov, A.V. Large and super-large orogenic gold deposits: Geodynamics, structure, genetic consequences. Yakutia. Lithosphere. 2019, 19, 813–833. [Google Scholar] [CrossRef]
  74. Anisimova, G.S.; Kondratieva, L.A.; Serkebaeva, E.S.; Ageenko, V.A. Badran gold deposit, Eastern Yakutia. Ores and metals. 2008, 5, 49–60. (In Russian) [Google Scholar]
  75. Anisimova, G.S.; Protopopov, R.I. Geological structure and composition of ores of the gold-quartz deposit of Vyun, Eastern. Ores and Met. 2009, 5, 59–69. [Google Scholar]
  76. Fridovsky, V.Y.; Polufuntikova, L.I.; Gamyanin, G.N.; Solovyov, E.E. Orogenic gold deposits with significant resource potential in the central part of the Yano-Kolyma belt. Explor. Protect. Miner. Res. 2015, 11, 3–9. [Google Scholar]
  77. Polufuntikova, L.I.; Fridovsky, V.Y.; Goryachev, N.A. Geochemical features of ores and host rocks of the orogenic Malo-Tarynskoye gold deposit (Verkhoyano-Kolyma folded region, North-East of Russia). Russ. J. of Pacific Geol. 2020, 39, 41–55. [Google Scholar] [CrossRef]
  78. Polufuntikova, L.I.; Fridovsky, V.Y.; Tarasov, Y.A.; Kudrin, M.V. Multistages mineralization and transformation of terrigenous rocks in the Vyun ore field, Yana-Kolyma metallogenic belt, Northeast Asia: Insight from the sedimentary, diagenetic and hydrothermal sulfides and geochemistry of ore-hosting rocks. In Proceeding of the IOP Conference Series: Earth and Environmental Science; IOP Publishing: Prague, Czech Republic, 2021; Volume 906, p. 012041. [Google Scholar] [CrossRef]
  79. Joint-Stock Company «VEDK» 2020. Available online: https://www.vedk.com/assets/resources (accessed on 16 September 2022).
  80. Zapadnaya Gold Mining Ltd. 2011. Available online: https://www.zapadnaya.ru/qa/zapasy_resursy.html (accessed on 16 September 2022).
  81. Gold mining 2008–2023. Available online: https://zolotodb.ru/article/12177 (accessed on 16 September 2022).
  82. 2022 «Gold and Technology». Available online: https://zolteh.ru/geology/novaya-kontseptsiya-razvitiya-i-osvoeniya-mineralno-syrevoj-bazy-msb-rudnogo-zolota-v-regionah-sibiri-i-dalnego-vostoka/ (accessed on 16 September 2022).
  83. Limited Liability Company “Business Media “Far East”, 2008–2021. Available online: https://nedradv.ru (accessed on 16 September 2022).
  84. Zaitsev, A.I.; Fridovsky, V.Y.; Vernikovskaya, A.E.; Kudrin, M.V.; Yakovleva, K.Y.; Kadilnikov, P.I. Rb-Sr isotopic study of basites of the dike complex of the Taryn ore-magmatic system (Northeast Russia). Russ. J. Domes. Geol. 2018, 5, 50–61. (In Russian) [Google Scholar]
  85. Zaitsev, A.I.; Fridovsky, V.Y.; Kudrin, M.V. Granitoids of the Ergelyakh intrusion-related gold–bismuth deposit (Kular-Nera Slate Belt, Northeast Russia): Petrology, physicochemical parameters of formation, and ore potential. Minerals 2019, 9, 297. [Google Scholar] [CrossRef] [Green Version]
  86. Warr, L.N. IMA–CNMNC approved mineral symbols. Mineral. Mag. 2021, 85(3), 1–30. [Google Scholar] [CrossRef]
  87. Akimov, G.Y. New data on the age of gold-quartz mineralization in the Upper Indigirka region. Dokl. Akad. Nauk 2004, 398, 80–83. (In Russian) [Google Scholar]
  88. Zaitsev, A.I.; Fridovsky, V.Y.; Kudrin, M.V. Intensive formation parameters and mineragenic potential of the granitoids of the Kurdat and Samyr massifs, Tas-Kysbyt magmatic belt of the Verkhoyansk-Kolyma folded region. Russ. J. Domes. Geol. 2017, 5, 80–89. (In Russian) [Google Scholar]
  89. Layer, P.W.; Newberry, R.J.; Fujita, K.; Parfenov, L.; Trunilina, V.; Bakharev, A. Tectonic setting of the plutonic belts of Yakutia, northeast Russia, based on 40Ar/39Ar geochronology and trace element geochemistry. Geology 2001, 29, 167–170. [Google Scholar] [CrossRef]
  90. Fridovsky, V.Y.; Zaitsev, A.I. New data on the timing of gold mineralization in the Upper Indigirka region (Yana-Kolyma belt) from Ar-Ar and Rb-Sr dating. In Proceeding of “Geological Processes in the Environments of Subduction, Collision, and Sliding of Lithospheric Plates”; Izdatelstvo Dalnauka: Vladivostok, Russia, 2018; pp. 296–299. (In Russian) [Google Scholar]
  91. Fridovsky, V.Y. Strike slip fault duplexes of the Badran deposit (North-East Yakutia). Izvestiya vysshikh uchebnykh zavedenii. Geol. Explor. 1999, 1, 60–66. (In Russian) [Google Scholar]
  92. Fridovsky, V.Y. Verkhoyansk metallogenic zone: Metamorphogenic Au quartz deposits. In Tectonics, Geodynamics and Metallogeny of the Territory of the Republic of Sakha (Yakutia); MAIK/Interperiodika: Moscow, Russia, 2001; pp. 353–355. [Google Scholar]
  93. Anisimova, G.S.; Serkebaeva, E.S.; Kondratyeva, L.A. Native gold of the Badran deposit. Domestic Geol. 2006, 5, 38–47. (In Russian) [Google Scholar]
  94. Obolensky, A.A.; Gushchina, L.V.; Anisimova, G.S.; Serkebaeva, E.S.; Tomilenko, A.A.; Gibsher, N.A. Physical and chemical modeling of mineral formation processes of the Badran gold deposit (Yakutia). Geol. and Geophys. 2011, 52, 373–392. [Google Scholar] [CrossRef]
  95. Rozhkov, I.S.; Grinberg, G.A.; Gamyanin, G.A.; Kukhtinskiy, Y.G.; Solovyev, V.I. Late Mesozoic Magmatism and Gold Mineralization of the Upper Indigirsky Region; Science: Moscow, Russia, 1971; p. 240. (In Russian) [Google Scholar]
  96. Kudrin, M.V.; Zayakina, N.V.; Fridovsky, V.Y.; Galenchikova, L.T. Hydrous ferric sulfate–Fe(SO4)(OH)2H2O from the supergene zone of the Khangalas gold deposit, Eastern Yakutia, Russia. Notes Rus. Miner. Soc. 2020, 149, 126–141. [Google Scholar] [CrossRef]
  97. Kudrin, M.V.; Polufuntikova, L.I.; Fridovsky, V.Y.; Aristov, V.V.; Tarasov, Y.A. Geochemistry and the form of «invisible» gold in pyrite from metasomatites of the Khangalas deposit, North-East of Russia. Arct. Subarct. Nat. Resources. 2020, 25, 7–14. [Google Scholar] [CrossRef]
  98. Polufuntikova, L.I.; Fridovsky, V.Y.; Akimova, E.D.; Zaitsev, A.I. Hydrothermal-metasomatic changes in the host rocks of the Vyun ore field (Kular-Nera slate belt, North-East Russia). In Geology and Mineral Resources of the North-East of Russia. Materials of the IX All-Russian Scientific and Practical Conference; Izd. Dom SVFU: Yakutsk, Russia, 2019; Volume 1, pp. 77–80. [Google Scholar]
  99. Goryachev, N.A.; Gamyanin, G.N.; Prokof’ev, V.Y.; Velivetskaya, T.A.; Ignat’ev, A.V.; Leskova, N.V. Ag-Sb mineralization of the Yana-Kolyma belt, Northeast Russia. Russ. J. Pac. Geol. 2011, 5, 97–110. [Google Scholar] [CrossRef]
  100. Ignatiev, A.V.; Velivetskaya, T.A.; Budnitskiy, S.Y.; Yakovenko, V.V.; Vysotskiy, S.V.; Levitskii, V.I. Precision analysis of multisulfur isotopes in sulfides by femtosecond laser ablation GC-IRMS at high spatial resolution. Chem. Geol. 2018, 493, 316–326. [Google Scholar] [CrossRef]
  101. Velivetskaya, T.A.; Ignatiev, A.V.; Yakovenko, V.V.; Vysotskiy, S.V. An improved femtosecond laser-ablation fluorination method for measurements of sulfur isotopic anomalies (∆33S and ∆36S) in sulfides with high precision. Rapid Commun. Mass Spectrom. 2019, 33, 1722–1729. [Google Scholar] [CrossRef] [PubMed]
  102. Sotskaya, O.T.; Semyshev, F.I.; Malinovsky, M.A.; Alshevsky, A.V.; Livach, A.E.; Goryachev, N.A. Pyrite of sulphidization zones of terrigenic complexes of the Yana-Kolyma orogenic belt (Northeast Russia): Generations, typochimism, mineral associations. Bull. NE Sci. Cent. FEB RAS 2022, 1, 14–30. [Google Scholar] [CrossRef]
  103. Tardani, D.; Reich, M.; Deditius, A.P.; Chryssoulis, S.; Sánchez-Alfaro, P.; Wrage, J.; Roberts, M.P. Copper–arsenic decoupling in an active geothermal system: A link between pyrite and fluid composition. Geochim. Cosmochim. Acta 2017, 204, 179–204. [Google Scholar] [CrossRef]
  104. Deditius, A.P.; Utsunomiya, S.; Ewing, R.C.; Chryssoulis, S.L.; Venter, D.; Kesler, S.E. Decoupled geochemical behavior of As and Cu in hydrothermal systems. Geology 2009, 37, 707–710. [Google Scholar] [CrossRef]
  105. Deditius, A.P.; Utsunomiya, S.; Ewing, R.C.; Kesler, S.E. Nanoscale ‘‘liquid” inclusions of As-Fe-S in arsenian pyrite. Am. Mineral 2009, 94, 391–394. [Google Scholar] [CrossRef]
  106. Reich, M.; Simon, A.; Deditius, A.; Barra, F.; Chryssoulis, S.; Lagas, G.; Tardani, D.; Knipping, J.; Bilenker, L.; Sánchez-Alfaro, P.; et al. Trace element signature of pyrite from the Los Colorados Iron Oxide-Apatite (IOA) deposit, Chile: A missing link between Andean IOA and Iron Oxide Copper-Gold systems? Econ. Geol. 2016, 111, 743–761. [Google Scholar] [CrossRef] [Green Version]
  107. Reich, M.; Lagas, G.; Deditius, A. New advances in trace element geochemistry of ore minerals and accessory phases. Ore Geol. Rev. 2017, 81, 1215–1217. [Google Scholar] [CrossRef]
  108. Peterson, E.C.; Mavrogenes, J.A. Linking high-grade gold mineralisation to earthquake-induced fault-valve processes in the Porgera gold deposit, Papua New Guinea. Geology 2014, 42, 383–386. [Google Scholar] [CrossRef]
  109. Qian, G.; Brugger, J.; Testemale, D.; Skinner, W.; Pring, A. Formation of As(II)-pyrite during experimental replacement of magnetite under hydrothermal conditions. Geochim. Cosmochim. Acta 2013, 100, 1–10. [Google Scholar] [CrossRef]
  110. Deditius, A.P.; Utsunomiya, S.; Renock, D.; Ewing, R.C.; Ramana, C.V.; Becker, U.; Kesler, S.E. A proposed new type of arsenian pyrite: Composition, nanostructure and geological significance. Geochim. Cosmochim. Acta 2008, 72, 2919–2933. [Google Scholar] [CrossRef]
  111. Sazonov, A.M.; Kirik, S.D.; Silyanov, S.A.; Bayukov, Y.A.; Tishin, P.A. Typomorphism of arsenopyrite of the Blagodatnoye and Olympiada gold deposits (Yenisei Ridge). Mineralogy 2016, 3, 53–70. (In Russian) [Google Scholar]
  112. Genkin, A.D. Gold-bearing arsenopyrite from gold deposits: The internal structure of grains, composition, growth mechanisms and condition of gold. Geol. Ore Depos. 1998, 40, 551–557. (In Russian) [Google Scholar]
  113. Cabri, L.J.; Newville, M.; Gordon, R.; Crozier, D.; Sutton, S.; McMahon, G.; De-Tong, J. Chemical speciation of gold in arsenopyrite. Can. Mineral 2000, 38, 1265–1281. [Google Scholar] [CrossRef] [Green Version]
  114. Bralia, A.; Sabatini, G.; Troja, F. A revaluation of the Co/Ni ratio in pyrite as geochemical tool in ore genesis problems. Miner. Depos. 1979, 14, 353–374. [Google Scholar] [CrossRef]
  115. Bajwah, Z.U.; Seccombe, P.K.; Offler, R. Trace element distribution, Co:Ni ratios and genesis of the Big Cadia iron-copper deposit, New South Wales, Australia. Miner. Depos. 1987, 22, 292–303. [Google Scholar] [CrossRef]
  116. Azovskova, O.B.; Utochkina, N.V.; Zubova, T.P. Geochemical features of pyrite and marcasite from weathering crusts and “ancient” loose deposits of the Aktai area (Northern Urals). In Ezhegodnik-2013, Tr. IGG UrO RAN; URO RAN: Ufa, Russia, 2014; pp. 238–245, No. 161. (In Russian) [Google Scholar]
  117. Wang, J.; Liu, Z.; Wang, K.; Zeng, X.; Liu, J.; Zhang, F. Typomorphic Characteristics of Pyrites from the Shuangwang Gold Deposit, Shaanxi, China: Index to Deep Ore Exploration. Minerals 2019, 9, 383. [Google Scholar] [CrossRef] [Green Version]
  118. Onufrienok, V.V. Comparative analysis of the density of vacant positions and the density of impurity atoms in the structure of pyrite. Adv. Mod. Nat. Sci. 2013, 7, 61–67. [Google Scholar]
  119. Large, R.R.; Maslennikov, V.V. Invisible Gold Paragenesis and Geochemistry in Pyrite from Orogenic and Sediment-Hosted Gold Deposits. Minerals 2020, 10, 339. [Google Scholar] [CrossRef] [Green Version]
  120. Lee, M.; Shin, D.; Yoo, B.; Im, H.; Pak, S.; Choi, S. LA-ICP-MS trace element analysis of arsenopyrite from the Samgwang gold deposit, South Korea, and its genetic implications. Ore Geol. Rev. 2019, 114, 103147. [Google Scholar] [CrossRef]
  121. Volkov, A.V.; Genkin, A.D.; Goncharov, V.I. On the forms of gold occurrence in the ores of the Natalka and Mayskoe deposits (North-East of Russia). Rus. J. of Pac. Geol. 2006, 25, 18–29. [Google Scholar]
  122. Moskvitina, L.V.; Moskvitin, S.G.; Anisimova, G.S. Research of Nanoscale Gold by Methods of Tunneling and Atomic-Powered Microscopy with Chemical and Ion-Plasma Etching in the Kuchus Deposit (Republic Sakha (Yakutia). In International Science and Technology Conference “Earth Science”-Section One; IOP Publishing: Prague, Czech Republic, 2019; Volume 272, pp. 1–7, No. 2. [Google Scholar] [CrossRef]
  123. Cook, N.J.; Ciobanu, C.L.; Mao, J.W. Textural control on gold distribution in As-free pyrite from the Dongping, Huangtuliang and Hougou gold deposits, North China craton (Hebei Province, China). Chem. Geol. 2009, 264, 101–121. [Google Scholar] [CrossRef]
  124. Tauson, V.L.; Kravtsova, R.G.; Smagunov, N.V.; Spiridonov, A.M.; Grebenshchikova, V.I.; Budyak, A.E. Structurally and superficially bound gold in pyrite from deposits of different genetic types. Russ. Geol. Geophys. 2014, 55, 273–289. [Google Scholar] [CrossRef]
  125. Volkov, A.V.; Sidorov, A.A. Invisible gold. Bull. RAS 2017, 87, 40–49. [Google Scholar] [CrossRef]
  126. Cline, J.S. Timing of gold and arsenic sulfide mineral deposition at the Getchell Carlin-type gold deposit, north-central Nevada. Econ. Geol. 2001, 96, 75–89. [Google Scholar] [CrossRef] [Green Version]
  127. Bortnikov, N.S.; Vikentiev, I.V.; Tagirov, B.R.; Stavrova, O.O.; Cabri, L.J.; Mc Mahon, G.; Bogdanov, Y.A. Invisible gold in sufides from seafloor massive sulfide edifices. Geol. Ore Depos. 2003, 45, 201–212. [Google Scholar]
  128. Cook, N.J.; Chryssouilis, S.L. Concentrations of invisible gold in the common sulfides. Can. Mineral. 1990, 28, 1–16. [Google Scholar]
  129. Vikentyev, I.V. Invisible and microscopic gold in pyrite: Research methods and new data for pyrite ores of the Urals. Geol. Ore Depos. 2015, 57, 267–298. [Google Scholar] [CrossRef]
  130. Wang, C.; Shao, Y.; Huang, K.; Zhou, H.; Zhang, J.; Liu, Z.; Liu, Q. Ore-Forming Processes at the Xiajinbao Gold Deposit in Eastern Hebei Province: Constraints from EPMA and LA-ICPMS Analysis. Minerals 2018, 8, 388. [Google Scholar] [CrossRef] [Green Version]
  131. Voitkevich, G.V.; Miroshnikov, A.E.; Povarenykh, A.S.; Prokhorov, V.G. A Short Guide to Geochem, 2nd ed.; Nedra: Moscow, Russia, 1977; p. 184. (In Russian) [Google Scholar]
  132. Belikova, G.I.; Salikhov, D.N.; Berdnikov, P.G. On the question of gold isomorphism in pyrite. Geol. Collect. GI USC RAS 2002, 3, 190–193. (In Russian) [Google Scholar]
  133. Chouinard, A.; Paquette, J.; Williams-Jones, A.E. Crystallographic controls on trace-element incorporation in auriferous pyrite from the Pascua epithermal high-sulfidation deposit, Chile-Argentina. Can. Miner. 2005, 43, 951–963. [Google Scholar] [CrossRef] [Green Version]
  134. Vaughan, J.P.; Kyin, A. Refractory gold ores in Archaean greenstones, Western Australia: Mineralogy, gold paragenesis, metallurgical characterization and classification. Miner. Magaz. 2004, 68, 255–277. [Google Scholar] [CrossRef]
  135. Sharp, Z.D.; Essene, E.J.; Kelly, W.C. A re-examination of the arsenopyrite geothermometer; pressure considerations and applications to natural assemblages. Can. Mineral. 1985, 23, 517–534. [Google Scholar]
  136. Lentz, D.R. Sphalerite and arsenopyrite at the Brunswick No. 12 massive sulfide deposit, Bathurst camp, New Brunswick: Constraints on P-T evolution. Can. Mineral. 2002, 40, 19–31. [Google Scholar] [CrossRef] [Green Version]
  137. Kovalchuk, E.V.; Tagirov, B.R.; Vikentyev, I.V.; Chareev, D.A.; Tyukova, E.E.; Nikolsky, M.S.; Bortnikov, N.S. “Invisible” Gold in Synthetic and Natural Arsenopyrite Crystals, Vorontsovka Deposit, Northern Urals. Geol. Ore Dep. 2019, 61, 447–468. [Google Scholar] [CrossRef]
  138. Groves, D.I.; Santosh, M.; Deng, J.; Wang, Q.; Yang, L.; Zhang, L. A holistic model for the origin of orogenic gold deposits and its implications for exploration. Miner. Dep. 2020, 55, 275–292. [Google Scholar] [CrossRef]
  139. Bortnikov, N.S.; Gamyanin, G.N.; Vikentieva, O.V.; Prokofiev, V.Y.; Alpatov, V.A.; Bakharev, A.G. Composition and origin of fluids in the hydrothermal system of the Nezhdaninsky gold ore deposit (Sakha-Yakutia, Russia). Geol. Ore Dep. 2007, 49, 99–145. [Google Scholar] [CrossRef]
  140. Brueckner, S.M.; Kline, A.K.; Bilenker, L.D.; Poole, J.; Whitney, M.S. Mineral Chemistry and Sulfur Isotope Geochemistry from Tonalite-Hosted, Gold-Bearing Quartz Veins at Hog Mountain, Southwestern Appalachians: Implications for Gold Precipitation Mechanism, Sulfur Source, and Genesis. Econ. Geol. 2021, 116, 357–388. [Google Scholar] [CrossRef]
  141. Sapancı, Ö.; Köprübaş, N.; Çiftçi, E.; Köprübaş, N.; Tokat, G.; Demir, Y. Mineralogy, geochemistry, fuid inclusion, and stable sulfur isotope investigation of the Terziali shear related orogenic gold deposit (Central Anatolia, Turkey): Implications for ore genesis and mineral exploration. Arab. J. Geosci. 2022, 15, 113. [Google Scholar] [CrossRef]
  142. Large, R.R.; Bull, S.W.; Maslennikov, V.V. A carbonaceous sedimentary source rock model for Carlin-type and orogenic gold deposits. Econ. Geol. 2011, 106, 331–358. [Google Scholar] [CrossRef] [Green Version]
  143. Li, R.; Chen, H.; Large, R.R.; Zhao, L.; Liu, Y.; Jiao, J.; Xia, X.P.; Yang, Q. Ore-forming fuid source of the orogenic gold deposit: Implications from a combined pyrite texture and geochemistry study. Chem. Geol. 2020, 552, 119781. [Google Scholar] [CrossRef]
  144. Chernyshev, I.V.; Chugaev, A.V.; Bortnikov, N.S.; Gamyanin, G.N.; Prokopiev, A.V. Pb isotopic composition and metal sources of Au and Ag deposits of the south Verkhoyansk region (Yakutia, Russia) according to high-precision MC-ICP-MS data. Geol. of Ore Dep. 2018, 60, 398–417. [Google Scholar] [CrossRef]
  145. Goldfarb, R.J.; Leach, D.L.; Rose, S.C.; Landis, G.P. Fluid inclusion geochemistry of gold-bearing quartz veins of the Juneau Gold Belt, southeastern Alaska—Implications for ore genesis. Econ Geol. Mono. 1989, 6, 363–375. [Google Scholar]
  146. Hoefs, J. Stable Isotope Geochemistry, Eighth Edition; Springer International Publishing AG, part of Springer Nature: Cham, Switzerland, 2018. [Google Scholar] [CrossRef]
  147. Ohmoto, H. Systematics of sulfur and carbon isotopes in hydrothermal ore deposits. Econ. Geol. 1972, 67, 551–578. [Google Scholar] [CrossRef]
  148. Goryachev, N.A.; Budyak, A.E.; Tarasova, Y.I.; Ignat’ev, A.V.; Velivetskaya, T.A. A case history of applying in situ analysis of the sulfur isotopic compositions of sulfides from ores of the largest deposits in the Bodaibo synclinorium (Eastern Siberia). Dokl. Akad. Nauk 2019, 484, 156–159. [Google Scholar] [CrossRef]
  149. Dubinina, E.O.; Ikonnikova, T.A.; Chugaev, A.V. Heterogeneity of the sulfur isotopic composition of pyrite at the Sukhoi Log deposit and its controlling factors. Dokl. Akad. Nauk 2010, 435, 1665–1669. [Google Scholar] [CrossRef]
  150. Kovalev, K.R.; Kalinin, Y.A.; Naumov, E.A.; Kolesnikova, M.K.; Korolyuk, V.N. Gold content of arsenopyrite of gold-sulfide deposits of East Kazakhstan. Geol. Geophys. 2011, 52, 225–242. [Google Scholar]
  151. Kovalev, K.R.; Kuzmina, O.N.; Dyachkov, B.A.; Vladimirov, A.G.; Kalinin, Y.A.; Naumov, E.A.; Kirillov, M.V.; Annikova, I.Y. Gold-sulfide disseminated mineralization of the Zhaima deposit (East Kazakhstan). Geol. Ore Dep. 2016, 58, 116–133. [Google Scholar] [CrossRef]
Figure 4. Geologic map and simplified cross-sections of the intrusion-hosted OGDs, central YKMB: (A) V’yun and (B) Shumnyi.
Minerals 13 00394 g004
Figure 5. Photographs of the ore bodies in the intrusion-hosted OGDs, central YKMB: (A,C) V’yun; (B) Shumnyi; (D) stereogram of the veins, bedding, and dykes. Abbreviations: S0—bedding, Qz—quartz vein, D—dyke. Structural data were plotted on the upper hemisphere of the Wulff stereographic net.
Minerals 13 00394 g005
Figure 8. Microtexture of diagenetic Py1 (reflected light) OGDs, central YKMB: (A) framboids and zonal structure; (B) nodular aggregate pyrite and marcasite as anhedral-to-colloform grains; (C) layered arrangement of Py1 crystals in siltstone.
Minerals 13 00394 g008
Figure 9. Microtextures of metamorphic pyrite2 (reflected light) OGDs, central YKMB: (A) intergrowths of cubic pyrite; (B) accumulation of crystals and pyrite intergrowths. The central part of the individual grains is corroded; (C) micro-veinlets of pyrite along cracks.
Minerals 13 00394 g009
Figure 10. Microtextures of alteration pyrite3 and arsenopyrite1 from proximal alteration rock sediment-hosted OGDs (AC) and from proximal alteration rock intrusion-hosted OGDs (D) ((A,C,D) reflected light and (B) backscattered electron images), central YKMB. (A) Dissemination of Py3 and Apy1: pentagondodecahedral shape and zoning are characteristic of individual large pyrite crystals; (B) microinclusions of galena (gn), chalcopyrite (Ccp), and sphalerite (Sp) in pores, voids, and microcracks of pyrite crystals; (C) rod-like rims of quartz–carbonate composition; (D) dissemination of the alteration Py3 and Apy1 in a dyke.
Minerals 13 00394 g010
Figure 11. Distribution of trace elements in pyrites of different generations in the studied OGDs, central YKMB: (A) ternary diagram As–Co+Ni–Sb for Py2 and Py3; (B) content of Σ (Co, Ni, Cu, Sb, Pb).
Minerals 13 00394 g011
Figure 15. The gold and silver content in sulfides from the alteration of the studied OGDs, central YKMB: (A) Malo–Taryn; (B) Badran; (C) Khangalas; (D) V’yun; (E) Shumnyi; (F) comparative diagrams between the maximum, mean, and median values of the gold and silver content in sulfides from the alteration.
Minerals 13 00394 g015
Figure 18. Diagrams of the ratios of concentrations of Fe, S, and As in Apy1 of the studied OGDs, central YKMB. (A) As vs. S. (B) As vs. Fe. (C) Variations in the S and As content in the studied deposits; (D) diagrams of the ratios S/As and (S + As)/Fe. The intersection of the lines S/As = 1 and (S + As)/Fe = 2 corresponds to chemical stoichiometry. See symbols in Figure 16.
Minerals 13 00394 g018
Figure 19. Diagrams of the ratios of concentrations of Fe, S, As, and trace elements in Apy1 of the studied OGDs, central YKMB. (A) Fe vs. Co; (B) S vs. Co; (C) As vs. Co; (D) Fe vs. Ni; (E) S vs. Ni; (F) As vs. Ni; (G) Fe vs. Cu; (H) S vs. Cu; (I) As vs. Cu; (J) Fe vs. Sb; (K) S vs. Sb; (L) As vs. Sb. The lines Fe = 34.30 wt%, S = 19.69 wt%, and As = 46.01 wt% correspond to the stoichiometric composition of pyrite. See symbols in Figure 16.
Minerals 13 00394 g019
Figure 20. Distribution of the total impurity Co+Ni in Py3 relative to the indicator S/Fe (A) of the studied OGDs, central YKMB. (B) Diagram of concentration ratios Ni and Co in Py3 of the studied deposits. The demarcated fields are after [115]. See symbols in Figure 16.
Minerals 13 00394 g020
Figure 23. Au-As plot for mean values of Apy1 in the studied OGDs, central YKMB. The lines of gold saturation after [32,49].
Minerals 13 00394 g023
Table 1. General characteristics of the studied OGDs, central YKMB.
CharacteristicsMalo–TarynBadranKhangalasV’yunShumnyi
Mineral typeAu-Py-ApyAu-Py-ApyAu-Py-ApyAu-Py-ApyAu-Py-Apy
Coordinates (N/E)63°54′/143°11′64°14′/141°31′64°06′/144°55′65°58′/138°16′66°00′/138°08′
Metallogenic zoneAdycha–TarynMugurdakh–SelerikanOlchan–NeraOlchan–NeraOlchan–Nera
Ore clusterTarynSelerikanKhangalasBurgandzhaBurgandzha
Magmatism/
composition
dyke/
trachybasalts
NoNoDykes/andesite,
dacite, granodiorite, trachyandesite, trachybasalt trachyandesite
Dykes/andesite, dacite, granodiorite, trachyandesite, trachybasalt, trachyandesite
Age, Ma: composition/
method
145–160?/trachybasalts/Rb-SrNoNo147/trachyandesite/
U-Pb SHRIMP II
151, 146/andesite, trachyandesite/
U-Pb SHRIMP II
Host rockClastic rocks (T3)Clastic rocks (T3)clastic rocks (P2)Dykes (J3)/
clastic rocks (T3)
Dykes (J3)/clastic rocks (T3)
AlterationPyrite–arsenopyrite–sericite–
carbonate–quartz
Pyrite–arsenopyrite–sericite-
carbonate–quartz
Pyrite–arsenopyrite-sericite–
carbonate–quartz
Pyrite–arsenopyrite–sericite–
carbonate–quartz
Pyrite–arsenopyrite–sericite–carbonate–
quartz
Ore locationReverse fault in the SW wing of the Malo–Taryn synclineThrust in the SW wing of the Mugurdakh synclineReverse fault in the SW wing of the Khangalas anticlineTransverse NE faults to the folding of the NW strikeTransverse NE faults to the folding of the NW strike
Ore bodiesMineralized faults with Au-quartz veins/veinlets
and Au-sulfide-disseminated
Au-quartz veins/veinlets and Au-sulfide-disseminated
Mineral associations *Au-Bi,
Py-Apy-Qz metasomatic,
Py-Apy-Qz vein,
Au-polysulfide-Qz,
Au-Sb,
sulfosalt–
carbonate,
berthierite–
antimony,
Ag-Sb
Py-Apy-Qz metasomatic,
Apy-Py-carbonate-Qz,
Ccp-Sp-Ab-Qz,
Ttr-Ser-Qz,
Ag-Qz,
Sbn-carbonate-Qz
Py-Apy-Qz metasomatic,
Py-Apy-Qz vein,
Au-polysulfide-Qz,
sulfosalt-carbonate-Qz
Py-Apy-Qz metasomatic,
Py-Apy-Qz vein,
Au-polysulfide-Qz,
fahlore-Qz
Py-Apy-Qz metasomatic,
Py-Apy-Qz vein,
Au-polysulfide-Qz,
Sbn-Qz
Sulphide content, vol%1–31–21–51–31–2
Au fineness, ‰894–995,
predominantly
901–925
462–998,
predominantly
800–899
780–850,
predominantly
820–830
700–920,
predominantly
800–899
800–900
Au, CAu, ppm4.27.83.912.180.0
Au reserves/Au resources, t∼12.5/-∼9.3/-∼9.5/-∼2.5/∼1.9-/6.8
Compiled using [12,21,62,66,68,74,75,76,77,78,79,80,81,82,83,84,85]. Abbreviations [86]: Py—pyrite, Apy—arsenopyrite, Au—native gold, Qz—quartz, Ccp—chalcopyrite, Sp—sphalerite, Ab—albite, Ttr—tetrahedrite, Ser—sericite, Sbn—stibnite. * Mineral associations: Au-Bi—gold–bismuth, Py-Apy-Qz metasomatic—pyrite–arsenopyrite–quartz metasomatic, Py-Apy-Qz vein—pyrite–arsenopyrite–quartz vein, Au-polysulfide-Qz—gold–polysulfide–quartz, Au-Sb—gold–stibnite, sulfosalt–carbonate-Qz—sulfosalt–carbonate–quartz, Ag-Sb—silver–stibnite, Apy-Py-carbonate-Qz—arsenopyrite–pyrite–carbonate–quartz, Ccp-Sp-Ab-Qz—chalcopyrite–sphalerite–albite–quartz, Ttr-Ser-Qz—tetrahedrite–sericite–quartz, Ag-Qz—silver–quartz, Sbn-carbonate-Qz—stibnite–carbonate–quartz, fahlore-Qz—fahlore–quartz, Sbn-Qz—stibnite–quartz.
Table 3. Summary of common textures and pyrite–arsenopyrite classification OGDs Central YKMB.
PyriteTimingHost RockStructure/TextureCo-Genetic MineralsEvidence for Timing
Py1Syn-sedimentary/
diagenetic
Sandstones, siltstonesFramboids, nodular aggregatesDetrital quartzAlong the layering
Py2MetamorphicSandstones, siltstonesEuhedral–subhedral; zoning structure; corroded structureSericite, carbonateFault zones
Py3MetasomaticSandstones, siltstones, andesite, daciteEuhedral–subhedral; fine-grained inclusions of galena, sphalerite, chalco-pyrite; zoning structure; corroded structureArsenopyrite, sericite, carbonateProximal alterations
Apy1MetasomaticSandstones, siltstones, andesite, daciteEuhedral–subhedral; fine-grained inclusions of galena, sphalerite, chalco-pyrite; zoning structure; corroded structurePyrite, sericite, carbonateProximal alterations
Table 4. Results of atomic absorption atomic spectrometry (ppm) of sulfides from the proximal alteration of the studied OGDs, central YKMB.
RockMineralAu, ppmAg, ppmAu/AgNReferences
Malo–Taryn deposit
Alteration rock after sandstonesPyrite 0.4 10.1 5.1 / 5.4 * 0.9 8.1 5.4 / 6.3 1.2 5.2 2.2 / 1.2 6This study,
and [21]
Arsenopyrite 5.0 28.1 17.1 / 17.8 0.1 10.2 4.2 / 3.3 0.9 191.6 55.7 / 15.1 4
Badran deposit
Alteration rock after sandstones and siltstonesPyrite 13.7 155.5 57.5 / 41.1 1.2 16.9 6.0 / 3.6 1.2 83.4 17.0 / 9.9 12[11]
Arsenopyrite 34.8 168.5 66.9 / 54.6 1.3 12.6 4.9 / 2.9 9.5 42.6 21.8 / 17.5 9
Khangalas deposit
Alteration rock after sandstones and siltstonesPyrite 0.8 39.3 11.2 / 7.4 1.1 17.4 6.2 / 6.1 0.5 10.9 2.6 / 1.8 13This study,
and [12]
Arsenopyrite 12.3 23.8 17.5 / 16.4 0.4 11.8 6.5 / 7.2 1.4 28.6 11.1 / 3.3 3
V’yun deposit
Alteration rock after dykesPyrite 0.3 25.8 5.0 / 0.7 0.9 2.0 1.3 / 1.1 0.3 16.0 3.1 / 0.6 6This study
Alteration rock after sandstones and siltstonesPyrite 0.3 159.5 35.6 / 14.4 0.4 23.7 5.6 / 3.0 0.2 30.5 6.0 / 2.3 8
Alteration rock after sandstones and siltstonesArsenopyrite28.9, 58.42.2, 2.312.8, 26.82
Shumnyi deposit
Alteration rock after dykesPyrite 9.8 53.9 28.8 / 25.8 0.6 2.8 2.1 / 2.6 4.0 40.9 18.7 / 14.9 4This study
Alteration rock after sandstonesPyrite 2.3 38.4 13.2 / 6.0 0.3 2.0 1.1 / 1.0 3.9 23.1 12.7 / 12.0 4
Minimum Maximum Mean / Median .
Table 5. Sulfur isotope data of pyrite and arsenopyrite from proximal alteration rock sediment-hosted deposits and intrusion-hosted deposits of the studied OGDs, central YKMB.
SampleDepositMineralRockd34SVCDT,‰Reference
1MT-66-16Malo–TarynArsenopyriteAlteration rock after sandstones−1.4This study
2Y-2012/1−1.6
3M-1-16PyriteAlteration rock after siltstones−2.3
4MT-76-16Alteration rock after sandstones−5.5
5Y-2012/21.4
6B-24/2-19Badran *ArsenopyriteAlteration rock after siltstones−0.3/−0.2[11]
7B-16-190.0/−0.3
8B-35/2-19−0.7/−0.8
9B-10/2-19Alteration rock after sandstones−0.3/−0.3
10B-54/2-19−0.5/−0.2
11B-14/3-19−0.4/0.1
12B-56/2-19−1.1/−0.6
13B-40-19−0.4/−0.3
14B-24/1-19PyriteAlteration rock after siltstones0.4/1.6
15B-44-190.3/0.3
16B-17-191.0/1.2
17B-26-190.8/1.1
18B-35/1-19−0.7/1.4
19B-10/1-19Alteration rock after sandstones0.1/1.8
20B-54/1-190.5/1.8
21B-14/1-190.6/1.9
22B-51-191.0/0.7
23B-52-191.1/1.0
24B-41-19−0.2/−0.3
25B-56/1-191.5/1.5
26B-33-19−0.5/1.0
27KG-9-19KhangalasArsenopyriteAlteration rock after sandstones−1.4[12]
28K-4-17−1.2
29KG-26-19−1.1This study
30KG-29-19−2.1
31KG-8-19PyriteAlteration rock after siltstones−0.8
32KG-20-19Alteration rock after sandstone and siltstones−1.0
33KG-32-19Alteration rock after sandstones−1.3[12]
34K-9-17/1−0.6
35K-9-17/2−1.5This study
36K-4-17−1.5
37K-14-17−1.9
38V-14-18V’yunPyriteAlteration rock after dykes−1.9This study
39V-15-183.1
40V-20-18−6.4
41V-22-183.1
42V-43-18−4.6
43V-140-18−4.7
44VF-24-18ArsenopyriteAlteration rock after sandstones4.4
45VF-27-18PyriteAlteration rock after sandstone and siltstones3.7
46VF-27-184.4
47VZ-158-18Alteration rock after sandstones5.6
48V-162-182.3
49S-42-18/1ShumnyiPyriteAlteration rock after dykes2.1This study
50S-42-18/22.5
51SU-22-182.4
52S-113-18/14.8
53S-113-18/25.1
54S-17-18Alteration rock after sandstones4.3
55S-112-185.0
* The values of the S isotopic composition of pyrite and arsenopyrite for the Badran deposit were determined using local measurement methods at the periphery (denominator) and center (numerator).
Disclaimer/Publisher’s Note: The statements, opinions and data contained in all publications are solely those of the individual author(s) and contributor(s) and not of MDPI and/or the editor(s). MDPI and/or the editor(s) disclaim responsibility for any injury to people or property resulting from any ideas, methods, instructions or products referred to in the content.

