

Genesis and Fluid Evolution of the Hongqiling Sn-W Polymetallic Deposit in Hunan, South China: Constraints from Geology, Fluid Inclusion, and Stable Isotopes


Abstract
:1. Introduction
2. Geological Setting
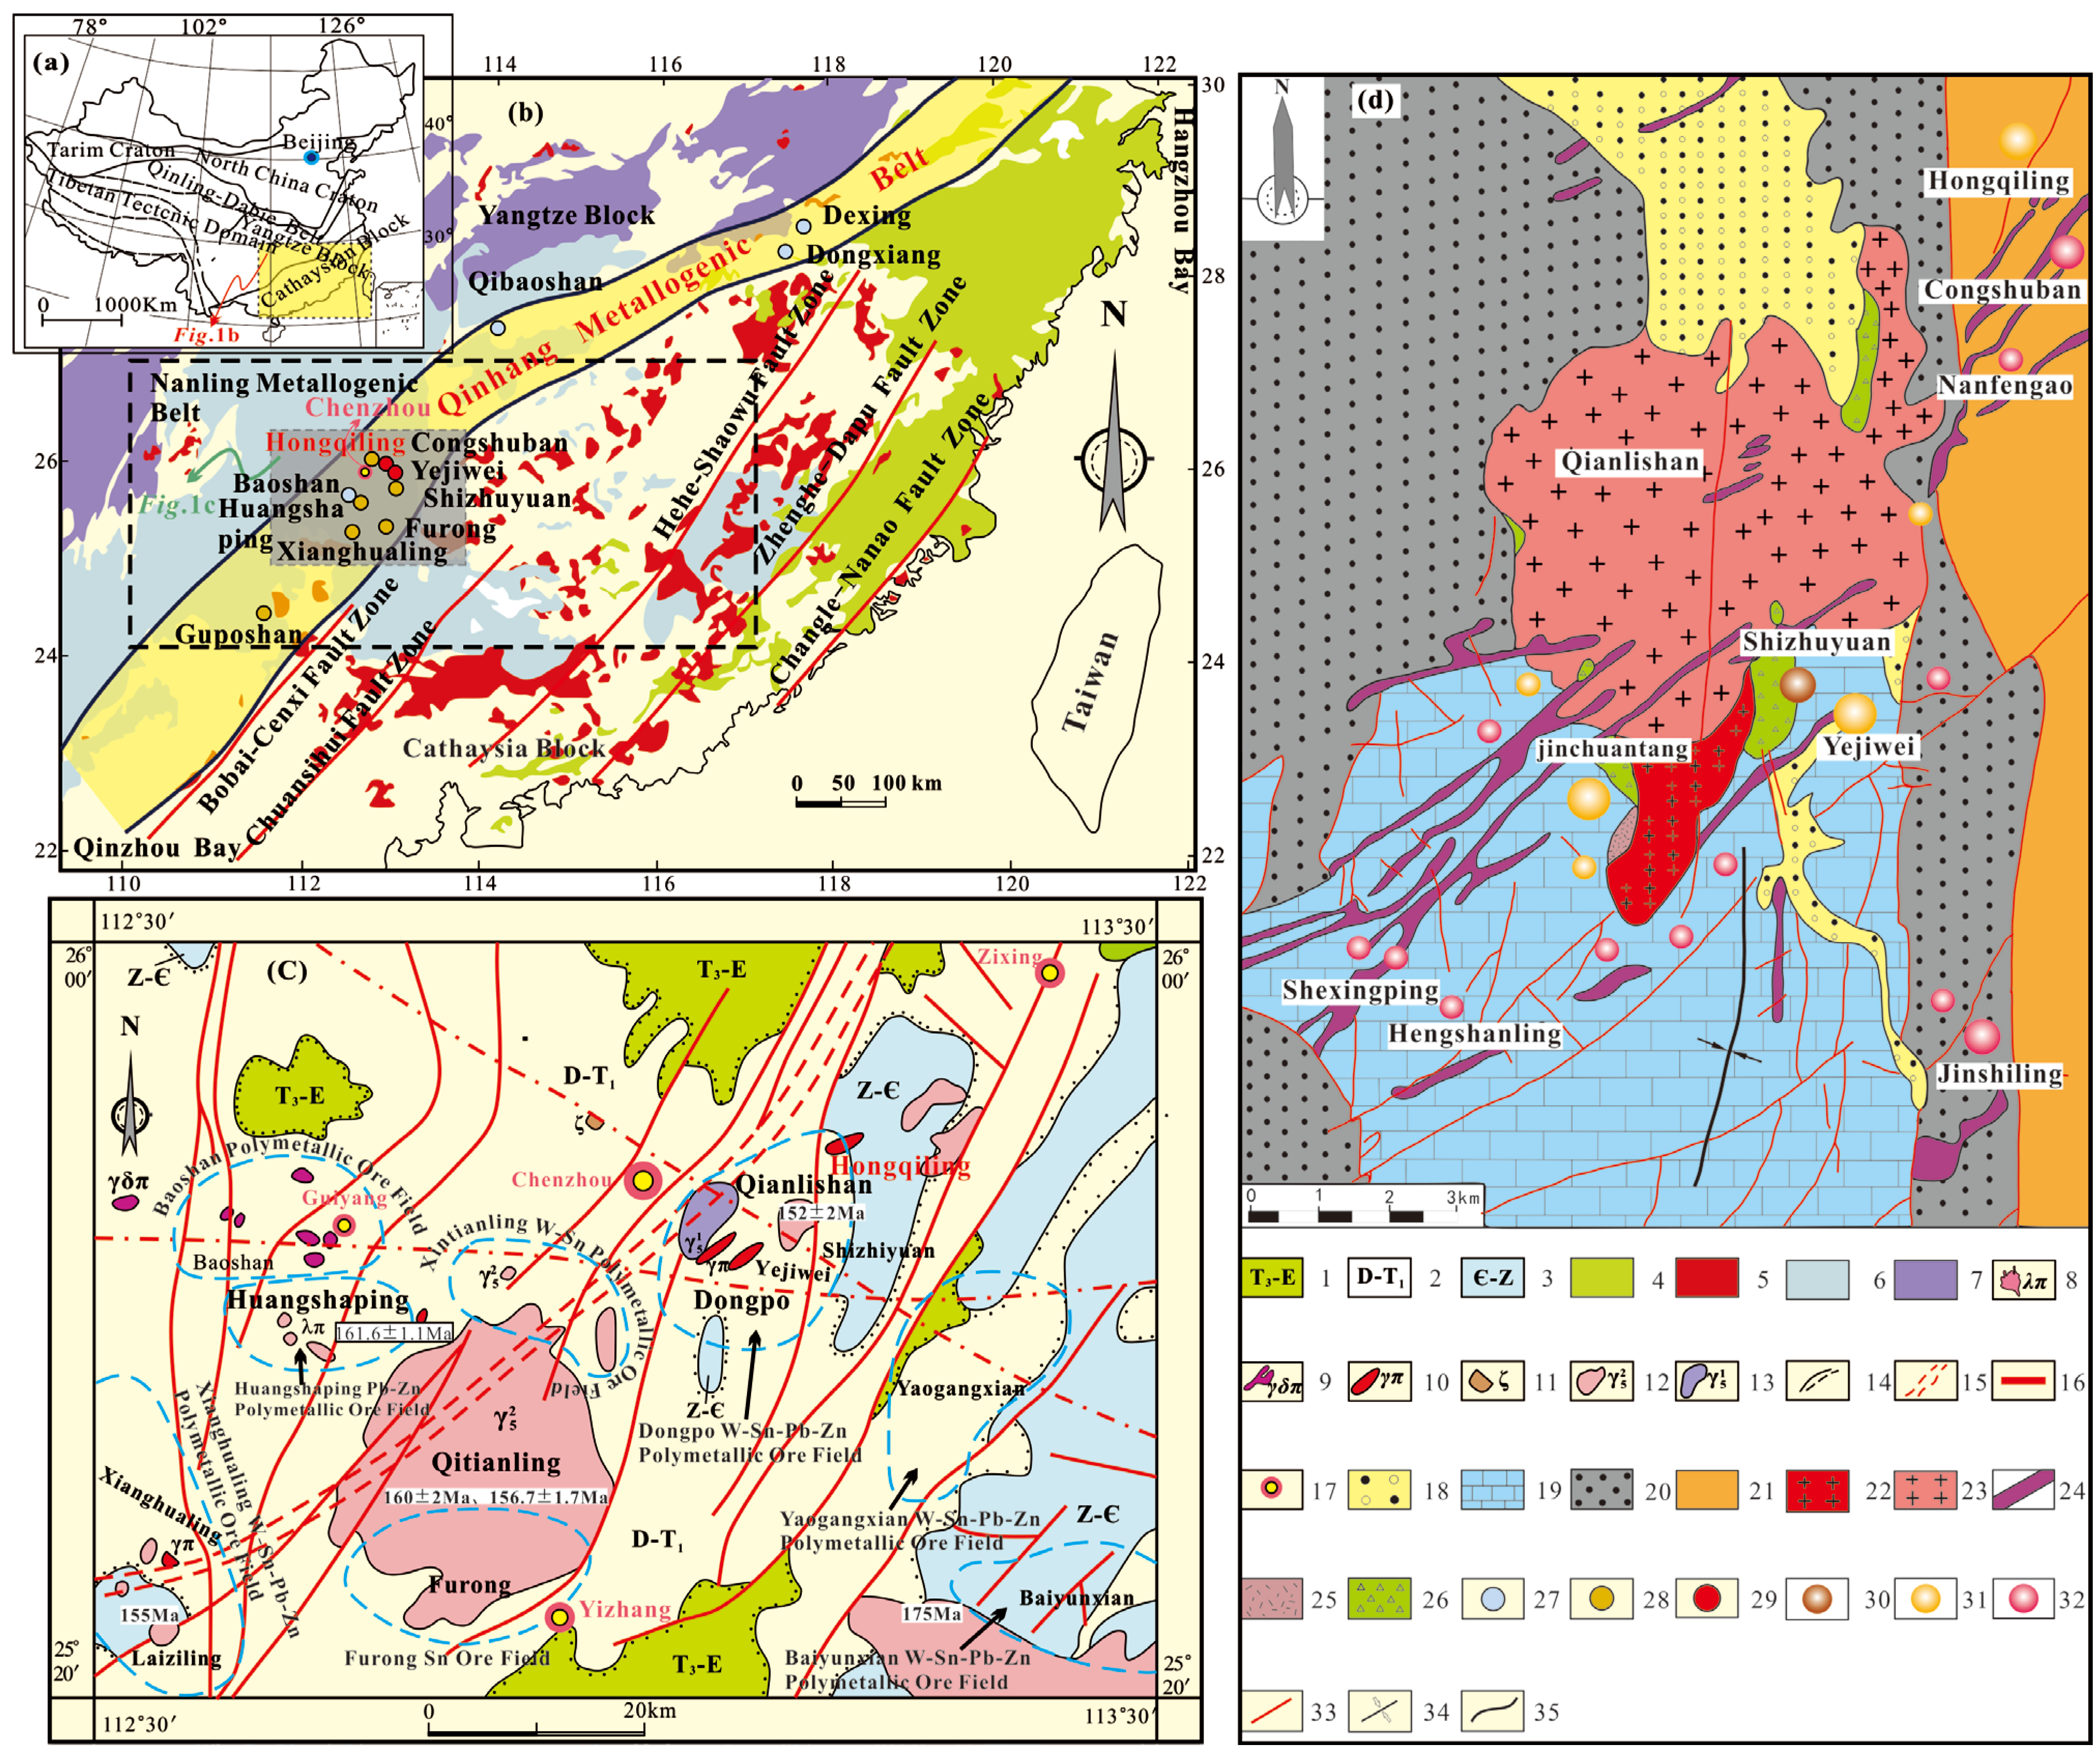
2.1. Regional Geology

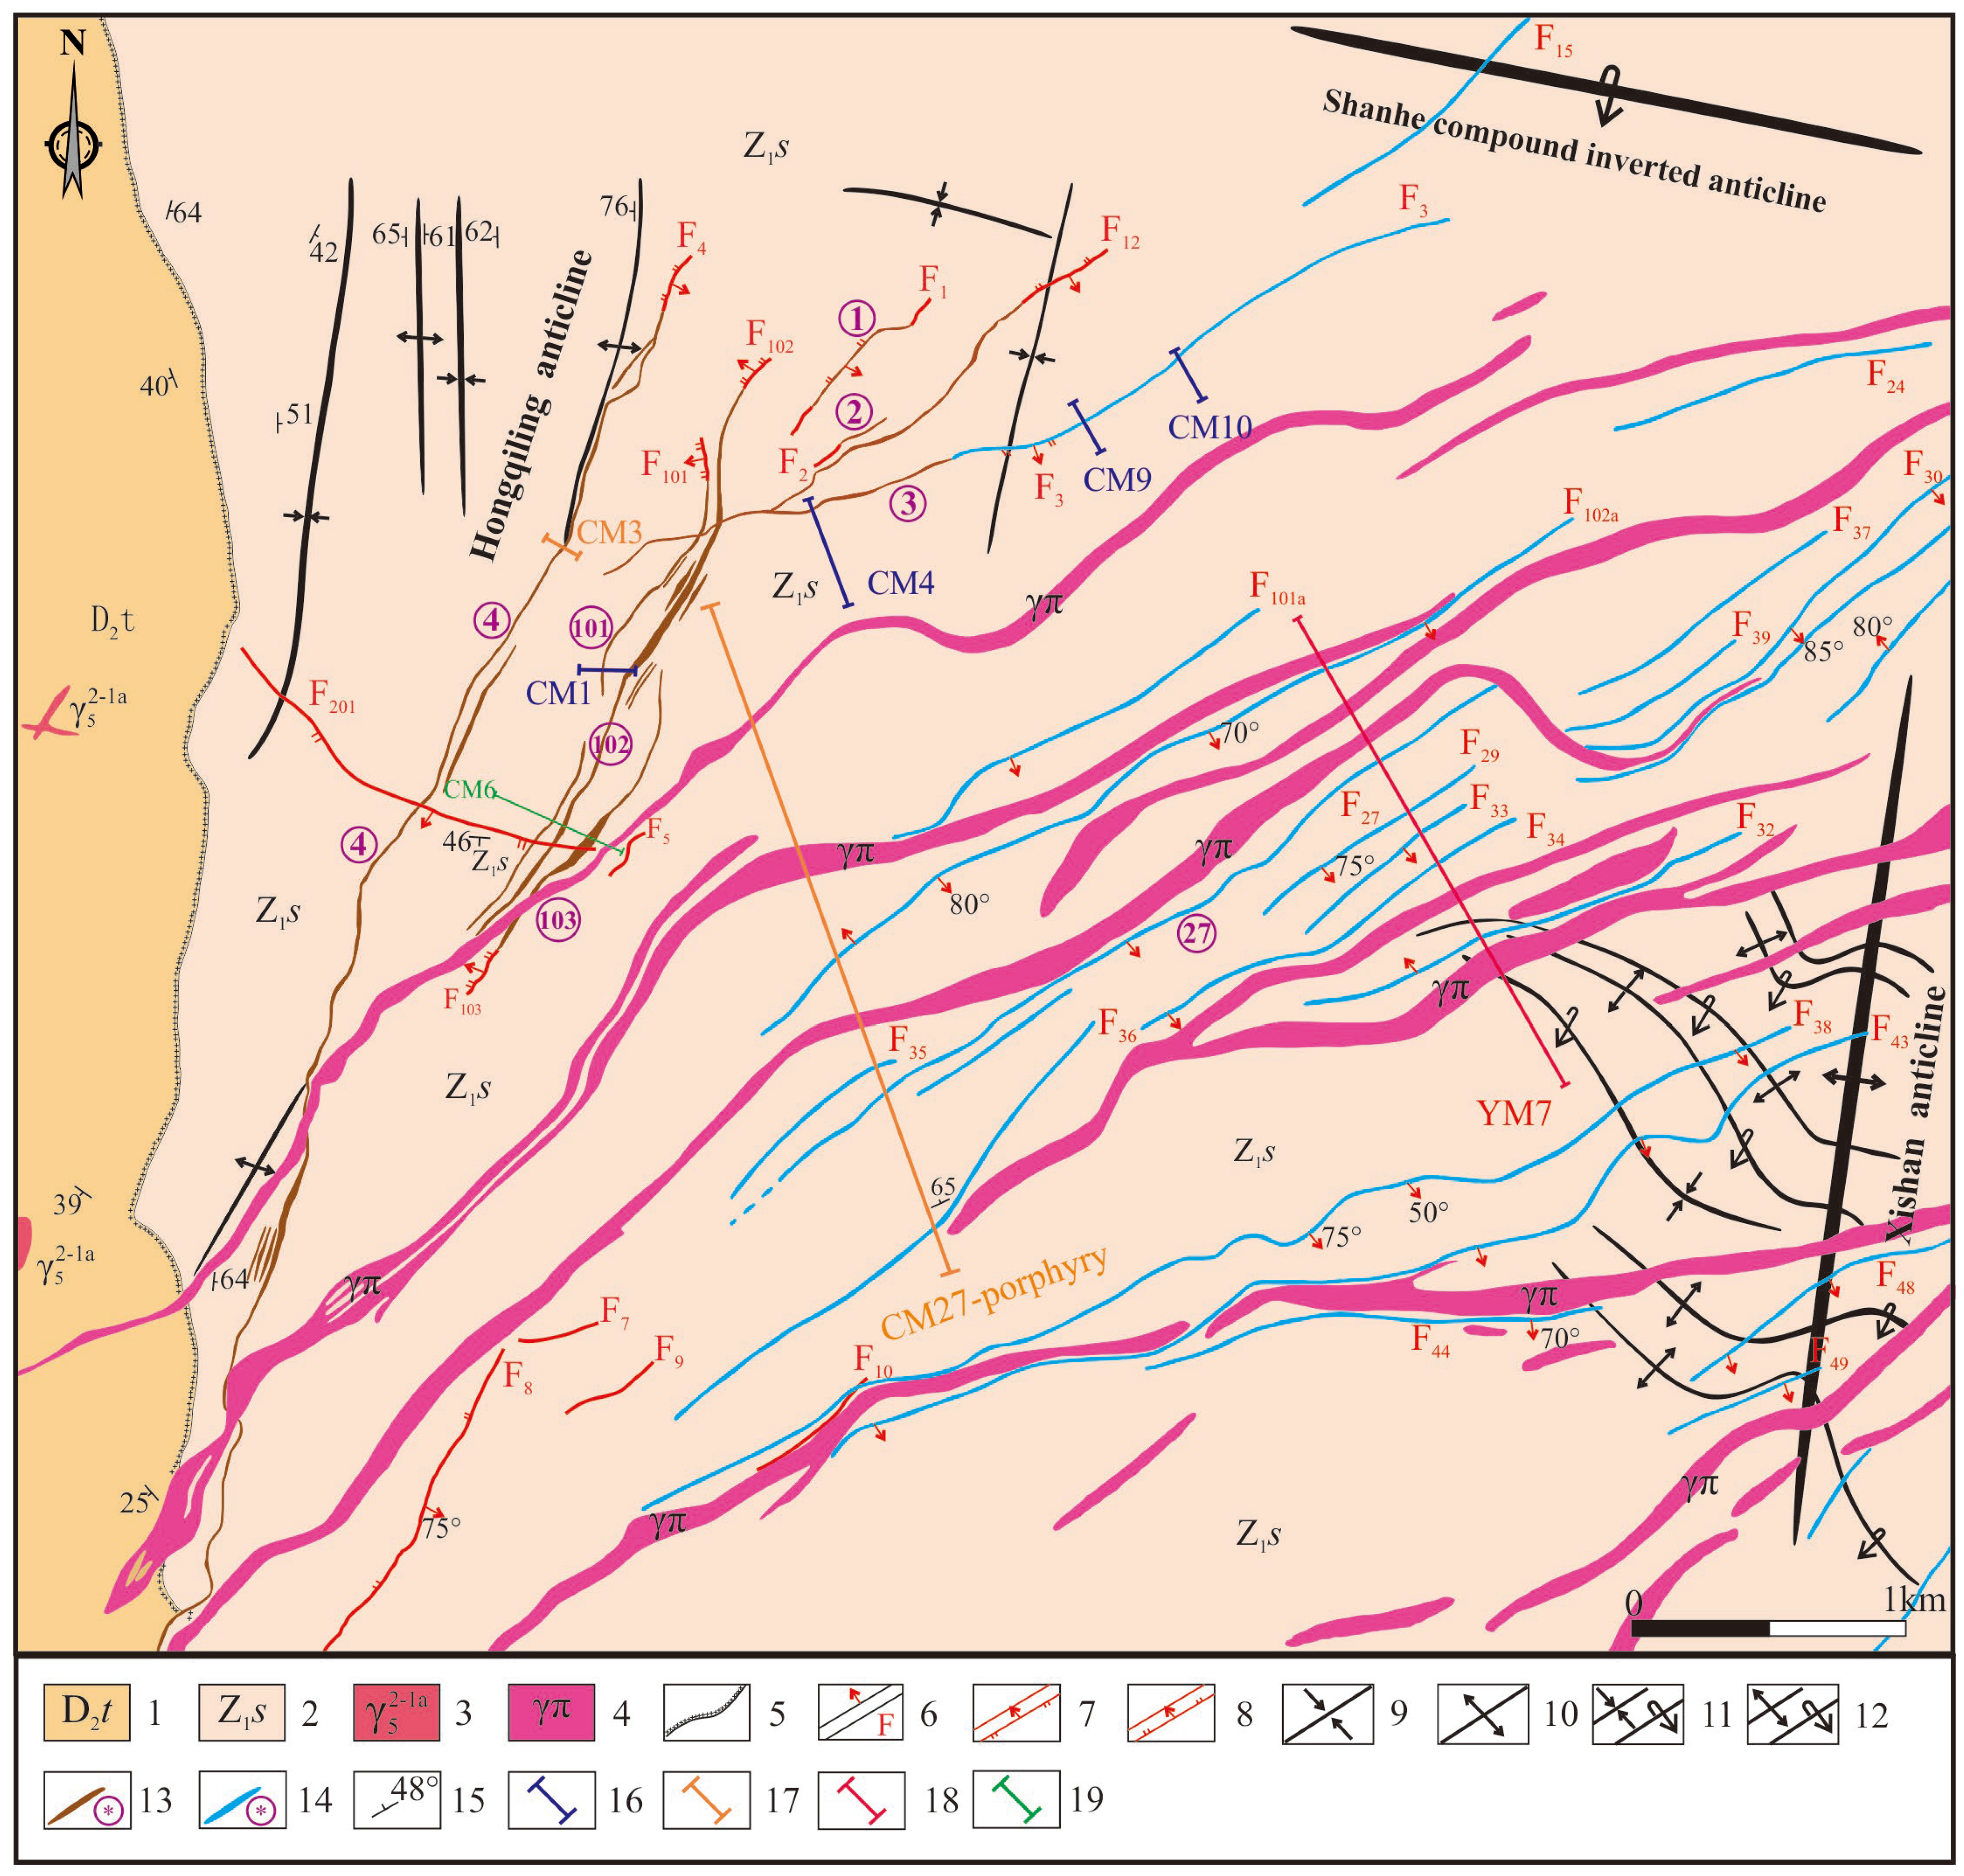
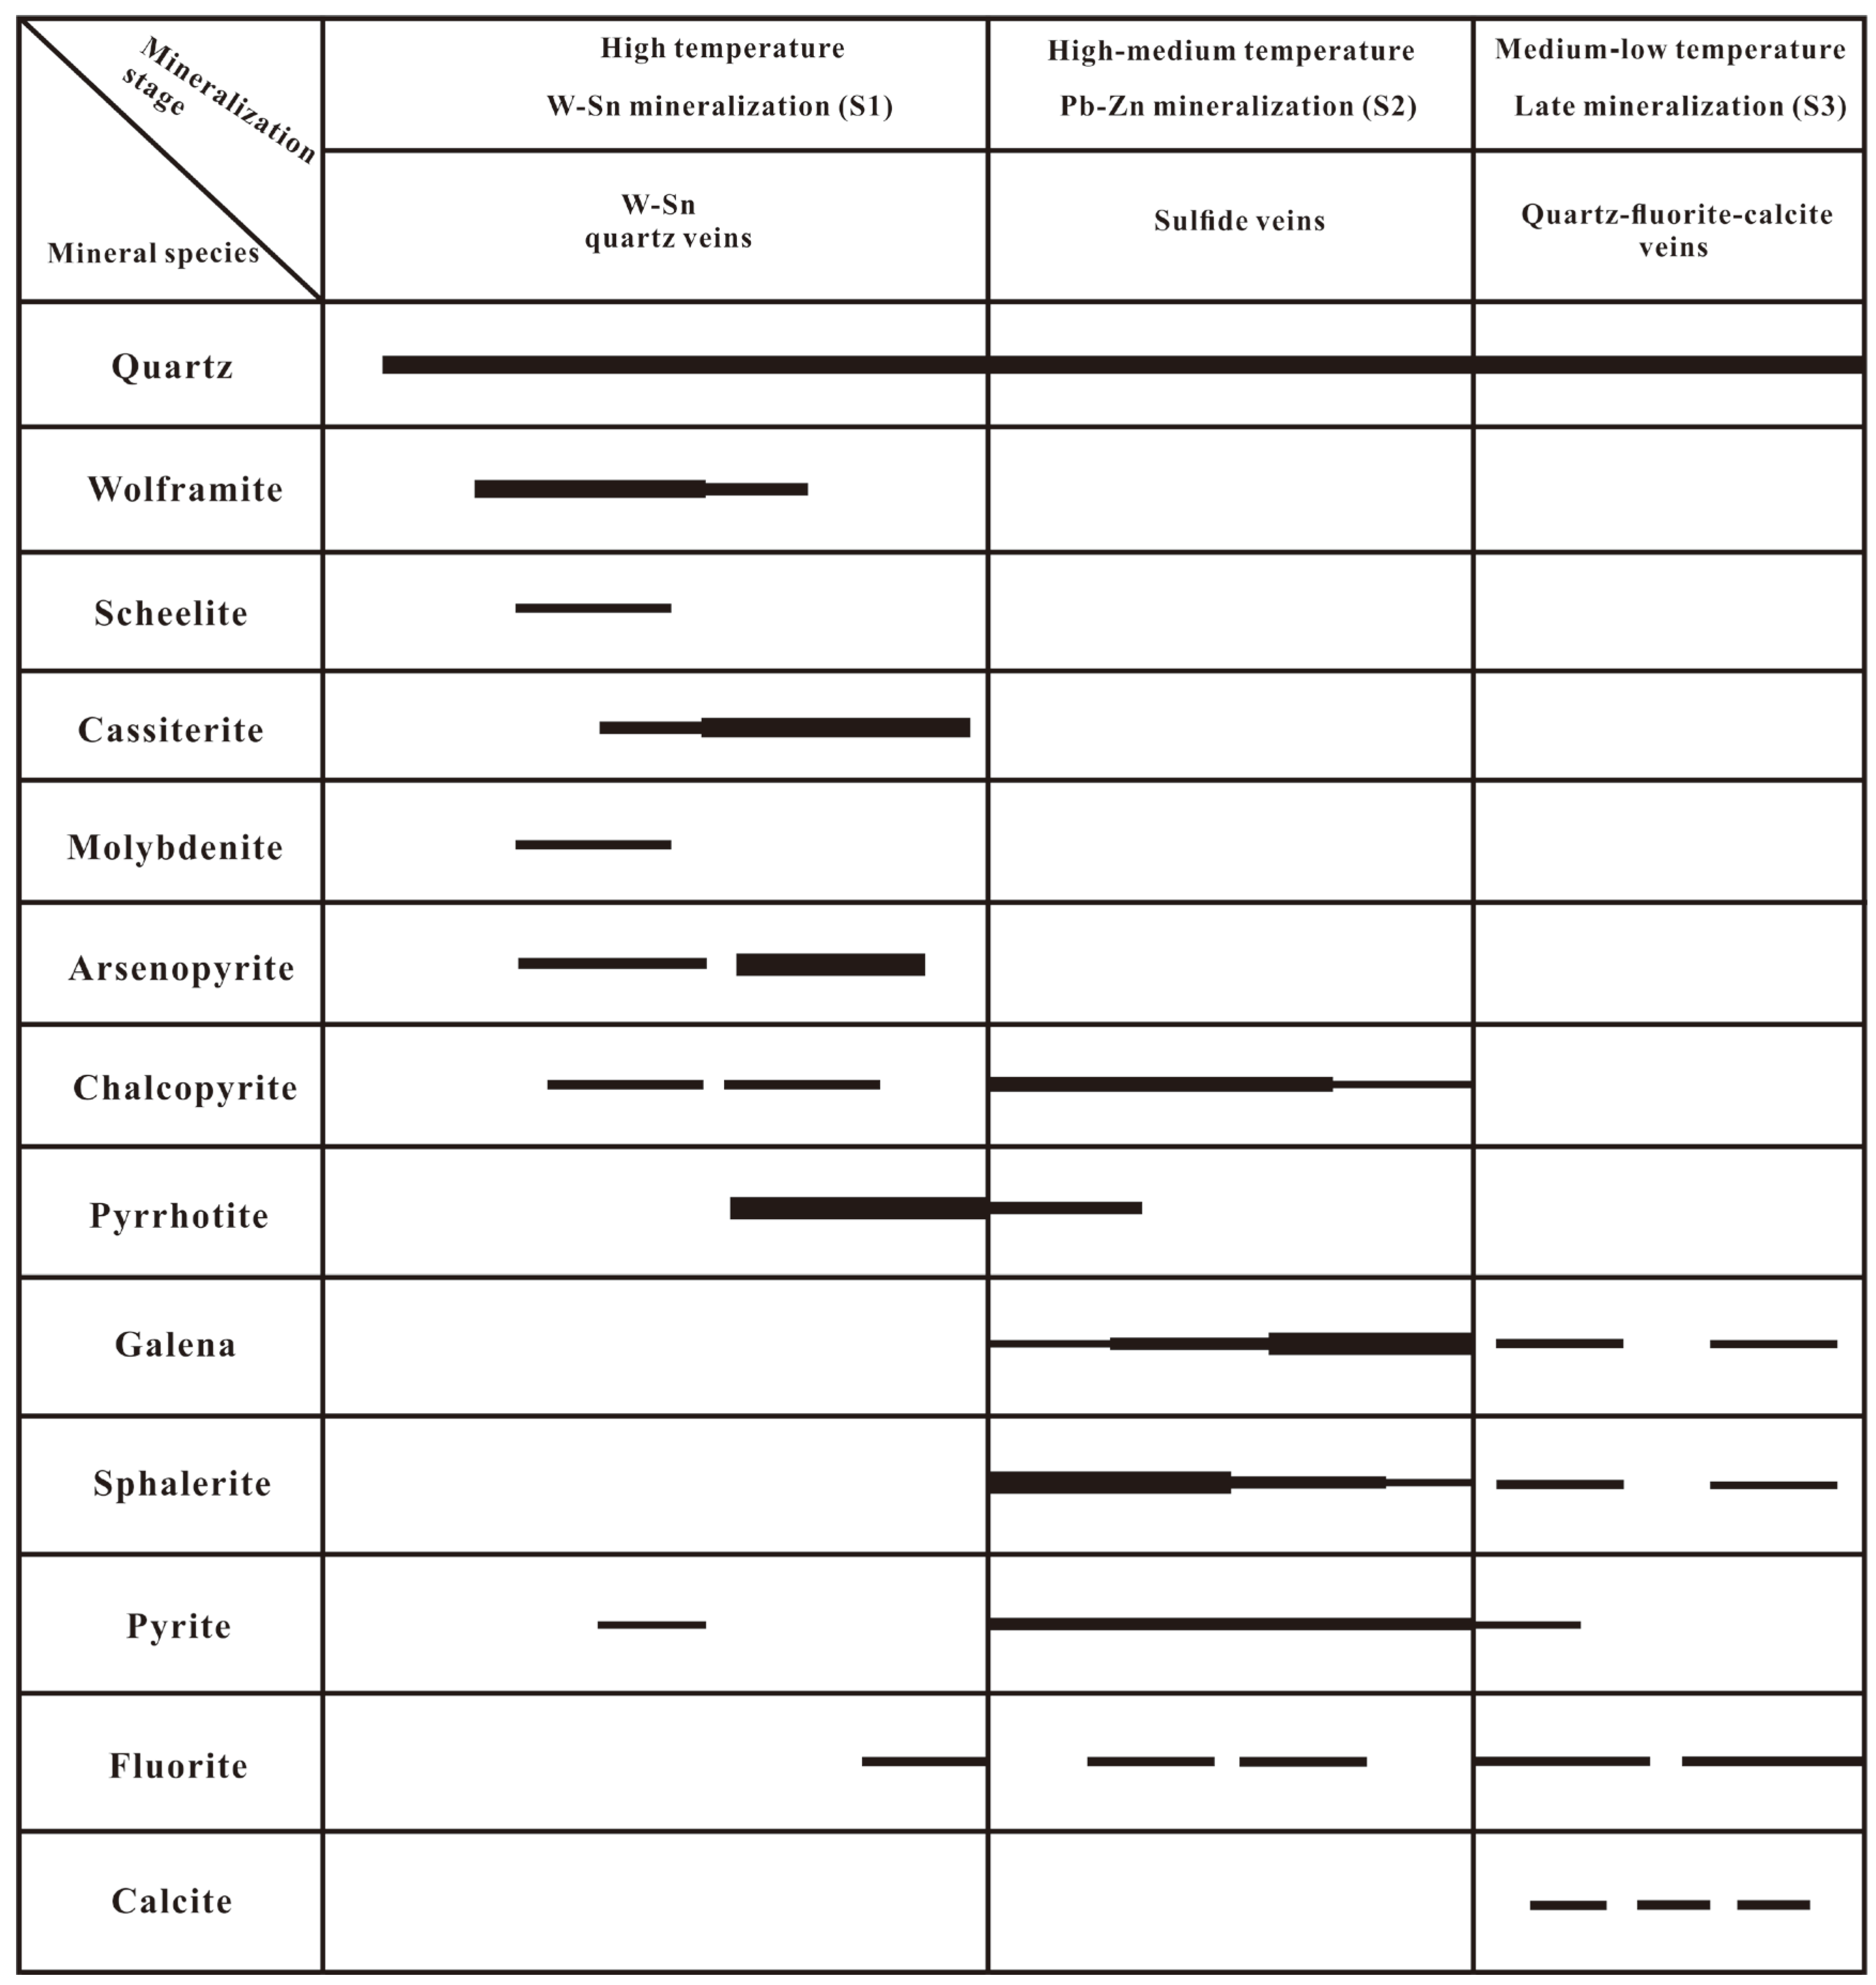
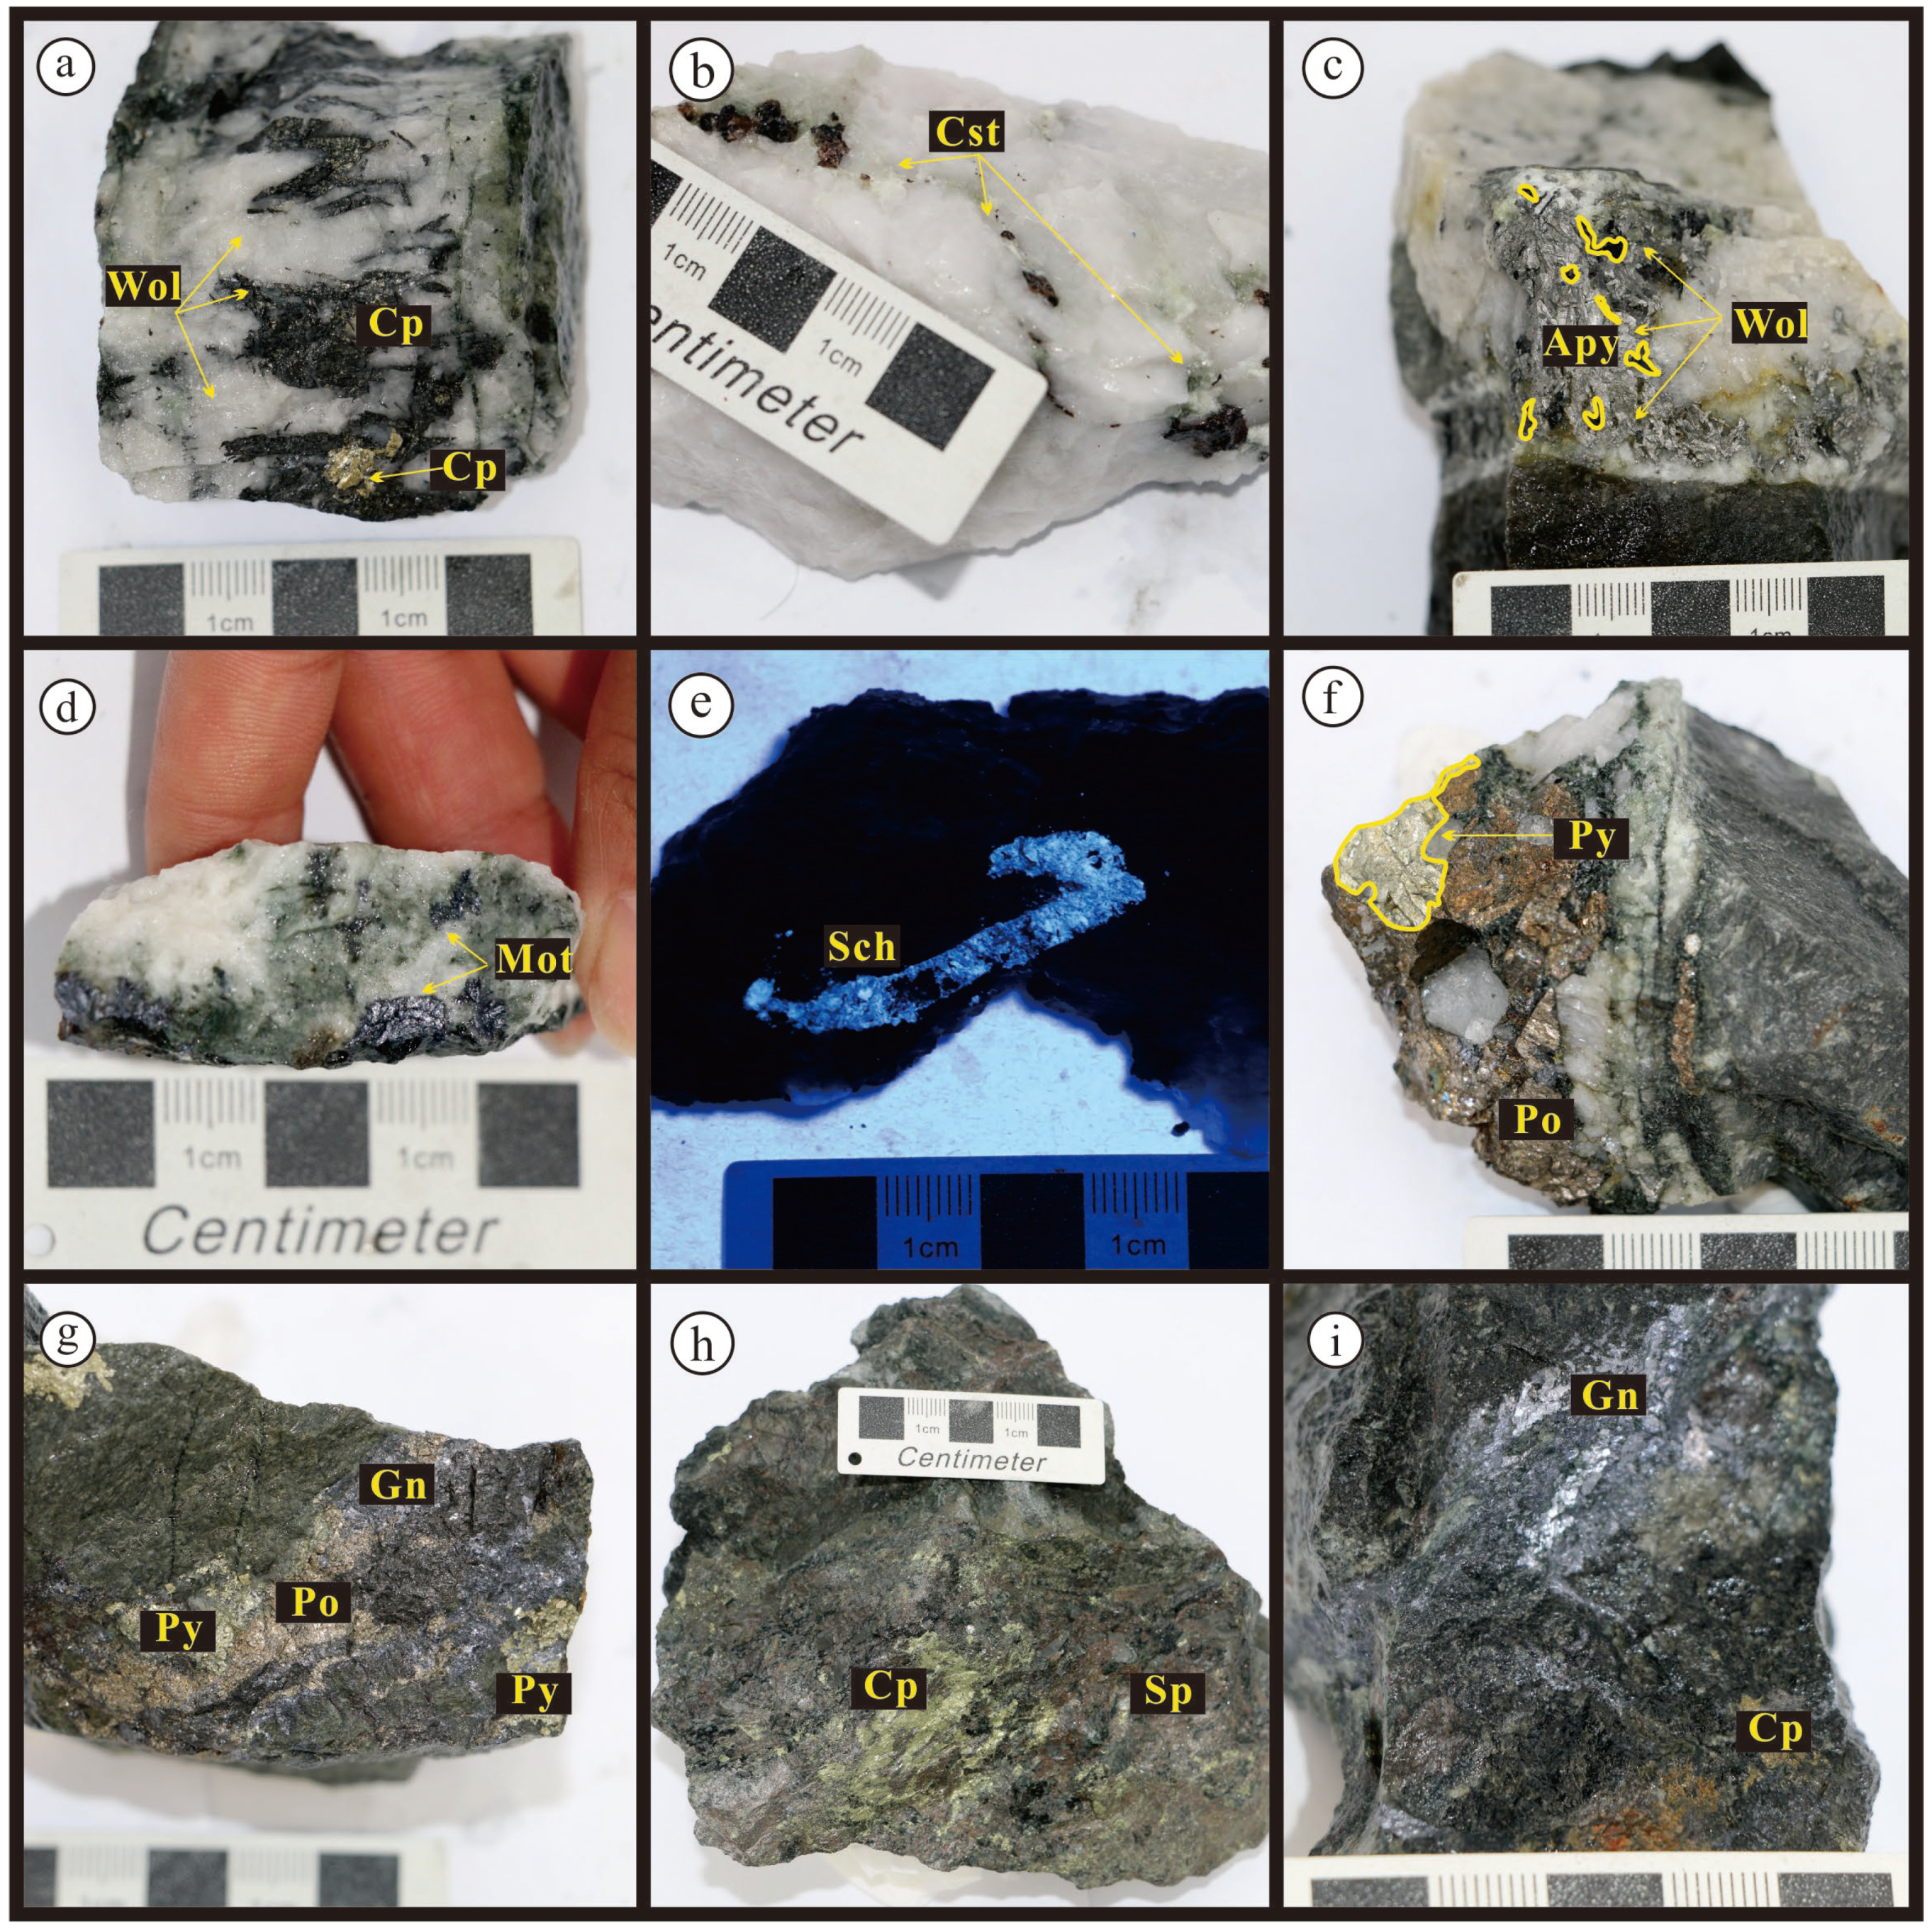
2.2. Deposit Geology
3. Sampling and Methodology
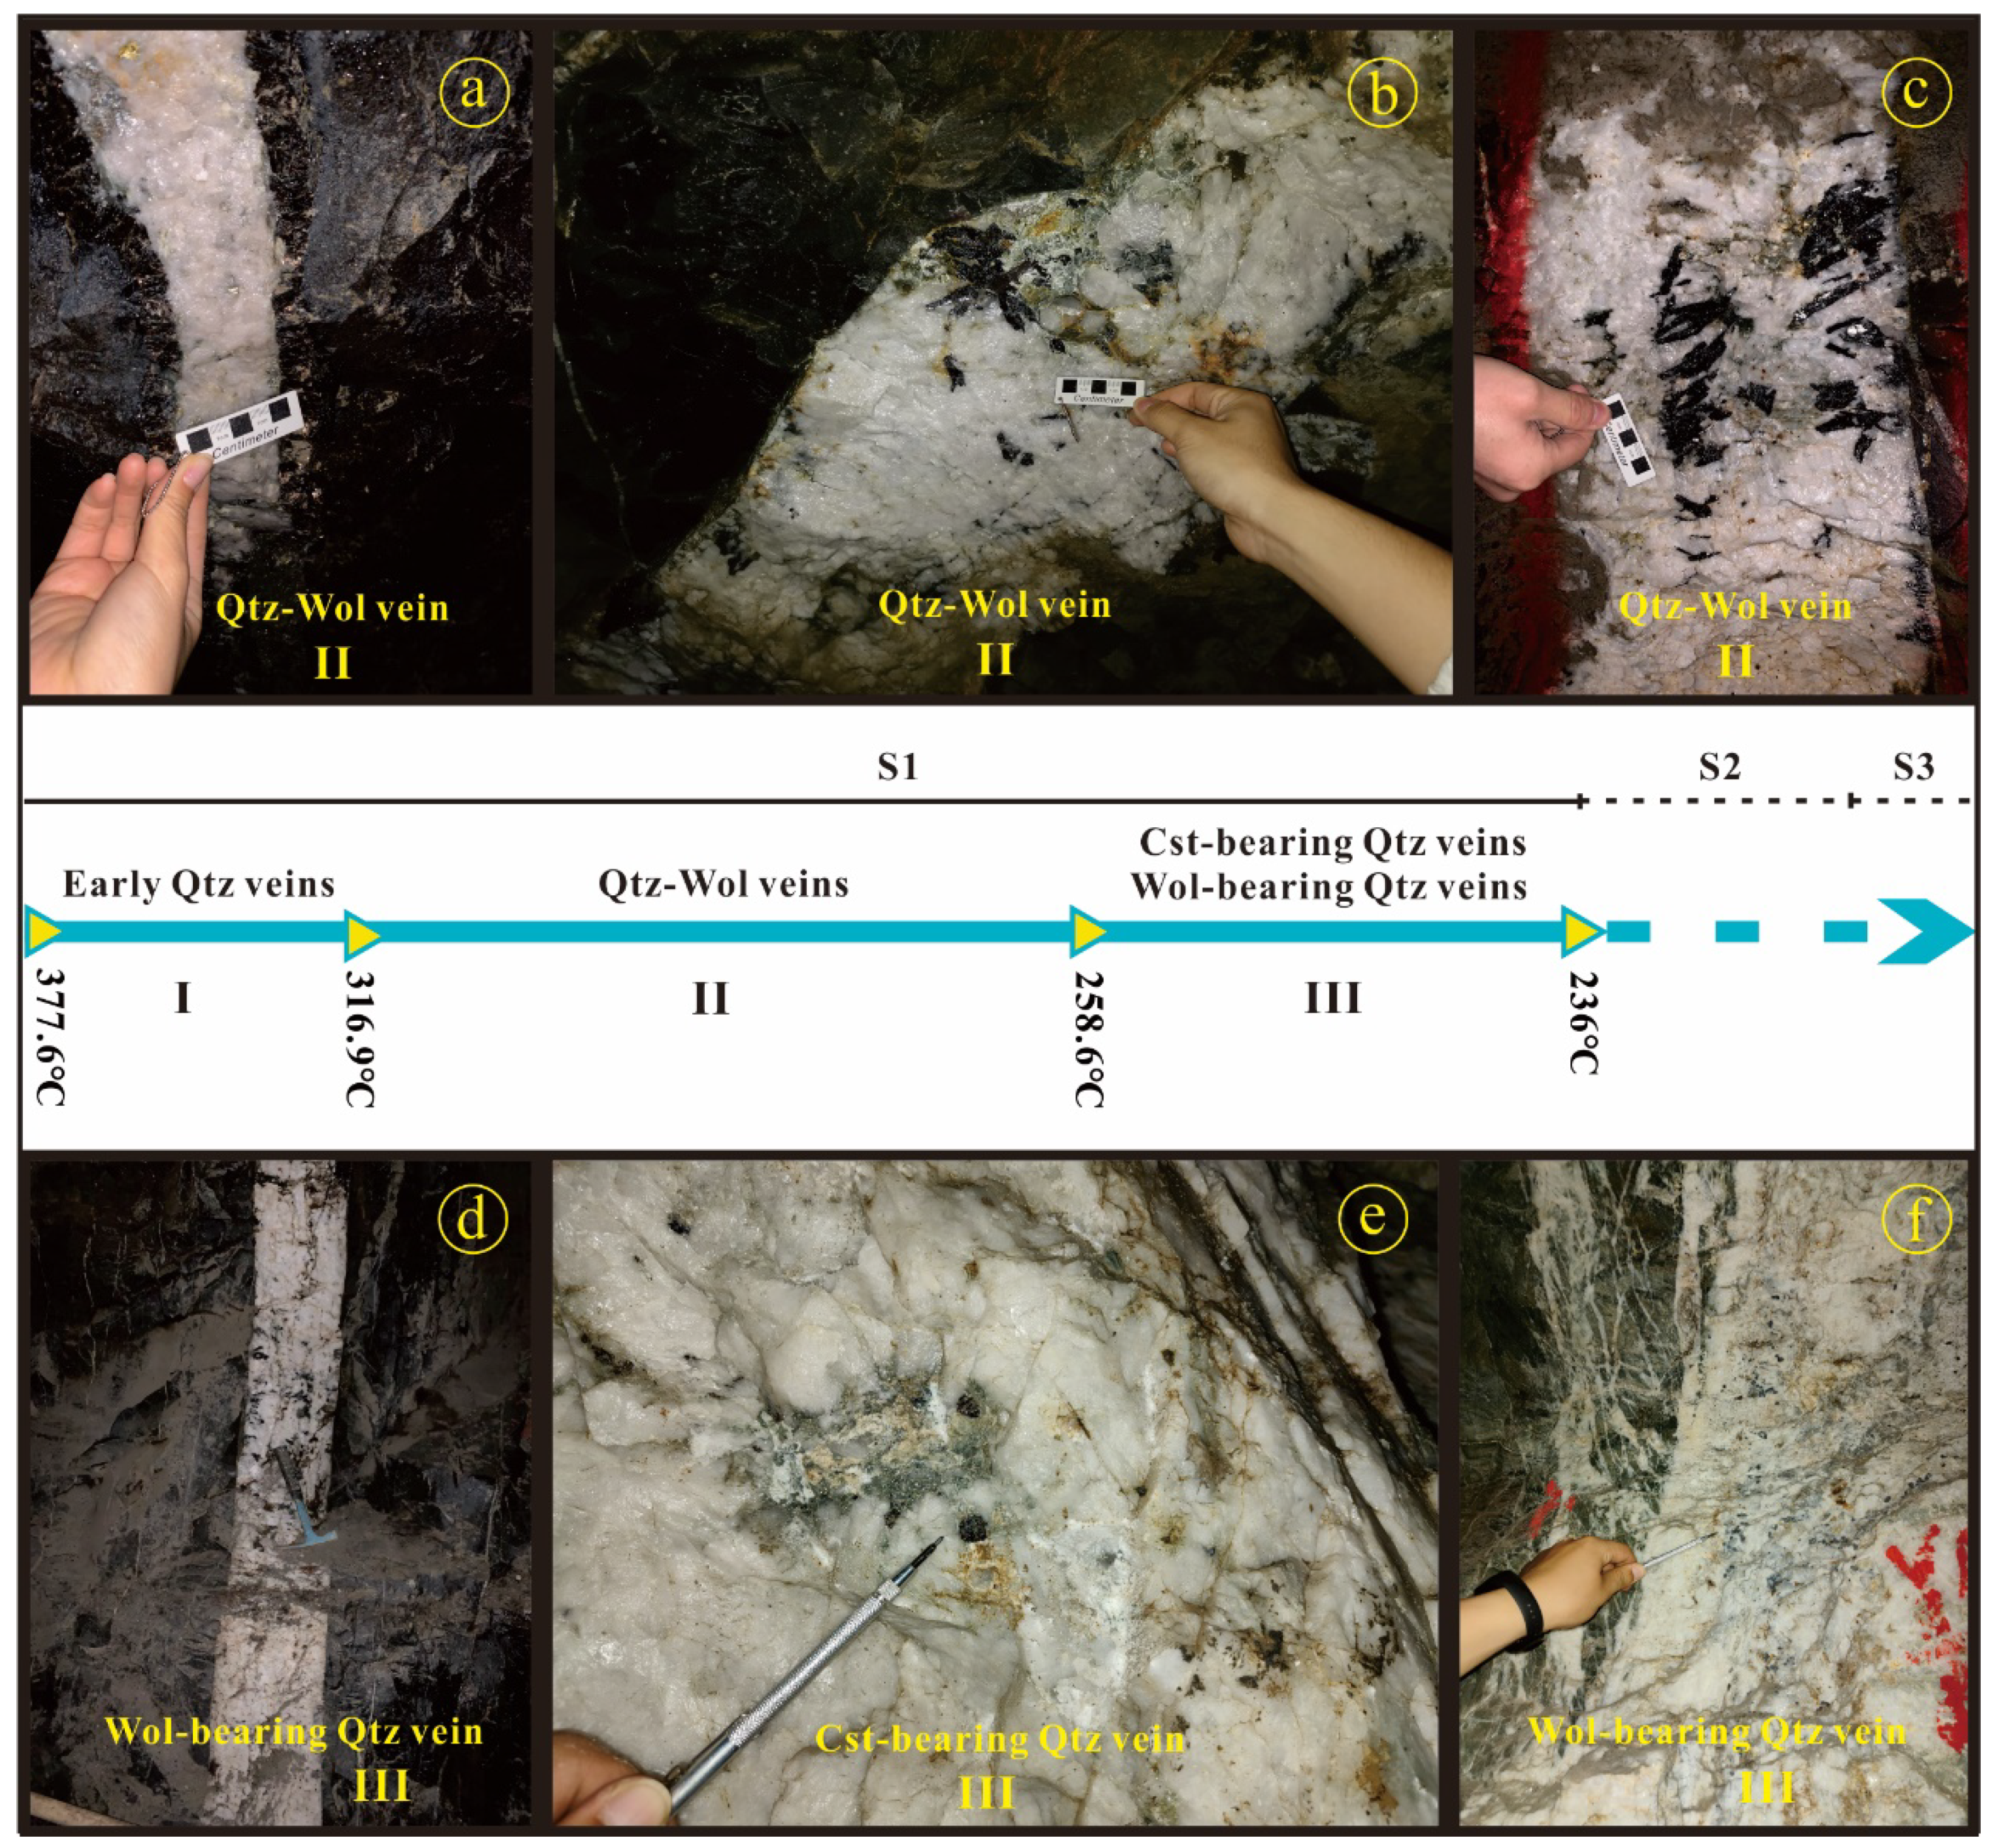
3.1. Sampling
3.2. Analytical Methods
3.2.1. Fluid Inclusion Microthermometry
3.2.2. Fluid Inclusion Laser Raman Spectroscopic Analysis
3.2.3. H–O Isotope Analyses
3.2.4. LA-MC-ICP-MS Sulfur Isotope Analysis
4. Results
4.1. Fluid Inclusions
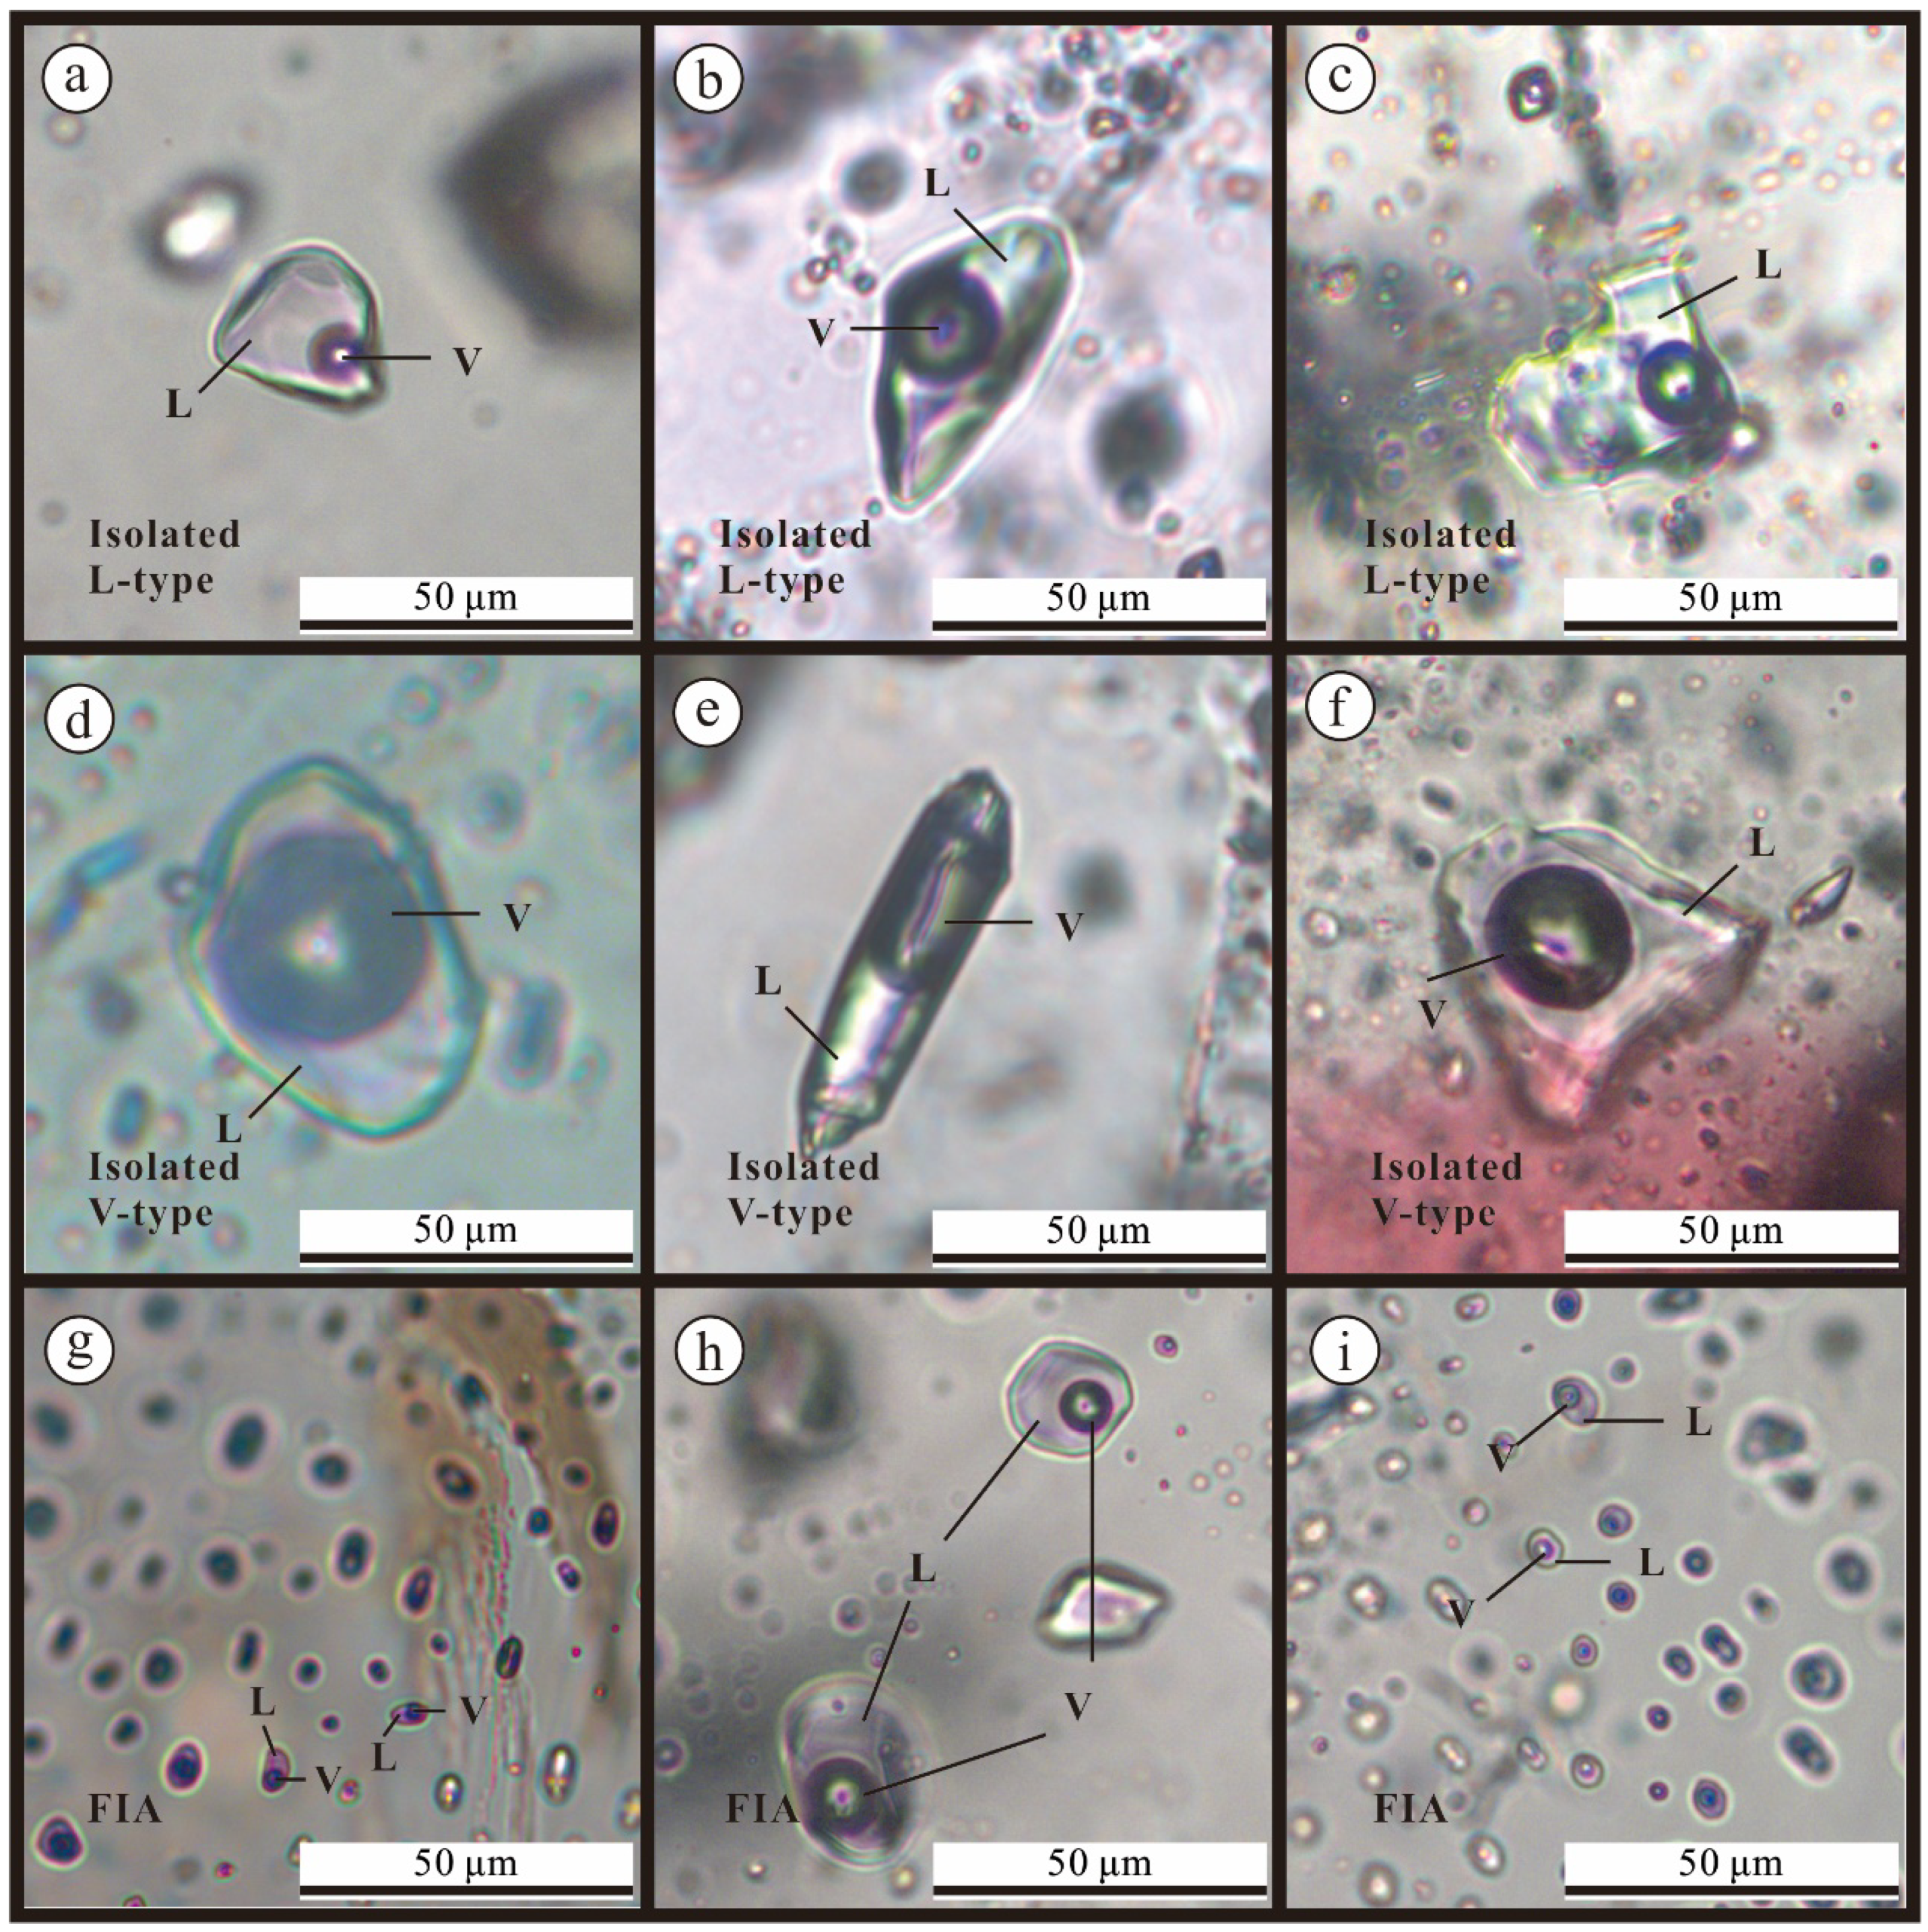
4.1.1. Petrography and Microthermometry of Fluid Inclusions
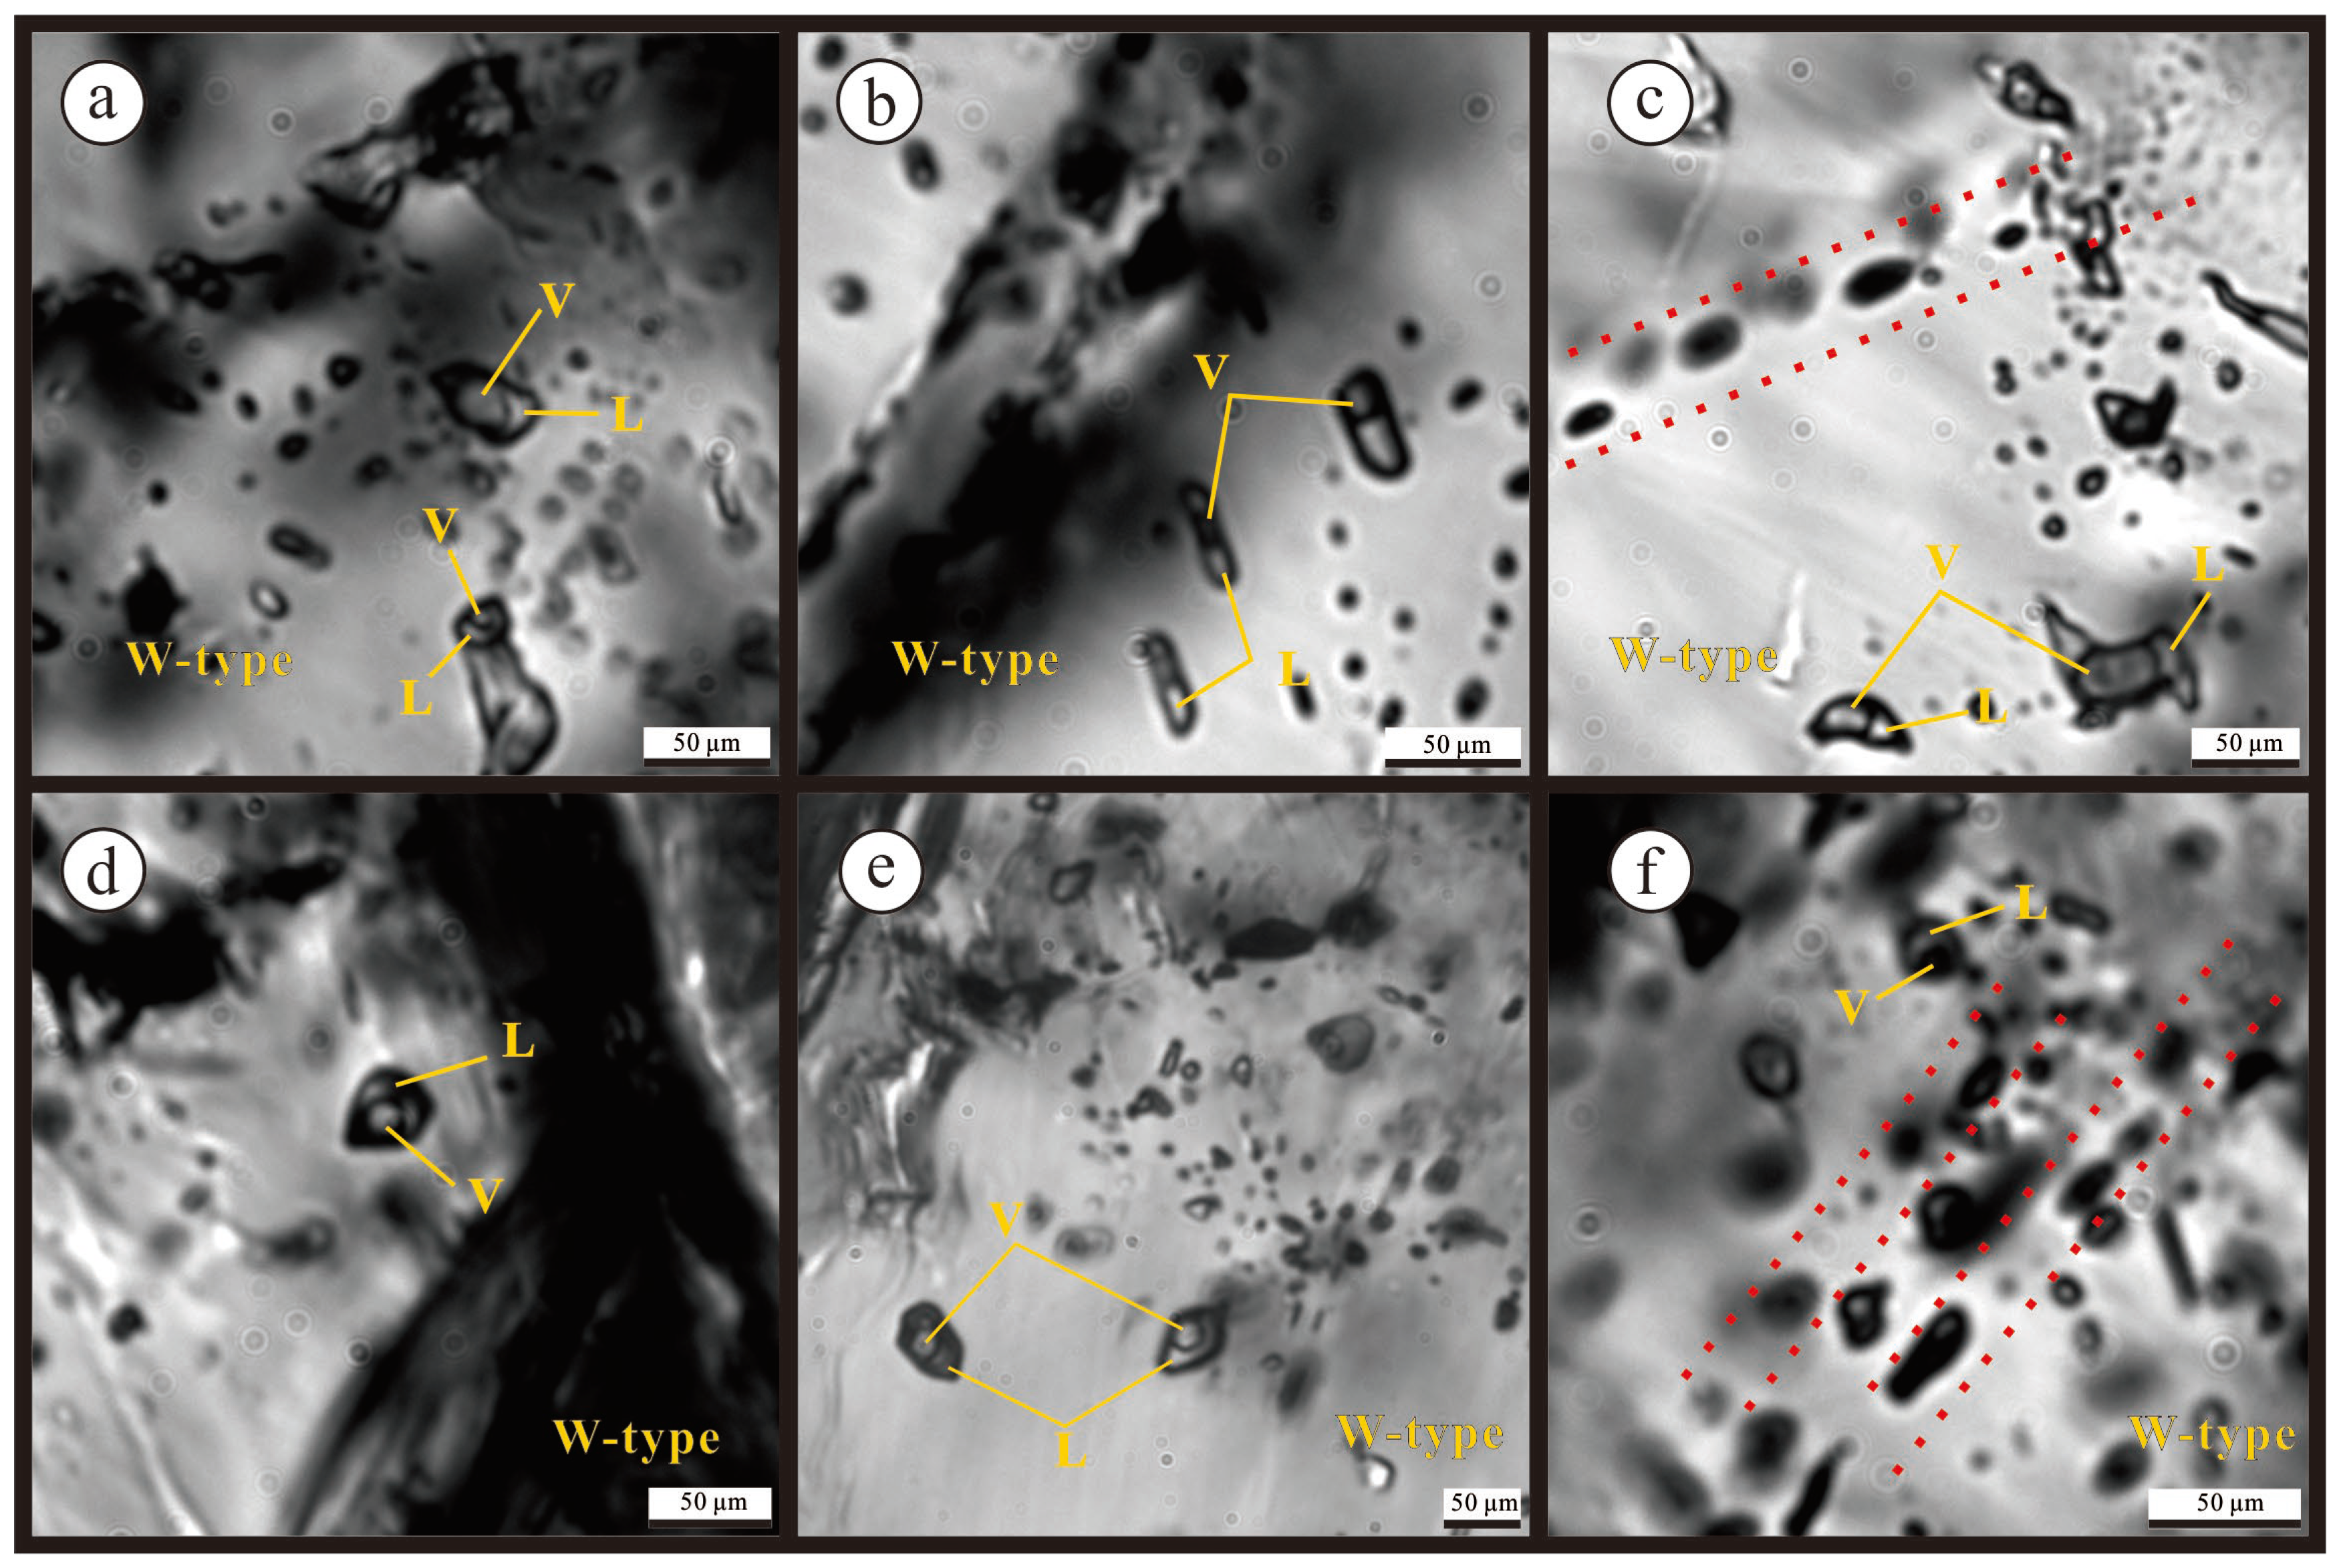
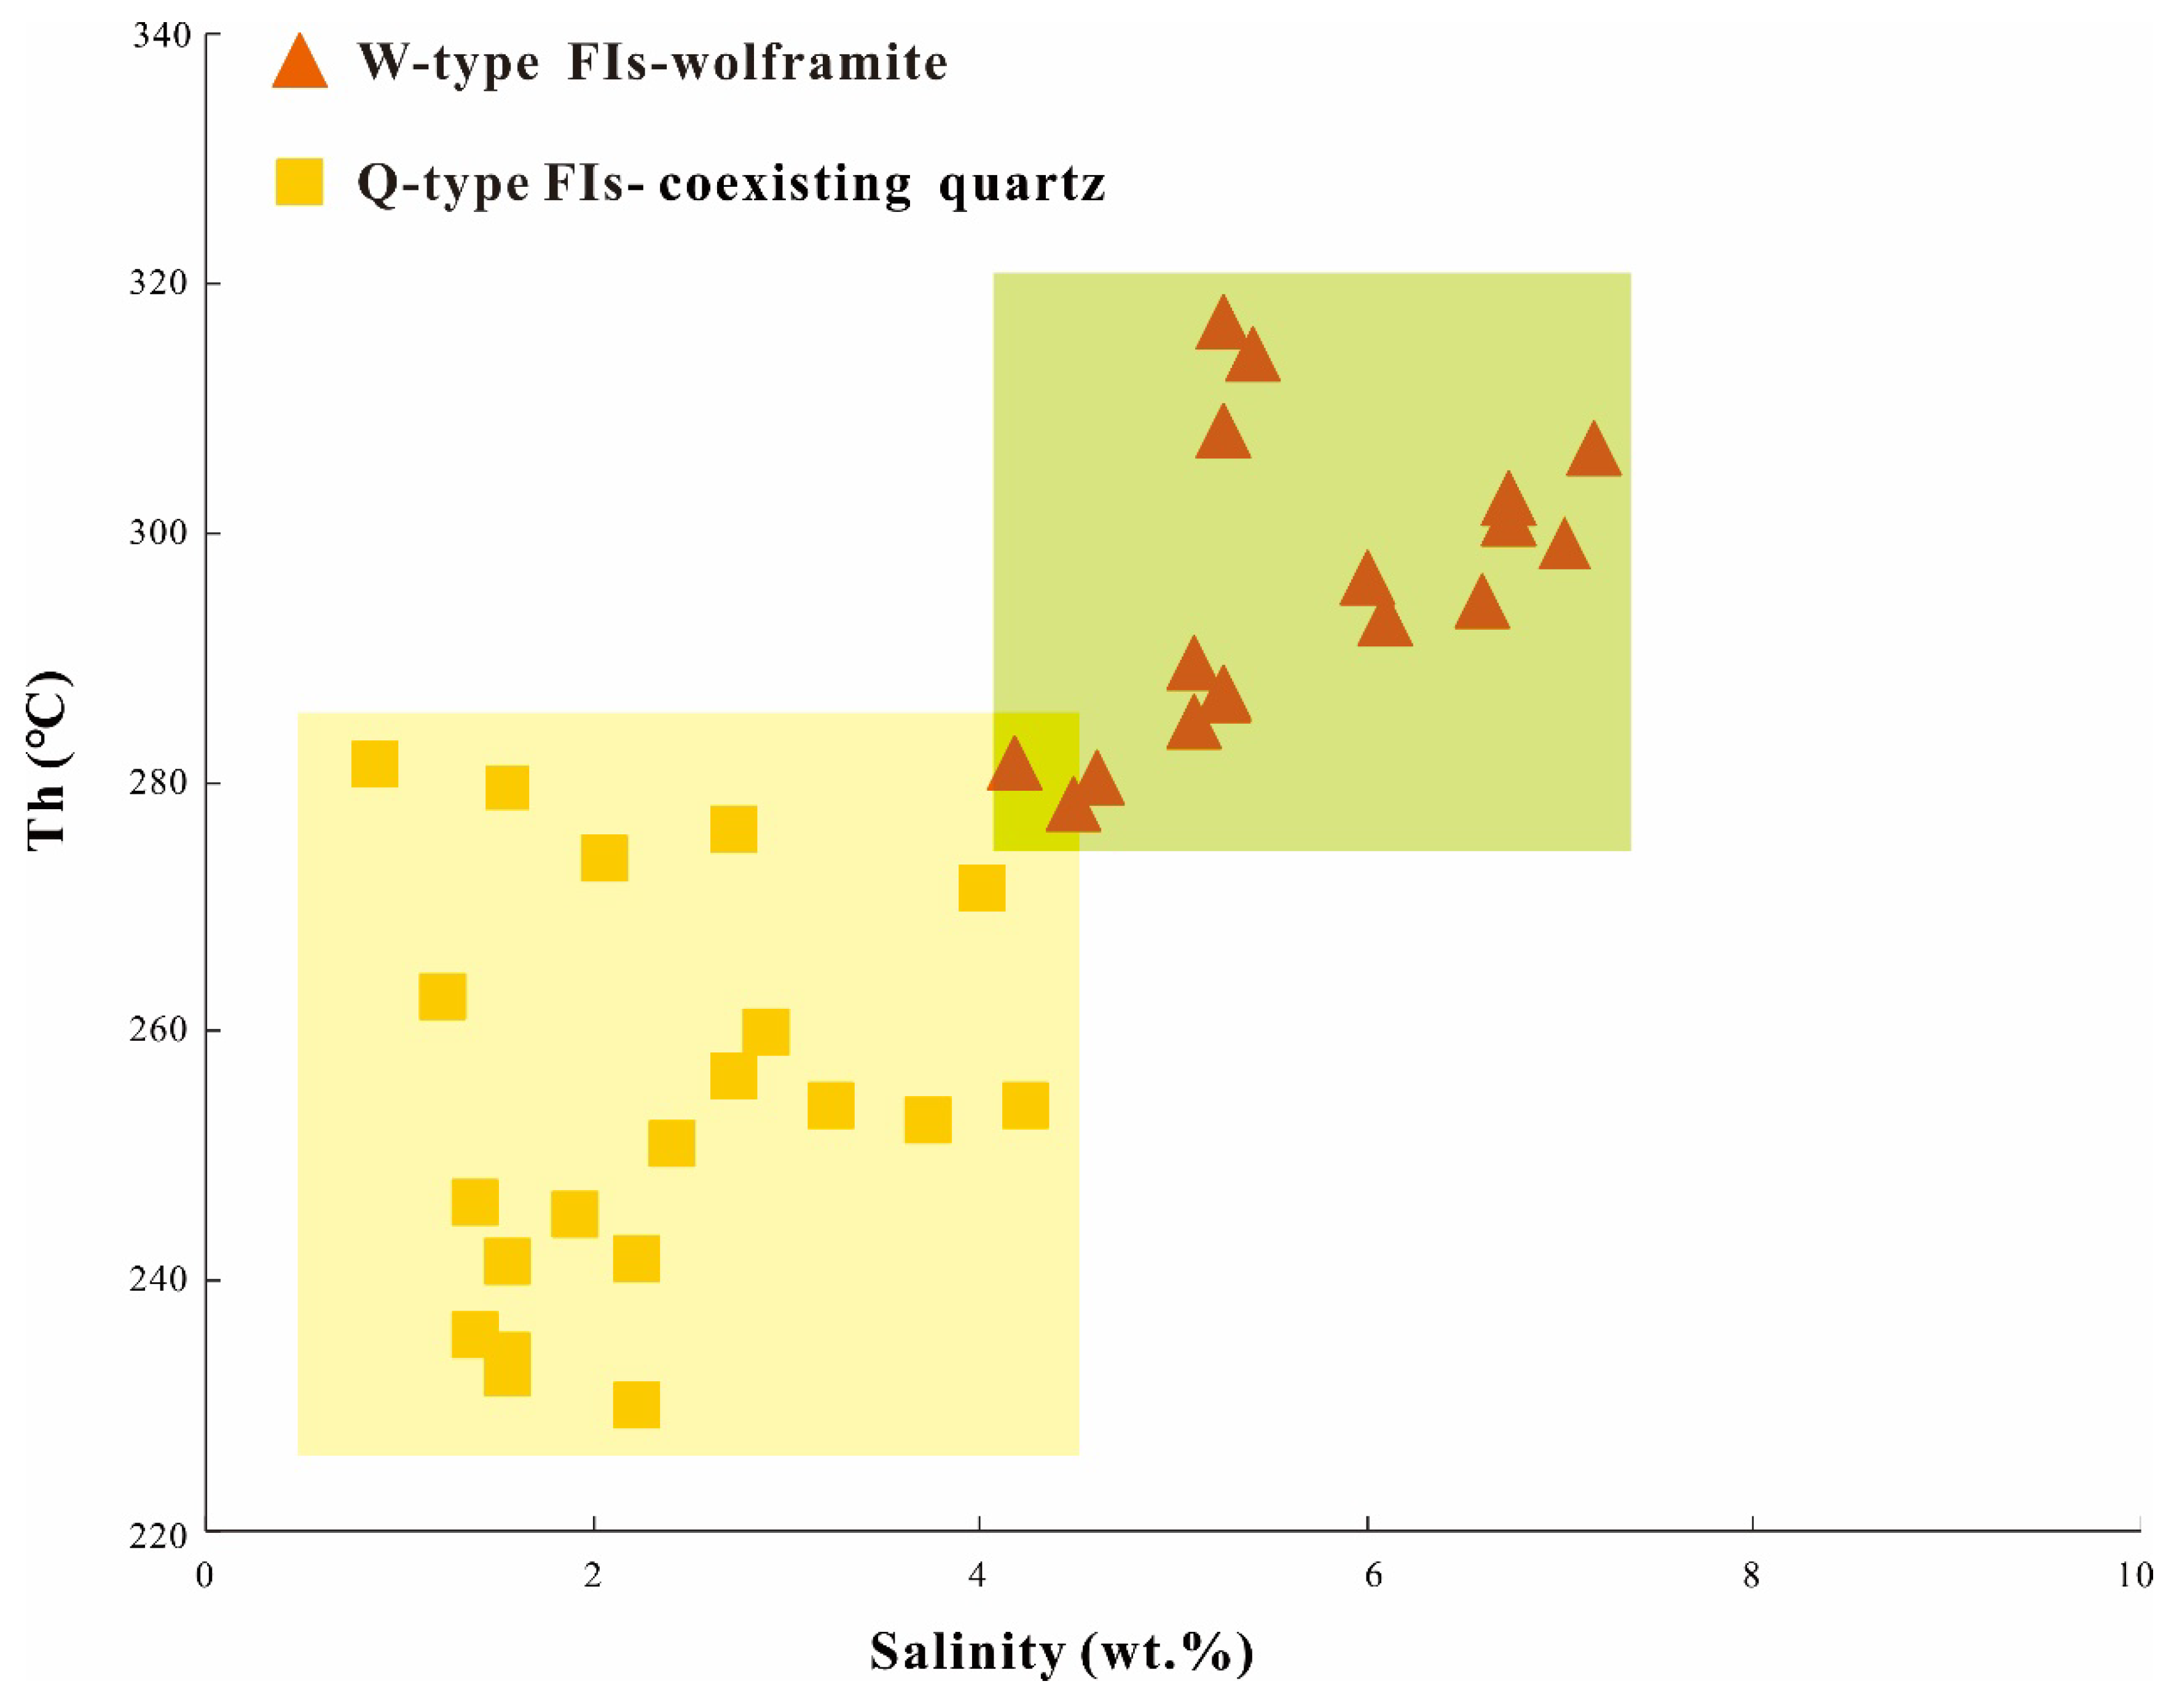
4.1.2. Fluid Inclusions in Wolframite (S1)
4.1.3. Sn-W Quartz Vein Stage (S1)
4.1.4. Pb-Zn Quartz Vein Stage (S2)
4.1.5. Quartz-Fluorite Vein Stage (S3)
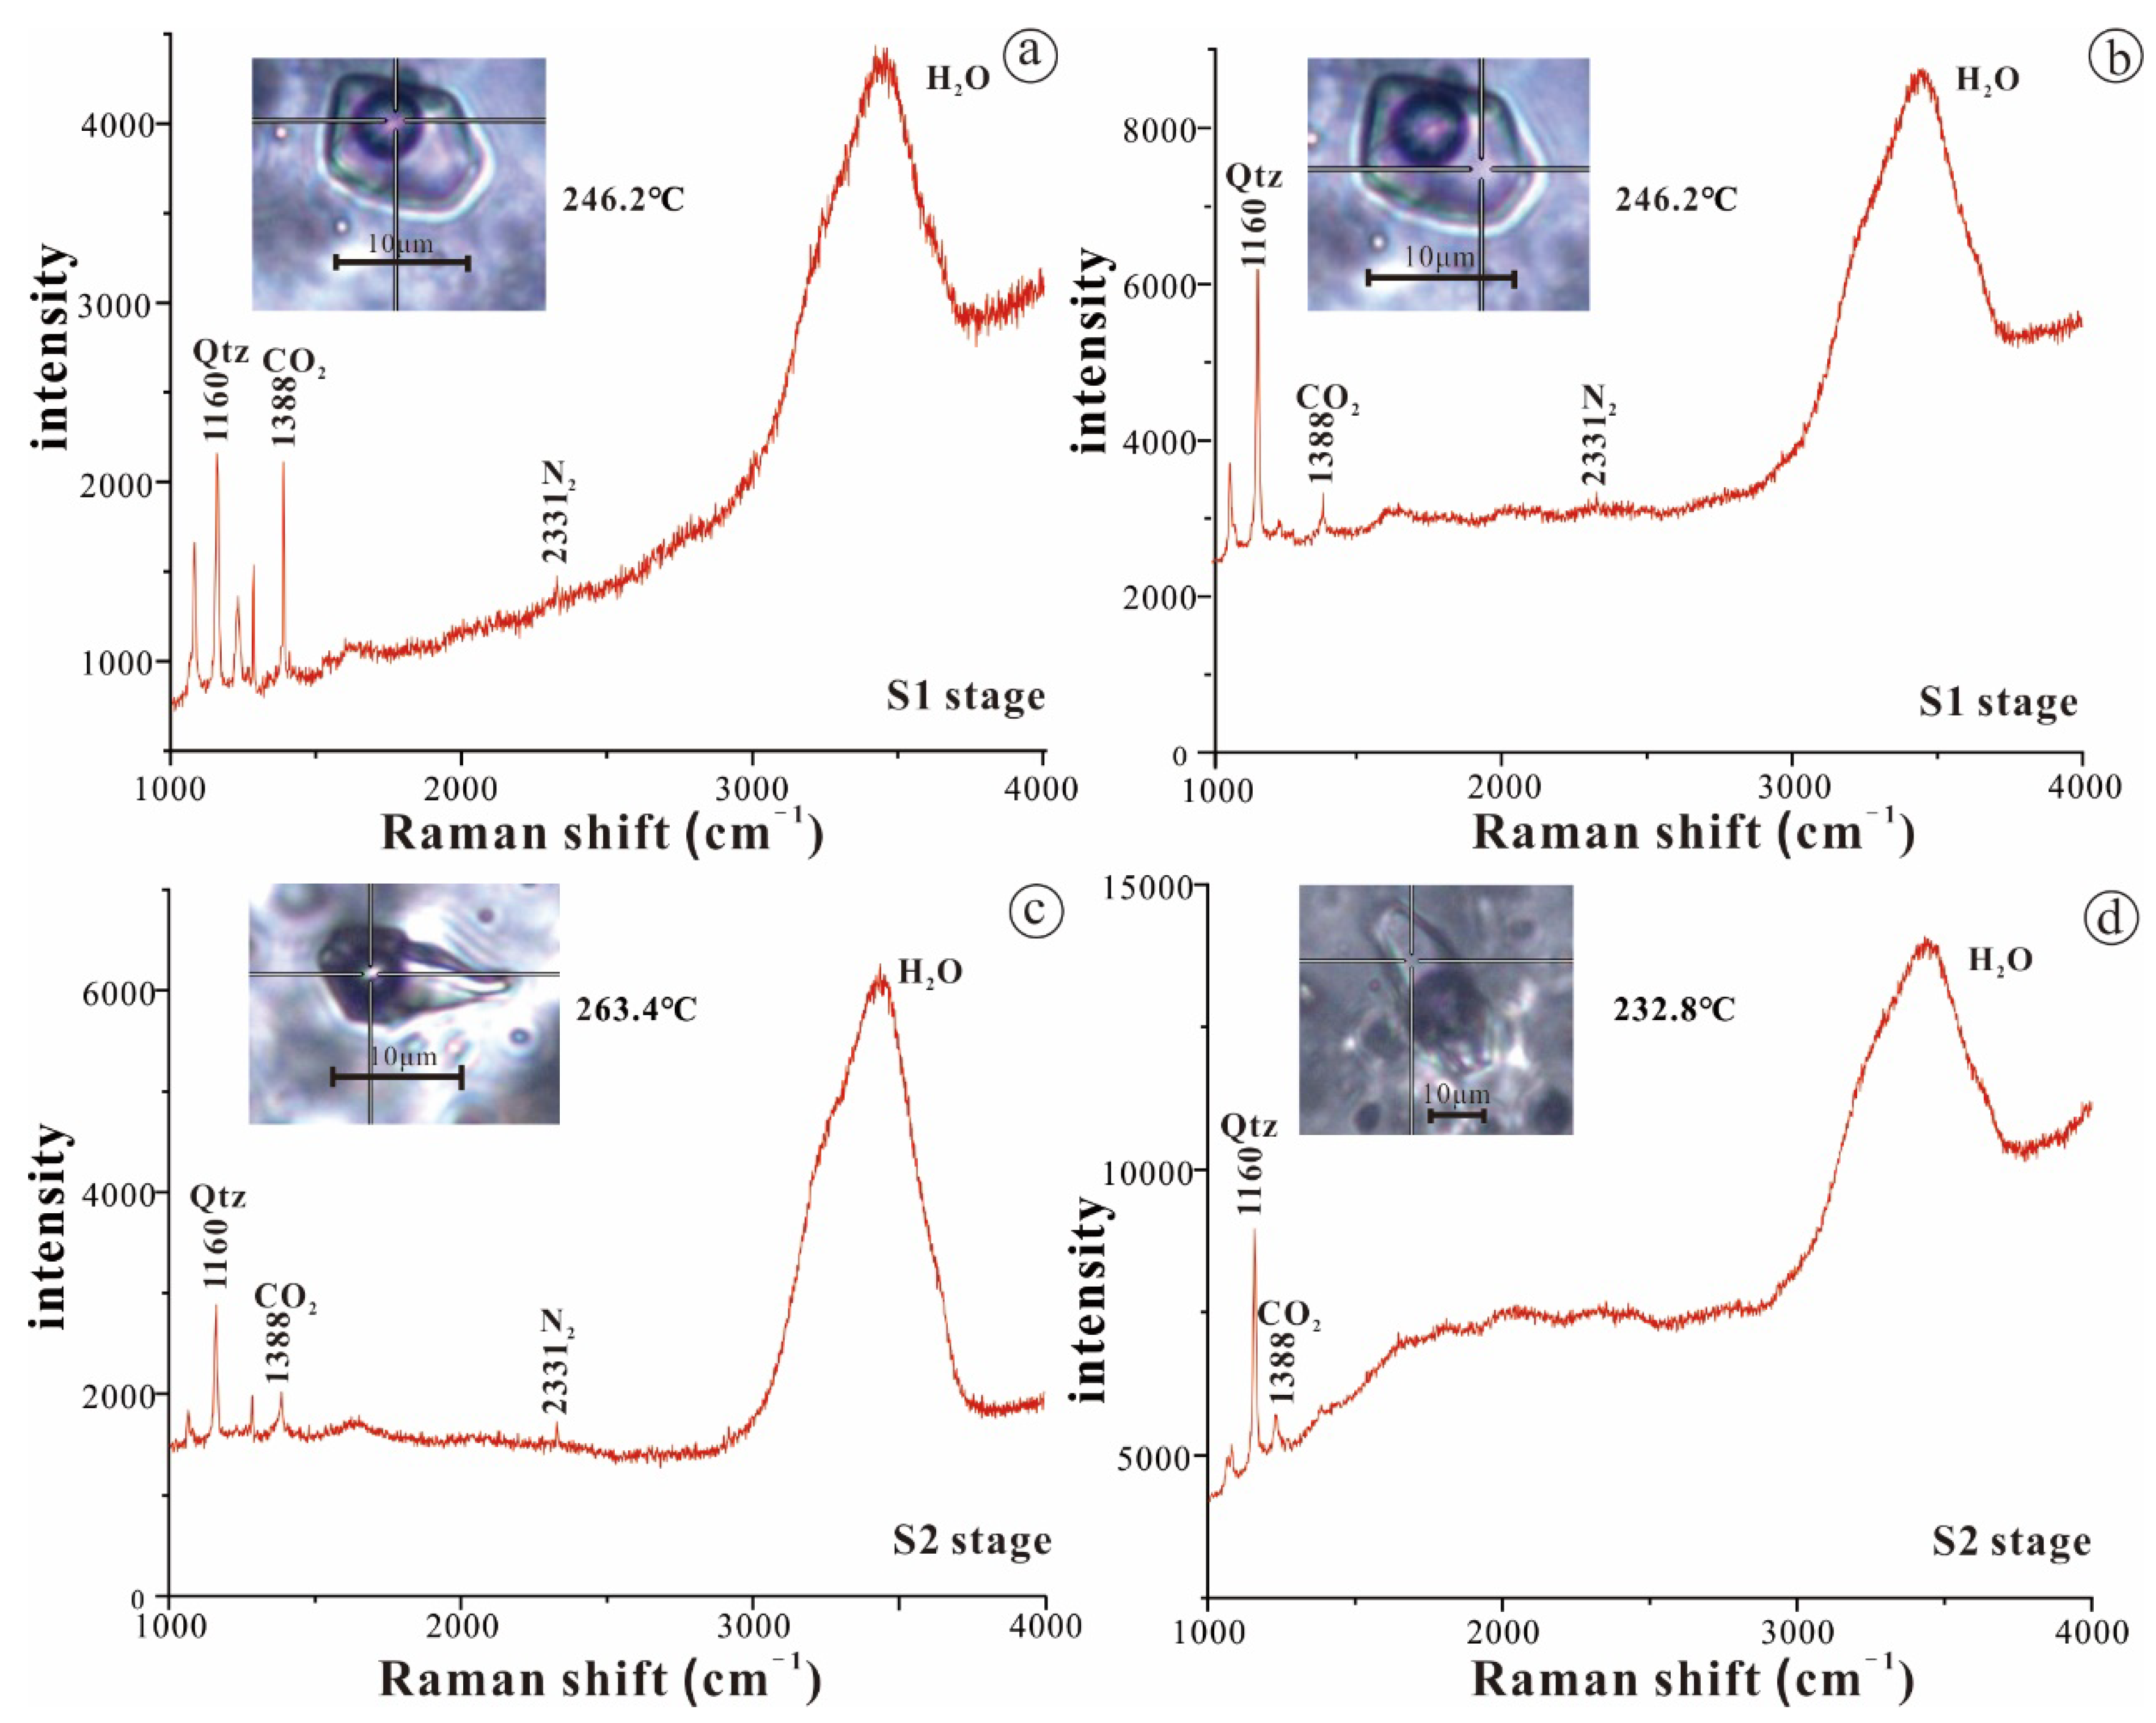
4.2. Laser Raman Spectroscopic Data
4.3. Fluid Density, Pressure, and Metallogenic Depth
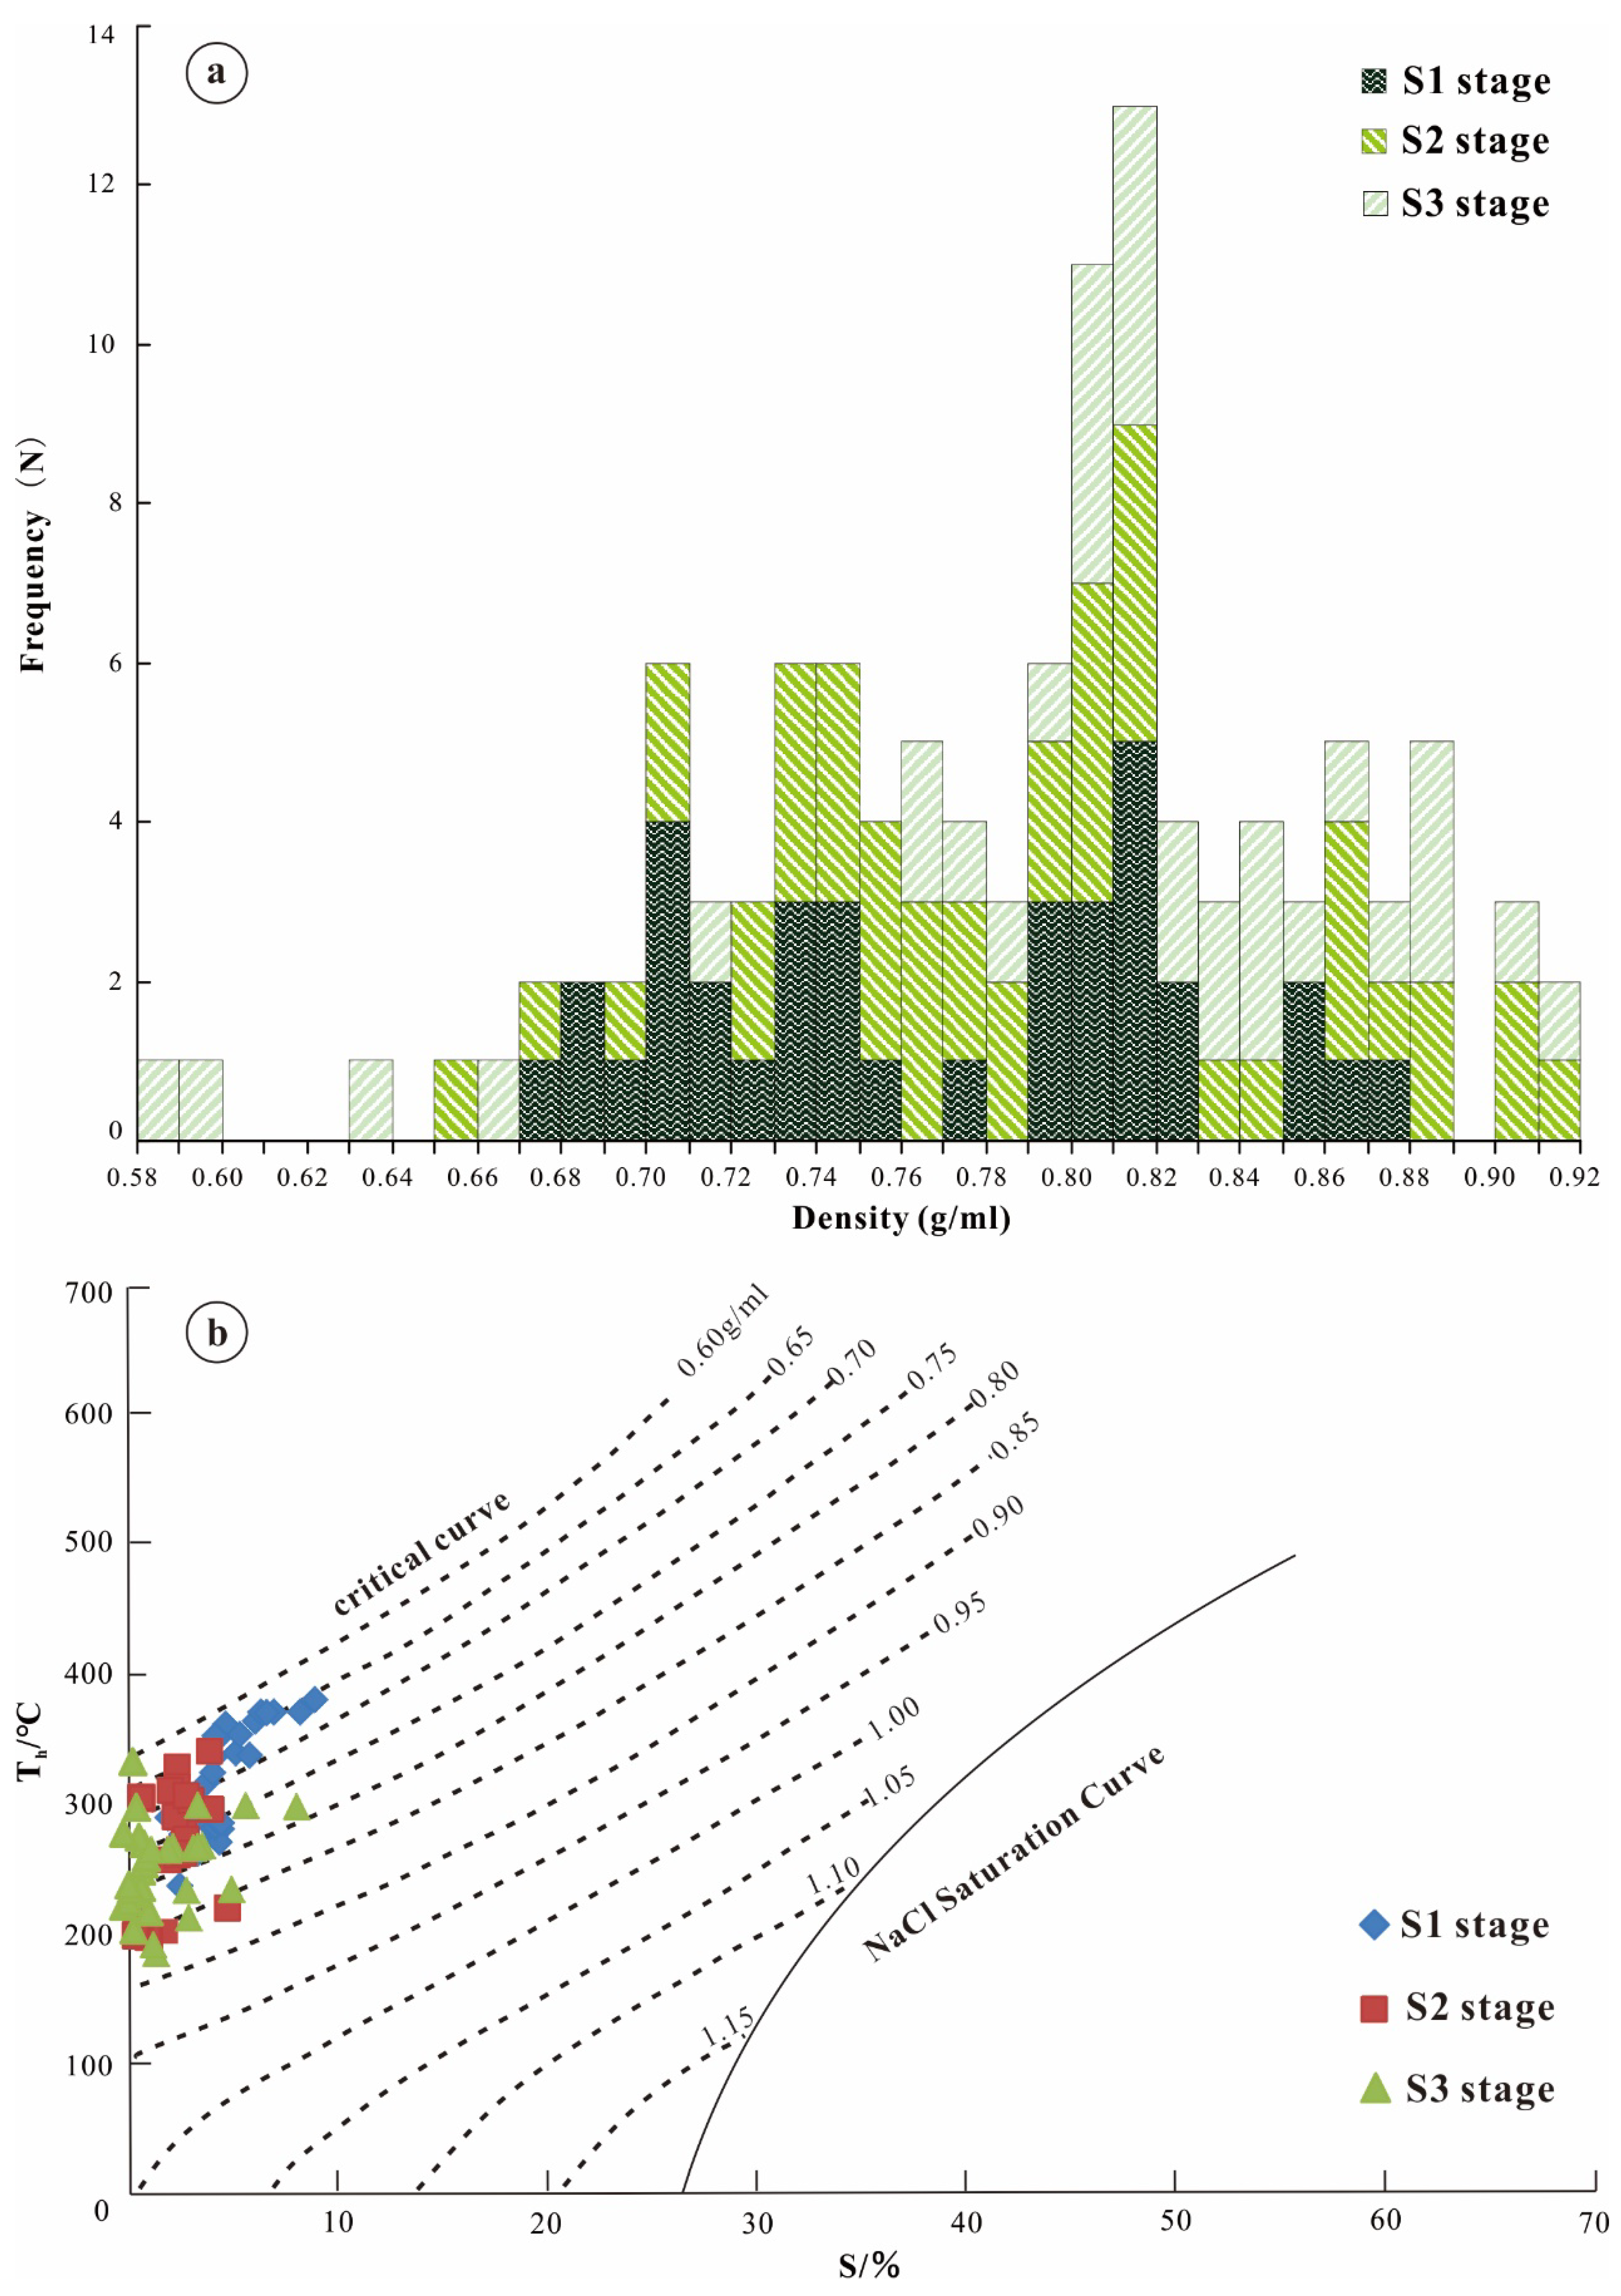
4.3.1. Fluid Density
4.3.2. Metallogenic Pressure and Depth Estimation
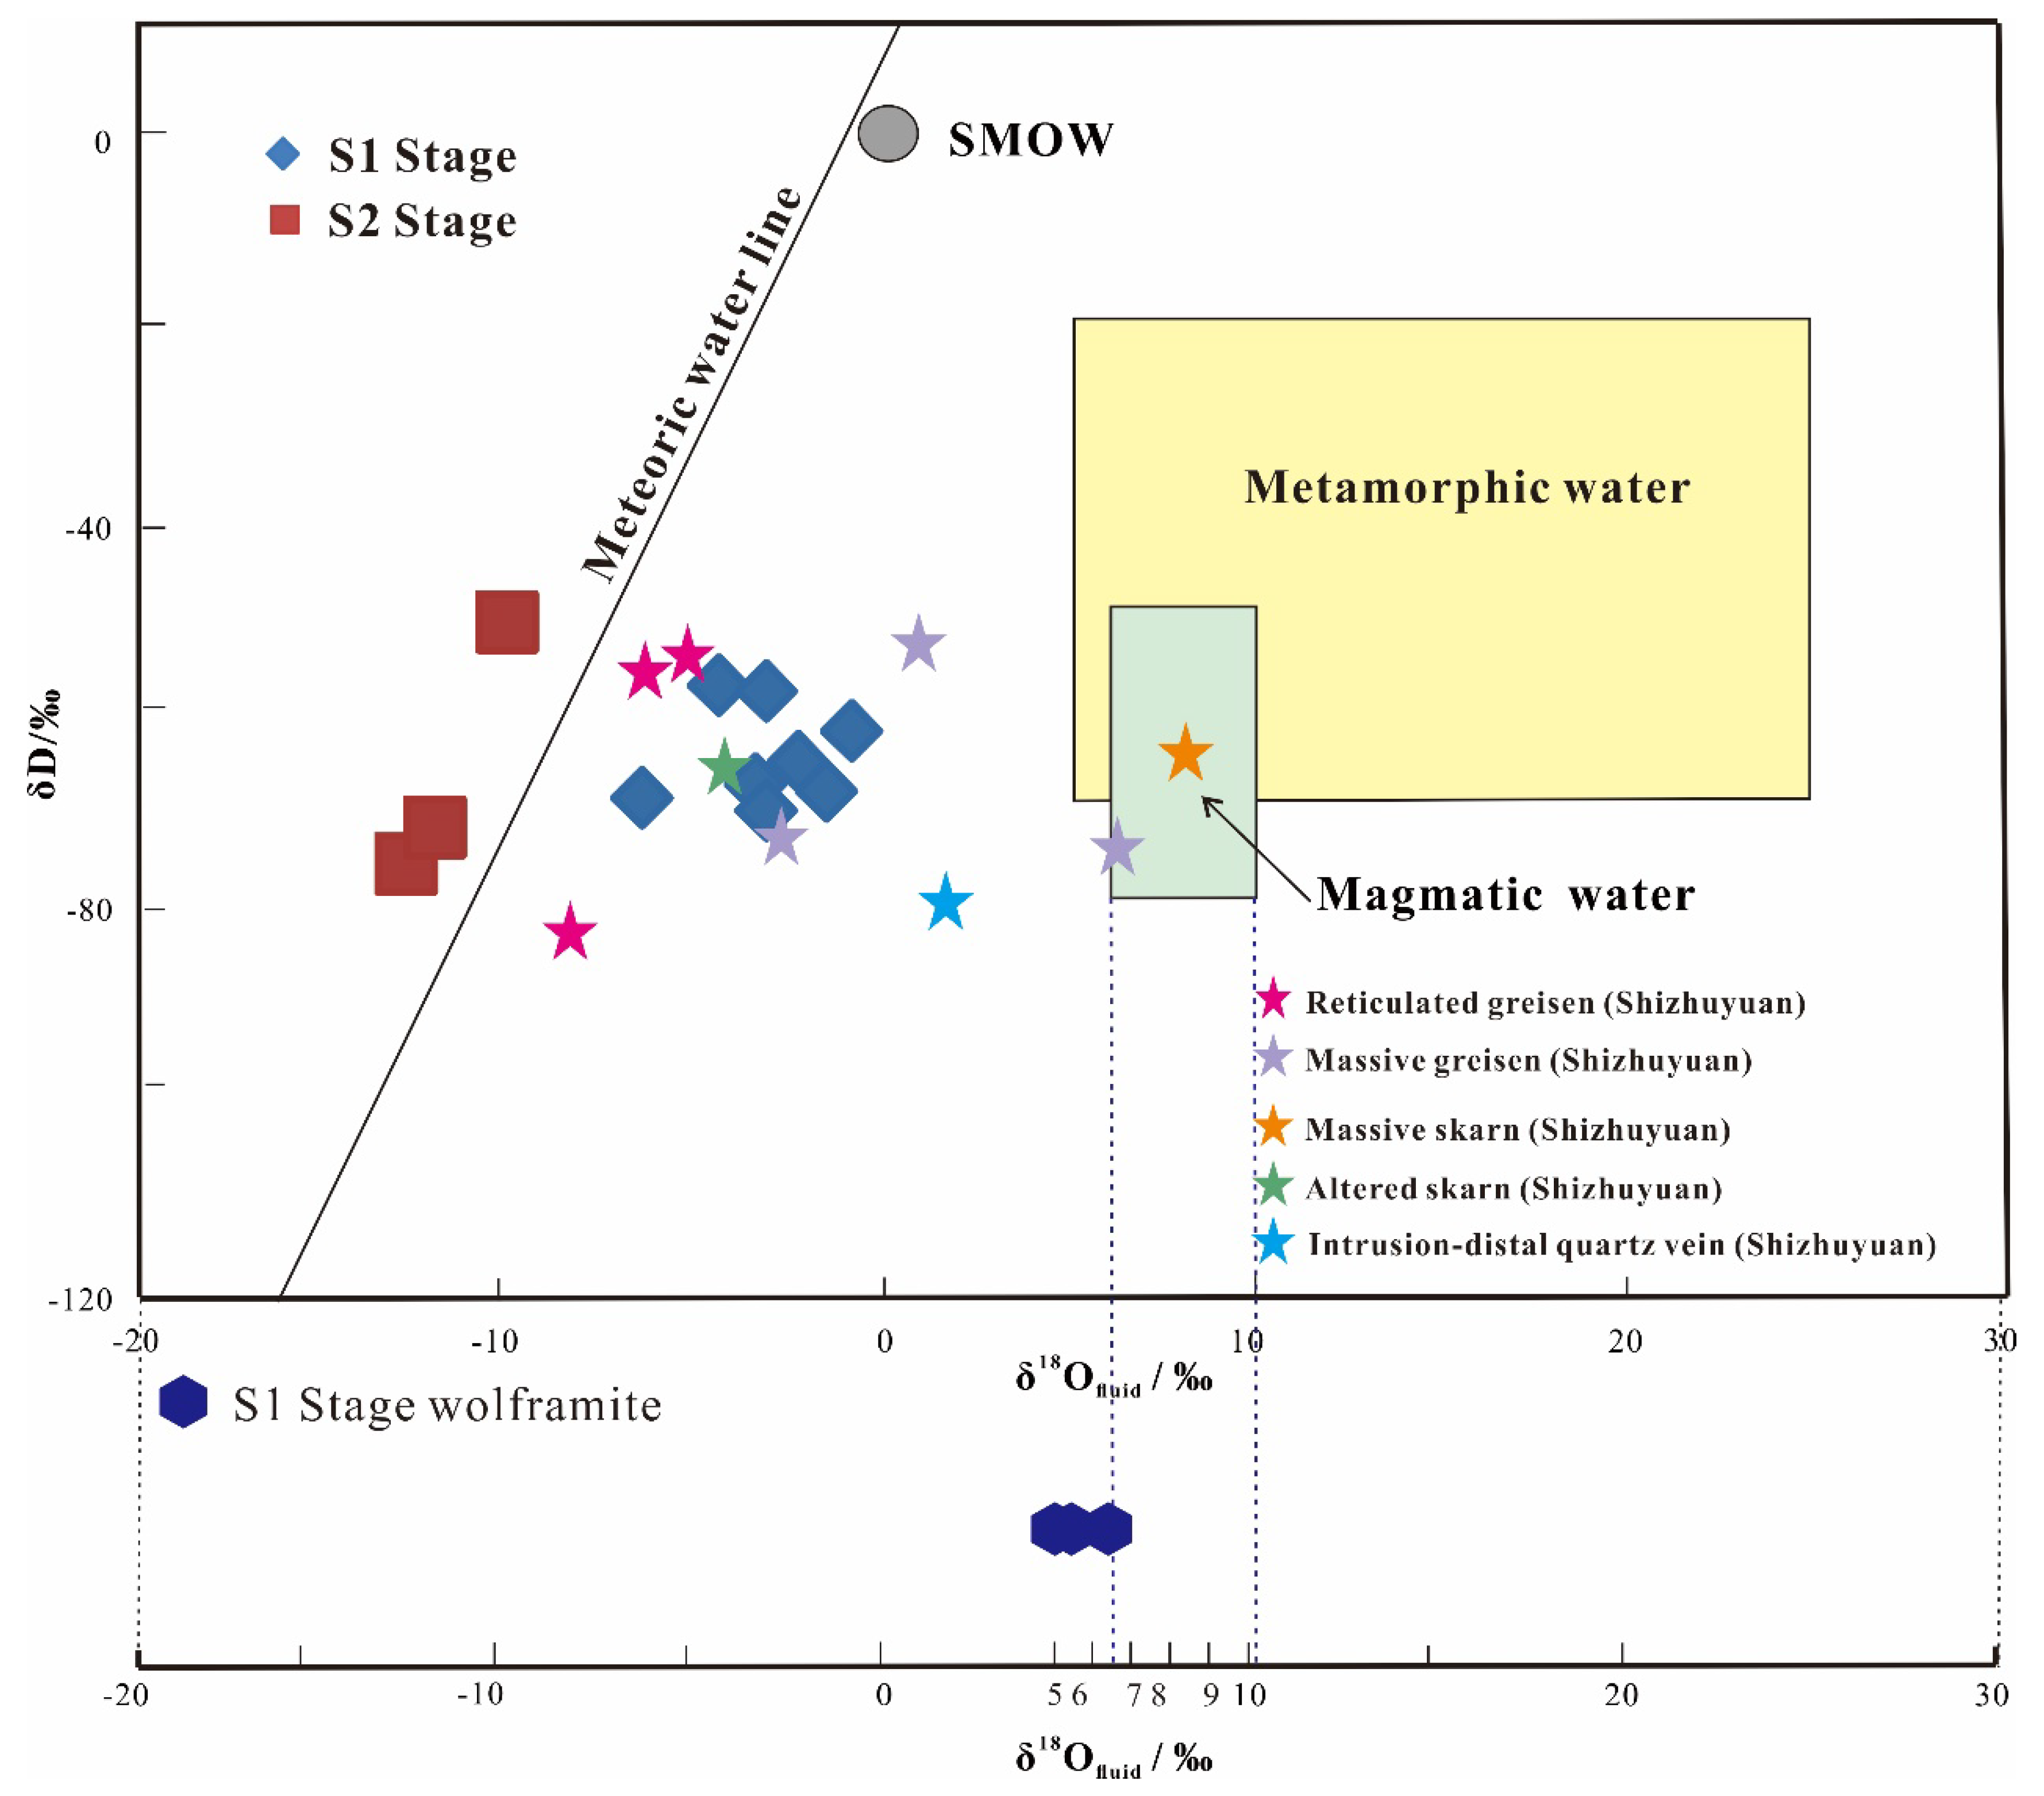
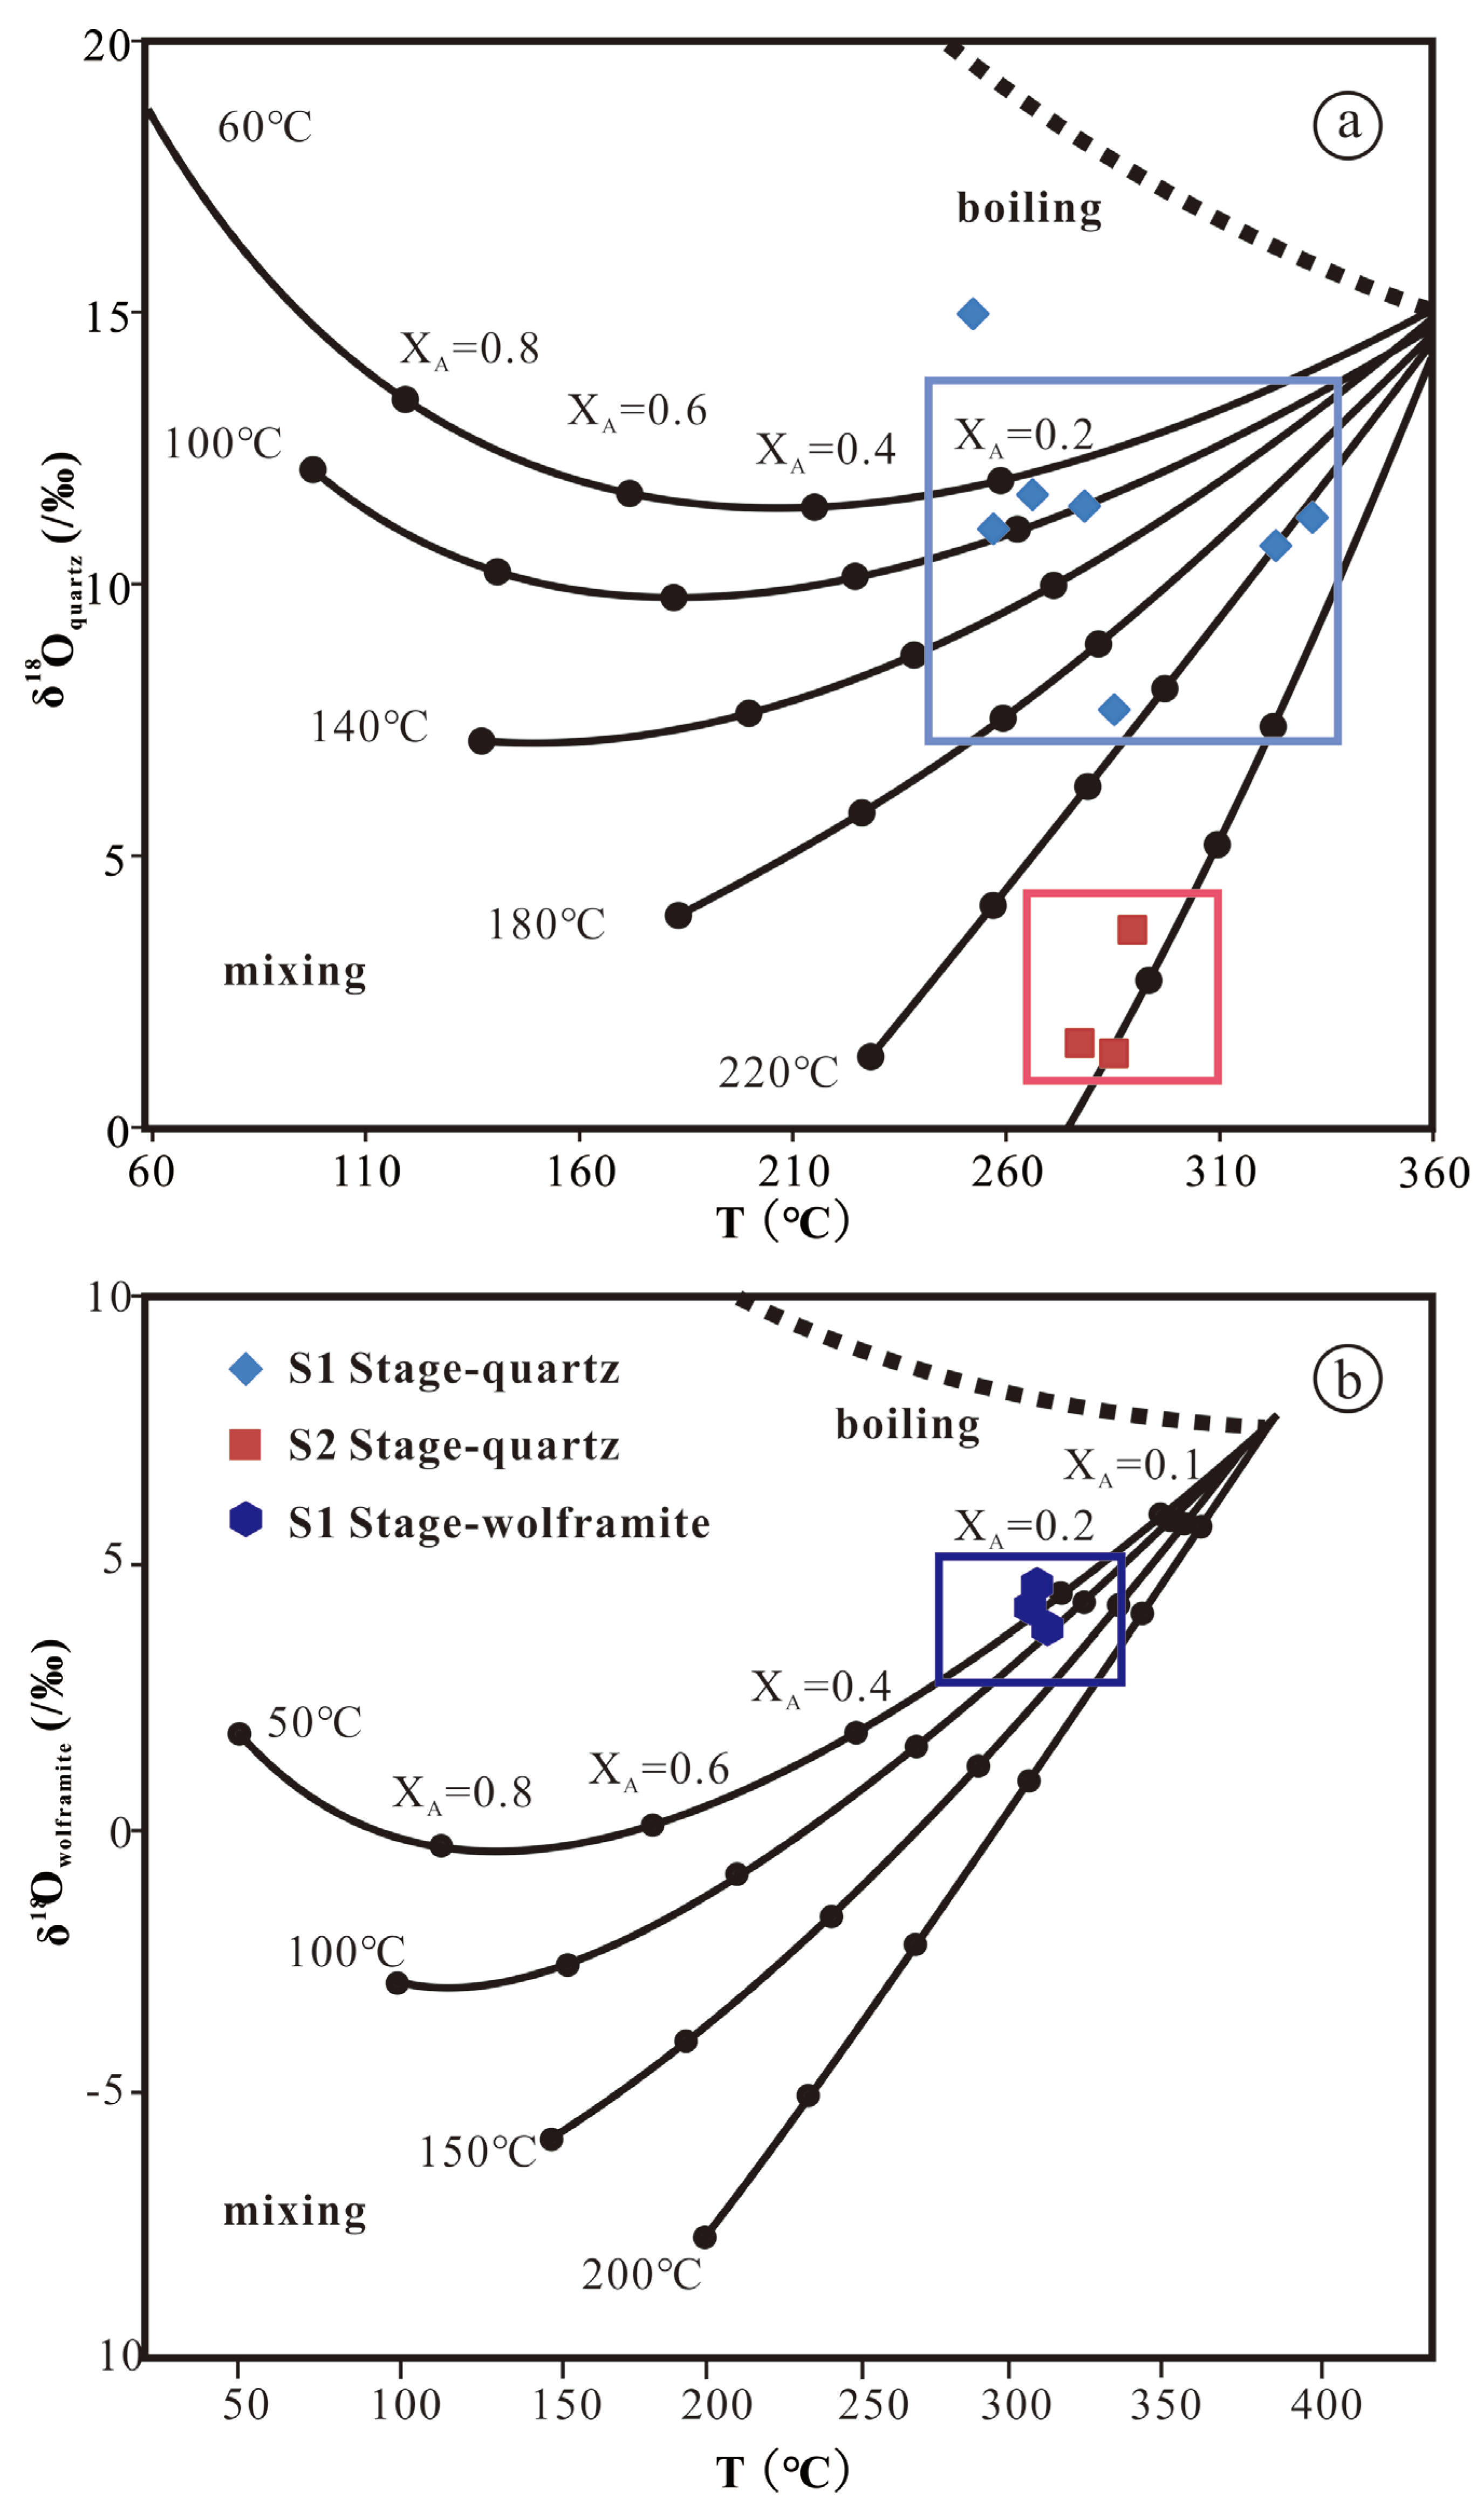
4.4. H–O Isotope Compositions
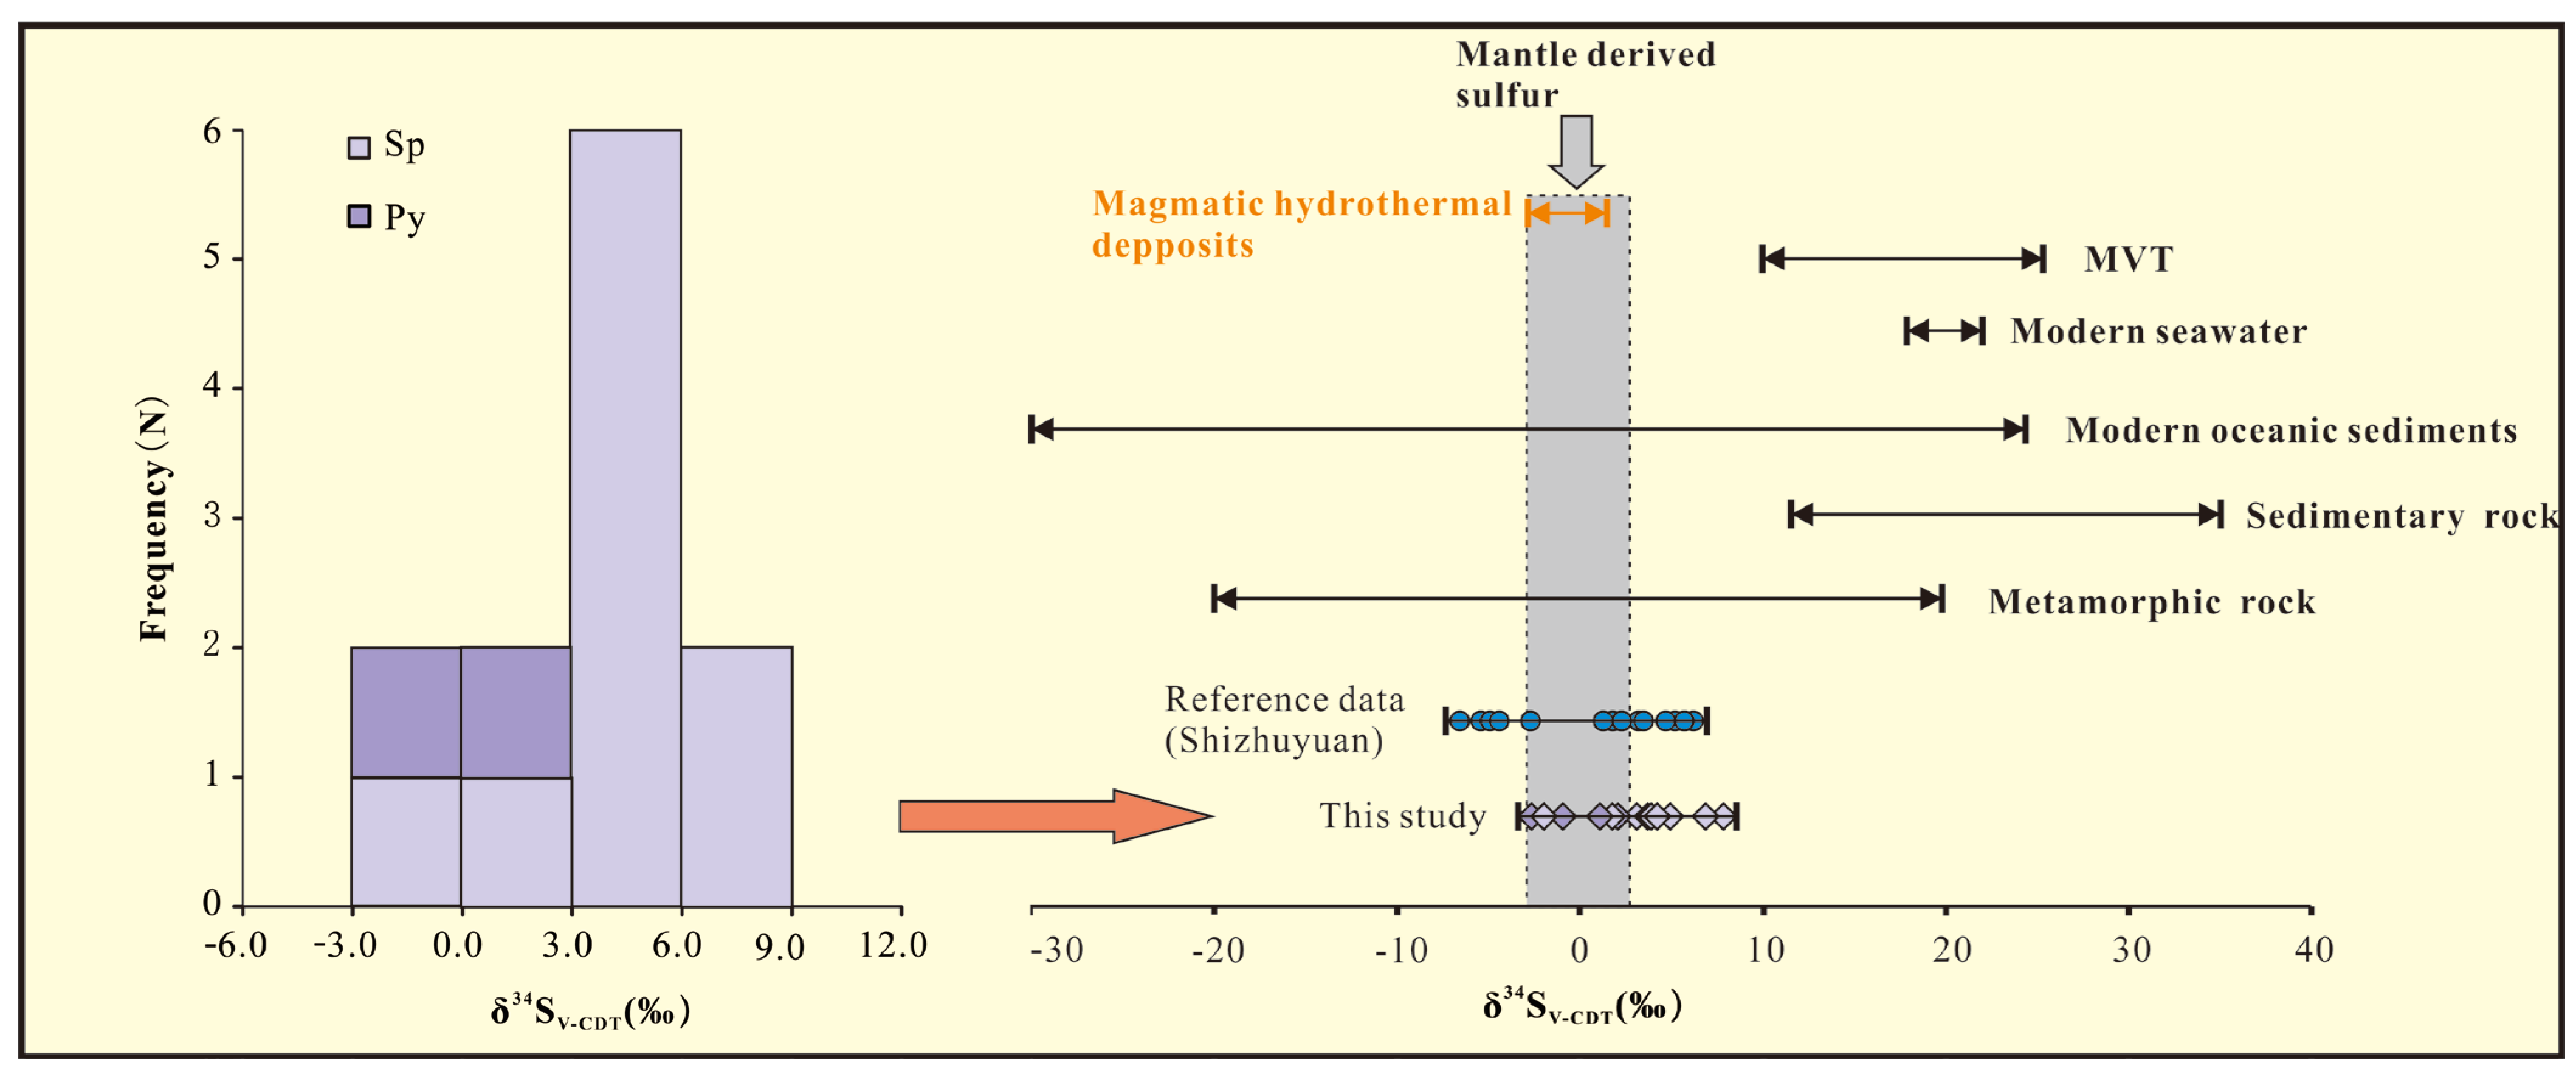
4.5. In Situ Sulfur Isotope Composition

| Sample Number | Text Point Number | Mineral | 34S (‰) | Sample Number | Mineral | 34S (‰) | Reference Data |
|---|---|---|---|---|---|---|---|
| FLR23-2 | CP-1 | Chalcopyrite | −5.91 | 558-43 | Bismuthinite | 2.2 | [61] |
| CP-2 | Chalcopyrite | −1.31 | 490-70 | Bismuthinite | 3.2 | ||
| CP-3 | Chalcopyrite | −2.45 | 514-6 | Bismuthinite | 3.1 | ||
| CP-4 | Chalcopyrite | −2.19 | 490-120 | Bismuthinite | 1.4 | ||
| FLR26 | SP-1 | Sphalerite | −2.58 | 490-121 | Bismuthinite | 1.8 | |
| SP-2 | Sphalerite | 0.83 | 490-131 | Bismuthinite | 1.5 | ||
| SP-3 | Sphalerite | 0.64 | 490-34 | Pyrite | 7.0 | ||
| CP-1 | Chalcopyrite | 1.80 | 490-38 | Pyrite | 6.2 | ||
| CP-2 | Chalcopyrite | 1.71 | Shi-2 | Pyrite | 4.9 | ||
| CP-3 | Chalcopyrite | 1.84 | — | Pyrite | 5.1 | ||
| This study | — | Pyrite | 4.8 | ||||
| D96 | Pyrite | 6.8 | |||||
| C650 | Galena | −5.2 | [62] | ||||
| C660 | Galena | −4.9 | |||||
| E 7 | Galena | −7.2 | [40] | ||||
| Shi 1 | Galena | −4.4 | |||||
| Shi 6 | Galena | −3.1 | |||||
5. Discussion
5.1. Ore-Forming Fluid Source and Evolution
5.1.1. Ore-Forming Fluid Source
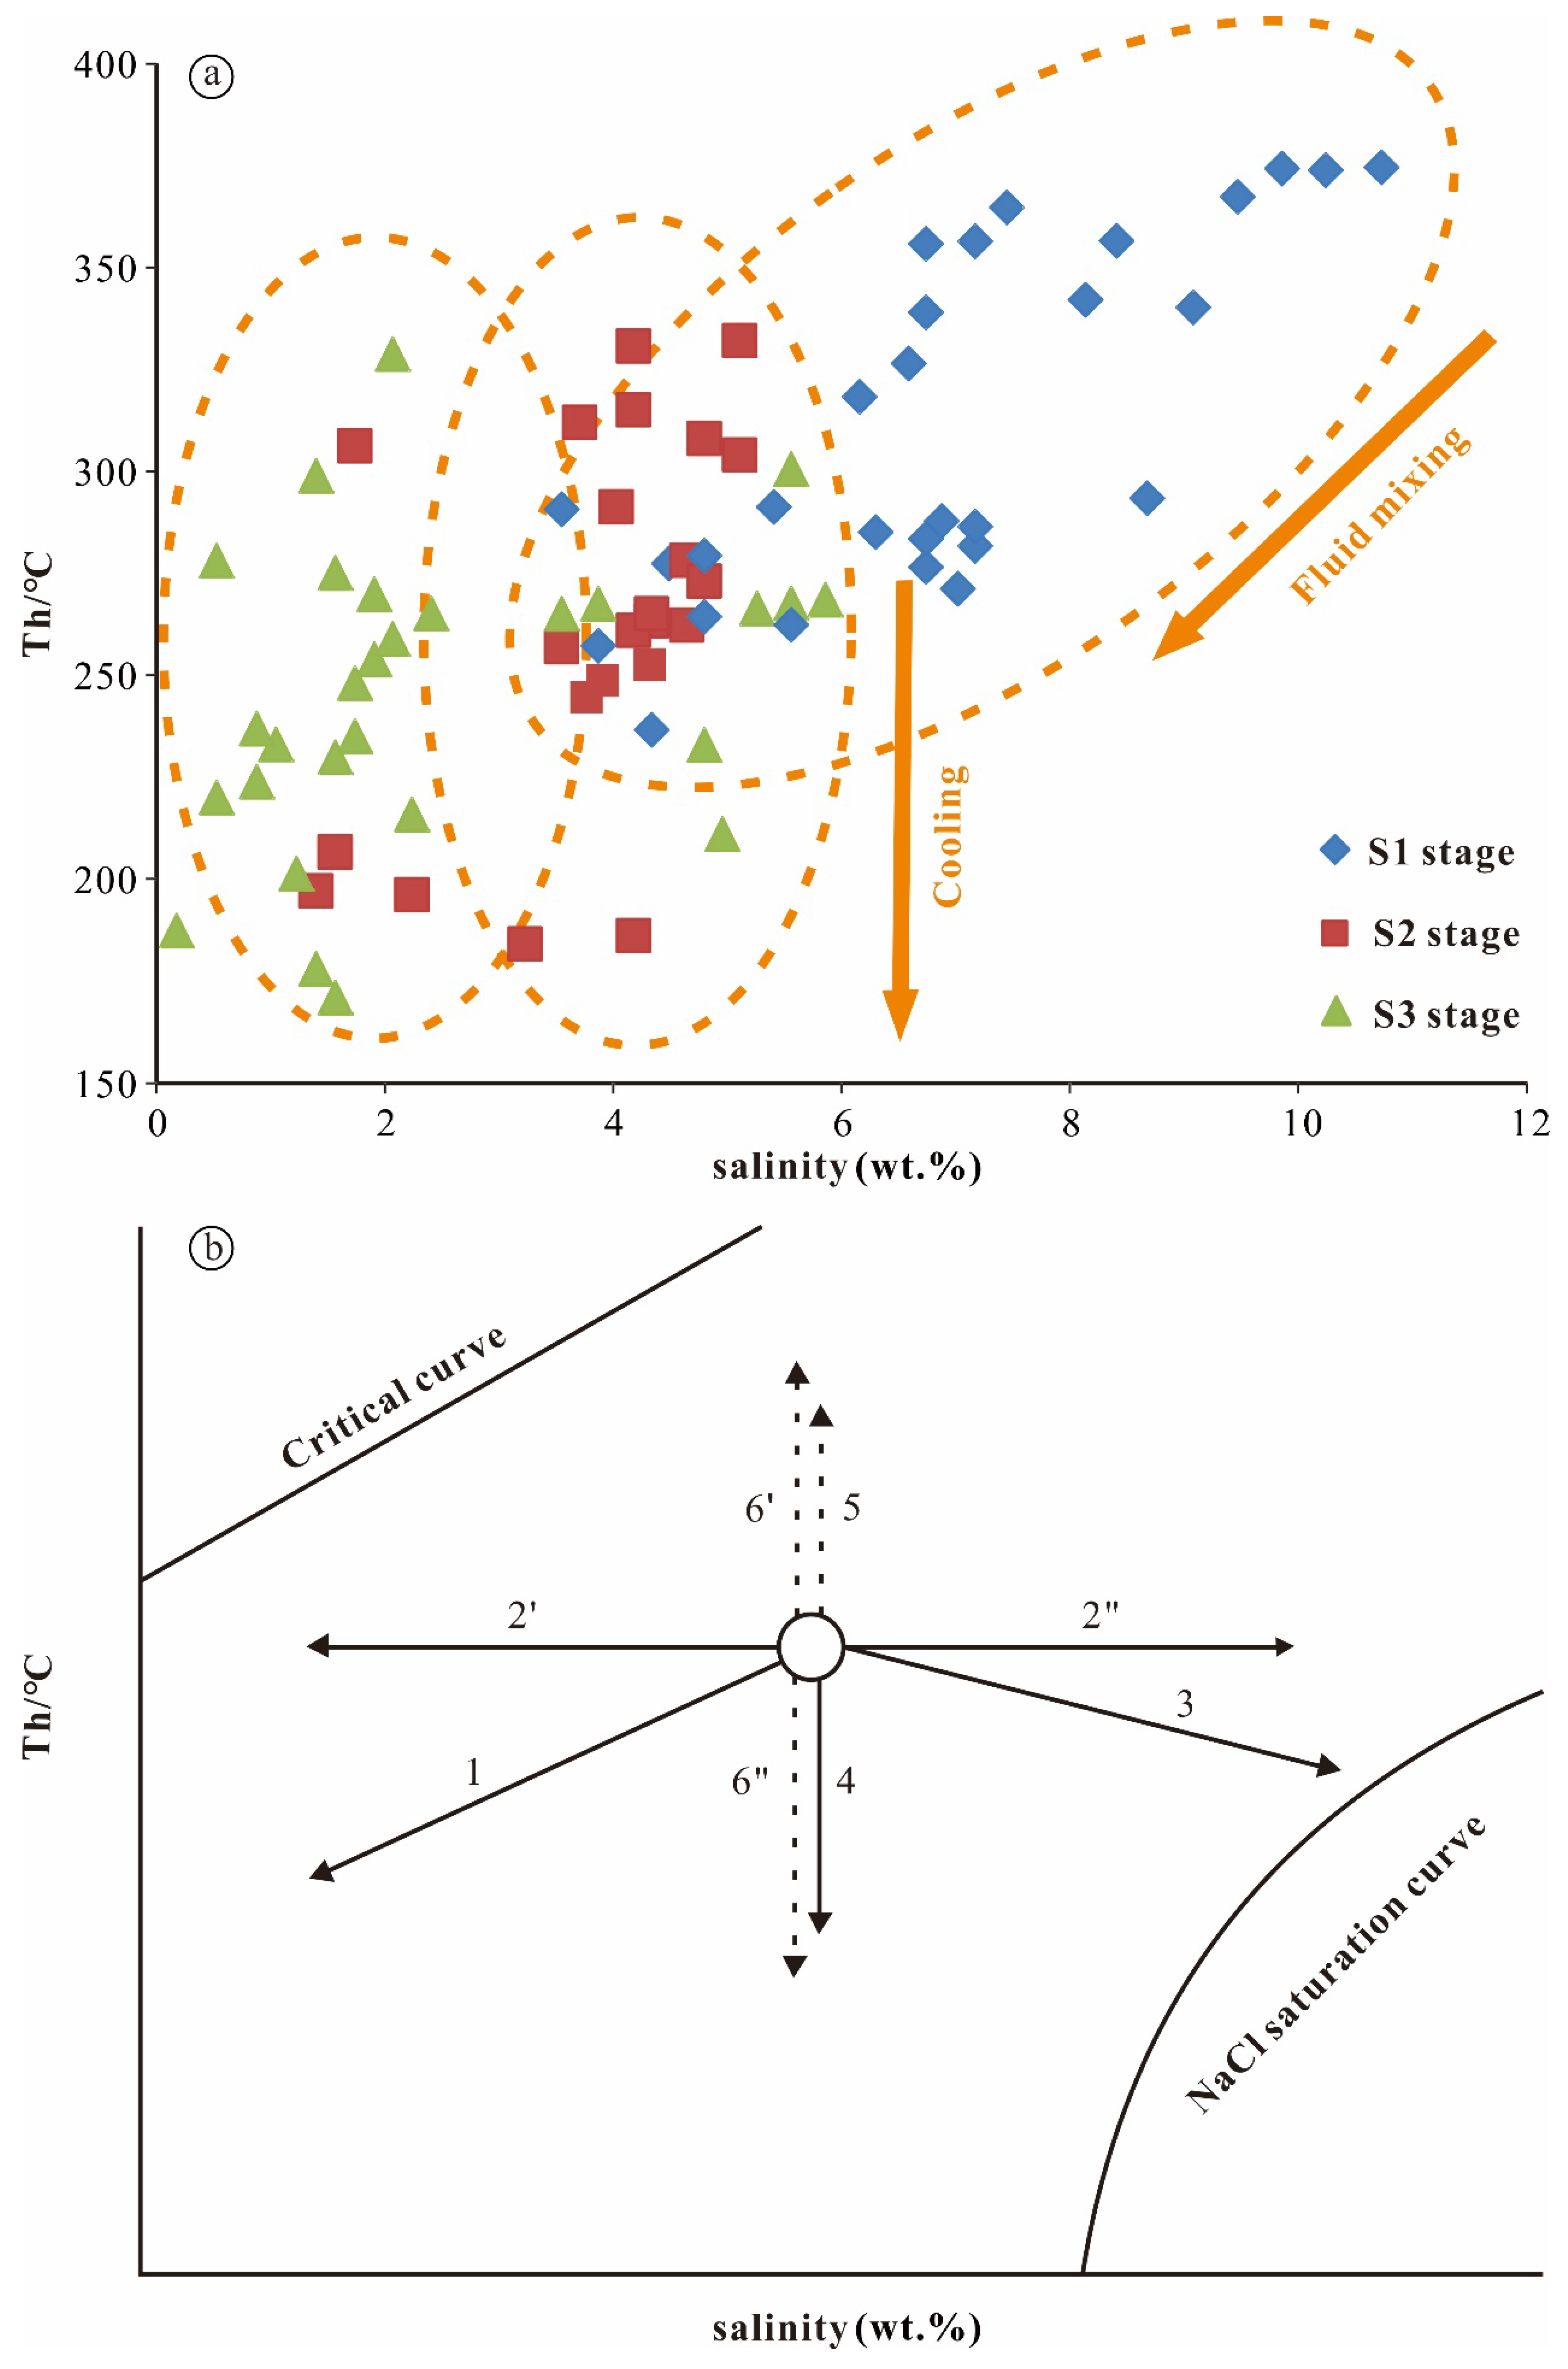
5.1.2. Ore-Forming Fluid Evolution
5.2. Fluid Processes in Quartz and Coexisting Wolframite
5.2.1. Mechanism of Wolframite Mineralization
5.2.2. Role of CO2 for Tungsten Mineralization
5.3. Constraints on Quartz-Vein-Type Tungsten Ore Formation by Clastic Wall Rocks
6. Conclusions
Author Contributions
Funding
Data Availability Statement
Acknowledgments
Conflicts of Interest
References
- Jiang, W.C.; Li, H.; Noreen, J.E.; Wu, J.H.; Cao, J.Y. Metal Sources of World-Class Polymetallic W–Sn Skarns in the Nanling Range, South China: Granites versus Sedimentary Rocks? Minerals 2018, 8, 265. [Google Scholar] [CrossRef] [Green Version]
- Yuan, S.; Williams-Jones, A.E.; Mao, J.; Zhao, P.; Yan, C.; Zhang, D. The origin of the Zhangjialong tungsten deposit, South China: Implications for W-Sn mineralization in large granite batholiths. Econ. Geol. 2018, 113, 1193–1208. [Google Scholar] [CrossRef] [Green Version]
- Yuan, S.; Williams-Jones, A.E.; Romer, R.L.; Zhao, P.; Mao, J. Protolith-Related Thermal Controls on the Decoupling of Sn and W in Sn-W Metallogenic Provinces: Insights from the Nanling Region, China. Econ. Geol. 2019, 114, 1005–1012. [Google Scholar] [CrossRef]
- Zhao, P.; Chu, X.; Williams-Jones, A.E.; Mao, J.; Yuan, S. The role of phyllosilicate partial melting in segregating tungsten and tin deposits in W-Sn metallogenic provinces. Geology 2022, 50, 121–125. [Google Scholar] [CrossRef]
- Zhao, P.; Yuan, S.; Williams-Jones, A.E.; Romer, R.L.; Yan, C.; Song, S.; Mao, J. Temporal Separation of W and Sn Mineralization by Temperature-Controlled Incongruent Melting of a Single Protolith: Evidence from the Wangxianling Area, Nanling Region, South China. Econ. Geol. 2022, 117, 667–682. [Google Scholar] [CrossRef]
- Cao, J.; Wu, Q.; Yang, X.; Kong, H.; Li, H.; Xi, X.; Huang, Q.; Liu, B. Geochronology and Genesis of the Xitian W-Sn Polymetallic Deposit in Eastern Hunan Province, South China: Evidence from Zircon U-Pb and Muscovite Ar-Ar Dating, Petrochemistry, and Wolframite Sr-Nd-Pb Isotopes. Minerals 2018, 8, 111. [Google Scholar] [CrossRef] [Green Version]
- Guo, C.L.; Mao, J.W.; Bierlein, F.; Chen, Z.H.; Chen, Y.C.; Li, C.B.; Zeng, Z.L. SHRIMP U-Pb (zircon), Ar-Ar (muscovite) and Re-Os (molybdenite) isotopic dating of the Taoxikeng tungsten deposit, South China Block. Ore Geol. Rev. 2011, 43, 26–39. [Google Scholar] [CrossRef]
- Liang, X.Q.; Dong, C.G.; Jiang, Y.; Wu, S.C.; Zhou, Y.; Zhu, H.F.; Fu, J.G.; Wang, C.; Shan, Y.H. Zircon U-Pb, molybdenite Re-Os and muscovite Ar-Ar isotopic dating of the Xitian W-Sn polymetallic deposit, eastern Hunan Province, South China and its geological significance. Ore Geol. Rev. 2016, 78, 85–100. [Google Scholar] [CrossRef]
- Peng, J.T.; Zhou, M.F.; Hu, R.Z.; Shen, N.P.; Yuan, S.D.; Bi, X.W.; Du, A.D.; Qu, W.J. Precise molybdenite Re-Os and mica Ar-Ar dating of the Mesozoic Yaogangxian tungsten deposit, central Nanling district, South China. Miner. Depos. 2006, 41, 661–669. [Google Scholar] [CrossRef]
- Liu, X.; Wang, W.; Zhang, D. The Mechanisms Forming the Five–Floor Zonation of Quartz Veins: A Case Study in the Piaotang Tungsten–Tin Deposit, Southern China. Minerals 2021, 11, 883. [Google Scholar] [CrossRef]
- Zhou, X.; Sun, T.; Shen, W.; Shu, L.; Niu, Y. Petrogenesis of Mesozoic granitoids and volcanic rocks in South China: A response to tectonic evolution. Episodes 2006, 29, 26–33. [Google Scholar] [CrossRef] [PubMed] [Green Version]
- Mao, J.W.; Cheng, Y.B.; Chen, M.H.; Pirajno, F. Major types and time-space distribution of mesozoic ore deposits in south China and their geodynamic settings. Miner. Depos. 2013, 48, 267–294. [Google Scholar]
- Jiang, P.C. Characteristics of Hongqiling Tin-Polymetallic deposit, Chenxian, Hunan. Hunan Inst. Geol. 1987, 6, 33–41, (In Chinese with English Abstract). [Google Scholar]
- Yuan, S.D.; Liu, X.F.; Wang, X.D.; Wu, S.H.; Yuan, Y.B.; Li, X.K.; Wang, T.Z. Geological characteristics and 40Ar-39Ar geo-chronology of the Hongqiling tin deposit in southern Hunan Province. Acta Petrol. Sin. 2012, 28, 3787–3797, (In Chinese with English Abstract). [Google Scholar]
- Ma, L.Y.; Lu, Y.F.; Fu, J.M.; Chen, X.Q.; Cheng, S.B. The Rb- Sr and Sm-Nd Geochronology Constraints on the Formation Age of Jinchuantang and Hongqiling Tin-polymetallic Deposits in Dongpo Orefield, Hunan Province. Geol. Miner. Resour. South China 2010, 4, 23–29, (In Chinese with English Abstract). [Google Scholar]
- Chen, B.L.; Liu, J.M. Study on the Genesis and Geochemical Characteristics of the Zongshuban Lead-zinc Deposit. Miner. Re-Sources Geol. 1999, 13, 39–43, (In Chinese with English Abstract). [Google Scholar]
- Su, Y.M. Geological Features and Genesis of the Hongqiling Sn-polymetallic Deposit in Chenxian, Hunan. Acta Geol. Sichuan 2007, 27, 274–278, (In Chinese with English Abstract). [Google Scholar]
- Zhao, W.W.; Zhou, M.-F.; Li, Y.H.M.; Zhao, Z.; Gao, J.-F. Genetic types, mineralization styles, and geodynamic settings of Mesozoic tungsten deposits in South China. J. Asian Earth Sci. 2017, 137, 109–140. [Google Scholar] [CrossRef]
- Wu, S.; Mao, J.; Yuan, S. Mineralogy, fluid inclusion petrography, and stable isotope geochemistry of Pb–Zn–Ag veins at the Shizhuyuan deposit, Hunan Province, southeastern China. Miner. Depos. 2018, 53, 89–103. [Google Scholar] [CrossRef]
- Yuan, S.D.; Peng, J.T.; Hu, R.Z.; Li, H.M.; Shen, N.P.; Zhang, D.L. A precise U-Pb age on cassiterite from the Xianghualing tin-polymetallic deposit (Hunan, south China). Miner. Depos. 2008, 43, 375–382. [Google Scholar] [CrossRef]
- Yuan, S.D.; Peng, J.T.; Hao, S.; Li, H.M.; Geng, J.Z.; Zhang, D.L. In situ LA-MC-ICP-MS and ID-TIMS U-Pb geochronology of cassiterite in the giant Furong tin deposit, Hunan Province, South China: New constraints on the timing of tin-polymetallic mineralization. Ore Geol. Rev. 2011, 43, 235–242. [Google Scholar] [CrossRef]
- Li, X.H.; Li, W.X.; Li, Z.X.; Lo, C.H.; Wang, J.; Ye, M.F.; Yang, Y.H. Amalgamation between the Yangtze and Cathaysia Blocks in South China: Constraints from SHRIMP U-Pb zircon ages, geochemistry and Nd-Hf isotopes of the Shuangxiwu volcanic rocks. Precambr. Res. 2009, 174, 117–128. [Google Scholar] [CrossRef]
- Zhao, P.; Yuan, S.; Mao, J.; Santosh, M.; Zhang, D. Zircon U–Pb and Hf–O isotopes trace the architecture of polymetallic deposits: A case study of the Jurassic ore-forming porphyries in the Qin–Hang metallogenic belt, China. Lithos 2017, 292–293, 132–145. [Google Scholar] [CrossRef]
- Wang, Y.L.; Pei, R.F.; LI, J.W.; Li, L. Geological settings of the tungsten-tin polymetallic ore-forming process in the ore concen-tration area of southern Hunan Province. Miner. Depos. 2006, 25, 375–378, (In Chinese with English Abstract). [Google Scholar]
- Zhao, P.; Yuan, S.; Mao, J.; Santosh, M.; Li, C.; Hou, K. Geochronological and petrogeochemical constraints on the skarn deposits in Tongshanling ore district, southern Hunan Province: Implications for Jurassic Cu and W metallogenic events in South China. Ore Geol. Rev. 2016, 78, 120–137. [Google Scholar] [CrossRef]
- Mao, J.W.; Li, H.Y.; Pei, R.F. Nd-Sr isotopic and petrogenetic studies of the Qianlishan granite stock, Hunan province. Miner. Depos. 1995, 14, 235–242, (In Chinese with English Abstract). [Google Scholar]
- Mao, J.W.; Guy, B.; Raimbault, L.; Shimazaki, H. Manganese Skarn in the Shizhuyuan Polymetallic Tungsten Deposit, Hunan, China. Resour. Geol. 1996, 46, 1–11. [Google Scholar]
- Chen, R.H.; Liu, C.X.; Xu, S.G. Jinchuantang Sn–Bi Deposit in Chengzhou City and its Metallogeny. Hunan Geol. 1997, 2, 33–37, (In Chinese with English Abstract). [Google Scholar]
- Zhu, Z.S.; Xu, K.Q.; Zhu, J.C. Geological features and prospecting significance of the Yejiwei porphyry tin deposit in Hunan province. Contrib. Geol. Miner. Resour. Res. 1990, 2, 1–11, (In Chinese with English Abstract). [Google Scholar]
- Liu, Y.X.; Qiao, Y.S.; Liu, Y.X. Silver occurrence and distribution regulation in the Nanfeng’ao Ag depositin Chenzhou, Hunan Province. Geol. Prospect. 2003, 39, 49–52, (In Chinese with English Abstract). [Google Scholar]
- Li, Z.X.; Li, X.H. Formation of the 1300-km-wide intracontinental orogen and post-orogenic magmatic province in Mesozoic South China: A flat-slab subduction model. Geology 2007, 35, 179–182. [Google Scholar] [CrossRef]
- Wang, L.L.; Ni, P.; Dai, B.Z.; Li, W.S.; Pan, J.Y.; Cui, J.M.; Gao, Y. Fluid inclusion study of the ore-bearing stockwork greisen at Shizhuyuan W-Sn-Mo-Bi deposit, Hunan. J. Nanjing Univ. Nat. Sci. 2020, 56, 653–665, (In Chinese with English Abstract). [Google Scholar]
- Shen, W.Z.; Wang, D.Z.; Xie, Y.L.; Liu, C.S. Geochemical characteristics and material sources of the Qianlishan composite granite body, Hunan province. Acta Petrol. Mineral. 1995, 14, 193–202, (In Chinese with English Abstract). [Google Scholar]
- Shu, X.J.; Wang, X.L.; Sun, T.; Xu, X.; Dai, M.N. Trace elements, U–Pb ages and Hf isotopes of zircons from Mesozoic granites in the western Nanling Range, South China: Implications for petrogenesis and W–Sn mineralization. Lithos 2011, 127, 468–482. [Google Scholar] [CrossRef]
- Mao, J.W.; Chen, M.; Yuan, S.D. Geological Characteristics of the Qinhang (or Shihang) Metallogenic Belt in South China and Spatial-Temporal Distribution Regularity of Mineral Deposits. Acta Geol. Sin. 2011, 85, 636–658, (In Chinese with English Abstract). [Google Scholar]
- Kuang, Y.Q. Geochemistry of the Qianlishan composite stock and its relation to tin mineralization Dongpo ore field. Hunan Geol. 1986, 5, 26–33, (In Chinese with English Abstract). [Google Scholar]
- Zhou, Y.Z.; Zeng, C.Y.; Li, H.Z. Geological evolution and ore-prospecting targets in southern segment of Qinzhou Bay-Hangzhou Bay juncture orogenic belt, southern China. Geol. Bull. China 2012, 31, 486–491. [Google Scholar]
- Xiong, Y.Q.; Shao, Y.J.; Cheng, Y.; Jiang, S.Y. Discrete jurassic and cretaceous mineralization events at the Xiangdong W (-Sn) deposit, Nanling Range, South China. Econ. Geol. 2020, 115, 385–413. [Google Scholar] [CrossRef]
- Jiang, H.; Jiang, S.Y.; Li, W.Q.; Zhao, K.D.; Peng, N.J. Highly fractionated Jurassic I-type granites and related tungsten miner-alization in the Shirenzhang deposit, northern Guangdong, South China: Evidence from cassiterite and zircon U-Pb ages, geo-chemistry and Sr-Nd-Pb-Hf isotopes. Lithos 2018, 312, 186–203. [Google Scholar] [CrossRef]
- Wang, Q.; Mo, N.; Mao, Y.D. S-isotope Geochemical Study of Shizhuyuan Deposit. Land Resour. Her. 2017, 14, 64. [Google Scholar]
- Chen, B.L.; Li, Y.S.; Dong, F.X.; Liu, J.M.; Liu, Y.X.; Xu, S.S.; Li, J.Z. Study on the structures of the ZongShuBan area, ChenXian, Hunan province and ore-controlling conditions. J. Geomech. 1998, 2, 77–84, (In Chinese with English Abstract). [Google Scholar]
- Li, X.; Liu, D.; Sun, M. Precise Sm-Nd and U-Pb isotopic dating of the supergiant Shizhuyuan polymetallic deposit and its host granite, SE China. Geol. Mag. 2004, 141, 225–231. [Google Scholar] [CrossRef] [Green Version]
- Zhao, P.L.; Yuan, S.D.; Mao, J.W.; Yuan, Y.B.; Zhao, H.J.; Zhang, D.L.; Shuan, Y. Constraints on the timing and genetic link of the large-scale accumulation of proximal W–Sn–Mo–Bi and distal Pb–Zn–Ag mineralization of the world-class Dongpo orefield, Nanling Range, South China. Ore Geol. Rev. 2018, 95, 1140–1160. [Google Scholar] [CrossRef]
- He, H. Analysis of Ore-Controlling Structure and Prospecting Model of The Hongqiling Hydrothermal Vein Sn-W-Pb-Zn Deposit in Southern Hunan; Kunming University of Science and Technology: Kunming, China, 2022. [Google Scholar]
- Chen, B.L.; Li, Y.S.; Liu, J.M. Analysis of Structural Ore Control of Vein-Like Lead-Zinc Deposits: A Case Study of the Congshuban Area; Earthquake Press: Beijing, China, 2000; pp. 1–226. (In Chinese) [Google Scholar]
- Hall, D.L.; Sterner, S.M.; Bondnar, R.J. Freezing point depression of NaCl-KCl-H2O solutions. Econ. Geol. 1988, 83, 197–202. [Google Scholar] [CrossRef]
- Roedder, E. Fluid Inclusions: Reviews in Mineralogy and Geochemistry. Mineral. Soc. Am. 1984, 12, 1–644. [Google Scholar]
- Lu, H.Z.; Fan, H.R.; Ni, P.; Ou, G.X.; Shen, K.; Zhang, W.H. Fluid Inclusions; Science Press: Beijing, China, 2004; pp. 1–487. [Google Scholar]
- Goldstein, R.H.; Reynolds, T.J. Systematics of Fluid Inclusions in Diagenetic Minerals; Society for Sedimentary Geology Short Course Notes: Tulsa, OK, USA, 1994; pp. 1–199. [Google Scholar]
- Liu, B. Density and isochoric formulae for NaCl-H2O inclusions with medium and high salinity and their applications. Geol. Rev. 2001, 6, 617–622, (In Chinese with English Abstract). [Google Scholar]
- Bodnar, R.J. A method of calculating fluid inclusion volumes based on vapor bubble diameters and P-V-T-X properties of inclusion fluids. Econ. Geol. 1983, 78, 535–542. [Google Scholar] [CrossRef]
- Shao, J.L.; Mei, J.M. On the study of typomorphic characteristics of mineral inclusion in the gold deposit from volcanic terrain in Zhejiang and its genetic and prospecting significance. Miner. Rocks 1986, 3, 103–111, (In Chinese with English Abstract). [Google Scholar]
- Shao, J.L. Mineralogy for Gold Ore Search; China University of Geosciences Press: Wuhan, China, 1999; pp. 1–150. (In Chinese) [Google Scholar]
- Clayton, R.N.; Neil, J.R.; Mayeda, T.K. Oxygen isotope exchange between quartz and water. J. Geophys. Res. 1972, 77, 3057–3067. [Google Scholar] [CrossRef]
- Zheng, Y.-F. Oxygen isotope fractionation in wolframite. Eur. J. Miner. 1992, 4, 1331–1336. [Google Scholar] [CrossRef]
- Taylor, H.P. The Application of Oxygen and Hydrogen Isotope Studies to Problems of Hydrothermal Alteration and Ore Dep-osition. Econ. Geol. 1974, 69, 843–883. [Google Scholar] [CrossRef]
- Wu, S.H.; Dai, P.; Wang, X.D. C, H, O, Pb isotopic geochemistry of W polymetallic skarn-greisen and Pb-Zn-Ag veins in Shizhuyuan ore field, Hunan Province. Miner. Depos. 2016, 35, 633–647, (In Chinese with English Abstract). [Google Scholar]
- Lu, H.Z. Mineralization and Fluid Inclusion Study of the Shizhuyuan W-Sn-Bi-Mo-F Skarn Deposit, Hunan Province, China. Econ. Geol. 2003, 98, 955–974. [Google Scholar] [CrossRef]
- Ohmoto, H. Systematics of Sulfur and Carbon Isotopes in Hydrothermal Ore Deposits. Econ. Geol. 1972, 67, 551–578. [Google Scholar] [CrossRef]
- Ohmoto, H.; Goldhaber, M.B. Sulfur and Carbon Isotopes. In Geochemistry of Hydrothermal Ore Deposits, 3rd ed.; Barnes, H.L., Ed.; Wiley: New York, NY, USA, 1997; pp. 517–611. [Google Scholar]
- Xiao, M.H. Sulfur isotopic geochemisty of Shi Zhu Yuan deposit. Miner. Resour. Geol. 1989, 2, 67–75, (In Chinese with English Abstract). [Google Scholar]
- Chen, J.; Halls, C.; Stanley, C.J. Mode of occurrence and origin of cassiterite in the Shi Zhu Yuan skarn W-Mo-Bi-Sn deposit, Hunan province. Geol. Rev. 1992, 2, 164–172+201, (In Chinese with English Abstract). [Google Scholar]
- Hoefs, J. Stable Geochemistry, 4th ed.; Springer: Berlin, Germany, 1997; pp. 119–120. [Google Scholar]
- Ohmoto, H. Stable isotope geochemistry of ore deposits. Rev. Mineral. Geochem. 1986, 16, 491–560. [Google Scholar] [CrossRef]
- Zhao, P.; Zajacz, Z.; Tsay, A.; Yuan, S. Magmatic-hydrothermal tin deposits form in response to efficient tin extraction upon magma degassing. Geochim. Cosmochim. Acta 2022, 316, 331–346. [Google Scholar] [CrossRef]
- Matsuhisa, Y.; Goldsmith, J.R.; Clayton, R.N. Oxygen isotopic fractionation in the system quartz-albite-anorthite-water. Geochim. Cosmochim. Acta 1979, 43, 1131–1140. [Google Scholar] [CrossRef]
- Nie, L.Q.; Zhou, T.F.; Wang, F.Y.; Zhang, Q.M.; Zhang, M.; Wang, L.H. Study of fluid inclusions and H-O-S isotopic compo-sitions of Donggushan tungsten skarn deposit, Anhui Province, China. Acta Petrol. Sin. 2019, 35, 3825–3837, (In Chinese with English Abstract). [Google Scholar]
- Heinrich, C.A. The chemistry of hydrothermal tin(-tungsten) ore deposition. Econ. Geol. 1990, 85, 457–481. [Google Scholar] [CrossRef]
- Hu, A.X.; Peng, J.T. Characteristics and Significance of the Fluid Inclusions from the Zhazixi Sb-W Deposit, Hunan Province. Geotecton. Metallog. 2020, 44, 431–446, (In Chinese with English Abstract). [Google Scholar]
- Wang, X.; Wang, X.D.; Yuan, S.D.; Jiang, Y.T.; He, W. Study on the Ore-forming fluid of the Dangping Quartz-type tungsten deposit in southern Jiangxi, China. Bull. Mineral. Petrol. Geochem. 2016, 35, 534–539, (In Chinese with English Abstract). [Google Scholar]
- Xie, W.; Wen, S.Q.; Tang, T.Q.; Ma, P.C. The thermodynamic phase diagram and the ore-forming mechanism of the Dongjun Pb-Zn-Ag deposit. Acta Geol. Sin. 2020, 94, 1482–1504, (In Chinese with English Abstract). [Google Scholar]
- Reed, M.H. Sulfide Mineral Precipitation from Hydrothermal Fluids. Rev. Mineral. Geochem. 2006, 61, 95–109. [Google Scholar] [CrossRef]
- Wu, K.X.; Wang, Y.H.; Sun, T.; Guo, X.F.; Hu, Y.M.; Chen, L.K.; Liu, W.M. Mineralization control effect of stratigraphic sur-rounding rock on the vein-shaped tungsten deposit in southern China: A research review. China Tungsten Ind. 2019, 34, 22–31, (In Chinese with English Abstract). [Google Scholar]
- Campbell, A.R.; Panter, K.S. Comparison of fluid inclusions in coexisting (cogenetic?) wolframite, cassiterite, and quartz from St. Michael’s Mount and Cligga Head, Cornwall, England. Geochim. Cosmochim. Acta 1990, 54, 673–681. [Google Scholar] [CrossRef]
- Bailly, L. Fluid inclusion study of stibnite using infrared microscopy: An example from the Brouzils antimony deposit (Vendee, Armorican massif, France). Econ. Geol. 2000, 95, 221–226. [Google Scholar] [CrossRef]
- Ni, P.; Wang, X.-D.; Wang, G.-G.; Huang, J.-B.; Pan, J.-Y.; Wang, T.-G. An infrared microthermometric study of fluid inclusions in coexisting quartz and wolframite from Late Mesozoic tungsten deposits in the Gannan metallogenic belt, South China. Ore Geol. Rev. 2014, 65, 1062–1077. [Google Scholar] [CrossRef]
- Wei, W.; Hu, R.; Bi, X.; Peng, J.; Su, W.; Song, S.; Shi, S. Infrared microthermometric and stable isotopic study of fluid inclusions in wolframite at the Xihuashan tungsten deposit, Jiangxi province, China. Miner. Depos. 2012, 47, 589–605. [Google Scholar] [CrossRef]
- Chen, L.-L.; Ni, P.; Li, W.-S.; Ding, J.-Y.; Pan, J.-Y.; Wang, G.-G.; Yang, Y.-L. The link between fluid evolution and vertical zonation at the Maoping tungsten deposit, Southern Jiangxi, China: Fluid inclusion and stable isotope evidence. J. Geochem. Explor. 2018, 192, 18–32. [Google Scholar] [CrossRef]
- Polya, D.A. Chemistry of the main-stage ore-forming fluids of the Panasqueira W-Cu (Ag)-Sn deposit, Portugal; implications for models of ore genesis. Econ. Geol. 1989, 84, 1134–1152. [Google Scholar] [CrossRef]
- Yokart, B.; Barr, S.M.; Williams-Jones, A.E. Late-stage alteration and tin–tungsten mineralization in the Khuntan Batholith, northern Thailand. J. Asian Earth Sci. 2003, 21, 999–1018. [Google Scholar] [CrossRef]
- Beuchat, S.; Moritz, R.; Pettke, T. Fluid evolution in the W-Cu-Zn-Pb San Cristobal vein, Peru: Fluid inclusion and stable isotope evidence. Chem. Geol. 2004, 210, 201–224. [Google Scholar] [CrossRef]
- Higgins, N.C. Fluid inclusion evidence for the transport of tungsten by carbonate complexes in hydrothermal solutions. Can. J. Earth Sci. 1980, 17, 823–830. [Google Scholar] [CrossRef]
- Manning, D.; Henderson, P. The behavior of tungsten in granitic melt-vapor systems. Contrib. Mineral. Petrol. 1984, 86, 286–293. [Google Scholar] [CrossRef]
- Drummond, S.E.; Ohmoto, H. Chemical evolution and mineral deposition in boiling hydrothermal systems. Econ. Geol. 1985, 80, 126–147. [Google Scholar] [CrossRef]
- Ridley, J.R.; Diamond, L.W. Fluid chemistry of orogenic lode gold deposits and implications for genetic models. Rev. Econ. Geol. 2000, 13, 141–162. [Google Scholar]
- Giuliani, G.; Li, Y.; Sheng, T. Fluid inclusion study of Xihuashan tungsten deposit in the southern Jiangxi province, China. Miner. Depos. 1988, 23, 24–33. [Google Scholar] [CrossRef]


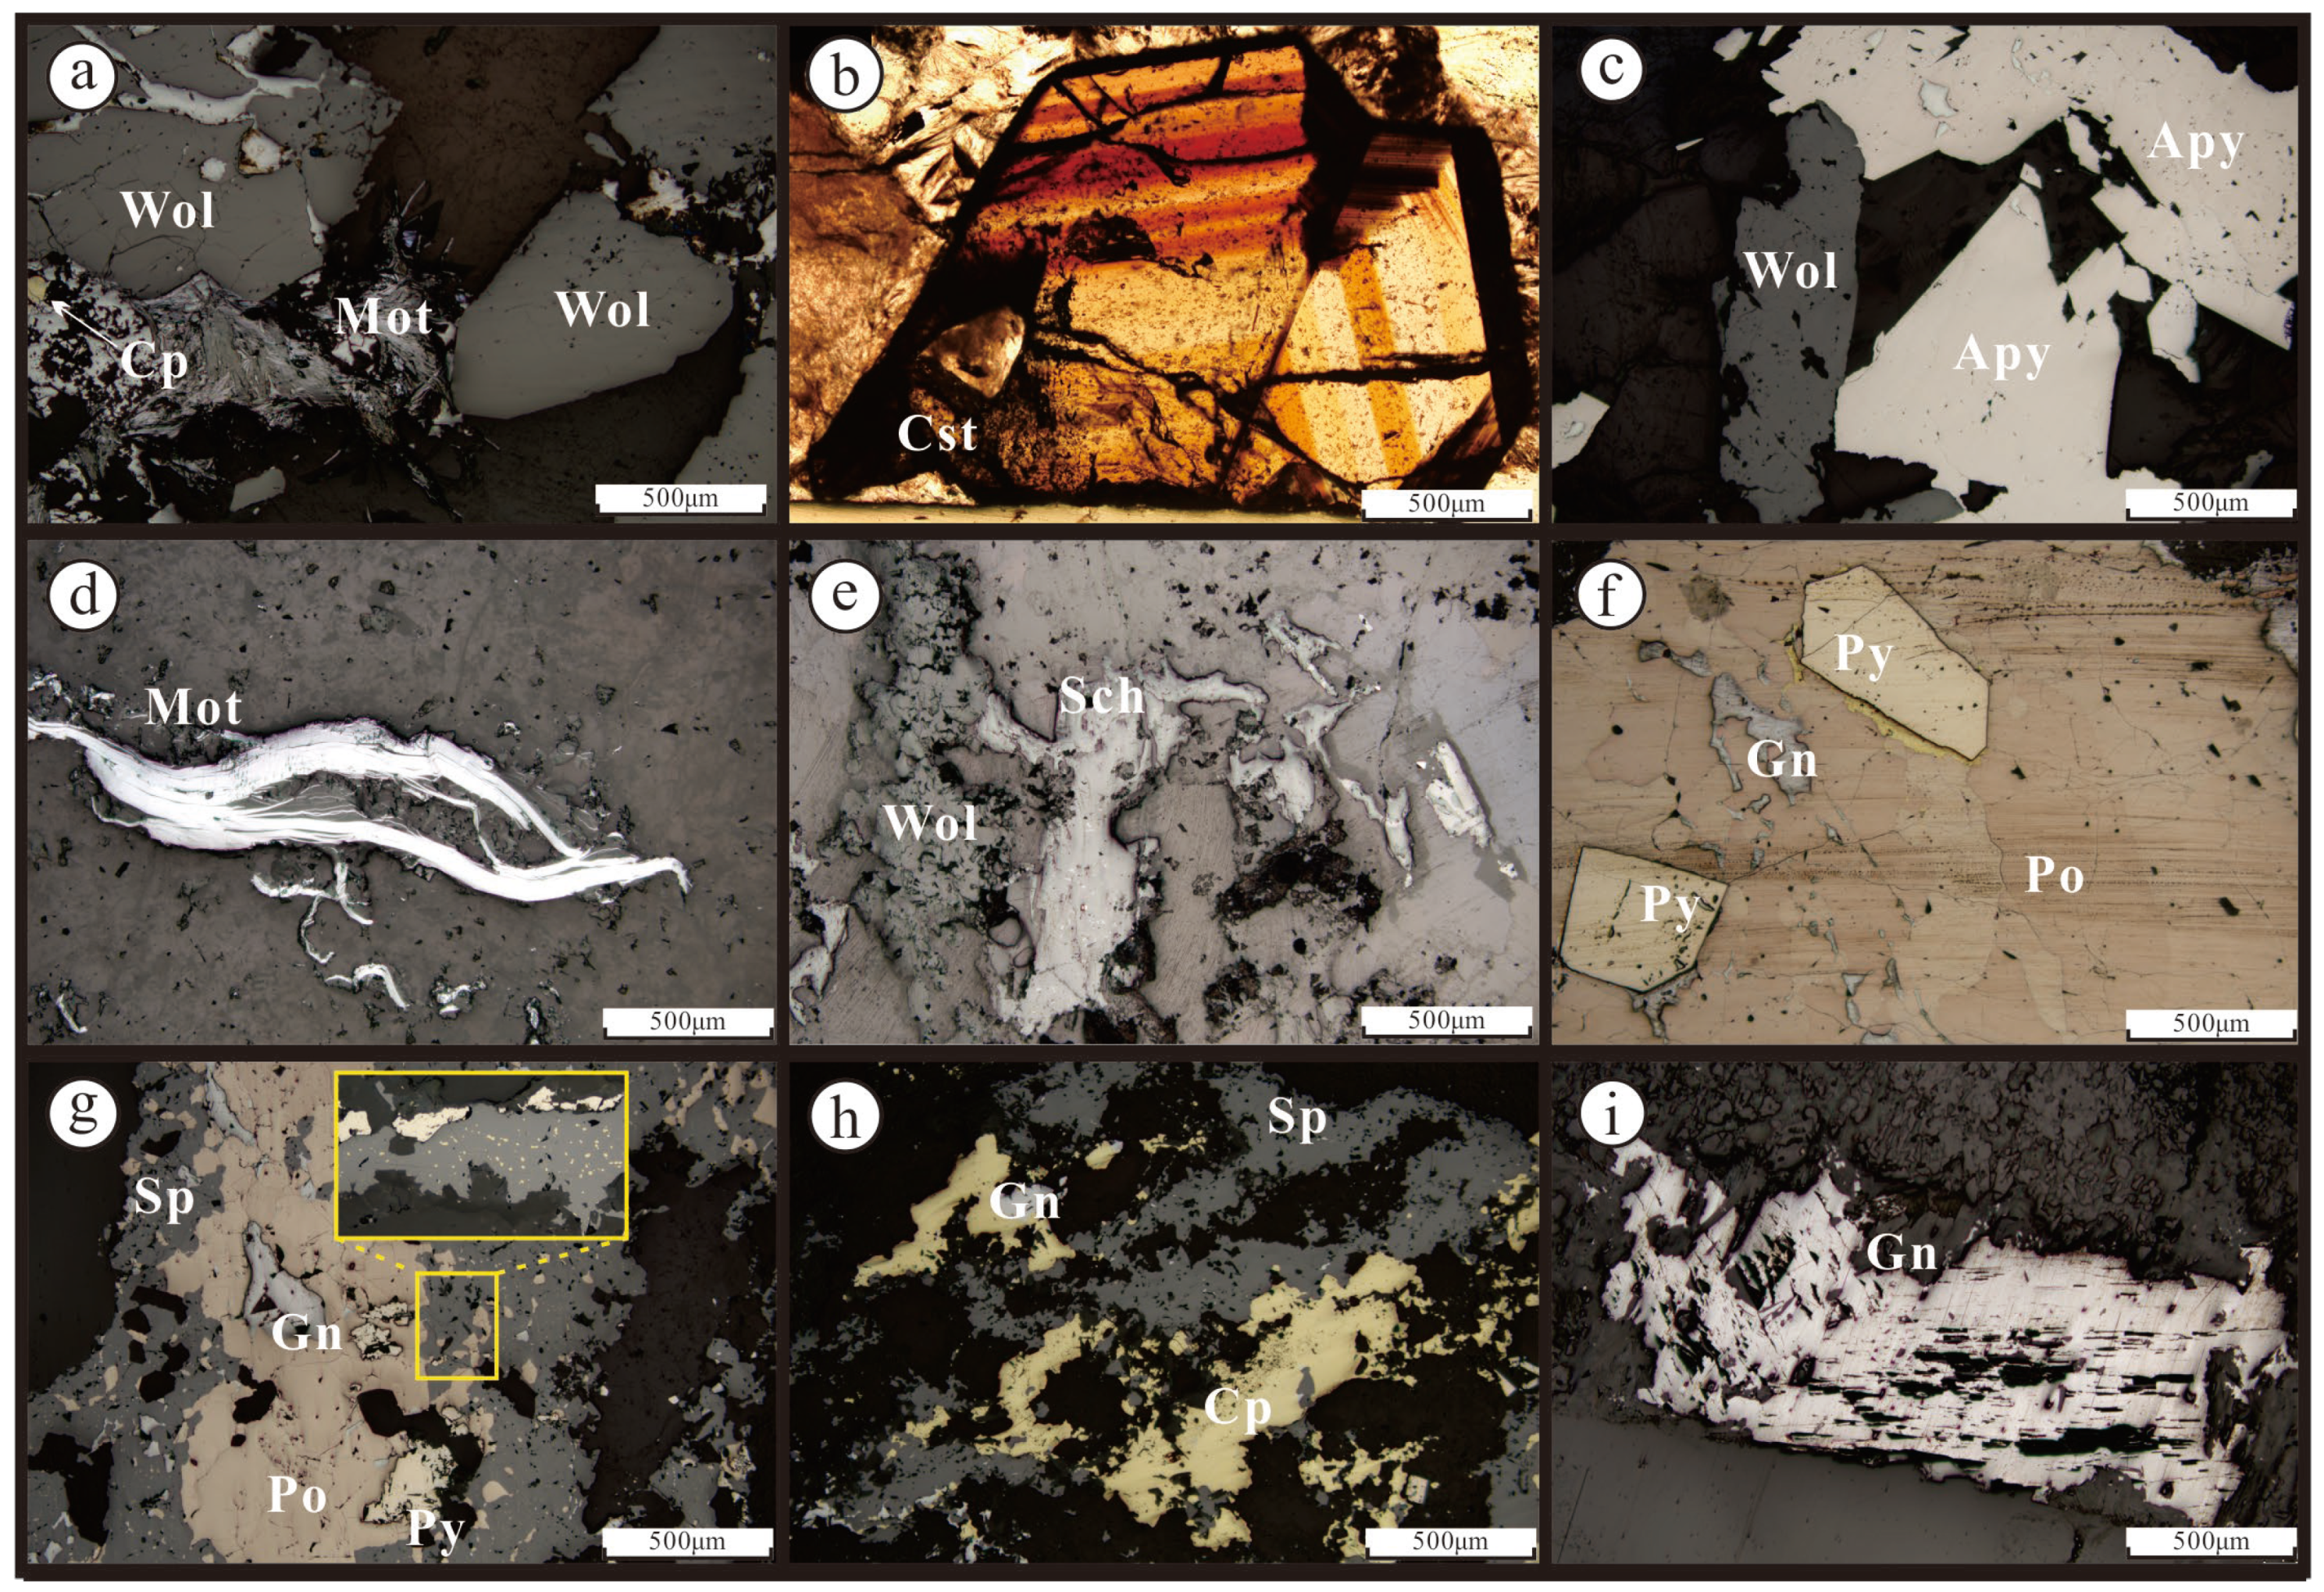
| Ore Vein | Type | Gangue Mineral | Ore Mineral | Texture of Ores | Ore Structure | |
|---|---|---|---|---|---|---|
| W-Sn mineralization stage | 4 | Cassiterite Sulfide type | A small amount of quartz | Cassiterite dominates, with small amounts of wolframite, pyrrhotite, and chalcopyrite | Euhedral-hypidiomorphic granular, cataclastic | The massive and disseminated |
| 101, 102, 103 | Cassiterite Quartz vein type | Quartz, fluorite, a small amount of calcite | Mainly wolframite, cassiterite, and arsenopyrite, followed by scheelite, molybdenite, chalcopyrite | Common crystallization, metasomatic-relict, euhedral-hypidiomorphic granular | Banded, massive, veined | |
| Pb-Zn mineralization stage | 27 | Lead-Zinc Ore vein | Quartz, fluorite, and calcite | Chalcopyrite, and sphalerite dominate, followed by galena and pyrite | metasomatic-relict, allotriomorphic granular, idiomorphic granular | The massive and disseminated |
| 3 | The mixed tin-lead-zinc ore vein | Quartz, fluorite, and calcite | Galena, sphalerite, pyrite, and chalcopyrite mainly, followed by cassiterite, wolframite arsenopyrite | allotriomorphic granular and metasomatic-relict | The massive, disseminated and veined |
| Mineralization Stage | Number of Tests | Host Mineral | Type | Th (°C) (avg) | Salinity (wt.% NaCleqv) (avg) | Density (g/mL) (avg) | Pressure (Mpa) (avg) | Depth (km) (avg) |
|---|---|---|---|---|---|---|---|---|
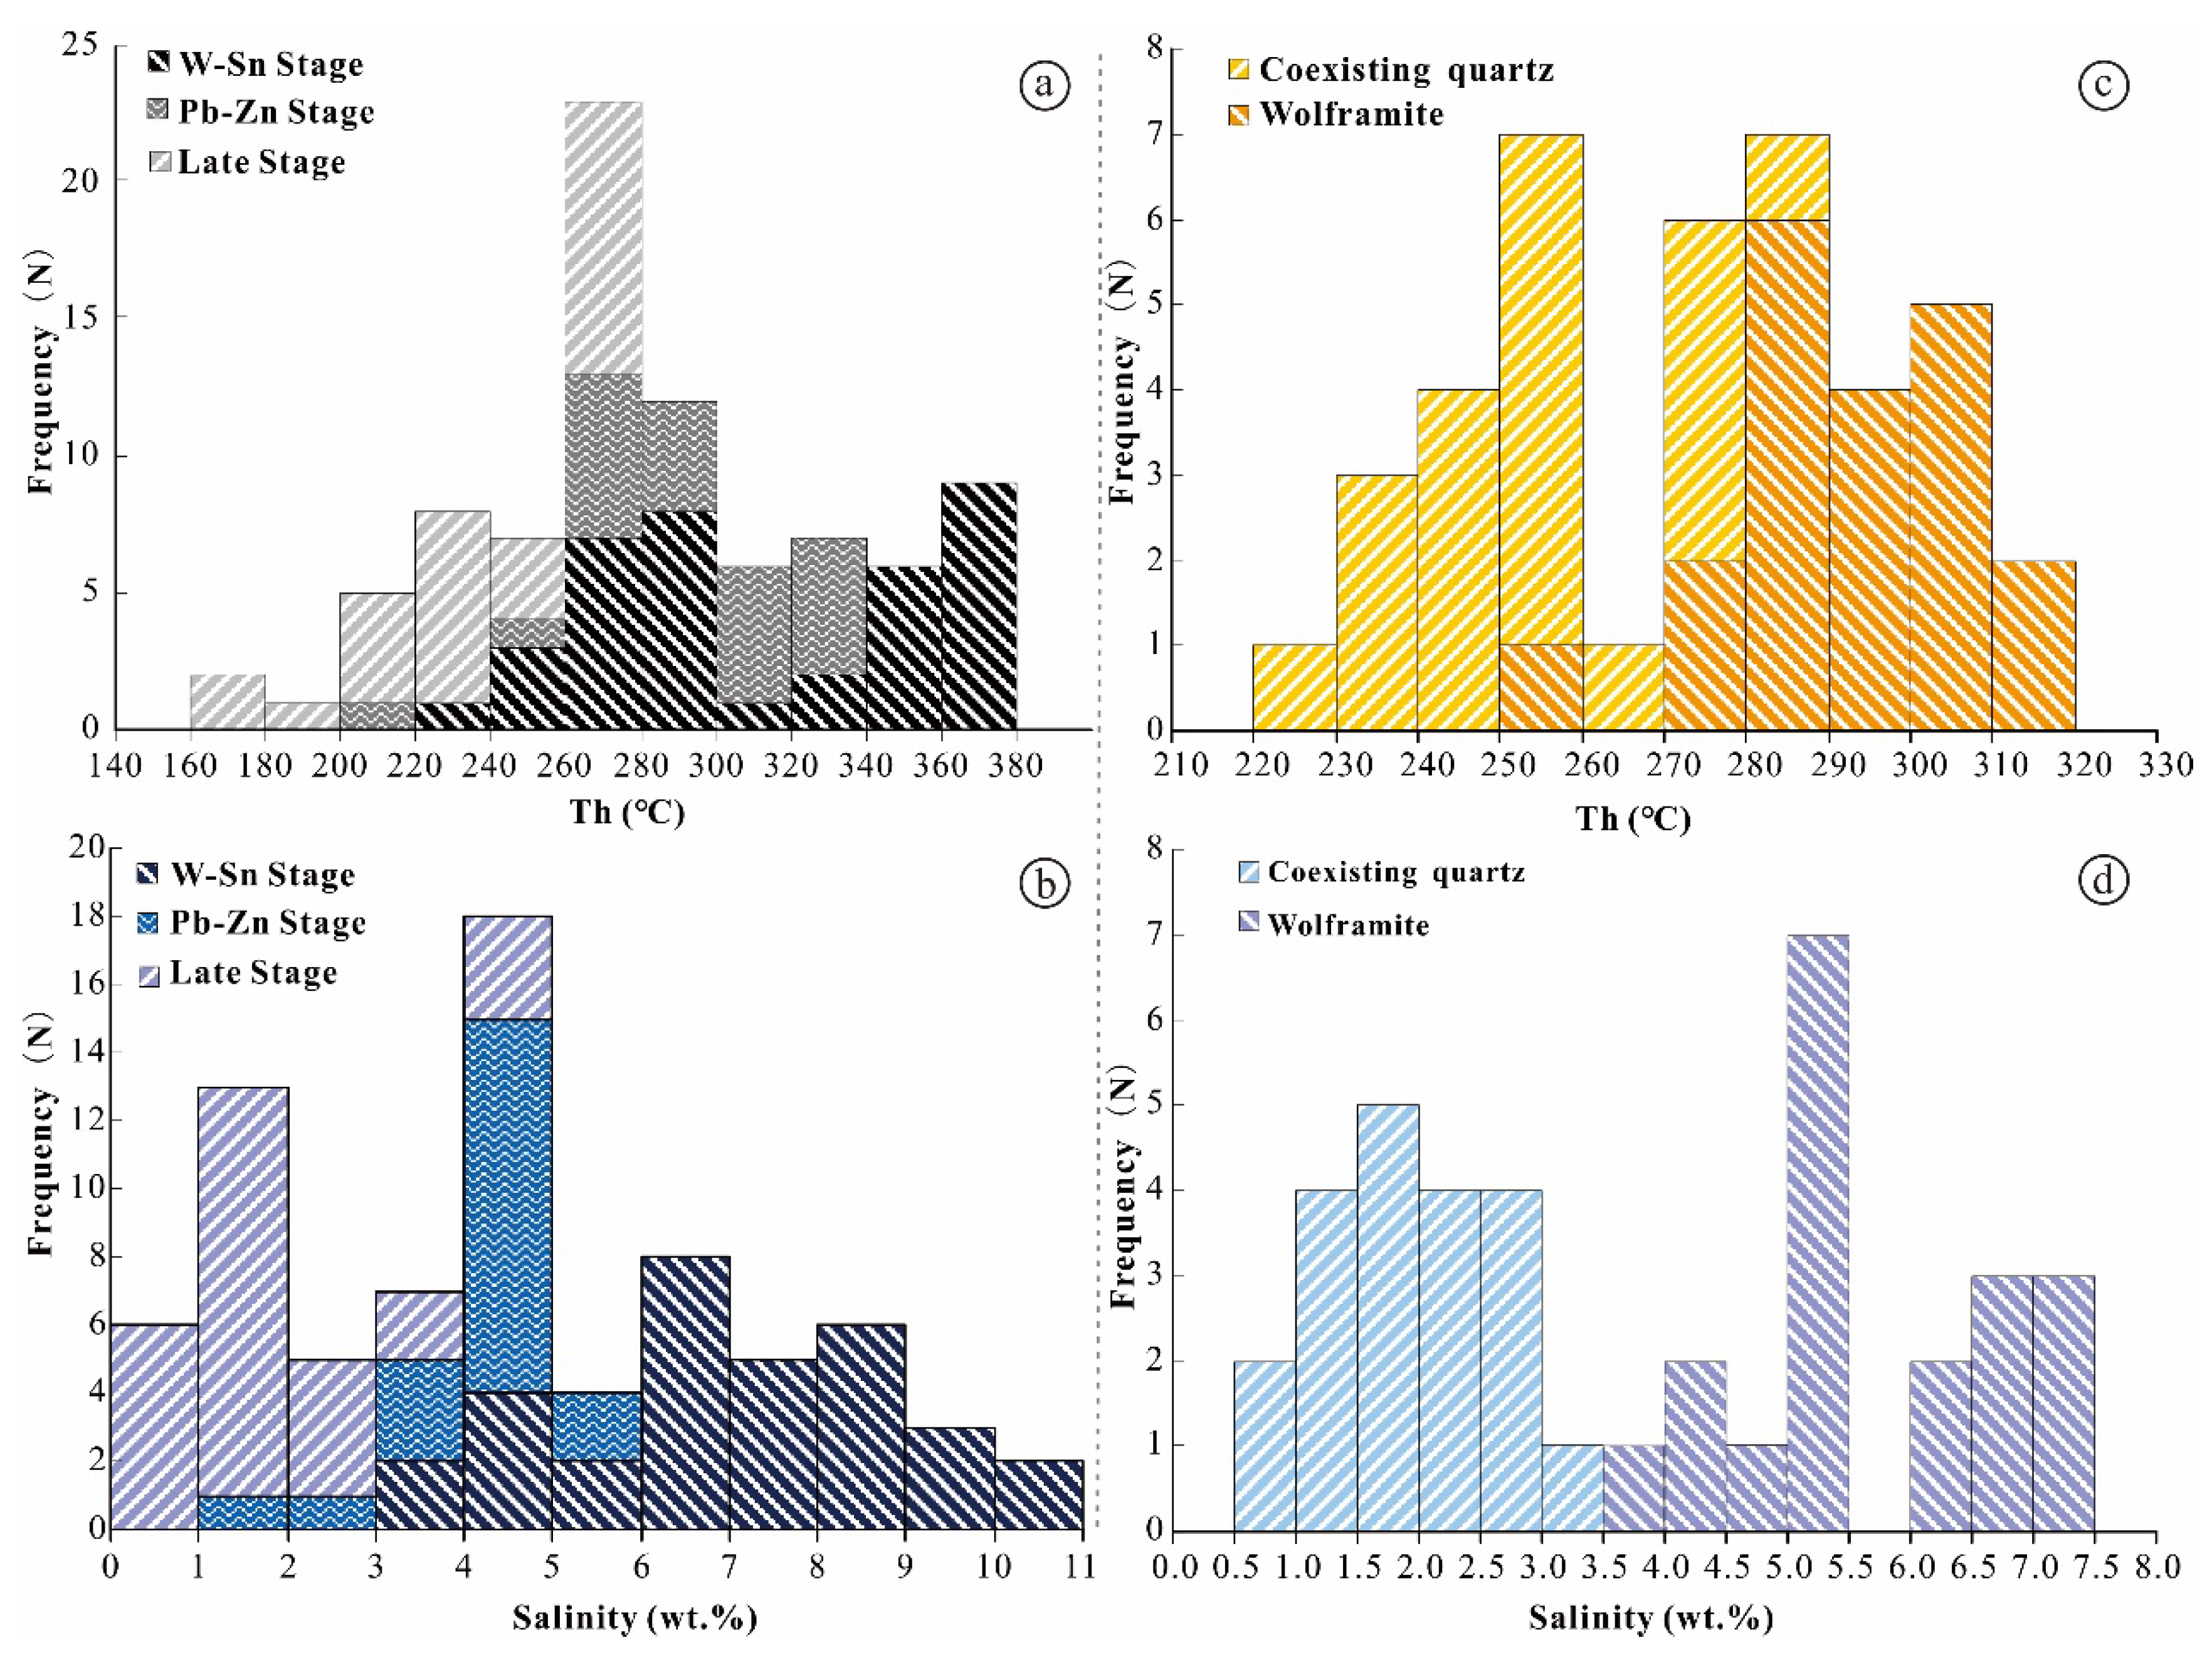
| W-Sn mineralization | 32 | Quartz | L + V | 236~377.6 (305.3) | 3.5~10.7 (8.07) | 0.68~0.87 (0.77) | 62.77~103.56 (82.39) | 2.09~3.44 (2.72) |
| Pb-Zn mineralization | 25 | Quartz | L + V | 206.5~332 (280.7) | 1.6~5.1 (3.84) | 0.66~0.9 (0.78) | 46.07~89.01 (69.78) | 1.54~2.97 (2.33) |
| Late stage of mineralization | 28 | Quartz and fluorite | L + V | 170.9~328.7 (246) | 0.2~5.9 (2.44) | 0.59~0.91 (0.82) | 23.97~81.4 (59.27) | 0.80~2.71 (1.98) |
| Sample Number | Ore Vein | Mineral | Th (℃) | δDV-SMOW (‰) | δ18OV-SMOW (‰) | δ18Ofluid (‰) |
|---|---|---|---|---|---|---|
| FLR8-3 | W-Sn | Quartz | 257 | −58.2 | 10.9 | −4.5 |
| HQR14 | Quartz | 321 | −66 | 10.6 | −2.4 | |
| HQR15-8 | Quartz | 266 | −68.3 | 11.5 | −3.5 | |
| HQR16 | Quartz | 329 | −69.1 | 11.1 | −1.6 | |
| HQR17 | Quartz | 278 | −58.7 | 11.3 | −3.2 | |
| FLR23-2 | Quartz | 253 | −62.8 | 14.7 | −0.9 | |
| HQR15-7 | Quartz | 278 | −71.1 | 11.3 | −3.2 | |
| HQR15-1 | Quartz | 285 | −69.8 | 7.7 | −6.6 | |
| HQR2-1 | Pb-Zn | Quartz | 278 | −76.6 | 1.6 | −12.9 |
| HQR2-2 | Quartz | 291 | −51.5 | 3.8 | −10.2 | |
| FLR26 | Quartz | 286 | −73.9 | 1.4 | −12.8 | |
| HQR14 | W-Sn | Wolframite | 321 | — | 4.1 | 5.7 |
| HQR16 | Wolframite | 329 | — | 4.9 | 6.5 | |
| HQR17 | Wolframite | 278 | — | 3.5 | 5.1 | |
| Reference Data (Shizhiyuan) | ||||||
| Data Source | Rock Type | Mineral | Th (°C) | δDV-SMOW (‰) | δ18OV-SMOW (‰) | δ18Ofluid (‰) |
| Wu et al., 2016 [57] | Greisen vein | Quartz Fluorite Fluorite | 225 — — | −83 −55 −56 | 2.5 — — | −8.2 −5.8 −6.3 |
| Lu, 2003 [58] | ||||||
| Wu et al., 2016 [58] | Massive greisen | Quartz Fluorite Fluorite | 360 — — | −77 −73 −52 | 10.6 — — | 5.1 −2.9 1.2 |
| Lu, 2003 [58] | ||||||
| Lu, 2003 [58] | Massive skarn | Quartz | — | −64 | — | 8.5 |
| Wu et al., 2016 [57] | Altered skarn | Quartz | 185 | −65 | 8.3 | −4.2 |
| Quartz veins located in the distant | Quartz | 225 | −83 | 13.6 | 2.8 | |
| Host Minerals | Type of FIs | N | Th (°C) (avg) | Salinity (wt.% NaCleqv) (avg) |
|---|---|---|---|---|
| quartz | Iwq-type | 20 | 229.8~279.4 (253.8) | 0.7~4.3 (1.9) |
| wolframite | Iw-type | 20 | 258.6~316.9 (293.2) | 3.8~8.9 (5.8) |
Disclaimer/Publisher’s Note: The statements, opinions and data contained in all publications are solely those of the individual author(s) and contributor(s) and not of MDPI and/or the editor(s). MDPI and/or the editor(s) disclaim responsibility for any injury to people or property resulting from any ideas, methods, instructions or products referred to in the content. |
© 2023 by the authors. Licensee MDPI, Basel, Switzerland. This article is an open access article distributed under the terms and conditions of the Creative Commons Attribution (CC BY) license (https://creativecommons.org/licenses/by/4.0/).
Share and Cite
Ren, W.; Wang, L.; Guan, S.; Xu, J.; He, H.; Zhu, E. Genesis and Fluid Evolution of the Hongqiling Sn-W Polymetallic Deposit in Hunan, South China: Constraints from Geology, Fluid Inclusion, and Stable Isotopes. Minerals 2023, 13, 395. https://doi.org/10.3390/min13030395
Ren W, Wang L, Guan S, Xu J, He H, Zhu E. Genesis and Fluid Evolution of the Hongqiling Sn-W Polymetallic Deposit in Hunan, South China: Constraints from Geology, Fluid Inclusion, and Stable Isotopes. Minerals. 2023; 13(3):395. https://doi.org/10.3390/min13030395
Chicago/Turabian StyleRen, Wenqi, Lei Wang, Shenjin Guan, Jiajin Xu, Hao He, and Enyi Zhu. 2023. "Genesis and Fluid Evolution of the Hongqiling Sn-W Polymetallic Deposit in Hunan, South China: Constraints from Geology, Fluid Inclusion, and Stable Isotopes" Minerals 13, no. 3: 395. https://doi.org/10.3390/min13030395