1. Introduction
The growing demand for metallic and critical raw materials associated with the green energy transition of world economies draws attention to the mining of massive and inclined orebodies. The sublevel caving system is a mining method used for extracting ore from such steeply dipping deposits. In this method, the ore is drilled and blasted while the waste rock caves in and fills the void created by the extraction of the ore [
1,
2,
3]. Deformation of the rock mass on the hanging-wall side, and to a lesser extent on the footwall, is an anticipated effect as the rock is expected to fracture and collapse following the caving in [
4]. The deformations that develop around the mine can be classified into three zones that are parallel to the mined mineral deposit [
5]. These are: the caved zone, which occurs above the mining operation; the fracture zone, characterised by parallel cracks that develop in the rock mass as it moves towards the caved zone; and the continuous deformation zone, which is the area where terrain deformations due to mining activity can be observed (
Figure 1). The cracks define the limit between the continuous and the discontinuous subsidence zones [
6]. The limits of fracture (discontinuous deformation) and the subsidence (continuous deformation) zones are defined empirically by break (fracture initiation) and limit (subsidence) angles, respectively (
Figure 1), traditionally determined with Laubscher’s method [
7,
8]. A database of these values based on an extensive query of sublevel caving operations worldwide was developed by [
9].
Prior studies related to sublevel caving mining focused predominately on the monitoring and modelling of deformations in underground workings for draw control and underground stability analysis [
5,
11], as well as underground mine planning and safe caving operation [
12,
13,
14].
The observations of surface deformations in sublevel caving mining areas have so far relied mainly on geodetic Total Station and GNSS measurements of controlled points to analyse the trend of rock caving and movement in the fracture zone. Notable studies have been conducted in the Kiruna and Malberg iron ore mines in Sweden [
15,
16], as well as the Chengchao [
17,
18], Xiaowanggou [
19] and Jinshandian [
20] iron ore mines in China. Trial uses of the satellite differential InSAR technique have also been reported in Sweden [
15].
To study rock mass behaviour under the influence of the sublevel caving method, empirical and numerical methods have been applied. Examples of the first include, for example, graph analysis applied for displacement–time curves observed in geodetic monitoring points or lines [
6,
18,
20]. The numerical methods applied for modelling rock mass behaviour include: continuum (finite element method (FEM)) [
14,
15], discontinuum (distinct element method) and hybrid (finite/discrete element method) approaches [
16,
19].
The application of satellite data for systematic monitoring of surface movements and the analysis of the full extent of the influence of sublevel caving mining that includes the continuous deformation zone have so far attracted less attention [
9,
13,
15]. Thus, the main aim of our study is to estimate the continuous deformation zone associated with sublevel caving mining of steeply inclined iron ore deposits based on the processing of openly available satellite permanent scatterer InSAR (PSInSAR) data in a geographic information system (GIS). The subsidiary aim is to assess the applicability of publicly available Sentinel-1 derived line-of-sight (LOS) movements and GIS spatial interpolation methods for estimating the extent of deformations from scattered and irregular networks of observations and providing the mine with interpreted information for control and management tasks.
2. Case Study Site
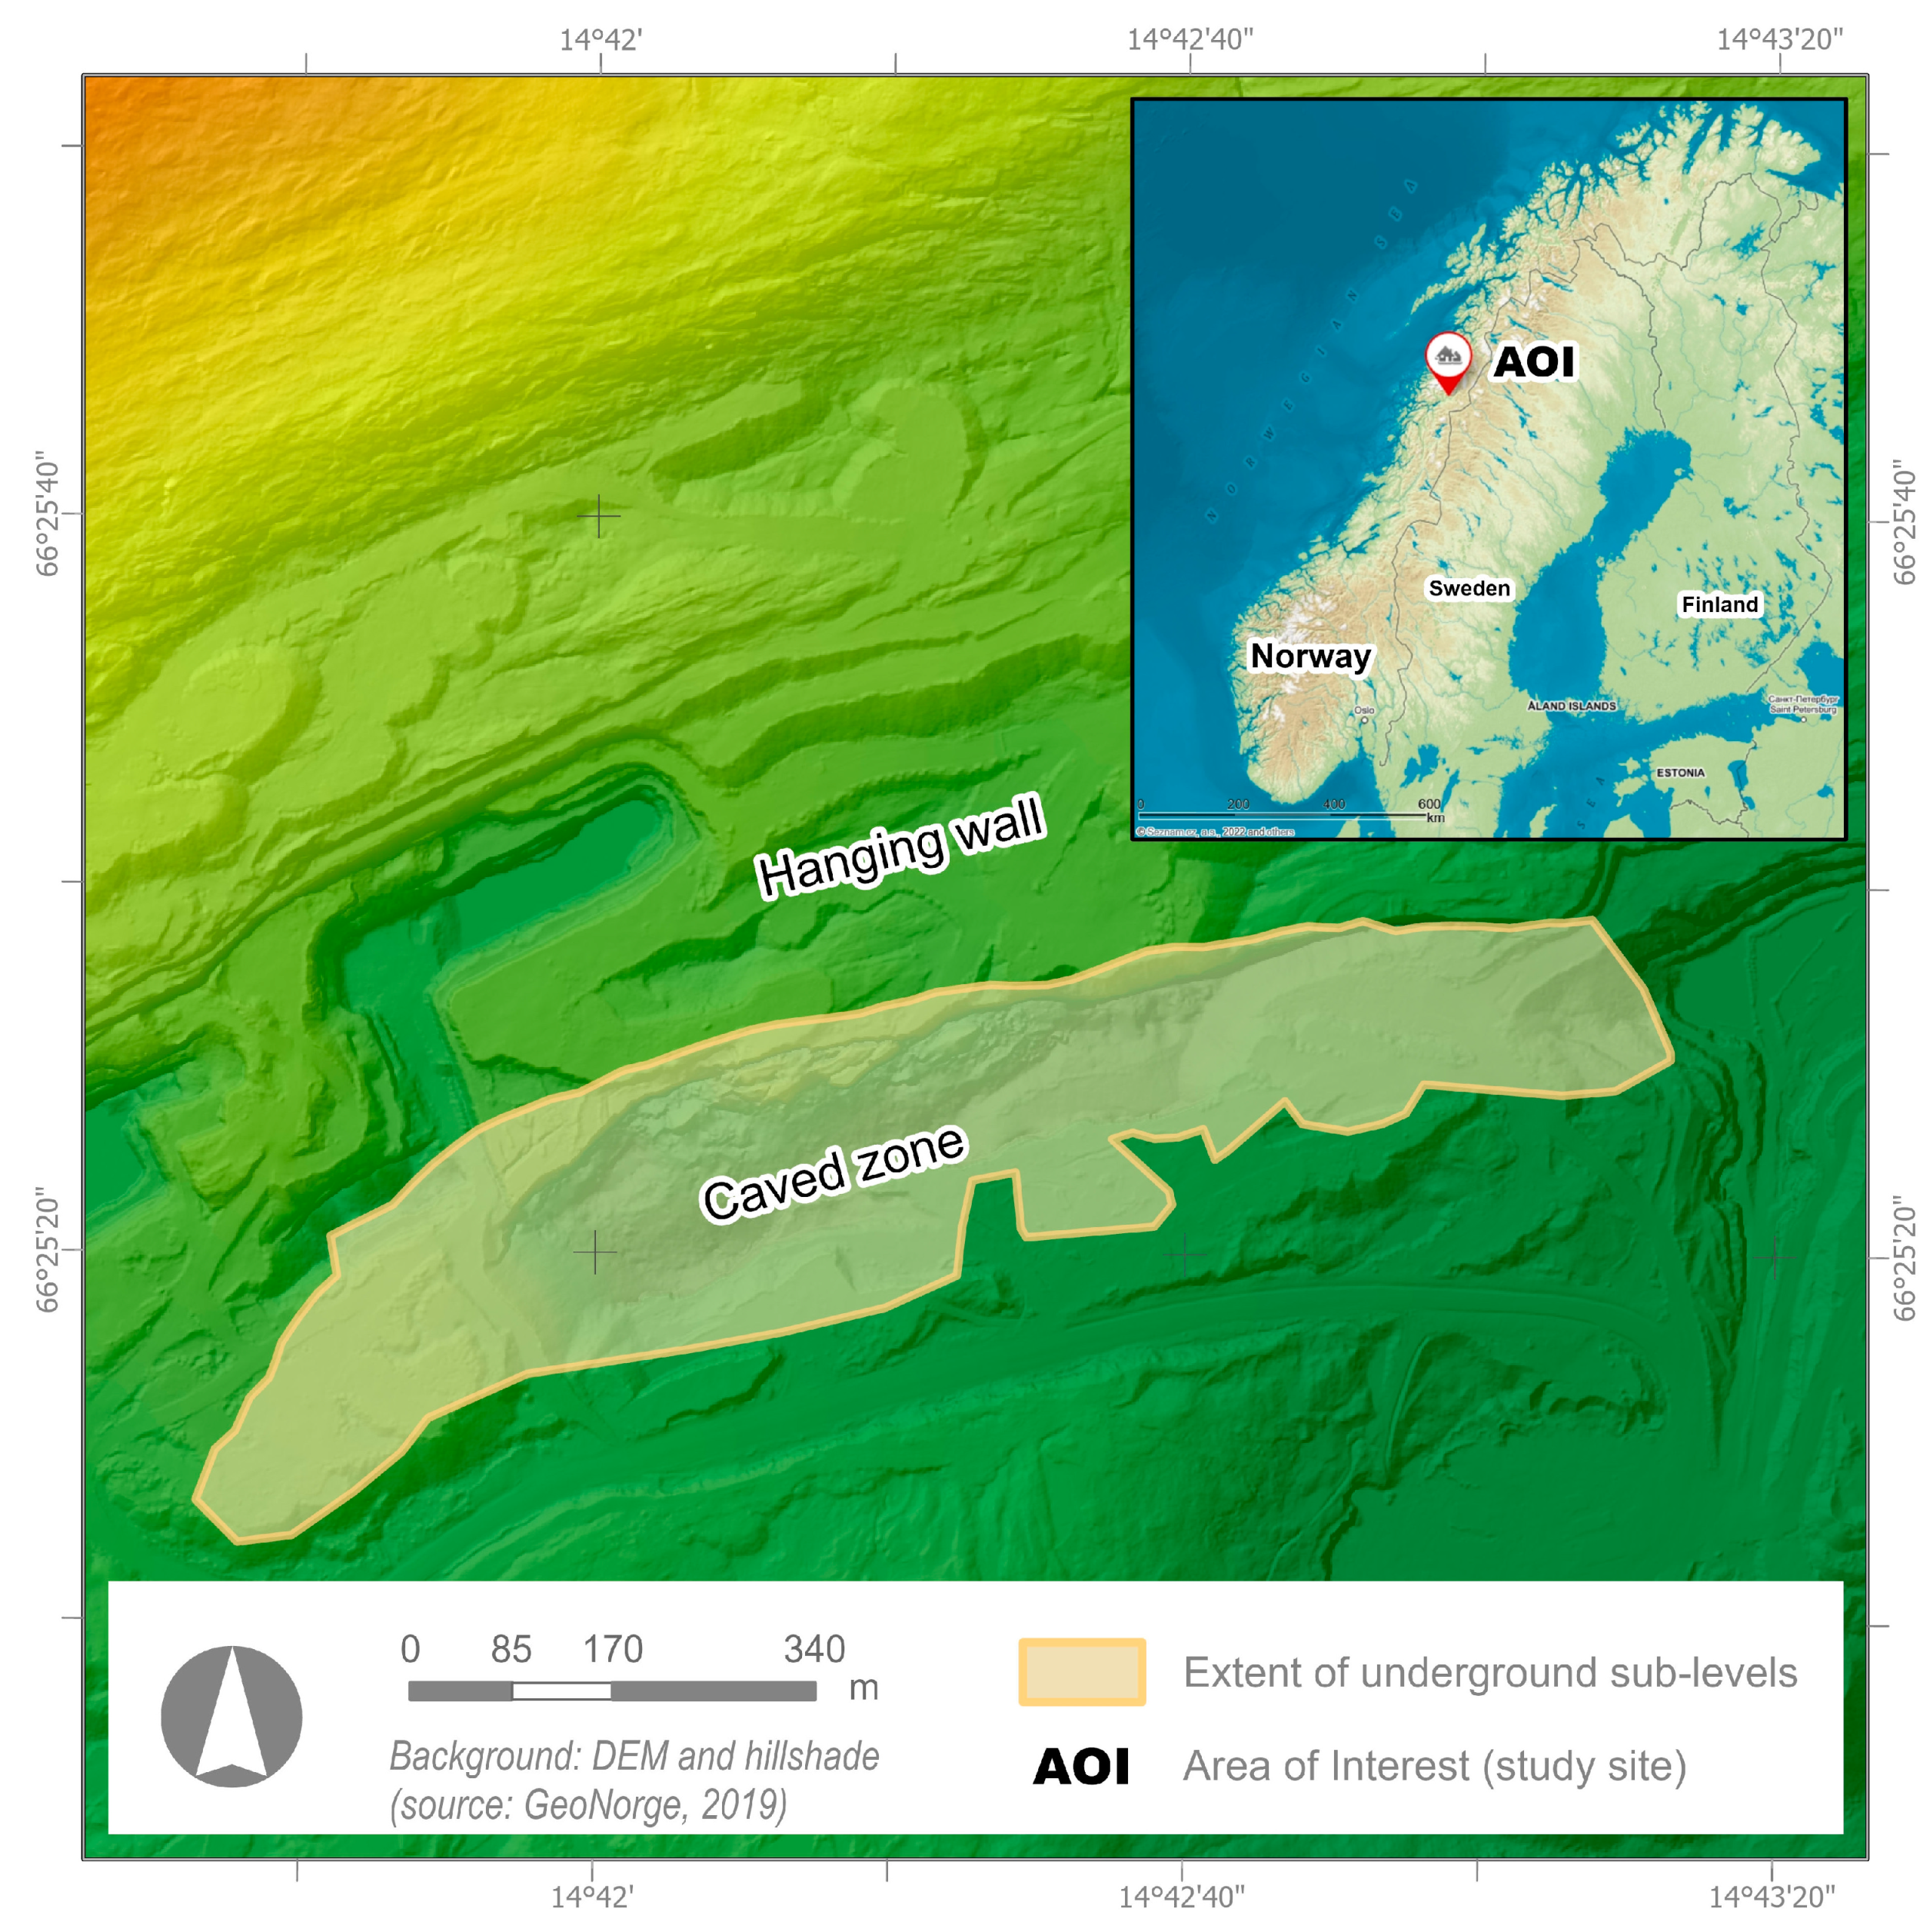
The area of interest (AOI) is the underground iron ore Kvannevann mine in Norway. The mine, located in the Dunderland Valley to the east of the town of Mo i Rana, is operated by the mining company Rana Gruber AS. The approximate location of the AOI is shown in
Figure 2 (insert map). Since 2010, the company has used the sublevel caving method to mine the orebody that dips 80–85° to the north, is 30 to 100 m wide and 1250 m long and has been proven to be more than 600 m deep [
11]. The sublevel caving method replaced previously used sublevel stoping due to its higher production capacity. The sublevel stoping mining started at levels 320 and 250 m above sea level (a.s.l.) in the early 21st century, and the sublevel caving operation continued on four sublevels located at 221, 187, 155 and 123 m a.s.l. In 2020, underground operations on level 123 m began and continued in 2021, together with activities on level 155 m. The company intends to open the next sublevel at 91 m a.s.l. During production, the ore within each sublevel is drilled in a fan-shaped design at a constant horizontal distance along the drilling/production drift. The ore is blasted, slice by slice, from the hanging-wall side to the footwall side in a retreating manner. The general extent of underground sublevels and production drifts and the digital elevation model (DEM) of the terrain are presented in
Figure 2. The underground operation stretches for approx. 1250 m from SW to NE and borders an abandoned open pit to the west and an active open pit to the east. The topography with the approximate location of the caved zone and the hanging-wall side of the mining operation is shown in
Figure 3. There are also two small abandoned open pits in the NW part of the hanging-wall side and old waste dumps in its NE part. The bottom of the caved zone is situated at approx. 350 m a.s.l. and the edge of the hanging wall is located at approx. 450 m a.s.l. The terrain elevation increases northwards from the caved zone at a ratio of approx. 1:5. The mine has started to dump waste rock in the eastern part of the caved zone.
The current surface monitoring of the hanging wall is limited to unmanned aerial vehicle (UAV) photogrammetric measurements aimed at the detection of cracks in the fracture zone that are performed once a year. The mine reports deformations in the hanging-wall side of the operation, as in the case of other deposits located under a mountain slope and mined with the sublevel caving method.
3. Materials and Methods
The analysis of the continuous deformation zone on the hanging-wall side is based on the publicly available PSInSAR data and GIS spatial interpolation methods. The main methodological steps in the study included: (1) pre-processing of published PSInSAR data, (2) exploratory data analysis, (3) spatial interpolation of discrete, point, and LOS data, (4) mapping extent of deformation zone, (5) comparative and statistical analysis of results.
The terrain motion data used in our study are published as a web service available at
https://insar.ngu.no/ (accessed on 3 June 2022) [
20]. The service was developed by the Geological Survey of Norway (NGU), The Norwegian Water Resources and Energy Directorate (NVE), the Norwegian Space Centre and Norce Research Institute. It allows users to view and download data for a specific location or area indicated by a polygon. Up to 50,000 points can be downloaded in a single operation. The web service provides information on LOS ground movements calculated from data acquired using the two Sentinel-1 satellites of the EU Copernicus program for earth observation (from 23 December 2021: due to Sentinel-1B malfunction, only one is available [
21]). The LOS movements are determined using the PSInSAR technique. The PSInSAR approach is based on persistent scatterers (PS), which are characterized by a greater strength of backscattering of the electromagnetic signal than other objects. This means that PS reflect most of the signal emitted by the radar back to the antenna, and thus is more stable and easier to identify in the analysed time series. The selection of persistent scatterers is made based on the dispersion of amplitude [
22] or based on temporal analysis of the coherence coefficient, an estimation of the phase noise value for each candidate pixel in every interferogram [
23]. The PSInSAR method allows for a significant reduction in atmospheric delays and errors associated with temporal and geometric decorrelation of the signal due to the large number of satellite images used in calculations. This enables the determination of LOS displacements in the order of millimetres separately for each PS point [
24]. The fundamentals of this technique have been described in [
22,
23,
25].
The online service is updated annually. The currently available data cover the period until October 2021 and are limited to the June to October season each year to avoid problems caused by snow cover [
21].
Ground motion data from two ascending tracks, A102 and A175, were used. Processing data for two ascending or two descending tracks allows one to check the quality of a signal in the data, i.e., check if the LOS movement is observed in both tracks. The available data covered the period from 3 June 2016 to 11 October 2021 and were downloaded for the area given by longitudes 14.672 E–14.733 E and latitudes 66.417 N–66.430 N. The spatial extent selected is more than double the distance away from the mine operation on the hanging wall, given by the lower limit angle of 40 degrees stated in studies reported in [
9]. The lower the angle, the greater the distance of the continuous deformation zone.
The registered LOS movement analysed in this study is relative to the initial observation from 2016-06-03. The basic metadata describing the datasets are given in
Table 1.
3.1. PSInSAR Data Pre-Processing
The dataset preparation involved selecting the AOI on the web service’s interactive map and downloading the automatically generated file containing the PS points located in the selected area. The procedure was repeated for two tracks. Each file in the .csv format was populated with rows describing the coordinates of PS points in the WGS-84 coordinate system, metadata of the InSAR data acquisition and PSInSAR processing, as well as LOS movements for each satellite observation until October 2021. The downloaded data were converted into point feature classes stored in a file geodatabase. The point data were spatially limited to the hanging-wall side of the mining operation and locations associated with surface activity (access road construction, waste rock dumping) were removed from the datasets.
The ArcGIS Pro 2.8 software licensed to Wroclaw University of Science and Technology was used for pre-processing, as well as for data interpolation and deformation zone mapping. Additional exploratory data analysis and calculation of experimental variograms were performed using the Isatis software licensed to the Norwegian University of Science and Technology.
3.2. Spatial Interpolation
The LOS ground movement observations can be thought of as realisations of a regionalised variable. Details on the regionalised variable theory can be found in the general literature on geostatistics, e.g., [
26,
27]. To infer the spatial characteristics of this variable, we applied a set of spatial interpolation methods that can be classified in several ways. A common approach is to group them into deterministic (non-geostatistical) and stochastic (geostatistical) methods. Deterministic interpolators create surfaces from sample points using mathematical functions based on either the extent of similarity (inverse distance weighted—IDW) or the degree of smoothing (radial basis functions—RBF). Geostatistical interpolators (kriging) utilize the statistical properties of the sample points by quantifying the spatial autocorrelation among sampling points and accounting for the spatial configuration of the sampling points around the prediction location [
28]. A review of spatial interpolation methods in environmental sciences based on a comparative analysis of 53 studies has been published by [
29].
The main applications of interpolation methods applied to InSAR, GNSS, levelling, bathymetric or digitised cartographic data include DEM construction [
30,
31,
32], DEM of difference calculation [
33], subsidence mapping in underground coal [
34,
35] and underground salt [
36,
37] mining areas, building deformation [
38,
39], subsidence due to groundwater abstraction [
40] and mapping continuous fields of vertical movement rates due to tectonic [
41,
42] and volcanic activity [
43]. A review of published studies revealed that IDW, OK and RBF are the interpolation methods predominately used, with OK applied most often. More than half of the cited studies did not substantiate why the OK method was used. Two publications did not specify which kriging technique was adopted [
34,
35]. In studies that compared the performance of different interpolation methods, the kriging interpolator was only once assessed as the best. The best-fitting interpolation model was predominately chosen based on the results of cross-validation and the lowest root mean square error (RMSE) values. Only one study considered anisotropy in the data [
32].
The presented examples indicate that various interpolation methods were applied to map terrain movements related to natural (earthquake, volcanic) and anthropogenic (mining) activity. There is no universal interpolation method, and the estimation of variable values in unmeasured locations is an iterative process involving testing of a given method’s parameters and performance.
In our study, we chose three interpolation methods, two deterministic (IDW and RBF) and one stochastic (OK), to assess their applicability for mapping the extent of terrain deformation of the hanging wall in the sublevel caving mining area.
The IDW interpolation method is a deterministic (mathematical) estimator of values for unsampled locations using a linearly weighted combination of a set of sample (known) points. The weight is a function of the inverse distance between the known (sampled) and unknown (estimated) locations. Estimations assume that the similarity of values of a spatially distributed variable z decreases with distance d and power p of the distance. The general formula for IDW interpolation is given by (1) [
44]:
where
is the estimated value at unsampled location
x0,
xi is the known locations,
i = 1 to
n,
d is the distance and
p is the power parameter. The default power value is 2. The choice of this parameter and search neighbourhood size is arbitrary [
45] but an estimate will approach the nearest neighbourhood estimate with increasing power value. IDW is a local and exact interpolator that does not predict values above or below the maximum and minimum input values.
The RBF interpolation method is based on the spline approach to fit a smooth surface through the measured sample values while minimizing the curvature. There are several spline functions available for estimating the unknown values: thin plate, completely regularized, spline with tension, multiquadric, and inverse multiquadric. In our study, we used the spline with tension approach. Mathematically, the value of variable
z in an unsampled location
x0 can be expressed as the sum of two components (2) [
46]:
where
is the radial basis function,
di is the distance between the sample point and prediction point
x0,
bi is the coefficient,
n is the number of sampled locations and
T(x0) is the trend function. Details of the RBF interpolation method can be found in [
46,
47]. RBF is a local and exact interpolator and can estimate values above the maximum or below the minimum measured values [
41].
Kriging is a group of interpolation methods in which a value at an unsampled location is predicted using a linear combination of the values at surrounding locations, using weights according to a model that describes the spatial correlation (the variogram model). The geostatistical basis of kriging enables the quantification of the accuracy of the predicted values via means of variance, which is a measure of the accuracy of the interpolated values [
27,
48,
49]. Ordinary kriging (OK) is a linear weighted average method, which is unbiased to the expected value of errors. It is used to find the linear unbiased estimation of a stationary random field with an unknown but assumed constant mean and is expressed as follows (3) [
50]:
where
is the OK estimated value at unsampled location
x0,
z(xi) is the value sampled at location
xi, and
λi is the weighting factor associated with the sampled location. Further details on kriging can be found in [
27,
48,
51].
In contrast to IDW and RBF, kriging is a two-step process: first, the spatial covariance structure of the regionalised variable is determined by fitting a variogram model to the experimental variogram, and second, weights derived from this covariance structure are used to interpolate values for unsampled points in the study area. It differs from the two other applied methods in that it uses a modelled spatial correlation from sampled points. It can estimate values that exceed the min. and the max. value in the dataset.
3.3. Validation of Interpolated Surfaces
The most common validation methods for evaluating the accuracy of interpolation results are the cross-validation (CV) method and the split-sample method. The first one involves omitting a single point from the analysed dataset and performing interpolation using the remaining dataset. After the interpolation procedure, the difference between the measured and predicted values of the removed point is calculated. This procedure is repeated for all the sample points. In the second approach, the dataset is divided into two subsets, the training one and the test one. The training dataset is used to create the interpolated surface, and the performance of each method is assessed by comparing the difference between the estimated and measured values from the test dataset. The validation methods have been described, e.g., in [
29,
30,
32]. In our study, we used the CV method using the algorithm available in the ArcGIS Pro Geostatistical Analyst extension. To evaluate the overall performance of the applied interpolation methods, we used the root mean square error (RMSE) statistic [
29].
4. Results
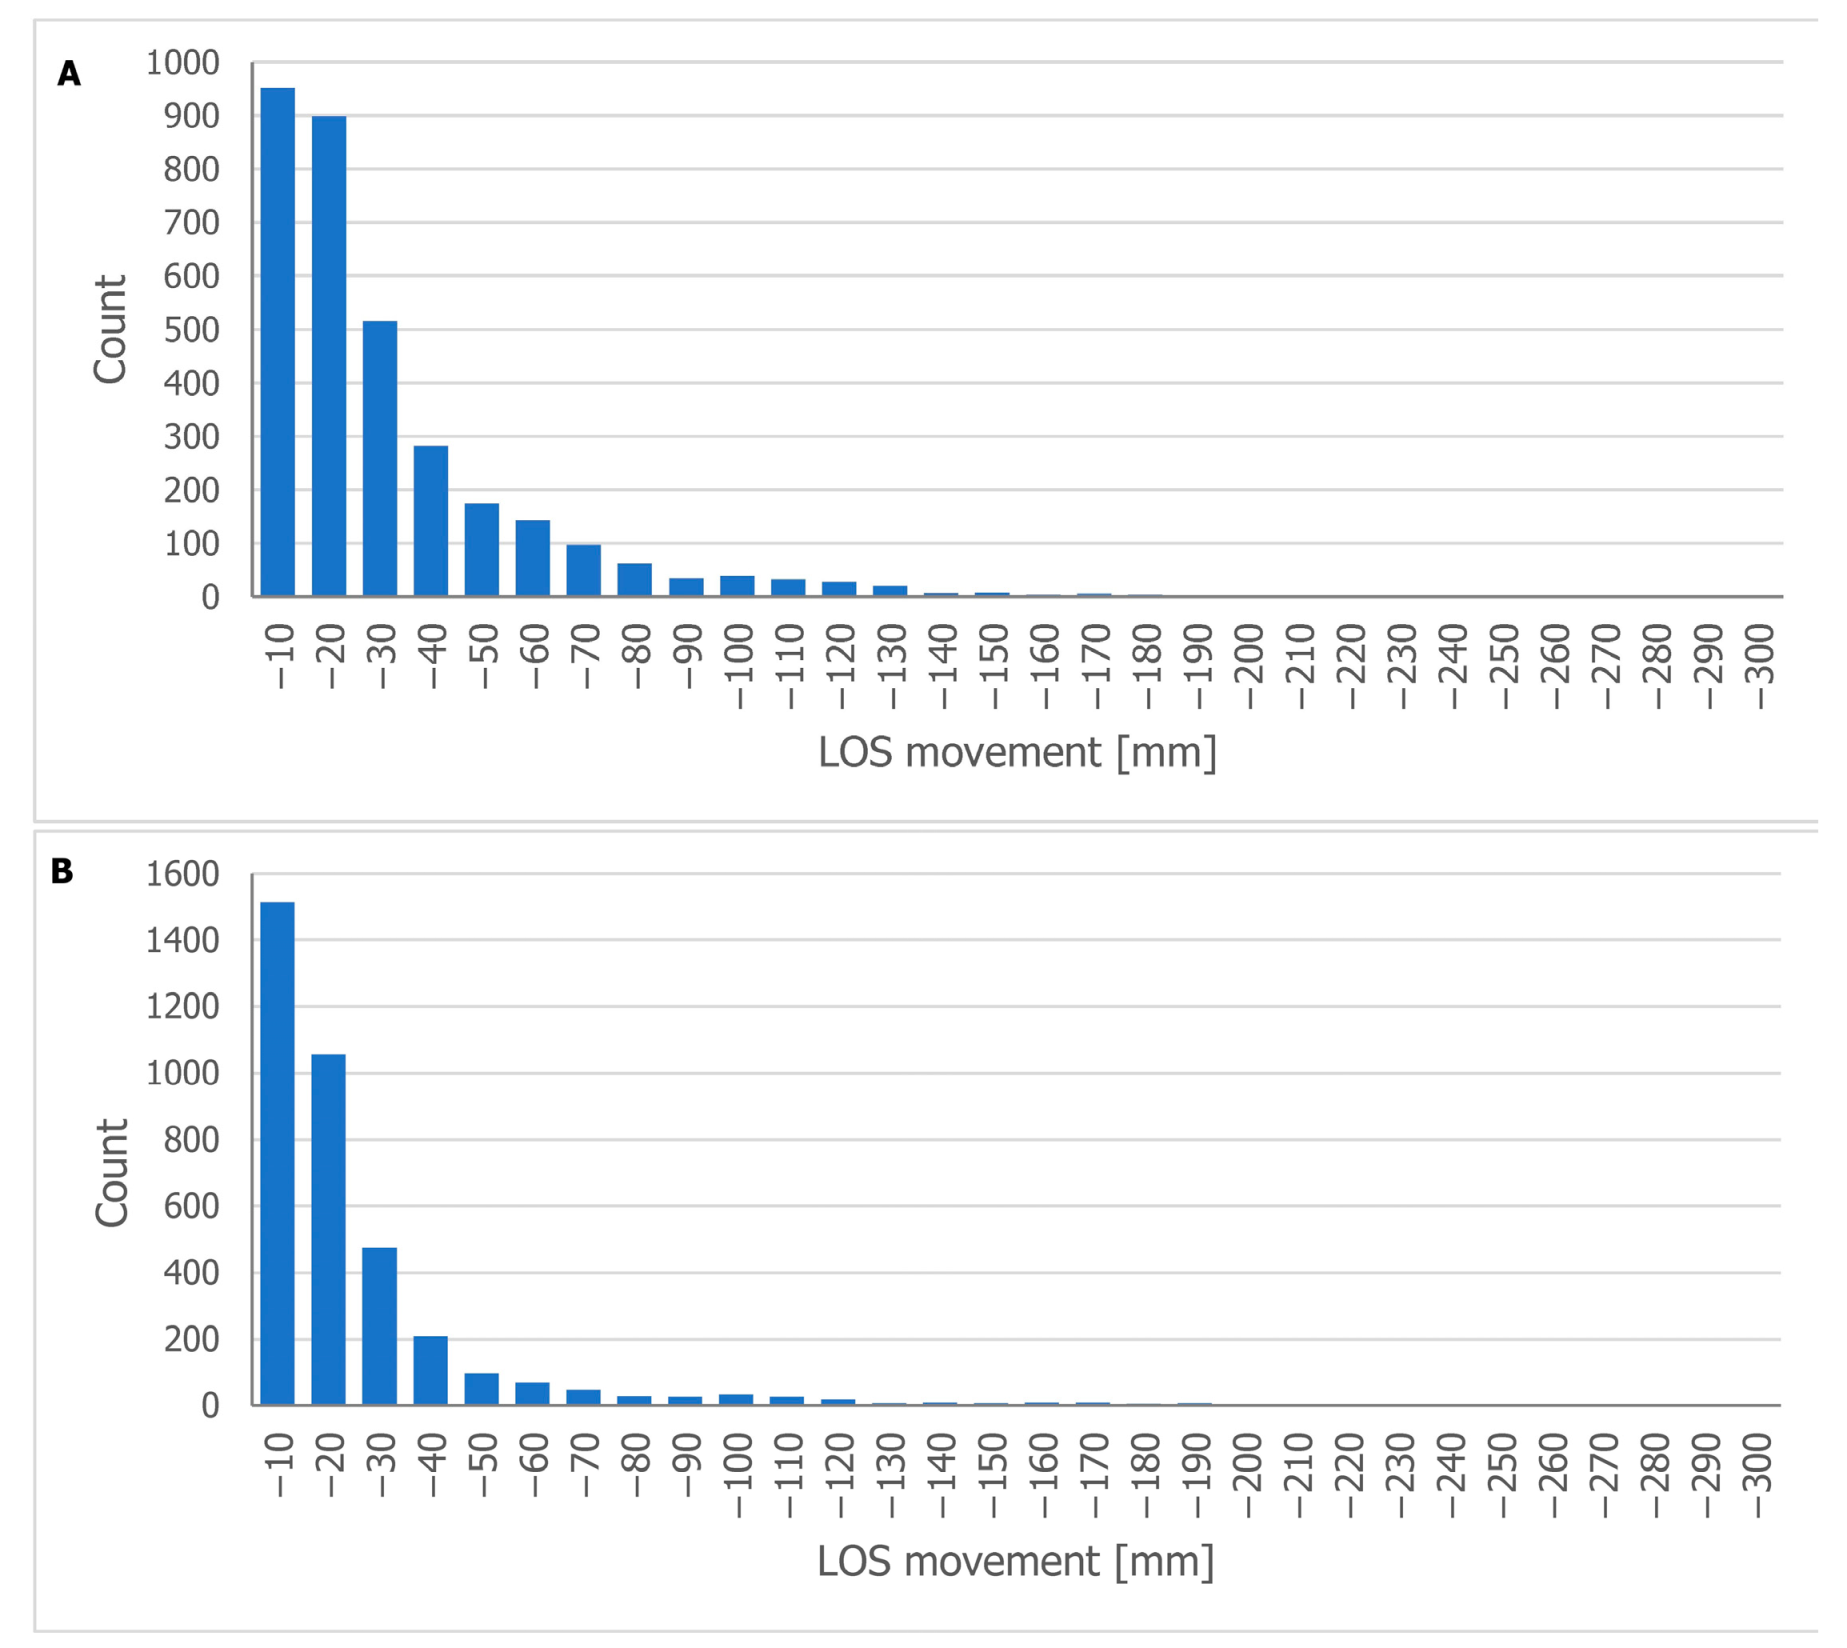
The number of PS points limited spatially to the hanging-wall side of the mining operation (north of the caved zone) and used for interpolation of deformation amounted to 2796 for the track A102 dataset and 2832 for the track A175 dataset. The spatial distribution of PS points for both tracks is presented in
Figure 4a,b, and histograms of LOS movements are presented in
Figure 5A,B. The max. registered LOS movements in the study period amounted to −299 mm for the A102 dataset and −296 mm for the A175 dataset. The highest values of LOS movements are, as expected, close to the caved zone. The spatial distribution of measured locations was influenced by the topography of the mining area, e.g., old pits in the north-west part of the hanging-wall zone which created a shadowing zone.
Different interpolation settings were tested, starting with one (circle) to eight search sectors and a minimum number of neighbours from four to twelve for each sector. We also tested models with anisotropy. The best results were obtained for interpolation models with four sectors, an azimuth of 65° E (parallel to the extent of the orebody) and with anisotropy. Following the anisotropies identified in the structural analysis (variography), the minor axis of the search neighbourhood ranged from 250 m to 300 m (perpendicular to the ore strike). The major axis of the search neighbourhood ranged from 750 m to 900 m (parallel to the mine), depending on the interpolation method. The anisotropy in the data suggests the influence of distance from the mine on the spatial variability of the dataset (decreasing values of LOS movements). The parameters used in the spatial interpolations have been presented in
Table 2.
In the IDW interpolation, we determined the power parameter value controlling the influence (weight) of sample points in the search neighbourhood based on the results of CV. The best-fitting IDW model involved four sectors, a min. number of six neighbours and a major-to-minor axis ratio of 3:1 for both tracks.
For the OK interpolation, the stable variogram model with a nugget and composite spherical and Gaussian function produced the best fit for empirical values. We used 12 lags for the A102 track dataset and 16 lags for the A175 track dataset, four search sectors for both datasets, a min. number of five neighbours for track A102 and six neighbours for track A175, as well as a major-to-minor axis ratio of 2.75:1 for both datasets.
In the RBF interpolation, we used spline with a tension kernel function and optimised the kernel parameter based on the results of CV for both tracks.
The RMSE statistics for the best-fitting interpolation models determined with the cross-validation technique are presented in
Table 3 for track A102 and in
Table 4 for track A175 datasets.
The RMSE statistics for the IDW and OK interpolation of the A102 dataset are nearly the same (a difference of 0.02). The RBF interpolation produced slightly lower RMSE statistics (by 0.10 and 0.12, respectively) (
Table 3).
In the case of the A175 dataset, we obtained the lowest RMSE statistic for RBF interpolation and the highest for IDW interpolation (
Table 4). The difference between the lowest and the highest value was 0.28. The RMSE values for this dataset were higher than for the A102, pointing to higher variability in the data.
The results of hanging-wall deformation interpolation with the three methods are presented graphically in
Figure 6A–C for the track A102 dataset and
Figure 7A–C for the track A175 dataset. We mapped out the maximum extent of the subsidence area in the hanging wall to the boundary of the continuous deformation zone. Thus, the deformation area presented in
Figure 6A–C and
Figure 7A–C combines the CDZ and the FZ (
Figure 1). To estimate the extent of continuous deformation, we used the −10 mm LOS movement as the cut-off limit [
52]. The distance of the continuous deformation zone boundary measured perpendicularly from the boundary of underground mining sublevels is given in
Table 3 for the track A102 dataset and
Table 4 for the track A175 dataset. In the analysed period (until October 2021), the maximum calculated extent of terrain deformation for the A102 dataset ranges from 637 m to 663.0 m away from the mine for the IDW and RBF methods, respectively. The minimum extent is 390.0 m to 404.5 m, depending on the method.
In the case of the A175 dataset, the maximum calculated extent of subsidence area in the hanging wall is lower than in the first dataset, ranging from 572.0 m to 623.5 m away from the mine for the IDW and OK methods, respectively. The minimum extent is also lower, ranging from 354.5 m to 397.0 m away from the mine for RBF and IDW methods, respectively. The general shape of the continuous deformation zone boundary is similar for both datasets with local fluctuations between the methods. The extent of the deformation zone is related to the section of the underground operation that spans over 1250 m. It is lower in the eastern part, which may be attributed to the sequence of mining that goes from west to east.
The maximum extent of terrain deformation calculated for the A102 dataset is up to 10% greater for the A175 dataset. The total area of deformation ranges from 735,326 m sq (OK interpolation, A175 dataset) to 821,720.5 m sq (IDW interpolation, A102 dataset).
Figure 8 represents the minimum and maximum zones of terrain deformation in the hanging wall for the A102 dataset (left) and the A175 dataset (right). The minimum zone was calculated as a geometrical intersection of the deformation surfaces interpolated with IDW, OK and RBF methods. The maximum zone was calculated as a geometrical union of the deformation surfaces interpolated with IDW, OK and RBF methods. For the A102 dataset, the maximum area is larger by 11.3% (85,165.5 m sq) than the minimum one, and for the A175 dataset, it is larger by 6.2% (42,052 m sq).
5. Discussion
In this section, we will comment on the following aspects of this study: the performance of applied interpolation methods, the shape and area of the deformation zone and the applicability of LOS movements derived from a public ground motion online service for the analysis of mining terrain deformations.
In our study, the RBF interpolation approach produced the lowest RMSE values and the smoothest surfaces. The OK interpolation produced the second-lowest value for this statistic. One of the advantages of RBF interpolation is its flexibility within the single radial basis function, as opposed to the often-subjective selection of a suitable variogram in kriging [
30]. Both methods have been selected the most often for mapping terrain deformation due to underground (usually coal) mining in the reviewed publications [
33,
34,
35]. Based on a review of over 50 environmental studies, [
29] found that, among factors such as sampling, spatial distribution and design, data variation is the dominant factor and has significant effects on the performance of interpolation methods. They did not find evidence of the effects of sampling density on the performance of the spatial interpolation methods. In our case, the sampling distribution was irregular and affected by topography and PSInSAR technique characteristics. The spatial interpolation approach allowed the development of a continuous subsidence surface from the discrete and irregularly spaced dataset (
Figure 4) and accounted for unsampled locations.
It is clear from the results of our study that the choice of interpolation method influences the extent and shape of the estimated deformation zone. The differences in results obtained with various methods reach 10%. Therefore, apart from analysis of interpolation methods performance, e.g., RMSE statistic values, knowledge about the modelled variable (process) is important. An alternative to the presented approach could be based on the tessellation of the surface into regular elementary polygon units, calculating statistics (mean LOS movement values) for units spatially congruent with PS points and applying the areal interpolation method [
51].
The calculated limit (subsidence) angle for the maximum extent of deformation in our study ranges from 38.7 to 41.0 degrees (
Figure 9). Whereas values ranging from 40 to 78 degrees based on a review of 49 sublevel caving operations worldwide have been reported by [
9]. The values in the low range can be attributed to the site-specific characteristics (varied and sloping topography and overhang), as well as the period of observations available (June 2016–October 2021). However, it may also indicate that the extent of the continuous deformation is greater than previously thought due to a limited number of observations performed with traditional geodetic techniques.
The varying extent of the deformation zone parallel to the production levels in the hanging wall can be attributed to the topography as well as the sequence of mining in the analysed period. The data on the blasting sequence was not available from the mine. Additionally, the shape of the deformation boundary in the north-easternmost part could be attributed to human activities on the surface.
We used two full PSInSAR datasets that provided us with the possibility to check the quality of the data. We observed the same trend of movement in both ascending tracks. This is a good indication that the observed LOS movements are correct and do not represent noise in the data.
Satellite InSAR data have been applied in numerous studies of mining-related terrain deformation [
33,
36,
52]. These studies involved specialised processing of InSAR data by the authors. To the best of our knowledge, so far, no research has been published that was based on calculated LOS movement data that are openly available from national services, e.g., Norwegian InSAR Service [
20] or German Ground Motion Service [
53]. Furthermore, the number of studies utilising satellite radar interferometry in sublevel caving mining monitoring is rare [
14,
16]. This can be attributed to the character of the terrain deformation induced by sublevel caving mining, e.g., sudden ground movements and fractures, as well as altered topography of mines. These factors limit the applicability of InSAR for caved and fracture zone monitoring as ground movements may exceed the InSAR wavelength, the caved area may be in a shadowed zone (inaccessible to the SAR signal) and observation of horizontal movements requires decomposition of the LOS movement into vertical and horizontal components. The methodology of the latter does not provide satisfactory results for N–S movement and requires both ascending and descending track data [
54]. Another setting related to the location of our AOI, which is a potential limitation, is the half-year observation time due to snow cover in the winter period.
The publicly available InSAR LOS movement data proved to be useful for estimating the extent of the continuous deformation zone without the need to carry out or commission repeated field (Total Station, GNSS) or airborne (UAV) surveys. This enabled the analysis of the progress of the deformation zone in time for the mine operation control, as well as the identification of zones that might require detailed monitoring without the need for specialist InSAR data processing knowledge and the necessary software. It should be noted that the mine does not carry out repeated geodetic monitoring of the hanging-wall zone.
6. Conclusions
In conclusion, the method proposed in this study, based on a publicly available web service for InSAR LOS movements and GIS spatial interpolation, allowed us to estimate the maximum extent of the continuous deformation zone in the hanging wall of a sublevel caving mining operation located under a mountain slope without the need for repeated field measurements. Among the tested spatial interpolators, the RBF produced the lowest RMSE values.
The estimated limit (subsidence) angle is lower than reported in known literature. A low limit angle translates into a larger extent of continuous deformation zone and greater influence of underground mining operations on the surroundings. This is important for operations in developed and inhabited areas that may be affected by the mining and calls for attention to monitoring the entire deformation zone.
The results of our study show the usefulness of the proliferating public satellite InSAR data web services for the continuous monitoring of mining terrain deformation without the need for expert InSAR processing skills and software. The proposed approach has potential as a low-cost augmentation of standard deformation surveys in the mines as well as backup (historical analysis) in case monitoring data becomes unavailable.


