Author Contributions
M.D.O.: conceptualisation, methodology, validation, formal analysis, investigation, data interpretation, writing—original draft, writing—review and editing, and visualisation; M.A.F.-E.: conceptualisation, methodology, resources, data interpretation, writing—review and editing, supervision, and project administration; S.T.L.H.: conceptualisation, methodology, resources, data interpretation, writing—review and editing, supervision, project administration, and funding acquisition. All authors have read and agreed to the published version of the manuscript.
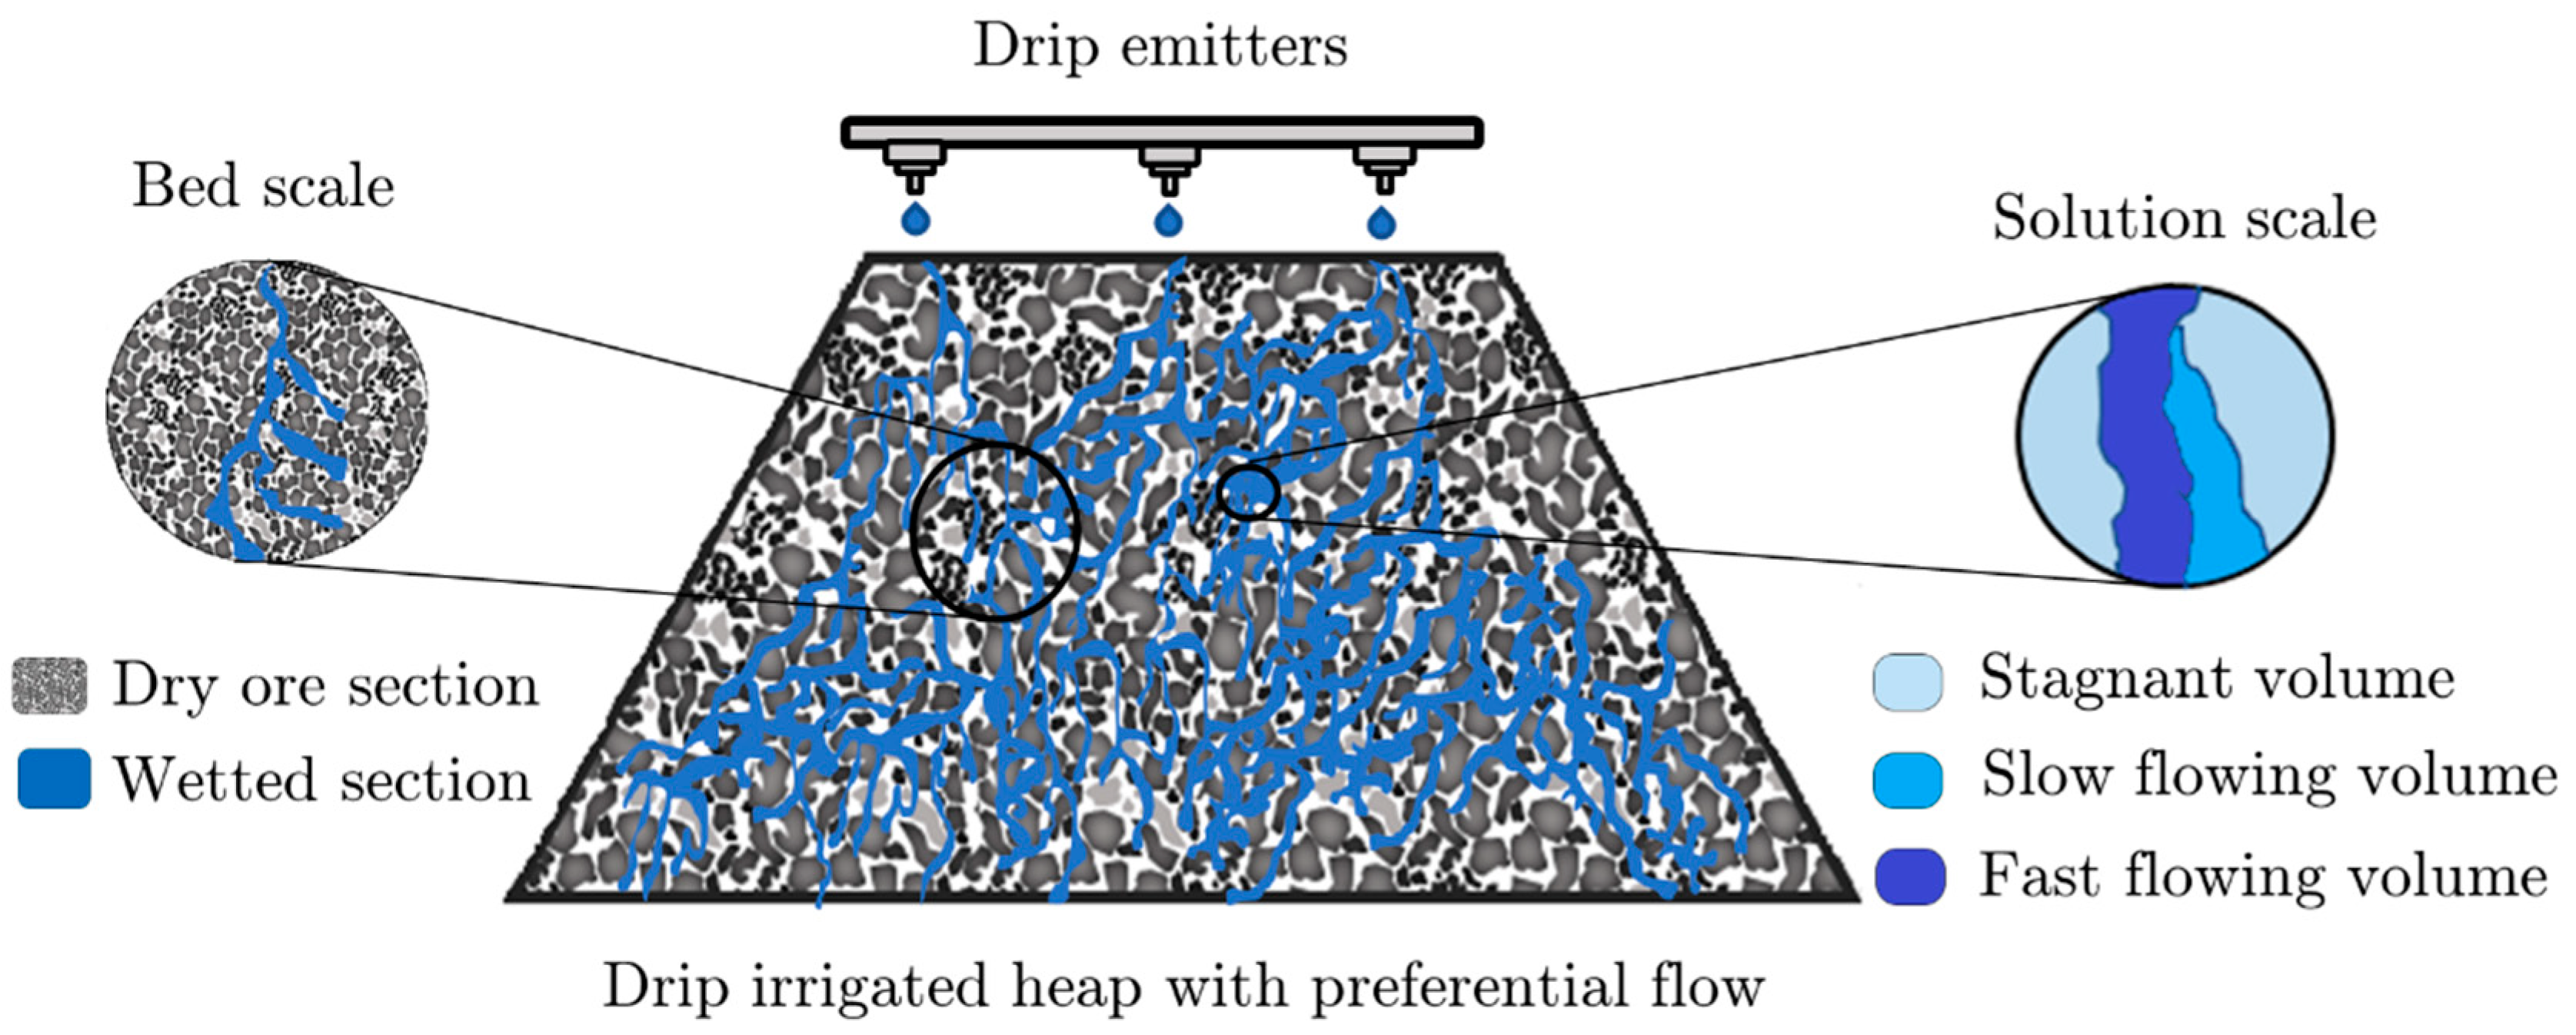
Figure 1.
Preferential flow depiction on two scales in a drip-irrigated heap.
Figure 1.
Preferential flow depiction on two scales in a drip-irrigated heap.
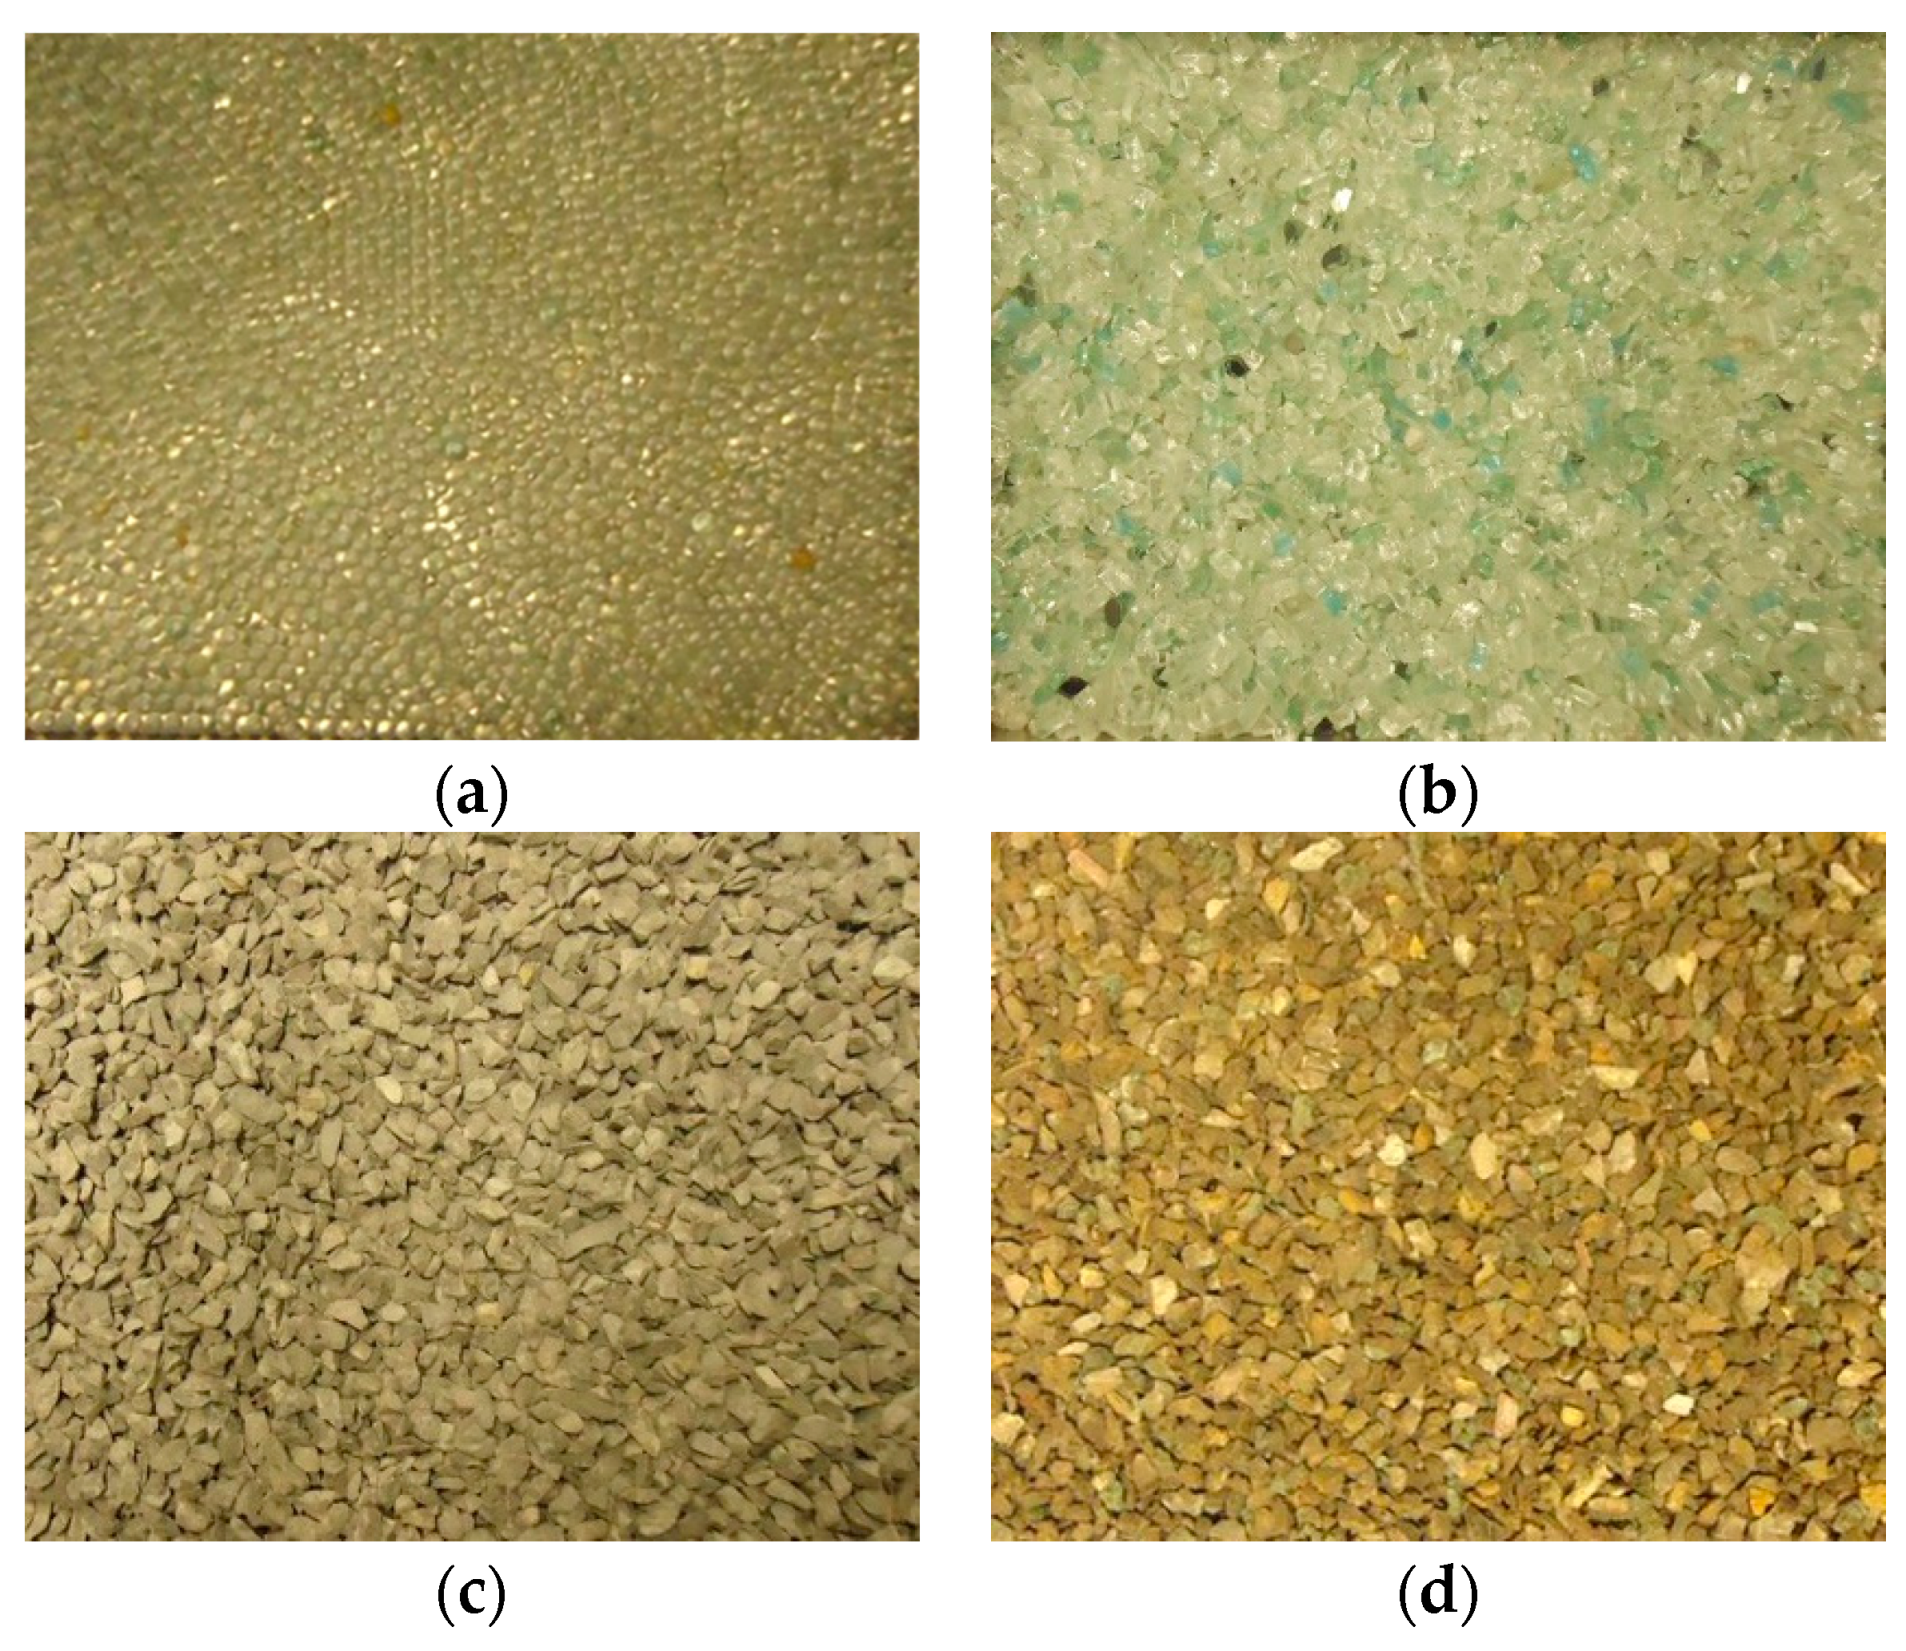
Figure 2.
Photographs of the different packing materials: (a) glass beads (GB: 2 mm), (b) glass shards (GS: 4.8–5.6 mm), (c) greywacke (GW: 4.8–5.6 mm), and (d) malachite ore (MO: 4.8–5.6 mm).
Figure 2.
Photographs of the different packing materials: (a) glass beads (GB: 2 mm), (b) glass shards (GS: 4.8–5.6 mm), (c) greywacke (GW: 4.8–5.6 mm), and (d) malachite ore (MO: 4.8–5.6 mm).
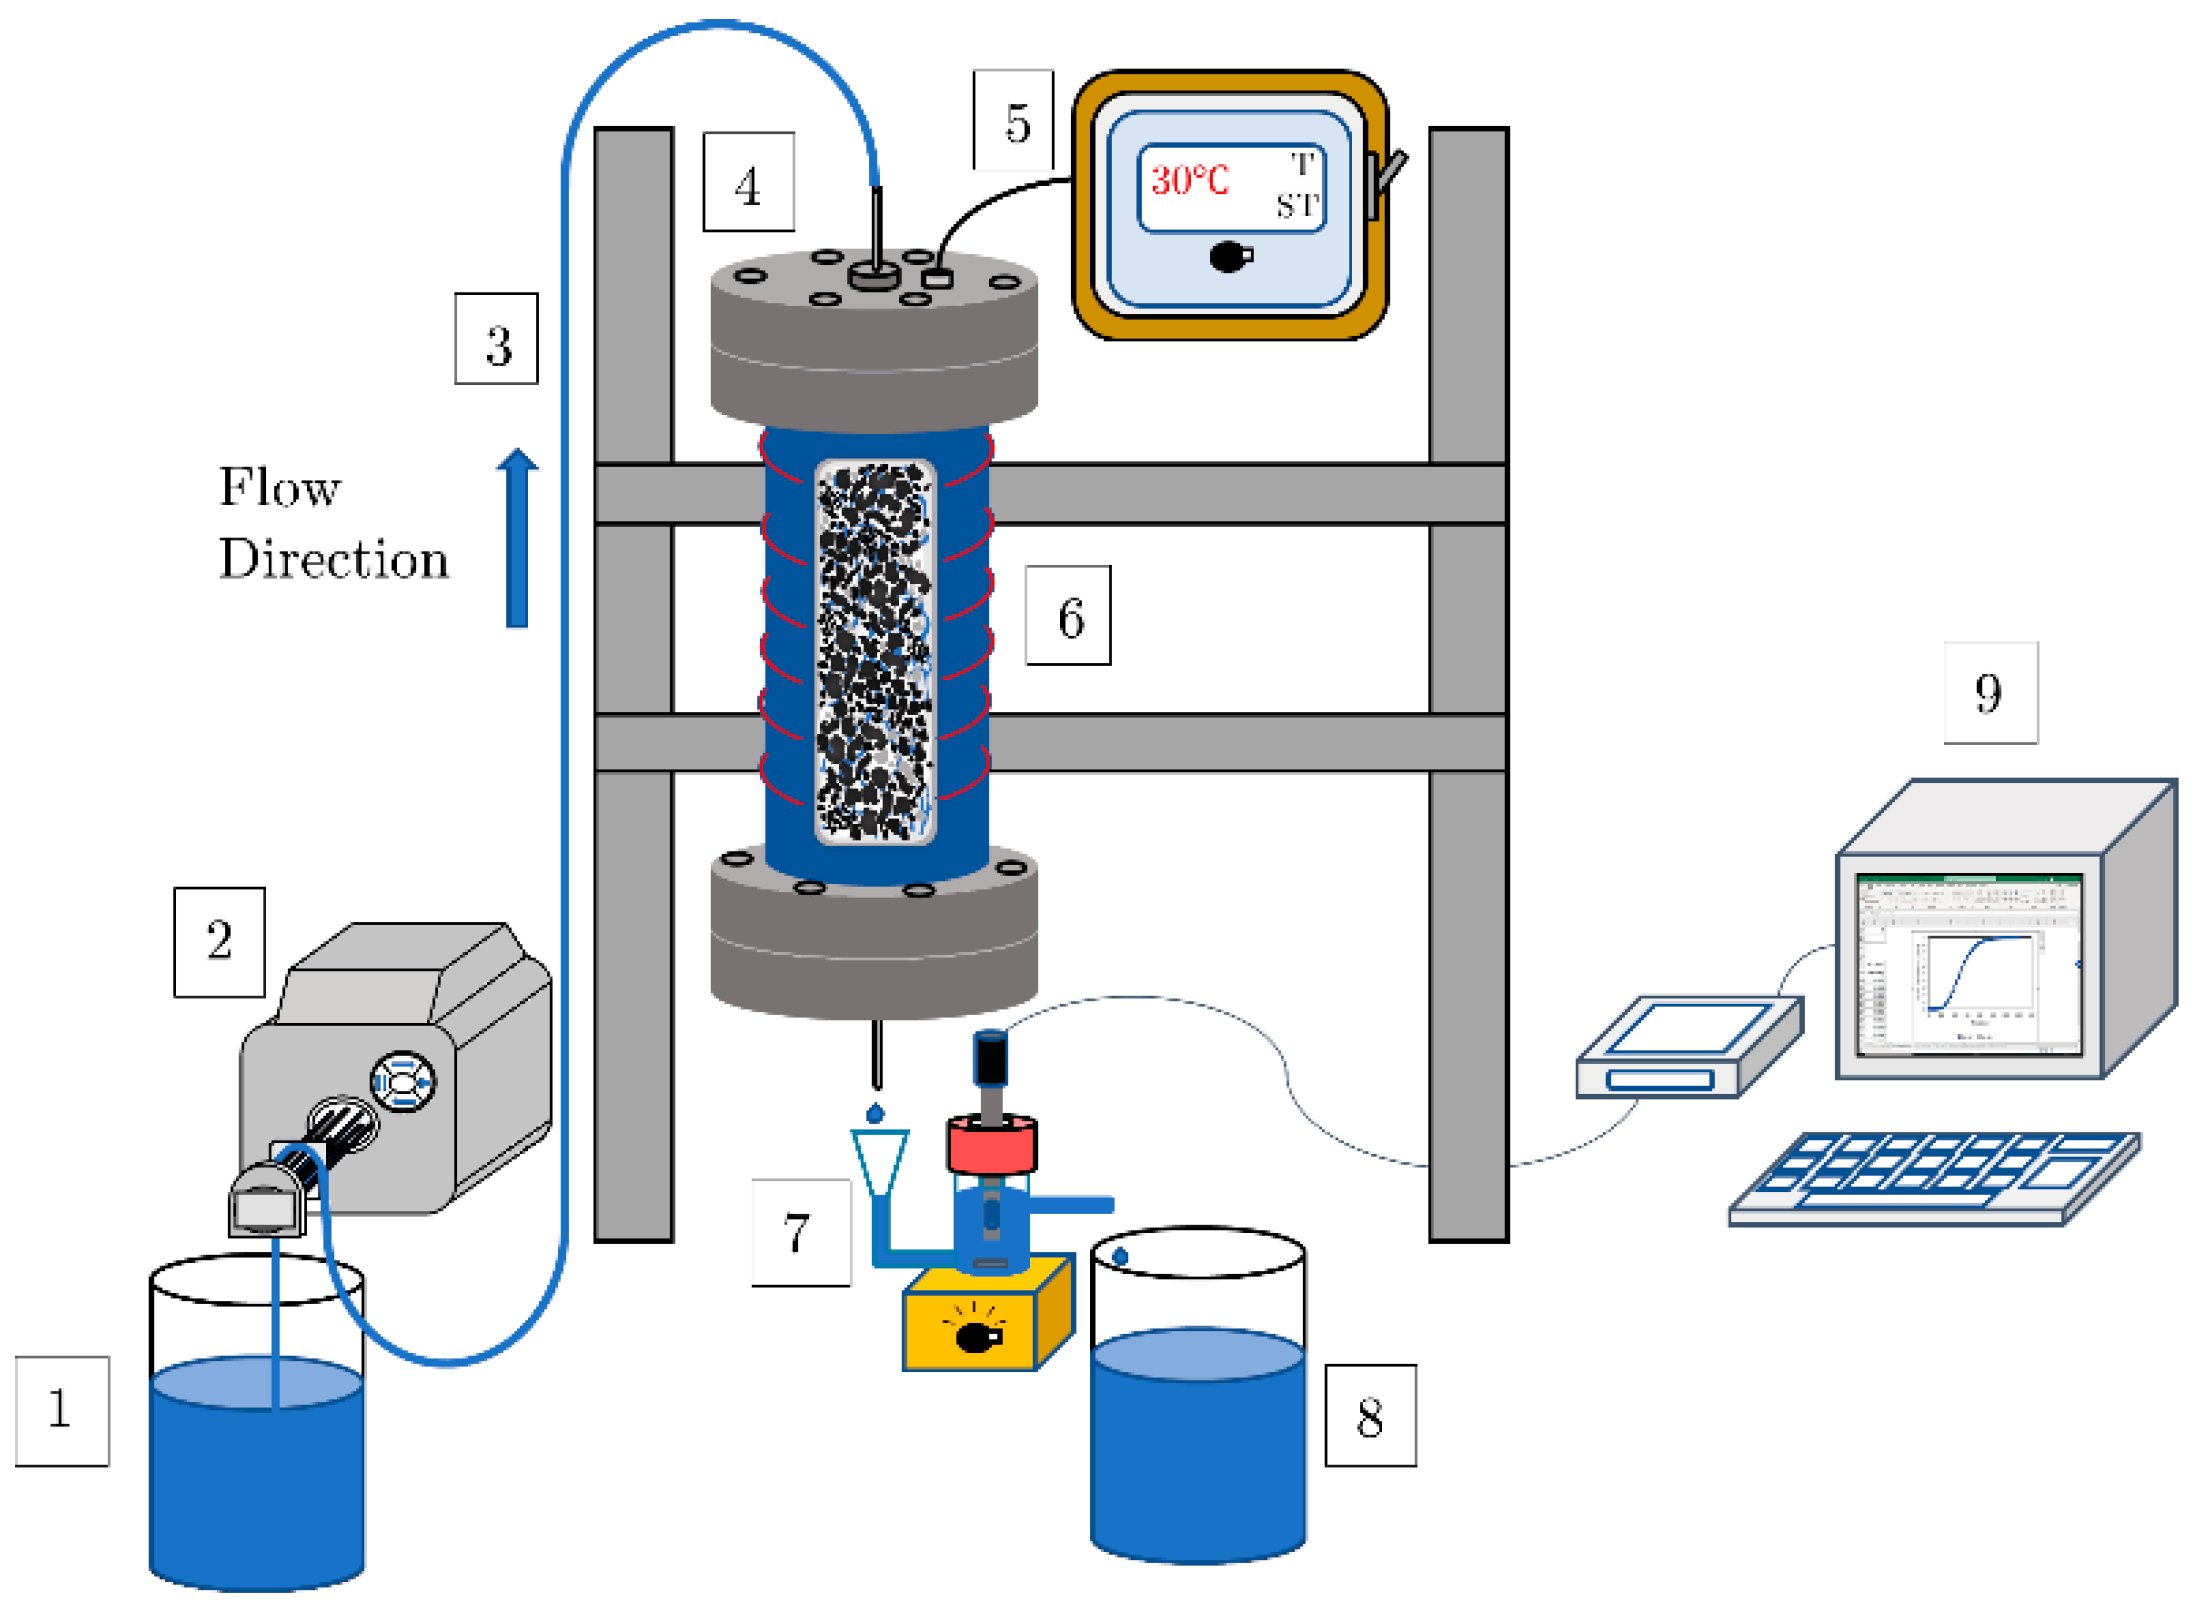
Figure 3.
Illustration of the experimental set-up used to conduct tracer tests on the packing materials. It consisted of a (1) 20 L feed tank, (2) peristaltic pump, (3) tubing, (4) cylindrical test column, (5) temperature control unit, (6) heating coils, (7) conductivity measurement cell, (8) 20 L effluent tank, and (9) a desktop computer with data logging software (Graphical Analysis 4).
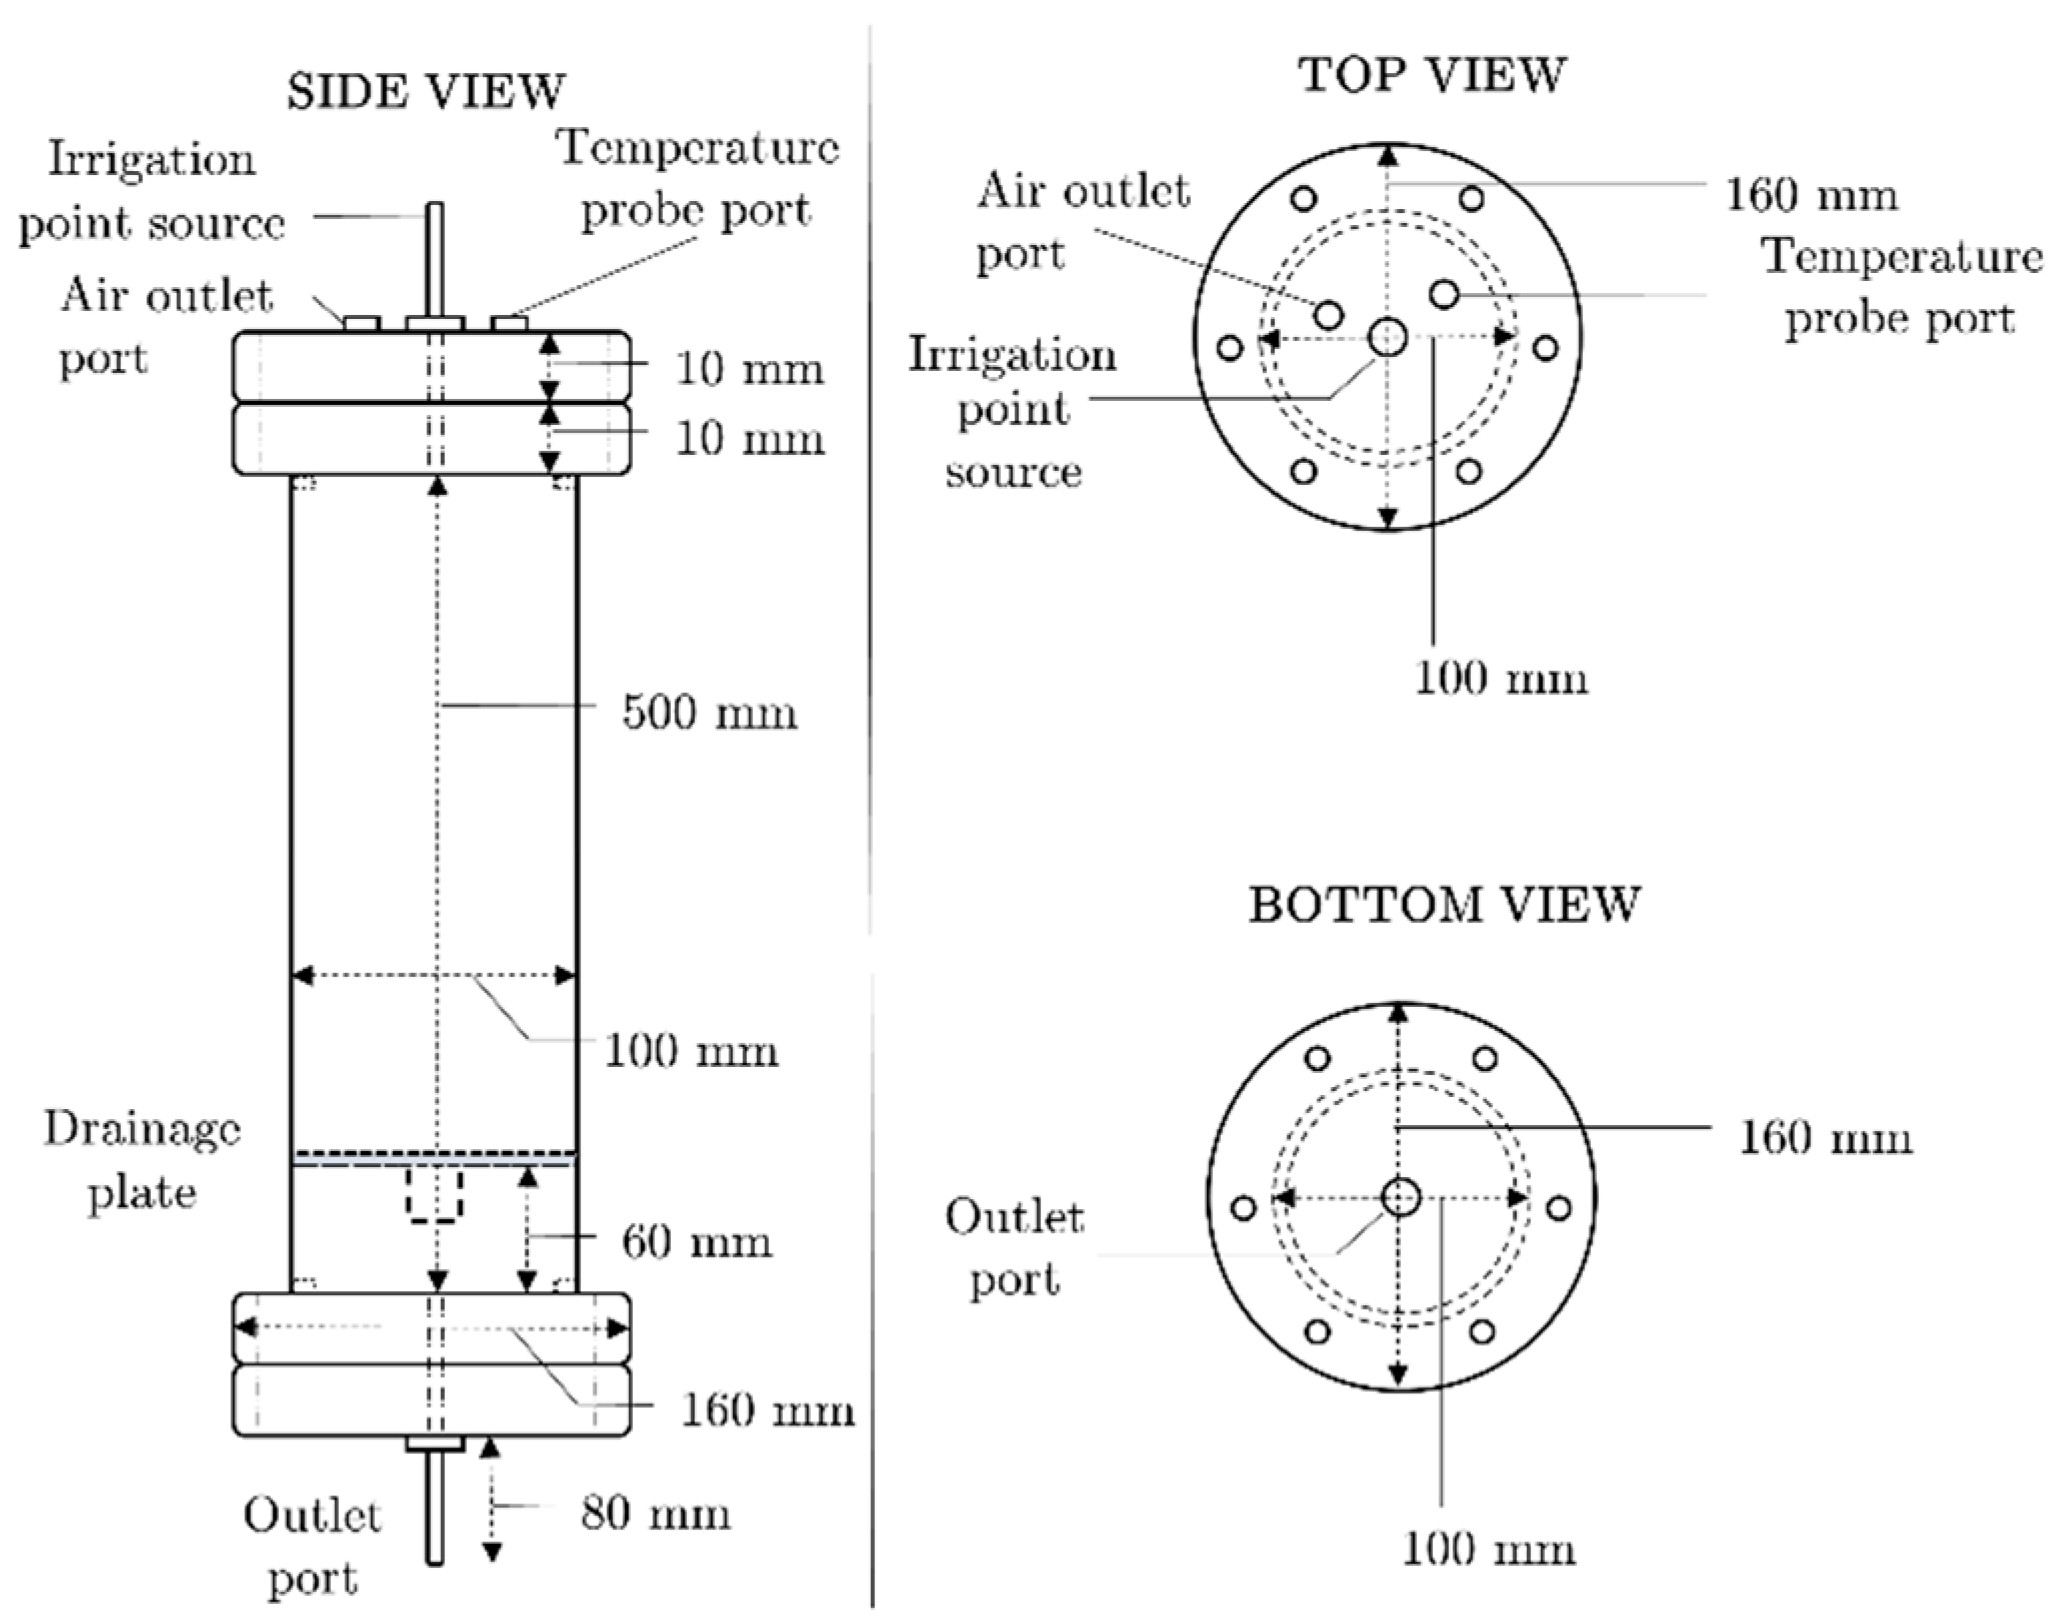
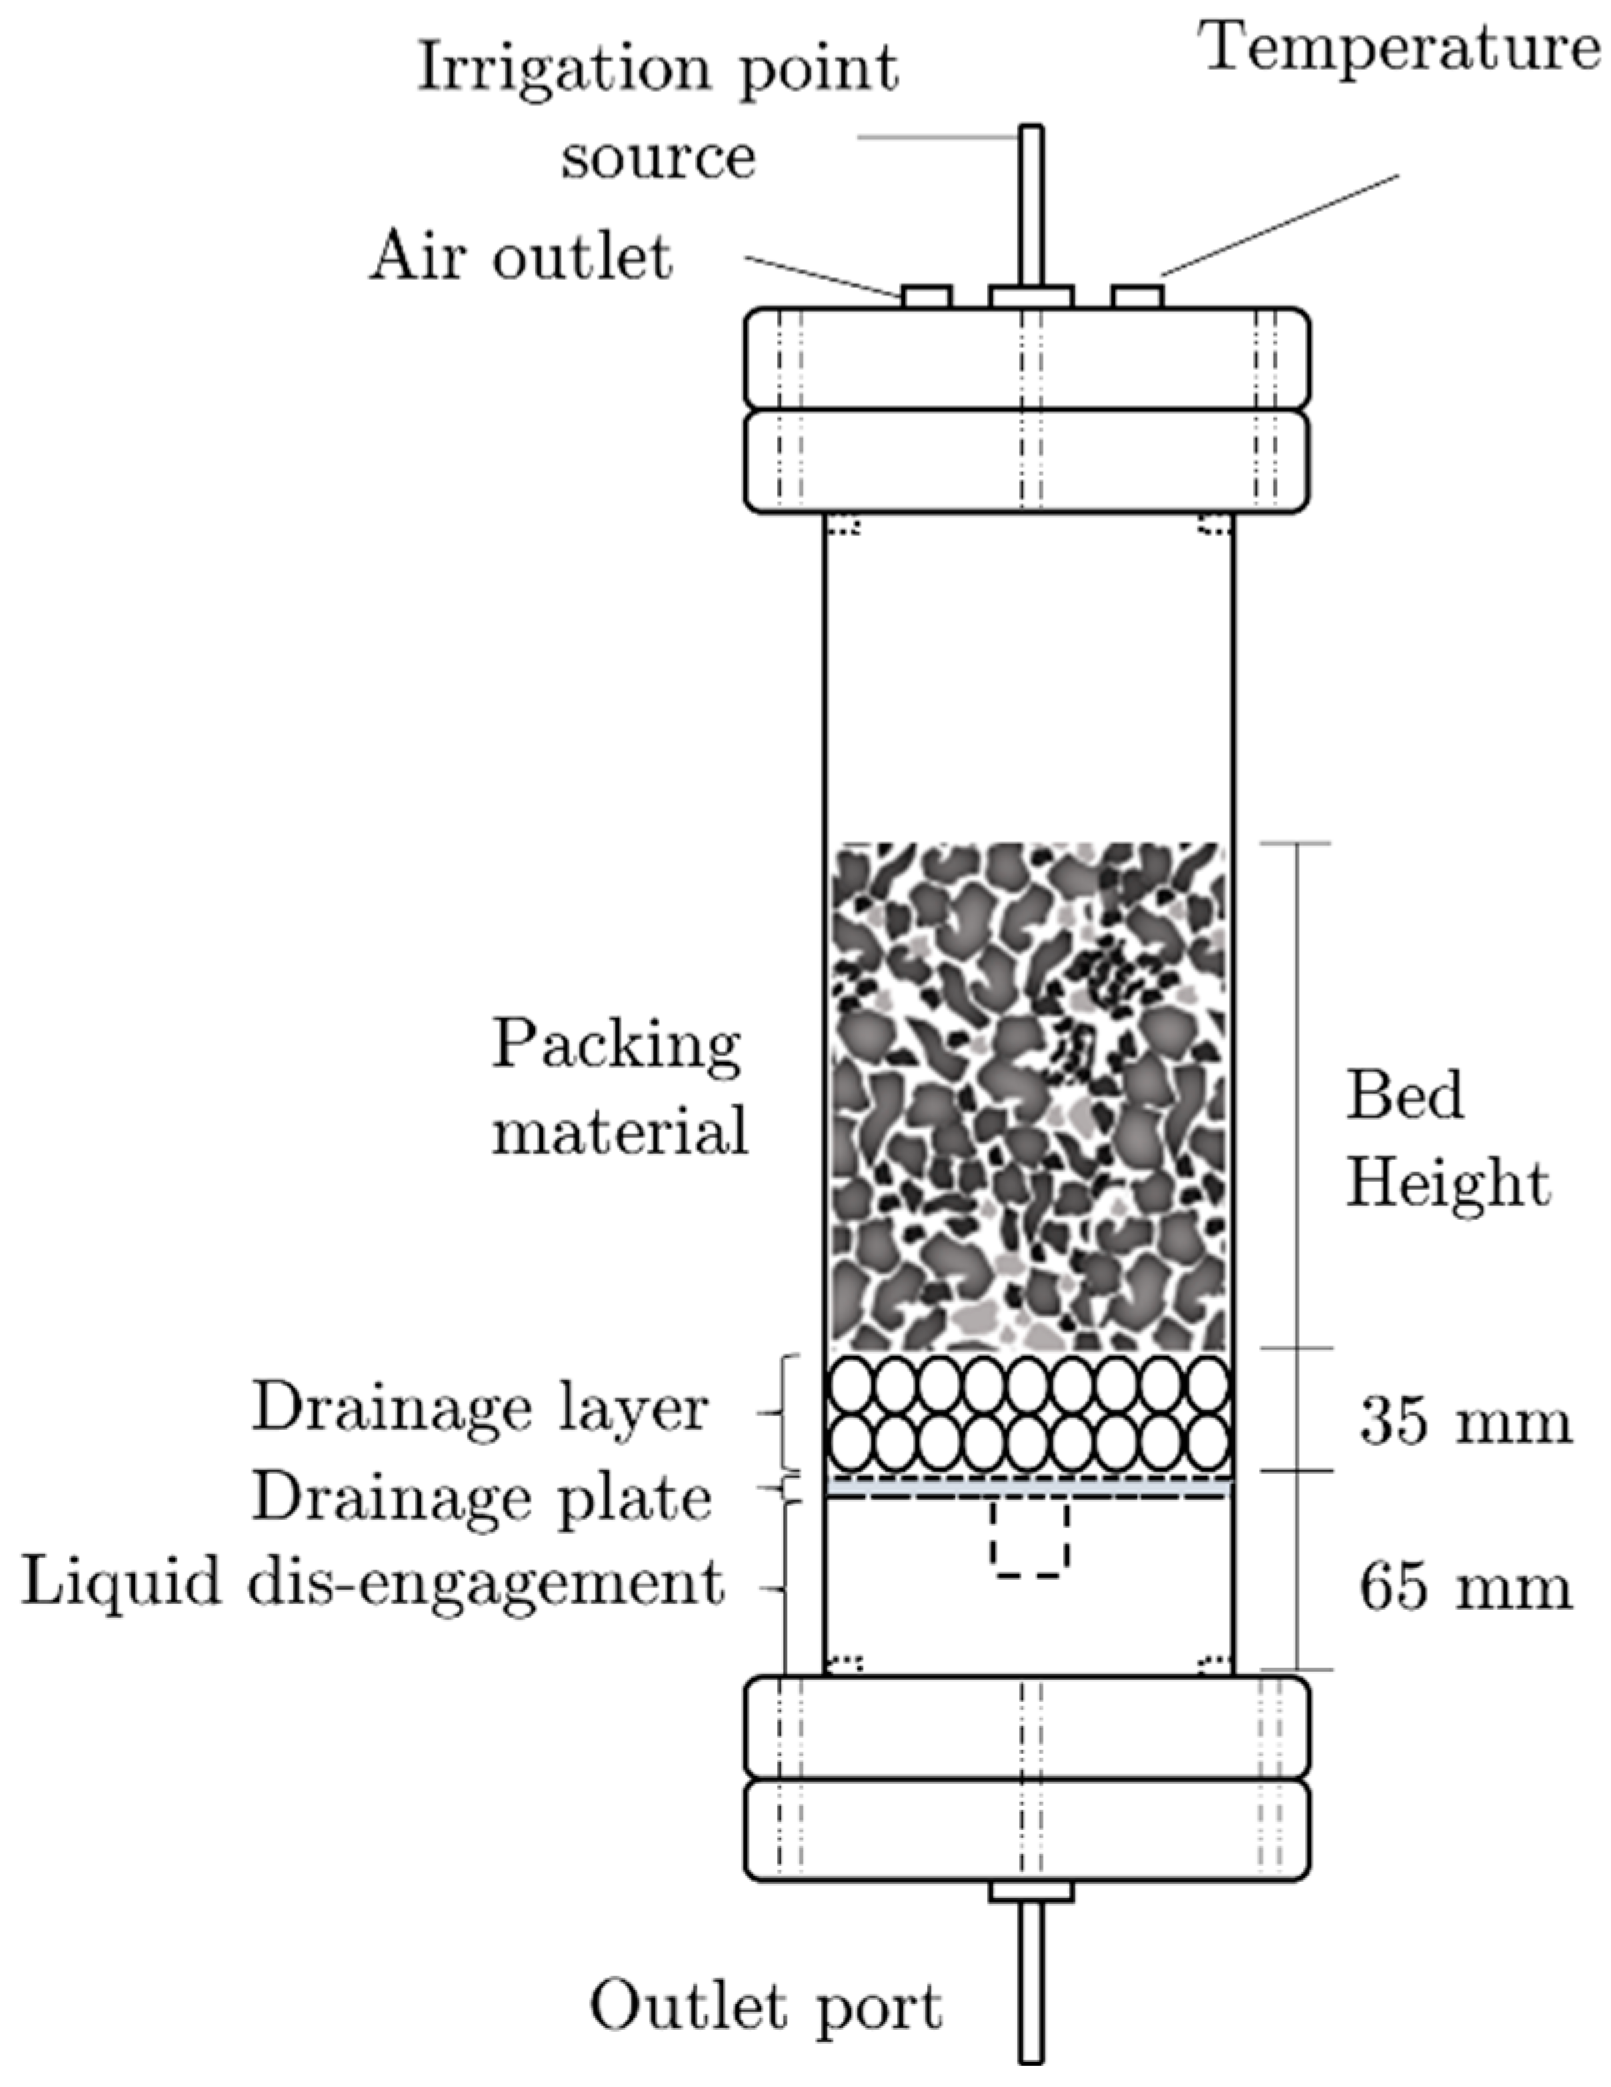
Figure 4.
Cylindrical column design and dimensions used in tracer tests [
29].
Figure 4.
Cylindrical column design and dimensions used in tracer tests [
29].
Figure 5.
Illustration of the cylindrical column packing [
29].
Figure 5.
Illustration of the cylindrical column packing [
29].
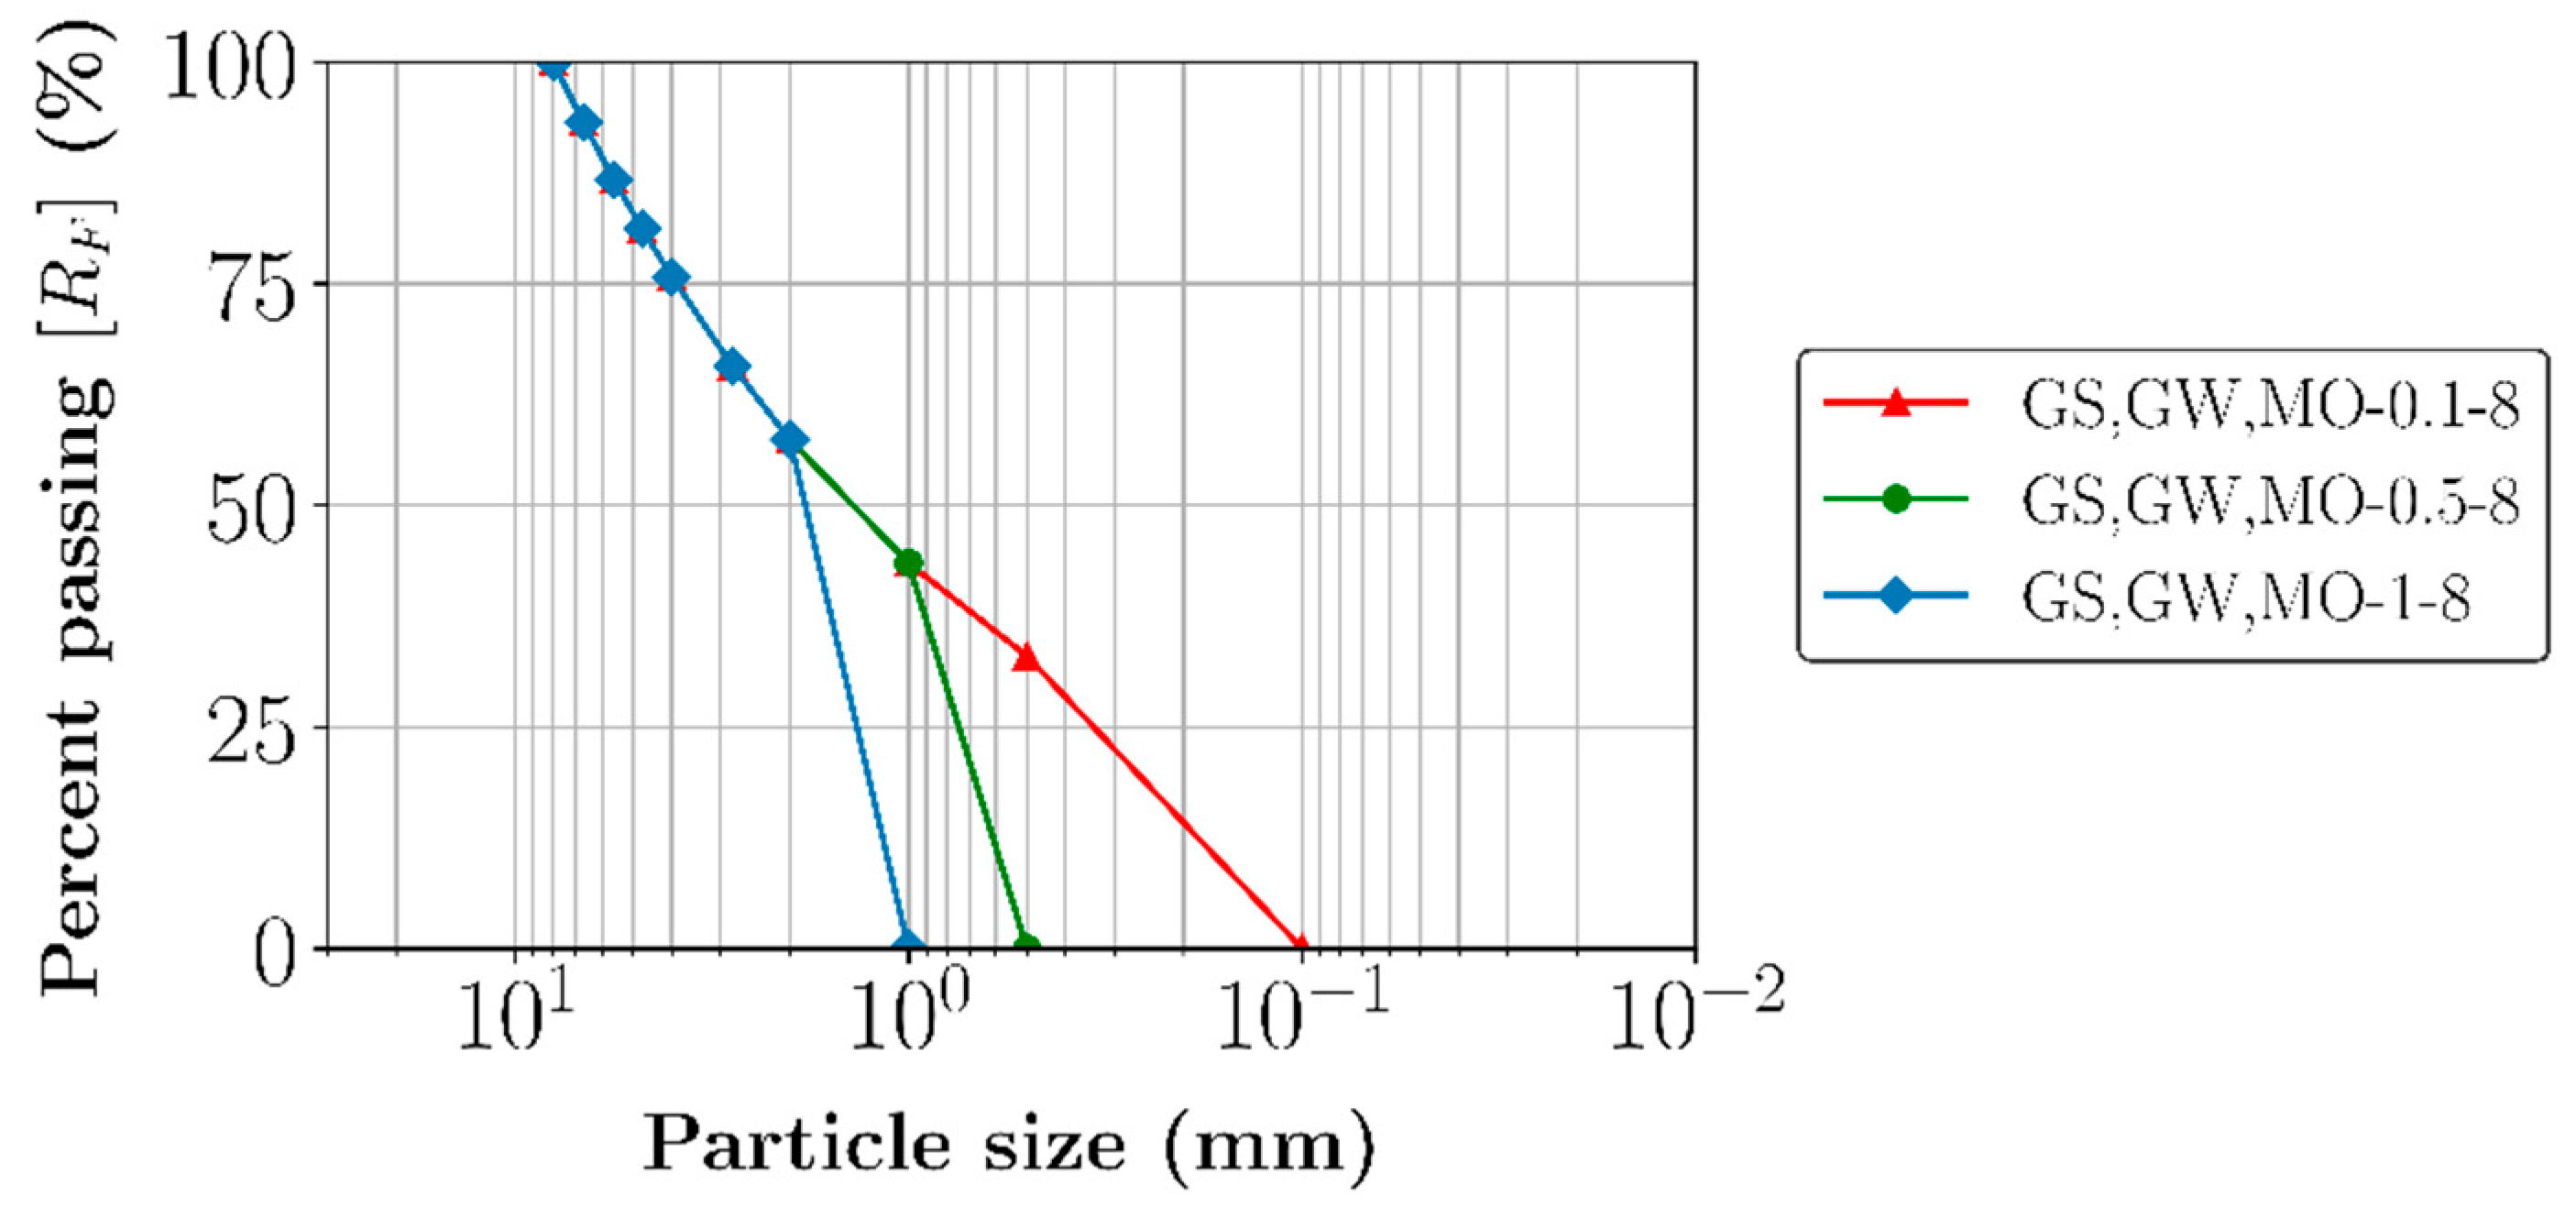
Figure 6.
Particle size distributions for the packed beds composed of the different sized mixtures.
Figure 6.
Particle size distributions for the packed beds composed of the different sized mixtures.
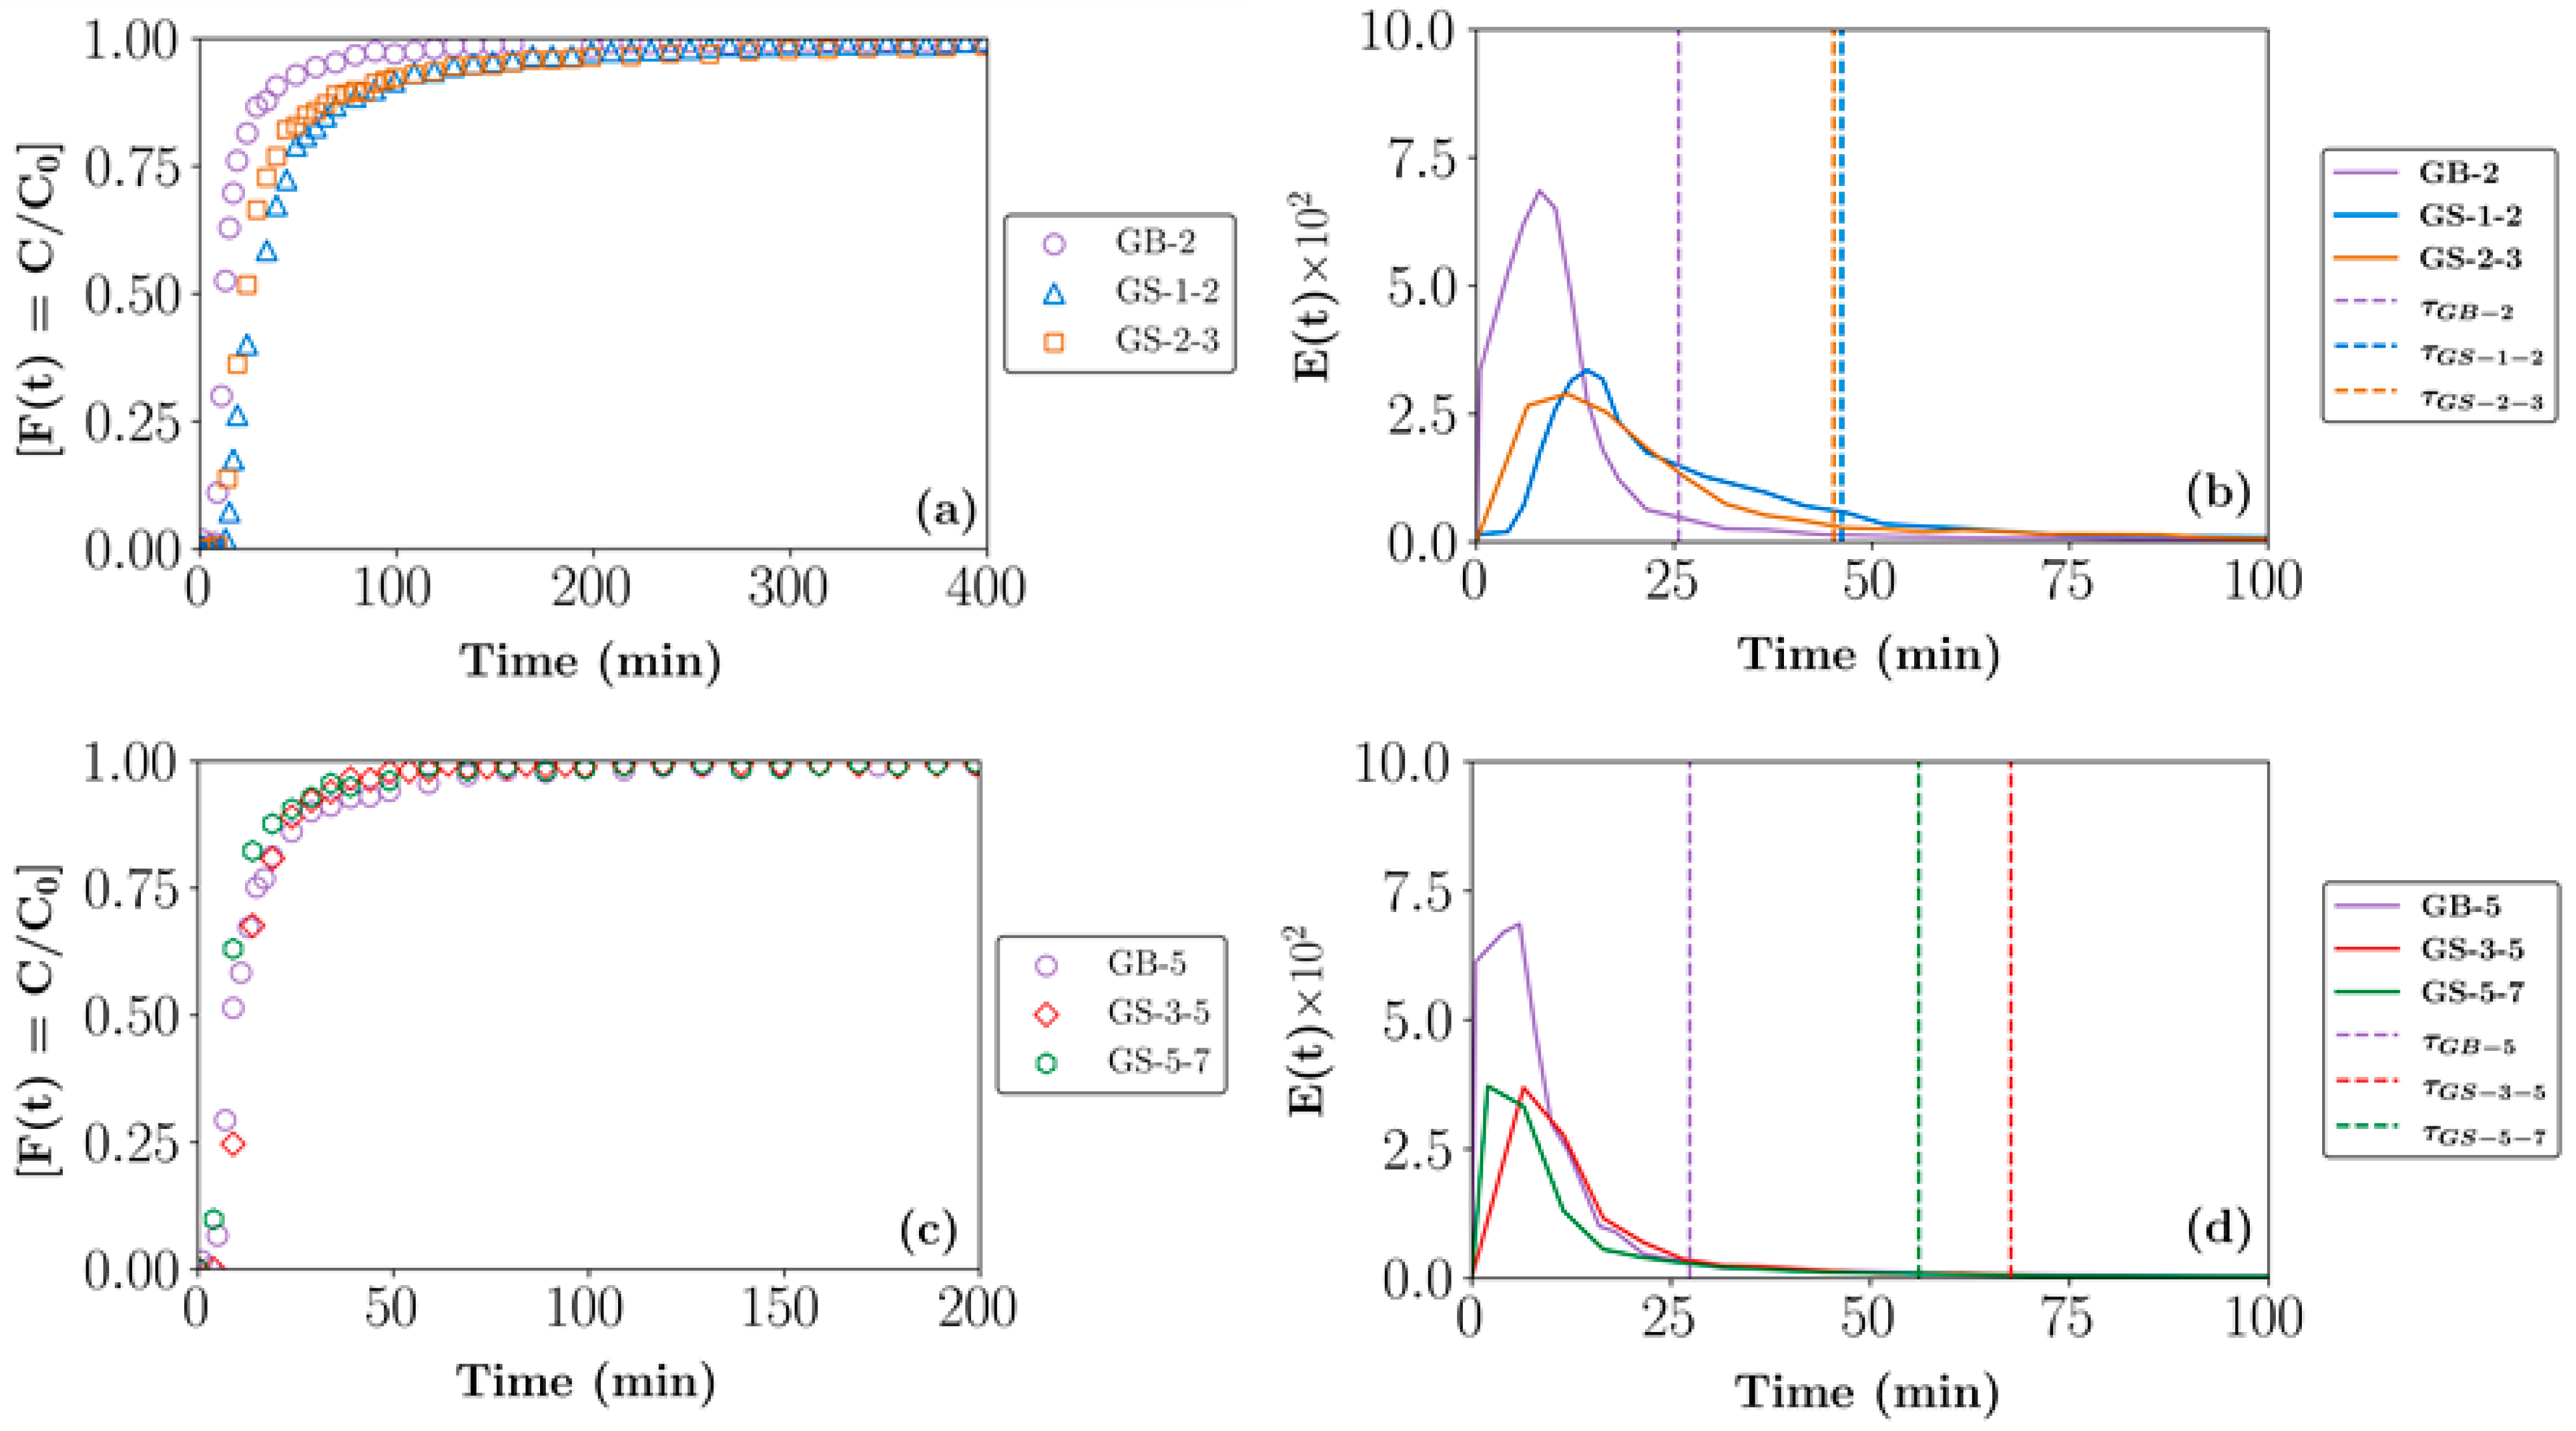
Figure 7.
(Left—(a,c)) Cumulative (F(t)) and (right—(b,d)) exit age (E(t)) RTD profiles for beds composed of different size fractions of glass beads (GBs) and glass shards (GSs). Key: GB-2 (2 mm), GB-5 (5 mm), GS-1-2 (1–2 mm), GS-2-3 (2–2.8 mm), GS-3-5 (2.8–4.8 mm), and GS-5-7 (4.8–6.7 mm).
Figure 7.
(Left—(a,c)) Cumulative (F(t)) and (right—(b,d)) exit age (E(t)) RTD profiles for beds composed of different size fractions of glass beads (GBs) and glass shards (GSs). Key: GB-2 (2 mm), GB-5 (5 mm), GS-1-2 (1–2 mm), GS-2-3 (2–2.8 mm), GS-3-5 (2.8–4.8 mm), and GS-5-7 (4.8–6.7 mm).
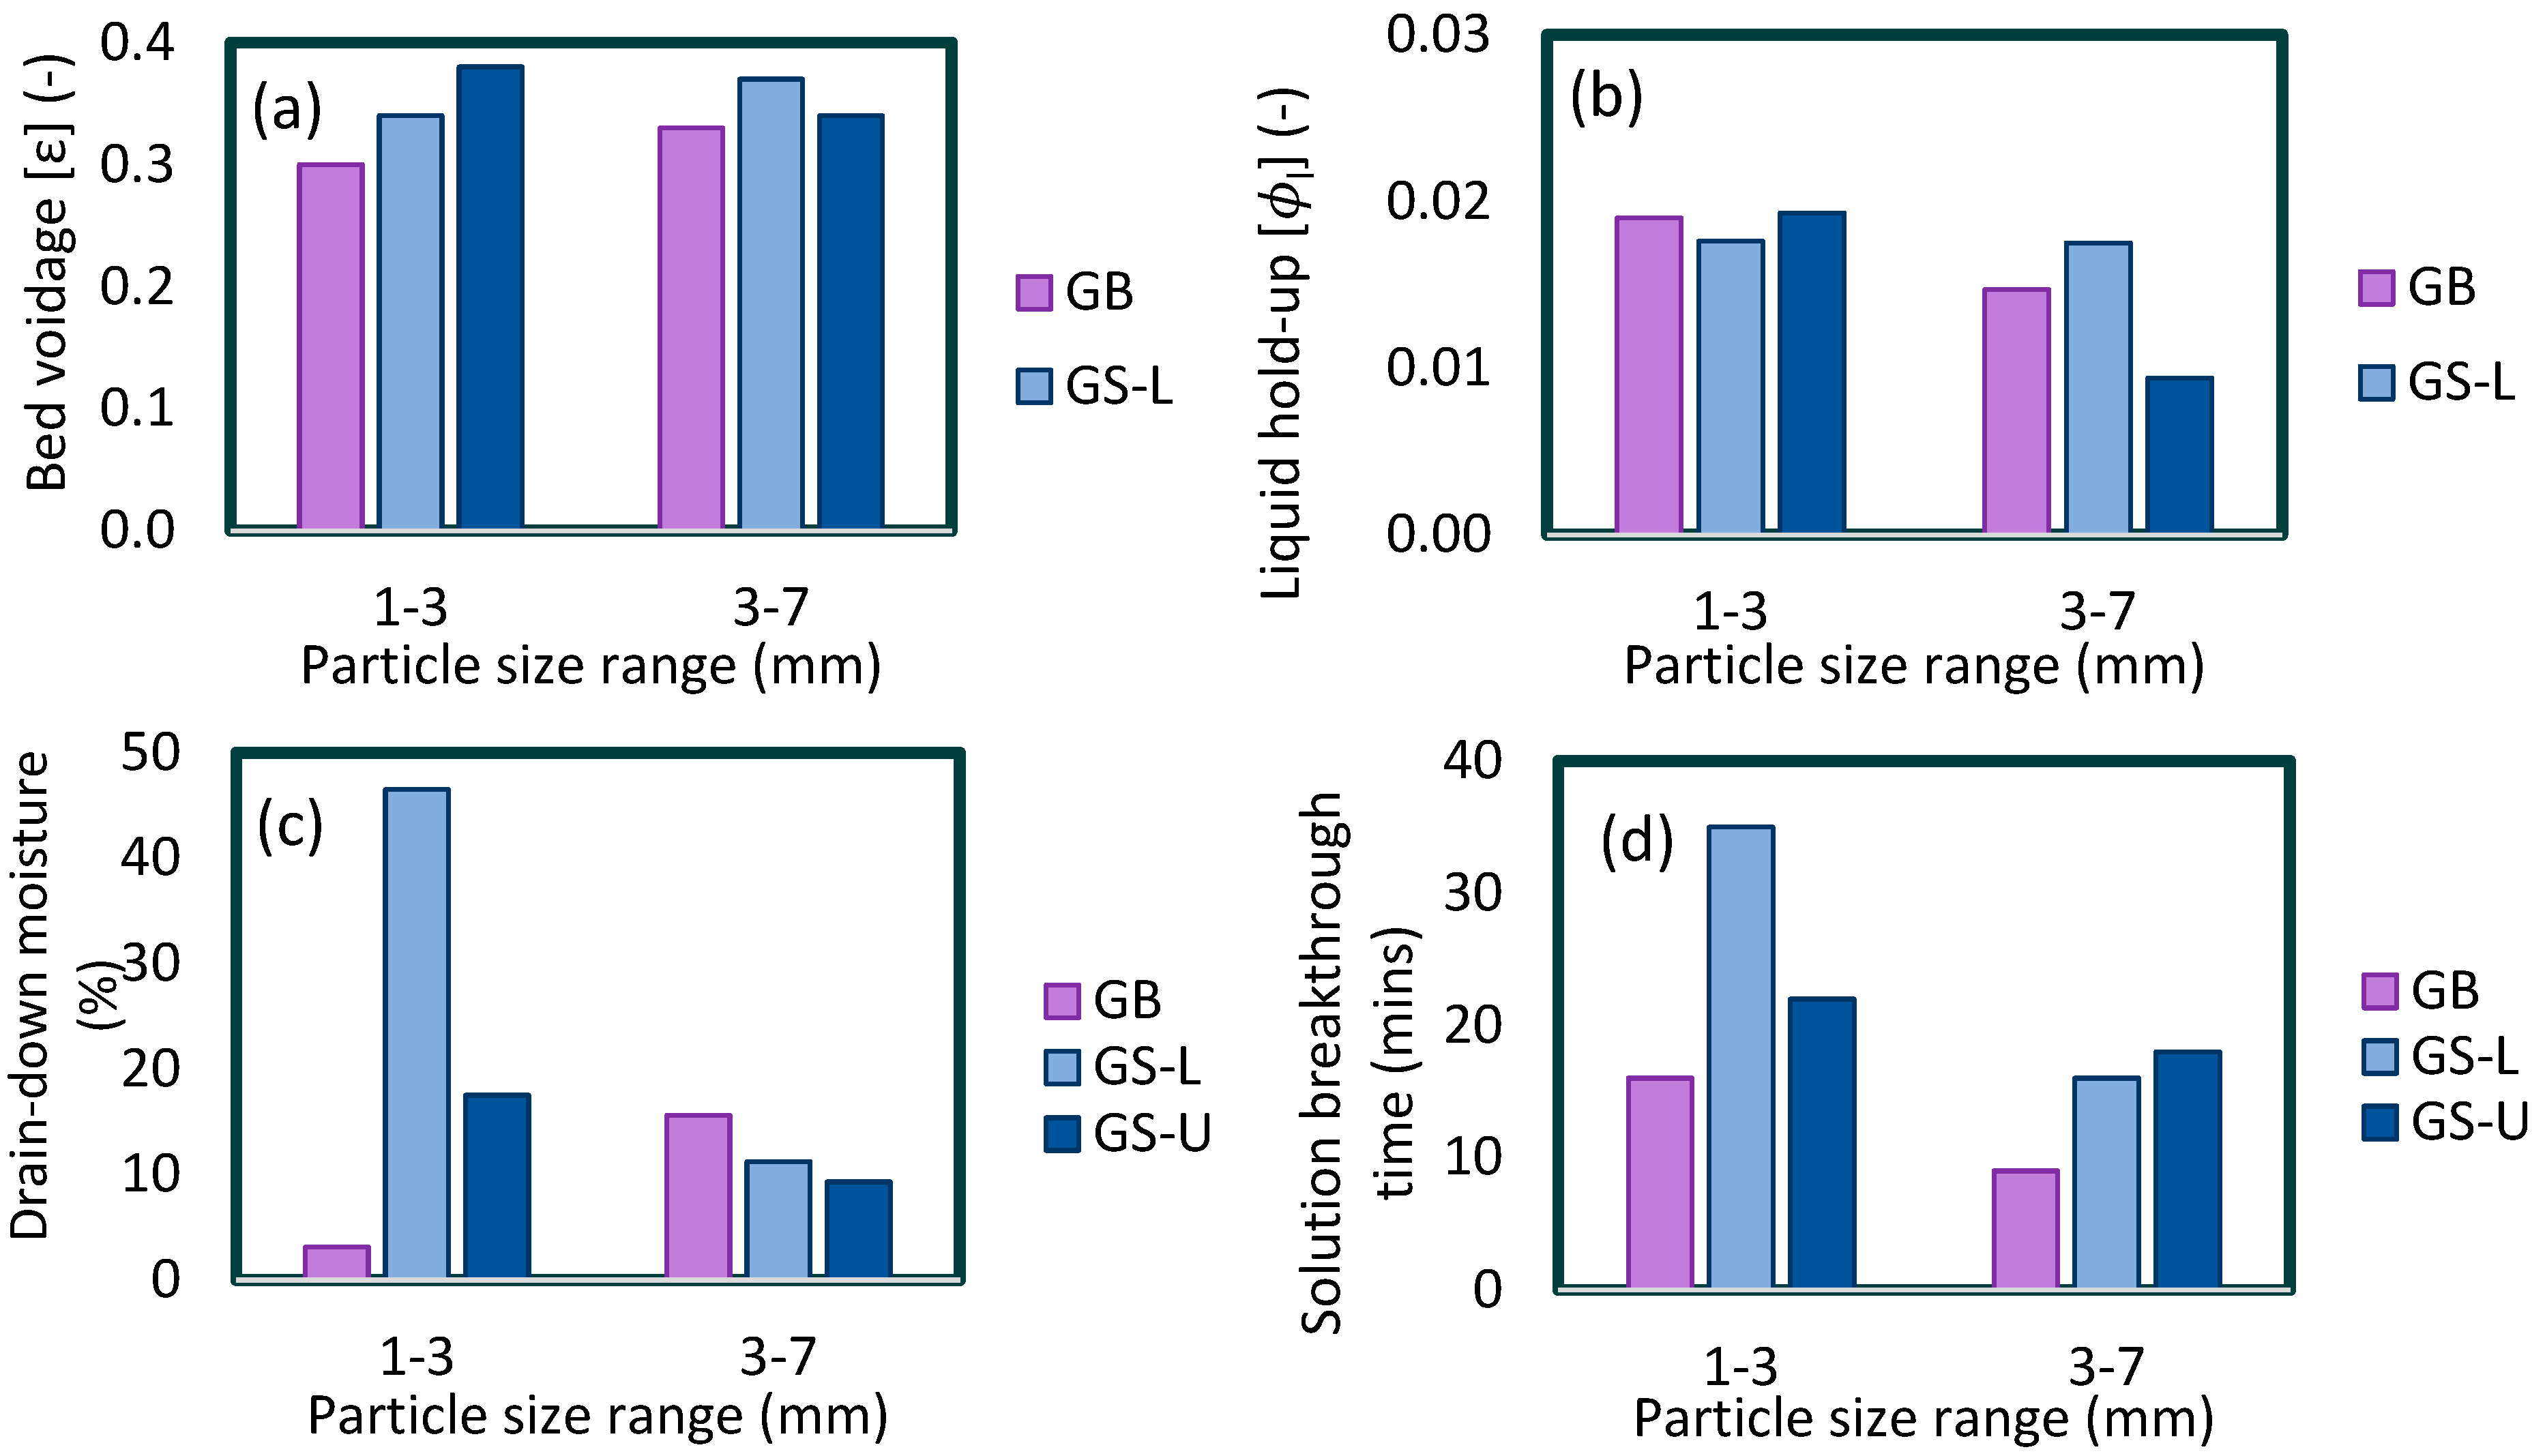
Figure 8.
(a) Bed voidage, (b) total liquid hold-up, (c) 24-h drain-down moisture as the percentage of total liquid hold-up and (d) solution breakthrough time characterisation data for beds composed of different size fractions of GBs and GSs. Key: L—lower size range; U—upper size range; GB 1-3 size range (GB-2) and GB 3-7 size range (GB-5); GS-L 1-3 size range (GS-1-2) and GS-L 3-7 size range (GS-3-5); GS-U 1-3 size range (GS-2-3) and GS-U 3-7 size range (GS-5-7).
Figure 9.
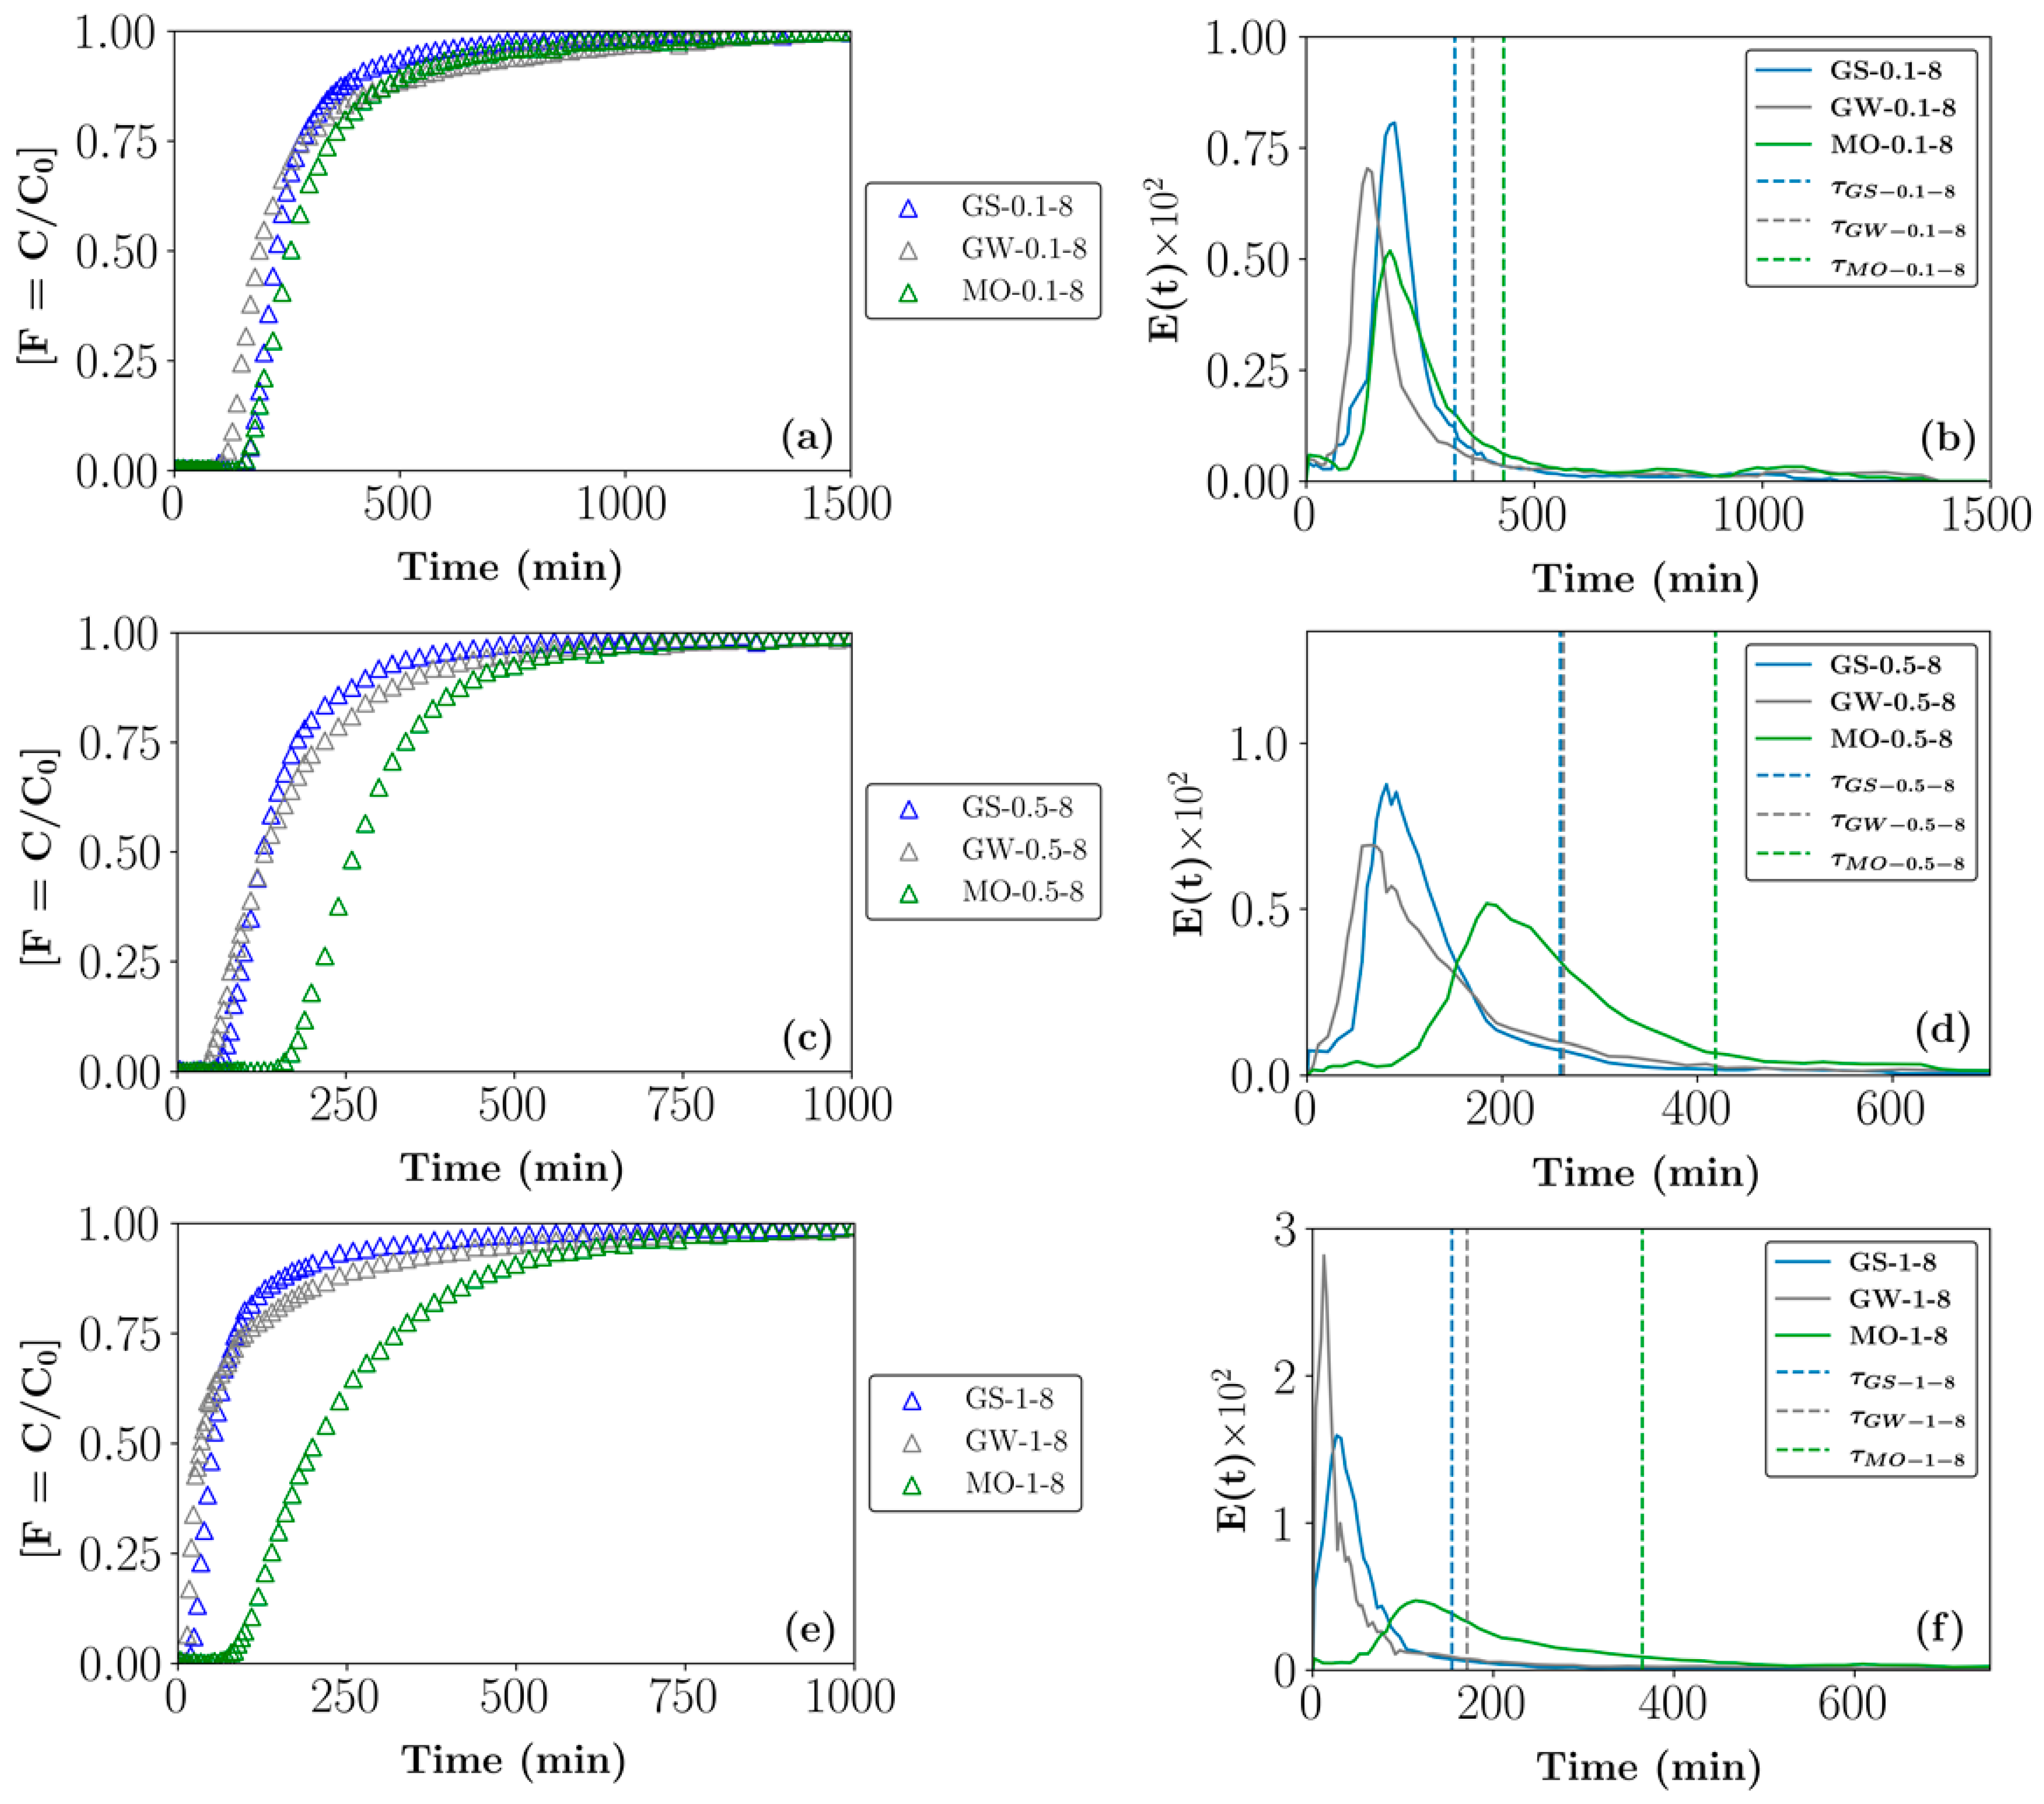
(Left—(a,c,e)) Cumulative (F(t)) and (right—(b,d,f)) exit age (E(t)) RTD profiles for beds composed of different size fractions of GSs, GW, and MO. The vertical lines in the E(t) curves represent the calculated average residence times. Key: GS/GW/MO- 0.1-8 (0.1–8 mm), 0.5-8 (0.5–8 mm), and 1-8 (1–8 mm).
Figure 9.
(Left—(a,c,e)) Cumulative (F(t)) and (right—(b,d,f)) exit age (E(t)) RTD profiles for beds composed of different size fractions of GSs, GW, and MO. The vertical lines in the E(t) curves represent the calculated average residence times. Key: GS/GW/MO- 0.1-8 (0.1–8 mm), 0.5-8 (0.5–8 mm), and 1-8 (1–8 mm).
Figure 10.
(a) Bed voidage, (b) total liquid hold-up, (c) 24-h drain-down moisture as percentage of total liquid hold-up, and (d) solution breakthrough time characterisation data for beds composed of different size fractions of GSs, GW, and MO. Key: 0.1-8 (0.1–8 mm), 0.5-8 (0.5–8 mm), and 1-8 (1–8 mm).
Figure 11.
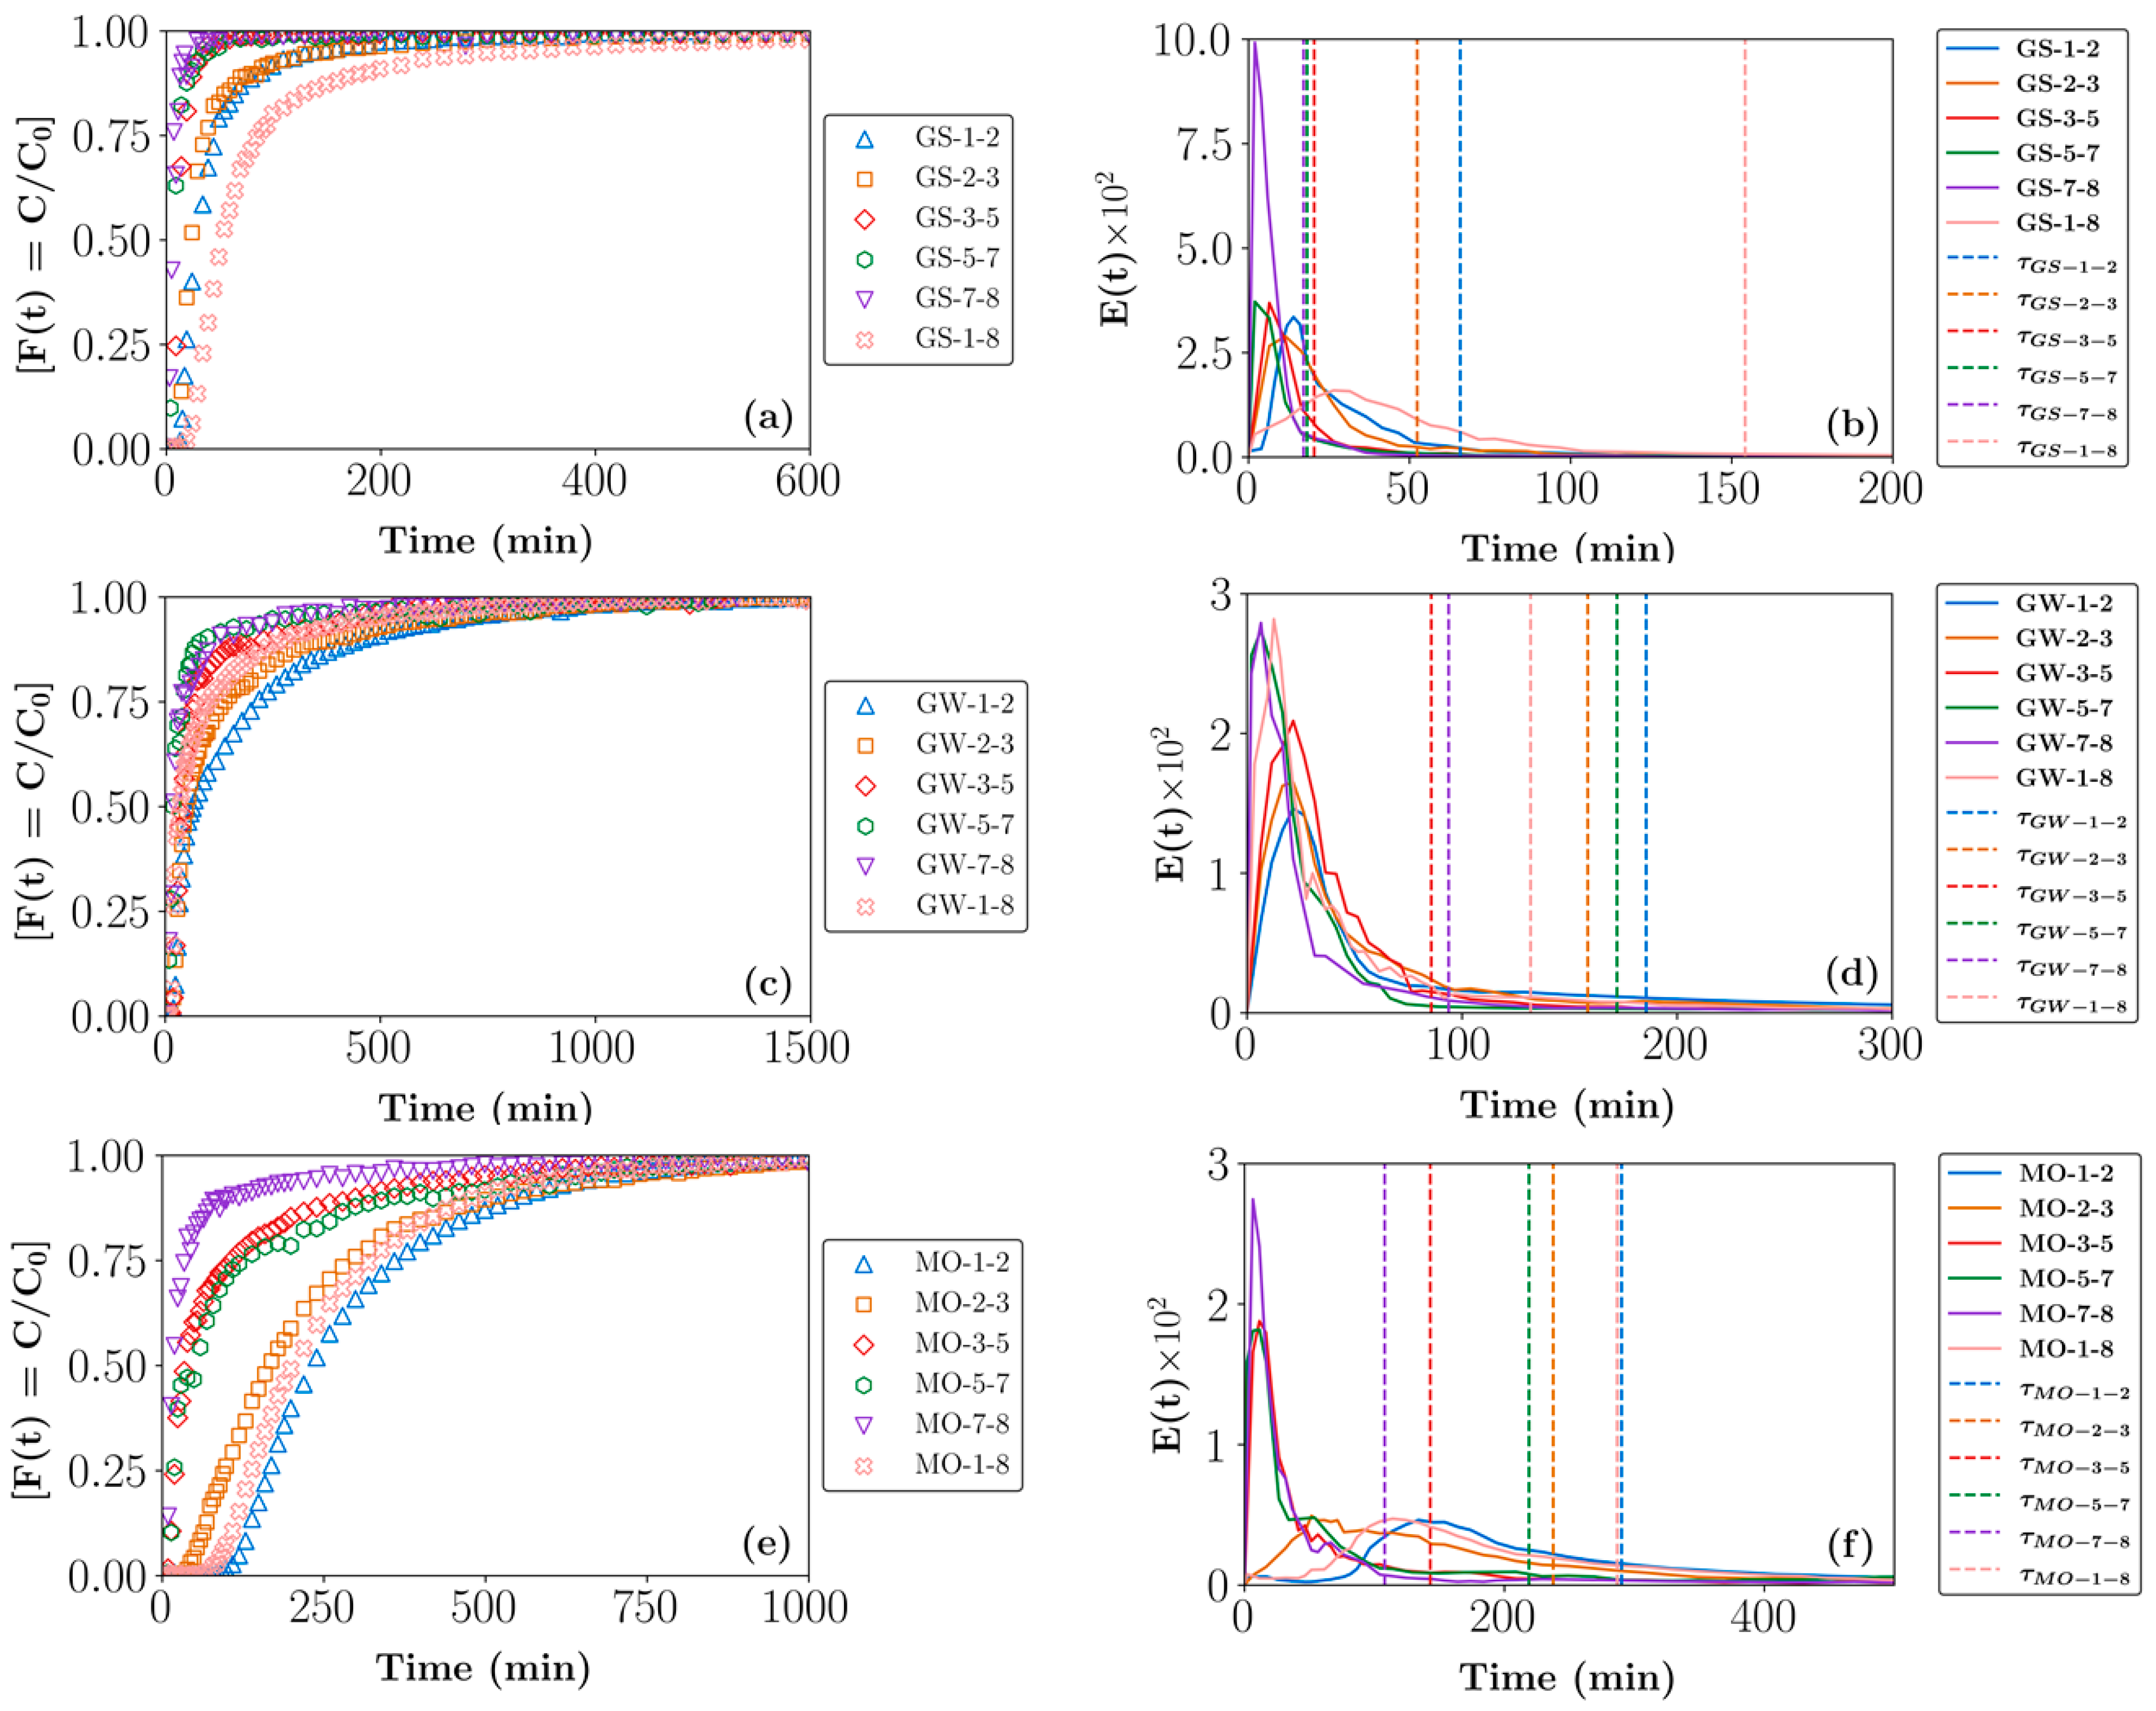
(Left—(a,c,e)) Cumulative (F(t)) and (right—(b,d,f)) exit age (E(t)) RTD profiles for beds composed of different size fractions of glass shards (GSs), greywacke (GW), and malachite ore (MO). The vertical lines in the E(t) curves represent the calculated average residence times. Key: GS/GW/MO- 1-2 (1–2 mm), 2-3 (2–2.8 mm), 3-5 (2.8–4.8 mm), 5-7 (4.8–6.7 mm), 7-8 (6.7–8 mm), and 1-8 (1–8 mm).
Figure 11.
(Left—(a,c,e)) Cumulative (F(t)) and (right—(b,d,f)) exit age (E(t)) RTD profiles for beds composed of different size fractions of glass shards (GSs), greywacke (GW), and malachite ore (MO). The vertical lines in the E(t) curves represent the calculated average residence times. Key: GS/GW/MO- 1-2 (1–2 mm), 2-3 (2–2.8 mm), 3-5 (2.8–4.8 mm), 5-7 (4.8–6.7 mm), 7-8 (6.7–8 mm), and 1-8 (1–8 mm).
Figure 12.
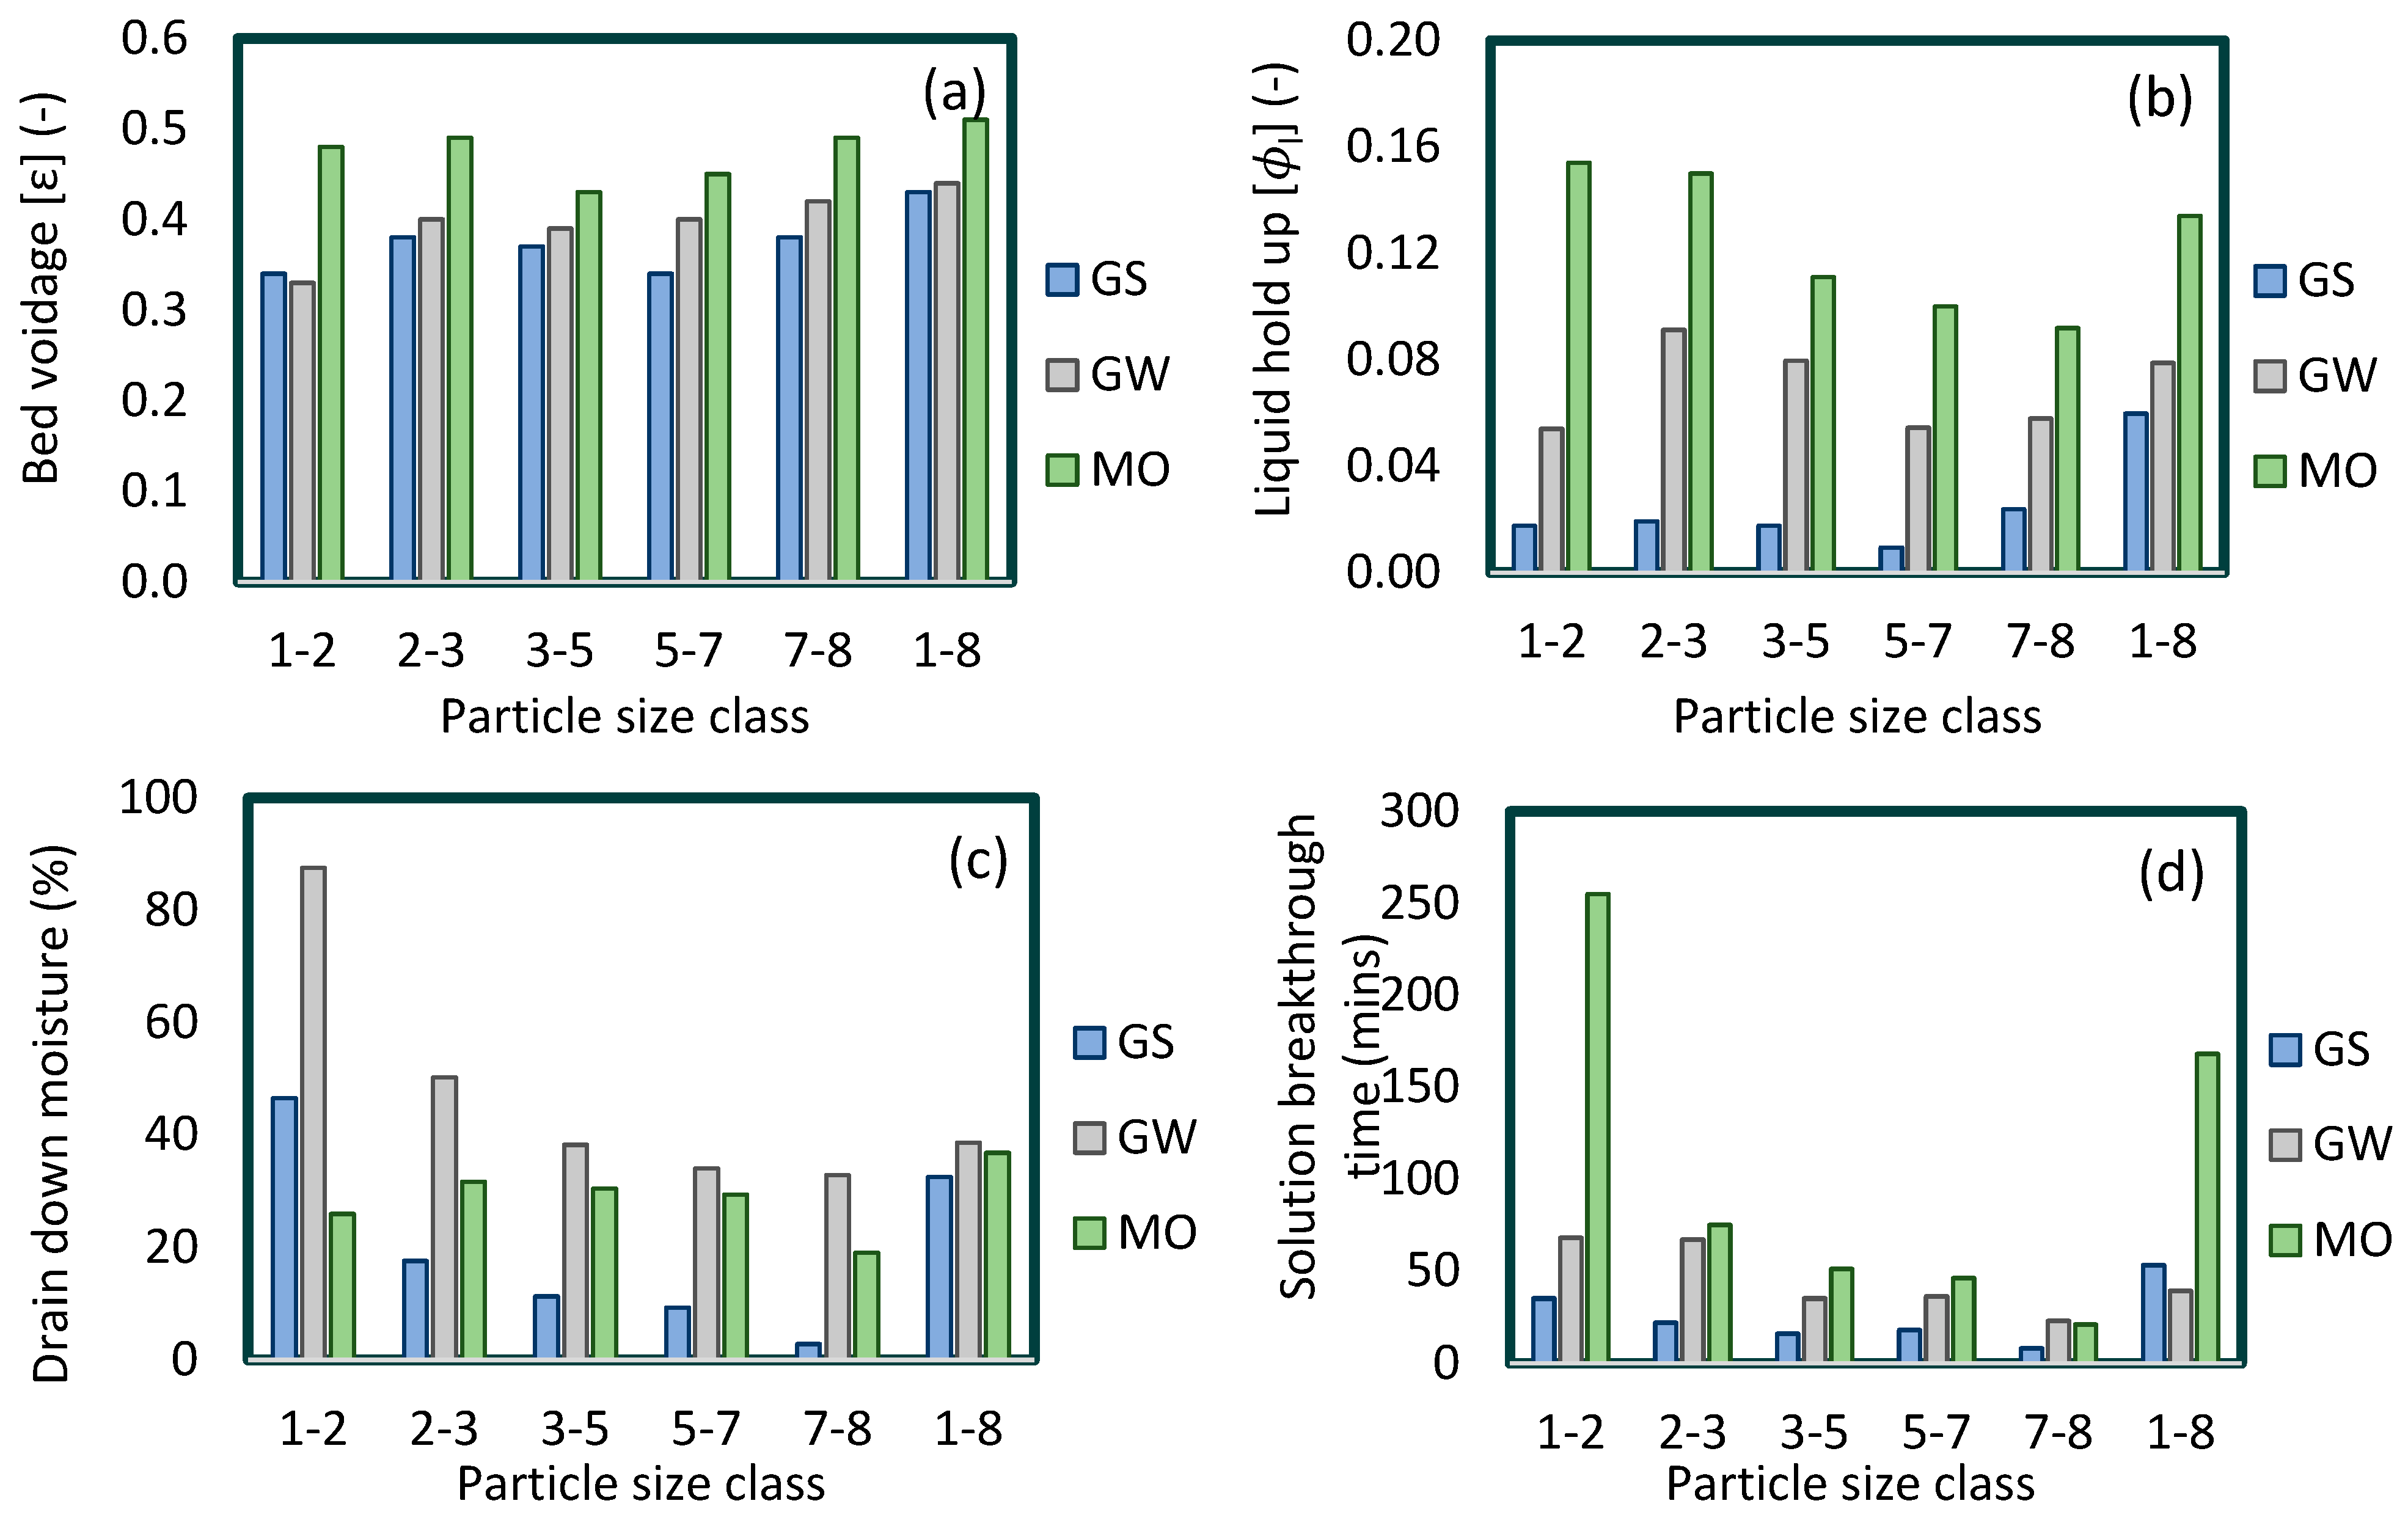
(a) Bed voidage, (b) total liquid hold-up, (c) 24-h drain-down moisture, and (d) solution breakthrough time characterisation data for beds composed of different size fractions of GS, GW, and MO.
Figure 12.
(a) Bed voidage, (b) total liquid hold-up, (c) 24-h drain-down moisture, and (d) solution breakthrough time characterisation data for beds composed of different size fractions of GS, GW, and MO.
Figure 13.
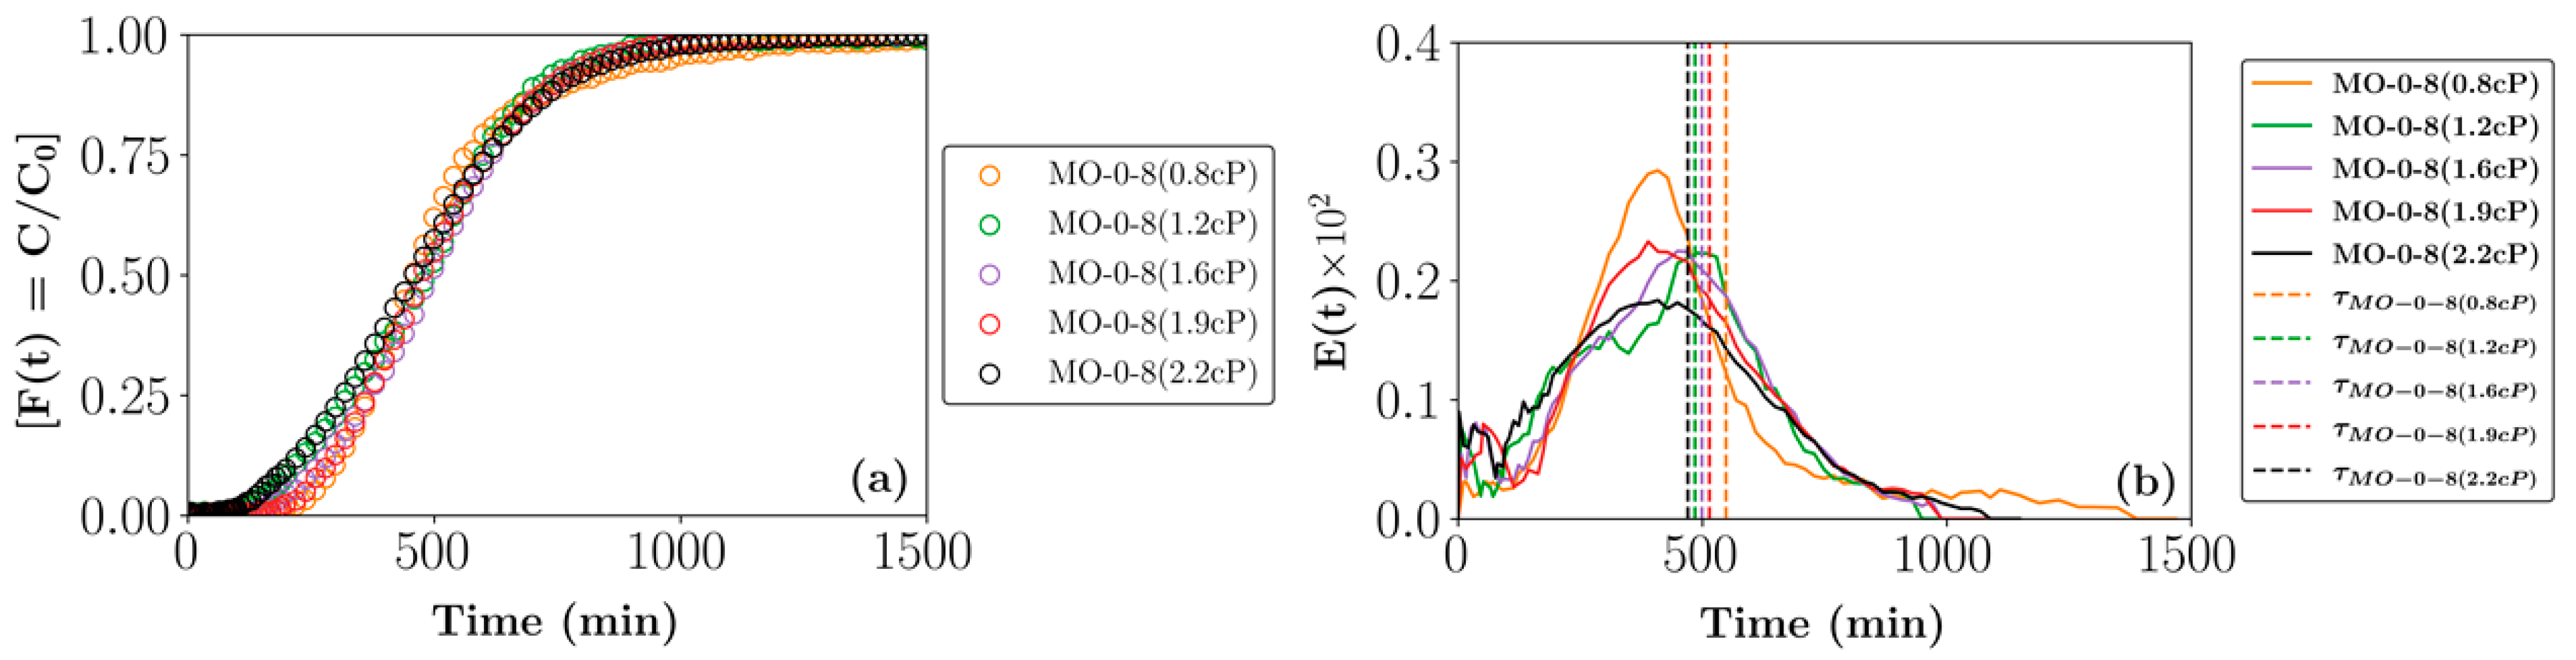
(Left—(a)) Cumulative (F(t)) and (right—(b)) exit age (E(t)) RTD profiles for beds composed of 0-8 mm MO particles and irrigated with different viscosity solutions (0.8. 1.2, 1.6, 1.9, and 2.2 cP). The vertical lines in the E(t) curves represent the calculated average residence times.
Figure 13.
(Left—(a)) Cumulative (F(t)) and (right—(b)) exit age (E(t)) RTD profiles for beds composed of 0-8 mm MO particles and irrigated with different viscosity solutions (0.8. 1.2, 1.6, 1.9, and 2.2 cP). The vertical lines in the E(t) curves represent the calculated average residence times.
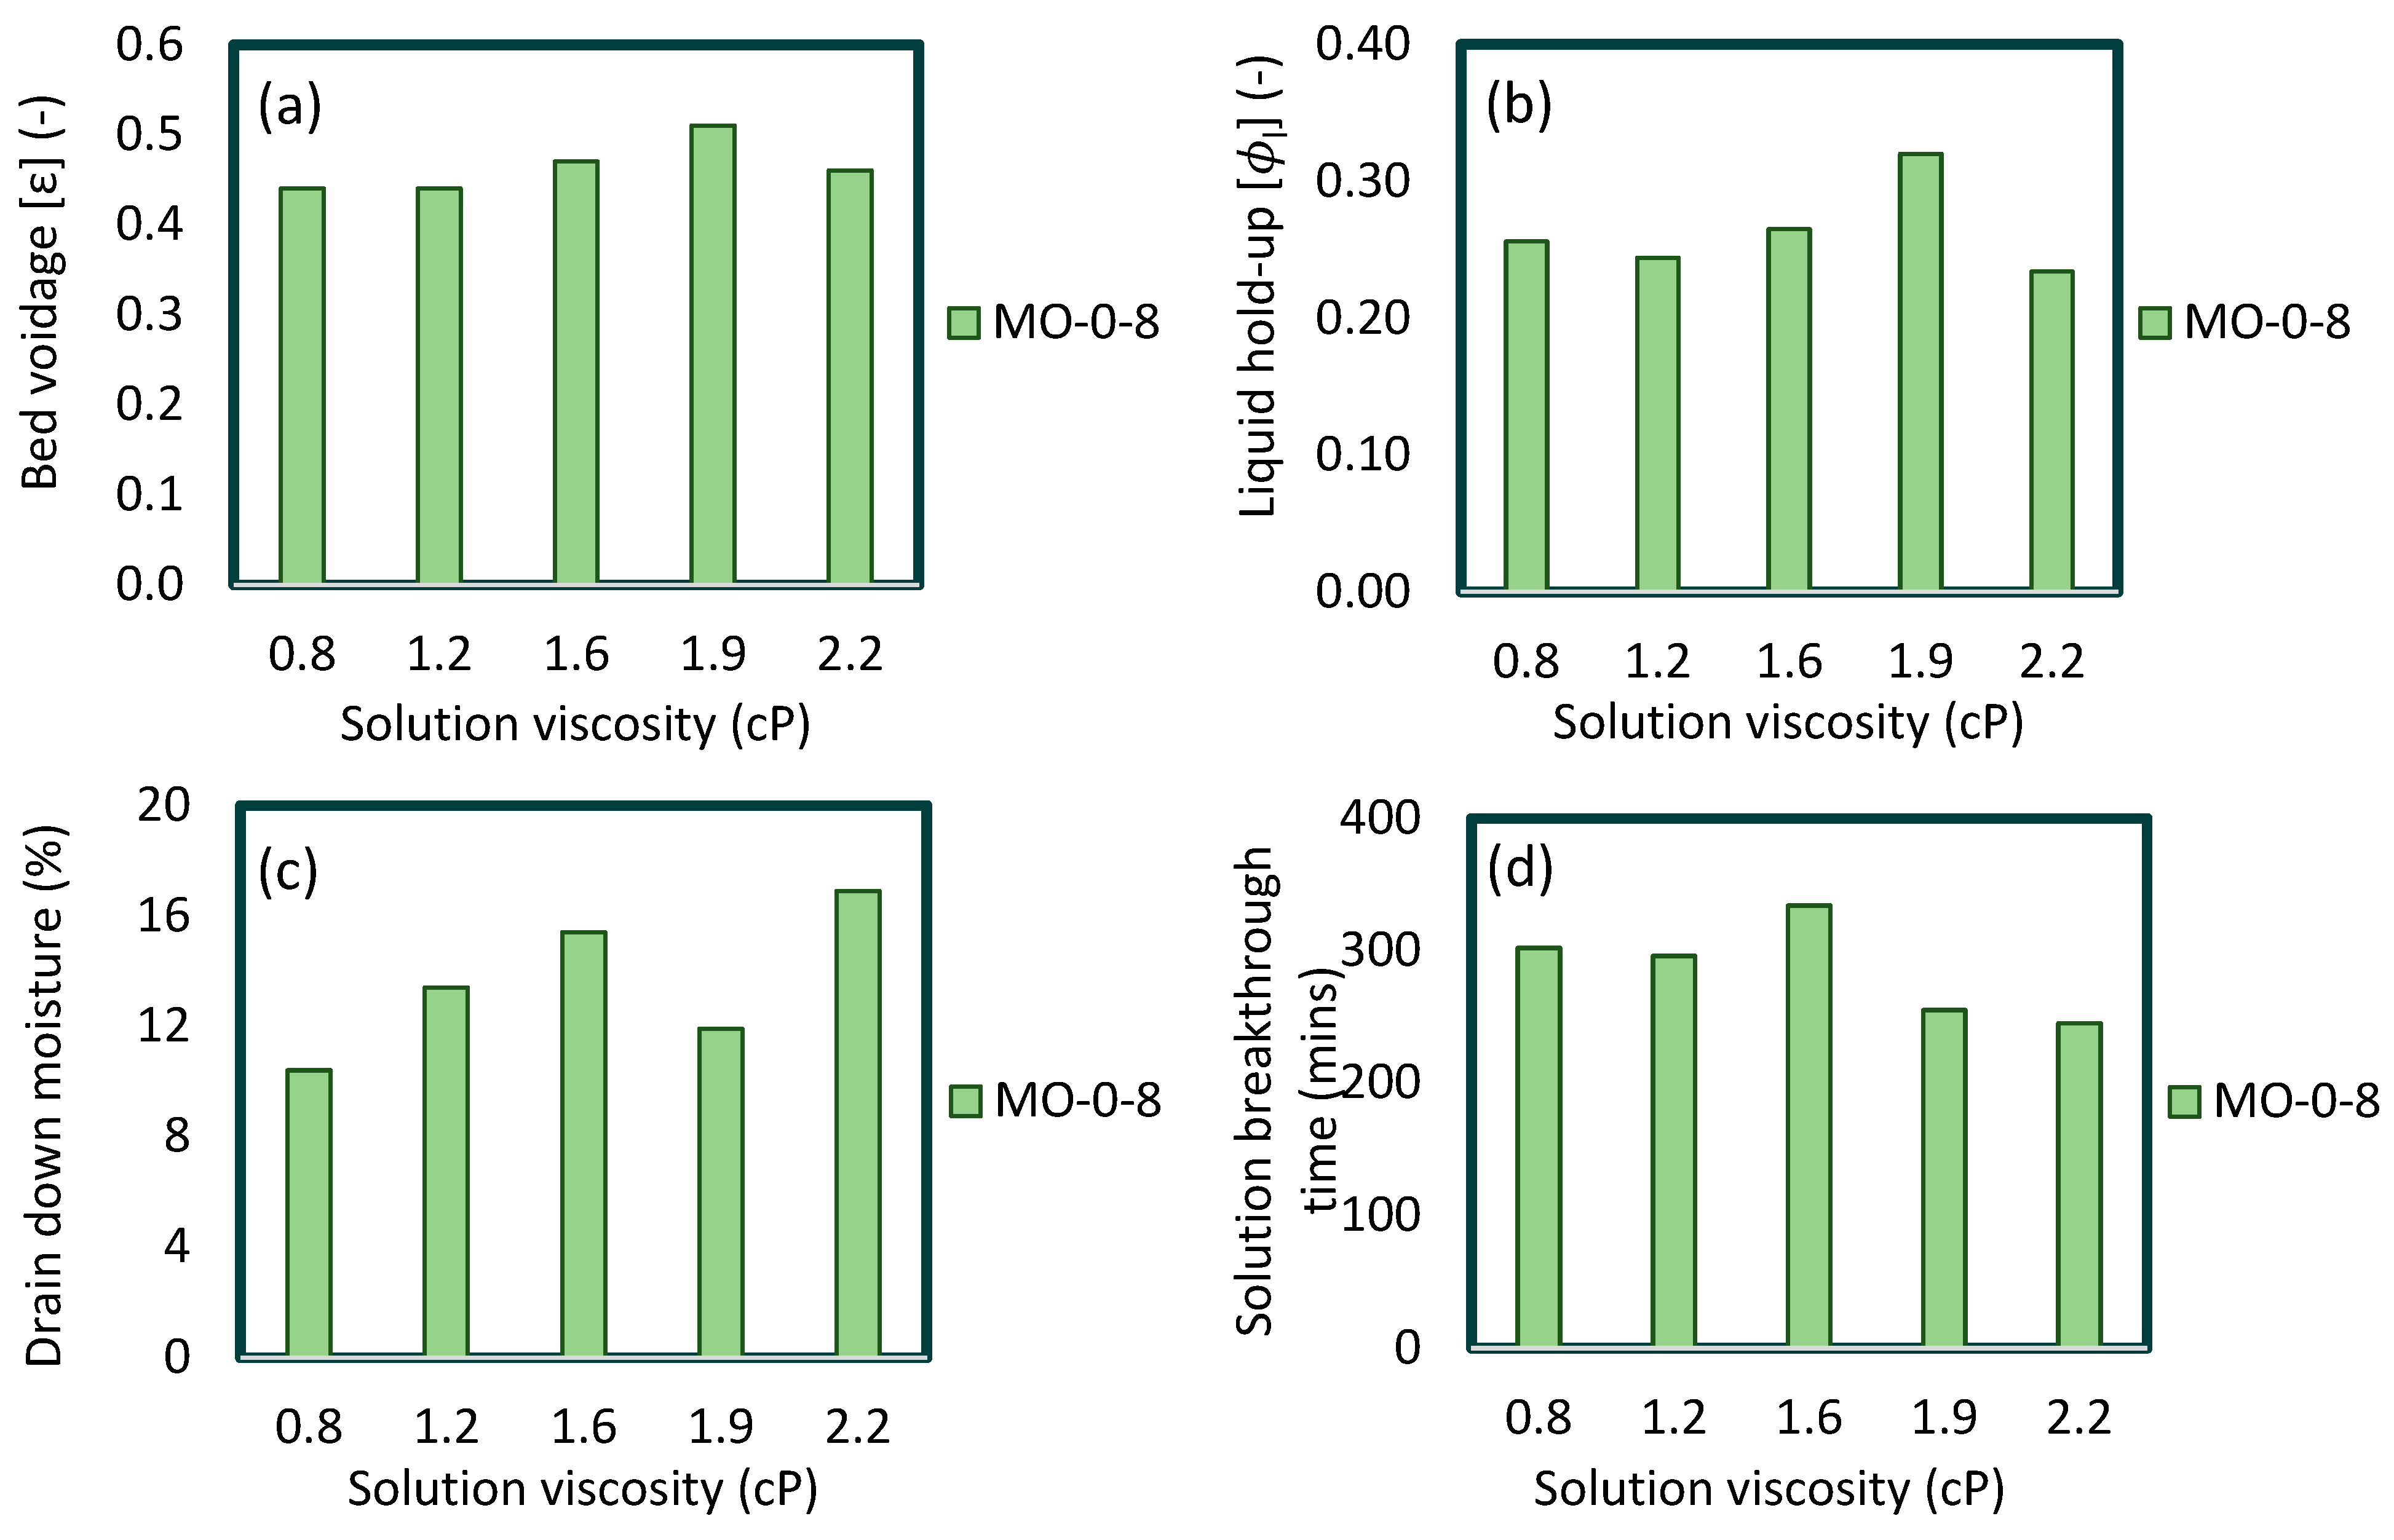
Figure 14.
(a) Bed voidage, (b) total liquid hold-up, (c) 24-h drain-down moisture, (d) solution breakthrough time characterisation data for beds composed of 0-8 mm MO particles and irrigated with different viscosity solutions (0.8. 1.2, 1.6, 1.9, and 2.2 cP).
Figure 14.
(a) Bed voidage, (b) total liquid hold-up, (c) 24-h drain-down moisture, (d) solution breakthrough time characterisation data for beds composed of 0-8 mm MO particles and irrigated with different viscosity solutions (0.8. 1.2, 1.6, 1.9, and 2.2 cP).
Table 1.
BET analysis results for greywacke and malachite ore.
Table 1.
BET analysis results for greywacke and malachite ore.
| Material | Size Fraction (mm) | BET Surface Area (m2/g) |
|---|
| Greywacke | 0.1–0.5 | 1.68 ± 0.01 |
| 0.5–1.0 | 1.01 ± 0.01 |
| Malachite ore | 0.1–0.5 | 5.88 ± 0.05 |
| 0.5–1.0 | 2.58 ± 0.02 |
Table 2.
Specific surface area of sulphide minerals using small-angle neutron scattering (SANS) and ultra-small-angle neutron scattering (USANS) [
28].
Table 2.
Specific surface area of sulphide minerals using small-angle neutron scattering (SANS) and ultra-small-angle neutron scattering (USANS) [
28].
| Material | Size (µm) | Surface Area (m2/g) |
|---|
| Violarite | 20–53 | 3.36 |
| Marcasite | 20–53 | 0.94 |
| Pyrite | 20–53 | 3.56 |
| Bornite | 20–53 | 0.99 |
| Chalcopyrite | 20–53 | 2.73 |
Table 3.
Average contact angles obtained from wettability experiments conducted on three selected materials using different solutions at 30 °C.
Table 3.
Average contact angles obtained from wettability experiments conducted on three selected materials using different solutions at 30 °C.
| Material | Liquid | Contact Angle |
|---|
| Glass shards (GS) | Water | 49.9 ± 3.3 |
| Greywacke (GW) | Water | 40.1 ± 2.9 |
| Malachite ore (MO) | Water | 62.9 ± 3.4 |
| 15 wt% Glycerol | 64.4 ± 0.9 |
| 25 wt% Glycerol | 63.0 ± 0.5 |
| 30 wt% Glycerol | 63.0 ± 0.5 |
| 35 wt% Glycerol | 63.6 ± 0.5 |
Table 4.
Average and standard deviation shape descriptor values obtained for the 2 and 5 mm glass beads (GBs) and over the 1–8 mm size fraction range for the glass shards (GSs), greywacke (GW), and malachite ore (MO) materials. The values are compared to those calculated for a perfect sphere (PS).
Table 4.
Average and standard deviation shape descriptor values obtained for the 2 and 5 mm glass beads (GBs) and over the 1–8 mm size fraction range for the glass shards (GSs), greywacke (GW), and malachite ore (MO) materials. The values are compared to those calculated for a perfect sphere (PS).
| Shape Descriptor | Calculated Value | Average Values |
|---|
| PS | GB | GS | GW | MO |
|---|
| Aspect ratio | 1.00 | 1.05 ± 0.01 | 1.55 ± 0.44 | 1.62 ± 0.45 | 1.58 ± 0.41 |
| Circularity | 1.00 | 0.88 ± 0.00 | 0.74 ± 0.08 | 0.73 ± 0.08 | 0.72 ± 0.08 |
| Compactness | 1.00 | 0.98 ± 0.01 | 0.82 ± 0.09 | 0.81 ± 0.09 | 0.81 ± 0.09 |
| Extent | 0.79 | 0.77 ± 0.01 | 0.68 ± 0.09 | 0.67 ± 0.07 | 0.67 ± 0.07 |
| Solidity | 1.00 | 0.97 ± 0.01 | 0.94 ± 0.03 | 0.93 ± 0.03 | 0.92 ± 0.03 |
Table 5.
Summary of the physical properties of the selected materials.
Table 5.
Summary of the physical properties of the selected materials.
| Property | Packing Material |
|---|
| GB | GS | GW | MO |
|---|
| Composition | Uniform | Uniform | Non-uniform | Non-uniform |
| Porosity | Non-porous | Non-porous | Porous | Highly porous |
| Shape | Spherical | Irregular | Irregular | Irregular |
| Packing Orientation | Ordered | Random | Random | Random |
| Wettability | Moderate | Moderate | High | Low |
Table 6.
Five test solutions used in the capillary suction tests with their associated dynamic viscosities and densities at 30 °C.
Table 6.
Five test solutions used in the capillary suction tests with their associated dynamic viscosities and densities at 30 °C.
| Glycerol (wt%) | Dynamic Viscosity (cP) | Density (g/mL) |
|---|
| 0 | 0.8 | 0.996 |
| 15 | 1.2 | 1.027 |
| 25 | 1.6 | 1.053 |
| 30 | 1.9 | 1.069 |
| 35 | 2.2 | 1.081 |
Table 7.
Bed characterisation and quantified RTD parameters for packed beds composed of different size fractions of GSs, GW, and MO. Key: E-tag (experimental tag), PSD (particle size distribution), BD (bulk density), BV (bed voidage), LH (total liquid hold-up), DM (24-h drain-down moisture as a percentage of total liquid hold-up), and BT (solution breakthrough time).
| Packing | E-Tag | PSD (mm) | Bed Characterisation Parameters | RTD Parameters |
|---|
| BD (g/cm3) | BV (-) | LH (-) | DM (%) | BT (mins) | (mins)
| | |
|---|
| Glass beads | GB-2 | 2 | 1.58 | 0.30 | 0.02 | 3.1 | 16 | 26 | 35 | 3.51 |
| GB-5 | 5 | 1.45 | 0.33 | 0.01 | 15.6 | 9 | 18 | 22 | 3.01 |
| Glass shards | GS-1-2 | 1.0–2.0 | 1.22 | 0.34 | 0.02 | 46.5 | 35 | 46 | 47 | 2.65 |
| GS-2-3 | 2.0–2.8 | 1.15 | 0.38 | 0.02 | 17.5 | 22 | 45 | 67 | 4.19 |
| GS-3-5 | 2.8–4.8 | 1.33 | 0.37 | 0.02 | 11.2 | 16 | 17 | 12 | 2.26 |
| GS-5-7 | 4.8–6.7 | 1.32 | 0.34 | 0.01 | 9.3 | 18 | 14 | 16 | 2.81 |
| GS-7-8 | 6.7–8.0 | 1.29 | 0.38 | 0.02 | 2.8 | 8 | 15 | 15 | 1.93 |
| GS-0.1-8 | 0.1–8.0 | 1.20 | 0.31 | 0.14 | 12.5 | 210 | 291 | 174 | 1.88 |
| GS-0.5-8 | 0.5–8.0 | 1.13 | 0.33 | 0.08 | 47.0 | 95 | 167 | 121 | 2.31 |
| GS-1-8 | 1.0–8.0 | 1.22 | 0.43 | 0.06 | 32.5 | 53 | 105 | 150 | 3.30 |
| Greywacke | GW-1-2 | 1.0–2.0 | 1.25 | 0.33 | 0.05 | 87.5 | 68 | 186 | 240 | 1.99 |
| GW-2-3 | 2.0–2.8 | 1.25 | 0.40 | 0.09 | 50.2 | 67 | 158 | 234 | 2.39 |
| GW-3-5 | 2.8–4.8 | 1.24 | 0.39 | 0.08 | 38.2 | 35 | 86 | 119 | 2.80 |
| GW-5-7 | 4.8–6.7 | 1.22 | 0.40 | 0.05 | 34.0 | 36 | 172 | 279 | 1.39 |
| GW-7-8 | 6.7–8.0 | 1.26 | 0.42 | 0.06 | 32.8 | 23 | 94 | 162 | 2.47 |
| GW-0.1-8 | 0.1–8.0 | 1.22 | 0.32 | 0.14 | 17.2 | 198 | 316 | 271 | 1.75 |
| GW-0.5-8 | 0.5–8.0 | 1.13 | 0.35 | 0.09 | 49.3 | 77 | 197 | 178 | 2.23 |
| GW-1-8 | 1.0–8.0 | 1.23 | 0.44 | 0.08 | 38.6 | 39 | 132 | 204 | 2.34 |
| Malachite ore | MO-1-2 | 1.0–2.0 | 1.02 | 0.48 | 0.15 | 25.9 | 255 | 290 | 183 | 1.28 |
| MO-2-3 | 2.0–2.8 | 1.00 | 0.49 | 0.15 | 31.6 | 75 | 236 | 207 | 1.78 |
| MO-3-5 | 2.8–4.8 | 1.07 | 0.43 | 0.11 | 30.4 | 51 | 143 | 229 | 2.32 |
| MO-5-7 | 4.8–6.7 | 1.00 | 0.45 | 0.10 | 29.3 | 46 | 190 | 234 | 1.08 |
| MO-7-8 | 6.7–8.0 | 1.01 | 0.49 | 0.09 | 19.0 | 21 | 100 | 161 | 2.17 |
| MO-0-8 | 0.0–8.0 | 1.19 | 0.44 | 0.26 | 10.4 | 302 | 548 | 272 | 0.78 |
| MO-0-8 (1.2cP) | 0.0–8.0 | 1.20 | 0.44 | 0.24 | 13.4 | 296 | 485 | 230 | -0.35 |
| MO-0-8 (1.6cP) | 0.0–8.0 | 1.17 | 0.47 | 0.27 | 15.4 | 334 | 499 | 217 | -0.35 |
| MO-0-8 (1.9cP) | 0.0–8.0 | 1.18 | 0.51 | 0.32 | 11.9 | 255 | 514 | 226 | -0.31 |
| MO-0-8 (2.2cP) | 0.0–8.0 | 1.19 | 0.46 | 0.23 | 16.9 | 245 | 470 | 236 | -0.03 |
| MO-0.1-8 | 0.1–8.0 | 1.21 | 0.41 | 0.17 | 16.9 | 229 | 396 | 272 | 1.11 |
| MO-0.5-8 | 0.5–8.0 | 1.10 | 0.45 | 0.15 | 28.4 | 174 | 317 | 147 | 1.17 |
| MO-1-8 | 1.0–8.0 | 1.19 | 0.51 | 0.13 | 36.8 | 168 | 287 | 202 | 1.12 |


