
Orthorhombic-Cubic Phase Transition in Rb2CoSi5O12 Leucite Analogue

Materials and Engineering Research Institute, Sheffield Hallam University, Sheffield S1 1WB, UK
Minerals 2023, 13(2), 210; https://doi.org/10.3390/min13020210
Submission received: 8 December 2022
/
Revised: 27 January 2023
/
Accepted: 30 January 2023
/
Published: 31 January 2023
(This article belongs to the Special Issue The Crystal Chemistry and Mineralogy of Critical Metals)
Abstract
:An Rb2CoSi5O12 leucite analogue has been synthesized. An ambient temperature X-ray powder diffraction study shows that this analogue has the Pbca orthorhombic structure of Cs2CdSi5O12. A high temperature X-ray powder diffraction study on this analogue shows a Pbca orthorhombic to cubic phase transition at 457 K. The Rb2CoSi5O12 unit cell volume initially decreases with increasing temperature on passing through this phase transition.
1. Introduction
Synthetic analogues of the silicate framework minerals leucite KAlSi2O6 [1] and pollucite CsAlSi2O6 [2] can be prepared with the general formulae ABSi2O6 and A2CSi5O12. A is an alkali metal cation (K, Rb, Cs), B is a trivalent cation (Al, B, Fe3+, Ga) and C is a divalent cation (Be, Mg, Mn, Fe2+, Co, Ni, Cu, Zn, Cd). These structures have tetrahedrally coordinated silicate frameworks with B or C cations partially substituting for Si on the tetrahedrally coordinated silicon sites (T-sites). A cations sit in the extra framework channels; these A cations can be removed by ion exchange which makes them of technological interest as possible storage media for radioactive Cs from nuclear waste [3].
Leucite analogues with high symmetry structures such as I41/a tetragonal KGaSi2O6 [4] and Ia-3d cubic Rb2ZnSi5O12 [5] have B and C cations disordered over the T-sites. However, lower symmetry leucite structures are known where C cations are ordered onto separate T-sites. The P21/c monoclinic K2MgSi5O12 [6] structure has twelve crystallographically distinct and fully ordered T-sites, ten of these are fully occupied by Si and two are fully occupied by Mg. Three more K2CSi5O12 (C = Fe2+, Co, Zn) structures [7] are known which are isostructural with P21/c monoclinic K2MgSi5O12 and have fully ordered T-sites. The Pbca orthorhombic structure of Cs2CdSi5O12 [8] has six crystallographically distinct and fully ordered T-sites, five of these are fully occupied by Si and one is fully occupied by Cd. Five more structures with the general formula Cs2CSi5O12 (C = Mg, Mn, Co, Cu, Zn) [9,10,11], four structures with the general formula Rb2CSi5O12 (C = Mg, Mn, Ni, Cd) [9,10,12] and three structures with the general formula RbCsCSi5O12 (C = Mg, Ni, Cd) [13] are all isostructural with the fully T-site cation ordered structure of Cs2CdSi5O12. However, Nuclear Magnetic Resonance spectroscopy [14] and high-resolution synchrotron X-ray powder diffraction [10] studies on Cs2ZnSi5O12 described a Pbca structure where Zn is partially disordered over two of the six T-sites.
High temperature neutron and X-ray powder diffraction studies on KAlSi2O6, RbAlSi2O6 and KFe3+Si2O6 [15] and KGaSi2O6 [4] showed first-order phase transitions from I41/a to Ia-3d (isostructural with pollucite CsAlSi2O6). High temperature X-ray powder diffraction studies on K2MgSi5O12 [16] and K2ZnSi5O12 [17] showed first-order phase transitions from P21/c to Pbca (isostructural with Cs2CdSi5O12.)
A high temperature study from 295 to 1173 K [18] has also been done on three Cs2CSi5O12 (C = Cu, Cd, Zn) leucite analogues using lower resolution synchrotron X-ray powder diffraction. For Cs2ZnSi5O12, the ambient temperature crystal structure shows (unlike for the high-resolution synchrotron X-ray powder diffraction study) that the Pbca structure is also isostructural with Cs2CdSi5O12 with complete T-site cation ordering. However, the sample with C = Zn shows evidence for a transition to a previously unknown cubic structure, with some T-site cation disorder, at 566 K, on heating. This transition is reversible on cooling to 633 K.
Rb2CSi5O12 leucite structures are known where C = Cd, Ni, Mg, Mn and Zn [5,7,9,10,12] as is the structure of Cs2CoSi5O12 [9]. A cubic lattice parameter of 13.4(1)Å for Rb2CoSi5O12 has been reported [19] but there is no published crystal structure for this leucite analogue. Therefore, a sample of Rb2CoSi5O12 leucite analogue has been synthesized. An ambient temperature X-ray powder diffraction study on this analogue has been undertaken to determine the crystal structure for Rb2CoSi5O12. A high temperature X-ray powder diffraction study has also been done to look for any phase transitions.
2. Materials and Methods
A sample of Rb2CoSi5O12 was synthesized from a stoichiometric mixture of Rb2CO3 (Alfa Aesar, Heysham, United Kingdom, 99.5%); CoO (Sigma-Aldrich, St. Louis, MO, USA, 99.98%) and SiO2 (Better Equipped purified white silica sand, Nantwich, United Kingdom). The mixture was then heated overnight at 873 K to decompose the carbonates and melted in a platinum crucible at 1673 K for 1.5 h before quenching to form a glass. The Rb2CoSi5Ol2 glass was then dry crystallized at ambient pressure and 1393 K for 5 days. These were the same sample preparation conditions as were used to synthesise Cs2CoSi5Ol2 leucite analogue [9].
This sample was then mounted on a low-background silicon wafer with a drop of acetone. Ambient temperature X-ray powder diffraction was then collected on this sample using a PANalytical Empyrean X-ray powder diffractometer (PANalytical, Almelo, Netherlands). Data were collected using CoKa X-rays over the range from 12 to 100 °2θ, the scan time was 19 h.
This Rb2CoSi5Ol2 sample was then loaded into a platinum flat plate sample holder which was loaded into an Anton HTK1200N high temperature stage mounted on a PANalytical X’Pert MPD X-ray powder diffractometer (PANalytical, Almelo, Netherlands). Data were collected using CuKa X-rays over the range from 10 to 80 °2θ. Scans were done at ambient temperature (scan time 30 min) and then in 50 K increments (scan time 2.5 h) from 323 to 1373 K. A second series of high temperature scans were done Rb2CoSi5Ol2 on using the HTK1200N over the range from 10 to 80 °2θ. Scans were done in 10 K increments from 423 to 523 K, the scan time at each temperature was 8 h. A final scan on cooling to ambient temperature was also measured over the range from 10 to 80 °2θ, the scan time was 30 min.
High temperature X-ray powder diffraction data were also collected on a sample of MgO (99.99%, Acros Organics, New Jersey, USA) to calibrate the temperature of the HTK1200N. This was loaded into a platinum flat plate sample holder which was loaded onto the same Anton HTK1200N high temperature stage. Data were collected over the range from 33 to 111 °2θ, the scan time at each temperature was 10 min. Scans were done at ambient temperature and then in 50 K increments from 323 to 1473 K.
Thermogravimetric Analysis (TGA) and Differential Scanning Calorimetry (DSC) were collected on a sample of Rb2CoSi5Ol2 from ambient temperature to 1673 K. Data were collected in a TA Instruments SDT 650 simultaneous TGA/DSC (New Castle, DE, USA), under a flow of compressed air. The instrument was suitably calibrated, an empty alumina crucible was used for the sample holder and reference sample, with no background corrections.
3. Results
3.1. Ambient Temperature X-ray Powder Diffraction
Analysis of the ambient temperature powder diffraction data collected on Rb2CoSi5Ol2 showed that the observed powder diffraction data were a close match to the Powder Diffraction File (http://www.icdd.com/ (accessed on 5 April 2022)) pattern 70-0007 for Rb2NiSi5Ol2. Therefore, the Pbca crystal structure for Rb2NiSi5Ol2 [12], with Co replacing Ni on one of the T-sites, was used as a starting model for Rietveld refinement [20] using GSAS-II [21]. Si-O and Co-O distances for T-sites were restrained to those in the crystal structure for Cs2CoSi5Ol2 [9].
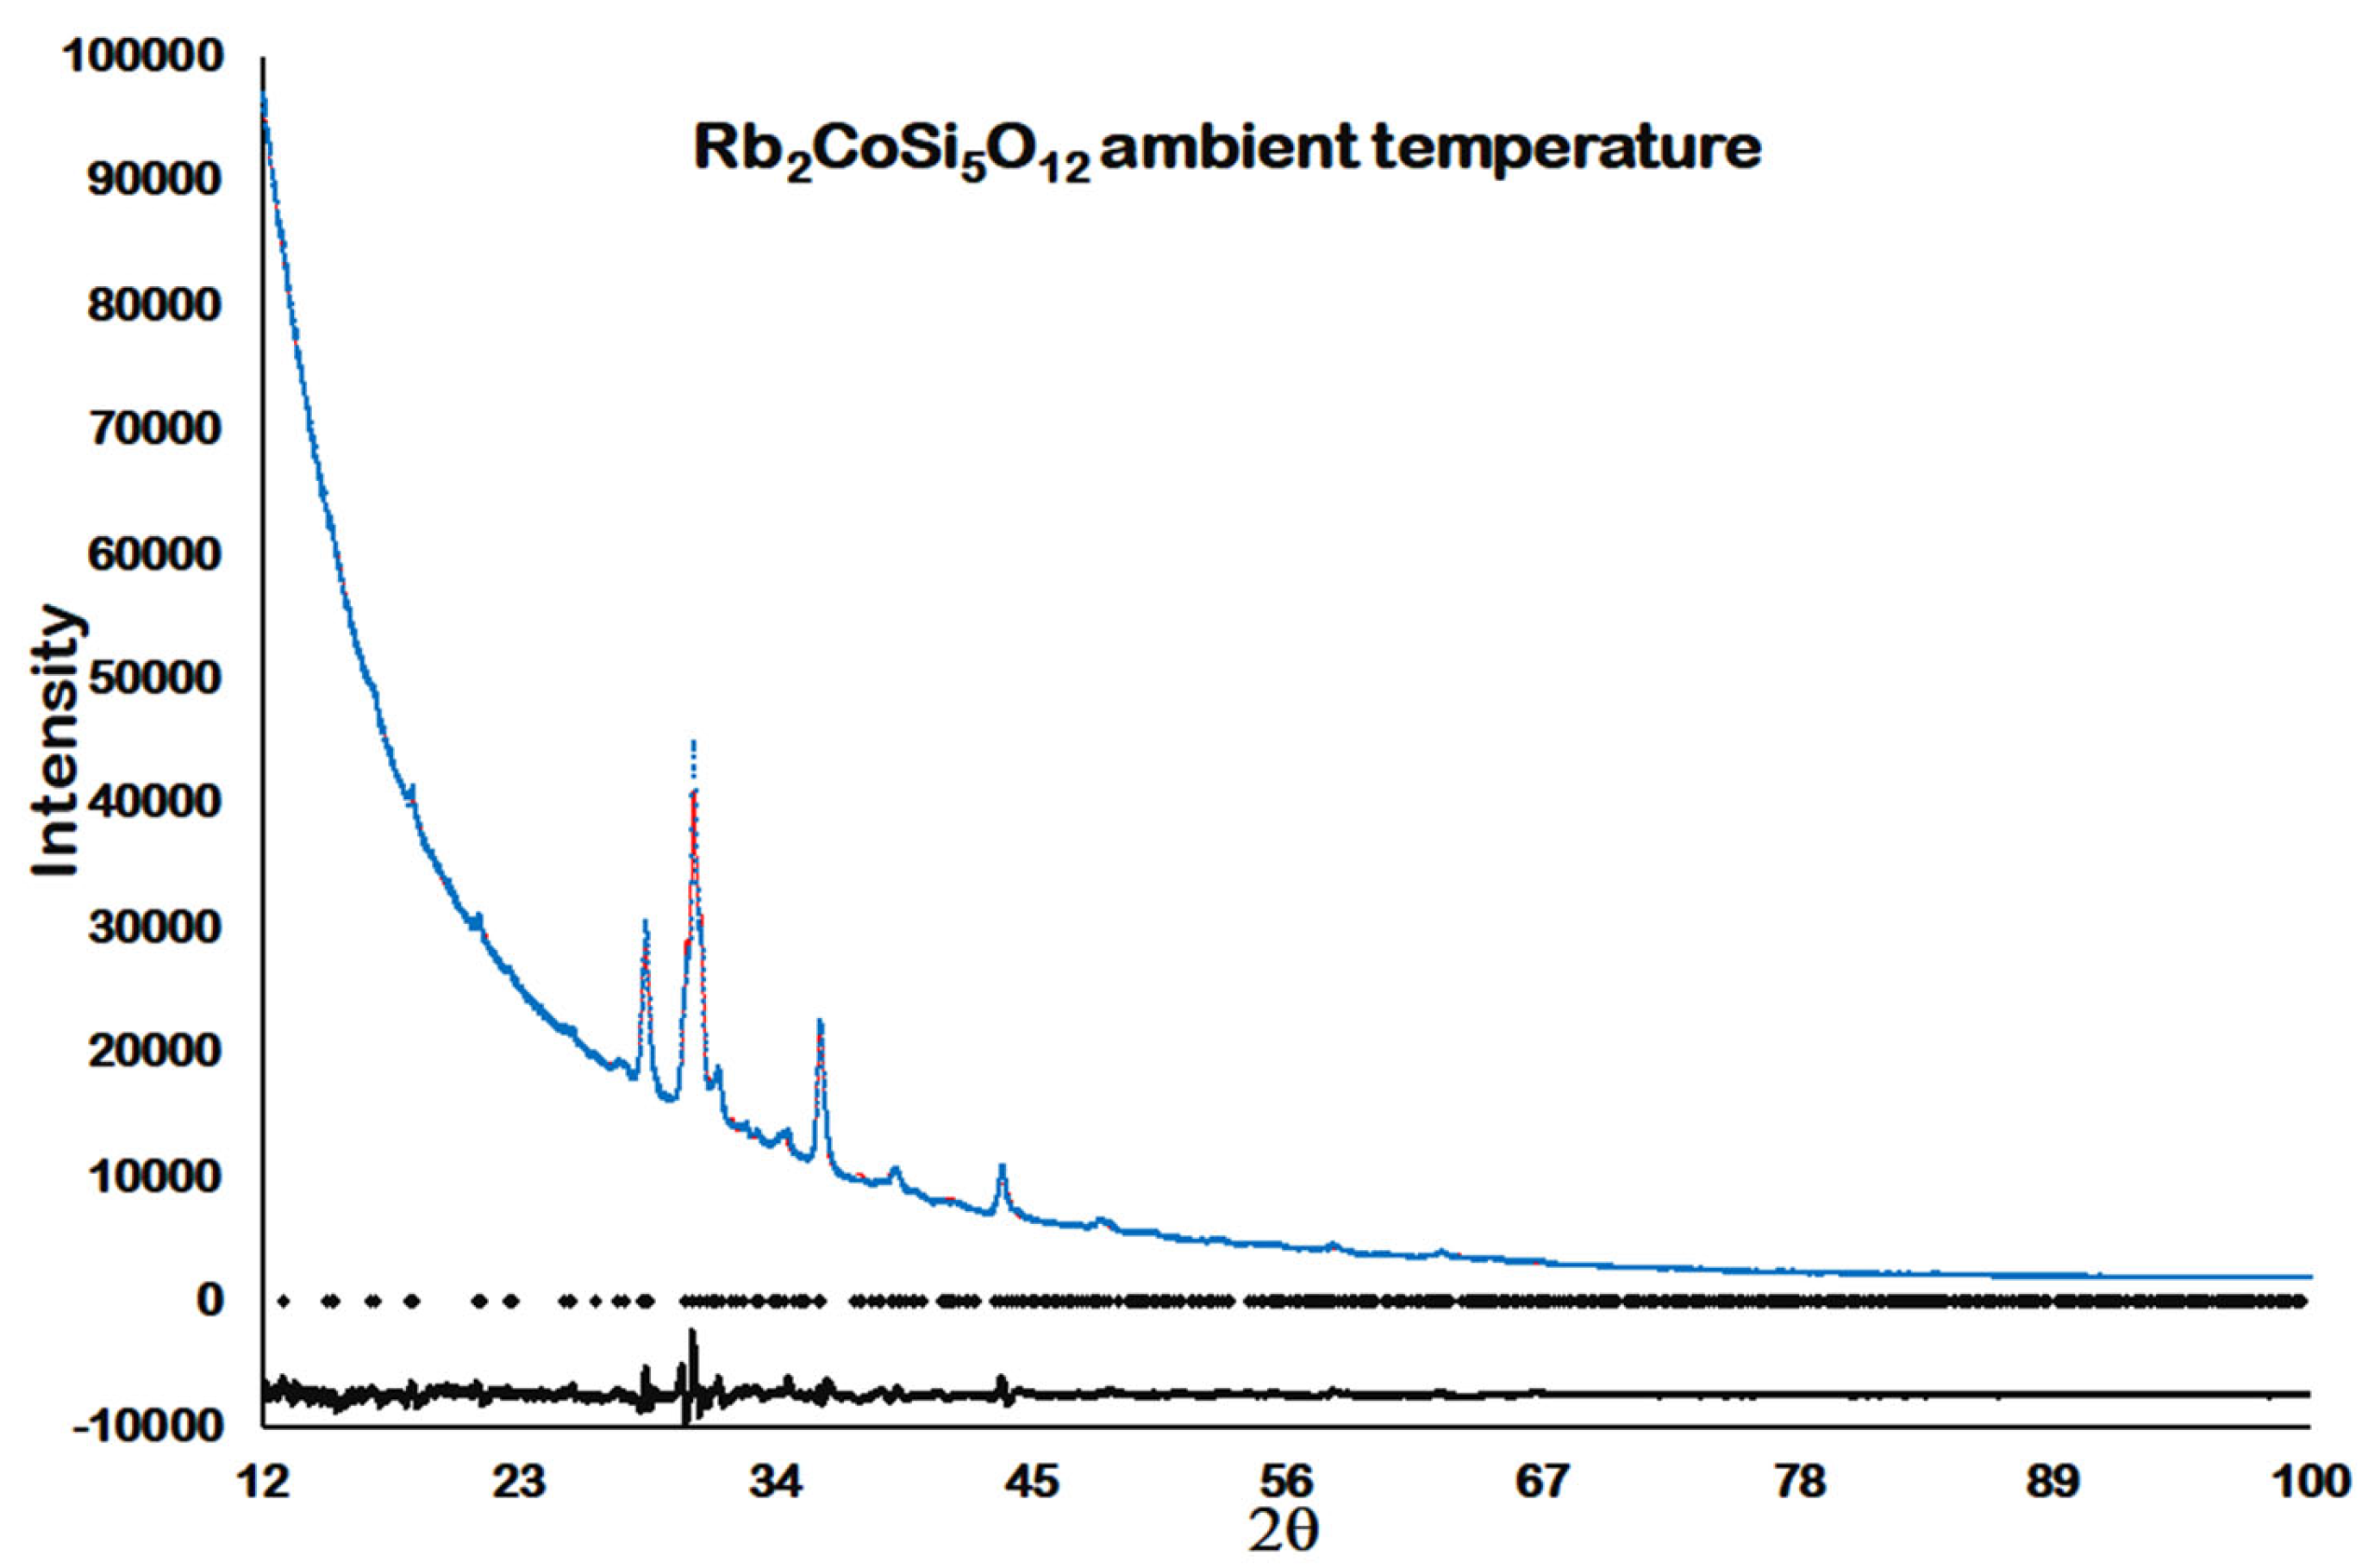
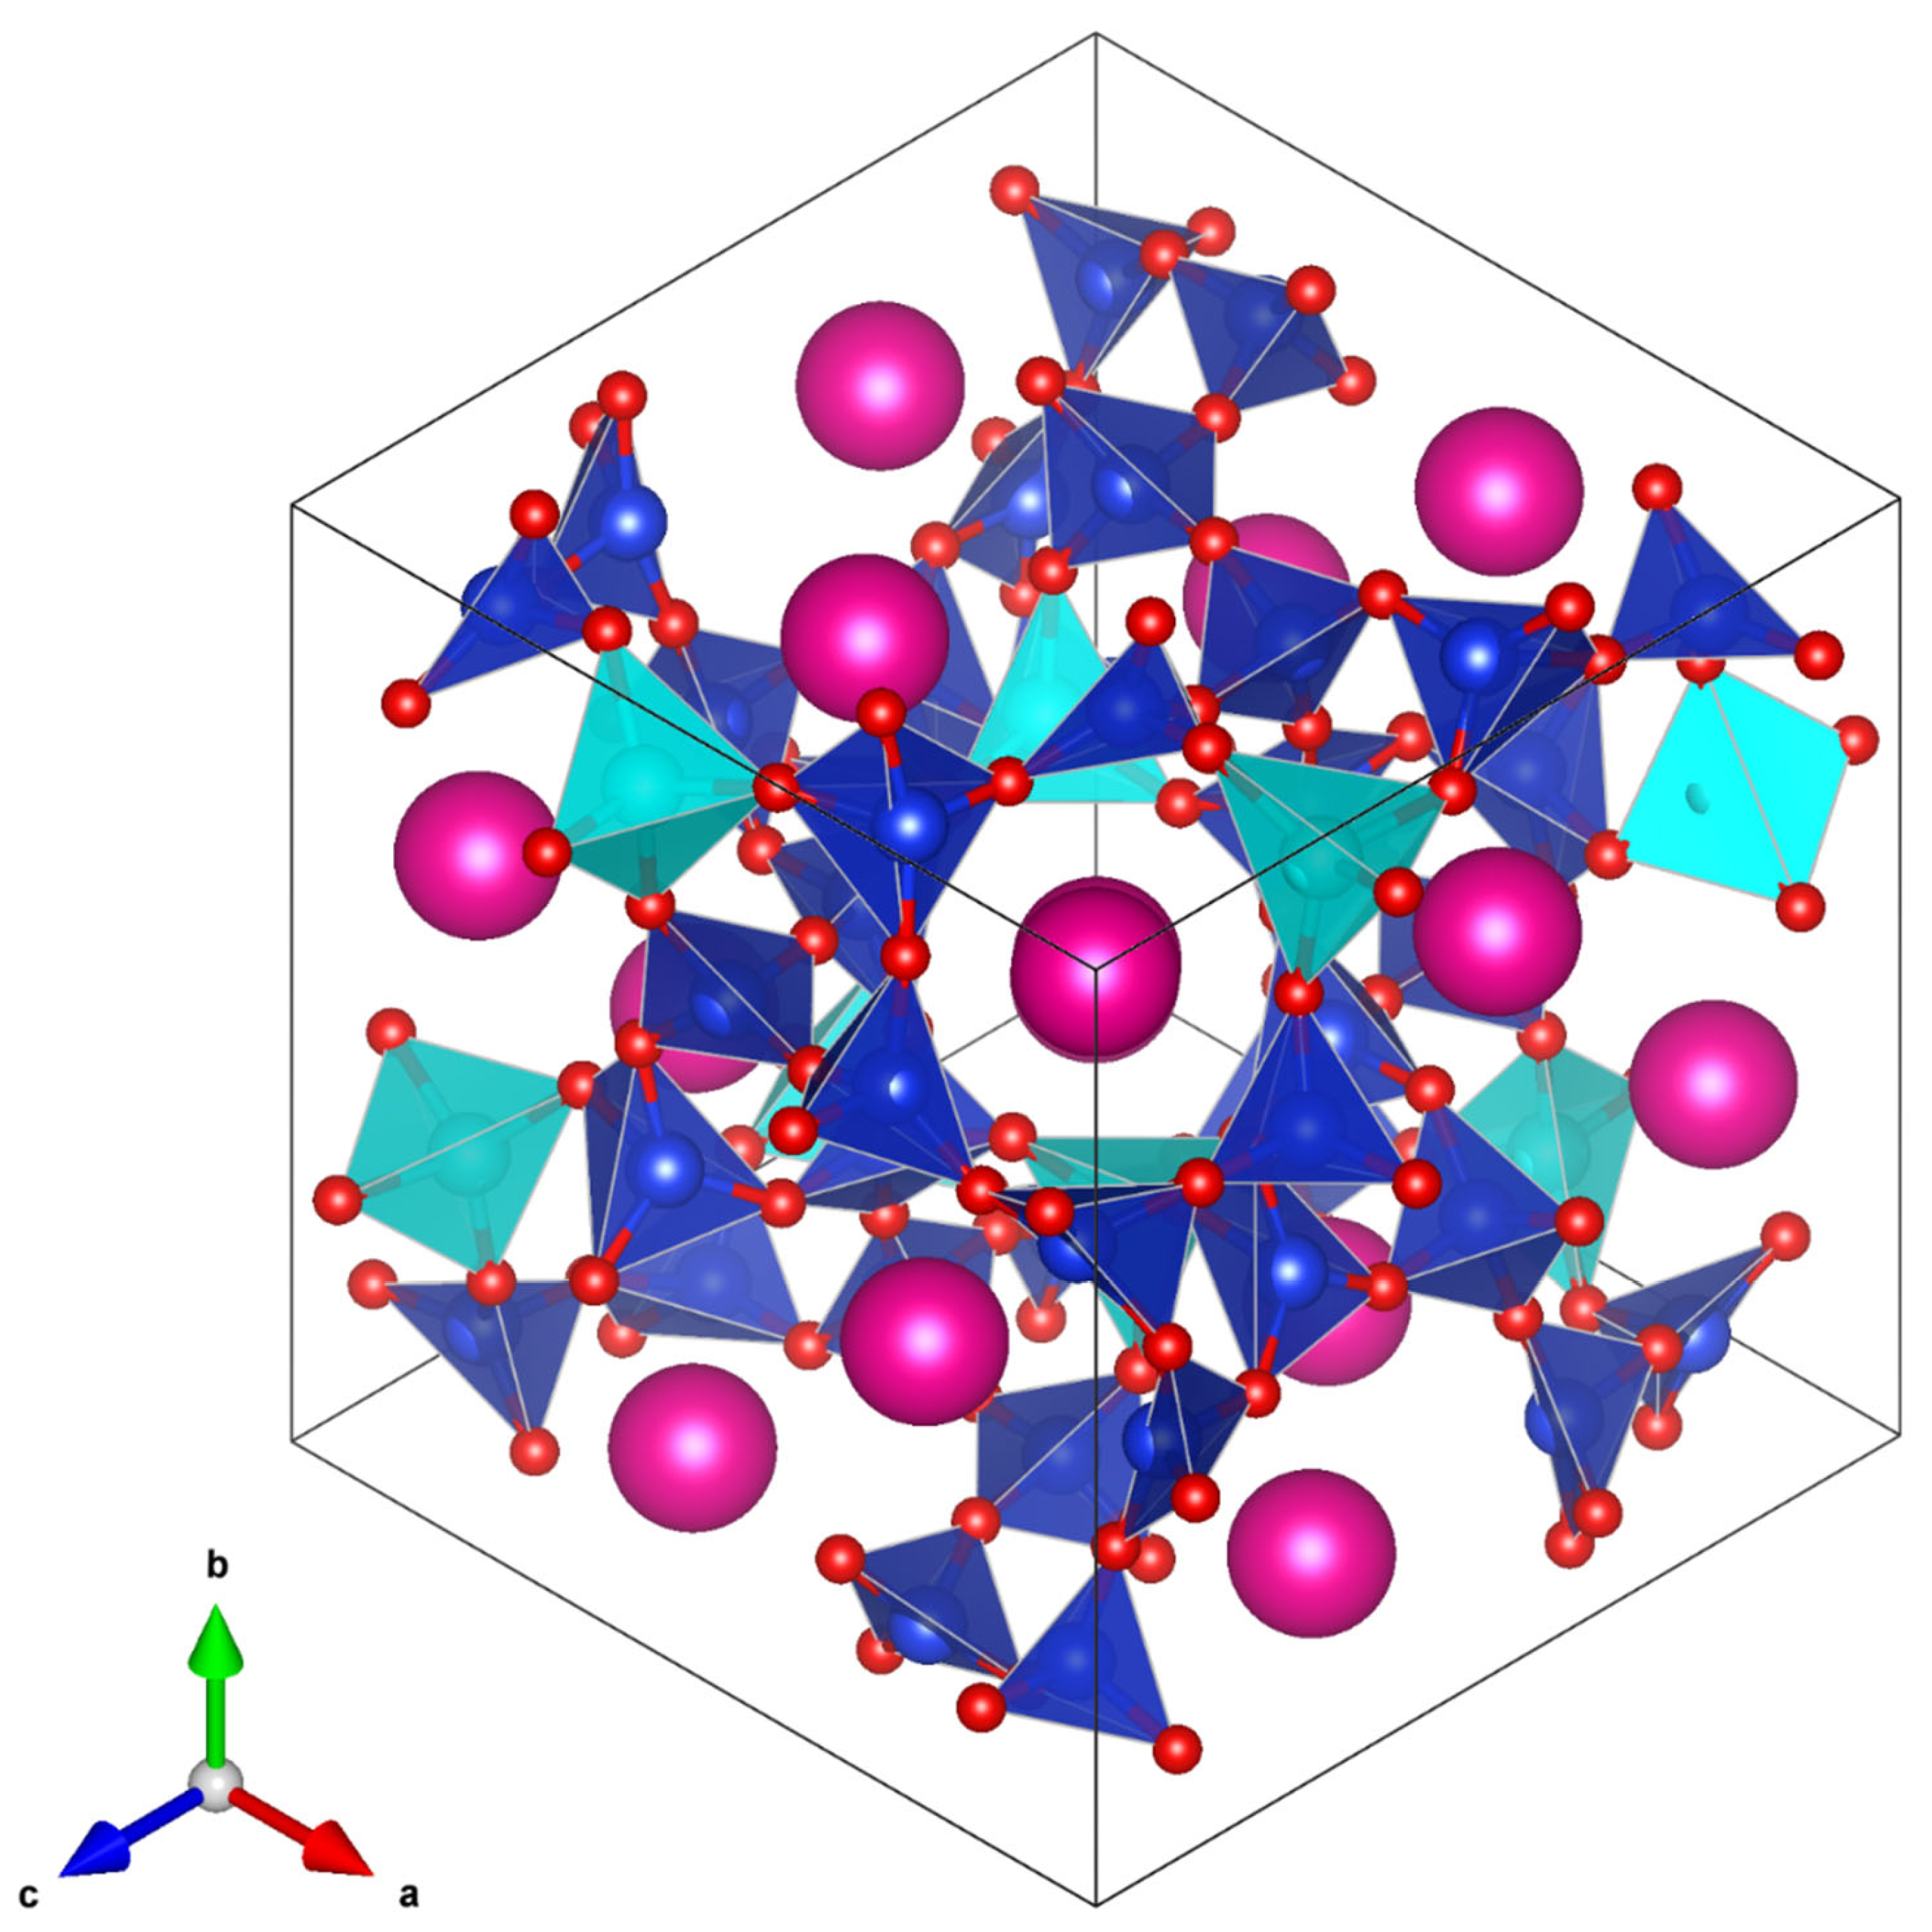
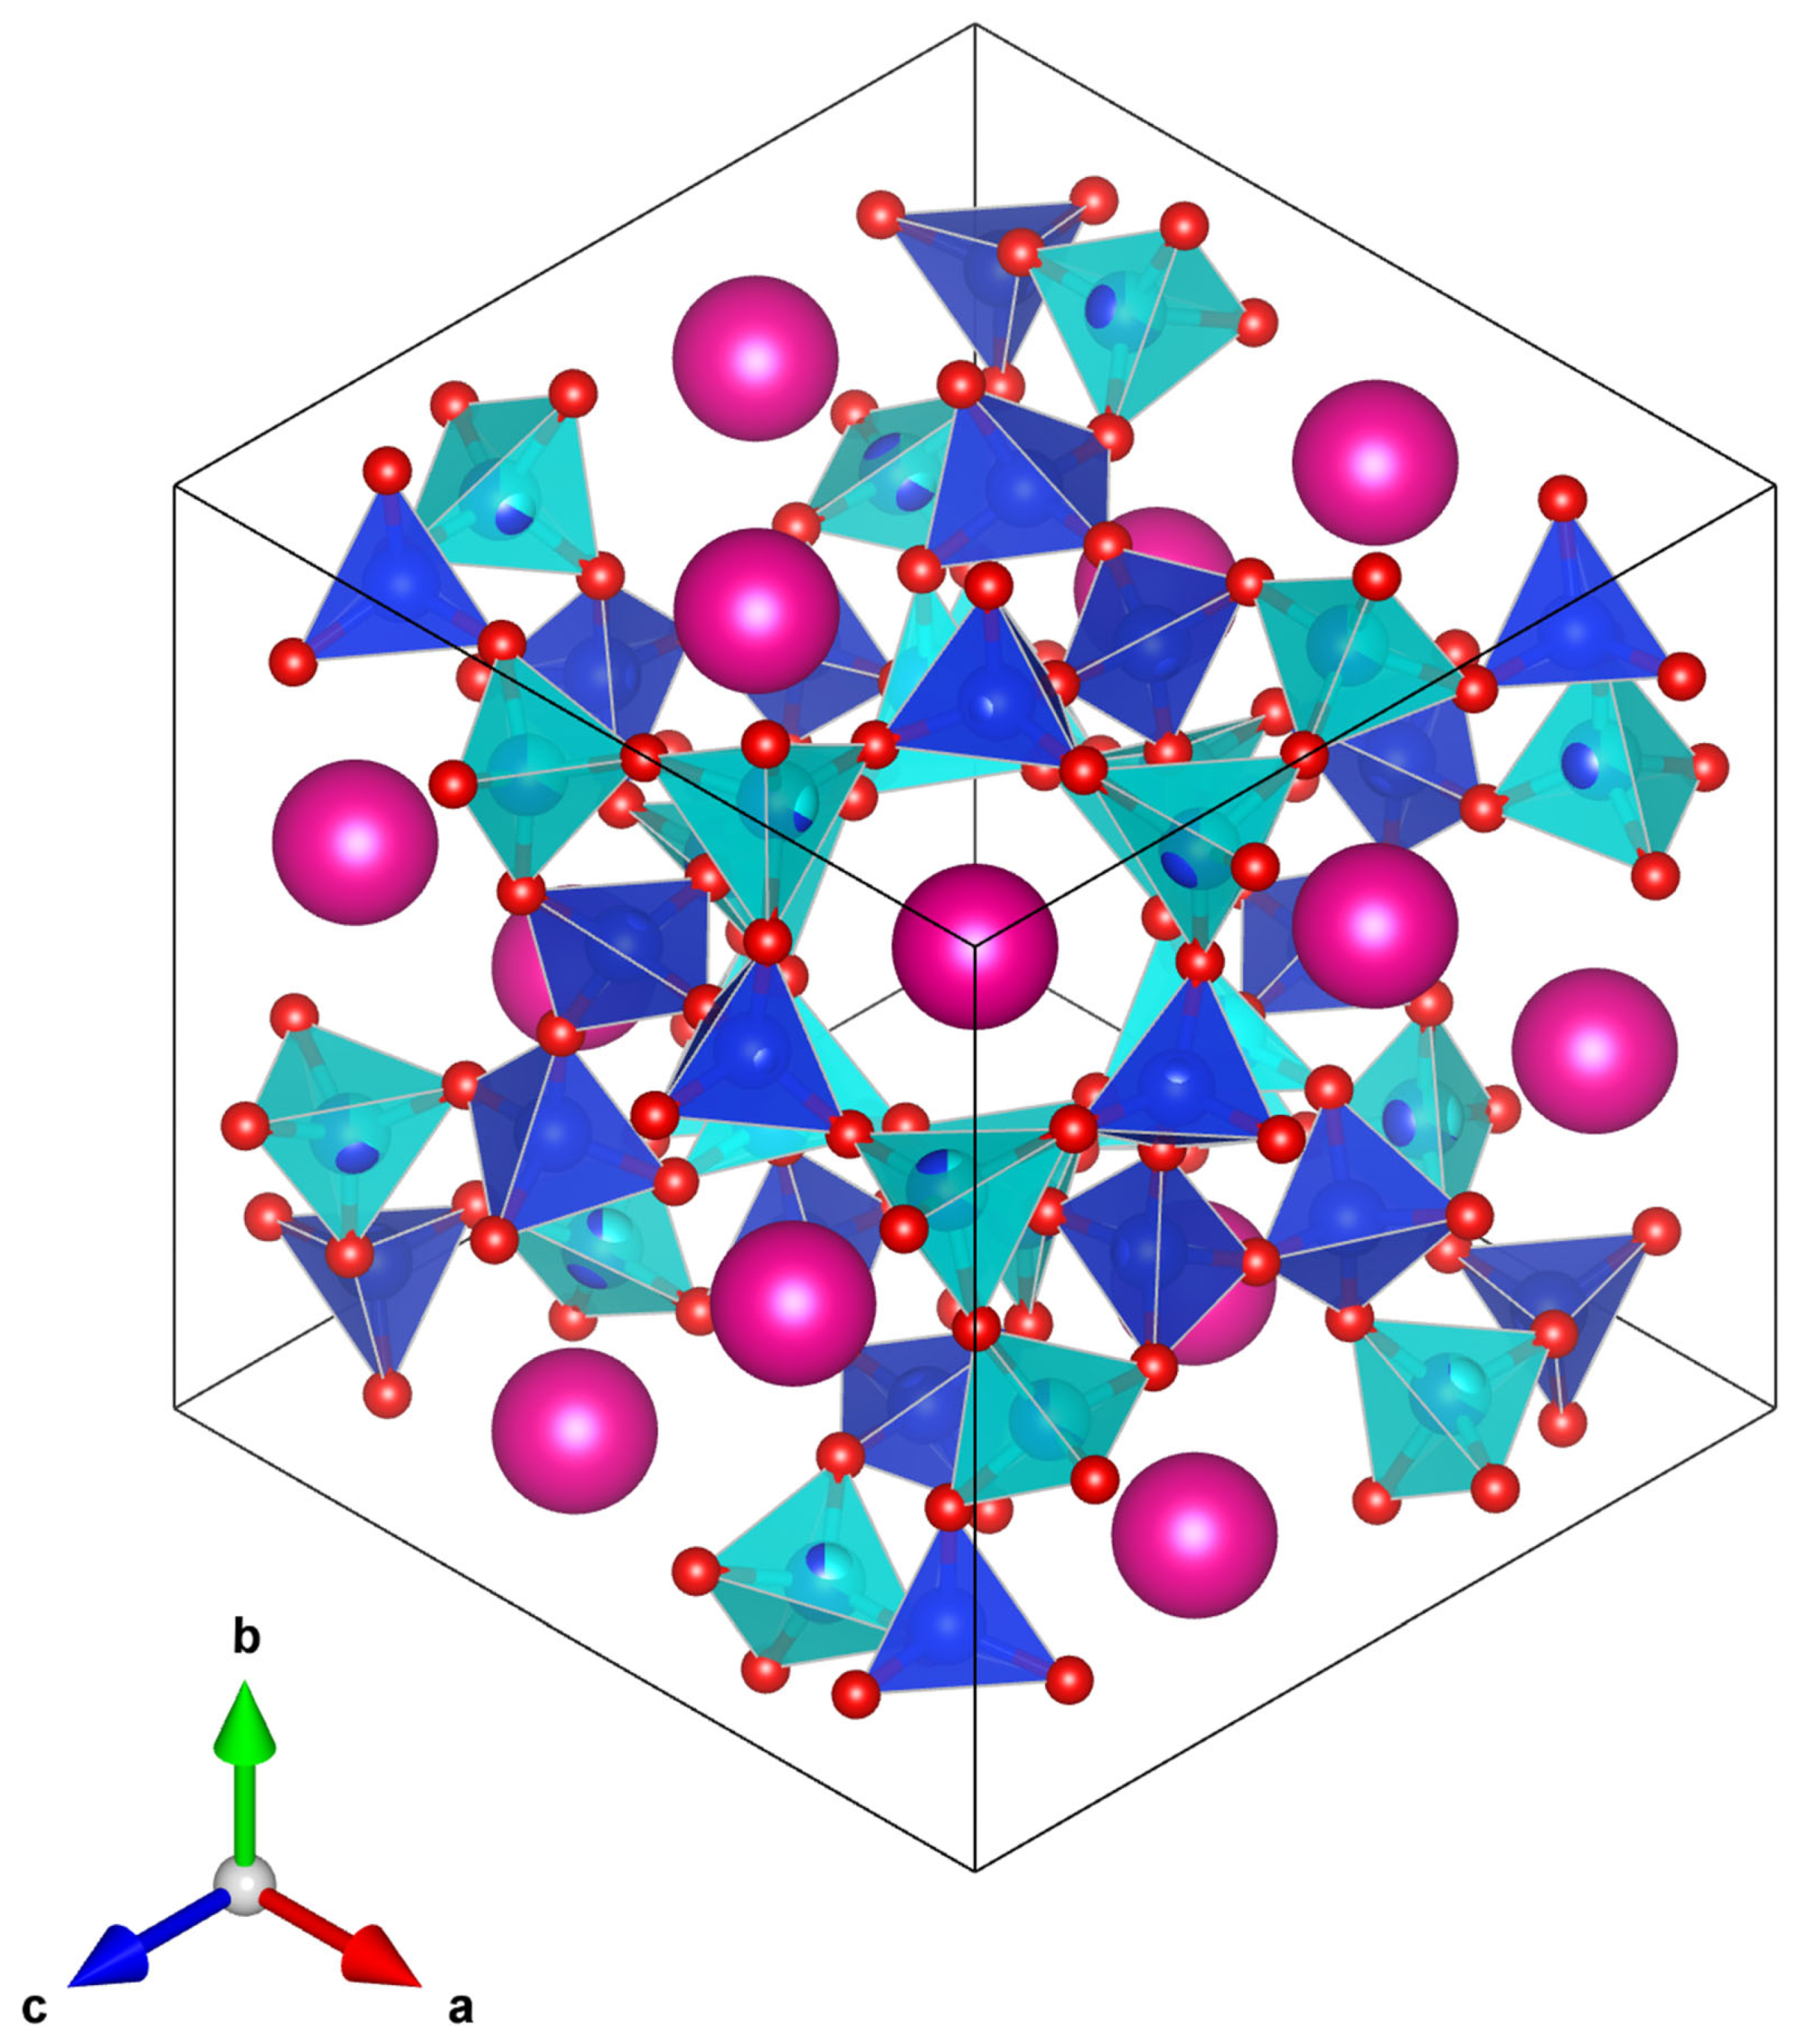
Figure 1 shows the Rietveld difference plot for ambient temperature Rb2CoSi5Ol2. Note that the X-ray powder diffraction data collected for this figure were collected in automatic divergence slit mode. These data were converted to fixed slit mode for Rietveld refinement, hence the very high background at low 2θ angles. Figure 2 shows a VESTA [22] crystal structure plot for the refined ambient temperature Pbca crystal structure of Rb2CoSi5Ol2. Table 1 shows the refined ambient temperature coordinates for Rb2CoSi5Ol2. Table 2 and Table 3 show the interatomic distances and angles for ambient temperature Rb2CoSi5Ol2.
3.2. High Temperature X-ray Powder Diffraction
3.2.1. First High Temperature Scans
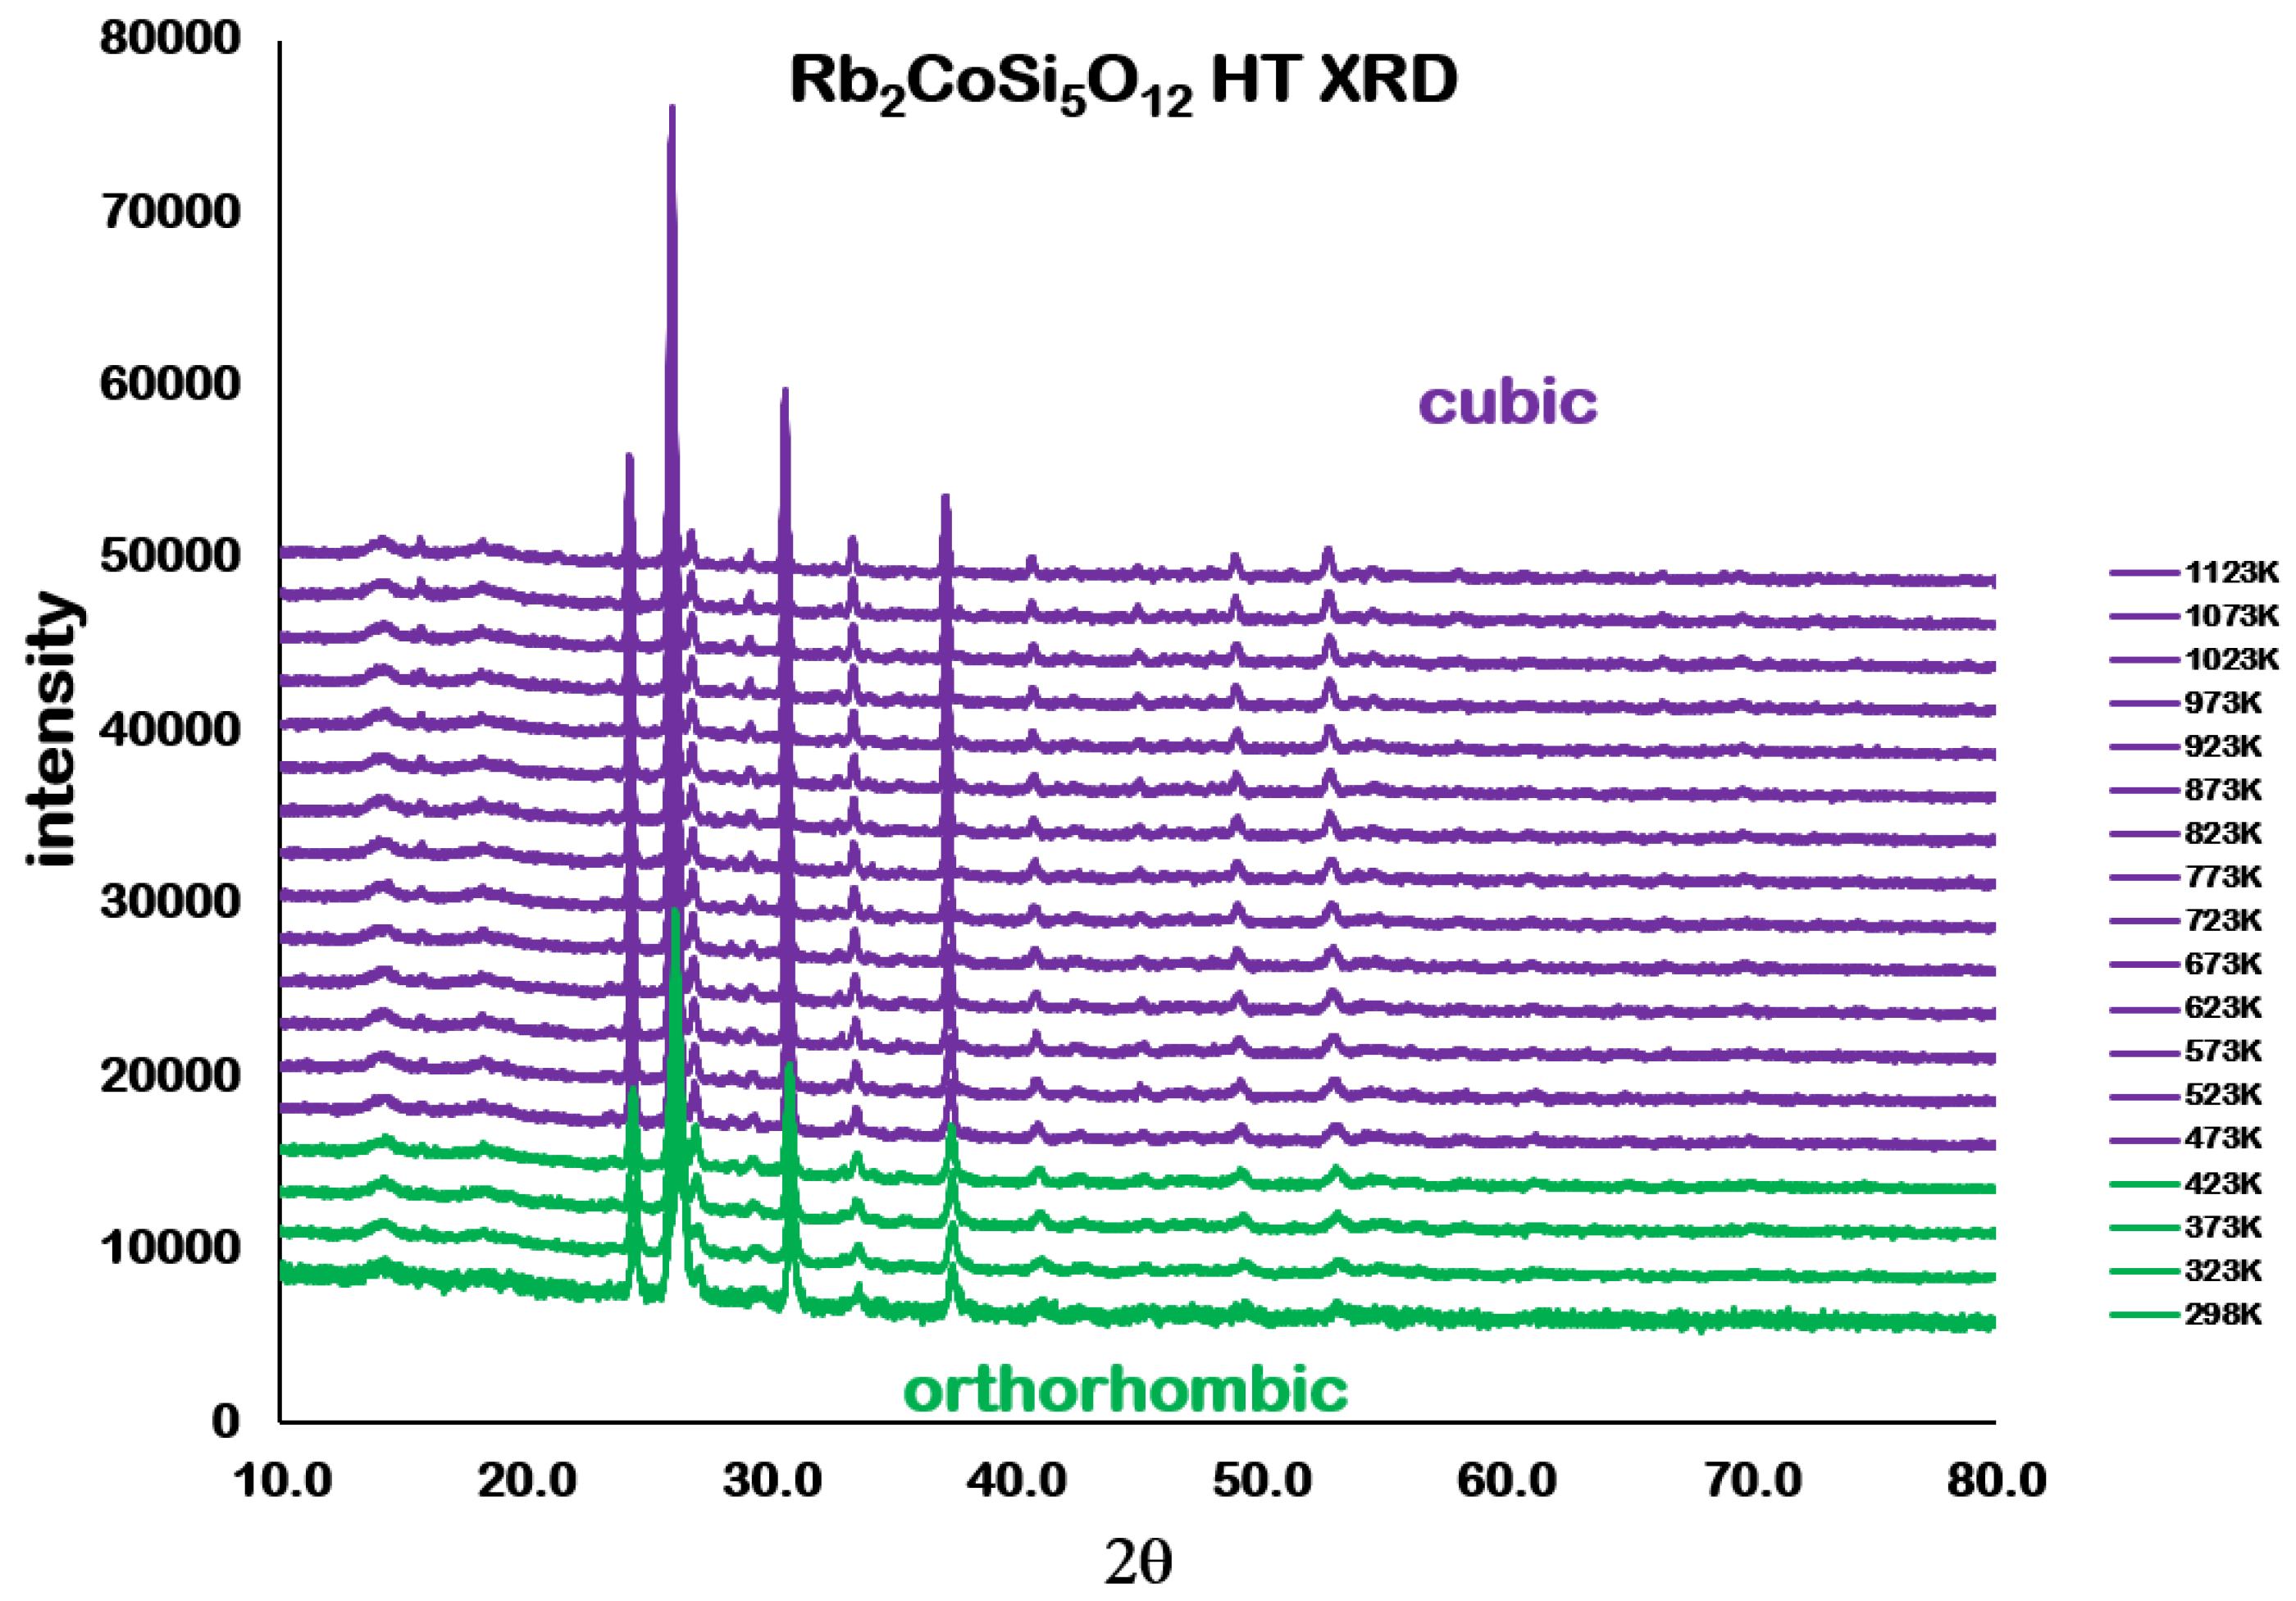
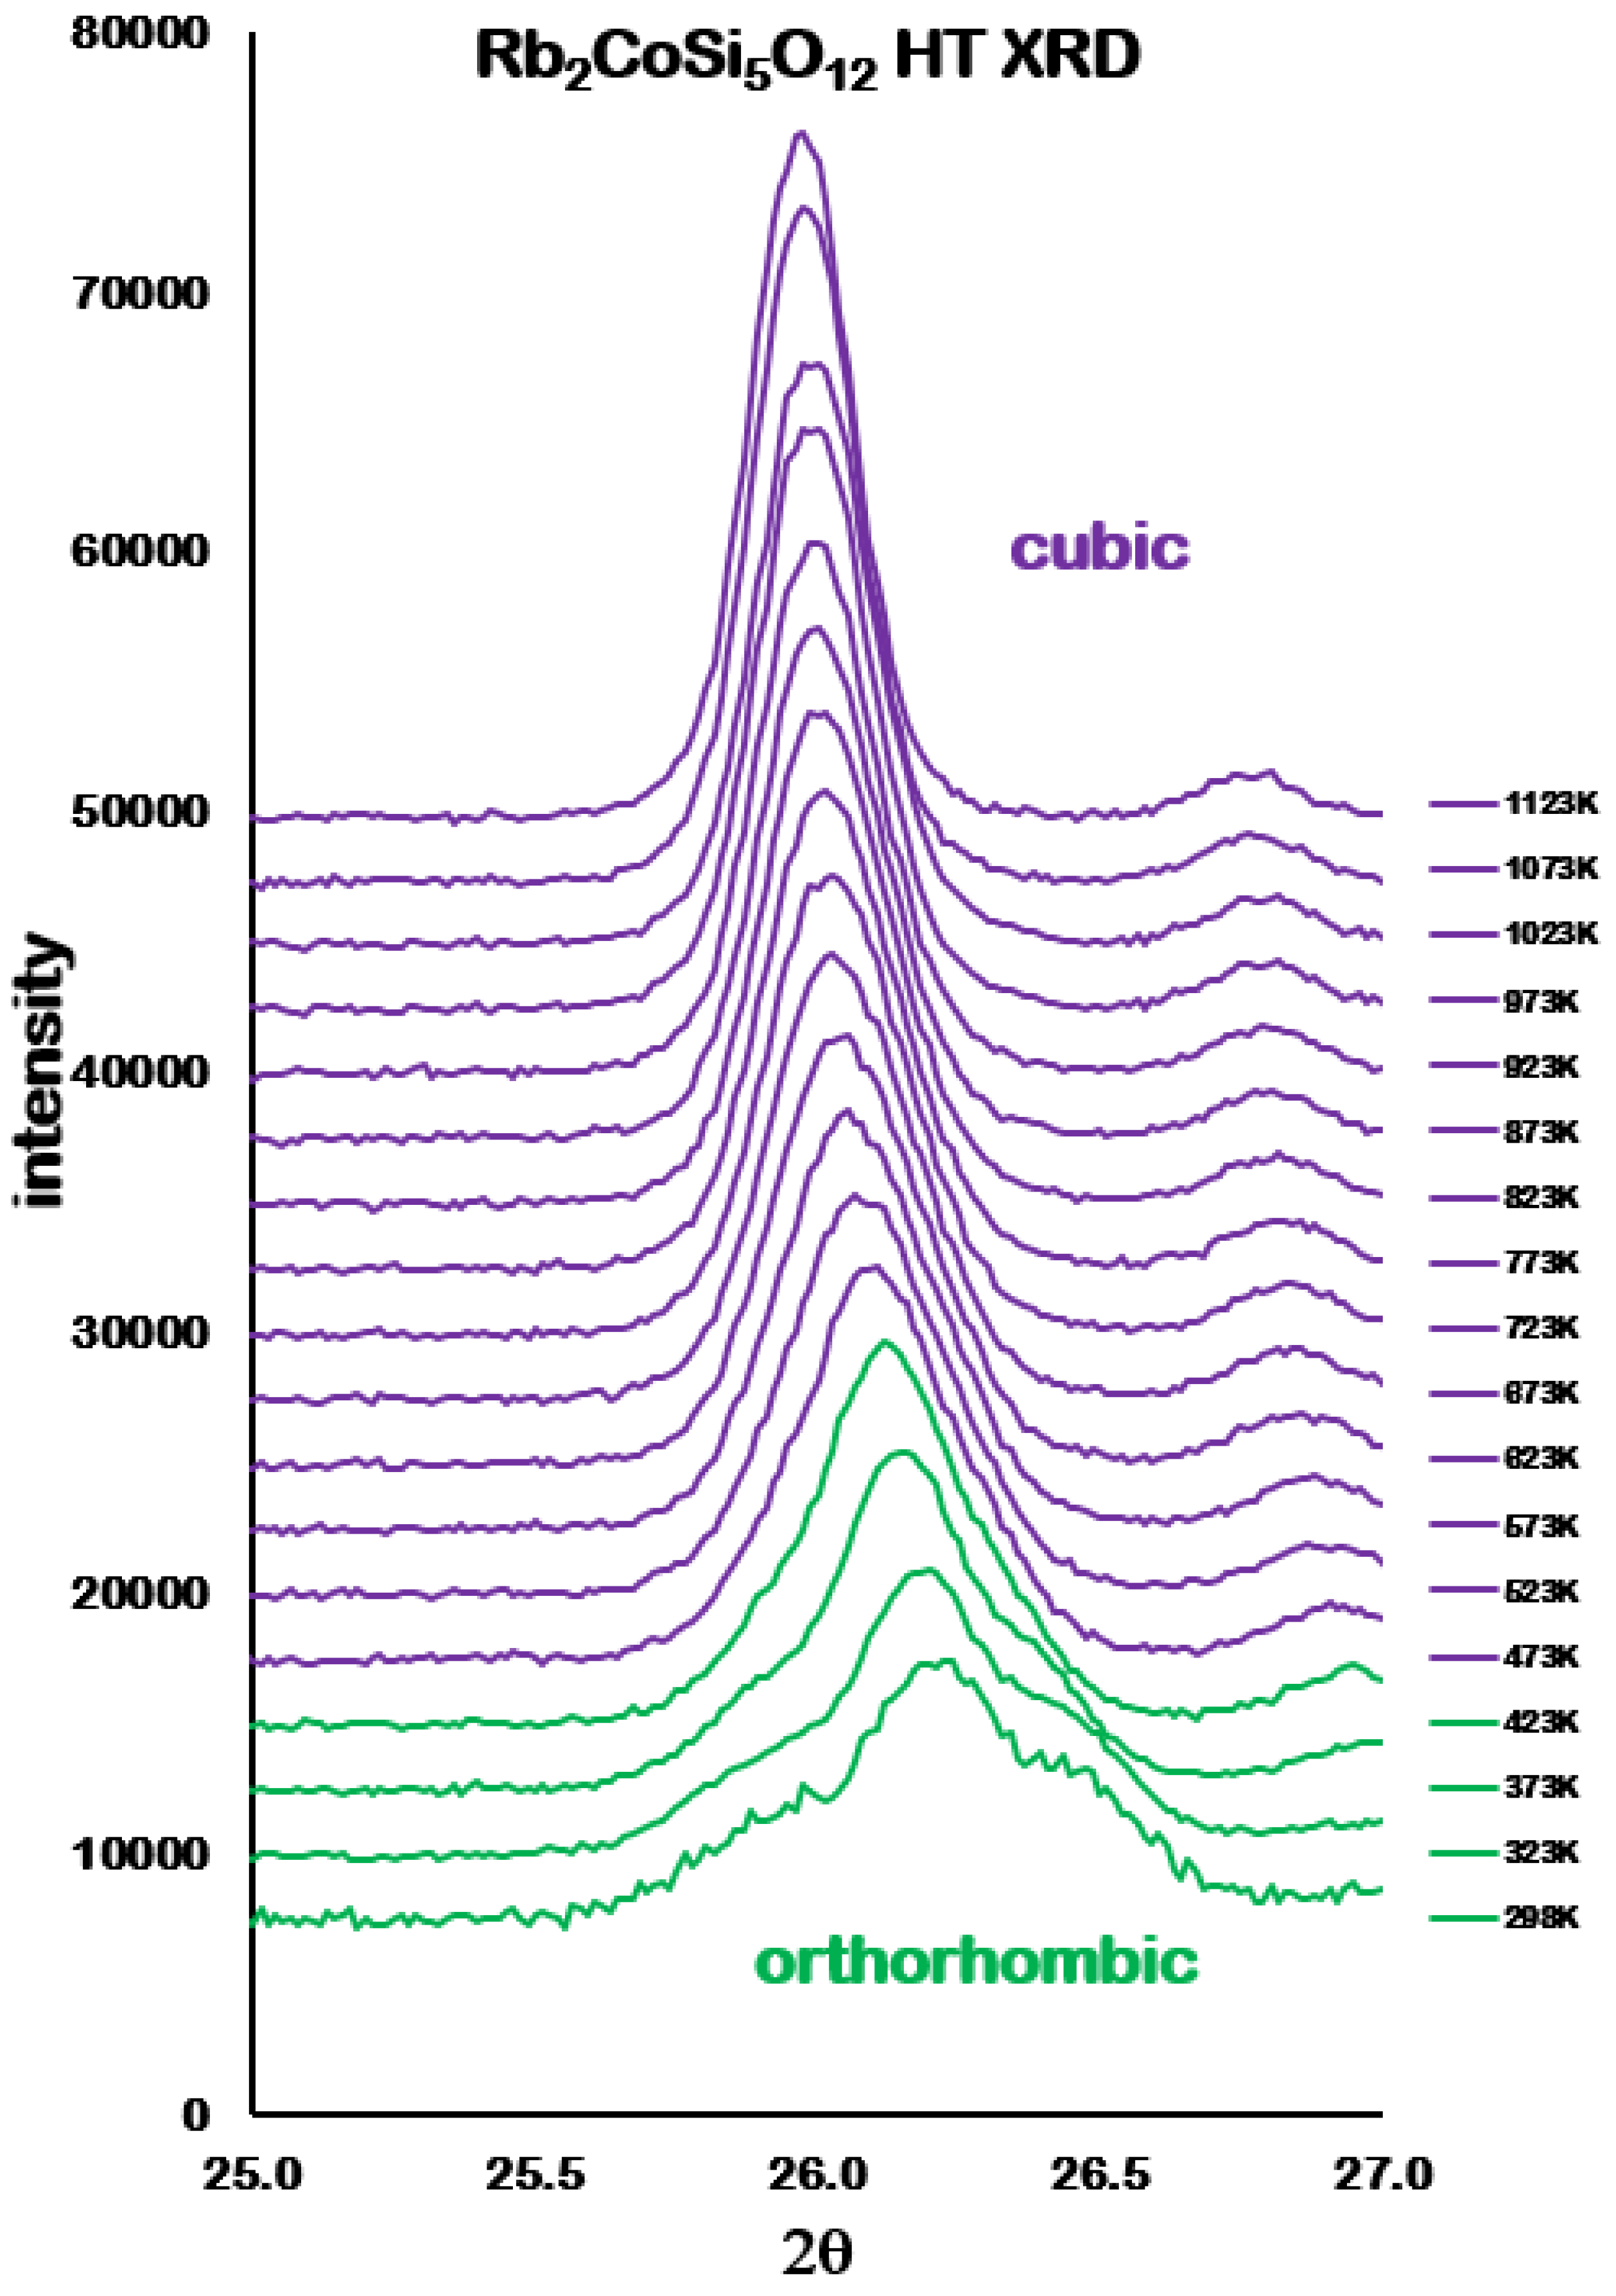
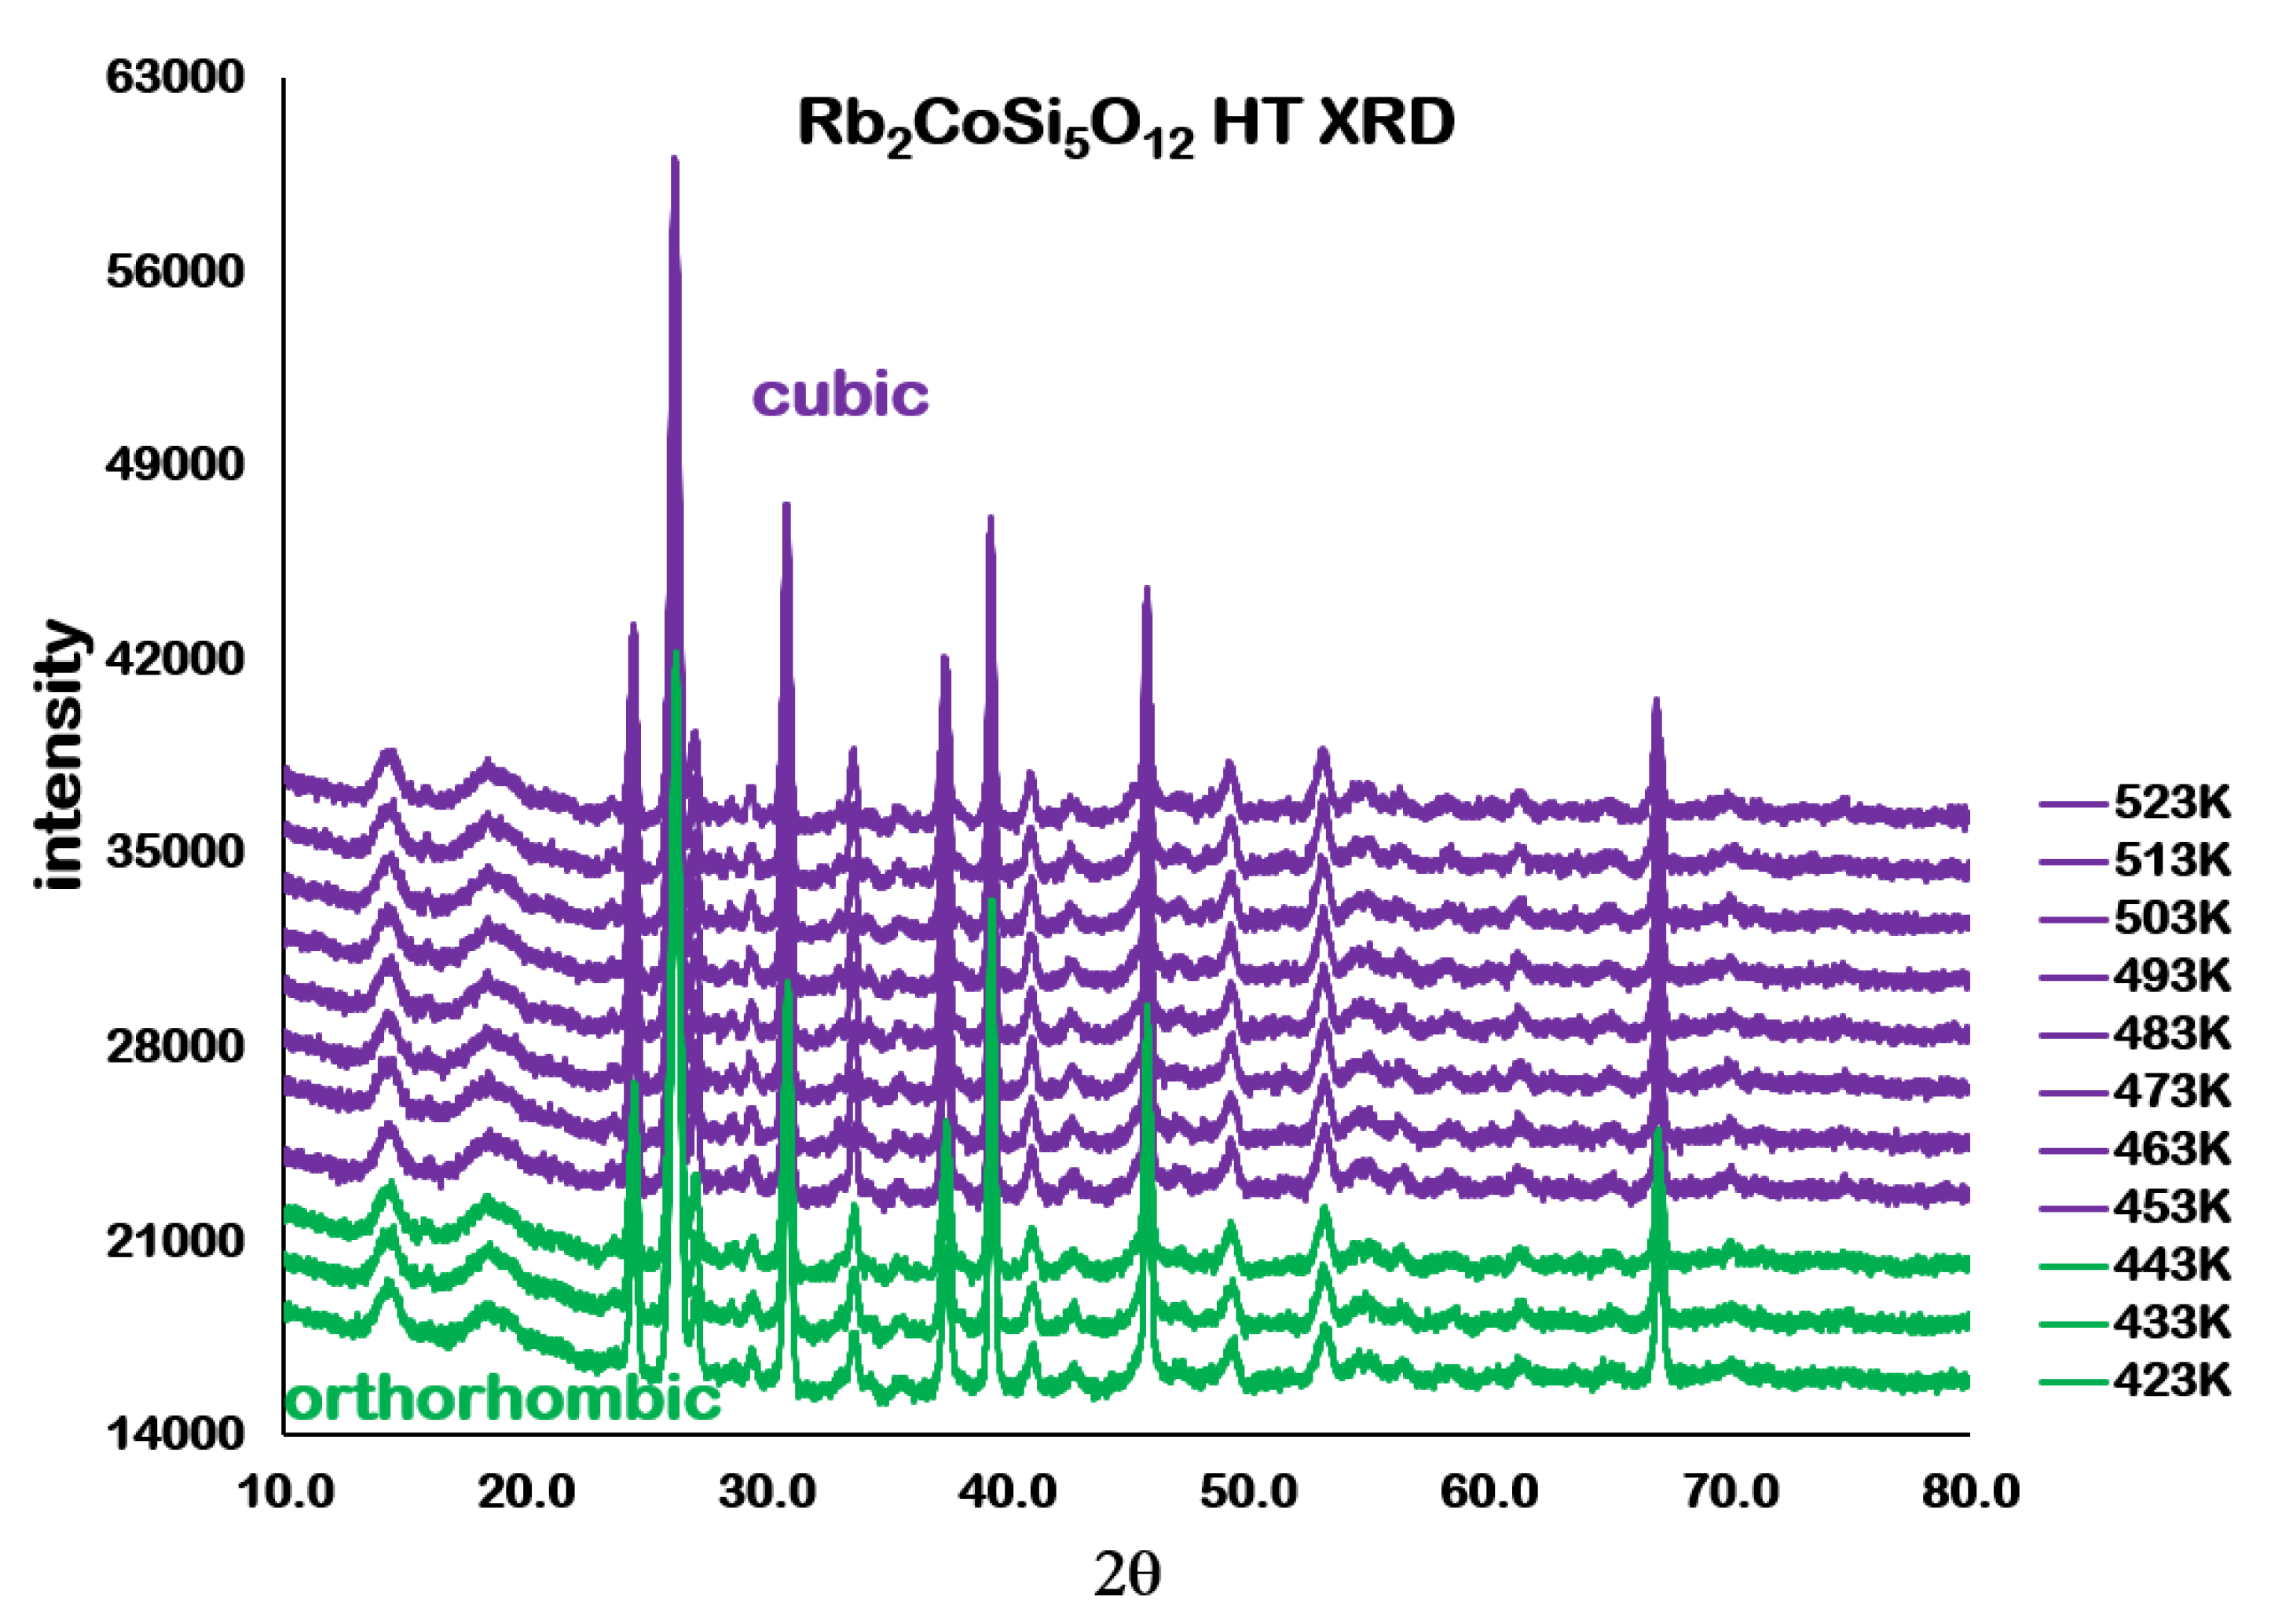
The first series of high temperature scans were done in 50 K increments from 323 to 1373 K. The strongest Bragg reflections in the Pbca orthorhombic powder diffraction patterns for Rb2CoSi5Ol2 were three closely overlapped 004, 040 and 400 Bragg reflections. As the temperature increases, these three reflections merge to form a single peak by 473 K, suggesting a phase transition from orthorhombic to cubic. This single peak is retained to 1123 K. However, at higher temperatures extra peaks appear in the powder diffraction pattern before all the Rb2CoSi5Ol2 peaks disappear at 1323 K; it was not possible to identify any phase(s) causing these extra peaks as the Rb2CoSi5Ol2 started to decompose. When the sample was removed from the high temperature stage, on cooling to ambient temperature, the sample appeared to have partially melted. Figure 3 shows all the powder diffraction data collected on heating 298–1123 K. Figure 4 shows how the closely overlapped 004, 040 and 400 Bragg reflections merge to a single peak on heating 298–1123 K.
3.2.2. Second High Temperature Scans
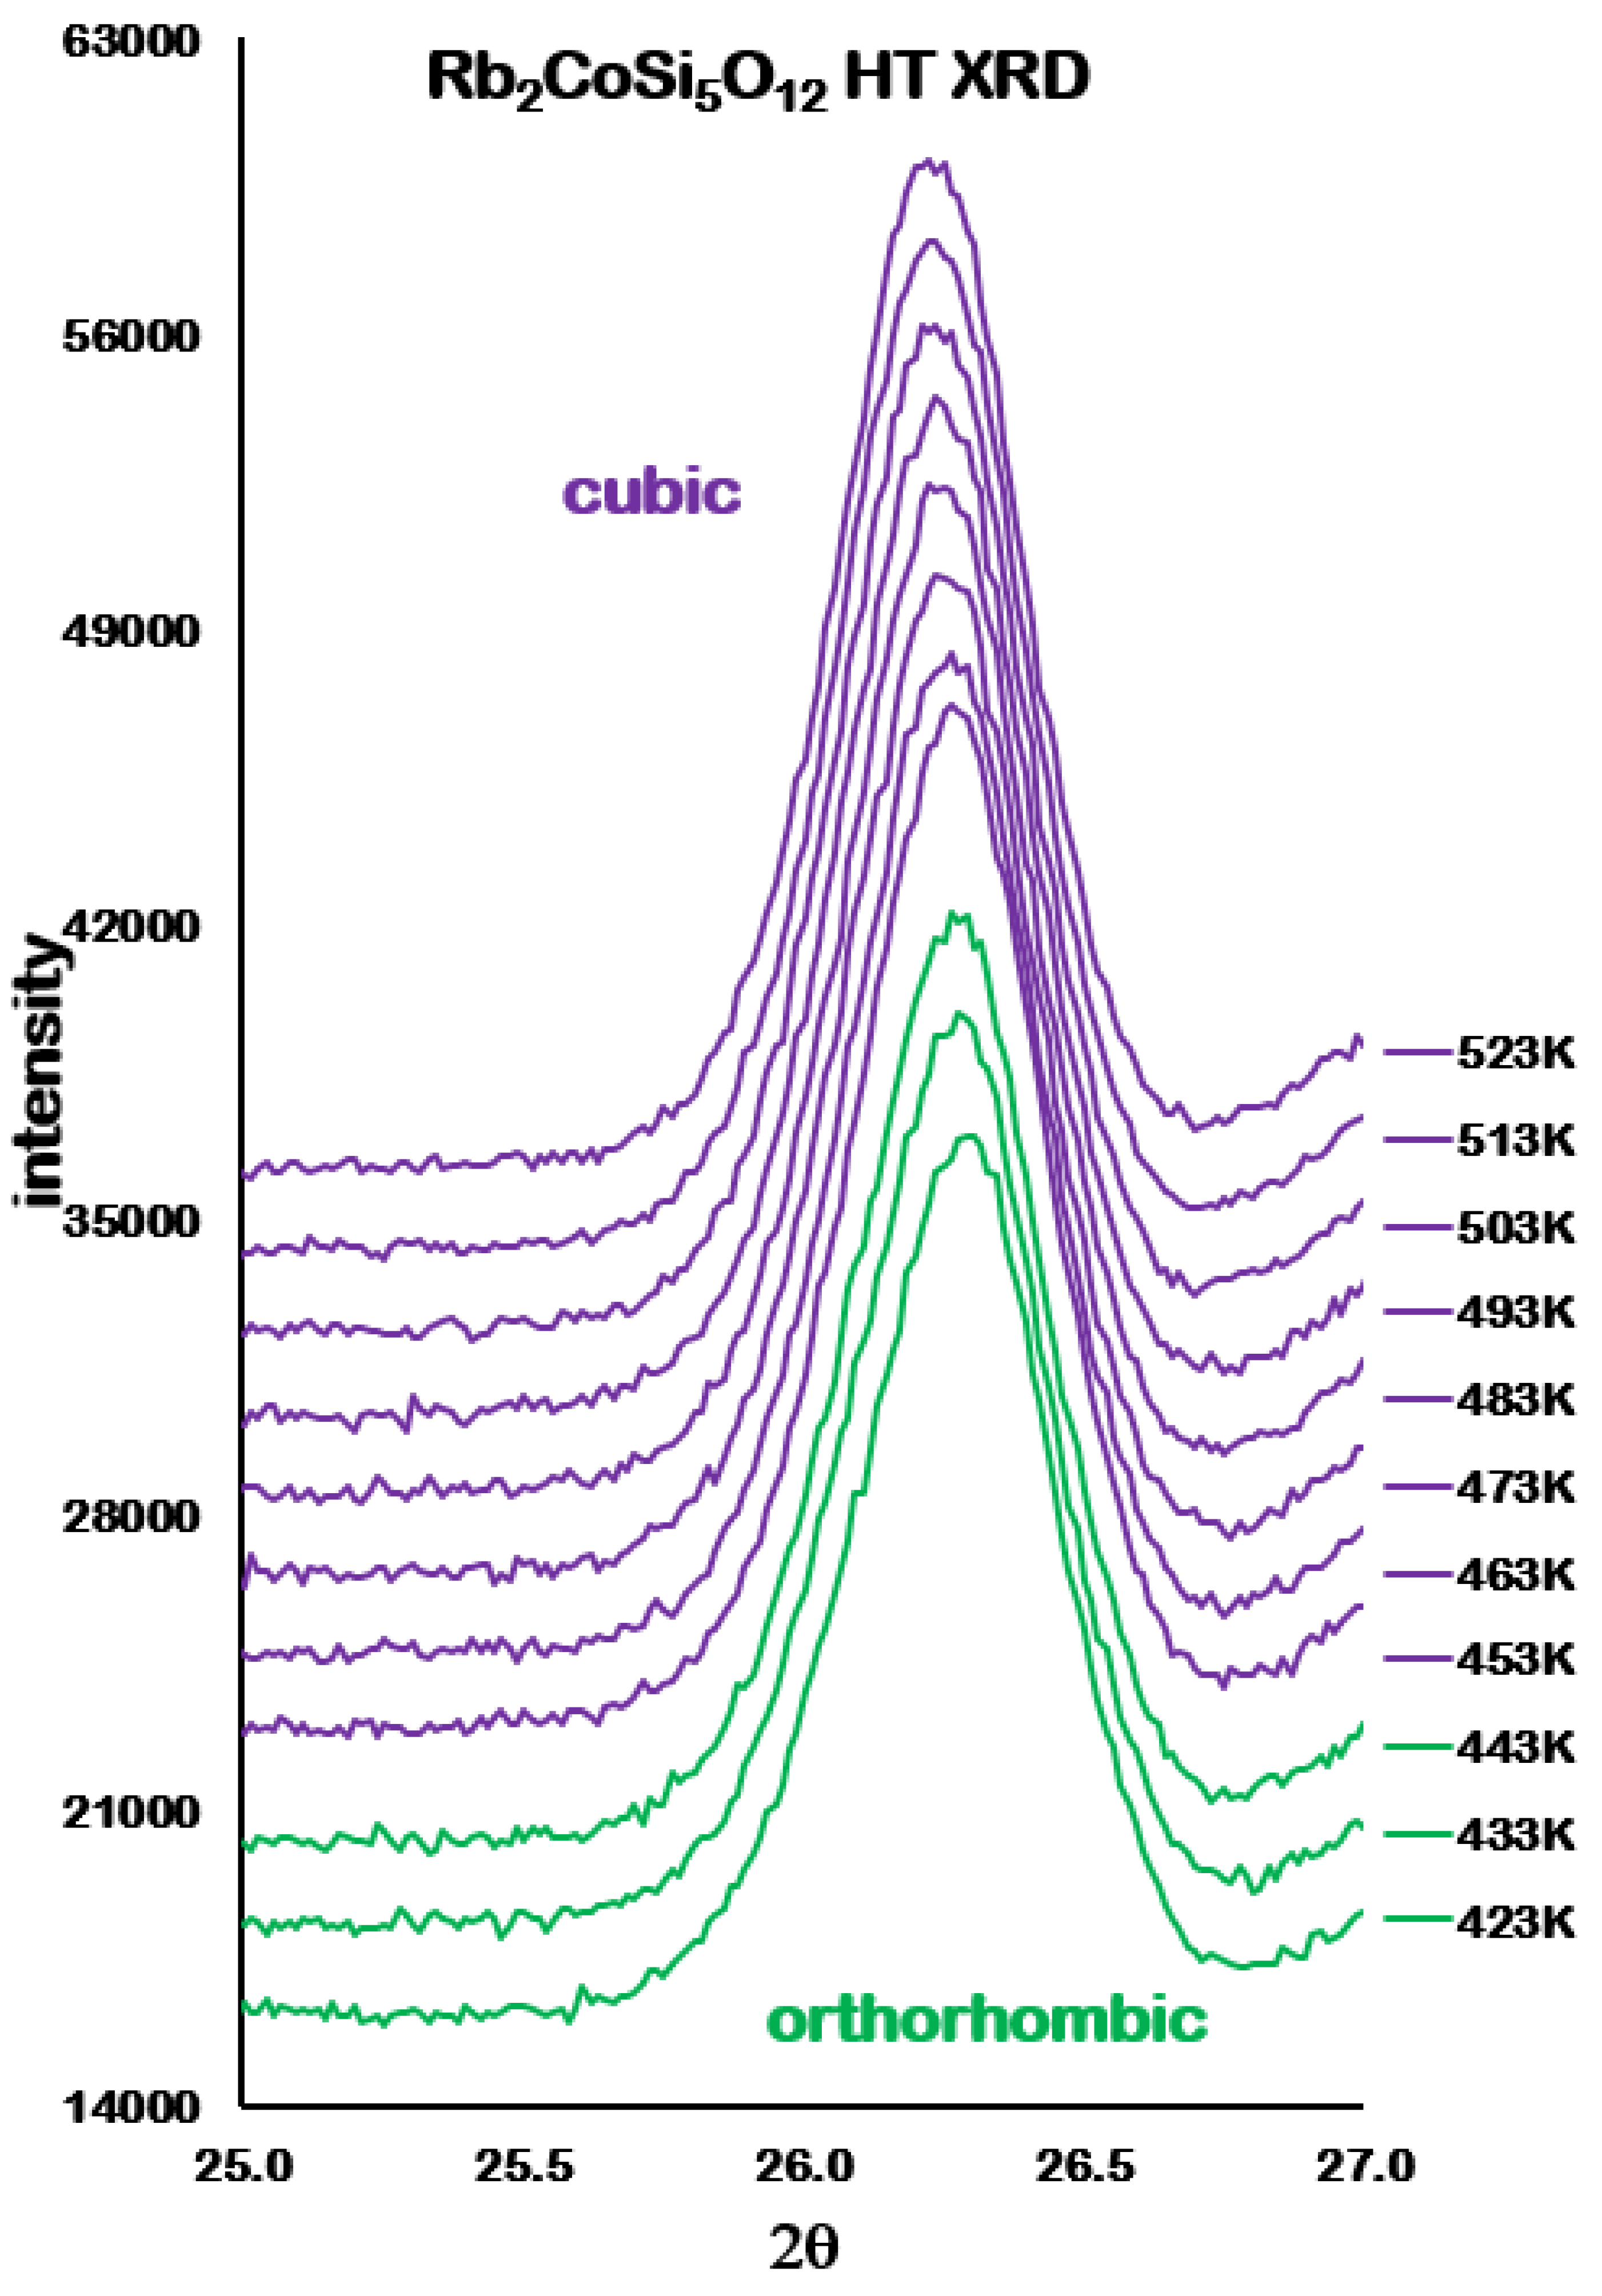
The second series of high temperature scans were done in 10 K increments from 423 to 523 K to determine more precisely the orthorhombic to cubic transition temperature. Some Bragg reflections from the platinum sample holder were also observed in the powder diffraction data from the second series of high temperature scans, these platinum peaks were excluded from the Rietveld refinements. Figure 5 shows all the powder diffraction data collected. Figure 6 shows how the closely overlapped 004, 040 and 400 Bragg reflections merge to a single peak on heating 423–523 K.
3.2.3. MgO Temperature Calibration Scans
The cubic structure of MgO [23] was used as a starting model for Rietveld refinements of the MgO crystal structure over the whole temperature range. The refined MgO lattice parameters determined at each temperature and thermal expansion parameters for MgO [24] were then used to calibrate the temperature of the HTK1200N. The second high temperature scan data, collected in 10 K increments from 423 to 523 K, were calibrated by interpolating between the calibrated temperatures from the MgO data collected at 423, 473 and 523 K.
3.2.4. TGA/DSC Analyses
No significant changes were detected by TGA/DSC on heating Rb2CoSi5Ol2 around the phase transition temperature.
3.3. Rietveld Refinement Data Analysis
All high temperature powder diffraction data from the two series of scans up to 443 K could be refined using the Pbca orthorhombic ambient temperature structure for Rb2CoSi5Ol2 as a starting model. All high temperature powder diffraction data from the two series of scans from 453 K to 1123 K could be refined using a cubic structure isostructural with the high temperature crystal structure for Cs2ZnSi5O12 [18]. The ambient temperature structure for Rb2CoSi5Ol2 after heating reverts to Pbca orthorhombic.
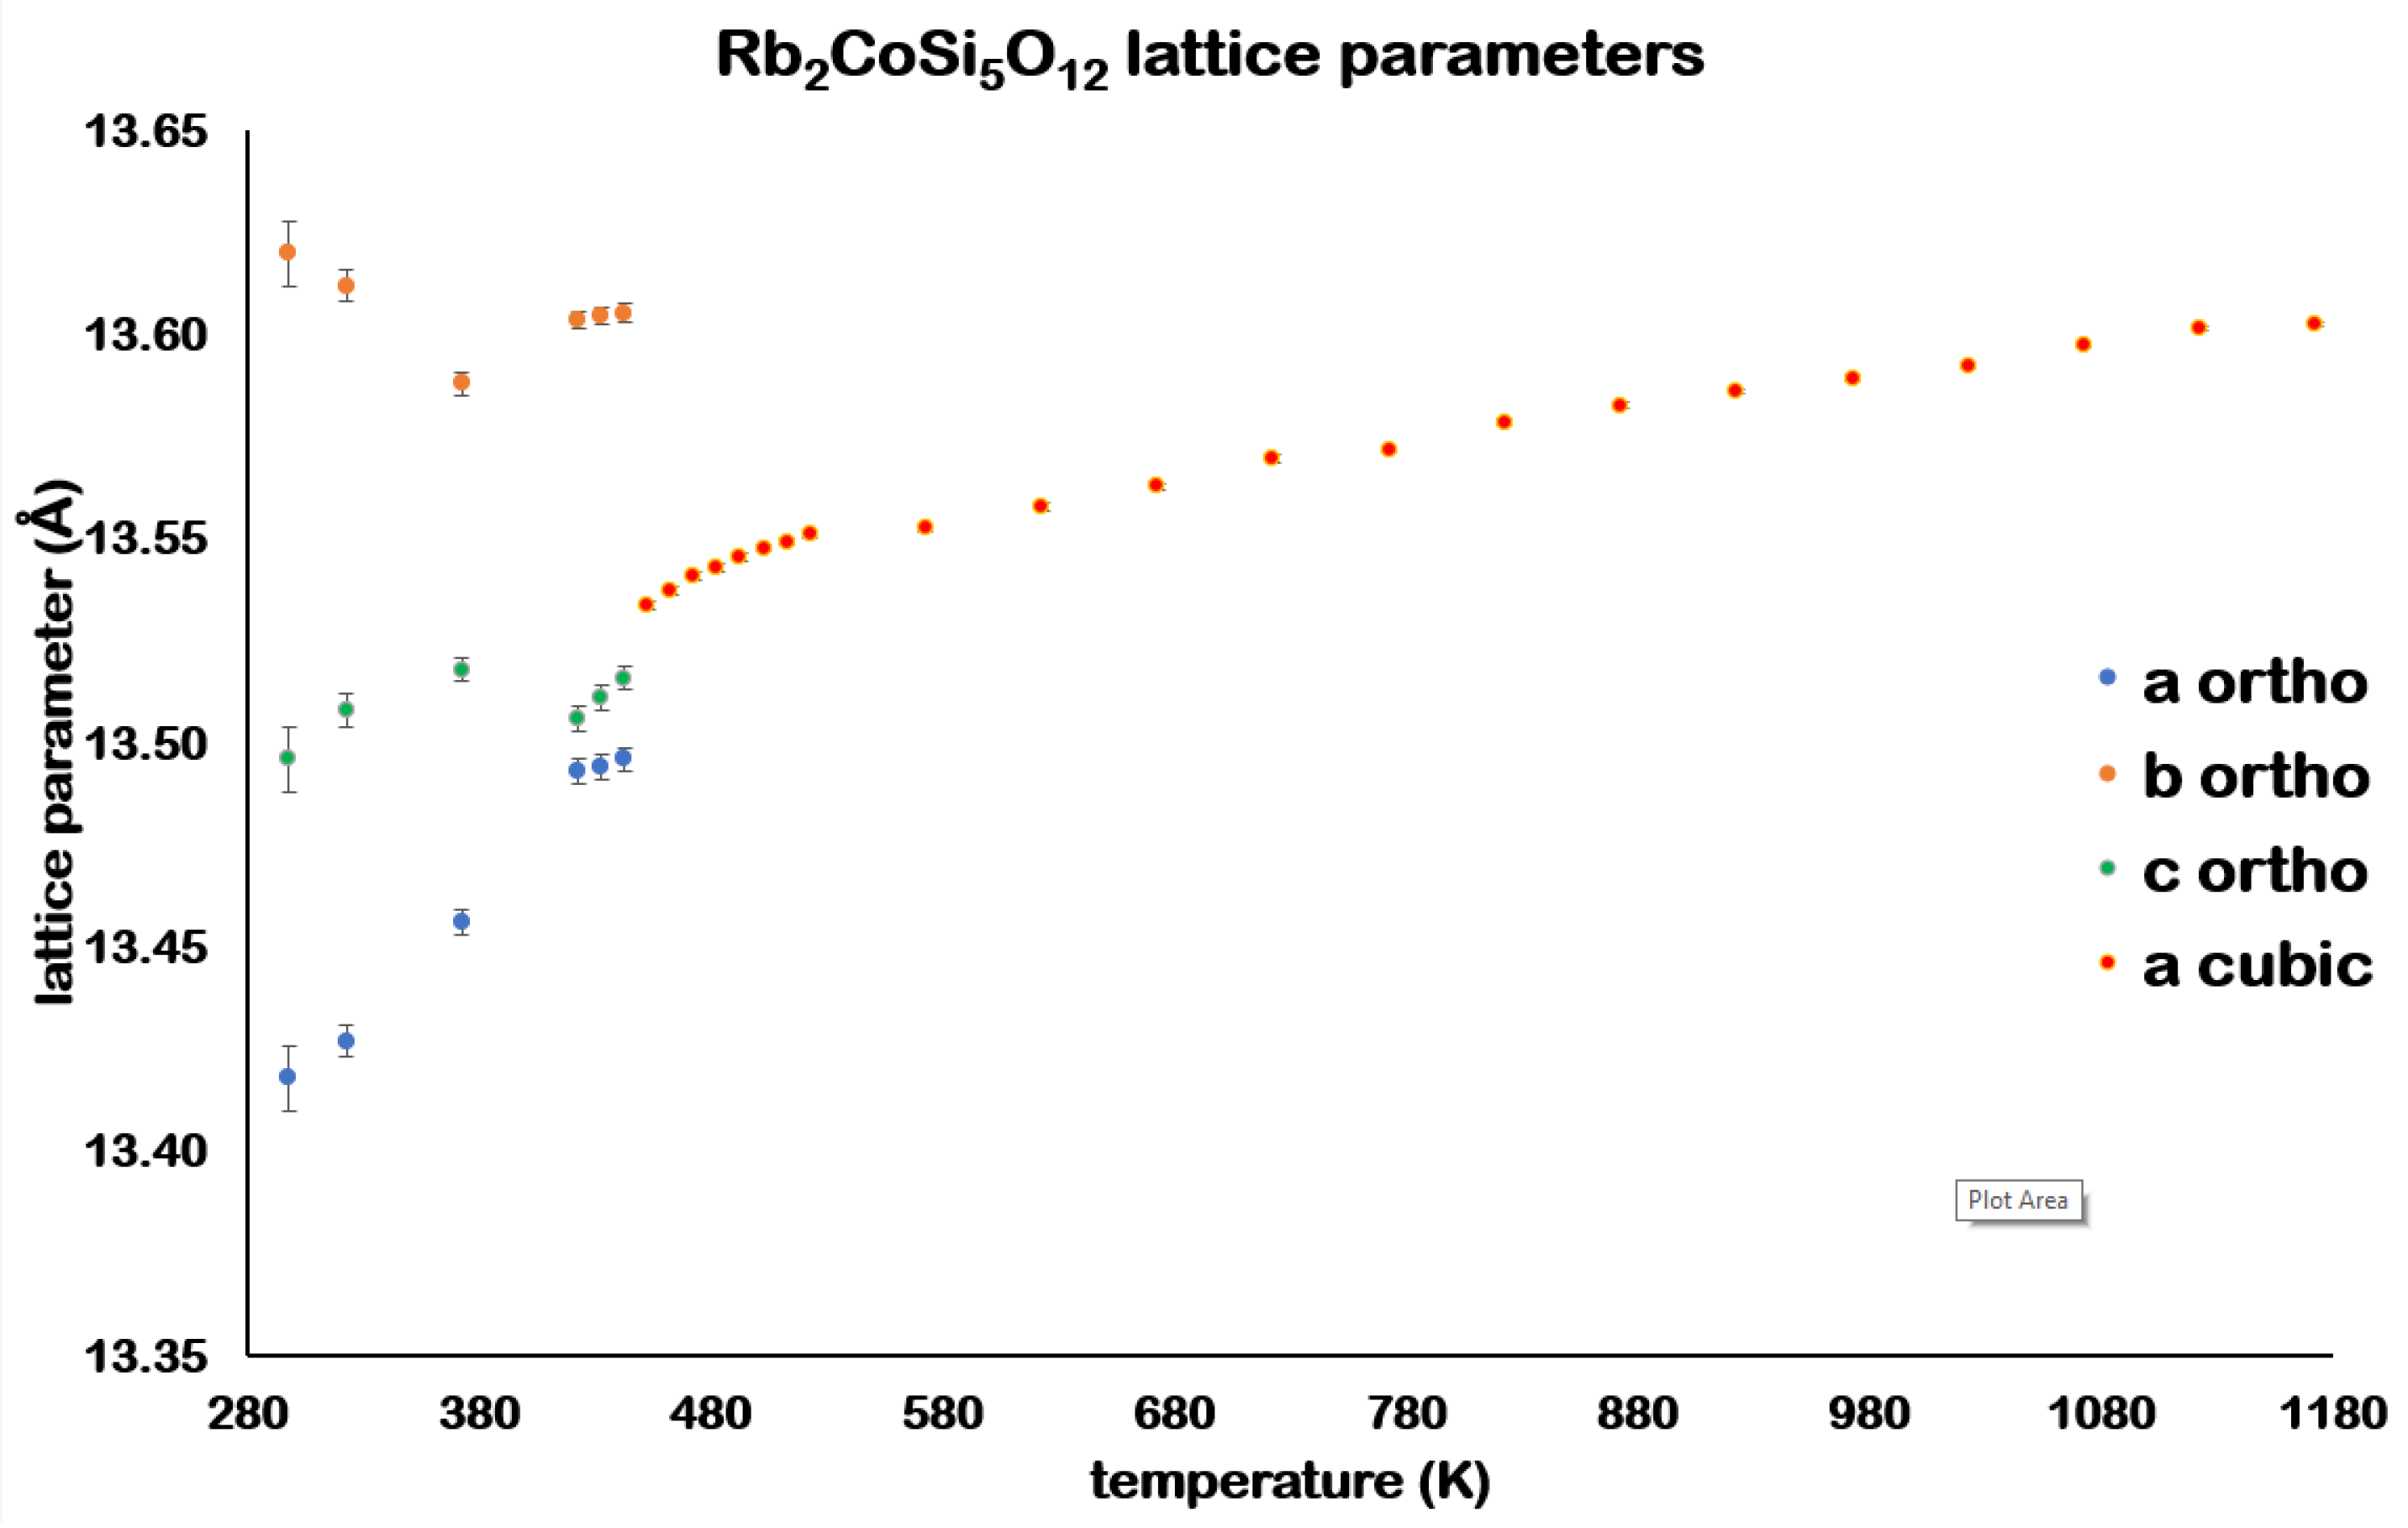
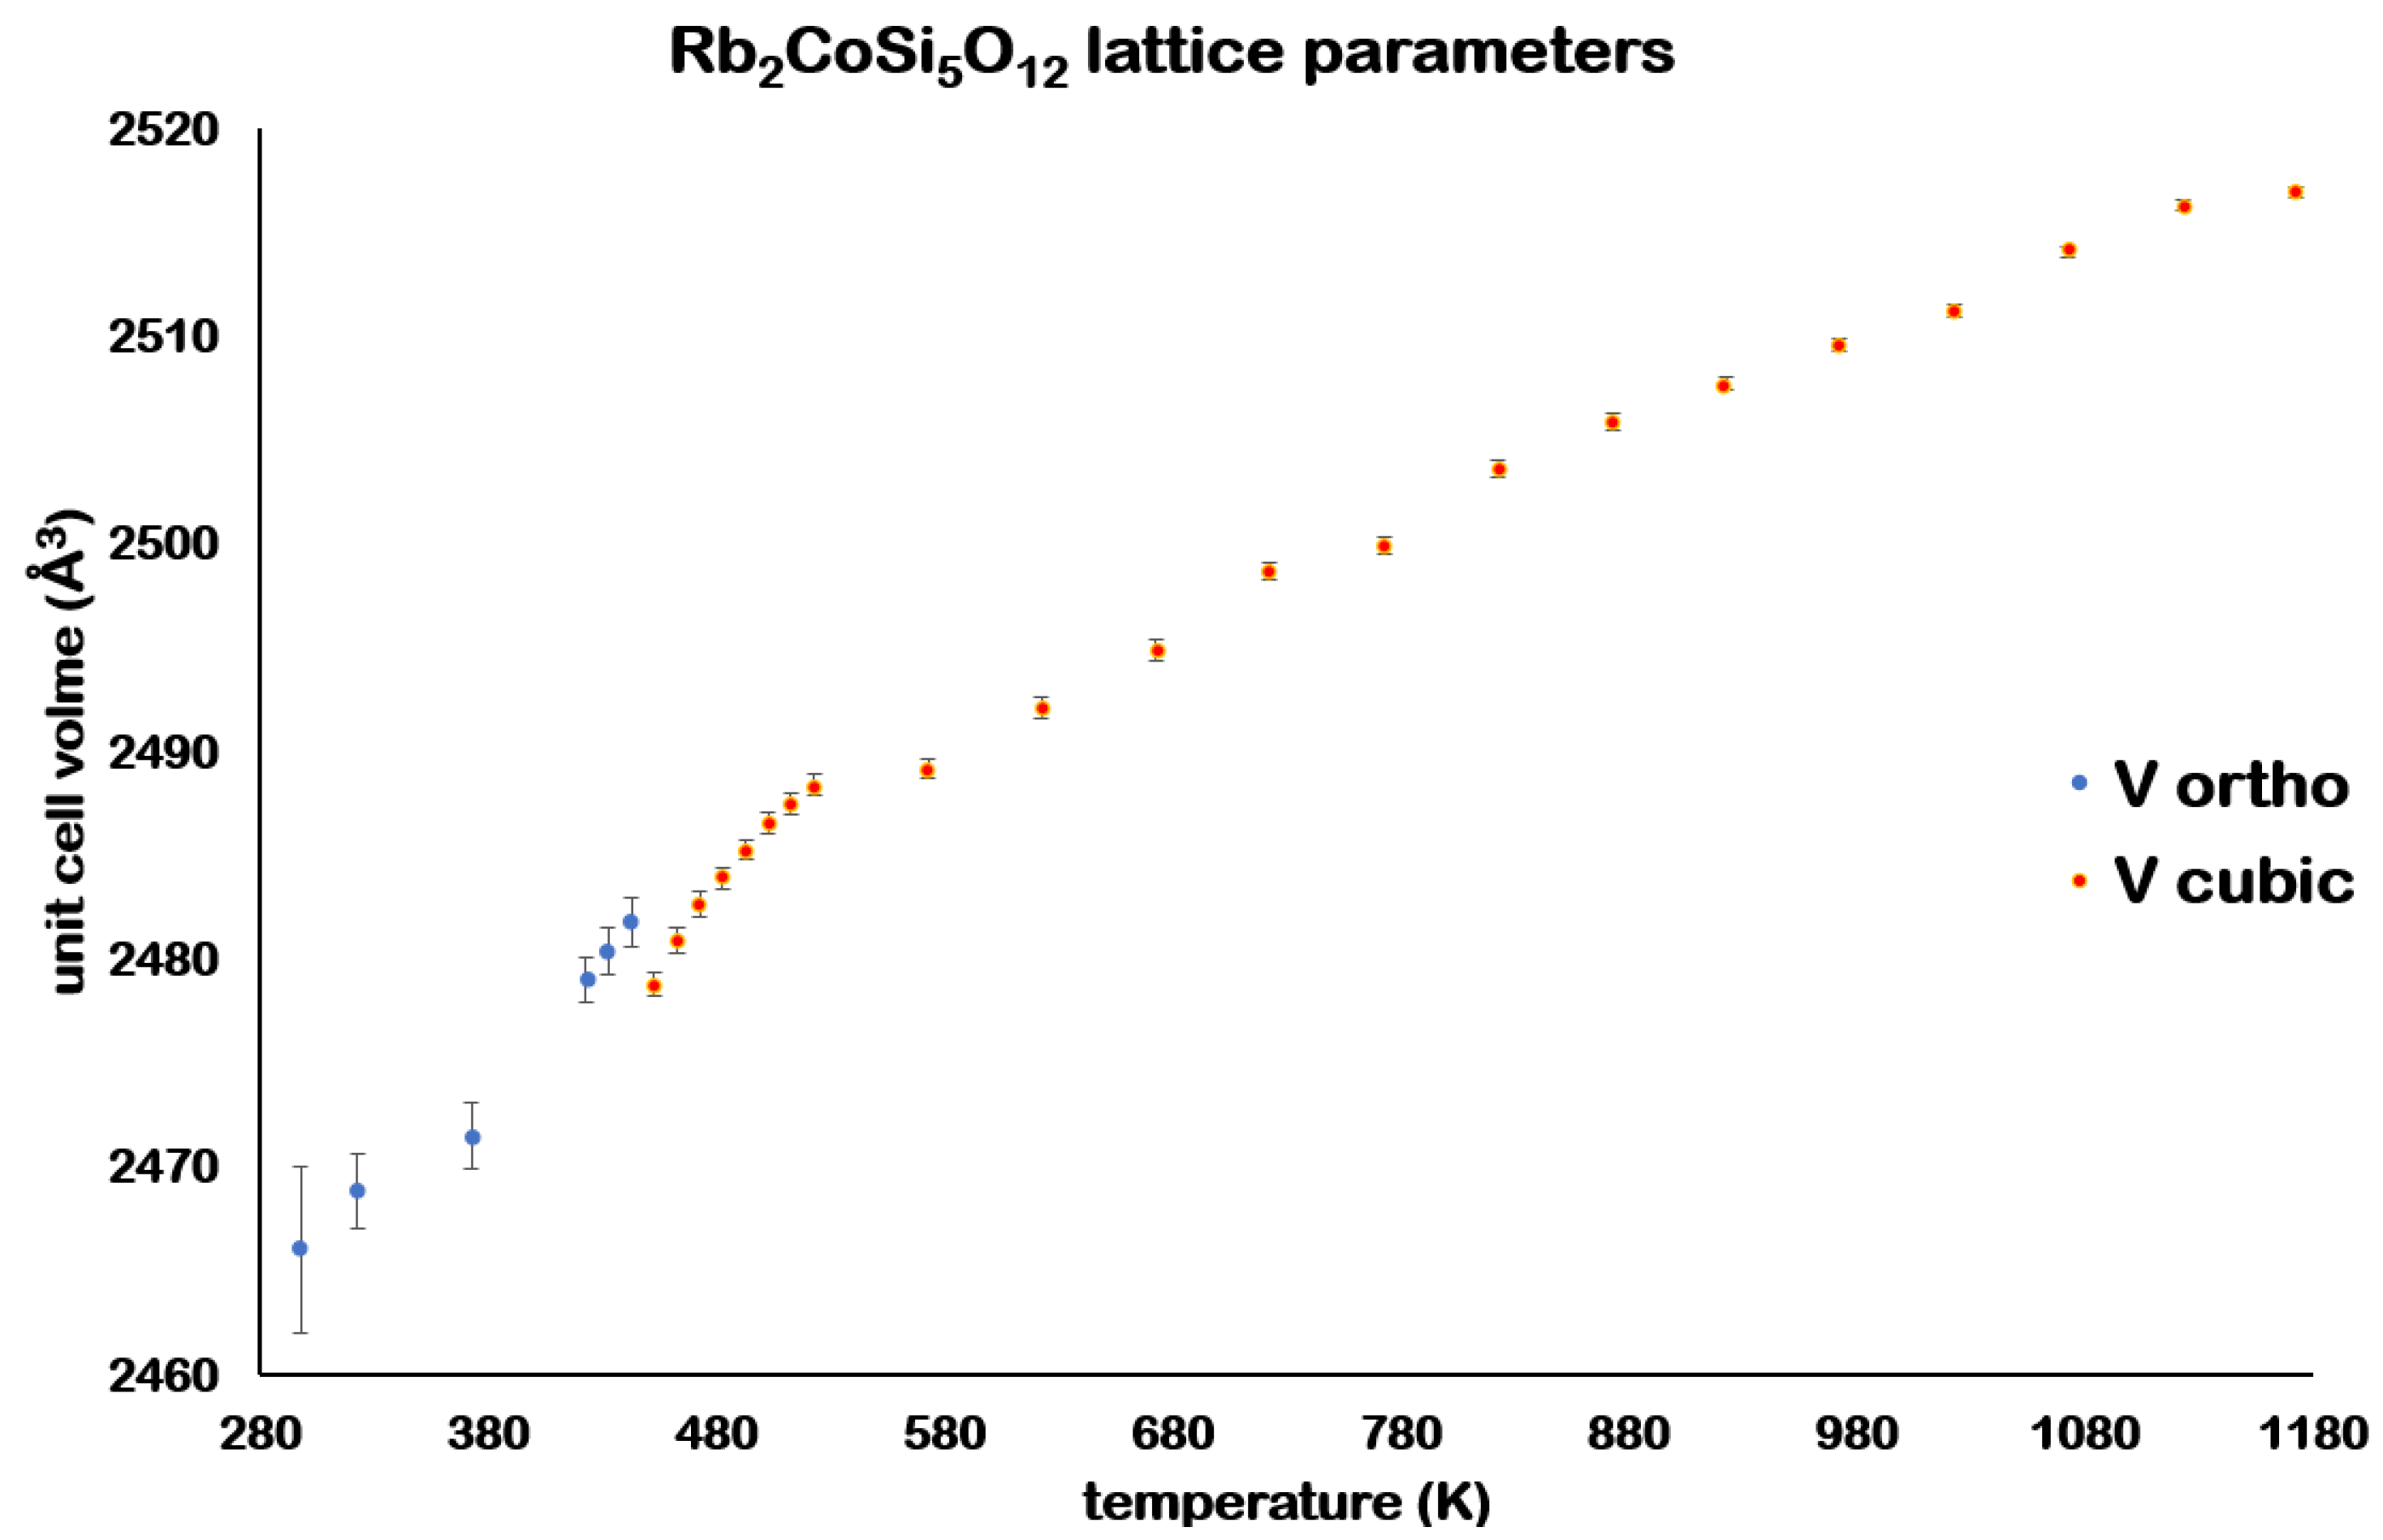
Table 4 shows how the Rb2CoSi5Ol2 lattice parameters vary with MgO calibrated temperature. Figure 7 and Figure 8 show how the lattice parameters and unit cell volumes vary with MgO calibrated temperature.
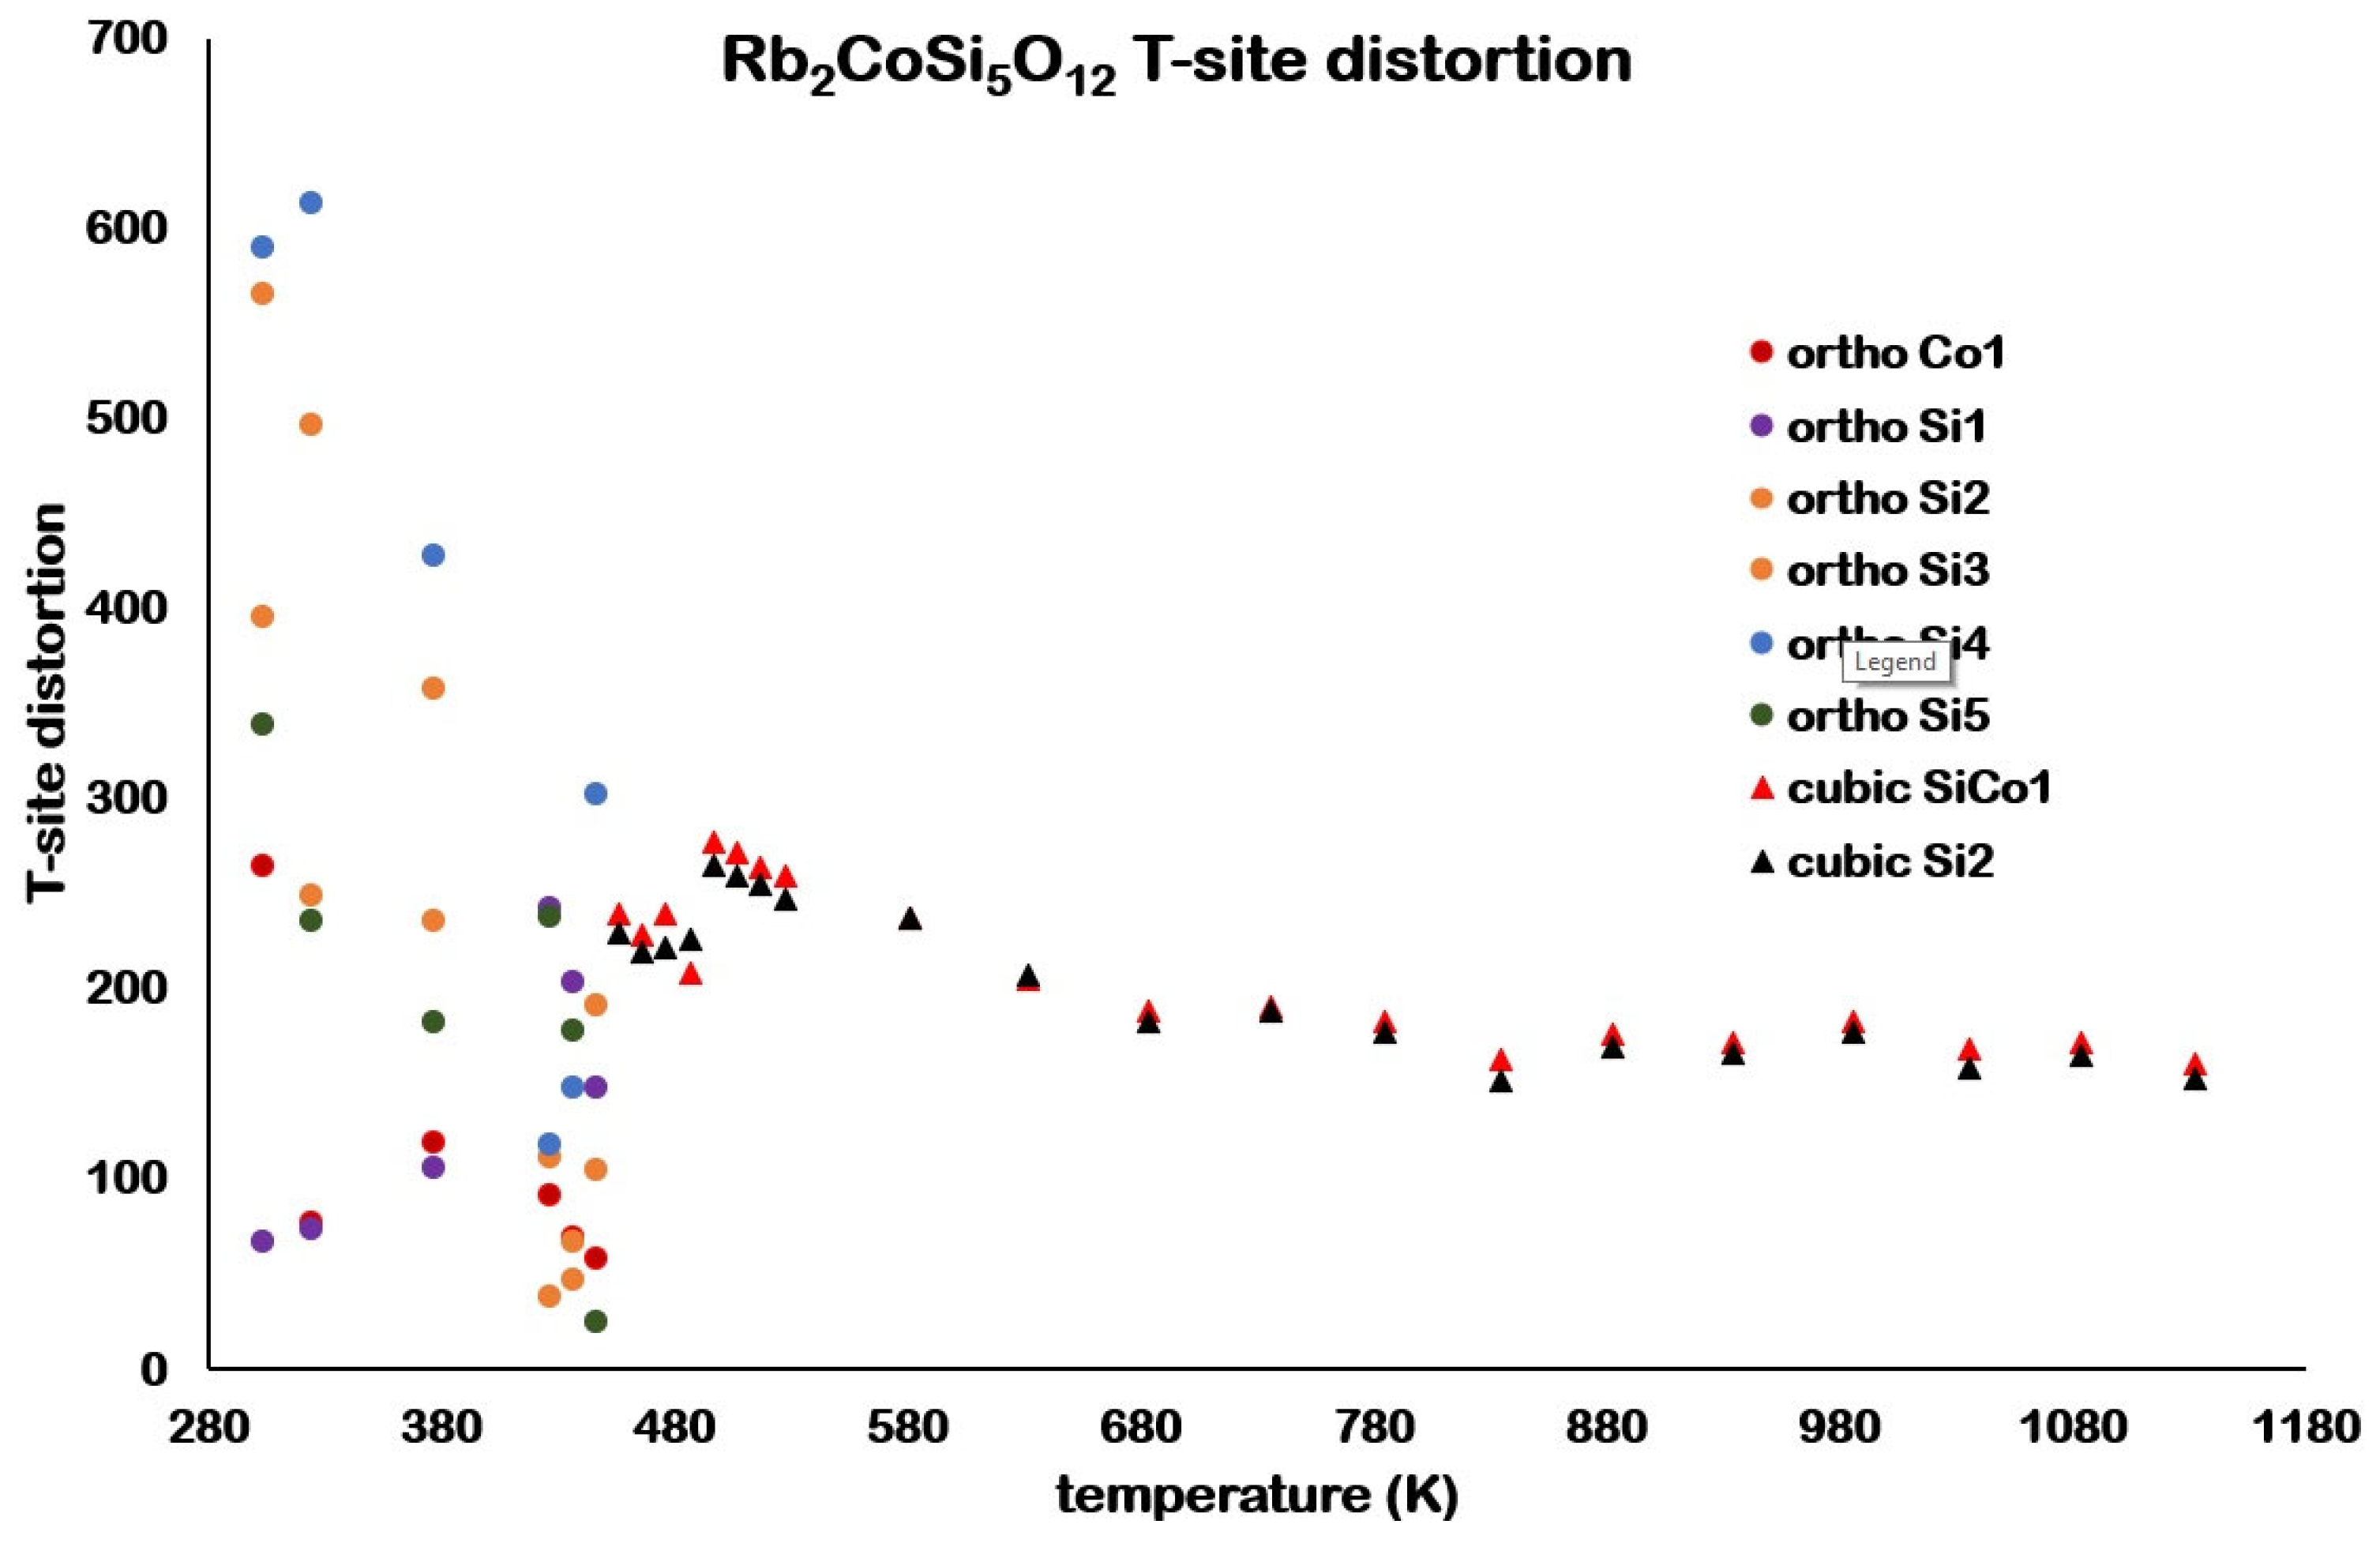
To study the changes in the Rb2CoSi5Ol2 structure with temperature the variance of the intratetrahedral O-T-O (T = Co and Si) angles (compared with the ideal tetrahedral angle of 109.5°) in the 6 Pbca orthorhombic T-sites and 2 cubic T-sites have been determined using the following equation [25]
where n is the number of different O-T-O angles (n = 6) and θ is the O-T-O angle in each TO4 unit. Figure 9 shows how these T-site distortion parameters vary with temperature for the structures of Pbca orthorhombic and cubic Rb2CoSi5Ol2.
n
θσ(tet)2 = Σ (θi − 109.5)2/(n − 1)
i = 1
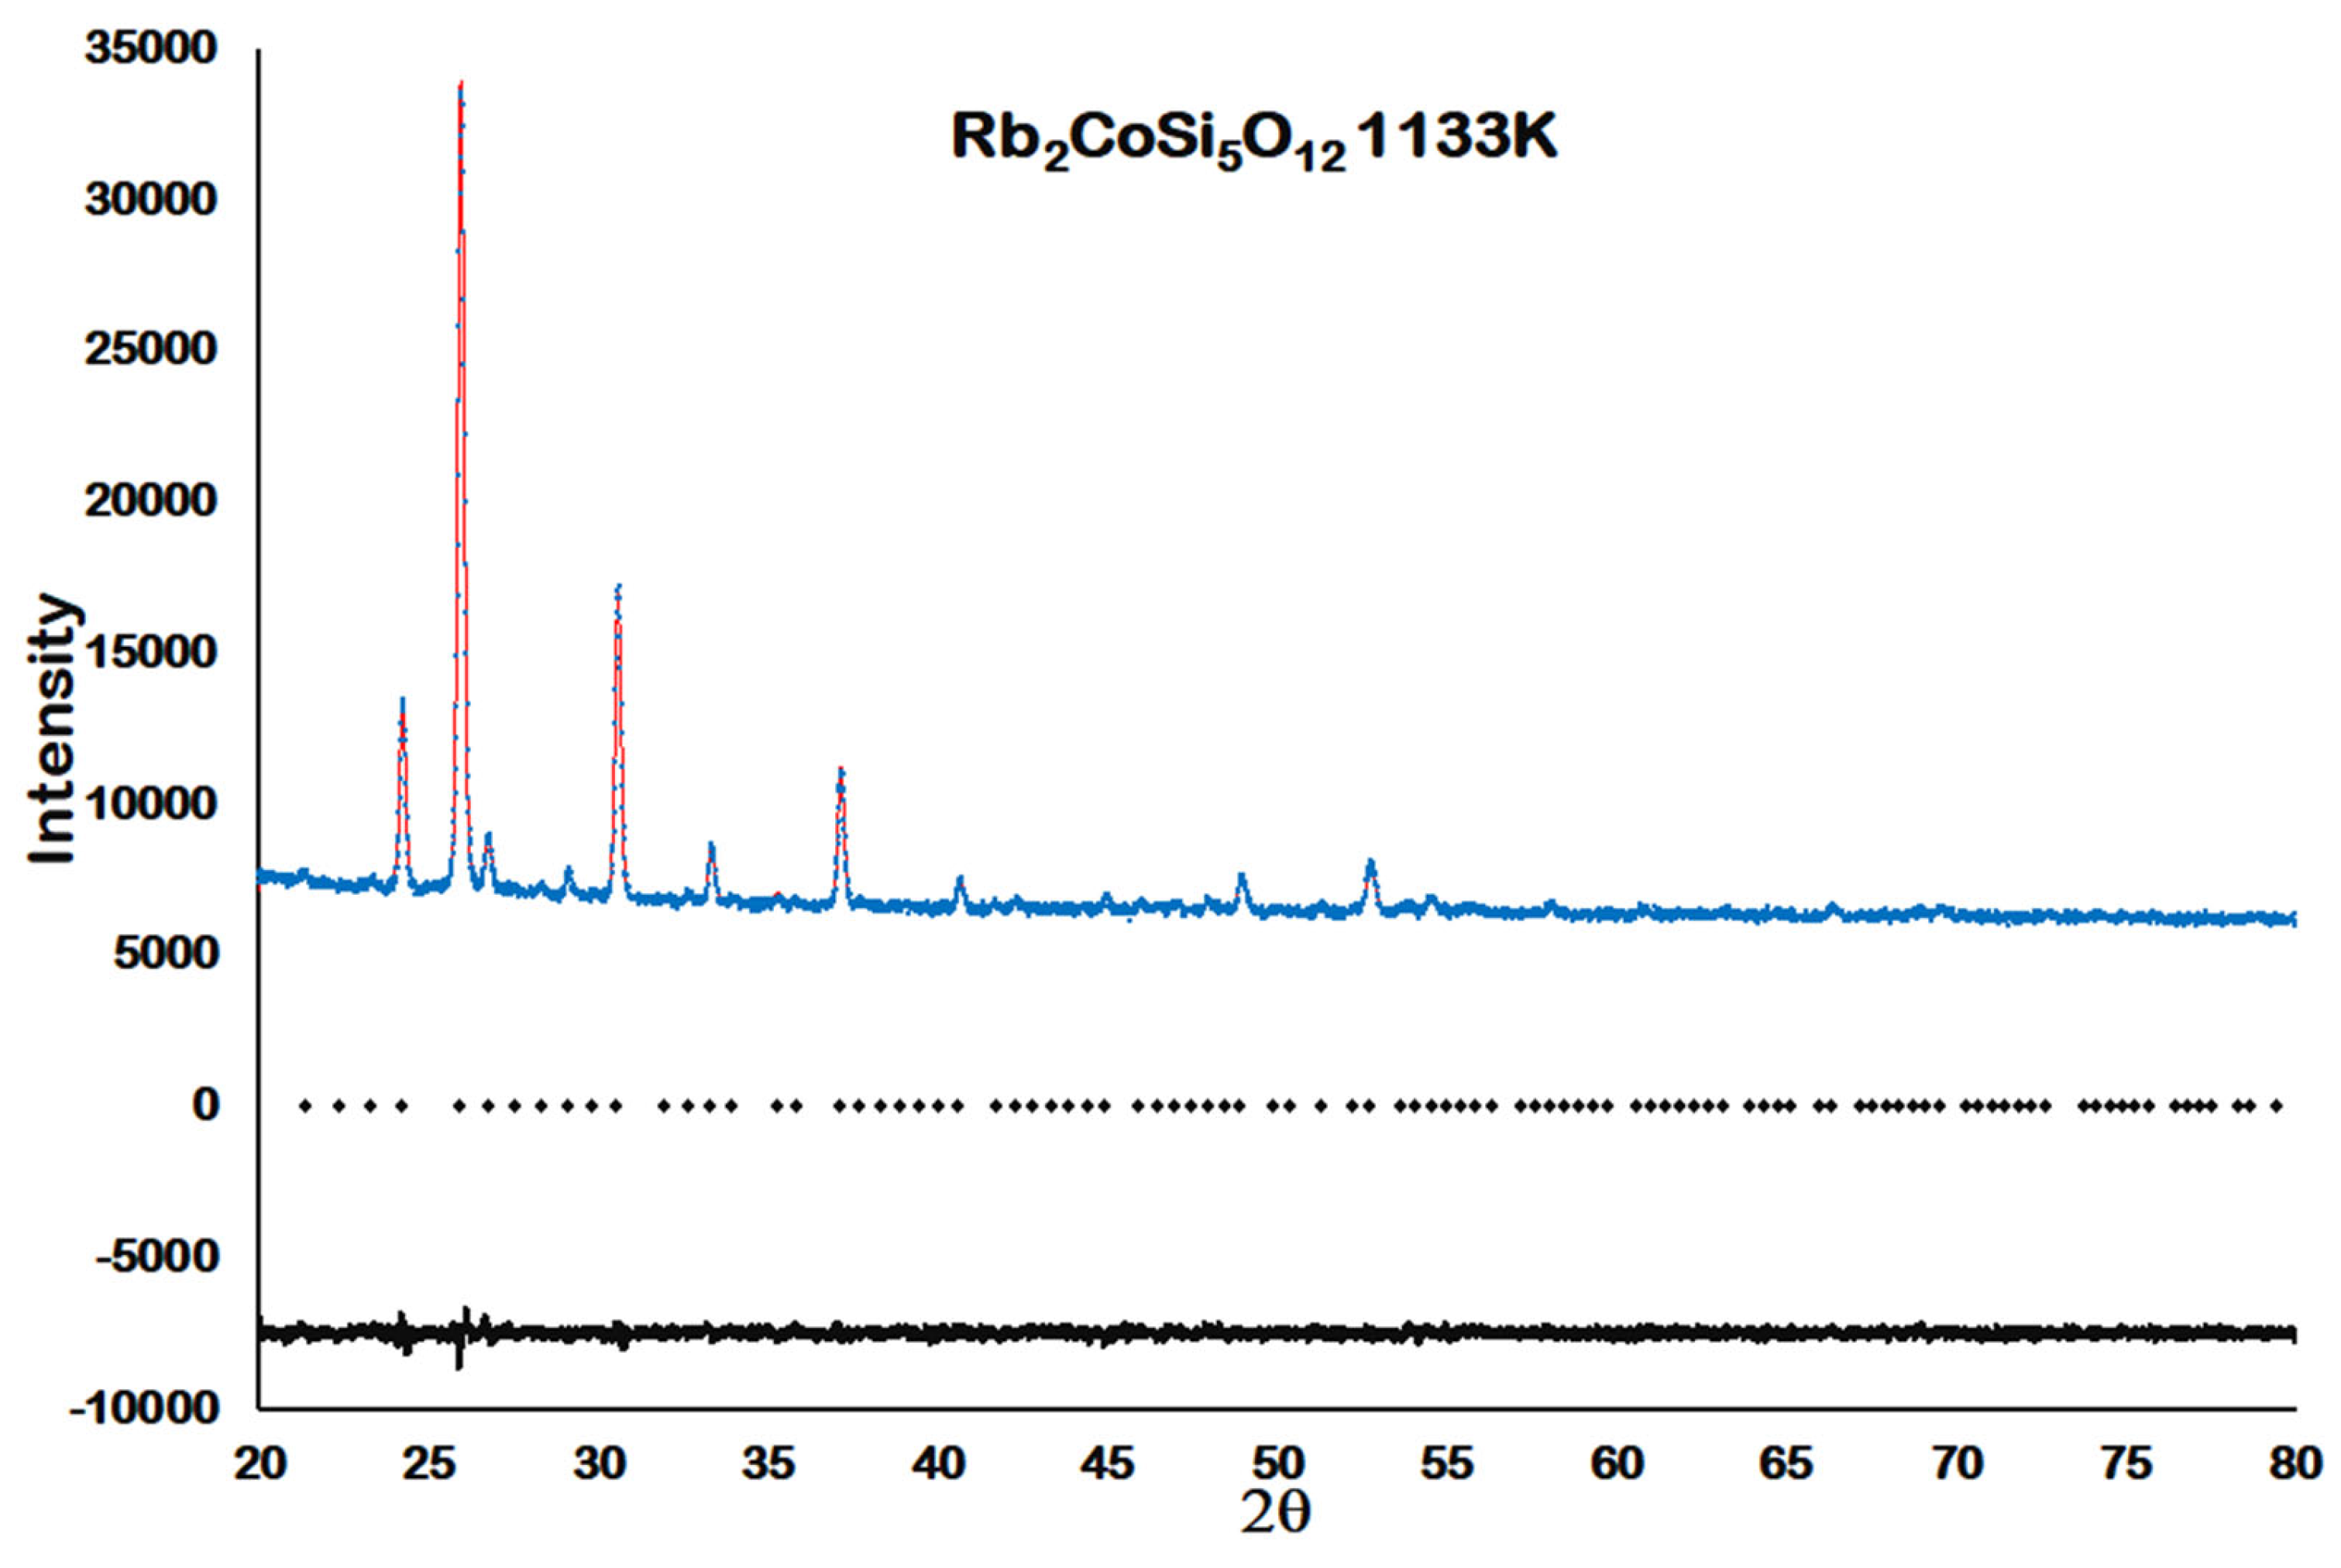
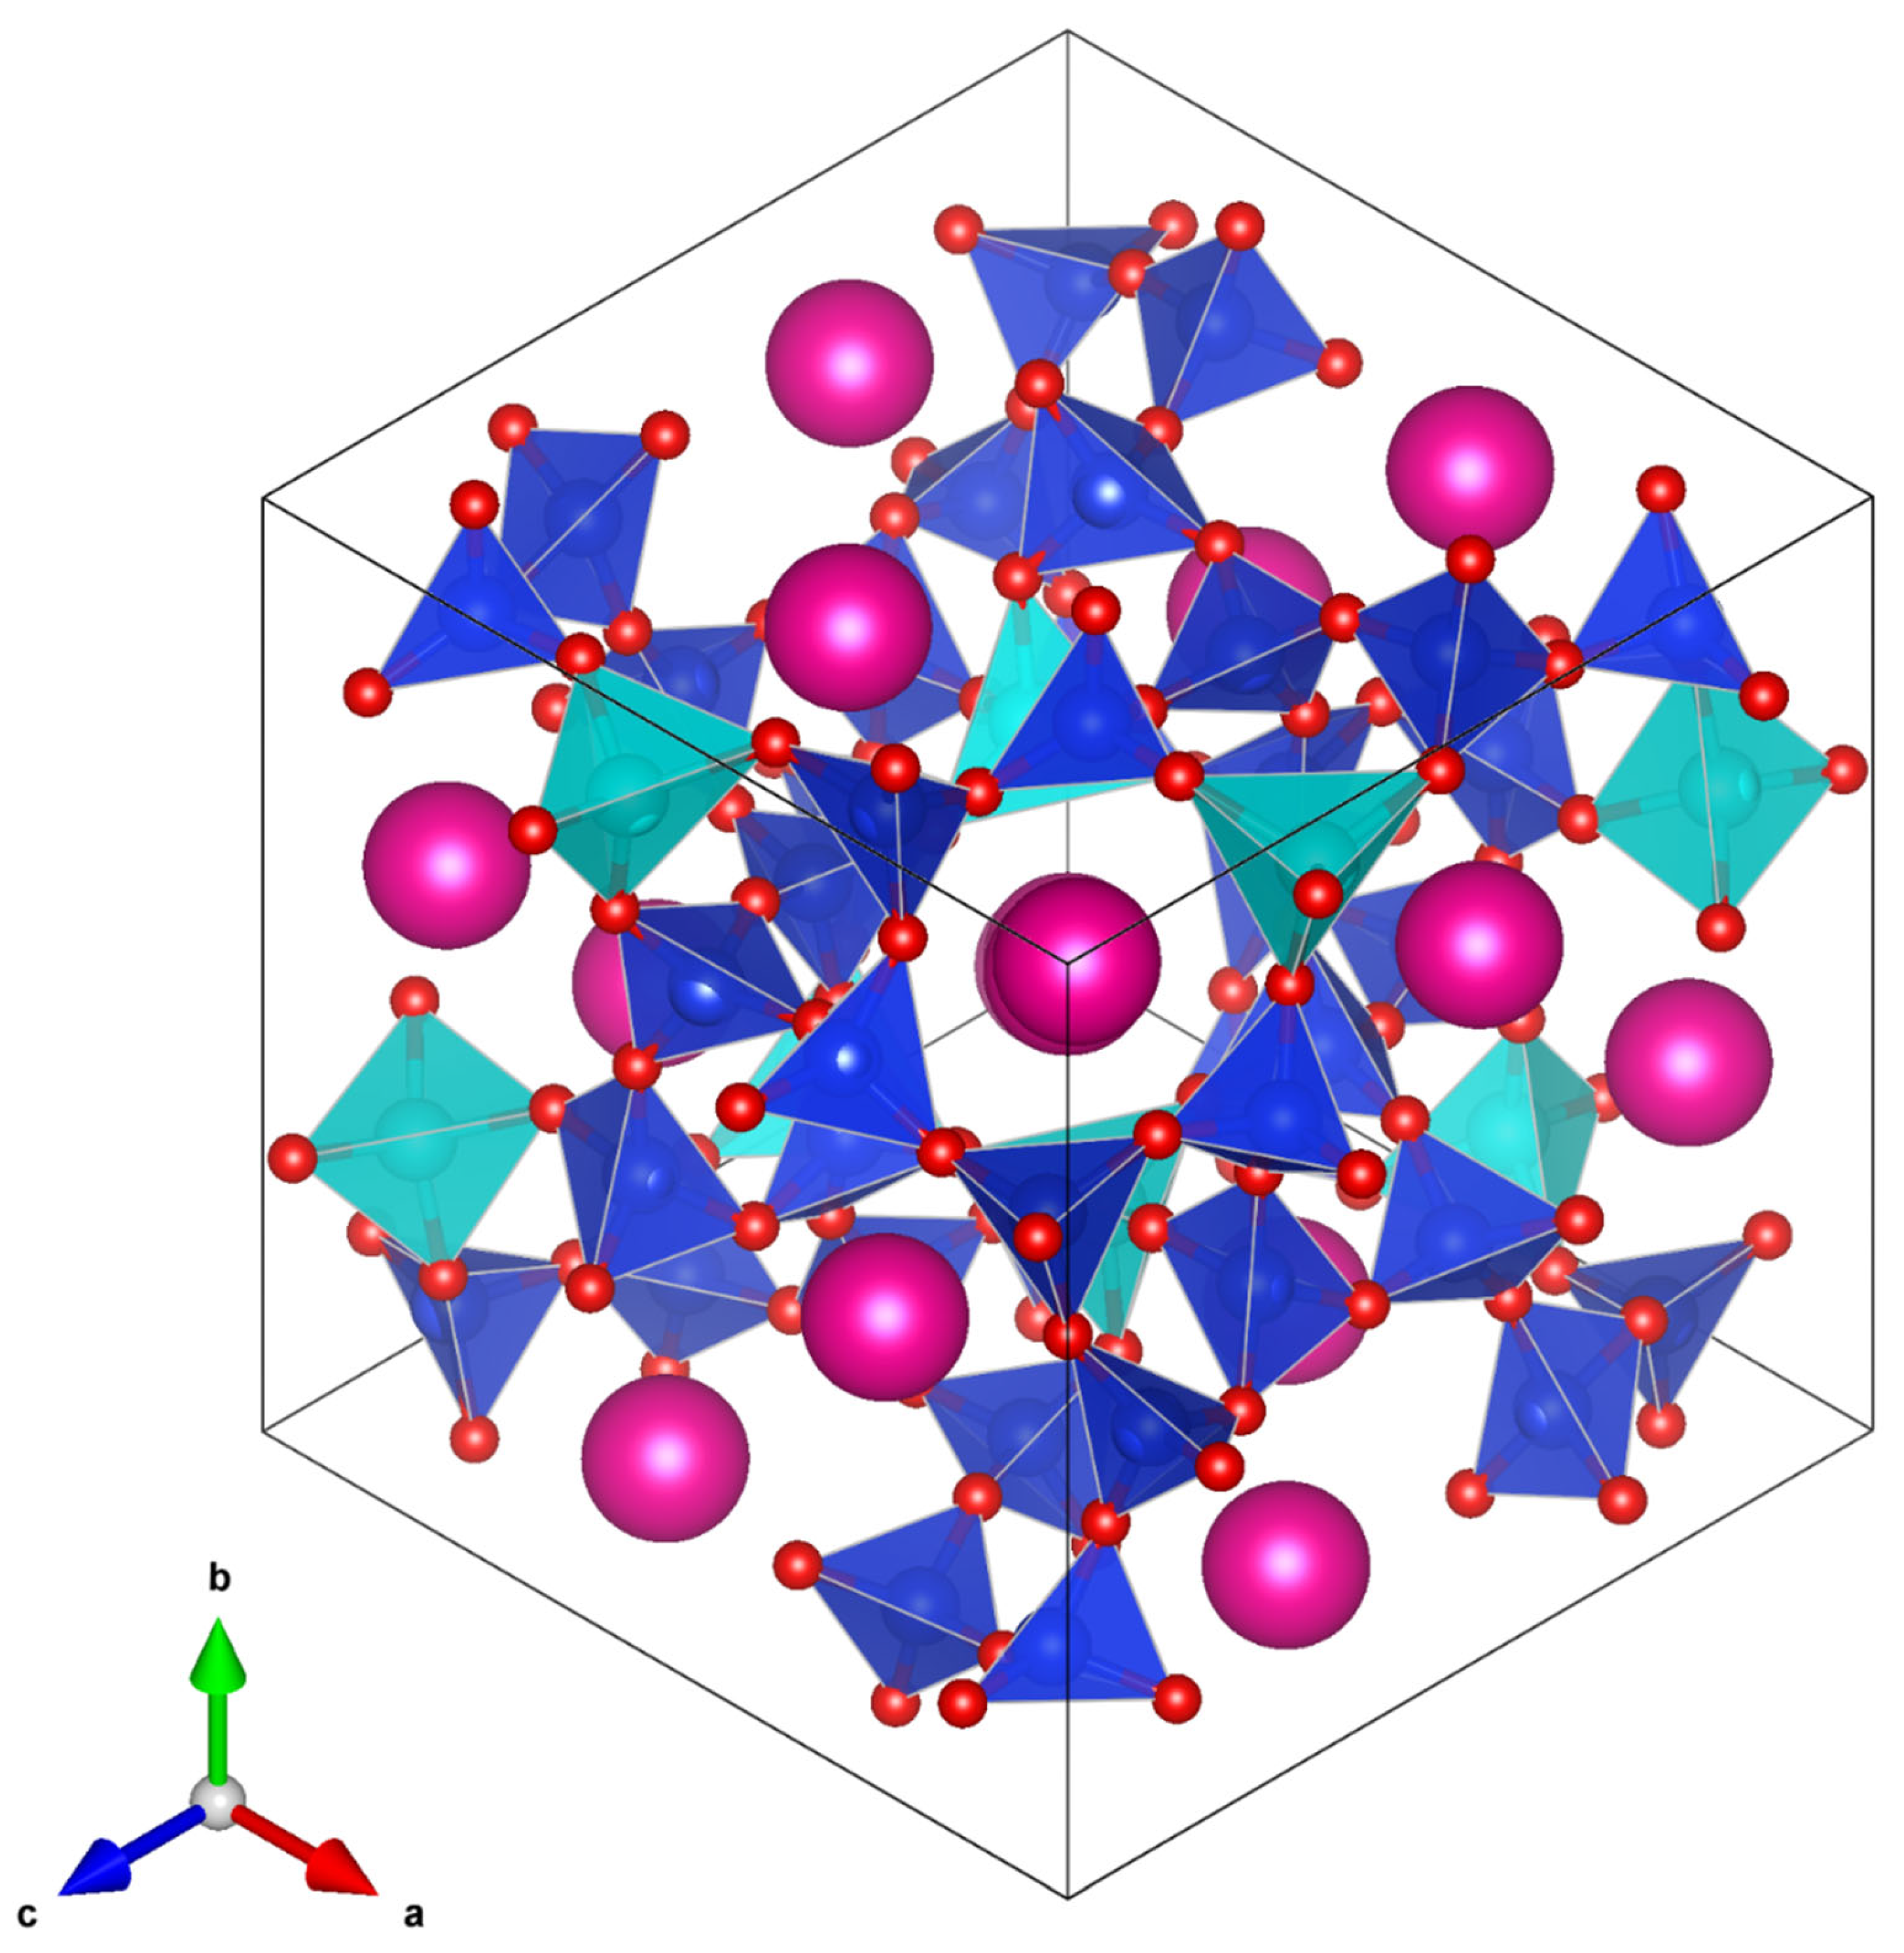
Figure 10 shows a VESTA [22] plot and Figure 11 shows the Rietveld difference plot for the 1133 K (MgO calibrated temperature) cubic structure of Rb2CoSi5Ol2. Table 5 shows refined 1133 K (MgO calibrated temperature) coordinates for Rb2CoSi5Ol2. Table 6 and Table 7 show interatomic distances and angles for 1133 K (MgO calibrated temperature) Rb2CoSi5Ol2.
4. Discussion
All temperatures referred to in this section are now MgO calibrated temperatures.
Analysis of the high temperature X-ray powder diffraction data for Rb2CoSi5Ol2 showed a first-order phase transition from Pbca orthorhombic to cubic at 457 K. However, Table 4 and Figure 7 and Figure 8 show that the unit cell volume decreases with increasing temperature after the phase transition. The Pbca structure for Rb2CoSi5Ol2 has the tetrahedrally coordinated Co and Si atoms ordered onto separate T-sites (1 Co and 5 Si sites). However, the structure for Rb2CoSi5Ol2 has some partial T-site disorder. One T site is fully occupied by Si, the other T site is 2/3 occupied by Si and 1/3 occupied by Co. Figure 9 shows how the T-site distortions for Rb2CoSi5Ol2 vary with temperature for the Pbca orthorhombic and cubic phases. There is a much wider spread of T-site distortions for Pbca orthorhombic compared with cubic. A plot of the 447 K Pbca T-site ordered crystal structure (Figure 12) shows that the central channel (which contains different sized SiO4 and CoO4 tetrahedra) is much more distorted than the central channel of the partially T-site disordered 457 K structure (Figure 13). This agrees with the plot of T-site distortions shown in Figure 9. In the structure, there is a smaller size difference between the SiO4 and (Si2/3Co1/3)O4 tetrahedra compared with the size difference between the Pbca SiO4 and CoO4 tetrahedra. The smaller size difference between the TO4 (T = Si or Co) tetrahedra in the structure compared with the Pbca structure means that the structure is less distorted than the Pbca structure. This decrease in distortion of the crystal structure through the phase transition is why the central channel contracts through the phase transition. This is reflected in the decrease in unit cell volume.
Such a phase transition with a unit cell contraction has not been observed before in a leucite mineral analogue. However, similar transitions have been observed in other materials such as BiNiO3 [26] and Hf0.86Ta0.14Fe2 [27].
Thermal expansion due to the increase in temperature means that the cubic unit cell volume eventually becomes greater than the orthorhombic unit cell volume at 497 K, 40 K higher than the phase transition temperature. The cubic structure is retained up to 1133 K. Above this temperature the Rb2CoSi5Ol2 sample starts to decompose before partially melting at 1323 K. Table 8 shows the thermal expansion coefficients (TEC) for the two Rb2CoSi5Ol2 phases. TEC for other leucite phases are given as comparison. It can be seen that the TEC for Rb2CoSi5Ol2 are in the same order of magnitude as those reported for other leucites.
The Pbca orthorhombic to cubic leucite phase transition was first observed in Cs2ZnSi5O12 [18]. There was no unit cell contraction noticed through the phase transition in Cs2ZnSi5O12 and this was assumed to be a second-order phase transition. However, the high temperature X-ray powder diffraction data for Cs2ZnSi5O12 were collected every 30 K, a larger temperature increment than was used for Rb2CoSi5Ol2. It would be interesting to repeat the high temperature XRD study on Cs2ZnSi5O12 with a smaller temperature increment to see if a unit cell contraction could be observed for this phase transition.
5. Conclusions
- The ambient temperature crystal structure of the Rb2CoSi5Ol2 leucite analogue has been determined as isostructural with the Pbca orthorhombic T-site ordered crystal structure of Cs2CdSi5O12.
- High temperature X-ray powder diffraction on Rb2CoSi5Ol2 leucite analogue shows a Pbca orthorhombic to cubic phase transition at 457 K, like that reported for Cs2ZnSi5O12. The decrease in the size difference between the TO4 (T = Si and Co) units before and after this transition means that the central channel of the cubic leucite structure is less distorted than that for the orthorhombic structure. The decrease in structural distortion means that there is an initial unit cell contraction with increasing temperature after the phase transition.
- The structure for Rb2CoSi5Ol2 leucite analogue is retained up to 1133 K; above this temperature the sample starts to decompose and then partially melts at 1323 K.
Funding
This research received no external funding.
Data Availability Statement
Not Applicable.
Acknowledgments
The author wishes to acknowledge the use of the EPSRC funded National Chemical Database Service hosted by the Royal Society of Chemistry. The author also wishes to thank Alex Scrimshire of Sheffield Hallam University for the TGA/DSC measurements.
Conflicts of Interest
The author declares no conflict of interest.
References
- Mazzi, F.; Galli, E.; Gottardi, G. The crystal structure of tetragonal leucite. Amer. Mineral. 1976, 61, 108–115. [Google Scholar]
- Beger, R.M. The crystal structure and chemical composition of pollucite. Zeits. Krist. 1969, 129, 280–302. [Google Scholar] [CrossRef]
- Sanchez-Valle, C.; Chio, C.-H.; Gatta, G. Single-crystal elastic properties of (Cs,Na)AlSi2O6.H2O pollucite: A zeolite with potential use for long-term storage of Cs radioisotopes. J. Appl. Phys. 2010, 108, 093509. [Google Scholar] [CrossRef]
- Bell, A.M.T.; Henderson, C.M.B. Tetragonal-cubic phase transition in KGaSi2O6 synthetic leucite analogue and its probable mechanism. J. Solid State Chem. 2020, 284, 121142. [Google Scholar] [CrossRef]
- Bell, A.M.T.; Henderson, C.M.B. Rietveld Refinement of Dry-Synthesized Rb2ZnSi5O12 Leucite by Synchrotron X-ray Powder Diffraction. Acta Cryst. 1994, 50, 984–986. [Google Scholar] [CrossRef] [Green Version]
- Bell, A.M.T.; Redfern, S.A.T.; Henderson, C.M.B.; Kohn, S.C. Structures of synthetic K2MgSi5O12 leucites by integrated X-ray powder diffraction, electron diffraction and 29Si MAS NMR methods. Acta Cryst. 1994, 50, 31–41. [Google Scholar] [CrossRef] [Green Version]
- Bell, A.M.T.; Henderson, C.M.B. Crystal structures of K2[XSi5O12] (X = Fe2+, Co, Zn) and Rb2[XSi5O12] (X = Mn) leucites; comparison of monoclinic P21/c and Ia-3d polymorph structures and inverse relationship between tetrahedral cation (T = Si and X)—O bond distances and intertetrahedral T—O—T angles. Acta Cryst. 2018, 74, 274–286. [Google Scholar] [CrossRef]
- Bell, A.M.T.; Redfern, S.A.T.; Henderson, C.M.B.; Kohn, S.C. Structural relations and tetrahedral ordering pattern of synthetic orthorhombic Cs2CdSi5O12 leucite: A combined synchrotron X-ray powder diffraction and multinuclear MAS NMR study. Acta Cryst. 1994, 50, 560–566. [Google Scholar] [CrossRef] [Green Version]
- Bell, A.M.T.; Henderson, C.M.B. Rietveld refinement of the orthorhombic Pbca structures of Rb2CdS5O12, Cs2MnSi5O12, Cs2CoSi5O12 and Cs2NiSi5O12 leucites by synchrotron X-ray powder diffraction. Acta Cryst. 1996, 52, 2132–2139. [Google Scholar] [CrossRef]
- Bell, A.M.T.; Henderson, C.M.B. Crystal structures and cation ordering in Cs2MgSi5O12, Rb2MgSi5O12 and Cs2ZnSi5O12 leucites. Acta Cryst. 2009, 65, 435–444. [Google Scholar] [CrossRef]
- Bell, A.M.T.; Knight, K.S.; Henderson, C.M.B.; Fitch, A.N. Revision of the structure of Cs2CuSi5O12 leucite as orthorhombic Pbca. Acta Cryst. 2010, 66, 51–59. [Google Scholar] [CrossRef] [PubMed] [Green Version]
- Bell, A.M.T.; Henderson, C.M.B. Rietveld refinement of the crystal structures of Rb2XSi5O12 (X = Ni, Mn). Acta Cryst. 2016, 72, 249–252. [Google Scholar] [CrossRef] [PubMed] [Green Version]
- Bell, A.M.T.; Henderson, C.M.B. A study of possible extra-framework cation ordering in Pbca leucite structures with stoichiometry RbCsXSi5O12 (X = Mg, Ni, Cd). Powder Diffr. 2019, 34, S2–S7. [Google Scholar] [CrossRef] [Green Version]
- Kohn, S.C.; Henderson, C.M.B.; Dupree, R. NMR Studies of the Leucite Analogues X2YSi5O12, where X = K, Rb, Cs; Y = Mg, Zn, Cd. Phys Chem Miner. 1994, 21, 176–190. [Google Scholar] [CrossRef]
- Palmer, D.C.; Dove, M.T.; Ibberson, R.M.; Powell, B.M. Structural behavior, crystal chemistry, and phase transitions in substituted leucite: High-resolution neutron powder diffraction studies. Amer. Mineral. 1997, 82, 16–29. [Google Scholar] [CrossRef]
- Redfern, S.A.T.; Henderson, C.M.B. Monoclinic-orthorhombic phase transition in the K2MgSi5O12 leucite analog. Amer. Mineral. 1996, 81, 369–374. [Google Scholar] [CrossRef]
- Bell, A.M.T.; Clegg, F.; Henderson, C.M.B. Monoclinic-orthorhombic first-order phase transition in K2ZnSi5O12 leucite analogue; transition mechanism and spontaneous strain analysis. Mineral. Mag. 2021, 85, 752–771. [Google Scholar] [CrossRef]
- Bell, A.M.T.; Henderson, C.M.B. High-temperature synchrotron X-ray powder diffraction study of Cs2XSi5O12 (X = Cd, Cu, Zn) leucites. Mineral. Mag. 2012, 76, 1257–1280. [Google Scholar] [CrossRef]
- Torres-Martinez, L.M.; West, A.R. Pollucite- and leucite-related phases: A2BX5O12 and ACX2O6 (A = K, Rb, Cs; B = Be, Mg, Fe, Co, Ni, Zn, Cd; C = B, Al, Ga, Fe, Cr; X = Si, Ge). Zeits. Anorg. Allg. Chem. 1989, 573, 223–230. [Google Scholar] [CrossRef]
- Rietveld, H.M. A profile refinement method for nuclear and magnetic structures. J. Appl. Cryst. 1969, 2, 65–71. [Google Scholar] [CrossRef]
- Toby, B.H.; Von Dreele, R.B. GSAS-II: The genesis of a modern open-source all purpose crystallography software package. J. Appl. Cryst. 2013, 46, 544–549. [Google Scholar] [CrossRef]
- Momma, K.; Izumi, F. VESTA 3 for three-dimensional visualization of crystal, volumetric and morphology data. J. Appl. Cryst. 2011, 44, 1272–1276. [Google Scholar] [CrossRef]
- Sasaki, S.; Fujino, K.; Takeuchi, Y. X-ray determination of electron-density distributions in oxides, Mg O, Mn O, Co O, and Ni O, and atomic scattering factors of their constituent atoms. Proc. Jpn. Acad. 1979, 55, 43–48. [Google Scholar] [CrossRef] [Green Version]
- Taylor, D. Thermal Expansion Data: I. Binary Oxides with the Sodium Chloride and Wurtzite Structures, MO. Trans. J. Br. Ceram. Soc. 1984, 83, 5–9. [Google Scholar]
- Robinson, K.; Gibbs, G.V.; Ribbe, P.H. Quadratic Elongation: A Quantitative Measure of Distortion in Coordination Polyhedra. Science 1971, 172, 567–570. [Google Scholar] [CrossRef] [PubMed]
- Azuma, M.; Chen, W.; Seki, H.; Czapski, M.; Olga, S.; Oka, K.; Mizumaki, M.; Watanuki, T.; Ishimatsu, N.; Kawamura, N.; et al. Colossal negative thermal expansion in BiNiO3 induced by intermetallic charge transfer. Nat. Commun. 2011, 2, 347. [Google Scholar] [CrossRef] [PubMed] [Green Version]
- Diop, L.V.B.; Isnard, O.; Amara, M.; Gay, F.; Itié, J.P. Giant negative thermal expansion across the first-order magnetoelastic transition in Hf0.86Ta0.14Fe2. J. Alloys Compd. 2020, 845, 156310. [Google Scholar] [CrossRef]
- Taylor, D.; Henderson, C.M.B. The thermal expansion of the leucite group of minerals. Am. Mineral. 1968, 53, 1476–1489. [Google Scholar]
Figure 1.
Ambient temperature Rietveld difference plot for Rb2CoSi5Ol2. Blue dots show observed data, red line shows calculated data, black line shows difference plot and black diamonds show positions of Bragg reflections.
Figure 1.
Ambient temperature Rietveld difference plot for Rb2CoSi5Ol2. Blue dots show observed data, red line shows calculated data, black line shows difference plot and black diamonds show positions of Bragg reflections.

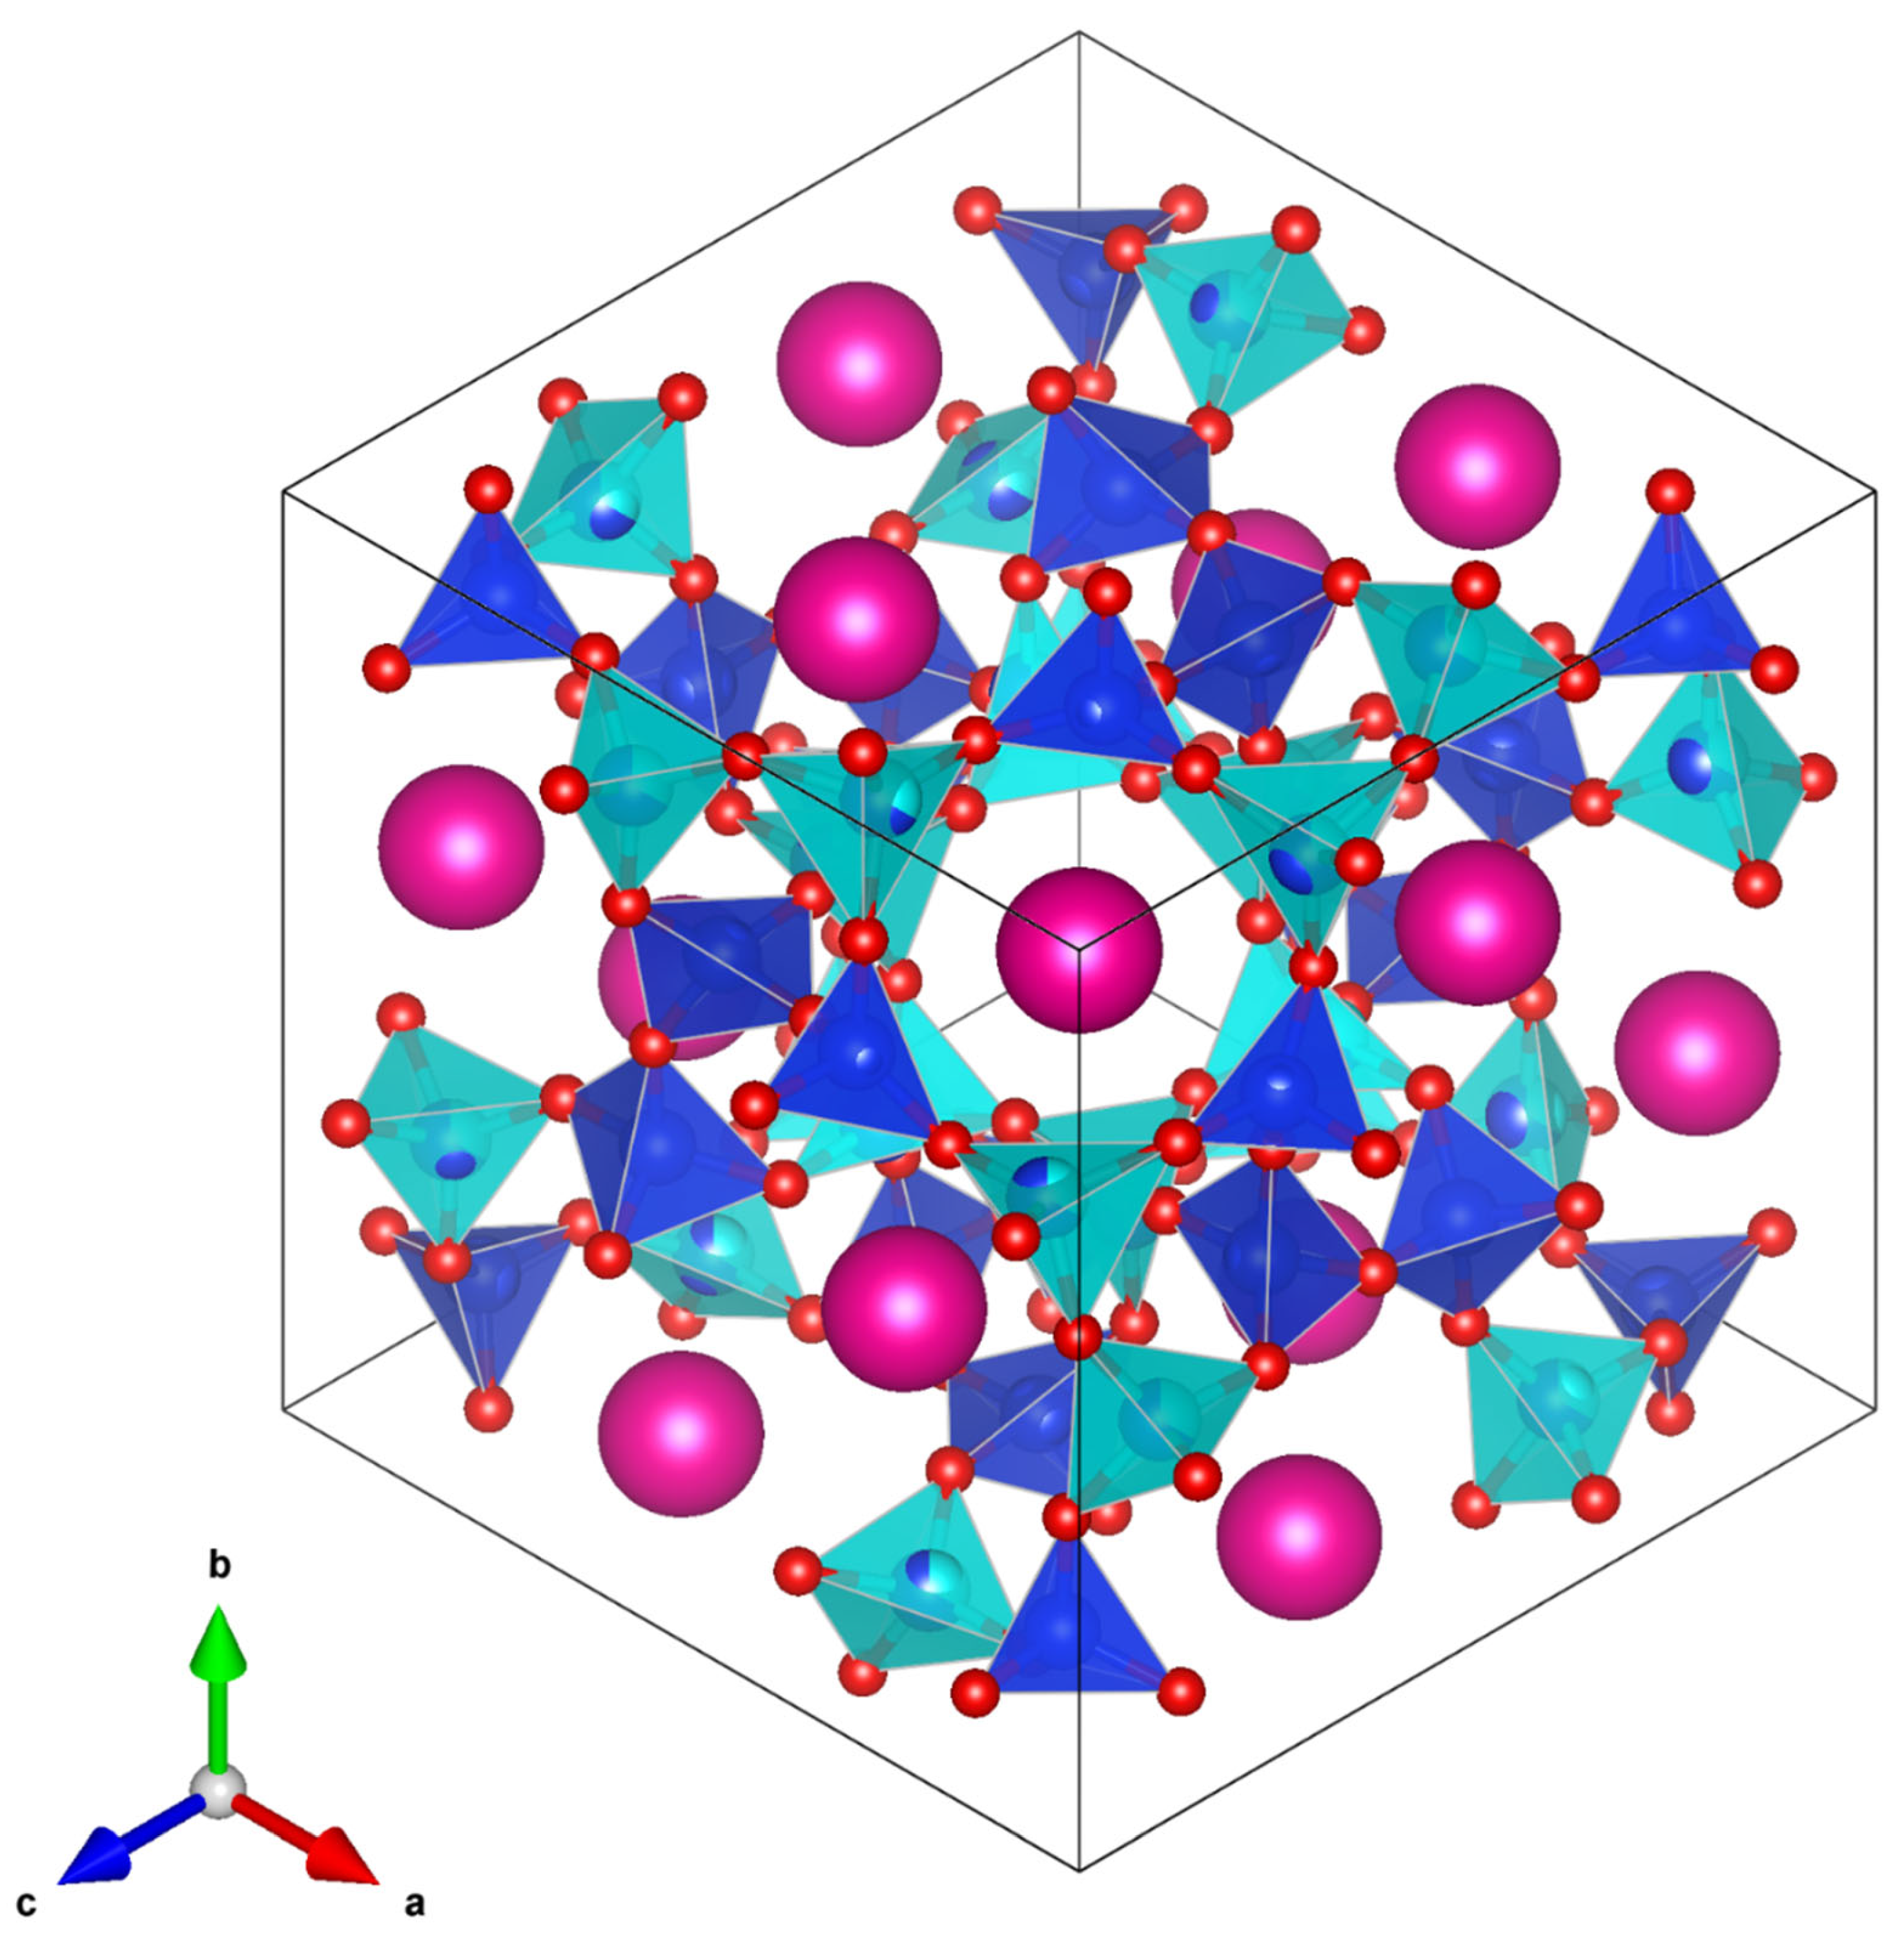
Figure 2.
VESTA plot showing the ambient temperature Pbca orthorhombic crystal structure of Rb2CoSi5Ol2. Pink spheres represent Rb+ cations, red spheres represent O2− anions, dark blue tetrahedra represent SiO4 units and light blue tetrahedra represent CoO4 units.
Figure 2.
VESTA plot showing the ambient temperature Pbca orthorhombic crystal structure of Rb2CoSi5Ol2. Pink spheres represent Rb+ cations, red spheres represent O2− anions, dark blue tetrahedra represent SiO4 units and light blue tetrahedra represent CoO4 units.

Figure 3.
Plot showing XRD data for Rb2CoSi5Ol2 10–80 °2θ over the temperature range 298–1123 K. Pbca orthorhombic data are shown in green and cubic are shown in purple.
Figure 3.
Plot showing XRD data for Rb2CoSi5Ol2 10–80 °2θ over the temperature range 298–1123 K. Pbca orthorhombic data are shown in green and cubic are shown in purple.

Figure 4.
Plot showing XRD data for Rb2CoSi5Ol2 25–27 °2θ over the temperature range 298–1123 K. This shows how three closely overlapped 004, 040 and 400 Pbca orthorhombic Bragg reflections (green) merge to form a single cubic 400 Bragg reflection (purple) on heating.
Figure 4.
Plot showing XRD data for Rb2CoSi5Ol2 25–27 °2θ over the temperature range 298–1123 K. This shows how three closely overlapped 004, 040 and 400 Pbca orthorhombic Bragg reflections (green) merge to form a single cubic 400 Bragg reflection (purple) on heating.

Figure 5.
Plot showing XRD data for Rb2CoSi5Ol2 25–27 °2θ over the temperature range 423–523 K. Pbca orthorhombic data are shown in green and cubic are shown in purple. Broad peaks at approximately 14 and 18 °2θ are due to the window material of the HTK1200N high temperature stage. Sharp peaks at approximately 39, 46 and 69 °2θ are due to the platinum sample holder.

Figure 6.
Plot showing XRD data for Rb2CoSi5Ol2 25–27 °2θ over the temperature range 423–523 K. This shows how three closely overlapped 004, 040 and 400 Pbca orthorhombic Bragg reflections (green) merge to form a single cubic 400 Bragg reflection (purple) on heating.
Figure 6.
Plot showing XRD data for Rb2CoSi5Ol2 25–27 °2θ over the temperature range 423–523 K. This shows how three closely overlapped 004, 040 and 400 Pbca orthorhombic Bragg reflections (green) merge to form a single cubic 400 Bragg reflection (purple) on heating.

Figure 7.
Variation of Pbca orthorhombic a, b and c lattice parameters and cubic a lattice parameter with calibrated temperatures for Rb2CoSi5Ol2.
Figure 7.
Variation of Pbca orthorhombic a, b and c lattice parameters and cubic a lattice parameter with calibrated temperatures for Rb2CoSi5Ol2.

Figure 8.
Variation of Pbca orthorhombic and cubic unit cell volumes with calibrated temperatures for Rb2CoSi5Ol2.
Figure 8.
Variation of Pbca orthorhombic and cubic unit cell volumes with calibrated temperatures for Rb2CoSi5Ol2.

Figure 9.
Variation of T-site distortion parameters with temperature showing how these parameters vary for the structures of Pbca orthorhombic and cubic Rb2CoSi5Ol2.
Figure 9.
Variation of T-site distortion parameters with temperature showing how these parameters vary for the structures of Pbca orthorhombic and cubic Rb2CoSi5Ol2.

Figure 10.
1133 K (MgO calibrated temperature) Rietveld difference plot for Rb2CoSi5Ol2. Blue dots show observed data, red line shows calculated data, black line shows difference plot and black diamonds show positions of Bragg reflections.
Figure 10.
1133 K (MgO calibrated temperature) Rietveld difference plot for Rb2CoSi5Ol2. Blue dots show observed data, red line shows calculated data, black line shows difference plot and black diamonds show positions of Bragg reflections.

Figure 11.
VESTA plot showing the 1133 K (MgO calibrated temperature) cubic crystal structure of Rb2CoSi5Ol2. Pink spheres represent Rb+ cations, red spheres represent O2− anions, dark blue tetrahedra represent SiO4 units and light blue tetrahedra represent (Si2/3Co1/3)O4 units.
Figure 11.
VESTA plot showing the 1133 K (MgO calibrated temperature) cubic crystal structure of Rb2CoSi5Ol2. Pink spheres represent Rb+ cations, red spheres represent O2− anions, dark blue tetrahedra represent SiO4 units and light blue tetrahedra represent (Si2/3Co1/3)O4 units.

Figure 12.
VESTA plot showing the 447 K (MgO calibrated temperature) Pbca orthorhombic crystal structure of Rb2CoSi5Ol2. Pink spheres represent Rb+ cations, red spheres represent O2− anions, dark blue tetrahedra represent SiO4 units and light blue tetrahedra represent CoO4 units.
Figure 12.
VESTA plot showing the 447 K (MgO calibrated temperature) Pbca orthorhombic crystal structure of Rb2CoSi5Ol2. Pink spheres represent Rb+ cations, red spheres represent O2− anions, dark blue tetrahedra represent SiO4 units and light blue tetrahedra represent CoO4 units.

Figure 13.
VESTA plot showing the 457 K (MgO calibrated temperature) cubic crystal structure of Rb2CoSi5Ol2. Pink spheres represent Rb+ cations, red spheres represent O2− anions, dark blue tetrahedra represent SiO4 units and light blue tetrahedra represent (Si2/3Co1/3)O4 units.
Figure 13.
VESTA plot showing the 457 K (MgO calibrated temperature) cubic crystal structure of Rb2CoSi5Ol2. Pink spheres represent Rb+ cations, red spheres represent O2− anions, dark blue tetrahedra represent SiO4 units and light blue tetrahedra represent (Si2/3Co1/3)O4 units.


Table 1.
Refined atomic coordinates for ambient temperature Rb2CoSi5Ol2.
| Rb2CoSi5O12 Pbca Orthorhombic. All Sites Fully Occupied and all Atoms on 8c Wyckoff Position | ||||
|---|---|---|---|---|
| a (Å) | b (Å) | c (Å) | V (Å3) | |
| 13.370(4) | 13.639(4) | 13.497(4) | 2461.4(20) | |
| Atom | x | y | z | Uiso |
| Rb1 | 0.1455(9) | 0.1306(11) | 0.1371(17) | 0.270(6) |
| Rb2 | 0.3751(12) | 0.3606(11) | 0.3787(17) | 0.270(6) |
| Co1 | 0.3468(22) | 0.8405(22) | 0.9184(16) | 0.203(14) |
| Si1 | 0.1223(29) | 0.628(3) | 0.610(3) | 0.117(7) |
| Si2 | 0.6105(30) | 0.1033(25) | 0.6364(30) | 0.117(7) |
| Si3 | 0.6625(27) | 0.5965(31) | 0.115(3) | 0.117(7) |
| Si4 | 0.9115(24) | 0.355(3) | 0.8258(31) | 0.117(7) |
| Si5 | 0.8438(29) | 0.9494(27) | 0.363(4) | 0.117(7) |
| O1 | 0.4908(29) | 0.418(3) | 0.122(5) | 0.036(5) |
| O2 | 0.1957(31) | 0.4815(29) | 0.380(5) | 0.036(5) |
| O3 | 0.3650(30) | 0.1469(25) | 0.490(3) | 0.036(5) |
| O4 | 0.7292(24) | 0.4557(22) | 0.615(4) | 0.036(5) |
| O5 | 0.6223(26) | 0.757(4) | 0.356(4) | 0.036(5) |
| O6 | 0.380(3) | 0.594(3) | 0.7432(29) | 0.036(5) |
| O7 | 0.9792(31) | 0.8219(30) | 0.635(4) | 0.036(5) |
| O8 | 0.5673(27) | 0.968(3) | 0.860(5) | 0.036(5) |
| O9 | 0.885(3) | 0.6312(31) | 0.9438(19) | 0.036(5) |
| O10 | 0.2217(30) | 0.9414(30) | 0.1311(31) | 0.036(5) |
| O11 | 0.1722(23) | 0.2036(27) | 0.886(3) | 0.036(5) |
| O12 | 0.9090(31) | 0.142(4) | 0.2032(31) | 0.036(5) |
Table 2.
Refined interatomic distances (Å) for ambient temperature Rb2CoSi5Ol2.
| Rb1 | O1 | 3.44(5) | Co1 | O4 | 1.926(6) |
| Rb1 | O2 | 3.85(6) | Co1 | O7 | 1.925(6) |
| Rb1 | O3 | 4.13(4) | Co1 | O9 | 1.966(6) |
| Rb1 | O4 | 3.72(6) | Co1 | O11 | 1.935(6) |
| Rb1 | O5 | 3.55(4) | Si1 | O1 | 1.642(6) |
| Rb1 | O6 | 4.04(5) | Si1 | O3 | 1.643(6) |
| Rb1 | O7 | 3.56(6) | Si1 | O5 | 1.639(6) |
| Rb1 | O8 | 4.07(4) | Si1 | O10 | 1.654(6) |
| Rb1 | O9 | 3.45(4) | Si2 | O1 | 1.638(6) |
| Rb1 | O10 | 2.78(4) | Si2 | O2 | 1.639(6) |
| Rb1 | O11 | 3.55(6) | Si2 | O6 | 1.635(6) |
| Rb1 | O12 | 3.29(5) | Si2 | O11 | 1.625(6) |
| Rb2 | O1 | 3.88(6) | Si3 | O2 | 1.631(6) |
| Rb2 | O2 | 2.91(5) | Si3 | O3 | 1.627(6) |
| Rb2 | O3 | 3.28(4) | Si3 | O4 | 1.614(6) |
| Rb2 | O4 | 2.87(3) | Si3 | O12 | 1.645(6) |
| Rb2 | O5 | 3.46(5) | Si4 | O5 | 1.642(6) |
| Rb2 | O6 | 3.72(5) | Si4 | O7 | 1.620(6) |
| Rb2 | O7 | 4.00(6) | Si4 | O8 | 1.631(6) |
| Rb2 | O8 | 3.49(4) | Si4 | O12 | 1.656(6) |
| Rb2 | O9 | 3.33(5) | Si5 | O6 | 1.627(6) |
| Rb2 | O10 | 3.75(5) | Si5 | O8 | 1.641(6) |
| Rb2 | O11 | 2.85(4) | Si5 | O9 | 1.640(6) |
| Rb2 | O12 | 3.21(6) | Si5 | O10 | 1.639(6) |
| mean Rb1-O | 3.62 | mean Co-O | 1.938 | ||
| stdev Rb1-O | 0.38 | mean Si-O | 1.636 | ||
| mean Rb2-O | 3.40 | ||||
| stdev Rb2-O | 0.39 | ||||
| mean Rb-O | 3.51 | ||||
| stdev Rb-O | 0.40 | ||||
Table 3.
Refined interatomic angles (°) for ambient temperature Rb2CoSi5Ol2.
| O4 | Co1 | O7 | 120.4(26) | Si1 | O1 | Si2 | 148(4) |
| O4 | Co1 | O9 | 101.3(27) | Si2 | O2 | Si3 | 120(4) |
| O7 | Co1 | O9 | 98.1(20) | Si1 | O3 | Si3 | 145(3) |
| O4 | Co1 | O11 | 131.7(23) | Co1 | O4 | Si3 | 96.6(26) |
| O7 | Co1 | O11 | 84.8(24) | Si1 | O5 | Si4 | 164(3) |
| O9 | Co1 | O11 | 116.0(21) | Si2 | O6 | Si5 | 158(4) |
| O1 | Si1 | O3 | 104.5(30) | Co1 | O7 | Si4 | 156(3) |
| O1 | Si1 | O5 | 109(4) | Si4 | O8 | Si5 | 122.2(28) |
| O3 | Si1 | O5 | 97(4) | Co1 | O9 | Si5 | 132(4) |
| O1 | Si1 | O10 | 121(4) | Si1 | O10 | Si5 | 148(4) |
| O3 | Si1 | O10 | 100.3(31) | Co1 | O11 | Si2 | 141.9(28) |
| O5 | Si1 | O10 | 120(4) | Si3 | O12 | Si4 | 138(3) |
| O1 | Si2 | O2 | 123(3) | mean Si-O-Si | 142.9 | ||
| O1 | Si2 | O6 | 100(4) | mean Co-O-Si | 131.6 | ||
| O2 | Si2 | O6 | 91(3) | ||||
| O1 | Si2 | O11 | 128(3) | ||||
| O2 | Si2 | O11 | 102.5(30) | ||||
| O6 | Si2 | O11 | 102(3) | ||||
| O2 | Si3 | O3 | 120(4) | ||||
| O2 | Si3 | O4 | 48.0(18) | ||||
| O3 | Si3 | O4 | 113(4) | ||||
| O2 | Si3 | O12 | 120(5) | ||||
| O3 | Si3 | O12 | 109.8(22) | ||||
| O4 | Si3 | O12 | 134(4) | ||||
| O5 | Si4 | O7 | 84.8(25) | ||||
| O5 | Si4 | O8 | 149(4) | ||||
| O7 | Si4 | O8 | 91(3) | ||||
| O5 | Si4 | O12 | 105(4) | ||||
| O7 | Si4 | O12 | 110.7(30) | ||||
| O8 | Si4 | O12 | 105(4) | ||||
| O6 | Si5 | O8 | 90.4(28) | ||||
| O6 | Si5 | O9 | 104.1(26) | ||||
| O8 | Si5 | O9 | 104(4) | ||||
| O6 | Si5 | O10 | 108(4) | ||||
| O8 | Si5 | O10 | 140.3(29) | ||||
| O9 | Si5 | O10 | 105(3) | ||||
| mean O-Co-O | 108.7 | ||||||
| mean O-Si-O | 108.0 | ||||||
Table 4.
Variation of lattice parameters with calibrated temperatures for Rb2CoSi5Ol2.
| T (K) | T—MgO (K) | a(Å) | b(Å) | c(Å) | V(Å3) |
|---|---|---|---|---|---|
| 298 | + | 13.370(4) | 13.639(4) | 13.497(4) | 2461.4(20) |
| 298 | ++ | 13.444(13) | 13.612(9) | 13.457(16) | 2463(5) |
| 298 | 303 | 13.416(8) | 13.620(8) | 13.495(8) | 2466(4) |
| 323 | 324 | 13.427(4) | 13.612(4) | 13.508(4) | 2469(2) |
| 373 | 376 | 13.455(3) | 13.587(3) | 13.518(3) | 2471(2) |
| 423 | 427 | 13.492(3) | 13.604(2) | 13.507(3) | 2479(1) |
| 433 | 437 | 13.494(3) | 13.603(2) | 13.509(3) | 2480(1) |
| 443 | 447 | 13.496(3) | 13.606(2) | 13.516(3) | 2482(1) |
| 453 | 457 | 13.532(1) | 2477.7(6) | ||
| 463 | 467 | 13.533(1) | 2478.4(6( | ||
| 473 | 477 | 13.536(1) | 2480.2(6) | ||
| 483 | 487 | 13.541(1) | 2482.8(5) | ||
| 493 | 497 | 13.544(1) | 2484.4(5) | ||
| 503 | 507 | 13.5448(9) | 2485.0(5) | ||
| 513 | 517 | 13.5478(9) | 2486.6(5) | ||
| 523 | 528 | 13.5498(9) | 2487.7(5) | ||
| 573 | 581 | 13.5495(9) | 2487.5(5) | ||
| 623 | 632 | 13.5545(9) | 2490.3(5) | ||
| 673 | 684 | 13.5609(8) | 2493.8(5) | ||
| 723 | 736 | 13.5686(8) | 2498.1(4) | ||
| 773 | 785 | 13.5709(7) | 2499.3(4) | ||
| 823 | 835 | 13.5775(7) | 2503.0(4) | ||
| 873 | 883 | 13.5820(7) | 2505.5(4) | ||
| 923 | 935 | 13.5853(6) | 2507.3(3) | ||
| 973 | 986 | 13.5885(6) | 2509.07(31) | ||
| 1023 | 1036 | 13.5919(5( | 2510.95(27) | ||
| 1073 | 1084 | 13.5968(5) | 2513.67(26) | ||
| 1123 | 1133 | 13.6008(5) | 2515.88(26) | ||
+ = ambient temperature scan outside high temperature stage. ++ = ambient temperature scan in high temperature stage after heating.
Table 5.
Refined atomic coordinates for 1133 K Rb2CoSi5Ol2.
| Rb2CoSi5Ol2 Cubic | ||||||
|---|---|---|---|---|---|---|
| a = 13.6008(5)Å | V = 2515.88(26)Å3 | |||||
| Atom | x | y | Z | occ. | Uiso | Wyckoff |
| Rb1 | 0.1363(5) | 0.1363(5) | 0.1363(5) | 1.0000 | 0.142(6) | 8c |
| Rb2 | 0.3871(6) | 0.3871(6) | 0.3871(6) | 1.0000 | 0.124(5) | 8c |
| Si1 | 0.36116(31) | 0.82652(27) | 0.9199(3) | 0.6667 | 0.092(6) | 24d |
| Co1 | 0.36116(31) | 0.82652(27) | 0.9199(3) | 0.3333 | 0.092(6) | 24d |
| Si2 | 0.1280(8) | 0.6550(7) | 0.5936(9) | 1.0000 | 0.026(4) | 24d |
| O1 | 0.4759(10) | 0.3756(16) | 0.1415(18) | 1.0000 | 0.098(4) | 24d |
| O2 | 0.1365(13) | 0.7276(8) | 0.1045(15) | 1.0000 | 0.098(4) | 24d |
| O3 | 0.9685(6) | 0.8798(6) | 0.6183(12) | 1.0000 | 0.098(4) | 24d |
| O4 | 0.6428(12) | 0.20079(23) | 0.5761(11) | 1.0000 | 0.098(4) | 24d |
Table 6.
Refined interatomic distances (Å) for 1133 K Rb2CoSi5Ol2.
| Rb1 | O1 | 3.862(22) | Rb2 | O1 | 3.555(25) | Si1/Co1 | O2 | 1.7110(31) |
| Rb1 | O1 | 3.862(24) | Rb2 | O1 | 3.555(30) | Si1/Co1 | O3 | 1.711(3) |
| Rb1 | O1 | 3.862(23) | Rb2 | O1 | 3.555(26) | Si1/Co1 | O3 | 1.712(3) |
| Rb1 | O2 | 3.358(18) | Rb2 | O2 | 3.358(22) | Si1/Co1 | O4 | 1.7117(30) |
| Rb1 | O2 | 3.358(20) | Rb2 | O2 | 3.358(26) | Si2 | O1 | 1.610(3) |
| Rb1 | O2 | 3.358(22) | Rb2 | O2 | 3.358(21) | Si2 | O1 | 1.613(3) |
| Rb1 | O3 | 3.635(18) | Rb2 | O3 | 3.358(9) | Si2 | O2 | 1.608(3) |
| Rb1 | O3 | 3.635(19) | Rb2 | O3 | 3.358(12) | Si2 | O4 | 1.606(3) |
| Rb1 | O3 | 3.635(18) | Rb2 | O3 | 3.358(9) | mean (Si1/Co1)-O | 1.711 | |
| Rb1 | O4 | 3.021(15) | Rb2 | O4 | 3.567(17) | mean Si2-O | 1.609 | |
| Rb1 | O4 | 3.021(16) | Rb2 | O4 | 3.567(17) | |||
| Rb1 | O4 | 3.021(15) | Rb2 | O4 | 3.567(17) | |||
| mean Rb1-O | 3.469 | mean Rb2-O | 3.460 | |||||
| stdev Rb1-O | 0.328 | stdev Rb2-O | 0.106 | |||||
| mean Rb-O | 3.464 | |||||||
| stdev Rb-O | 0.239 | |||||||
Table 7.
Refined interatomic angles (°) for 1133 K Rb2CoSi5Ol2. T = Si or Co.
| O2 | Si1/Co1 | O3 | 103.5(7) | |
| O2 | Si1/Co1 | O3 | 105.2(11) | |
| O3 | Si1/Co1 | O3 | 87.5(8) | |
| O2 | Si1/Co1 | O4 | 122.7(9) | |
| O3 | Si1/Co1 | O4 | 117.4(6) | |
| O3 | Si1/Co1 | O4 | 114.5(9) | |
| O1 | Si2 | O1 | 110.3(18) | |
| O1 | Si2 | O2 | 106.4(13) | |
| O1 | Si2 | O2 | 101.9(9) | |
| O1 | Si2 | O4 | 101.6(9) | |
| O1 | Si2 | O4 | 110.9(14) | |
| O2 | Si2 | O4 | 125.5(11) | |
| Si2 | O1 | Si2 | 155.4(17) | |
| Si1/Co1 | O2 | Si2 | 136.0(12) | |
| Si1/Co1 | O3 | Si1/Co1 | 145.8(4) | |
| Si1/Co1 | O4 | Si2 | 125.6(9) | |
| mean | O | Si1/Co1 | O | 108.5 |
| mean | O | Si2 | O | 109.4 |
| mean | O | T | O | 109.0 |
| mean | T | O | T | 140.7 |
Table 8.
Thermal expansion coefficients (TEC) for leucite analogues.
| Stoichiometry | SG | T (K) | Mean TEC (× 105 K−1) | Reference |
|---|---|---|---|---|
| Rb2CoSi5O12 | Pbca | 303–447 | 4(1) | This work |
| Rb2CoSi5O12 | 457–1133 | 4(2) | This work | |
| KGaSi2O6 | I41/a | 298–873 | 5.2(4) | [4] |
| KGaSi2O6 | Ia-3d | 673–1473 | 8(2) | [4] |
| K2ZnSi5O12 | P21/c | 773–843 | 10(1) | [17] |
| K2ZnSi5O12 | Pbca | 868–973 | 6(3) | [17] |
| Cs2CdSi5O12 | Pbca | 295–1173 | 1.8(4) | [18] |
| Cs2CuSi5O12 | Pbca | 295–333 | 6(3) | [18] |
| Cs2CuSi5O12 | Pbca | 333–1173 | 0.8(3) | [18] |
| Cs2ZnSi5O12 | Pbca | 295–543 | 2(1) | [18] |
| Cs2ZnSi5O12 | 573–1173 | 1.1(3) | [18] | |
| K2MgSi5O12 | P21/c | 293–647 | 5(1) | [16] |
| K2MgSi5O12 | Pbca | 668–842 | 2(1) | [16] |
| CsAlSi2O6 | I41/a | 20–368 | 5.1(1.4) | [15] |
| CsAlSi2O6 | Ia-3d | 373–573 | 3.0(2.2) | [15] |
| RbAlSi2O6 | I41/a | 298–743 | 7.1(7) | [15] |
| RbAlSi2O6 | Ia-3d | 753–953 | 3(1) | [15] |
| KAlSi2O6 | I41/a | 4–923 | 5(1) | [15] |
| KAlSi2O6 | Ia-3d | 943–1023 | 4.1(6) | [15] |
| KFeSi2O6 | I41/a | 298–843 | 6.2(8) | [15] |
| KFeSi2O6 | Ia-3d | 853–1050 | 5(1) | [15] |
| Nat. leucite | I41/a | 298–963 | 8.562 | [28] |
| Nat. leucite | Ia-3d | 963–1193 | 0.877 | [28] |
| KAlSi2O6 | I41/a | 298–878 | 8.548 | [28] |
| KAlSi2O6 | I41/a | 878–1093 | 6.323 | [28] |
| KAlSi2O6 | Ia-3d | 1093–1193 | 0.921 | [28] |
| RbAlSi2O6 | I41/a | 298–583 | 7.98 | [28] |
| RbAlSi2O6 | I41/a | 583–793 | 4.653 | [28] |
| RbAlSi2O6 | Ia-3d | 793–1193 | 1.215 | [28] |
| CsAlSi2O6 | Ia-3d | 298–463 | 4.789 | [28] |
Disclaimer/Publisher’s Note: The statements, opinions and data contained in all publications are solely those of the individual author(s) and contributor(s) and not of MDPI and/or the editor(s). MDPI and/or the editor(s) disclaim responsibility for any injury to people or property resulting from any ideas, methods, instructions or products referred to in the content. |
© 2023 by the author. Licensee MDPI, Basel, Switzerland. This article is an open access article distributed under the terms and conditions of the Creative Commons Attribution (CC BY) license (https://creativecommons.org/licenses/by/4.0/).
Share and Cite
MDPI and ACS Style
Bell, A.M.T. Orthorhombic-Cubic Phase Transition in Rb2CoSi5O12 Leucite Analogue. Minerals 2023, 13, 210. https://doi.org/10.3390/min13020210
AMA Style
Bell AMT. Orthorhombic-Cubic Phase Transition in Rb2CoSi5O12 Leucite Analogue. Minerals. 2023; 13(2):210. https://doi.org/10.3390/min13020210
Chicago/Turabian StyleBell, Anthony Martin Thomas. 2023. "Orthorhombic-Cubic Phase Transition in Rb2CoSi5O12 Leucite Analogue" Minerals 13, no. 2: 210. https://doi.org/10.3390/min13020210
Note that from the first issue of 2016, this journal uses article numbers instead of page numbers. See further details here.