Article

The Impact of Froth Launders Design in an Industrial Flotation Bank Using Novel Metallurgical and Hydrodynamic Models

1
Department of Chemical and Environmental Engineering, Universidad Técnica Federico Santa María, Valparaíso 2390123, Chile
2
Metso Outotec, 28100 Pori, Finland
*
Author to whom correspondence should be addressed.
Minerals 2023, 13(2), 169; https://doi.org/10.3390/min13020169
Submission received: 6 December 2022 / Revised: 18 January 2023 / Accepted: 19 January 2023 / Published: 24 January 2023
(This article belongs to the Special Issue Hydrodynamics and Gas Dispersion in Flotation)

Abstract

:
In flotation cells, especially in large flotation units, froth management is a crucial variable that should be considered during the design phase or optimized to improve the performance of existing flotation circuits. This paper presents a simulation evaluation of the effect of launder design on the metallurgical performance of an industrial flotation circuit consisting of five TankCell® e630 (630 m3) cells in a Cu rougher duty. This analysis was carried out using a new industrial simulator that includes novel metallurgical and hydrodynamic models, developed from a wide database collected from many industrial concentrators. This tool is currently incorporated into HSC Chemistry® software and allows evaluating the effect of launder design on mineral froth recovery, water recovery, entrainment, and other variables. The industrial flotation circuit was evaluated under different launder design scenarios, considering an actual flotation circuit that includes TankCell® e630 cells for calibration and as a reference (baseline). Firstly, two different designs were evaluated in the full circuit: a standard launder design and a new launder technology. It was found that the new launder technology enabled improvement of the mineral recovery along the circuit, mainly for coarse particles, due to the improvement in froth mineral recovery. Next, a partial upgrade of the launder design along the circuit was analysed. Thus, the new launder technology was evaluated in the first and the last two cells of the bank. The results showed that upgrading the launders in different cells along the circuit delivered an increase in the final recovery with respect to the baseline, with a partial impact on the concentrate grade. However, these changes are less than those when evaluating the full upgrade scenario. A partial launder upgrade either in the first or last two cells of the bank showed similar final recoveries, but the latter enabled a slightly higher concentrate grade (about 1% higher) to be achieved. Finally, the evaluation of launder design using the industrial simulator made it possible to estimate its effect on variables that are not commonly obtained from plant surveys, including superficial gas rates at the froth surface level, froth recovery per particle size, collection recovery per particle size and liberation, gangue entrainment, and bubble loading grade.

1. Introduction

Industrial flotation circuits have seen a significant increase in mechanical cell sizes, and now many plants or expansions are fully equipped with 300 m3 cells all over the world. Additionally, in recent years, larger cells of over 500 m3 and 600 m3 are being incorporated into new projects [1,2,3]. The new circuits with large cells have many reported advantages, e.g., lower specific energy, simpler circuits to operate with a lower number of cells, smaller footprint, and better control. However, new challenges arise to achieve the required recovery of the target cells. The main constraint in large cells is related to the decrease in froth recovery, which is strongly dependent on the longer froth transport distances and normally becomes the bottleneck of the system. To overcome this problem, new cell designs are required regarding the improvement of the froth transport together with the proper selection of operating conditions and control strategies. With this aim, Coleman [4] has carried out research on launder design, and Brito-Parada and Cilliers [5] have addressed the problem of launder configuration for improving froth transport. Grau et al. [6] have shown the improvement in flotation cell performance after reducing the froth area in a flotation cell of 300 m3 in operation at Atalaya copper concentrator, Spain. Additionally, Seaman et al. [7] have shown the optimization of the existing rougher cells of 200 m3 at Red Chris concentrator in Canada, where the installation of concentric launders to reduce the froth transport distance, together with a rougher control strategy, enabled improved cell recovery. Similarly, Bermudez et al. [8] have presented the results from launder retrofits with a new centre launder on the last three cells in the rougher circuit with 300 m3 cells at Hudbay Constancia concentrator, Peru. Metallurgical recovery improvements of 0.70% and 1.40% in Cu and Mo, respectively, were reported. Additionally, Corona et al. [9] have described the effect of launder configuration on froth surface area (FSA) at different tank cell volumes.
Recently, Bermudez et al. [10] have presented the metallurgical results after installing a set of centre launder retrofits on the last three tank cells in one of the parallel rougher flotation rows with 300 m3 cells at Copperton, USA. The results showed significant improvements in copper and molybdenum flotation recoveries throughout the rougher circuit.
Some studies have been conducted in industrial flotation circuits focused on the measurements and correlation of variables such as froth discharge velocity and top of the froth grades to correlate with the metallurgical performance [11]. However, despite the advances in basic and applied research, there is still a lack of industrial data for flotation characterization. In this sense, the main objective of this work is to present the evaluation of large industrial flotation cells (630 m3), analysing froth launder arrangements to improve the froth transport into the concentrate. Thus, the effect of changing the launders design in the full circuit as well as a partial modification in the first two and the last two cells was evaluated. For this purpose, an alternative launder design was simulated in four different scenarios, using new models implemented in the HSC® Chemistry simulator to evaluate metallurgical performance. Evaluation of other variables, such as collection recovery, froth recovery, gangue entrainment, and bubble loading grade along the flotation bank, allowed evaluation of different alternatives to improve the flotation bank performance.
The experimental testing for the simulator calibration was performed in the rougher banks of Buenavista del Cobre (BVC) concentrator in Mexico, which includes TankCell® e630 cells at the beginning of the rougher circuit [2].

2. Methodology

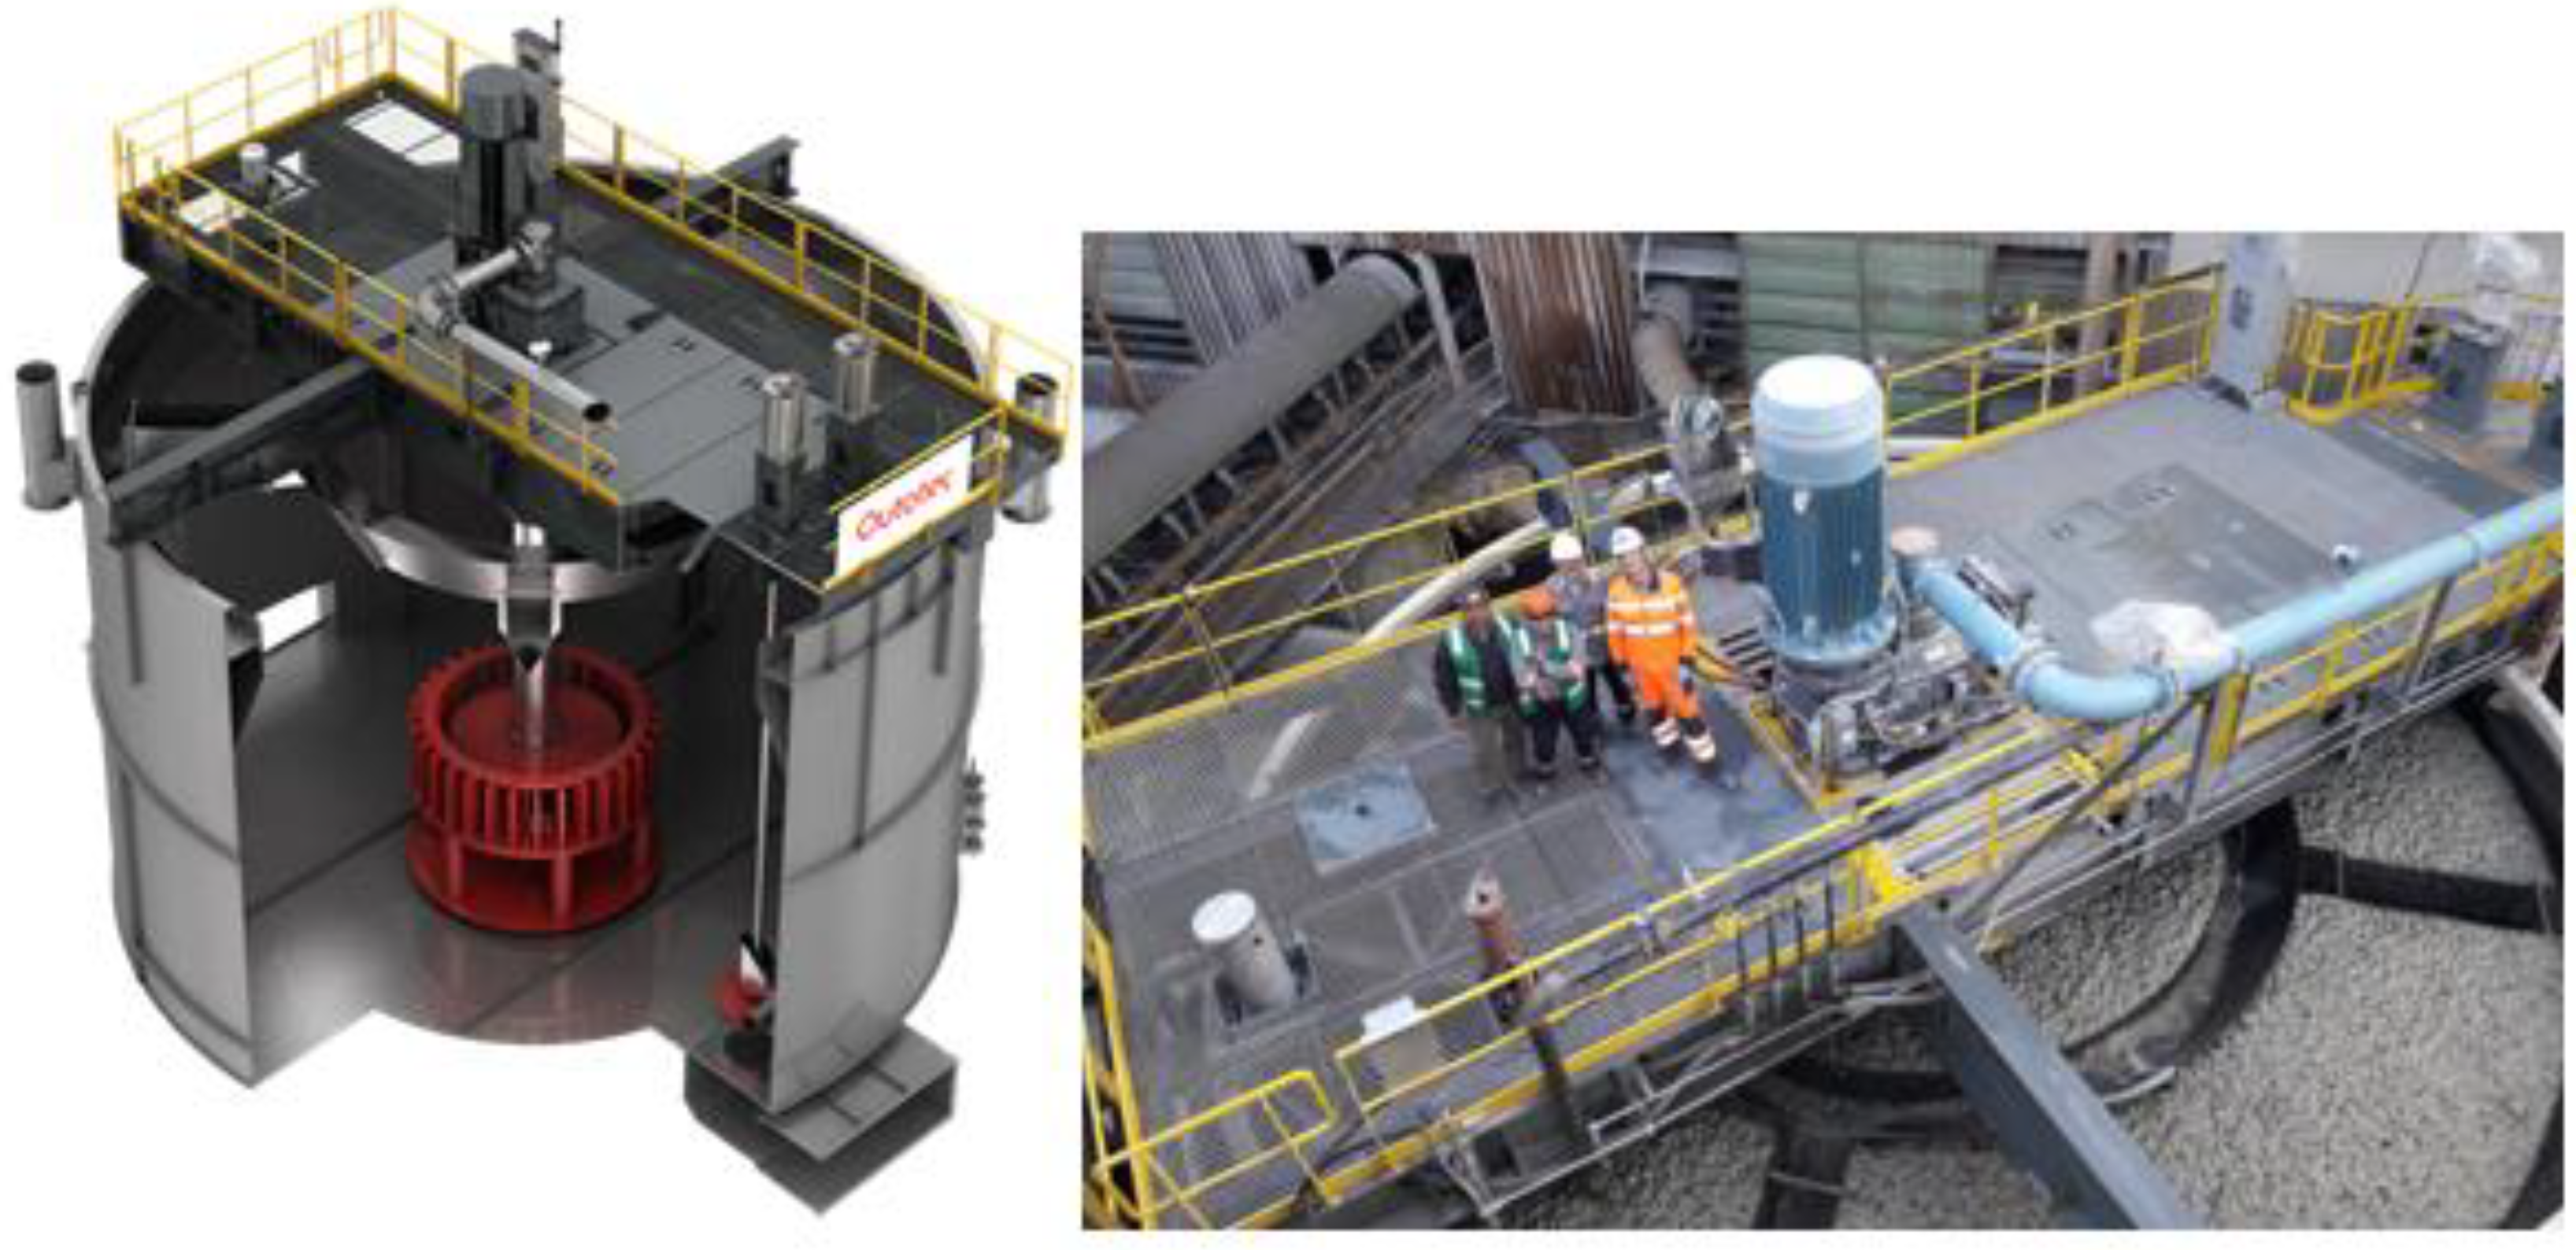
2.1. Evaluation of New Launder Designs in Flotation Cells

Two launder designs were evaluated in a simulated flotation bank consisting of five TankCell® e630 cells: a standard launder, shown in Figure 1a, corresponding to a double internal launder [6], and a new launder technology (upgrade), shown in Figure 1b.
The new launder technology includes an adjustable froth crowder and centre launder, complementing the internal peripherical launder and the original froth crowder. The main objective of this launder design is to reduce the froth surface area and increase the overflow launder lip, enabling improved mineral transport in froth and increased froth recovery. The adjustable froth crowder and the centre launder are highlighted in grey in Figure 1b. The centre launder is located between the froth crowder and the adjustable crowder.

2.2. Simulation of Different Scenarios for an Industrial Flotation Circuit

2.2.1. Scenarios

Four scenarios were simulated to evaluate the metallurgical performance after changing the launder design in the flotation cells of a bank consisting of five TankCell® e630 cells. The first scenario corresponds to the baseline, concerning the full circuit with standard launders (without upgrade). Then, full and partial launder upgrades were evaluated.
The simulator was able to show the differences between the scenarios with respect to recovery, concentrate grade, and internal variables such as froth recovery, entrainment, bubble loading grade, and other variables.
The scenarios are shown below:
  • Full circuit with standard launders (baseline).
  • Full circuit with new launder technology (upgrade).
  • New launder technology in the two first cells of the bank.
  • New launder technology in the two last cells of the bank.

2.2.2. Industrial Flotation Simulator to Predict Metallurgical Performance

The industrial flotation simulator used in this study was developed from a wide database gathered from industrial sampling surveys performed at different flotation plants. This simulator includes the operating conditions, cell design, and feed characteristics as input variables and allows the calculation of the metallurgical behaviour of each cell along a flotation bank [12]. This tool is currently implemented in the HSC Chemistry software [13]. The implementation process of this tool has been described earlier by Betancourt et al. [14].
The flotation simulator considers the sequential calculation of each single cell in series, assuming a two-zone system: collection and froth [15,16]. The feed minerals are characterized in terms of size-by-liberation classes.
The collection zone was characterized using a perfect mixing plus by-pass flow model, based on actual residence time distribution measurements (per particle size) at industrial circuits using the radioactive tracer technique [17]. To characterize the kinetics, a single rate constant (k) and a maximum recovery (Rmax) per size-by-liberation class was considered.
The hydrodynamic conditions were characterized based on actual industrial data. Thus, a relationship between the superficial gas rate (JG) and the bubble diameter (D32), at the interface level, was found from a benchmarking, considering cells sizes from 10 m3 to 300 m3 in rougher, cleaner, and scavenger stages, including some operations using sea water [12]. Equation (1) shows the general correlation to describe all the industrial data on JG (cm/s) and D 32 (cm).
D 32 = 0.0707 e 0.823 J G
Then, the bubble surface area flux, S B (m2/s/m2), was expressed in terms of the superficial gas rate JG (cm/s) and bubble size D32 (cm), as shown in Equation (2).
S B = 6 J G D 32 = 84.87 J G e 0.823 J G
The analysis of industrial data [12] for the range of interest showed a correlation between SB and the collection gas holdup (εG,C), described by Equation (3). Then, the εG,C was expressed as a function of JG, as shown in Equation (4).
S B = 4.46 ε G , C  
ε G , C = 19 J G e 0.823 J G
Regarding the froth recovery, it was modelled as a function of four variables: froth stability, which depends on the solid flow rate entering the froth by true flotation; the launder design; the froth residence time; and the particle size [12]. This model was built using a wide database on froth recoveries measured at different industrial plants. Froth recoveries from 40% to 90% were found in flotation plants and were used to calibrate the model. The average residence time of gas in the froth ( τ G , F ) was estimated in terms of froth depth (HF), superficial gas rate (JG, at the froth surface level), and mean gas holdup in froth ( ε G , F ), as shown in Equation (5).
τ G , F = H F   ε G , F J G
The mineral recovery by entrainment (valuable and gangue) in each cell was estimated in terms of water recovery and particle settling velocity [18]. The froth water recovery was represented as a function of solid froth recovery, froth depth, and air flow rate, while the water entering the interface was considered as a function of gas holdup, air flow rate, pulp density, and solid content.
The paper presented by Yianatos et al. [12] describes in more detail the models used to build the flotation simulator. Additionally, some case studies analysed with the industrial simulator have been presented by Vallejos et al. [19,20], Vallejos et al. [21], and Betancourt et al. [14].
The industrial flotation simulator can represent the effect of both operating conditions and cell design characteristics on recovery and concentrate grade. According to the models and structure of the simulator, specific variables such as launder design were included in the simulator, which is an innovative topic in this type of tool and allows the study of the effect of the froth transport distance to the discharge lip on the metallurgical performance in industrial cells.

2.2.3. Industrial Flotation Simulator to Predict Metallurgical Performance

Description of the Industrial Flotation Circuit

This study was based on Buenavista del Cobre (BVC) mine Concentrator 1. BVC is a copper-molybdenum mine located in northern Mexico. Concentrator 1, processing 86 ktpd, has two parallel grinding-flotation sections known as Section 1 and Section 2. Both sections consist of three bulk (Cu and Mo) rougher flotation lines, and the rougher concentrate is transferred to a regrinding stage followed by two cleaning stages that produce a final bulk Cu–Mo concentrate [2,22].
In 2018, a TankCell® e630 cell was installed as the first cell in each existing rougher stage of Section 1 and Section 2. The implementation was recommended and reported by Grau et al. [2] based on a process assessment performed by personnel from Buenavista del Cobre and Outotec in 2015 to improve metallurgical performance.

Metallurgical Surveys at BVC Concentrator

The simulation study reported in this work is based on multiple sampling campaigns conducted around the TankCell® e630 flotation cells (Figure 2). The feed and tail samples were collected from automatic cutters, while the concentrate samples were cut manually at the end of the TankCell® e630 cell concentrate pipe.
The products of four sampling rounds were combined and analysed size by size, and the results were mass balanced to obtain metallurgical performance per size class. Additionally, mineralogical information (microscopy) on the feed samples of BVC concentrator was available, including minerals distribution and mineral liberation (polished section).
Operating conditions such as grade, tonnage and solid content in feed, air flow rate, froth depth, and pH were monitored through sampling surveys.
The average operating conditions of the TankCell® e630 cell observed in the sampling surveys were used as input variables for the simulation study. A froth depth of 25 cm and a superficial gas rate of 1.2 cm/s (interface level) were considered for the four simulated scenarios. The operating conditions were set as input variables for each cell of the flotation bank, consisting of five TankCell® e630 units.
Table 1 shows the feed characteristics of BVC in terms of distribution of valuable mineral in size-by-liberation classes, total mass distribution and feed Cu grade per size class. Additionally, the flotation feed was composed of 78% chalcopyrite, 17% secondary Cu sulphides, and 5% tennantite.

3. Results and Discussion

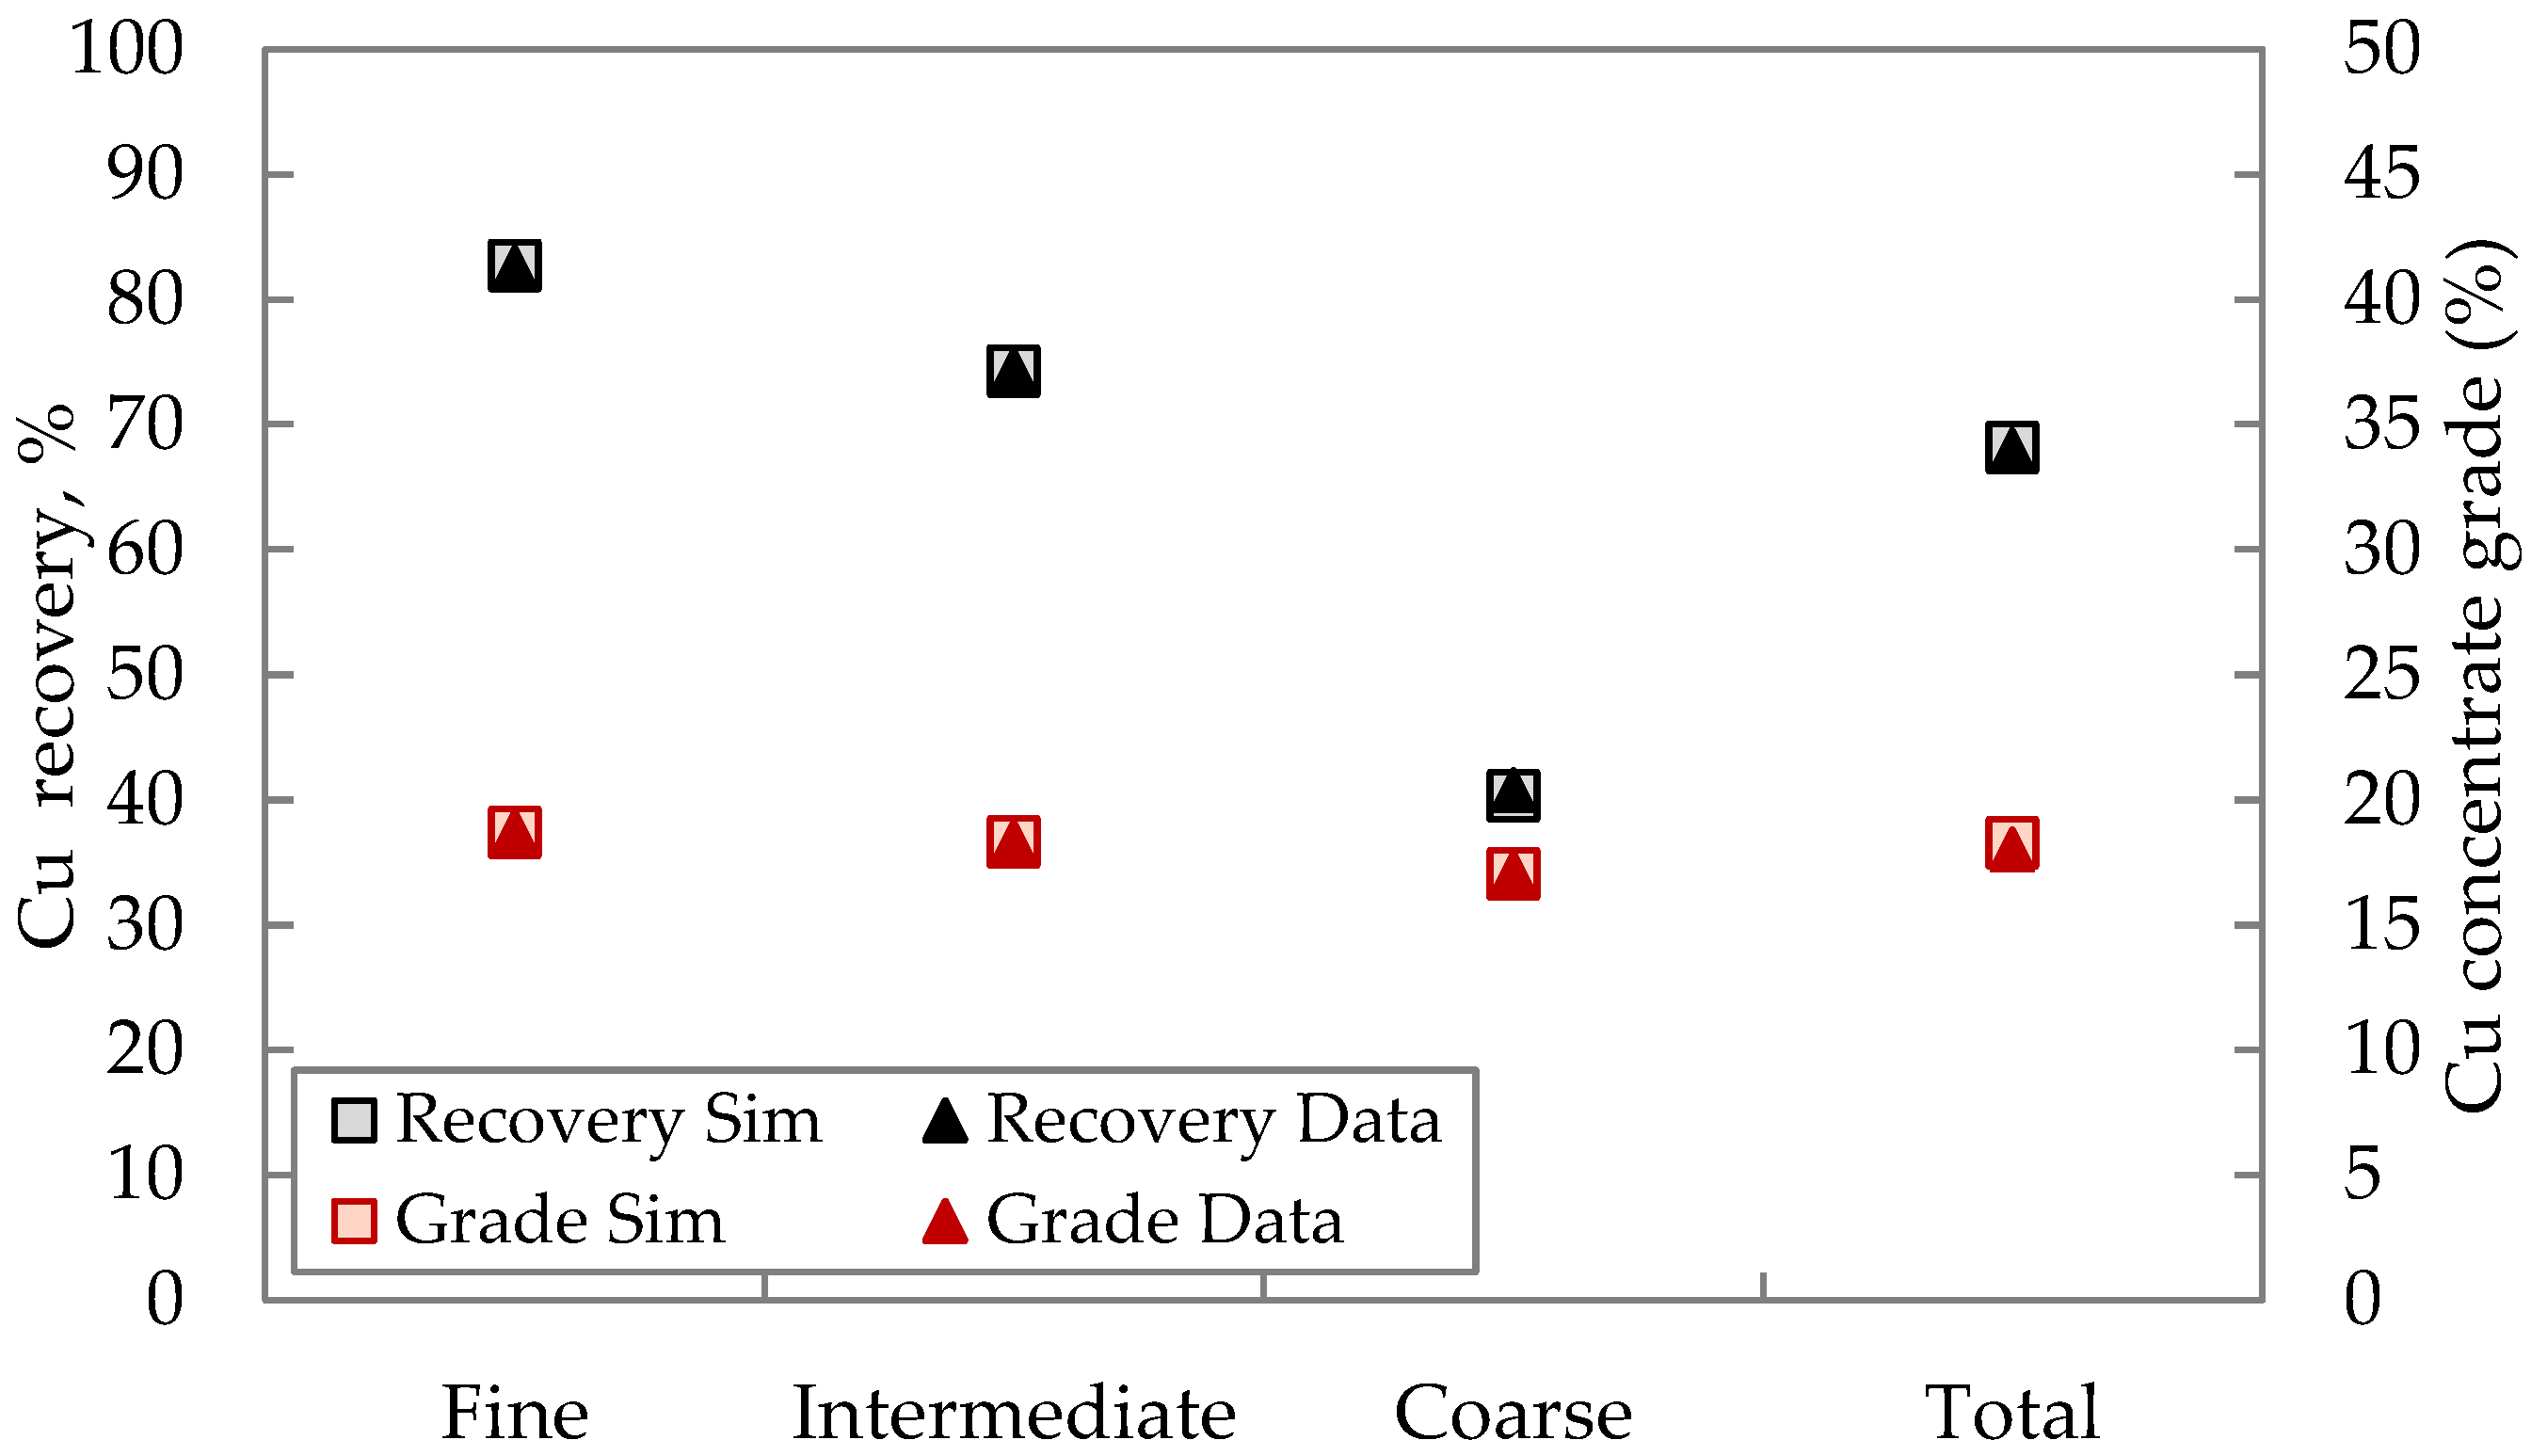
3.1. Calibration of the Metallurgical Response Predicted by the Industrial Simulator

The response predicted by the simulator was calibrated using the information from the sampling surveys performed at the BVC concentrator. Thus, size-by-liberation kinetics parameters were obtained by fitting the recoveries and concentrate grades by particle size.
Figure 3 shows the recovery and concentrate grade for the TankCell® e630 cell, including measured and predicted data after calibration. Good agreement between the measured and simulated data can be observed.
Moreover, Suhonen et al. [22] earlier estimated the froth recovery in the TankCell® e630 cell at the BVC concentrator. Figure 4 shows the froth recovery for three froth depths. It was found that froth recovery decreased from 69% to 47% when the froth depth increased from 14 to 26 cm. Then, from the simulation study presented in this work, the froth recovery of the TankCell® e630 cell was predicted using the industrial simulator (at a froth depth of 25 cm, Table 1) and is shown with a red point in Figure 4.
This plant value is in good agreement with the correlation shown for froth recovery vs. froth depth. It should be noted that the froth recovery model used in the industrial simulator was built and validated from a wide database of measurements performed at several industrial plants. Therefore, these results validate the estimation performed by Suhonen et al. [22] as well as strengthening the froth recovery model in the simulator.

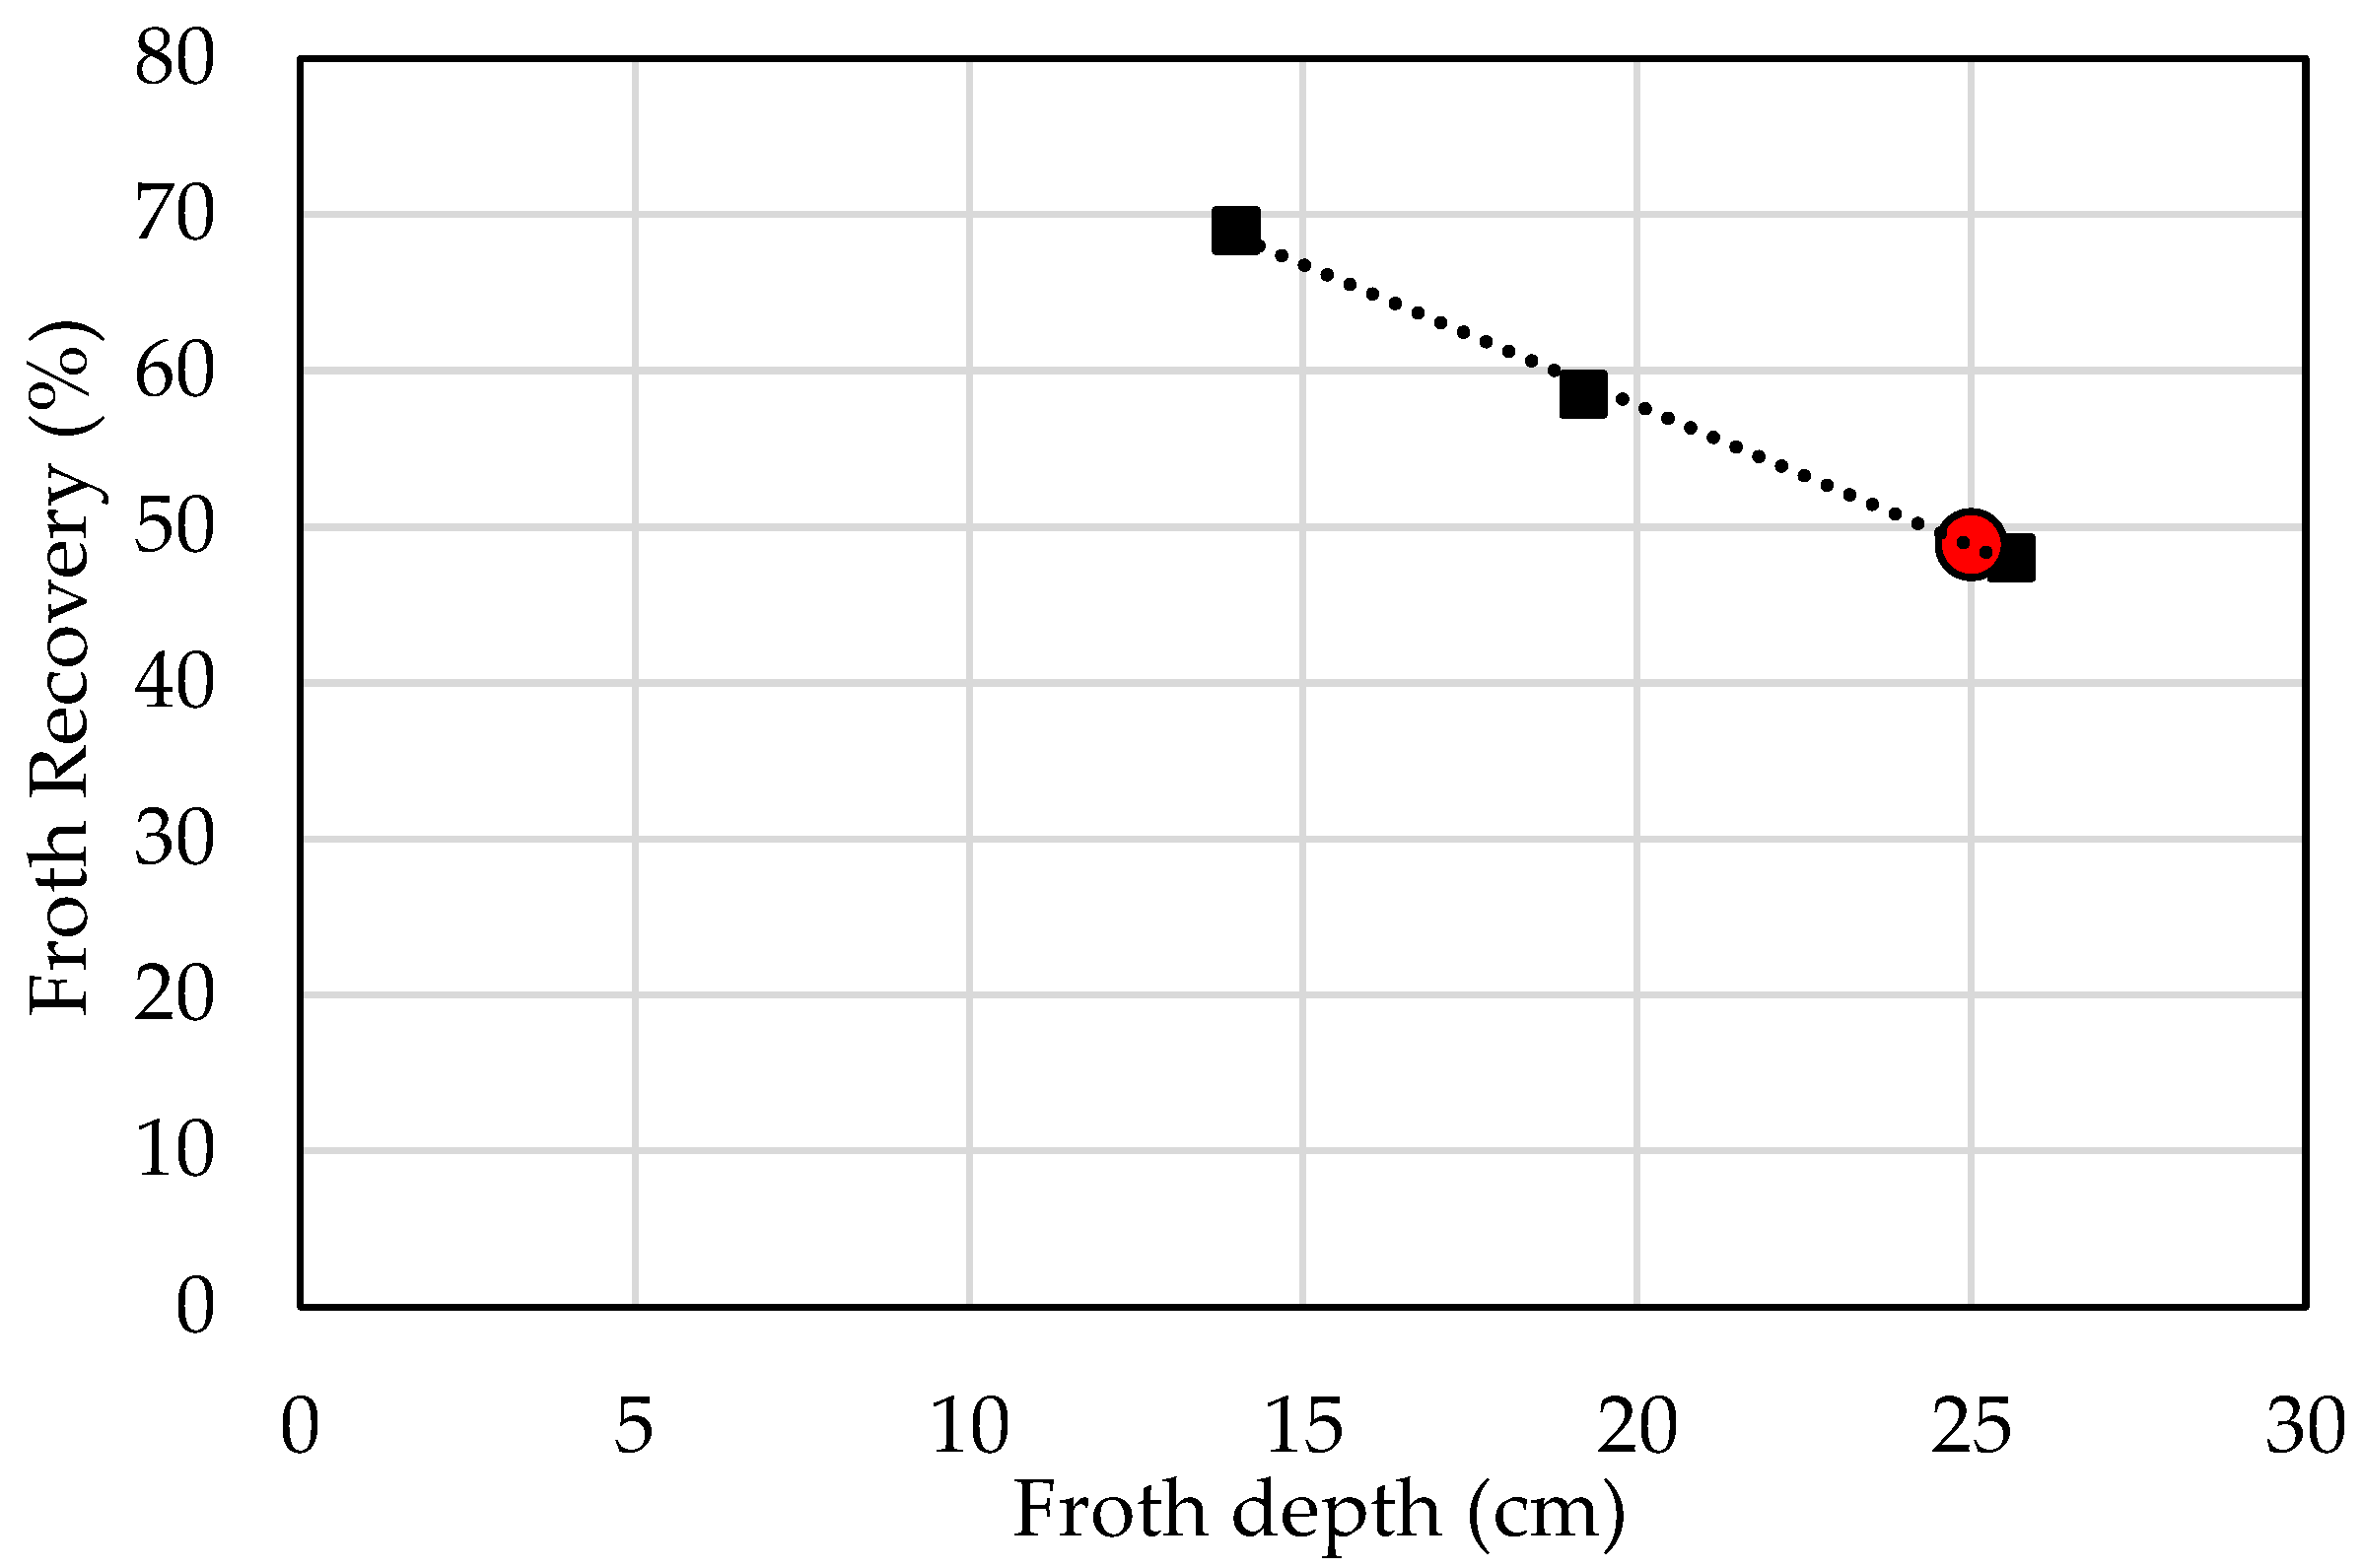
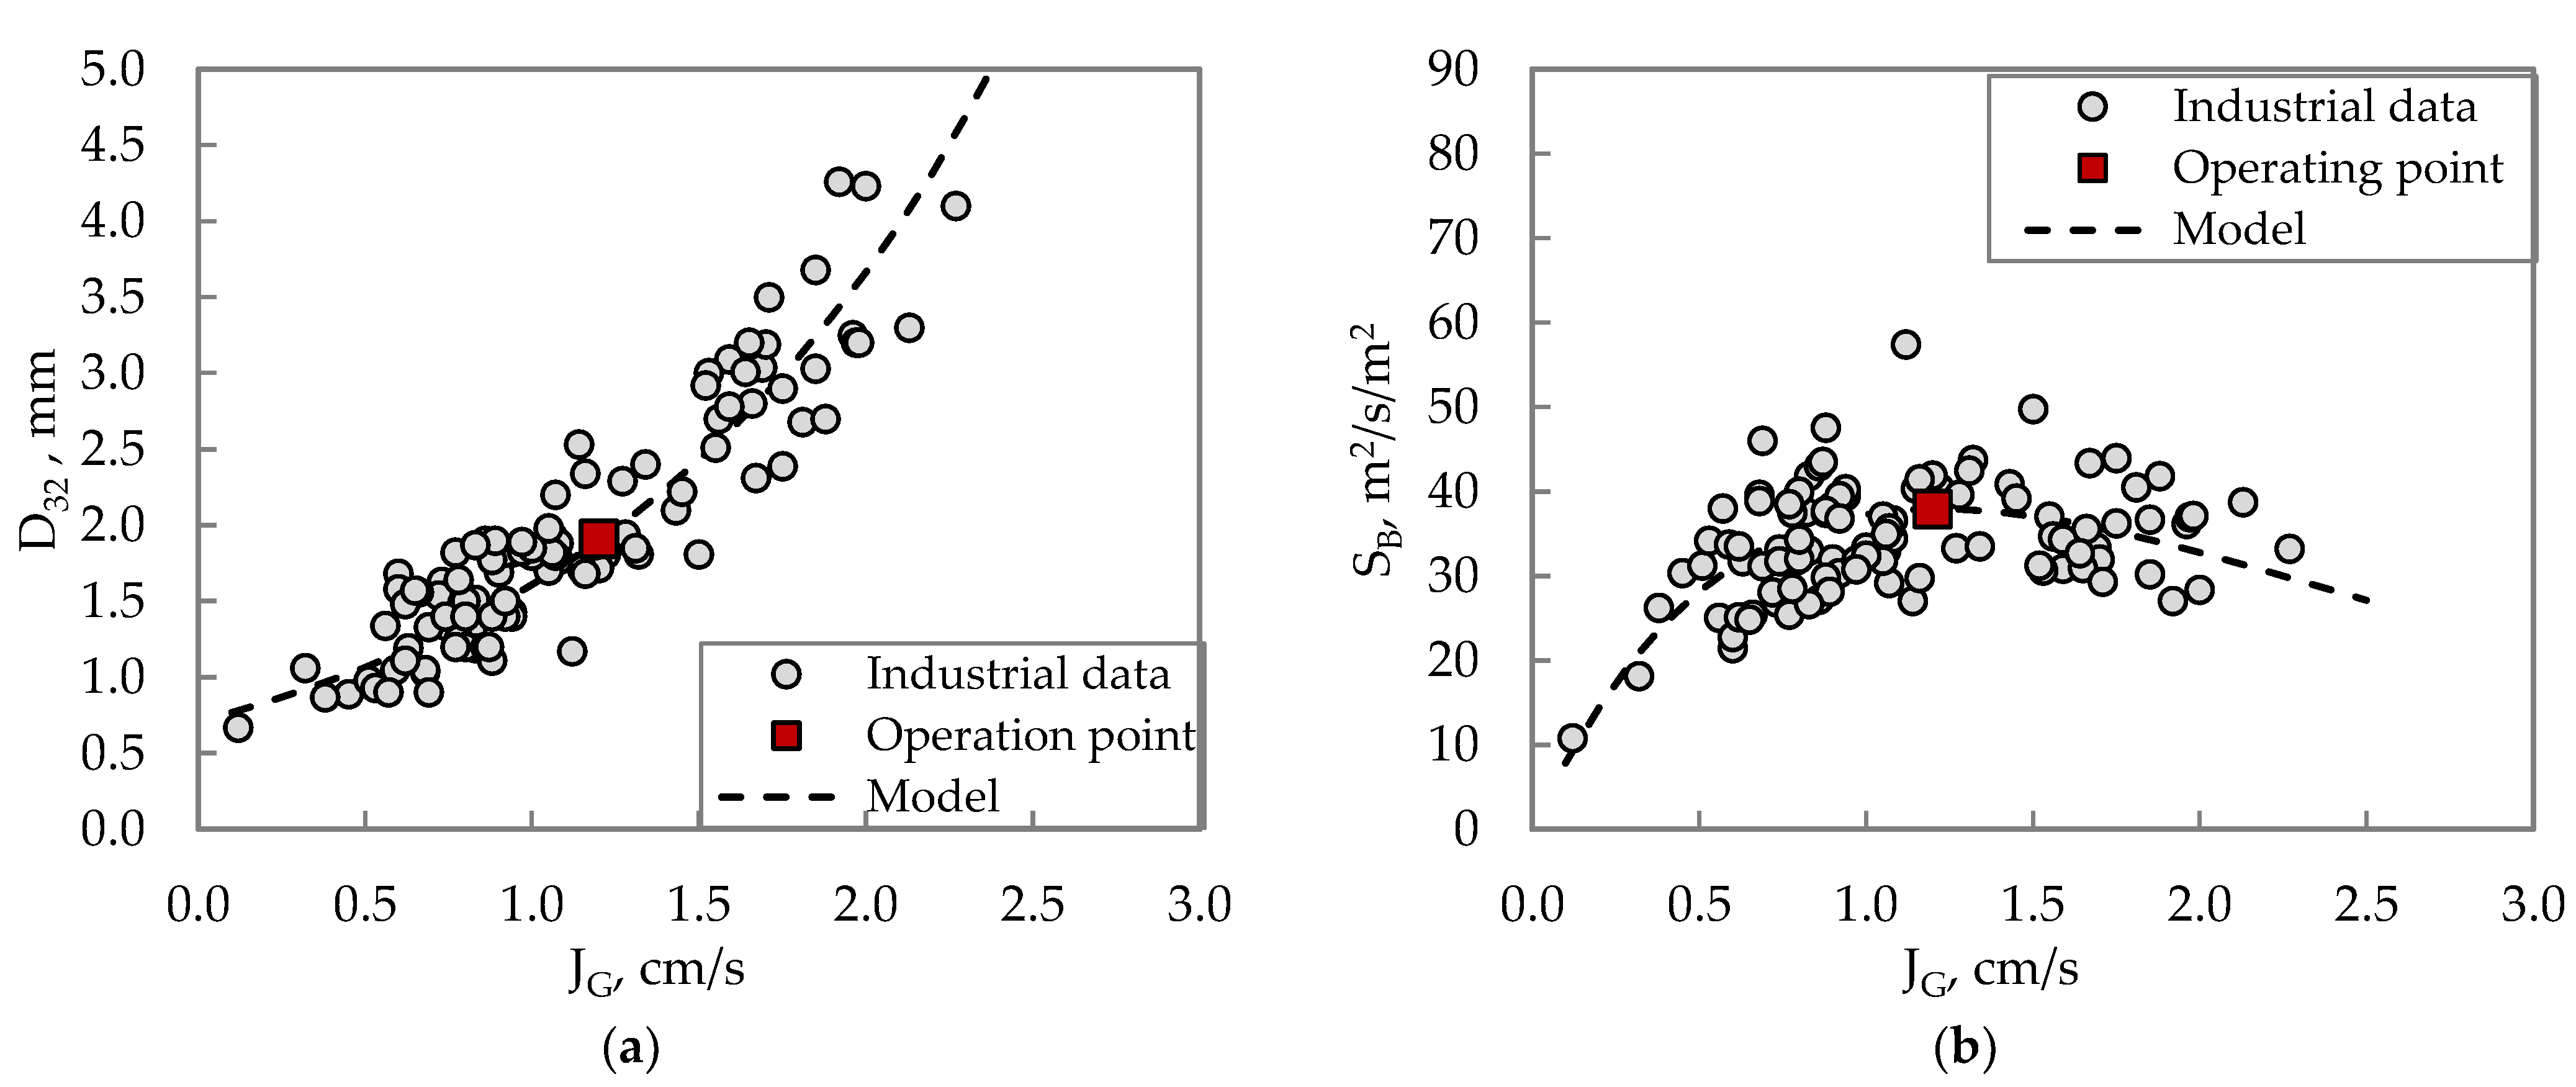
3.2. Hydrodynamic Conditions of the Industrial Flotation Bank

Figure 5 shows the relationship between JG (interface level) and bubble size (Figure 5a), and between JG and SB (Figure 5b). These trends were found from a benchmarking of industrial data (grey points), as mentioned in Section 2.2.1. The dashed lines in Figure 5a,b represent the models that were developed for D32 and SB, shown in Equations (1) and (2), respectively. The red squares show the operating point of the flotation cells used for the simulation analysis. Thus, the JG at the interface level in all cells, for the four scenarios, was fixed at 1.2 cm/s. As changing the launder design do not have a significant impact on gas flowrate at the interface level, cells in all scenarios have the same JG at the interface.
The operating point at JG of 1.2 cm/s produces a D32 of 1.9 mm and SB of 37.9 m2/s/m2. This value of SB is located within the range of JG that generates maximum SB values (maximum collection capacity), according to Figure 5b.

3.3. Comparison of Different Scenarios after Launder Upgrade

The four scenarios were compared with each other in terms of recovery and concentrate grade. Other variables such as froth and collection recovery, as well as gangue entrainment, water recovery, and bubble loading grade, were also analysed in this study.

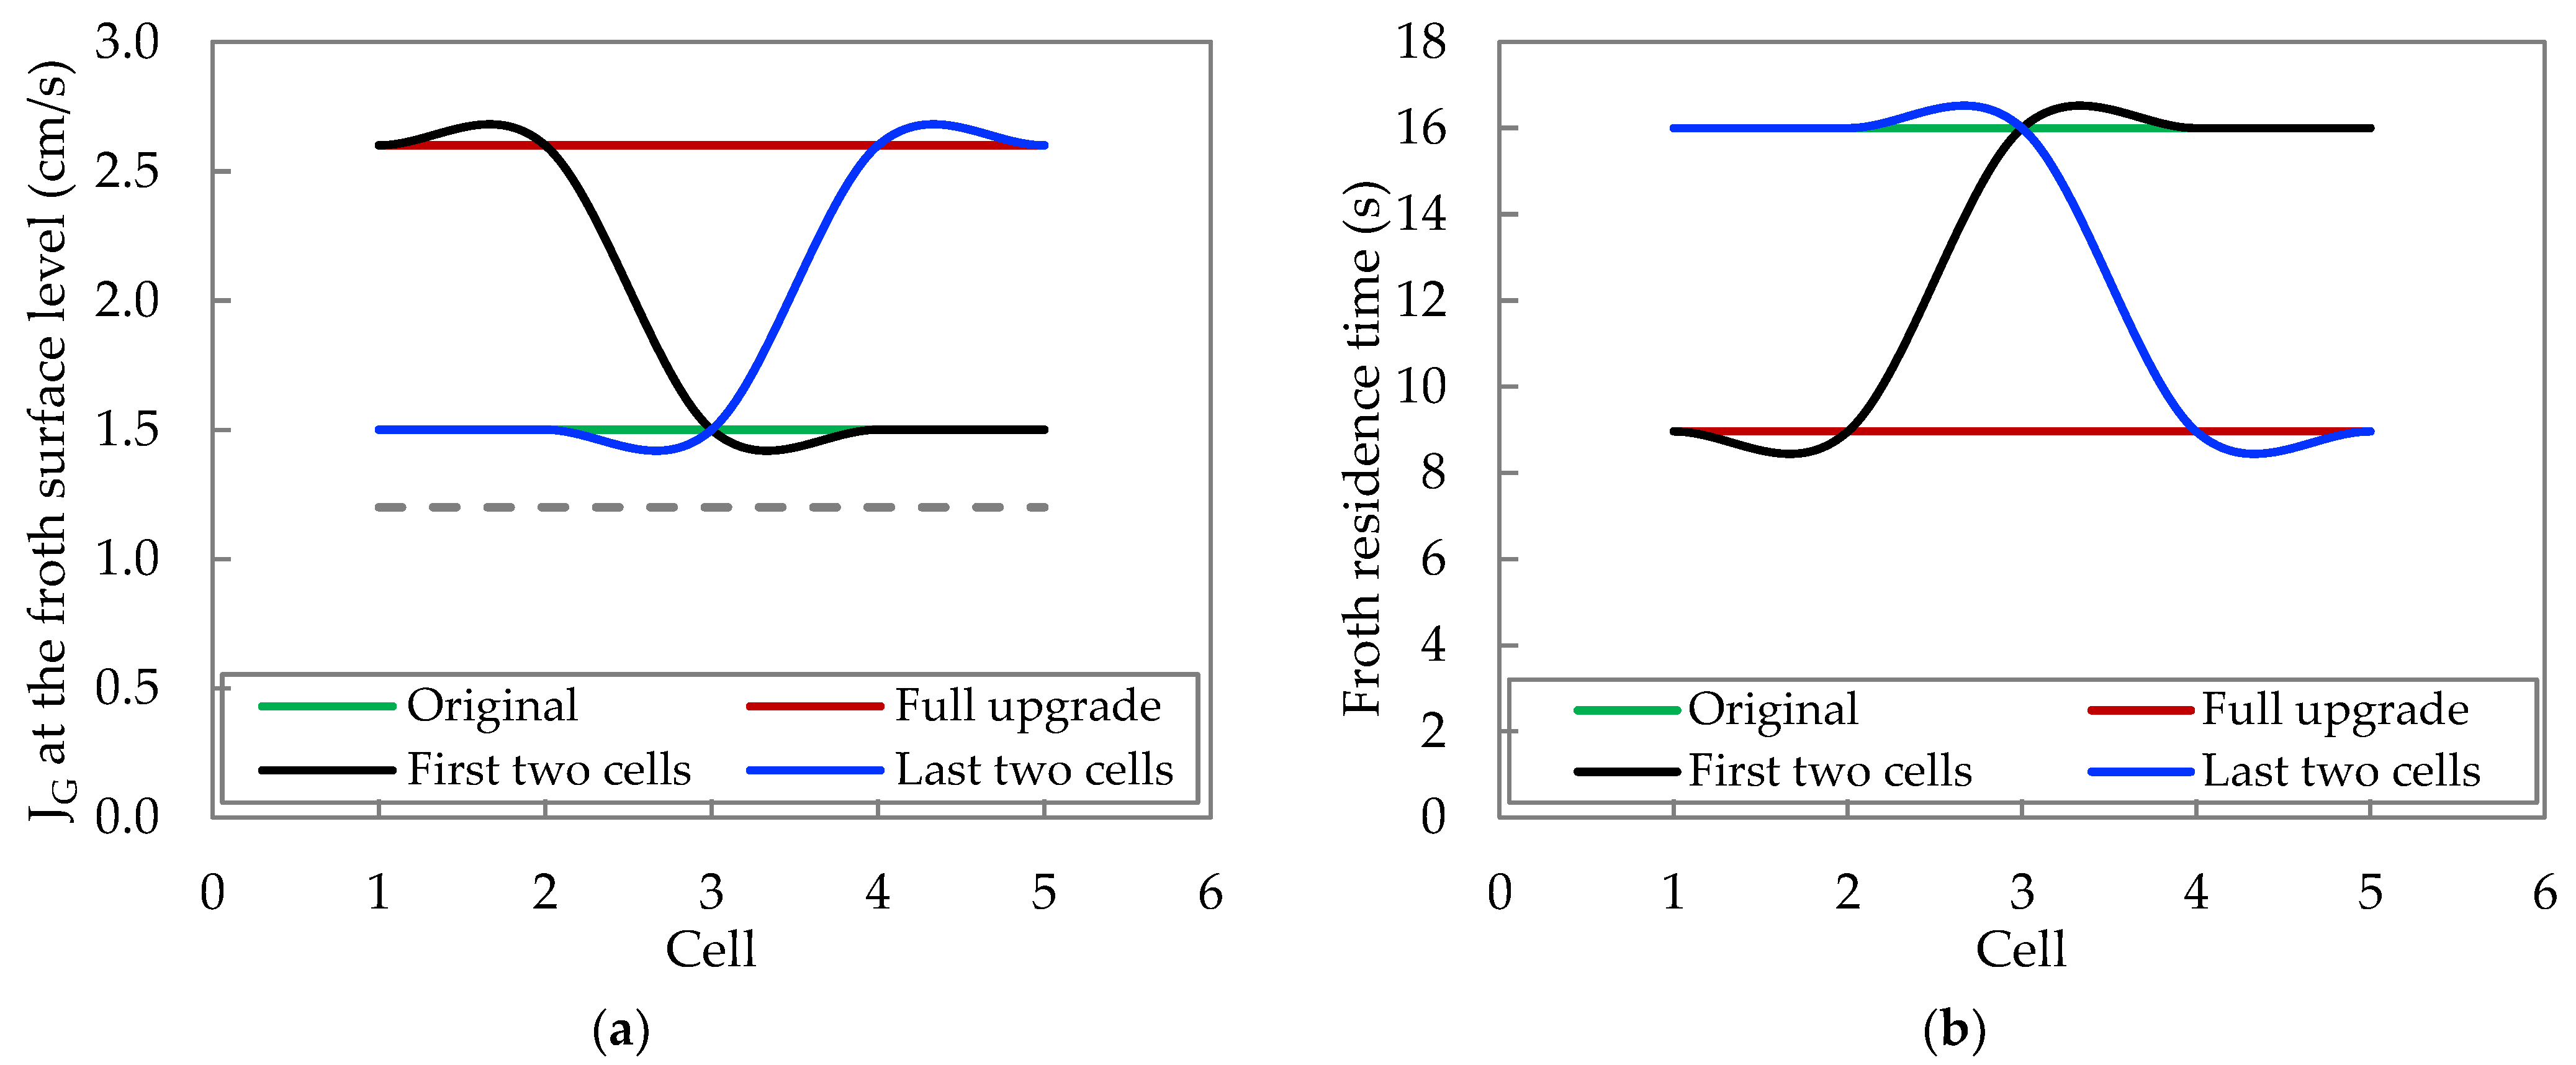
3.3.1. Hydrodynamic Conditions in Froth for the Different Scenarios

Figure 6 shows the JG profiles at the froth surface level (Figure 6a) and the froth residence time along the bank for the different scenarios.
Figure 6a shows an increase in the JG at the froth surface level when the new launder technology was evaluated for the different scenarios. The increase in the JG occurred because of the decrease in the froth cross-sectional area when using the new launders. This situation is relevant when cells operate with high air flowrates or when the area reduction is significant. In many cases, a decrease in air flowrate is required after installing new launders and reducing the froth cross-sectional area. The dashed line shows the JG at the interface level, as a reference.
Figure 6b shows an opposite behaviour with respect to the JG (Figure 6a) because higher JG values cause lower residence times, considering the same froth depth. The lower residence times produce an increase in froth recoveries in those cells.

3.3.2. Effect on Cu Recovery

Figure 7a shows the simulated final Cu recovery per particle size class for each scenario. The results showed a higher final recovery for the full upgrade scenario, where the differences are more significant for coarse particles (+106 µm). This is because the launder upgrade decreases the froth transport distance, which favours the recovery of coarse and less liberated particles (with higher froth dropback).
The scenarios with launder upgrade in the first two cells and in the last two cells of the bank did not show any significant differences in recovery. Only a slight difference in recovery can be observed for the coarse class. In general, all the scenarios including a launder upgrade enabled improved recovery with respect to the original scenario (baseline).
Since coarse particles (+106 µm) are more affected by the launder upgrade, Figure 7b shows the simulated recovery profiles of this class for the four scenarios to illustrate the cell-to-cell recovery along the bank.
Figure 8a shows the simulated froth recovery along the bank for the four scenarios. When the launder upgrade was evaluated, it was found that froth recovery increased from 49% to 76% in the first cell. In the last cell, the froth recovery increased from 36% to 52%. Comparing the original and the full upgrade scenarios, an increase in froth recovery can be observed in all the cells along the bank. For the other two scenarios (partial launder upgrade), the effect of the launder upgrade in the first or last two cells on froth recovery is clearly noticeable.
It should be noted that when froth recovery is improved in the first two cells because of the launder upgrade (third scenario), the froth recovery in the next cells is slightly lower than in the original scenario (equivalent cell characteristics). This occurs because the increase in recovery of the first cells decreases the mineral grade fed to the next cells, which strongly affects the collected mineral grade and flow rate, and therefore, the froth stability.
Figure 8b shows the relative differences in froth recovery between standard and new launders per particle size class and per cell along the bank. This is equivalent to comparing the cell-to-cell results between the first and the second scenario (baseline vs. full upgrade). The relative values were calculated as the difference between the froth recovery for the upgrade condition and for the standard condition, with respect to the latter.
The results showed that the main impact of the launder upgrade is on coarse particles, improving froth recovery by more than 140% (relative) in the first cell. This corresponds to an increase in froth recovery from 18.5% to 45.3%. In cells 2 to 5, the improvement in froth recovery is approximately 110%–120% (relative).
Figure 9a shows the simulated collection recovery along the bank for the four scenarios. The collection recovery decreased along the bank for all the scenarios, as expected, because of the mineral depletion along the bank. Figure 9a also shows lower collection recoveries along the bank for the second scenario (full upgrade) with respect to the baseline. This occurs because the increase in froth recovery (due to the launder upgrade) decreases the amount of valuable mineral dropping back to the collection zone. Thus, the mineral entering the collection zone (fresh feed + drop-back) has poorer characteristics and, therefore, decreases the collection recovery. For the two scenarios with the partial launder upgrade (third and fourth scenarios), the effect of improved froth recoveries in the first or last two cells on collection recovery can be seen clearly. The comparison of the four scenarios was performed considering the same gas flow rate, and therefore the same superficial gas rate (JG) at collection level, as indicated in Table 1.
Figure 9b shows the collection zone recovery per size-by-liberation class in the first cell of the original scenario. It can be observed that the collection recovery strongly increases when the liberation increases, mainly from the less liberated (<20% lib.) to intermediate class (20%–80% lib.). Particle size also has an effect on collection recovery, which increases while the particle size decreases; however, this effect is slight and less significant than that of liberation.
It is also noteworthy that the collection recovery in each size-by-liberation class does not significantly change for the other scenarios or the other cells along the bank. The main change is related to the mass distribution of minerals fed to each cell per size-by-liberation class, which significantly varies along the bank and when implementing a launder upgrade.

3.3.3. Effect on Cu Concentrate Grade

Figure 10a shows the simulated Cu concentrate grade of the bank per particle size class for each scenario. The highest concentrate grades are observed for the original scenario, and the differences are greater for fine particles (−45 µm). The scenarios with a partial launder upgrade (third and fourth scenarios) did not show any significant differences in the cumulative concentrate grade, but a launder upgrade in the last two cells enabled an approximately 1% higher total grade to be reached. In general, all the scenarios including a launder upgrade showed lower concentrate grades than the original scenario (baseline). However, considering that the flotation bank corresponds to a rougher operation, a decrease in concentrate grade (and an increase in mass pull) should not cause significant operating problems, provided that the cleaning circuit has enough capacity to process the increment in flow rate.
Since the cumulative concentrate grade of fine particles (−45 µm) is more affected by the launder upgrade, Figure 10b shows the simulated cumulative grade profiles of fine particles for the four scenarios. This allows us to observe the behaviour of the cell-to-cell cumulative concentrate grade along the bank and the effect of a full and partial launder upgrade. The more significant decrease in concentrate grade for fine particles is due to the increase in gangue entrainment (Figure 10), promoted by the improved froth stability given by the new launders.
Figure 11 shows the simulated gangue entrainment flow rate along the bank for the four scenarios. The results showed that the gangue entrainment is considerably higher for the second scenario compared to the original one (full upgrade) in all cells. For the scenarios with a partial launder upgrade, gangue entrainment is significantly higher in the cells with the new launder. The trends observed in Figure 11 show a clear relationship with the profiles of Figure 10b, i.e., cells with a higher gangue entrainment have lower concentrate grades.
On the other hand, Table 2 shows the simulated froth water recovery along the bank for the four scenarios. This variable is directly related to froth mineral recovery and is also affected by the launder upgrade. Thus, the increase in gangue entrainment is caused by an increase in froth water recovery. The data presented in Table 2 shows the same trends along the bank as those in Figure 11 for gangue entrainment.
Figure 12 shows the simulated bubble loading grade (collected minerals) along the bank for the four scenarios. The bubble loading grade decreased along the bank for all the scenarios, representing mineral depletion along the bank. However, the results showed lower grades in all cells for the full upgrade scenario compared to the original scenario. This occurs because the increase in total recovery along the bank, due to the launder upgrade in the whole bank, decreases the mineral grade fed to the collection zone of the cells, affecting the collected mineral grade.
The effect of the partial launder upgrade (third and fourth scenarios) can be clearly observed, reaching similar values in the last cell of the bank.

4. Discussion

The industrial simulator allowed for the evaluation of the metallurgical performance of an actual industrial plant (Buenavista del Cobre, México) under different scenarios with a full and partial launder upgrade. Additionally, the froth recovery estimation made by the simulator was consistent and validated with a previous froth recovery study carried out in the same plant. On the other hand, the simulator showed that the chosen operating point of the cells in the different scenarios produced a SB within the range of maximum collection capacity.
The simulation results showed that either a partial or a full launder upgrade would improve recovery with respect to the original scenario (baseline). The highest final recovery was observed for the full upgrade of the bank because the recovery in all cells was improved. On the other hand, a partial launder upgrade either in the first or last two cells of the bank showed similar final recoveries, higher than the original scenario. With respect to the effect of launder upgrade on particle size, it would improve recovery, mainly of coarse particles, because the decrease in the froth transport distance favours the recovery of particles with higher froth dropback (coarse and less liberated particles).
The recovery improvement by upgrading launder design occurs because the new launder technology in each scenario increased the froth recovery, due to decreased froth transport distance and enhanced froth stability. The froth recovery increased from 49% to 76% in the first cell and from 36% to 52% in the last cell according to the launder upgrade evaluation, with respect to the baseline.
On the other hand, the results showed that either a partial or a full launder upgrade decreased the concentrate grade, because of the increase in gangue entrainment, caused by the increase in froth water recovery. This latter increased due to the increase in froth stability. Thus, fine particles grade (−45 µm) was more affected because particles of gangue in this size class are more likely to be entrained by the water flowrate to the concentrate. Therefore, the full upgrade scenario showed the lowest concentrate grades because the water recovery in all cells was improved. Then, a partial launder upgrade in the last two cells enabled a slightly higher concentrate grade to be reached than an upgrade in the first two cells (about 1% higher). However, considering that the flotation bank corresponds to a rougher operation, a decrease in concentrate grade (and an increase in mass pull) should not cause significant operating problems, provided that the cleaning circuit has sufficient capacity to process the increment in flow rate.
It should be noted that the conditions for each scenario were not optimized along the bank, but the results show the potential and flexibility of using different launder designs in a flotation bank, as well as the strengths of the new flotation models.
Finally, the industrial simulator allowed for evaluating non-conventional variables such as size-by-liberation collection recovery, water recovery, gangue entrainment, and bubble loading grade along the bank for each scenario. Additionally, hydrodynamic variables were also characterized by the simulation tool, including JG, bubble size, SB, ε G , C (which allowed for the estimation of the effective pulp residence time), and the froth residence time. This tool enables the evaluation of a wide range of modifications in flotation cells, related to volume and launder configuration. As well as the launder designs evaluated in this study, other launder designs available for flotation cells can be evaluated to choose the right configuration to reach the desired metallurgical performance, which can be an increase in recovery, grade, or selectivity.

5. Conclusions

The metallurgical performance of an actual industrial plant under different scenarios, with a full and partial launder upgrade, was successfully evaluated using the industrial simulator. The main results from the simulation study were the following:
  • Either a partial or a full launder upgrade improved recovery.
  • The full launder upgrade of the bank showed the highest final recovery.
  • A partial launder upgrade, either in the first or last two cells of the bank, showed similar final recoveries, but the latter showed a slightly higher concentrate grade (about 1% higher).
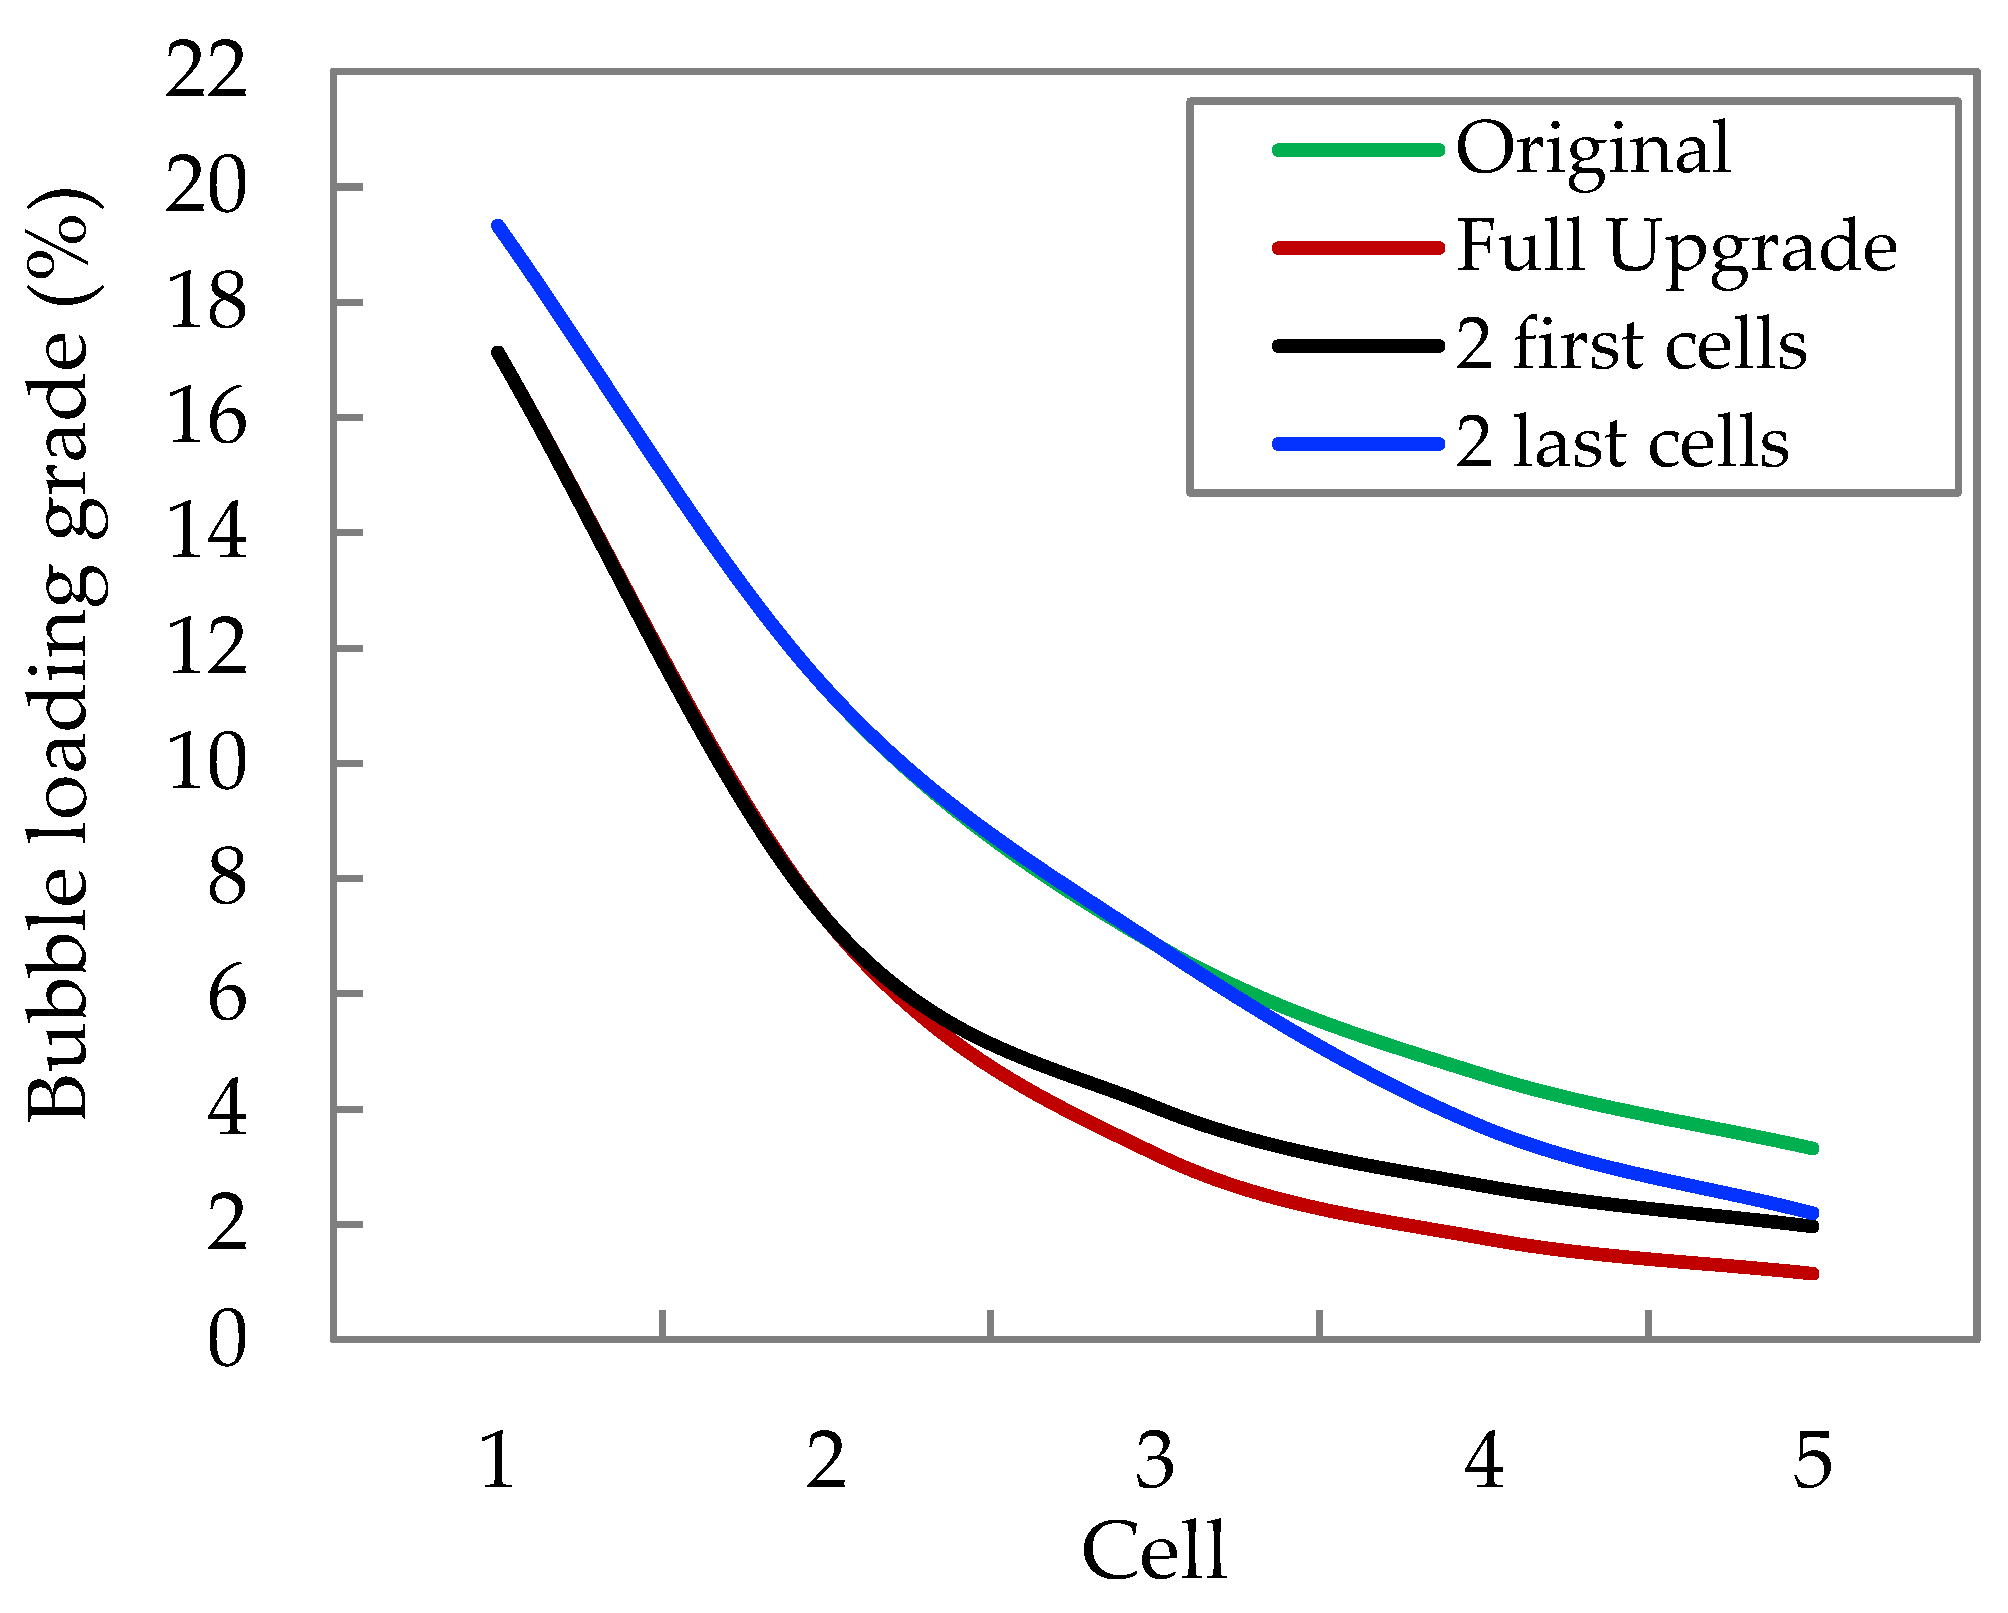
  • The main impact of launder upgrade was to improve recovery of coarse particles.
  • The effect of launder upgrade in each evaluated cell was to increase froth recovery. The froth recovery estimation made by the industrial simulator was validated with previous industrial data.
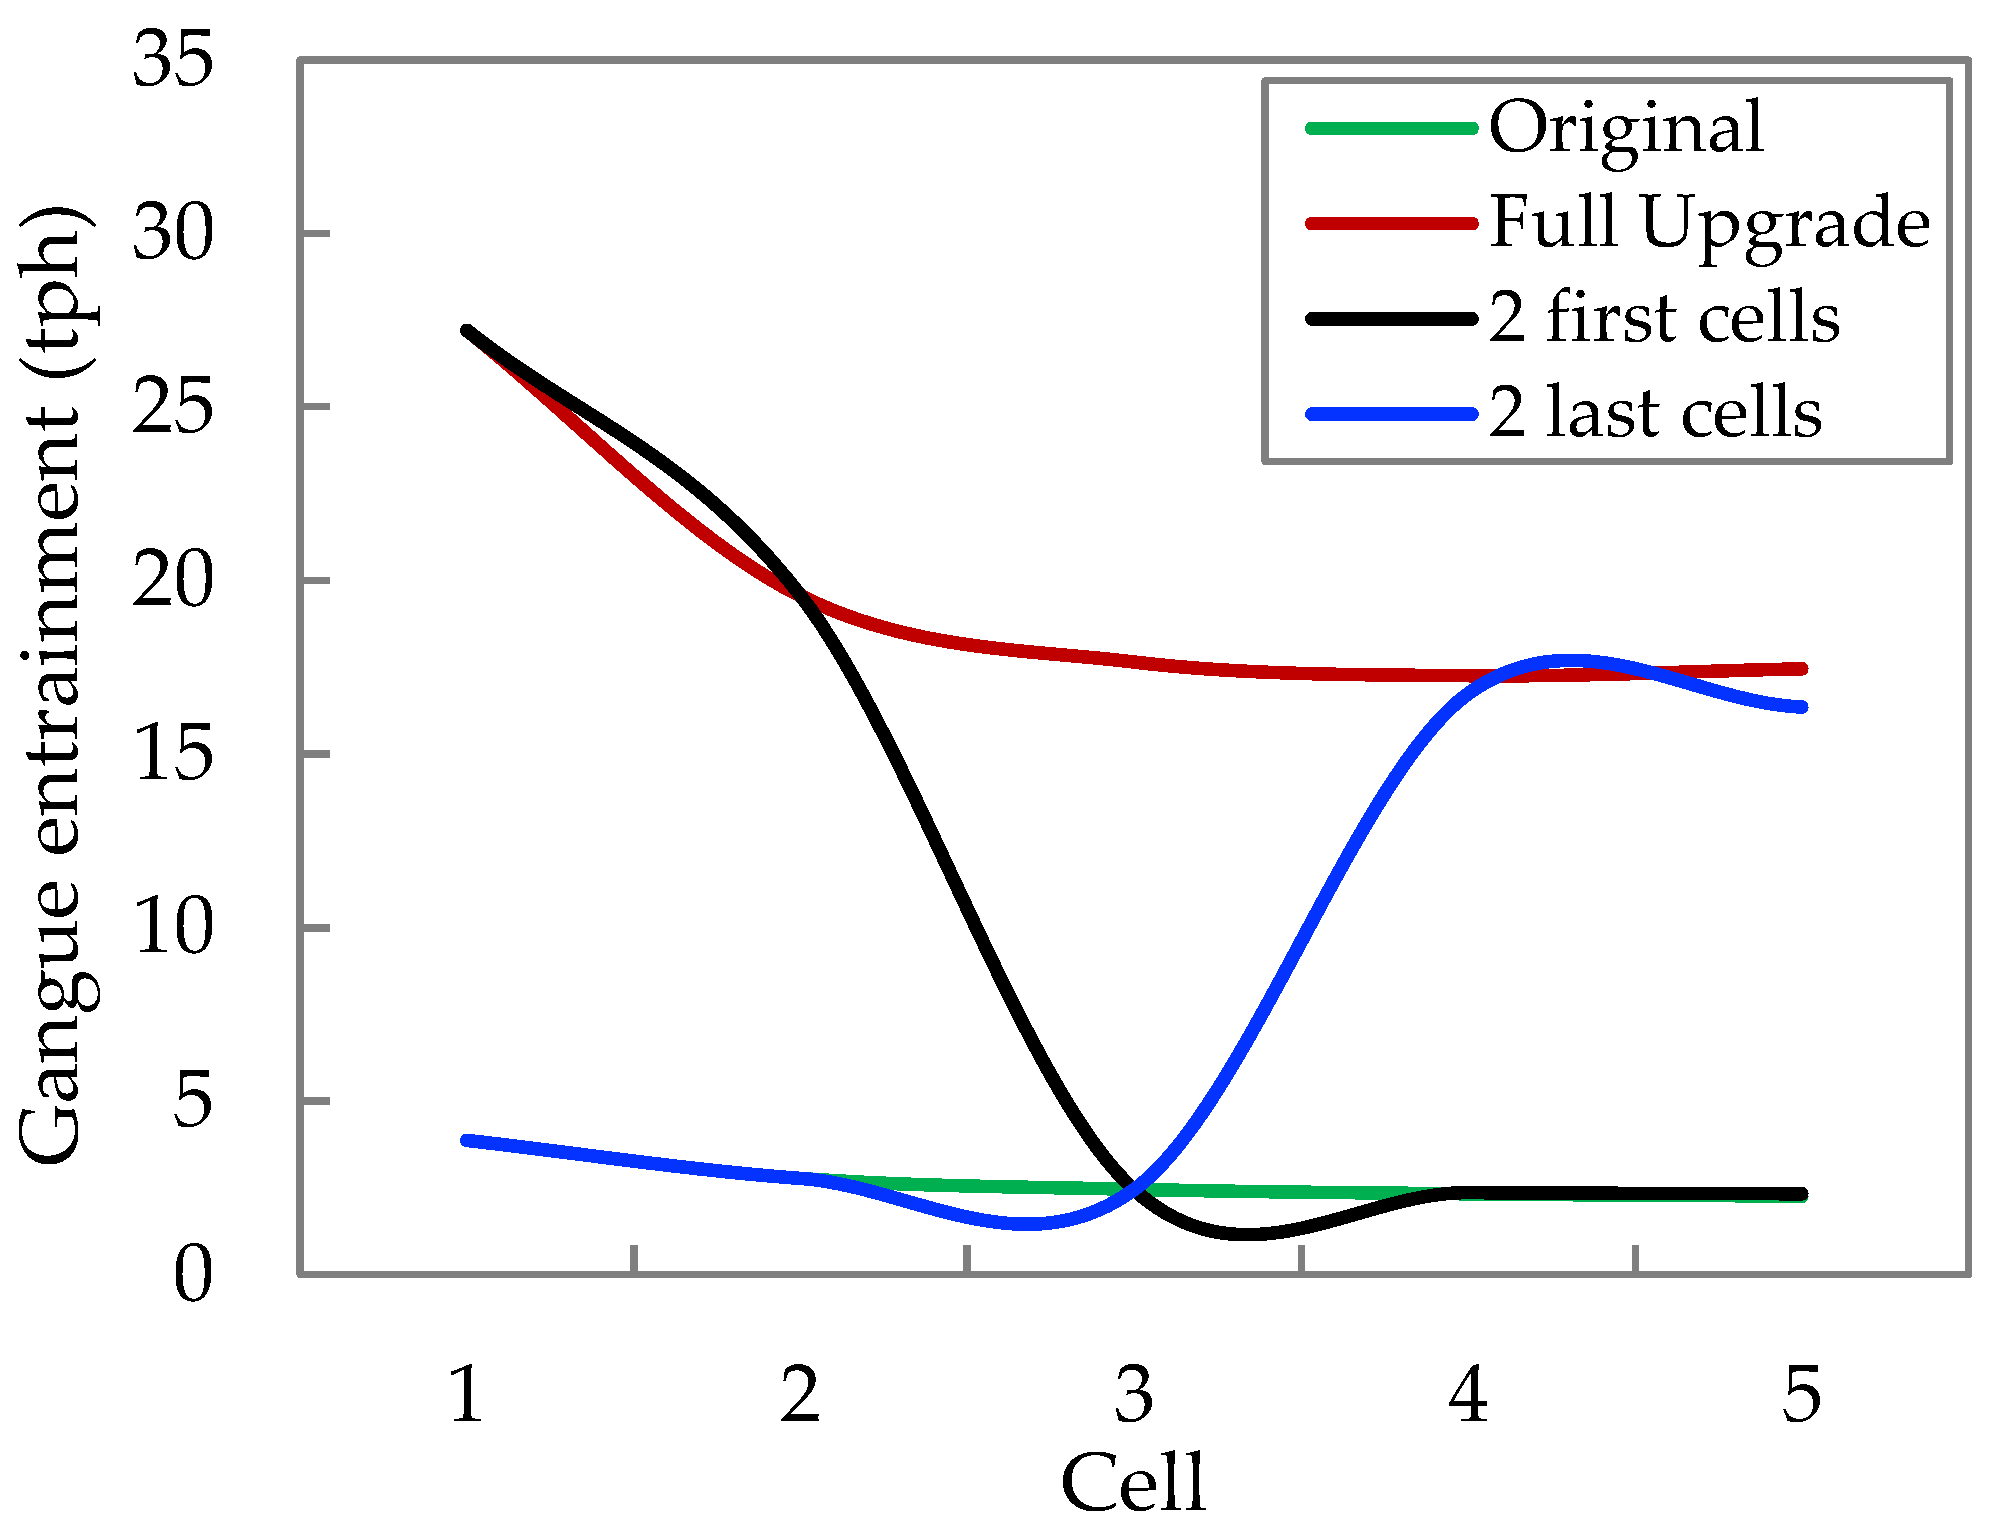
  • Either a partial or a full launder upgrade decreased the concentrate grade, to varying degrees, because of the increase in gangue entrainment (mainly for fine particles).
The industrial simulator allowed for evaluating variables that are not usually included in the currently available simulation systems, such as size-by-liberation metallurgical performance, entrainment, hydrodynamic conditions, and others.

Author Contributions

Conceptualization, P.V. and R.G.; methodology, P.V. and J.Y.; software, P.V.; validation, R.G., A.Y. and J.Y.; formal analysis, P.V.; investigation, J.Y. and P.V.; resources, J.Y. and R.G.; data curation, R.G., P.V. and A.Y.; writing—original draft preparation, P.V. and J.Y.; writing—review and editing, R.G. and A.Y.; visualization, J.Y.; supervision, J.Y. and R.G.; project administration, J.Y. and R.G.; funding acquisition, J.Y. All authors have read and agreed to the published version of the manuscript.

Funding

This research and the APC were funded by Agencia Nacional de Investigación y Desarrollo (ANID), Fondecyt Project 1201335.

Data Availability Statement

Not applicable.

Acknowledgments

The authors are grateful to the Agencia Nacional de Investigación y Desarrollo (ANID), FONDECYT Project 1201335 and Universidad Técnica Federico Santa María for providing funding for process modelling and control research. Additionally, we would like to thank Grupo México, Buenavista del Cobre, for allowing this collaborative work to be published.

Conflicts of Interest

The authors declare no conflict of interest. The funders had no role in the design of the study; in the collection, analyses, or interpretation of data; in the writing of the manuscript; or in the decision to publish the results.

References

  1. Mattsson, T.; Grau, R.; Rinne, A.; Maksimianen, T. Hydrodynamic and metallurgical performance of large TankCell® flotation cell in comparison to smaller cells. In Proceedings of the Flotation’17, Cape Town, South Africa, 13–16 November 2017. [Google Scholar]
  2. Grau, R.; Tapia, J.; Yáñez, A.; Hicks, M.; Chavira, J.; Muro, G.; Romero, J. Improving Buenavista del Cobre Flotation Performance with Outotec TankCell® e630 Technology. In Proceedings of the Procemin-Geomet 2018, Santiago, Chile, 28–30 November 2018. [Google Scholar]
  3. Neethling, S.J.; Brito-Parada, P.R.; Hadler, K.; Cilliers, J. The transition from first to zero order flotation kinetics and its implications for the efficiency of large flotation cells. Miner. Eng. 2019, 132, 149–161. [Google Scholar] [CrossRef]
  4. Coleman, R. Flotation cells: Selecting the correct concentrate launder design. Filtr. Sep. 2009, 46, 36–37. [Google Scholar] [CrossRef]
  5. Brito-Parada, P.; Cilliers, J. Experimental and numerical studies of launder configurations in a two-phase flotation system. Miner. Eng. 2012, 36–38, 119–125. [Google Scholar] [CrossRef]
  6. Grau, R.; Davoise, D.; Yañez, A.; López, A. Optimizing the froth area of large mechanical flotation cells. In Proceedings of the Procemin-Geomet 2019, Santiago, Chile, 20–22 November 2019. [Google Scholar]
  7. Seaman, D.R.; Li, K.; Lamson, G.; Seaman, B.A.; Adams, M.H. Overcoming rougher residence time limitations in the rougher flotation bank at Red Chris Mine. In Proceedings of the 15th Mill Operators Conference 2021, Brisbane, Australia, 23–25 June 2021. [Google Scholar]
  8. Bermudez, G.; Amelunxen, P.; Medina, M.; Taylor, M.; Dube, R. Copper and molybdenum recovery increased by upgrading flotation cells with center launders at Hudbay Constancia. In Proceedings of the SME Annual Meeting, Senver, CO, USA, 1–5 March 2021. [Google Scholar]
  9. Corona, M.; Bermudez, G.; Dube, R.; Jalili, A. Recent advances in flotation cell froth management. In Proceedings of the CIM Virtual Convention and Expo, online, 3–6 May 2021. [Google Scholar]
  10. Bermudez, G.; Perkins, T.; Sorensen, R.; Smith, C.; Bartsch, L.; Moyo, J.; Dube, R.; Brändström, M. Froth launder modification in 300m3 flotation cells at Kennecott Copperton concentrator. In Proceedings of the SME Annual Meeting, Salt Lake City, UT, USA, 27 February–2 March 2022. [Google Scholar]
  11. Yianatos, J.; Bergh, L.; Vinnett, L.; Panire, I.; Iriarte, V. Correlation between the top of froth grade and the operational variables in rougher flotation circuits. Miner. Eng. 2016, 99, 151–157. [Google Scholar] [CrossRef]
  12. Yianatos, J.; Vallejos, P.; Grau, R.; Yañez, A. New approach for flotation process modelling and simulation. Miner. Eng. 2020, 156, 106482. [Google Scholar] [CrossRef]
  13. Metso Outotec. HSC Chemistry® software. October 2022. Available online: https://www.mogroup.com/portfolio/hsc-chemistry/ (accessed on 29 November 2022).
  14. Betancourt, D.; Izart, C.; Vallejos, P.; Yianatos, J.; Grau, R.; Yañez, A. Development of a new tool for industrial flotation modelling and simulation. In Proceedings of the Procemin-Geomet 2021, Santiago, Chile, 20–22 October 2021. [Google Scholar]
  15. Finch, J.A.; Dobby, G.S. Column Flotation, 1st ed.; Pergamon: Oxford, UK, 1990. [Google Scholar]
  16. Yianatos, J.; Moys, M.; Contreras, F.; Villanueva, A. Froth recovery of industrial flotation cells. Miner. Eng. 2008, 21, 817–825. [Google Scholar] [CrossRef]
  17. Yianatos, J.; Bergh, L.; Vinnett, L.; Panire, I.; Díaz, F. Modelling of residence time distribution of liquid and solid in mechanical flotation cells. Miner. Eng. 2015, 78, 69–73. [Google Scholar] [CrossRef]
  18. Wang, L.; Runge, K.; Peng, Y.; Vos, C. An empirical model for the degree of entrainment in froth flotation based on particle size and density. Miner. Eng. 2016, 98, 187–193. [Google Scholar] [CrossRef]
  19. Vallejos, P.; Yianatos, J.; Grau, R.; Yañez, A. Evaluation of flotation circuits design using a novel approach. Miner. Eng. 2020, 158, 106591. [Google Scholar] [CrossRef]
  20. Vallejos, P.; Yianatos, J.; Grau, R.; Yañez, A. Effect of mineral feed characteristics on industrial flotation circuits performance by simulating mineralogical and operational changes. In Proceedings of the IMPC 2020, Cape Town, South Africa, 18–22 October 2020. [Google Scholar]
  21. Vallejos, P.; Yianatos, J.; Grau, R.; Yañez, A.; López, A.; Davoise, D. Improving metallurgical performance in an industrial flotation bank by upgrading the first cell design. In Proceedings of the Procemin-Geomet 2021, Santiago, Chile, 20–22 October 2021. [Google Scholar]
  22. Suhonen, J.; Grau, R.; Yáñez, A.; Miettinen, T.; Tapia, A.; Mattsson, T. Performance of TankCell® 630 at Buenavista del Cobre Cu-Mo concentrator. In Proceedings of the Flotation’19, Cape Town, South Africa, 11–14 November 2019. [Google Scholar]
Figure 1. Launder designs for TankCell® e630 cell: (a) standard launder (baseline) and (b) new launder technology (upgrade).
Minerals 13 00169 g001
Figure 2. Schematic image of TankCell e630 and the flotation cell at BVC concentrator [2].
Minerals 13 00169 g002
Figure 3. Comparison between measured and simulated data after calibration: Cu recovery and concentrate grade.
Minerals 13 00169 g003
Figure 4. Froth recovery vs. froth depth in the TankCell® e630: data reported by Suhonen et al. [22] and this work (red point).
Minerals 13 00169 g004
Figure 5. Relationships of JG with (a) D32 and (b) SB.
Minerals 13 00169 g005
Figure 6. (a) JG profiles at the froth surface level and (b) Froth residence time profiles.
Minerals 13 00169 g006
Figure 7. Cu recovery results for the four scenarios: (a) Final Cu recovery per particle size class and (b) recovery profiles for coarse particles (+106 µm).
Minerals 13 00169 g007
Figure 8. (a) Froth recovery along the bank for the four scenarios and (b) relative differences in froth recovery between standard and upgraded launders per particle size class.
Minerals 13 00169 g008
Figure 9. (a) Collection recovery along the bank for the four scenarios and (b) collection recovery per particle size and liberation class (first cell, original circuit).
Minerals 13 00169 g009
Figure 10. Cu concentrate grade results for the four scenarios: (a) Cumulative Cu concentrate grade per particle size class and (b) concentrate grade profiles for fine particles (−45 µm).
Minerals 13 00169 g010
Figure 11. Gangue entrainment along the bank for the four scenarios.
Minerals 13 00169 g011
Figure 12. Bubble loading grade along the bank for the four scenarios.
Minerals 13 00169 g012
Table 1. Feed characteristics of BVC cell used to carry out the scenario simulations.
Valuable Mass Fraction (%)Total Mass Fraction (%)Cu Grade (%)
Liberation Class (%)
Particle Size (µm)<2020–80>80
+106 (coarse)20.732.247.136.50.40
+45 −106 (intermediate)2.517.679.918.20.79
−45 (fine)0.44.695.045.30.49
Table 2. Froth water recovery along the bank for the four scenarios.
CellOriginalFull Upgrade2 First Cells2 First Cells
110.729.729.710.7
28.923.923.98.9
38.321.98.08.3
48.020.97.721.8
57.820.37.620.9
Disclaimer/Publisher’s Note: The statements, opinions and data contained in all publications are solely those of the individual author(s) and contributor(s) and not of MDPI and/or the editor(s). MDPI and/or the editor(s) disclaim responsibility for any injury to people or property resulting from any ideas, methods, instructions or products referred to in the content.

