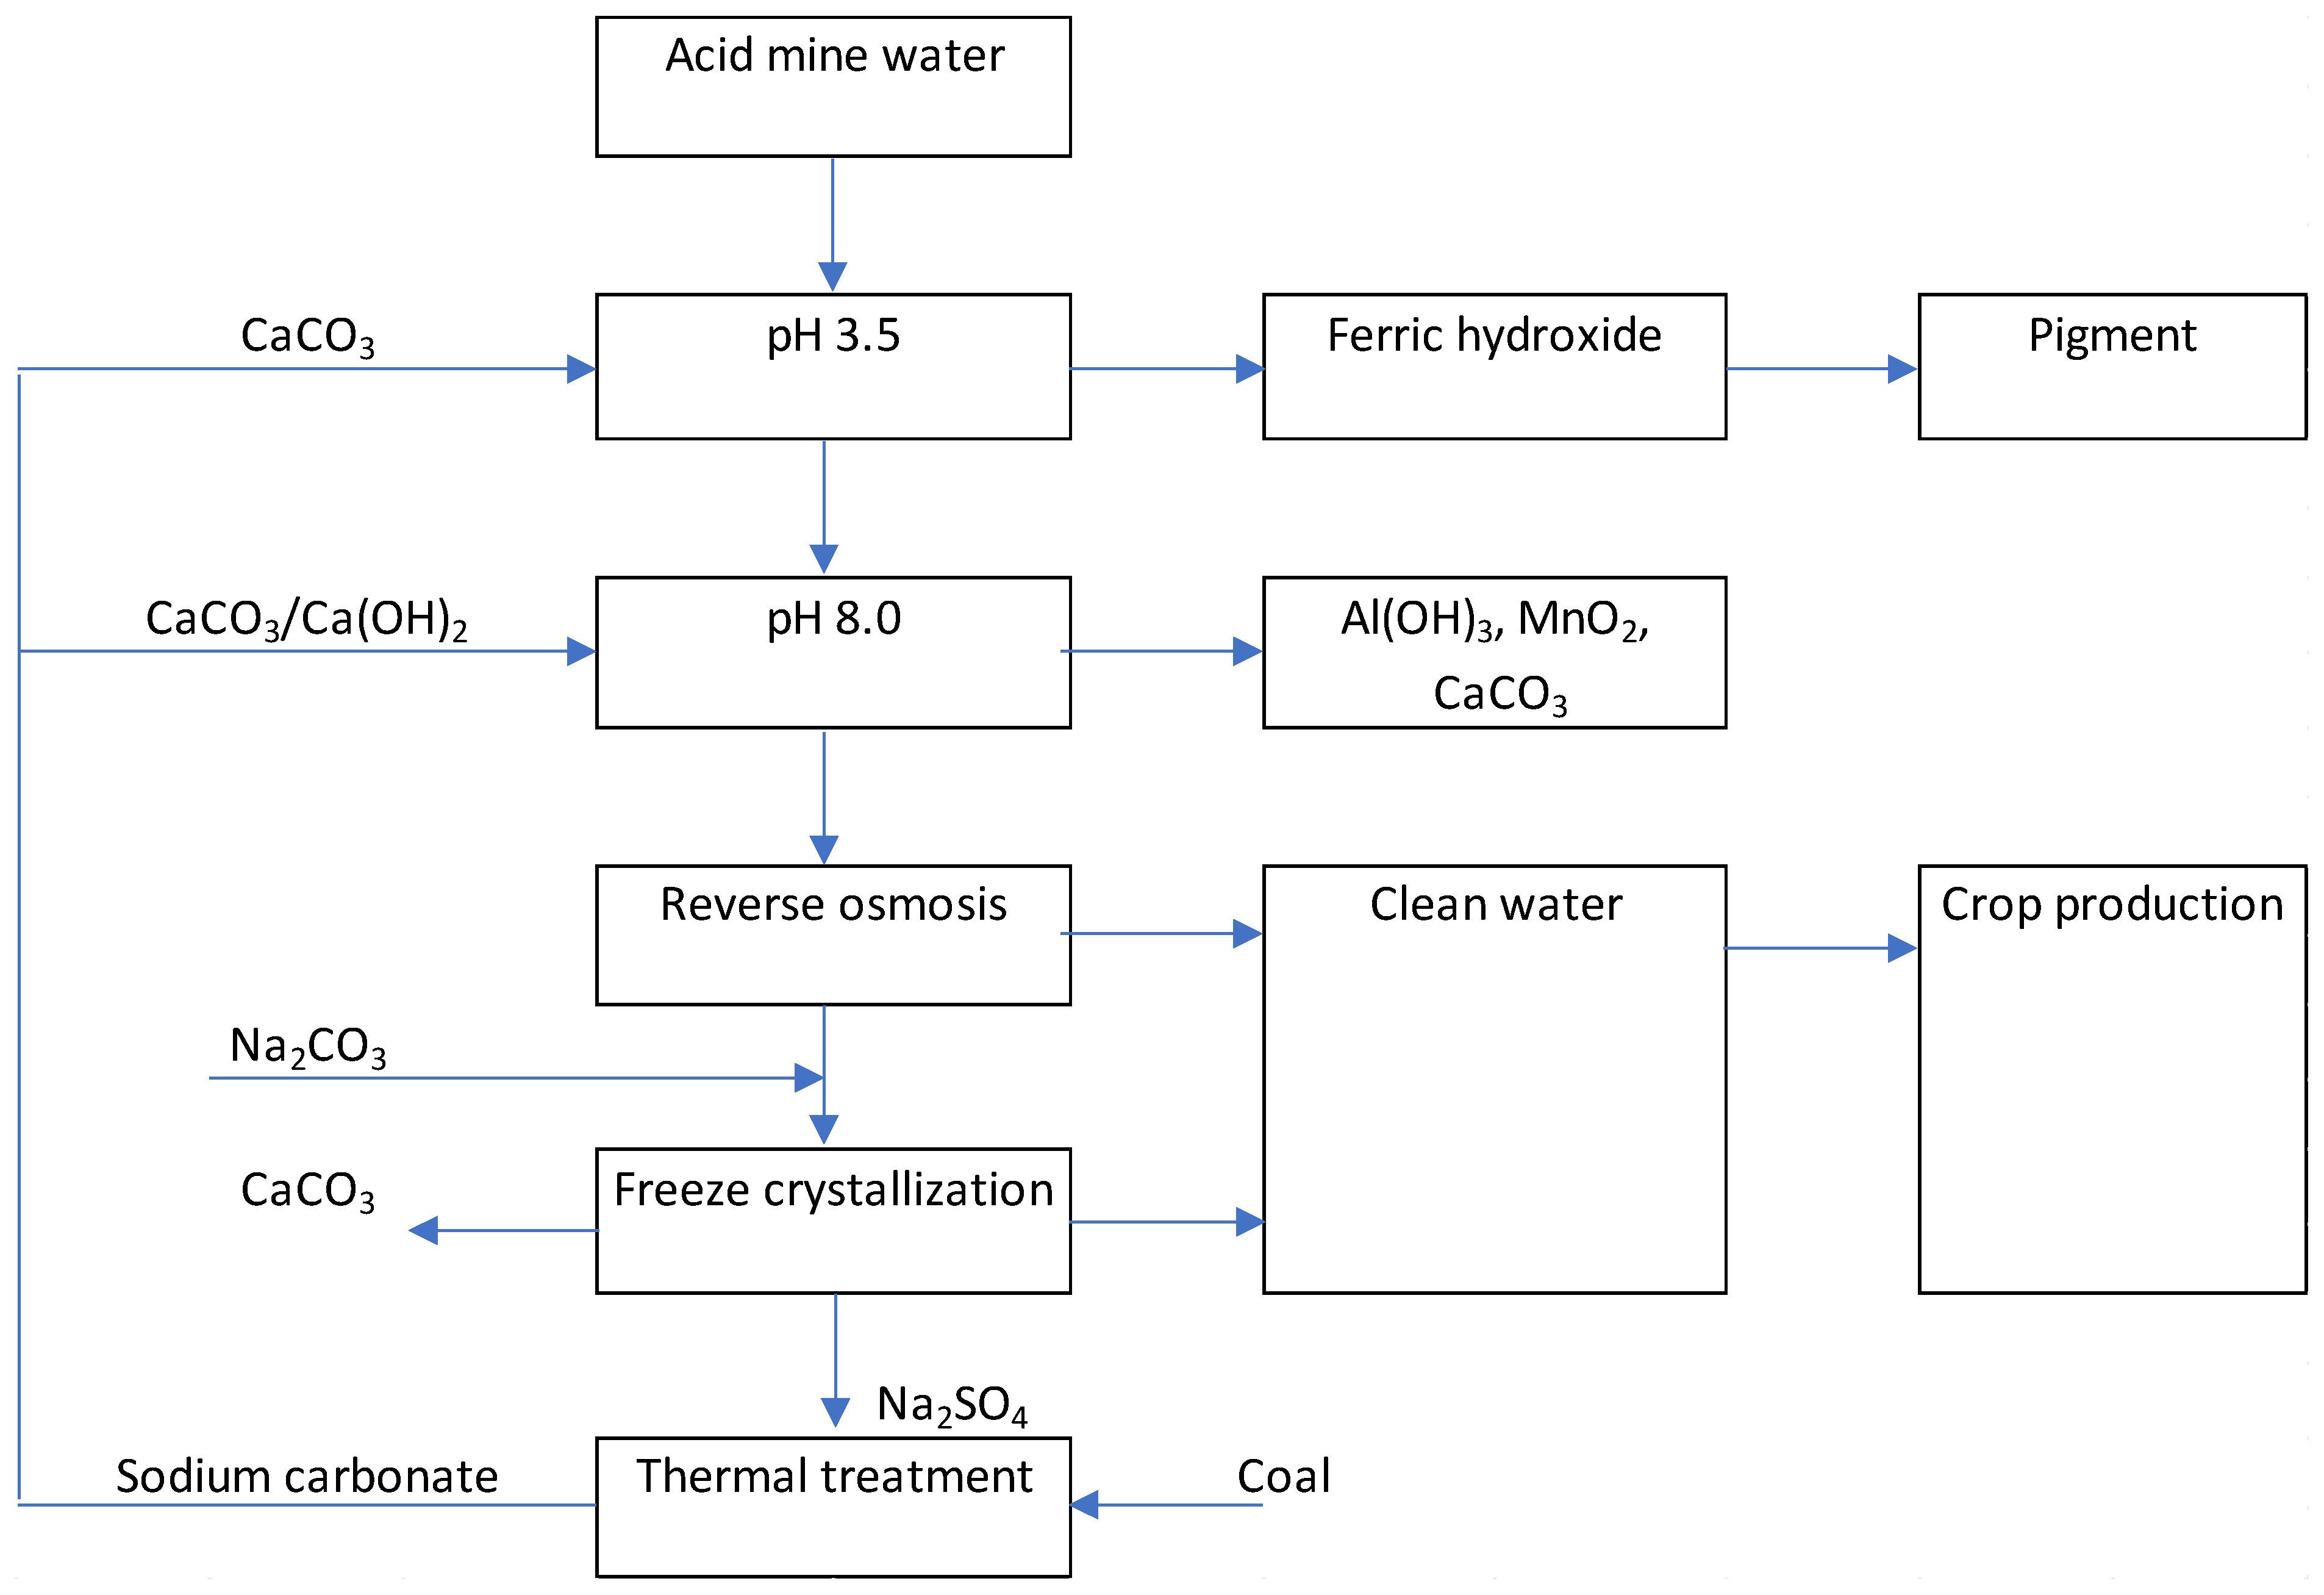
Figure 1.
Ideal solution for mine water treatment.
Figure 1.
Ideal solution for mine water treatment.
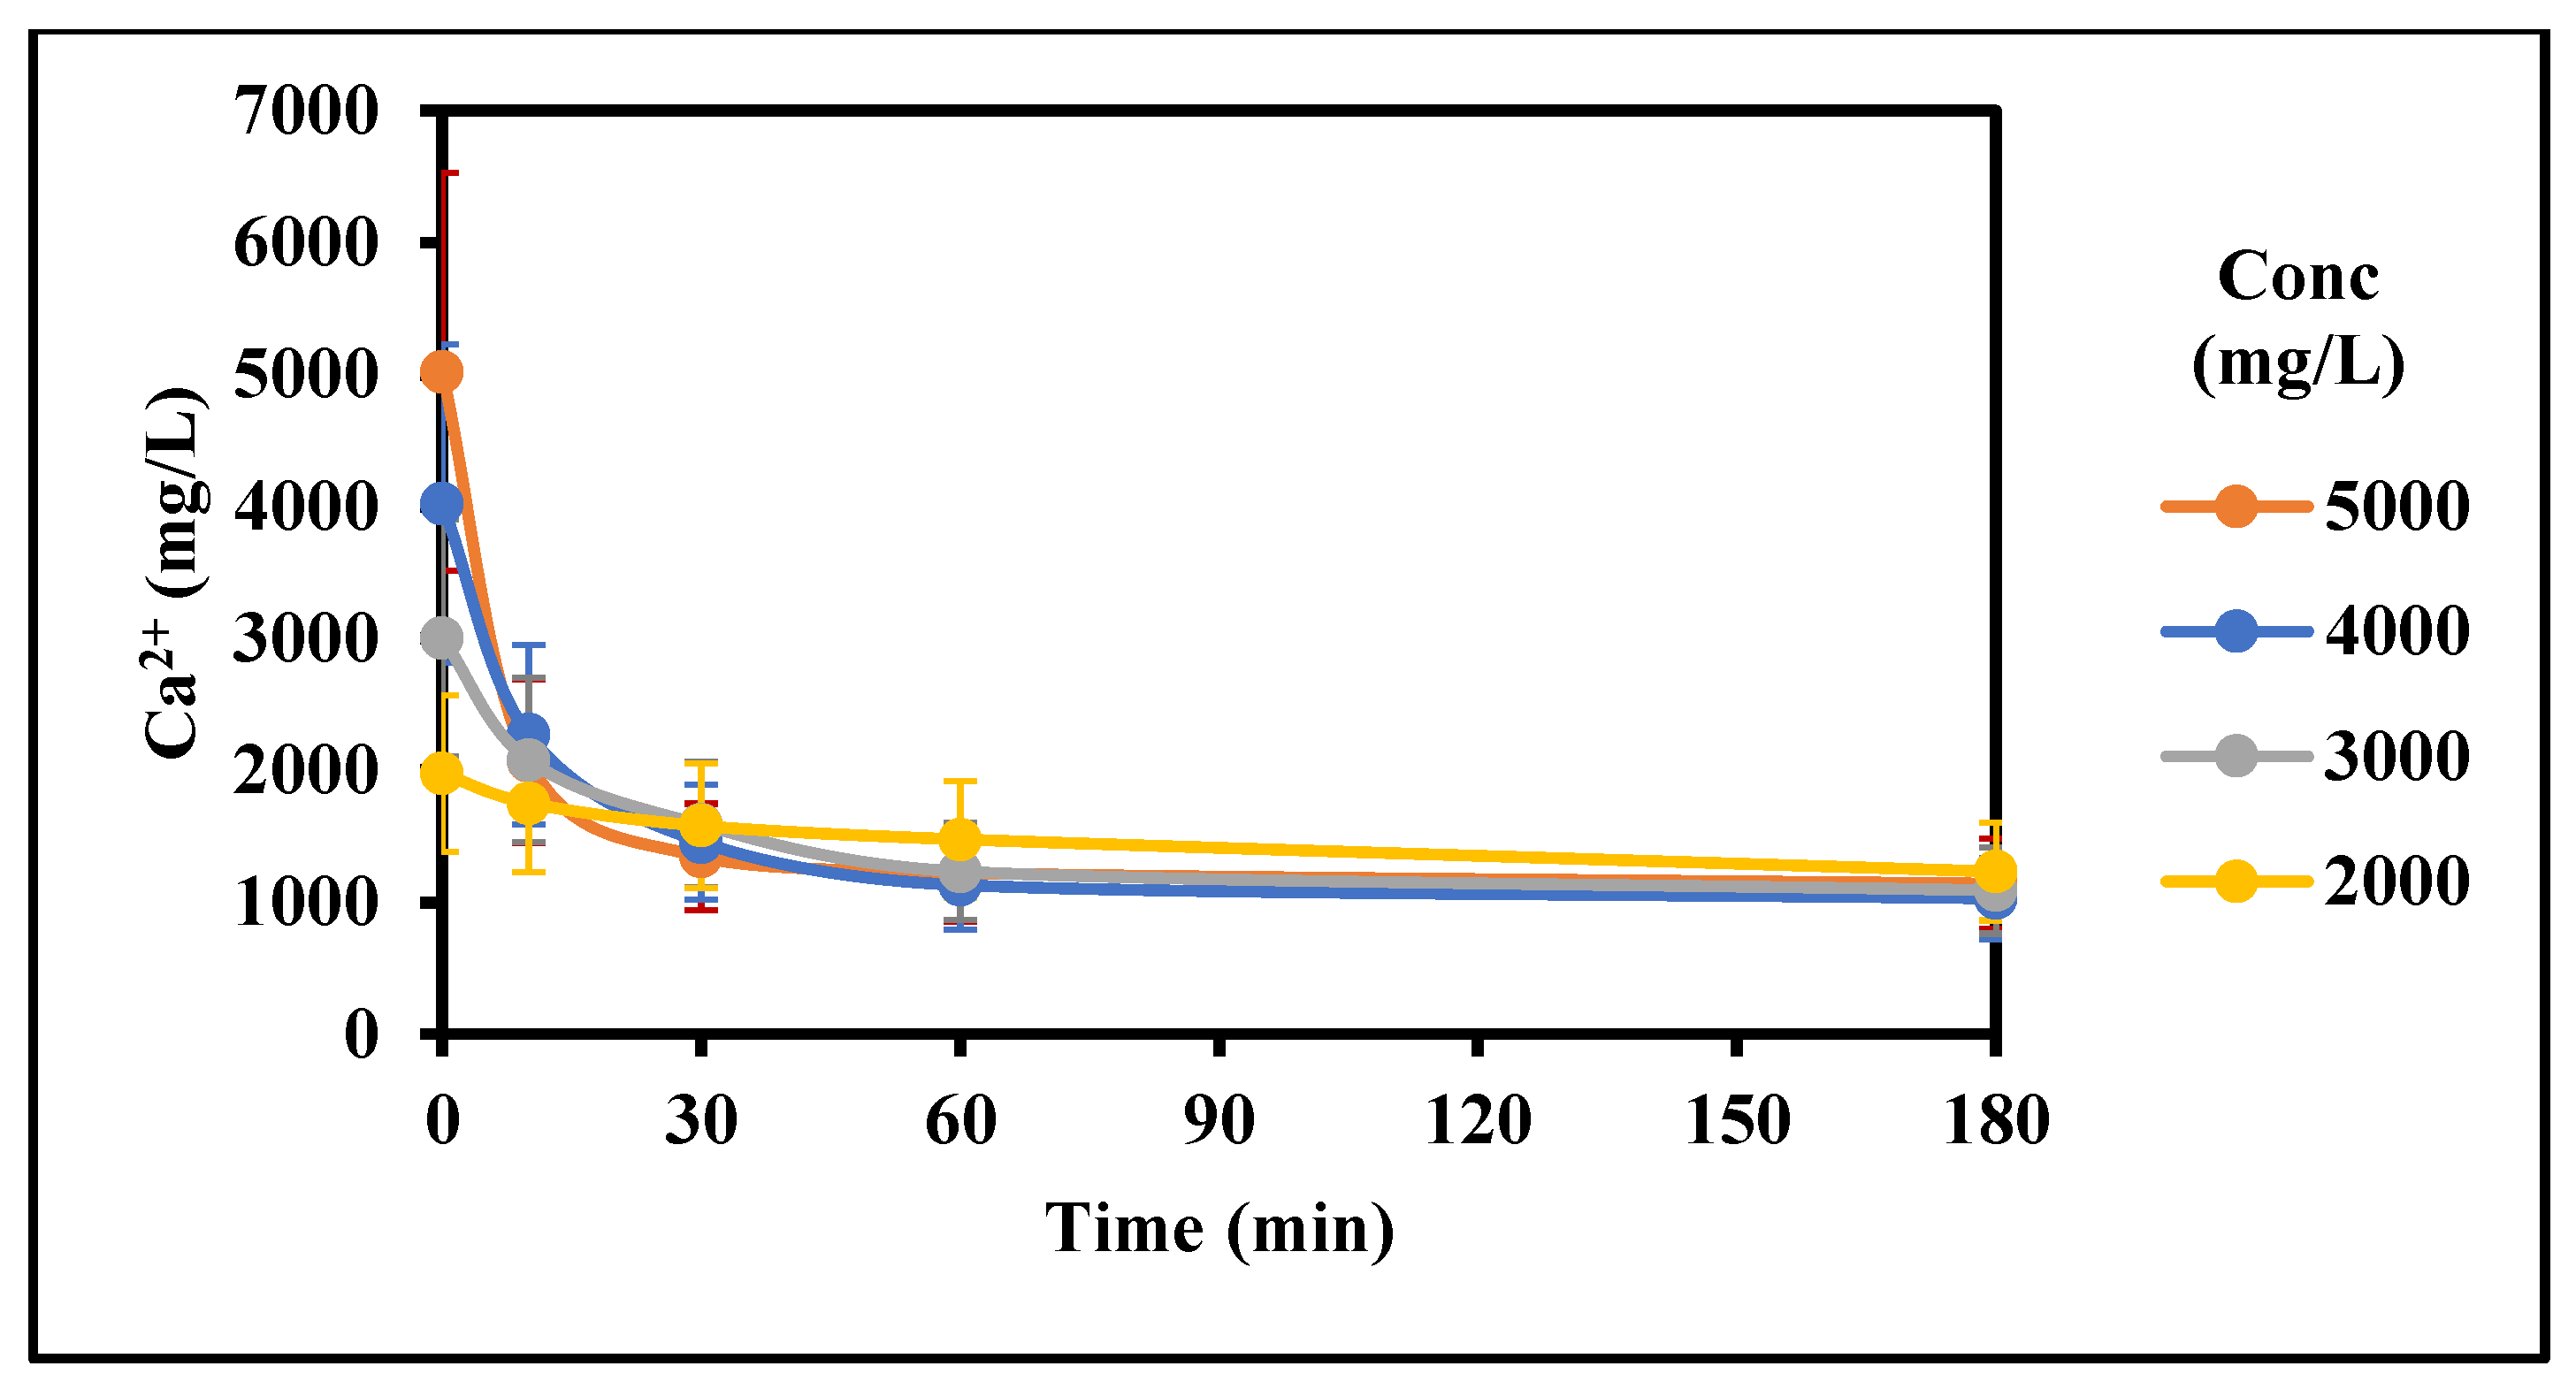
Figure 2.
Effect of concentration on the rate of gypsum crystallization (2000–5000 mg/L CaSO4 (as Ca), 5 g/L gypsum seed, 0 g/L Fe3+, 0 mg/L Inh, 25 °C, stirring rate: 200 rpm; Stirring time (min): 180/180).
Figure 2.
Effect of concentration on the rate of gypsum crystallization (2000–5000 mg/L CaSO4 (as Ca), 5 g/L gypsum seed, 0 g/L Fe3+, 0 mg/L Inh, 25 °C, stirring rate: 200 rpm; Stirring time (min): 180/180).
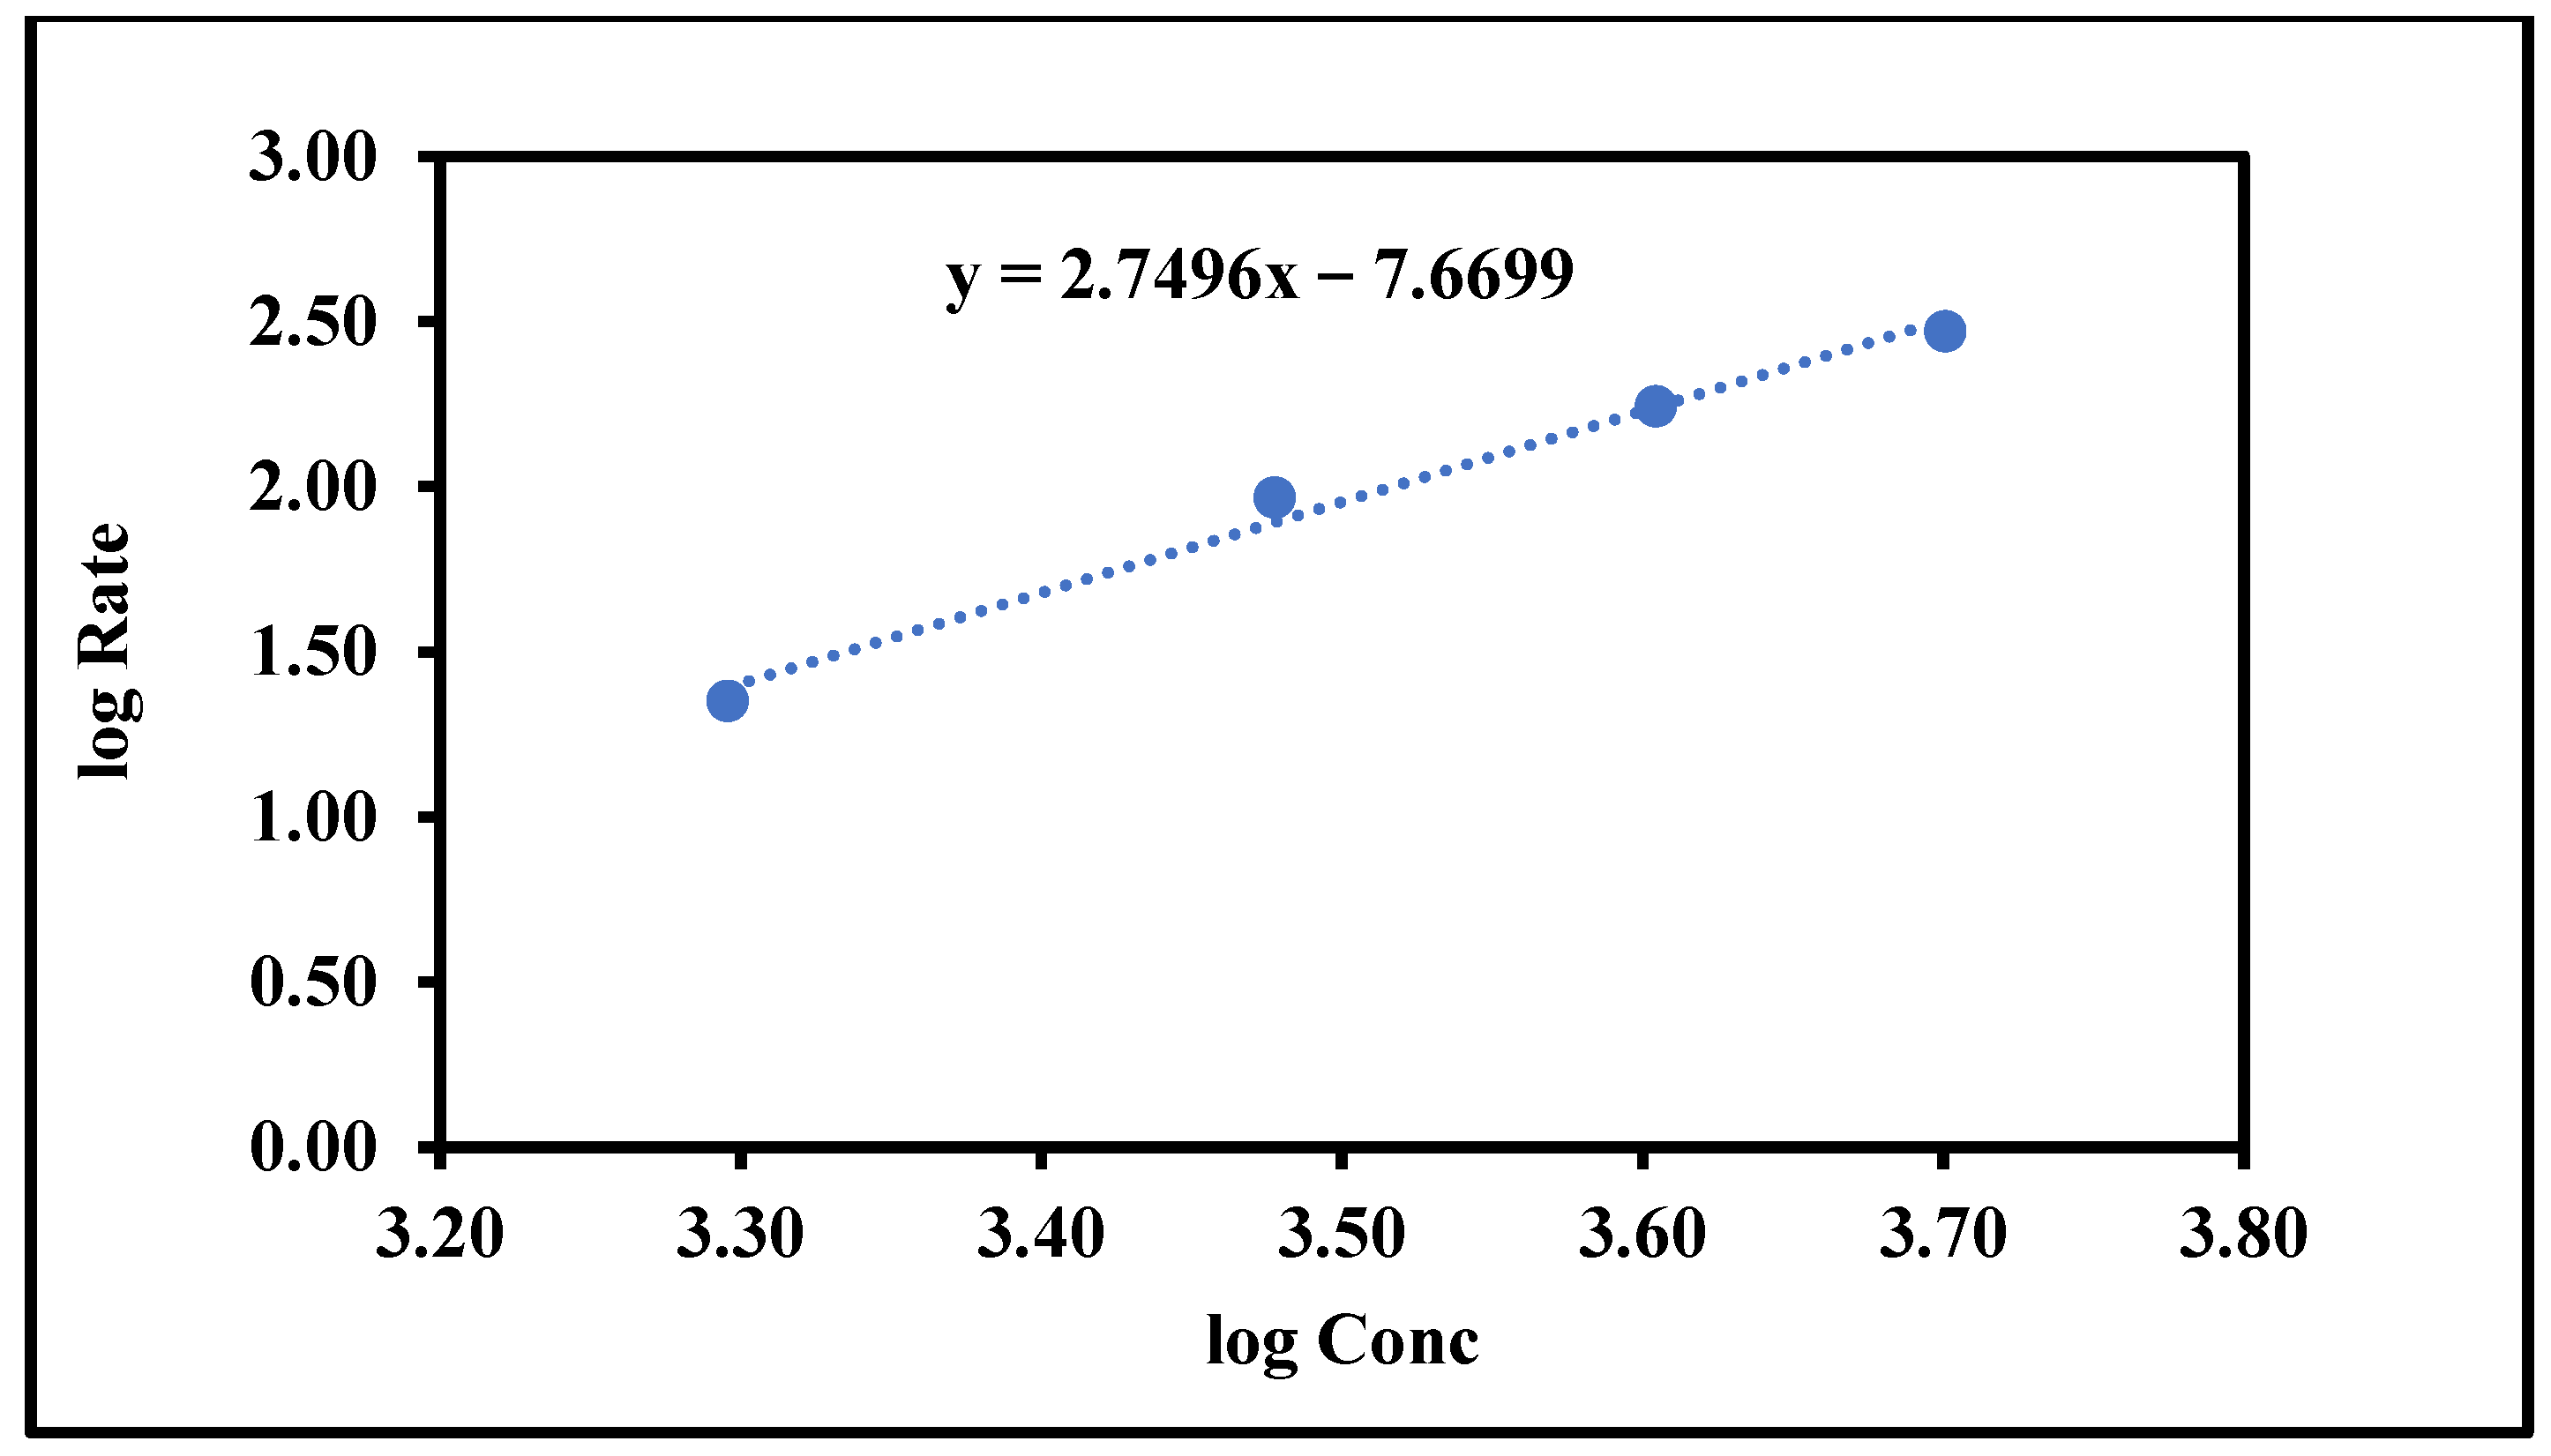
Figure 3.
Determination of the reaction order.
Figure 3.
Determination of the reaction order.
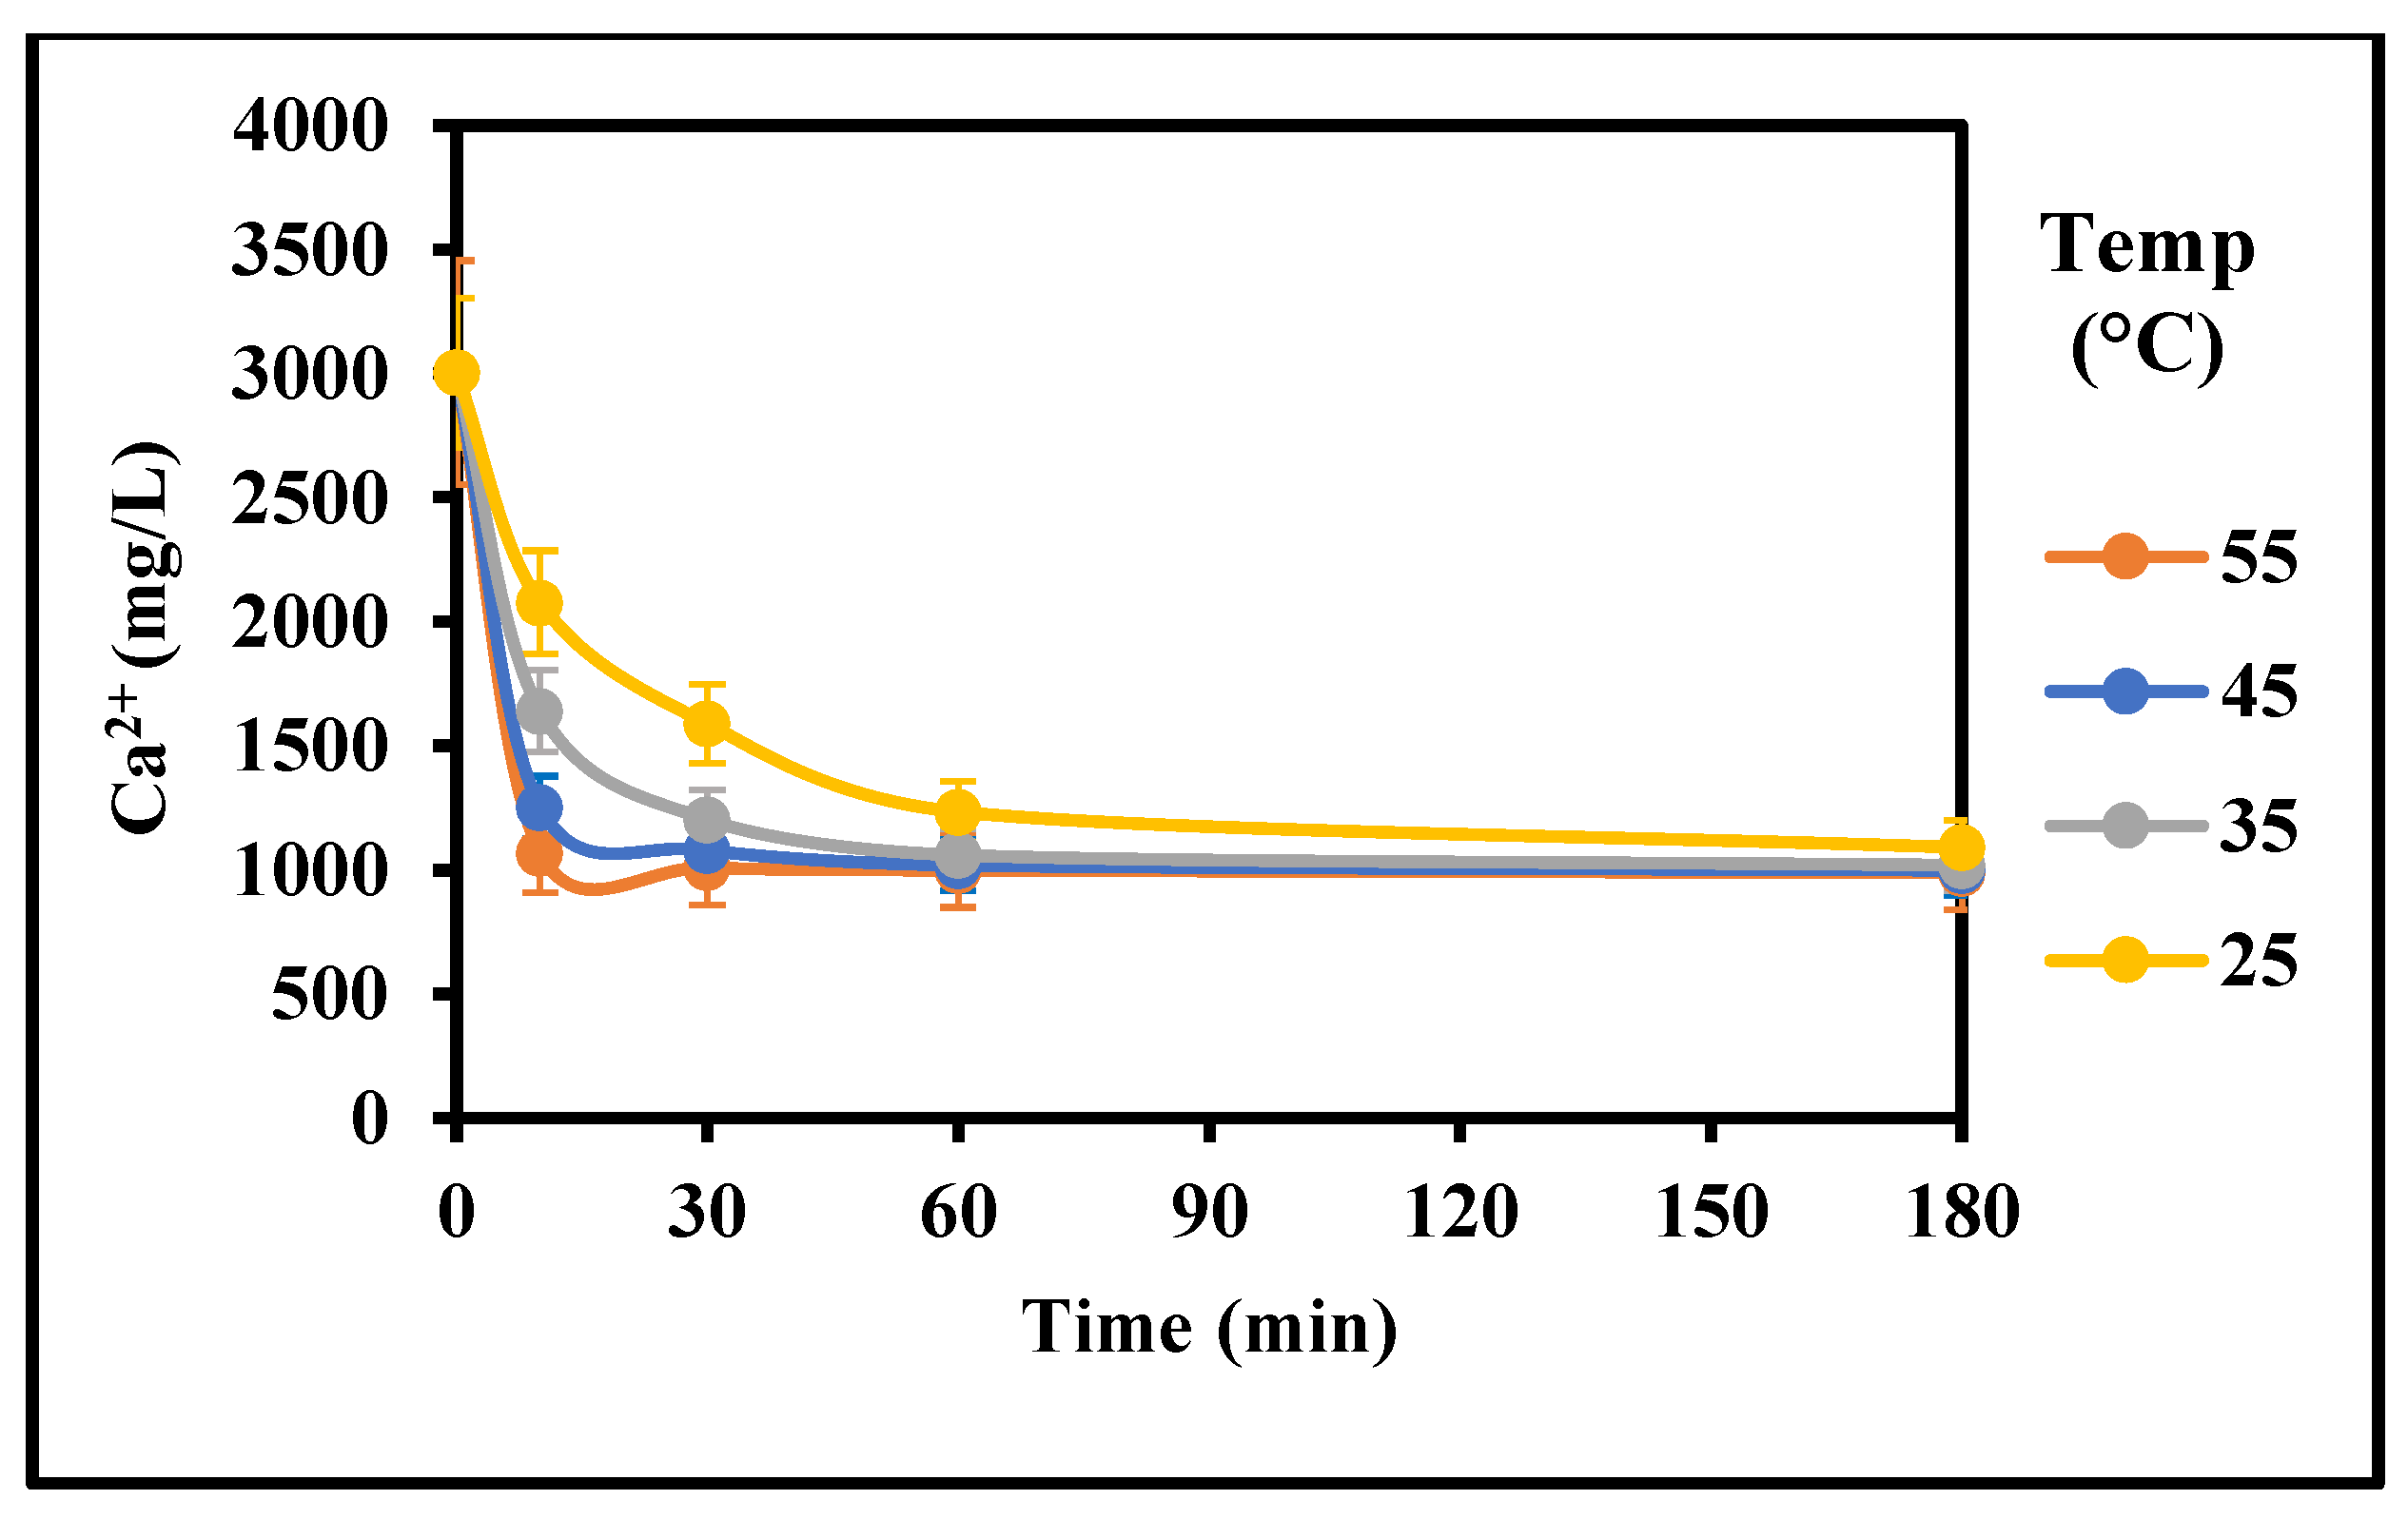
Figure 4.
Effect of temperature on the rate of gypsum crystallization (3000 mg/L CaSO4 (as Ca), 5 g/L gypsum seed, 0 g/L Fe3+, 0 mg/L Inh, 25–55 °C, stirring rate: 200 rpm; Stirring time (min): 180/180).
Figure 4.
Effect of temperature on the rate of gypsum crystallization (3000 mg/L CaSO4 (as Ca), 5 g/L gypsum seed, 0 g/L Fe3+, 0 mg/L Inh, 25–55 °C, stirring rate: 200 rpm; Stirring time (min): 180/180).
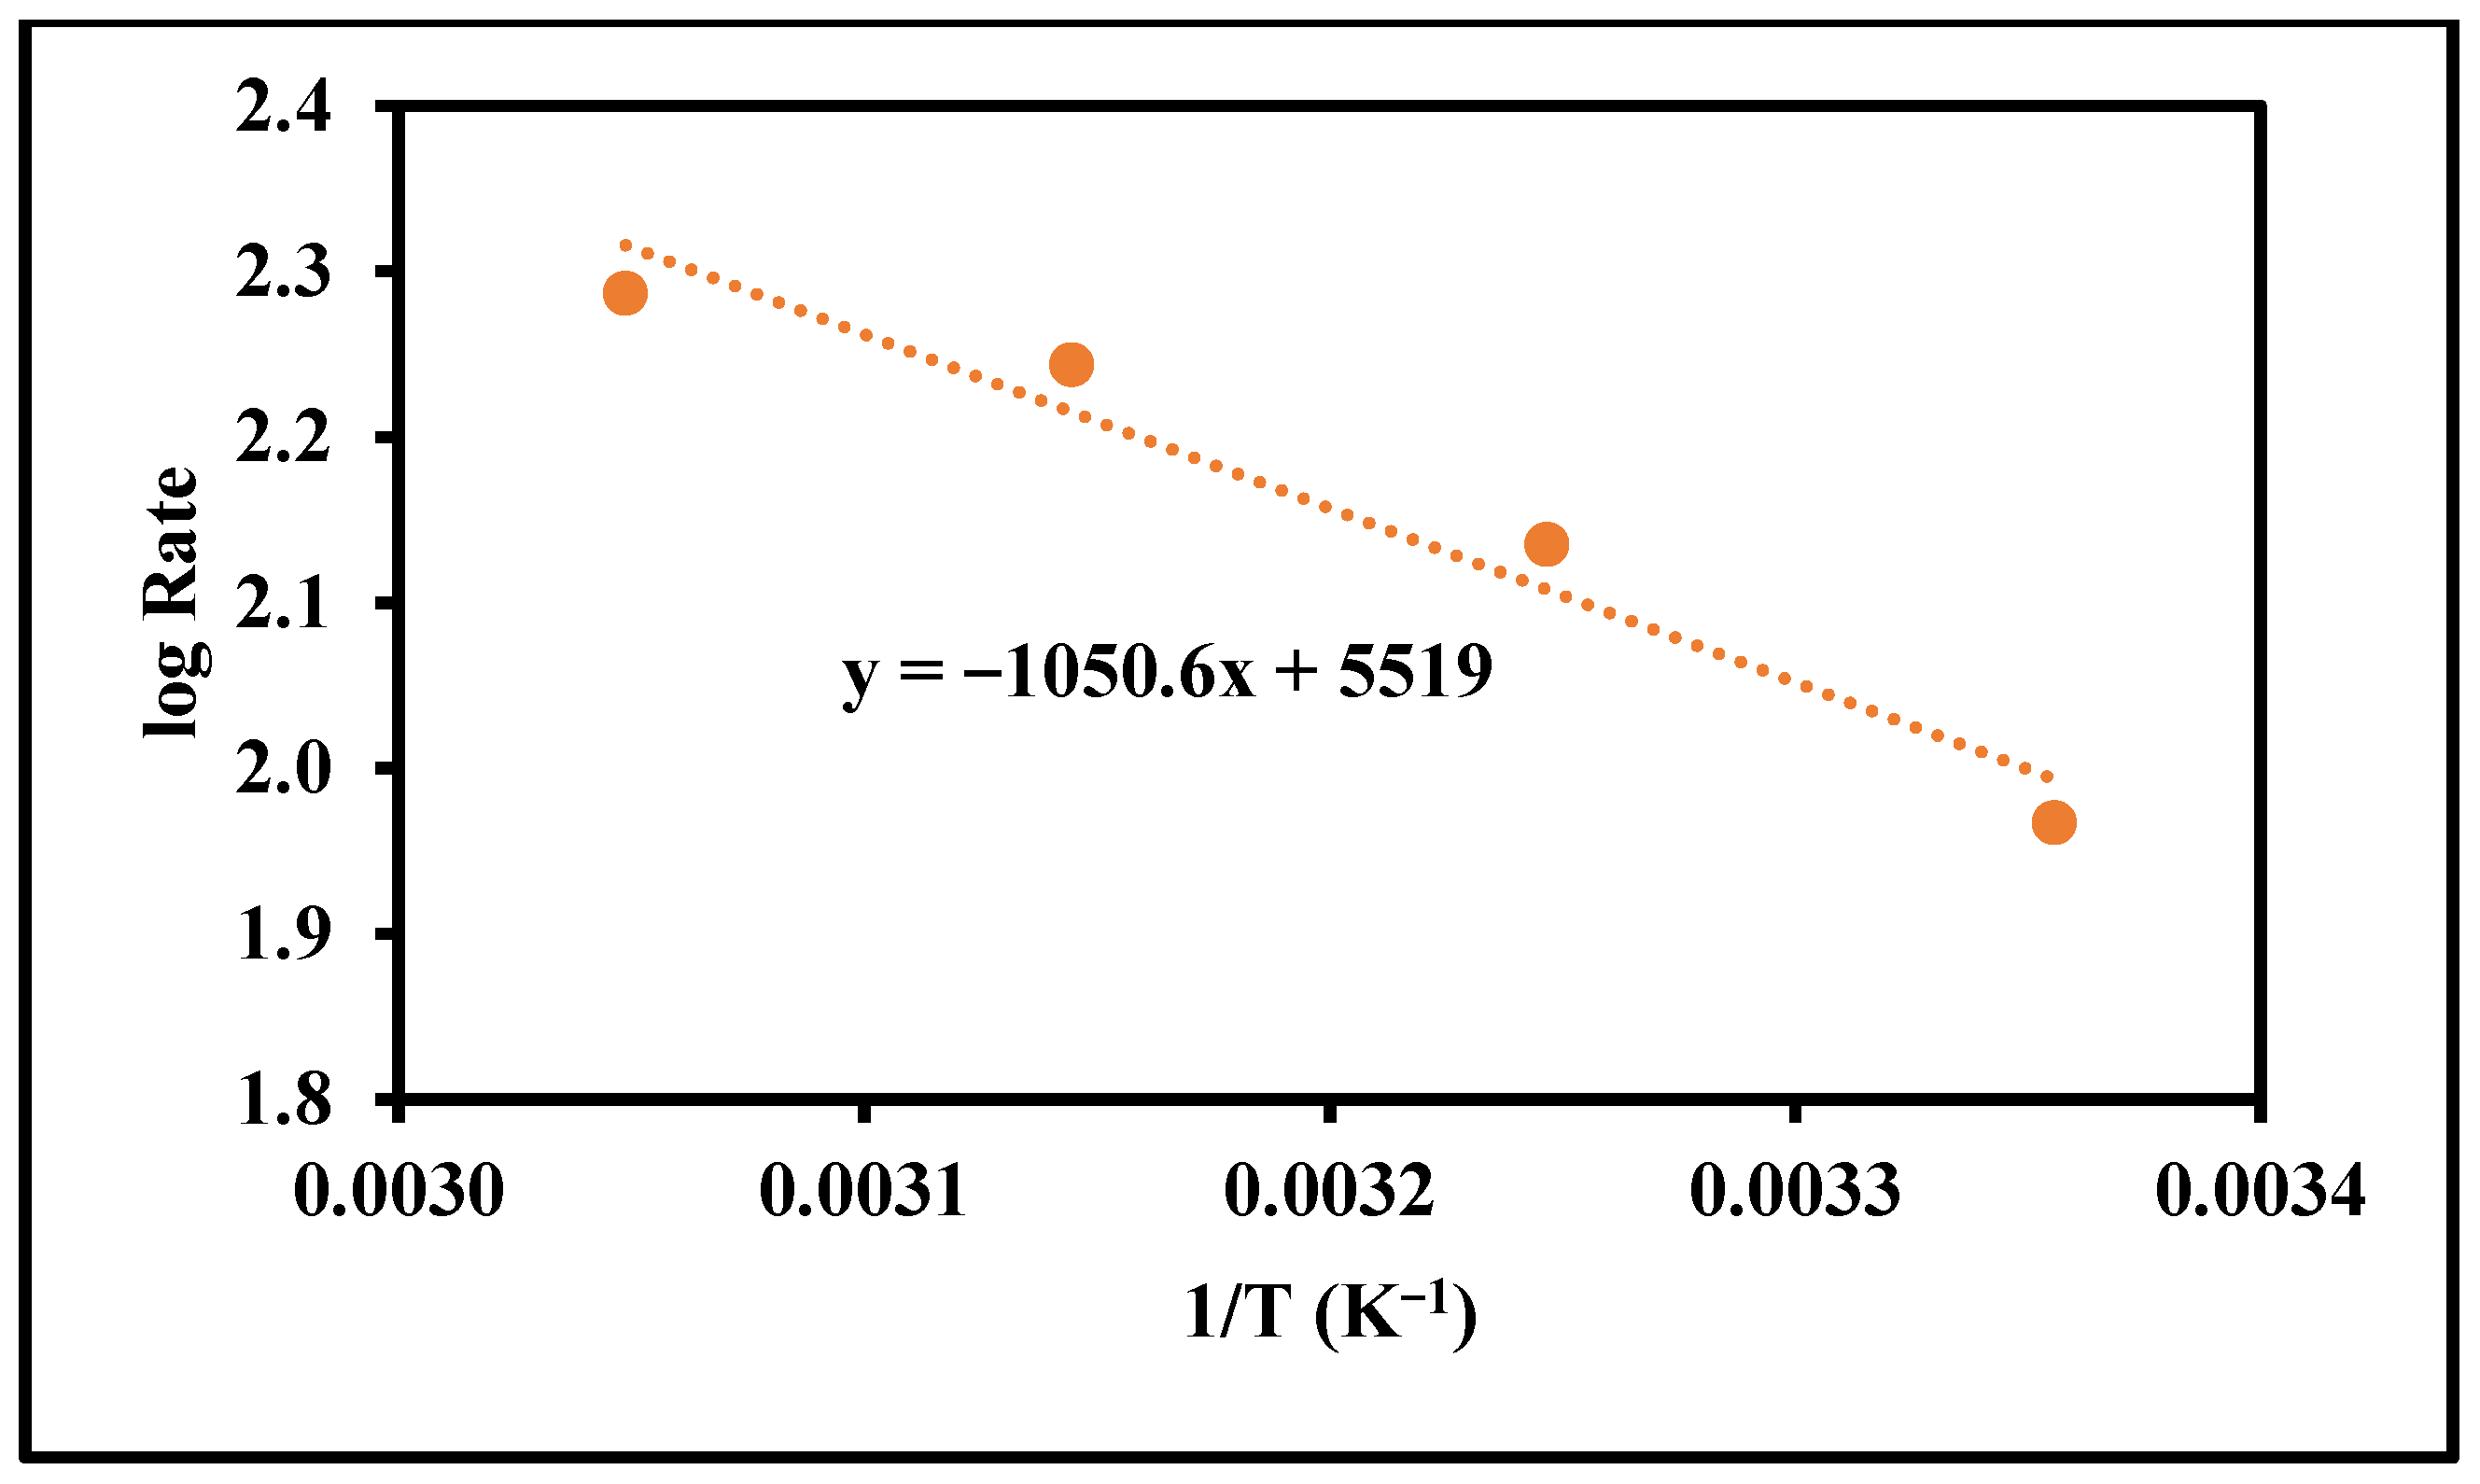
Figure 5.
Determination of the activation energy.
Figure 5.
Determination of the activation energy.
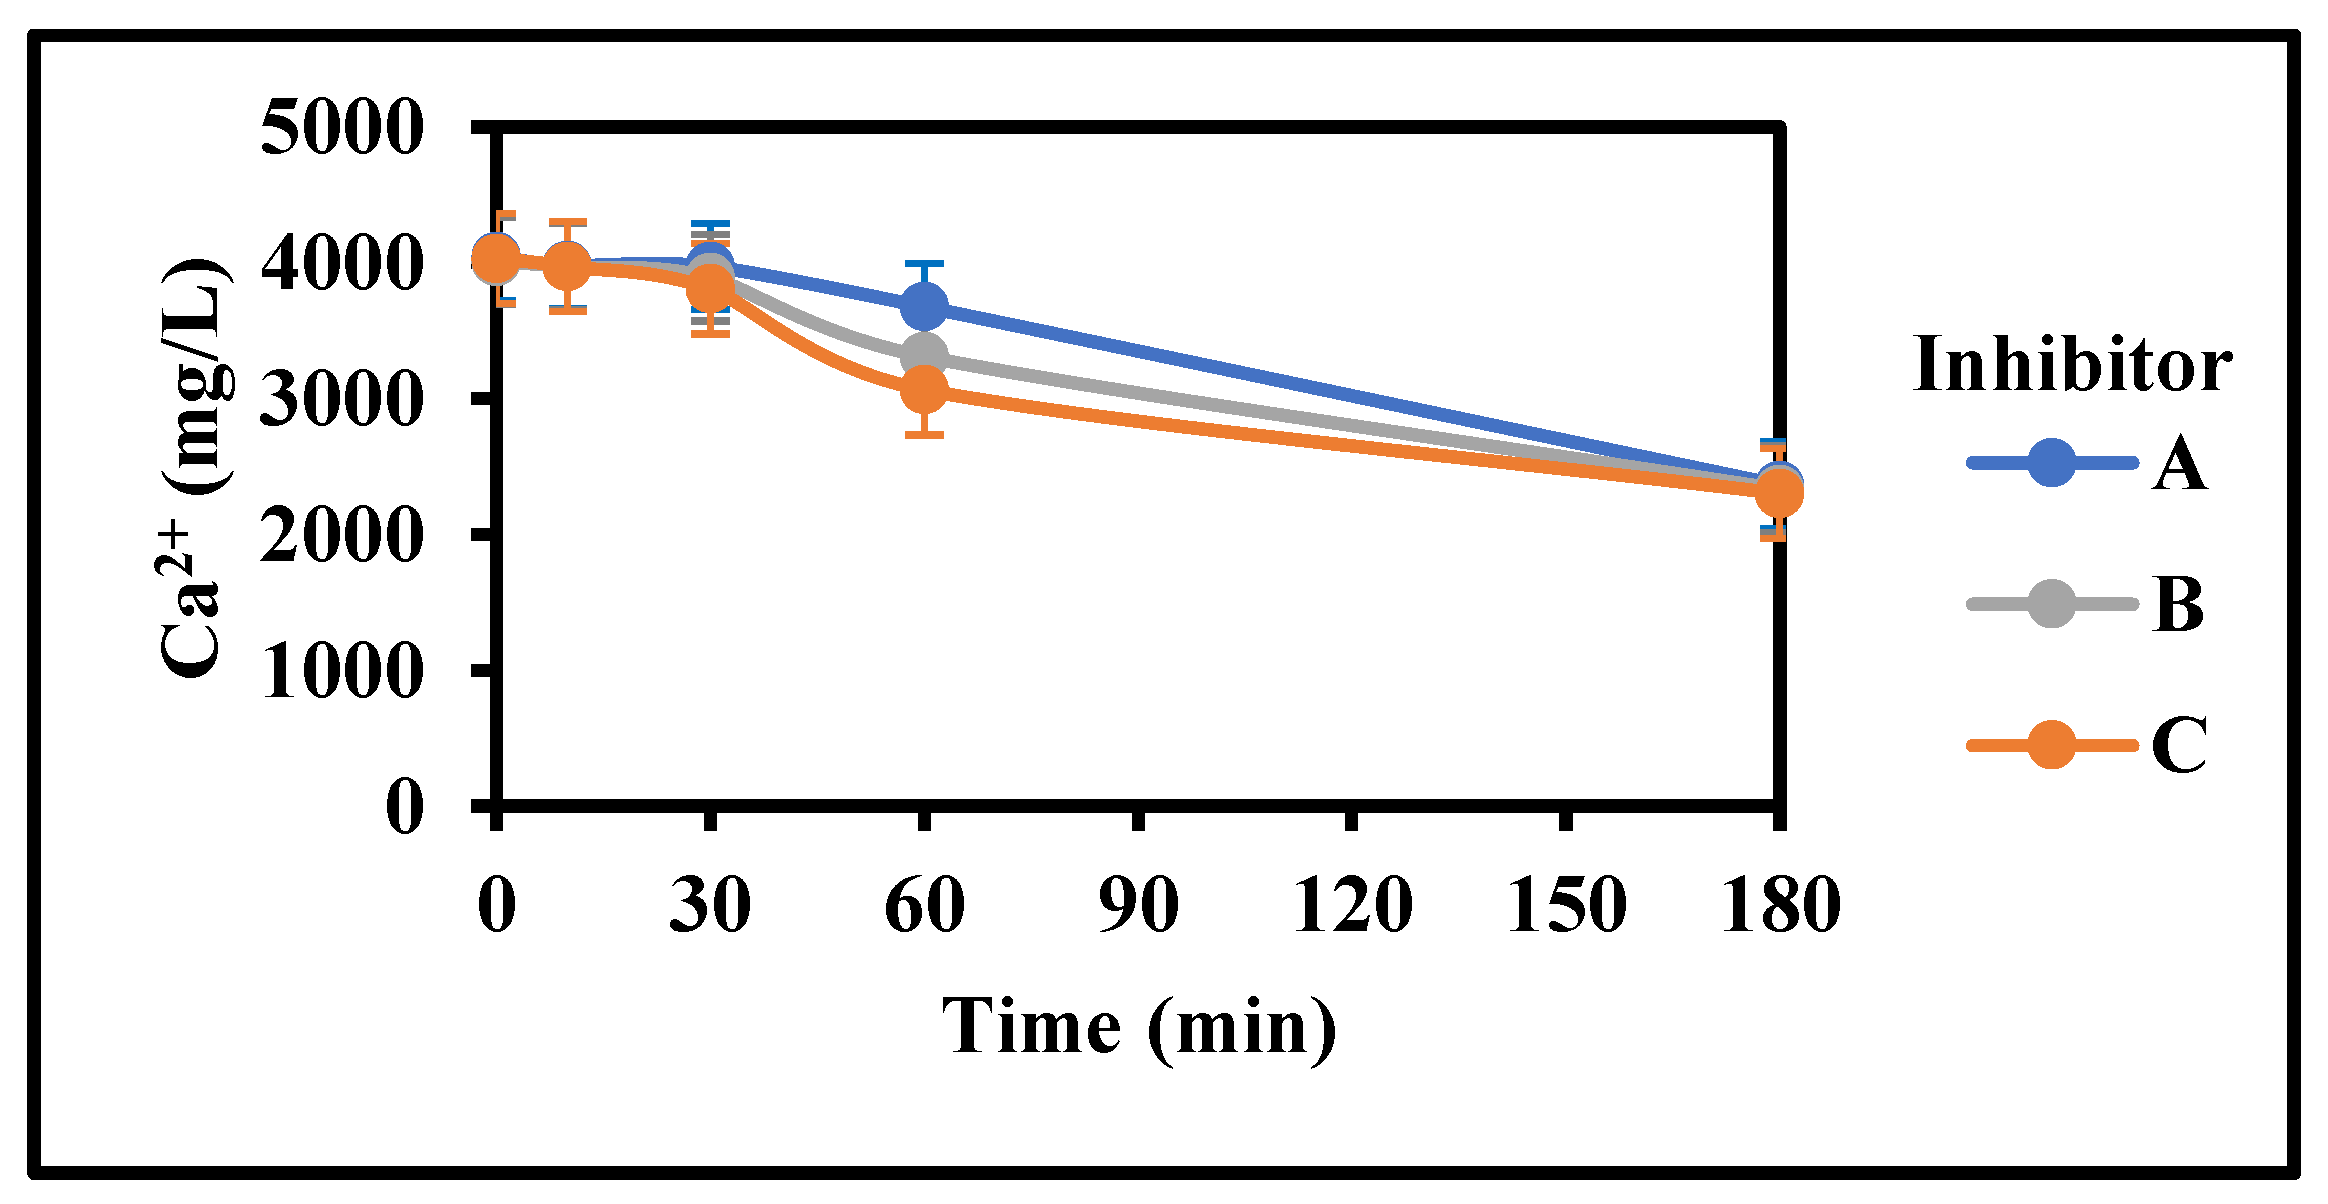
Figure 6.
Comparison of various inhibitors on the rate of gypsum crystallization with initial mixing (4000 mg/L CaSO4 (as Ca), 0 g/L gypsum seed, 4 g/L Fe3+, 100 mg/L Inh, 25 °C, stirring rate: 200 rpm; Stirring time (min): 180/180; pH 3.5).
Figure 6.
Comparison of various inhibitors on the rate of gypsum crystallization with initial mixing (4000 mg/L CaSO4 (as Ca), 0 g/L gypsum seed, 4 g/L Fe3+, 100 mg/L Inh, 25 °C, stirring rate: 200 rpm; Stirring time (min): 180/180; pH 3.5).
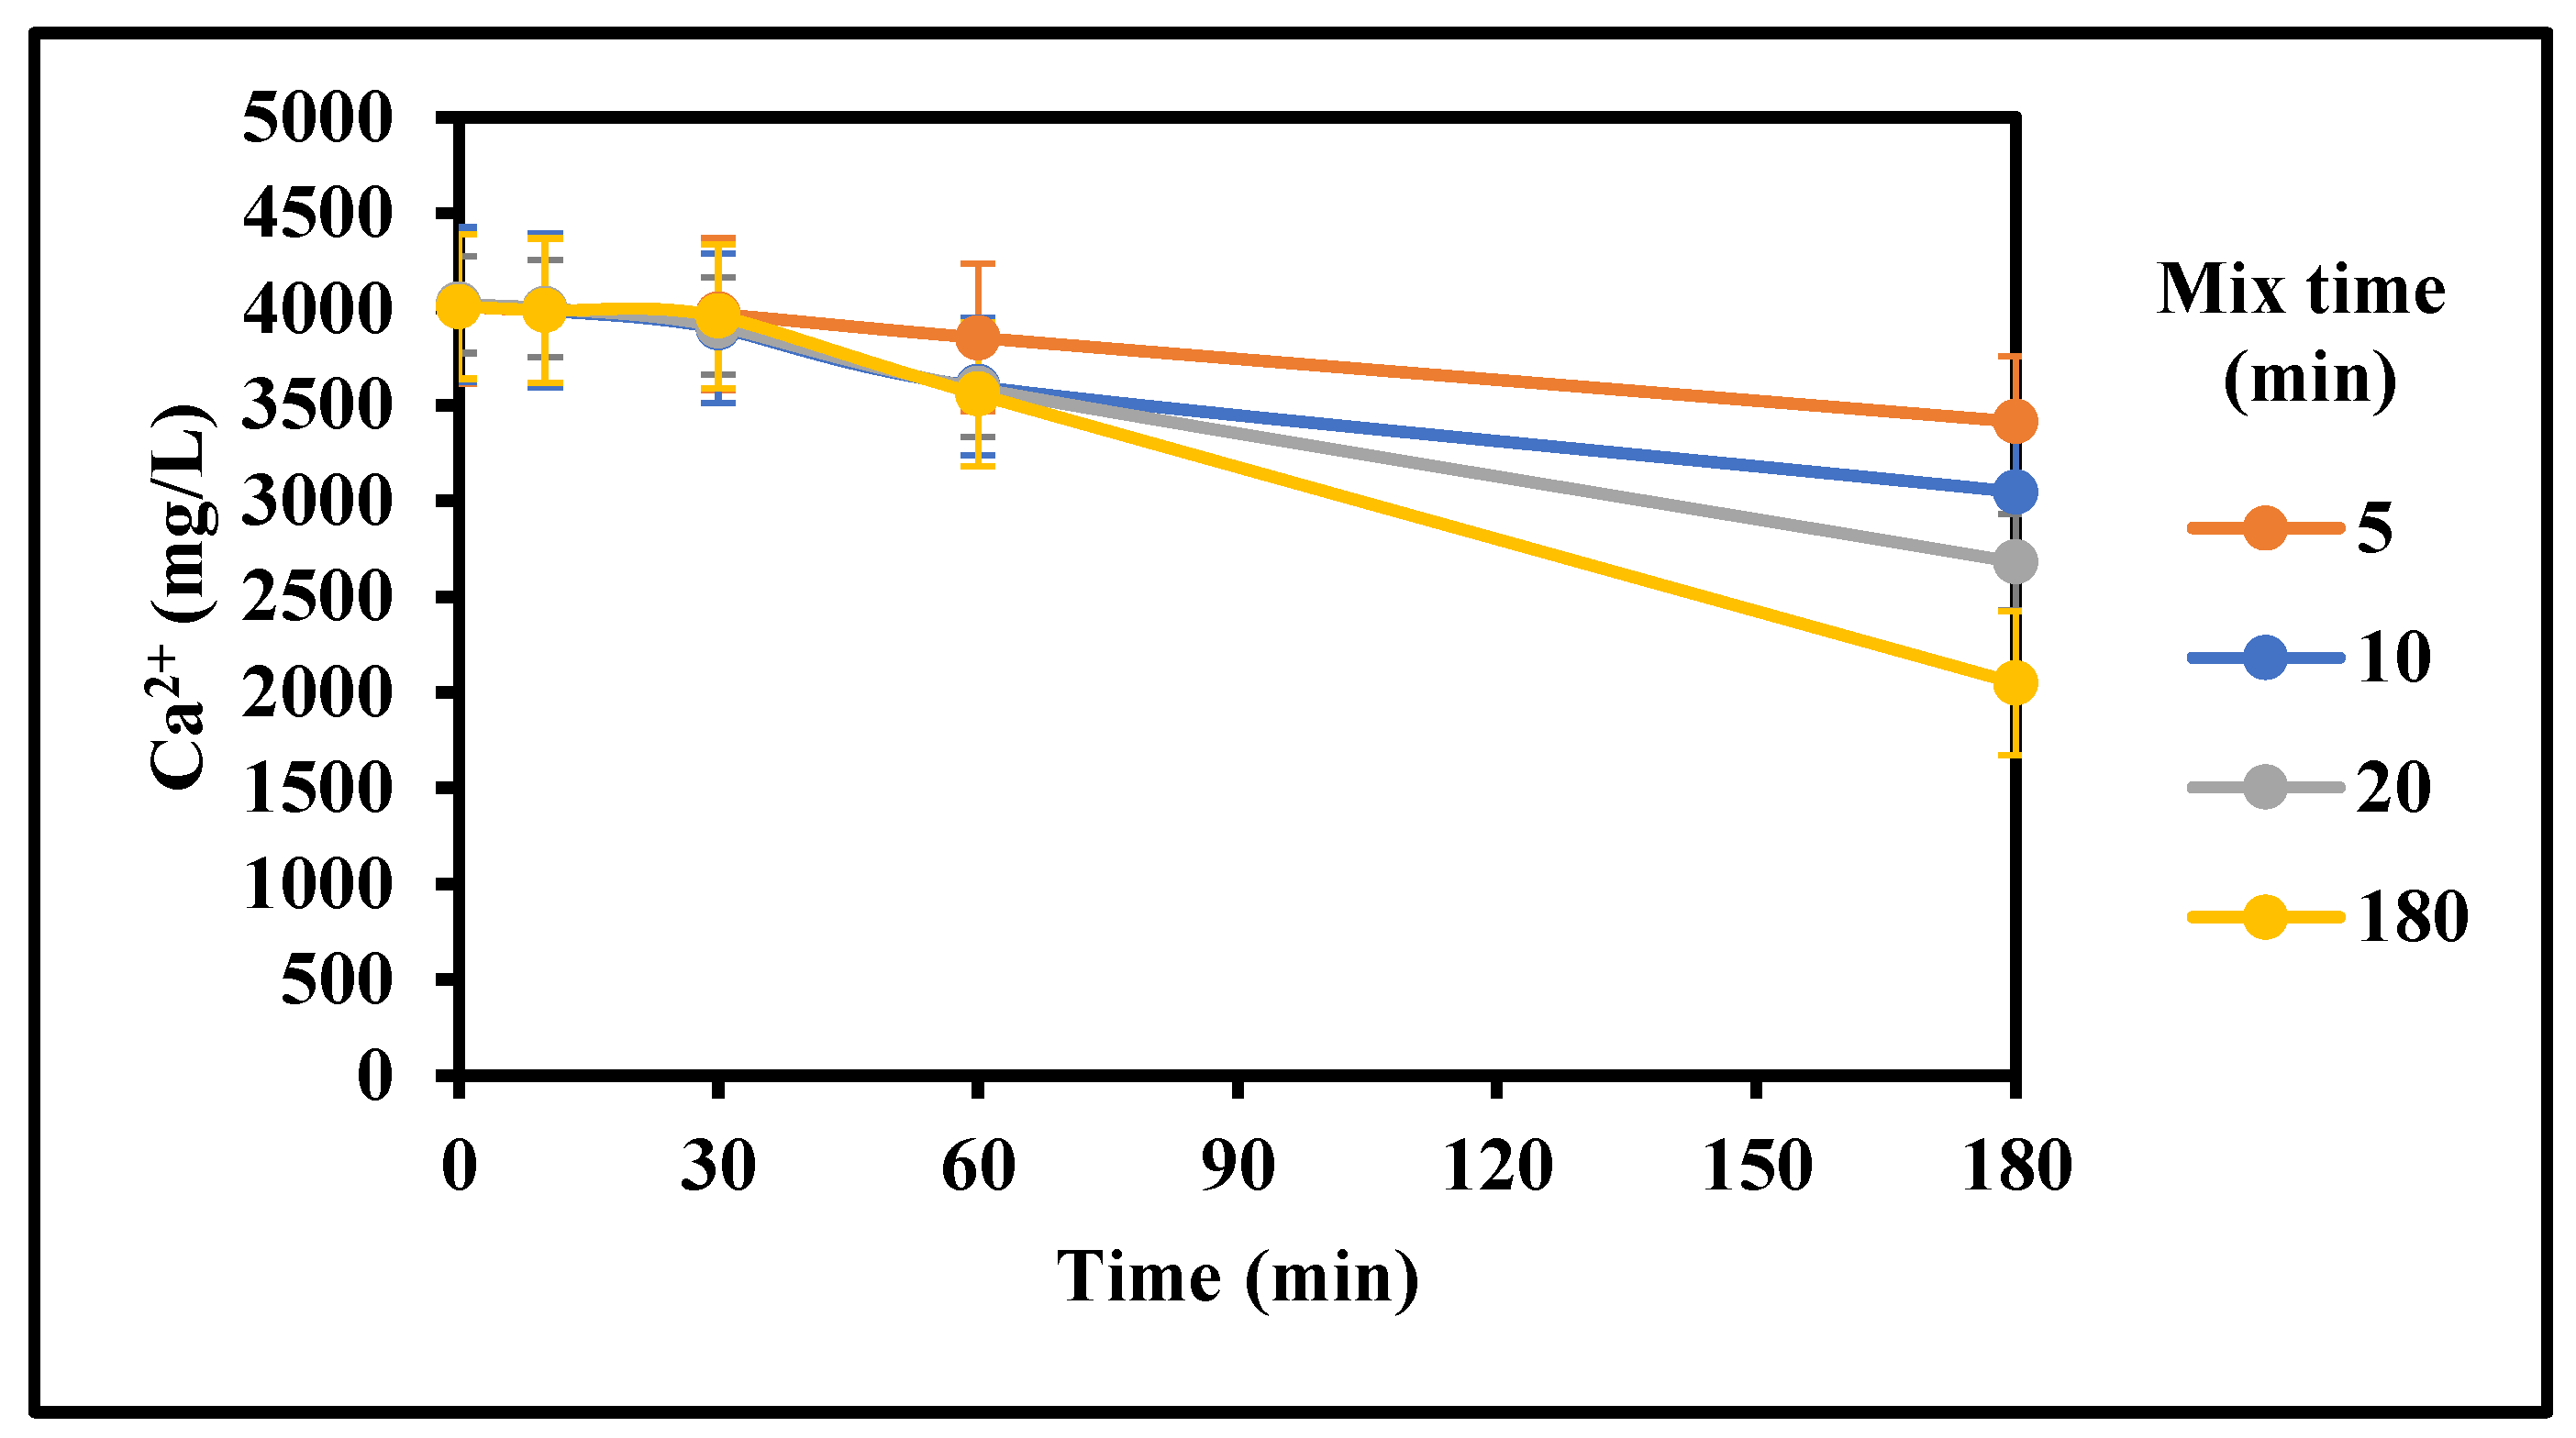
Figure 7.
Effect of mixing time on the rate of gypsum crystallization with initial mixing (4000 mg/L CaSO4 (as Ca), 0 g/L gypsum seed, 4 g/L Fe3+, 0–100 mg/L Inh. A, 25 °C, stirring rate: 200 rpm; Stirring time (min): 5 to 180/180).
Figure 7.
Effect of mixing time on the rate of gypsum crystallization with initial mixing (4000 mg/L CaSO4 (as Ca), 0 g/L gypsum seed, 4 g/L Fe3+, 0–100 mg/L Inh. A, 25 °C, stirring rate: 200 rpm; Stirring time (min): 5 to 180/180).
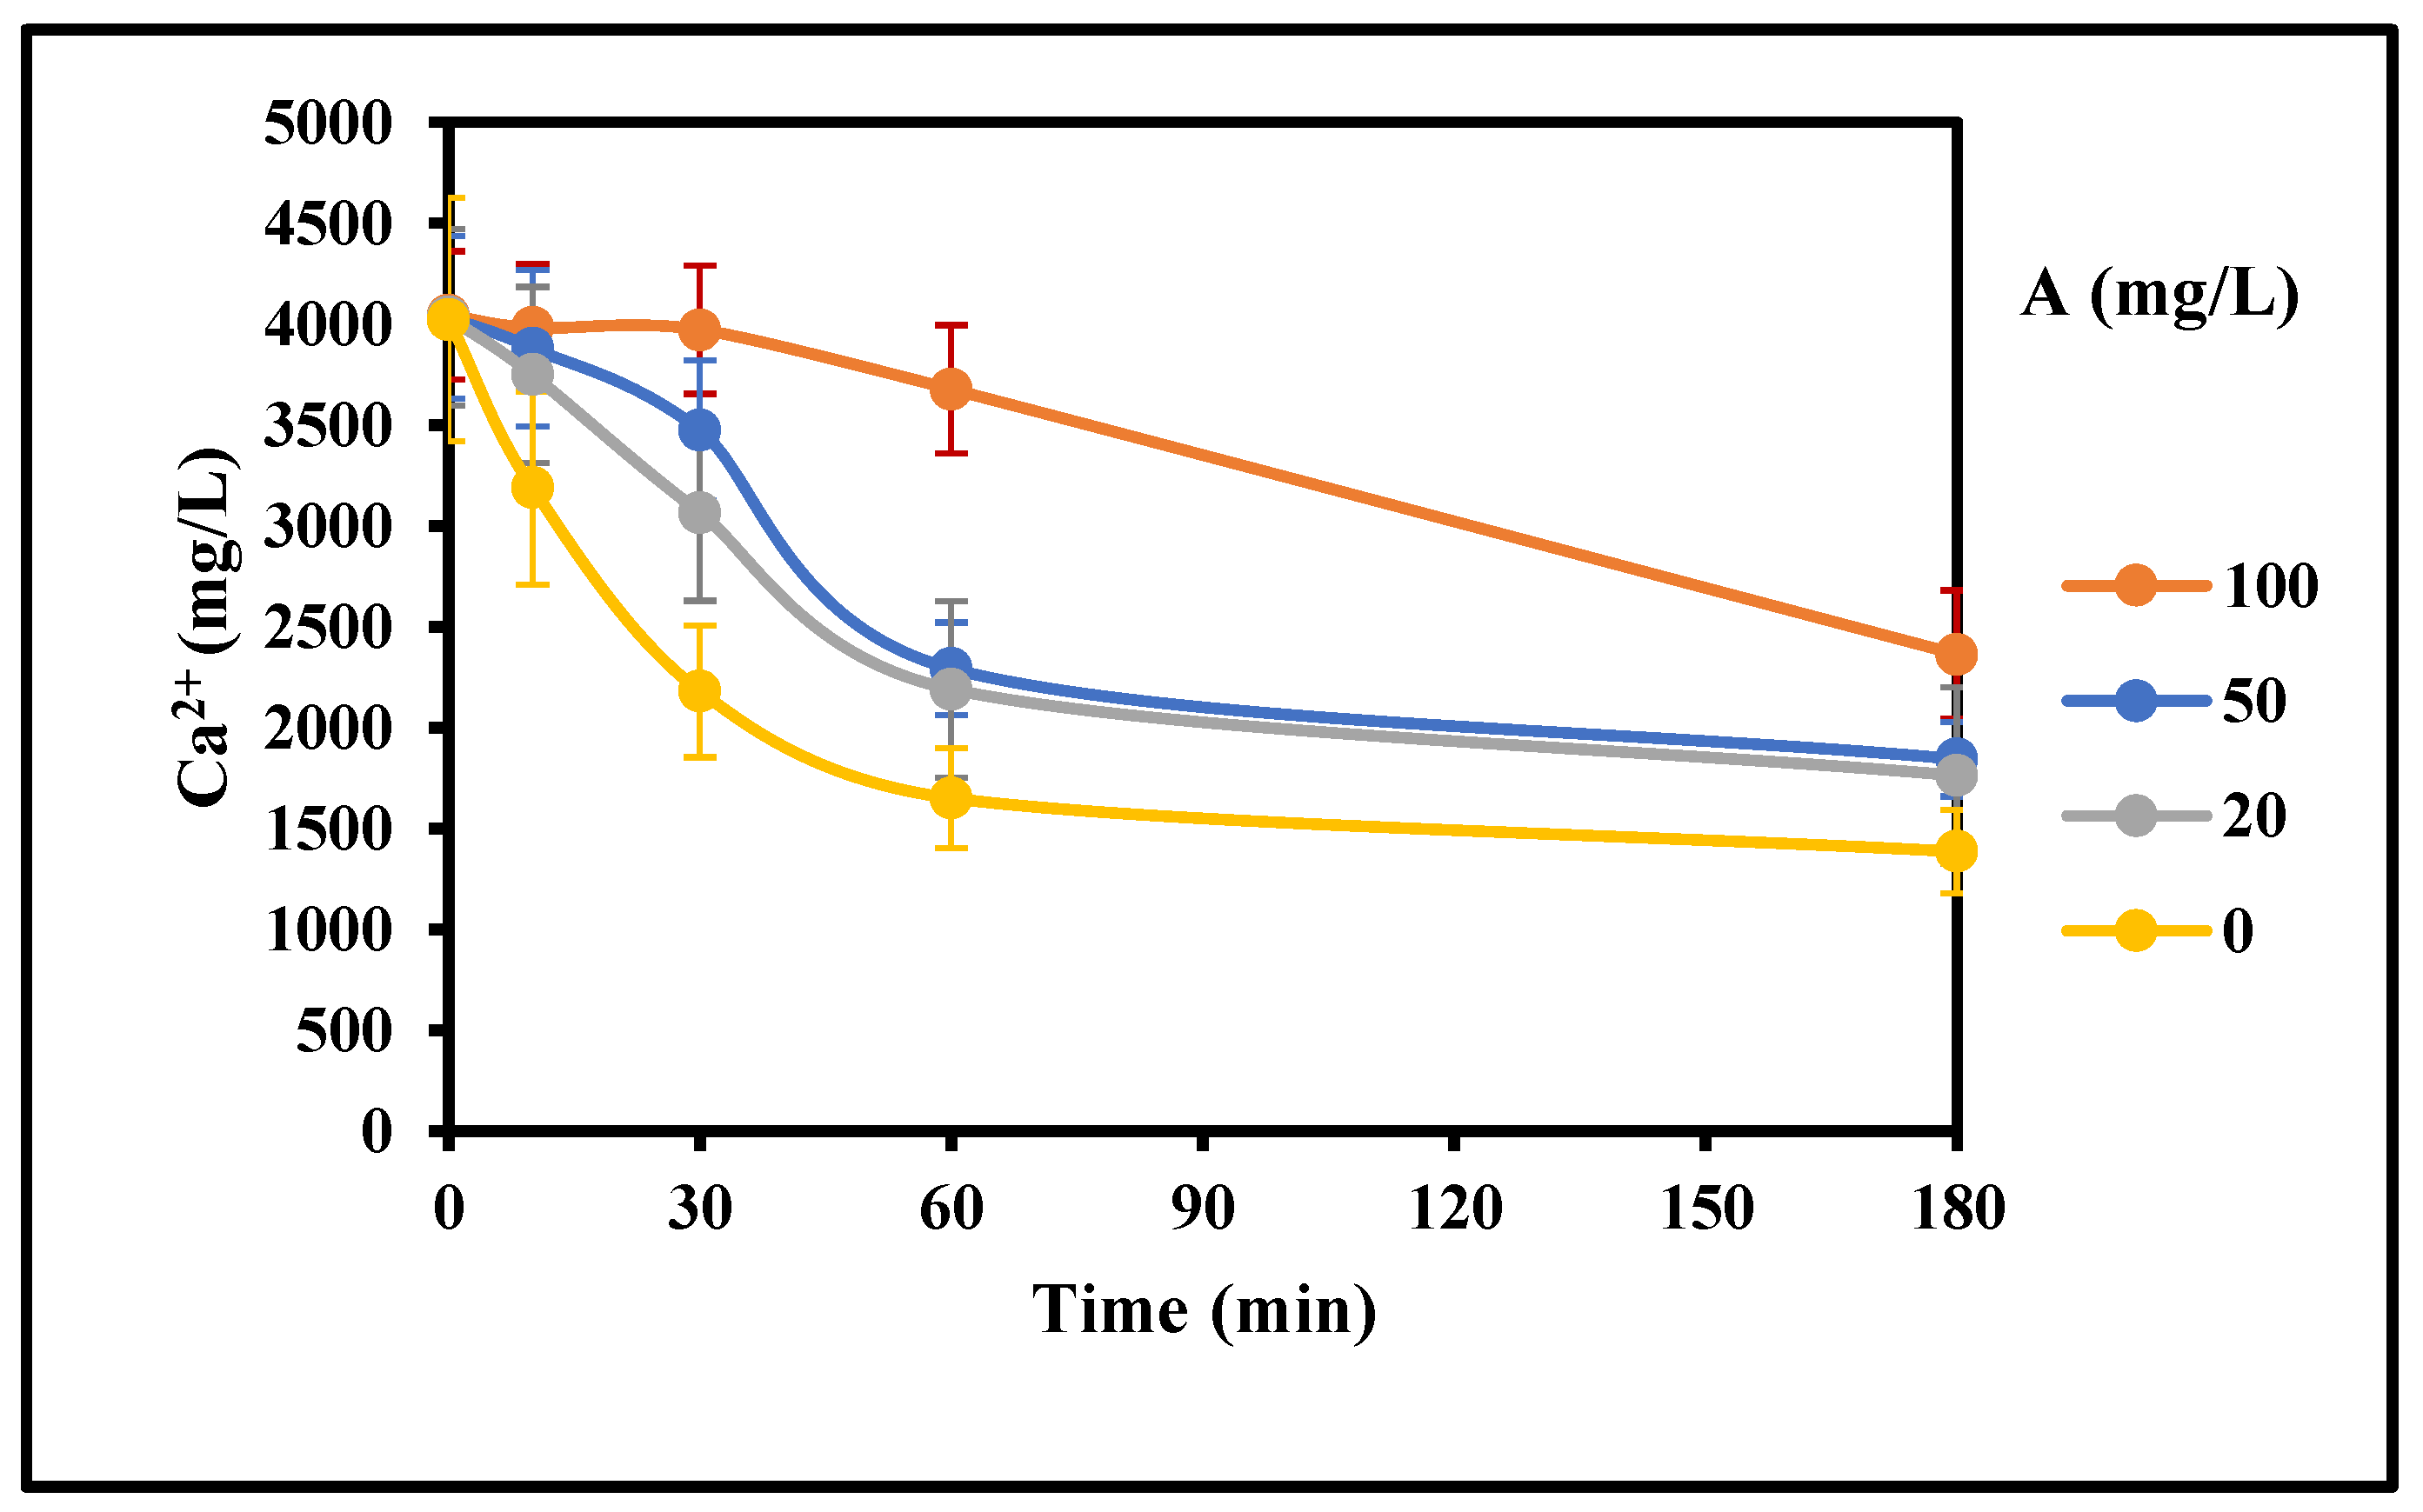
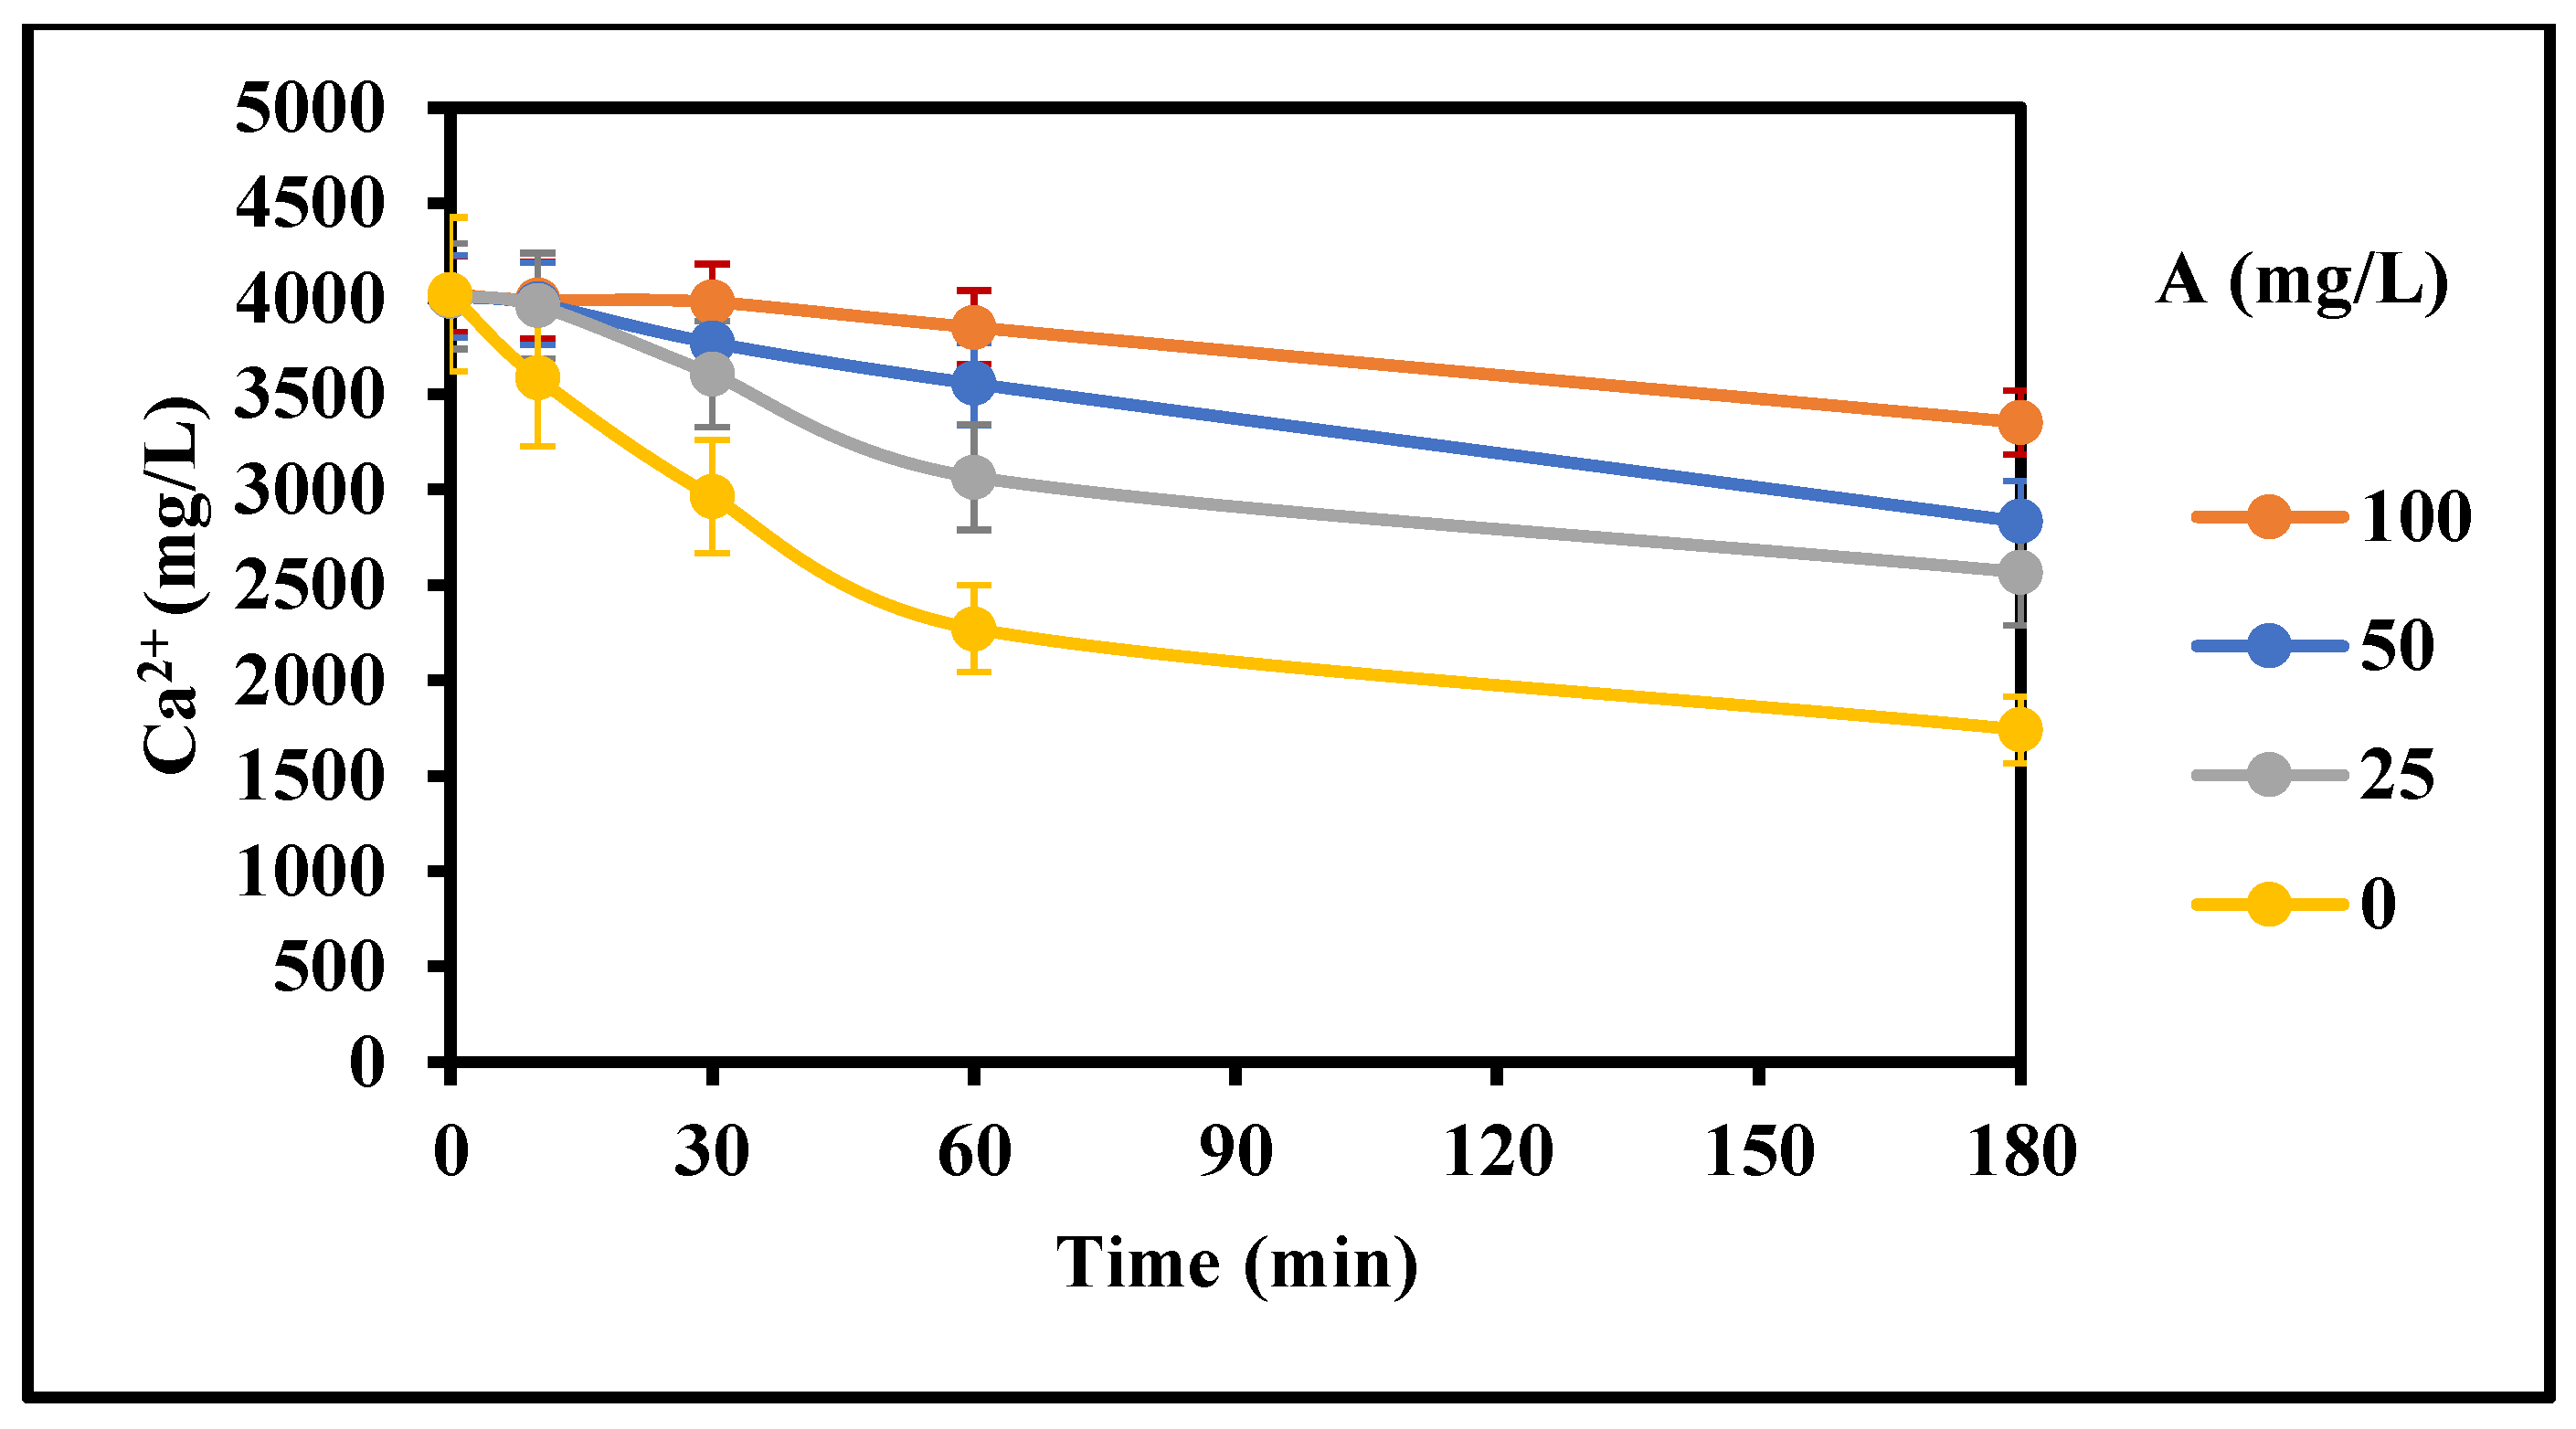
Figure 8.
Effect of inhibitor A concentration on the rate of gypsum crystallization with mixing (4000 mg/L CaSO4 (as Ca), 0 g/L gypsum seed, 4 g/L Fe3+, 0–100 mg/L Inh. A, 25 °C, stirring rate: 200 rpm; Stirring time (min): 180/180).
Figure 8.
Effect of inhibitor A concentration on the rate of gypsum crystallization with mixing (4000 mg/L CaSO4 (as Ca), 0 g/L gypsum seed, 4 g/L Fe3+, 0–100 mg/L Inh. A, 25 °C, stirring rate: 200 rpm; Stirring time (min): 180/180).
Figure 9.
Effect of inhibitor A concentration on the rate of gypsum crystallization with initial mixing (4000 mg/L CaSO4 (as Ca), 0 g/L gypsum seed, 4 g/L Fe3+, 0–100 mg/L Inh. A, 25 °C, stirring rate: 200 rpm; Stirring time (min): 5/180).
Figure 9.
Effect of inhibitor A concentration on the rate of gypsum crystallization with initial mixing (4000 mg/L CaSO4 (as Ca), 0 g/L gypsum seed, 4 g/L Fe3+, 0–100 mg/L Inh. A, 25 °C, stirring rate: 200 rpm; Stirring time (min): 5/180).
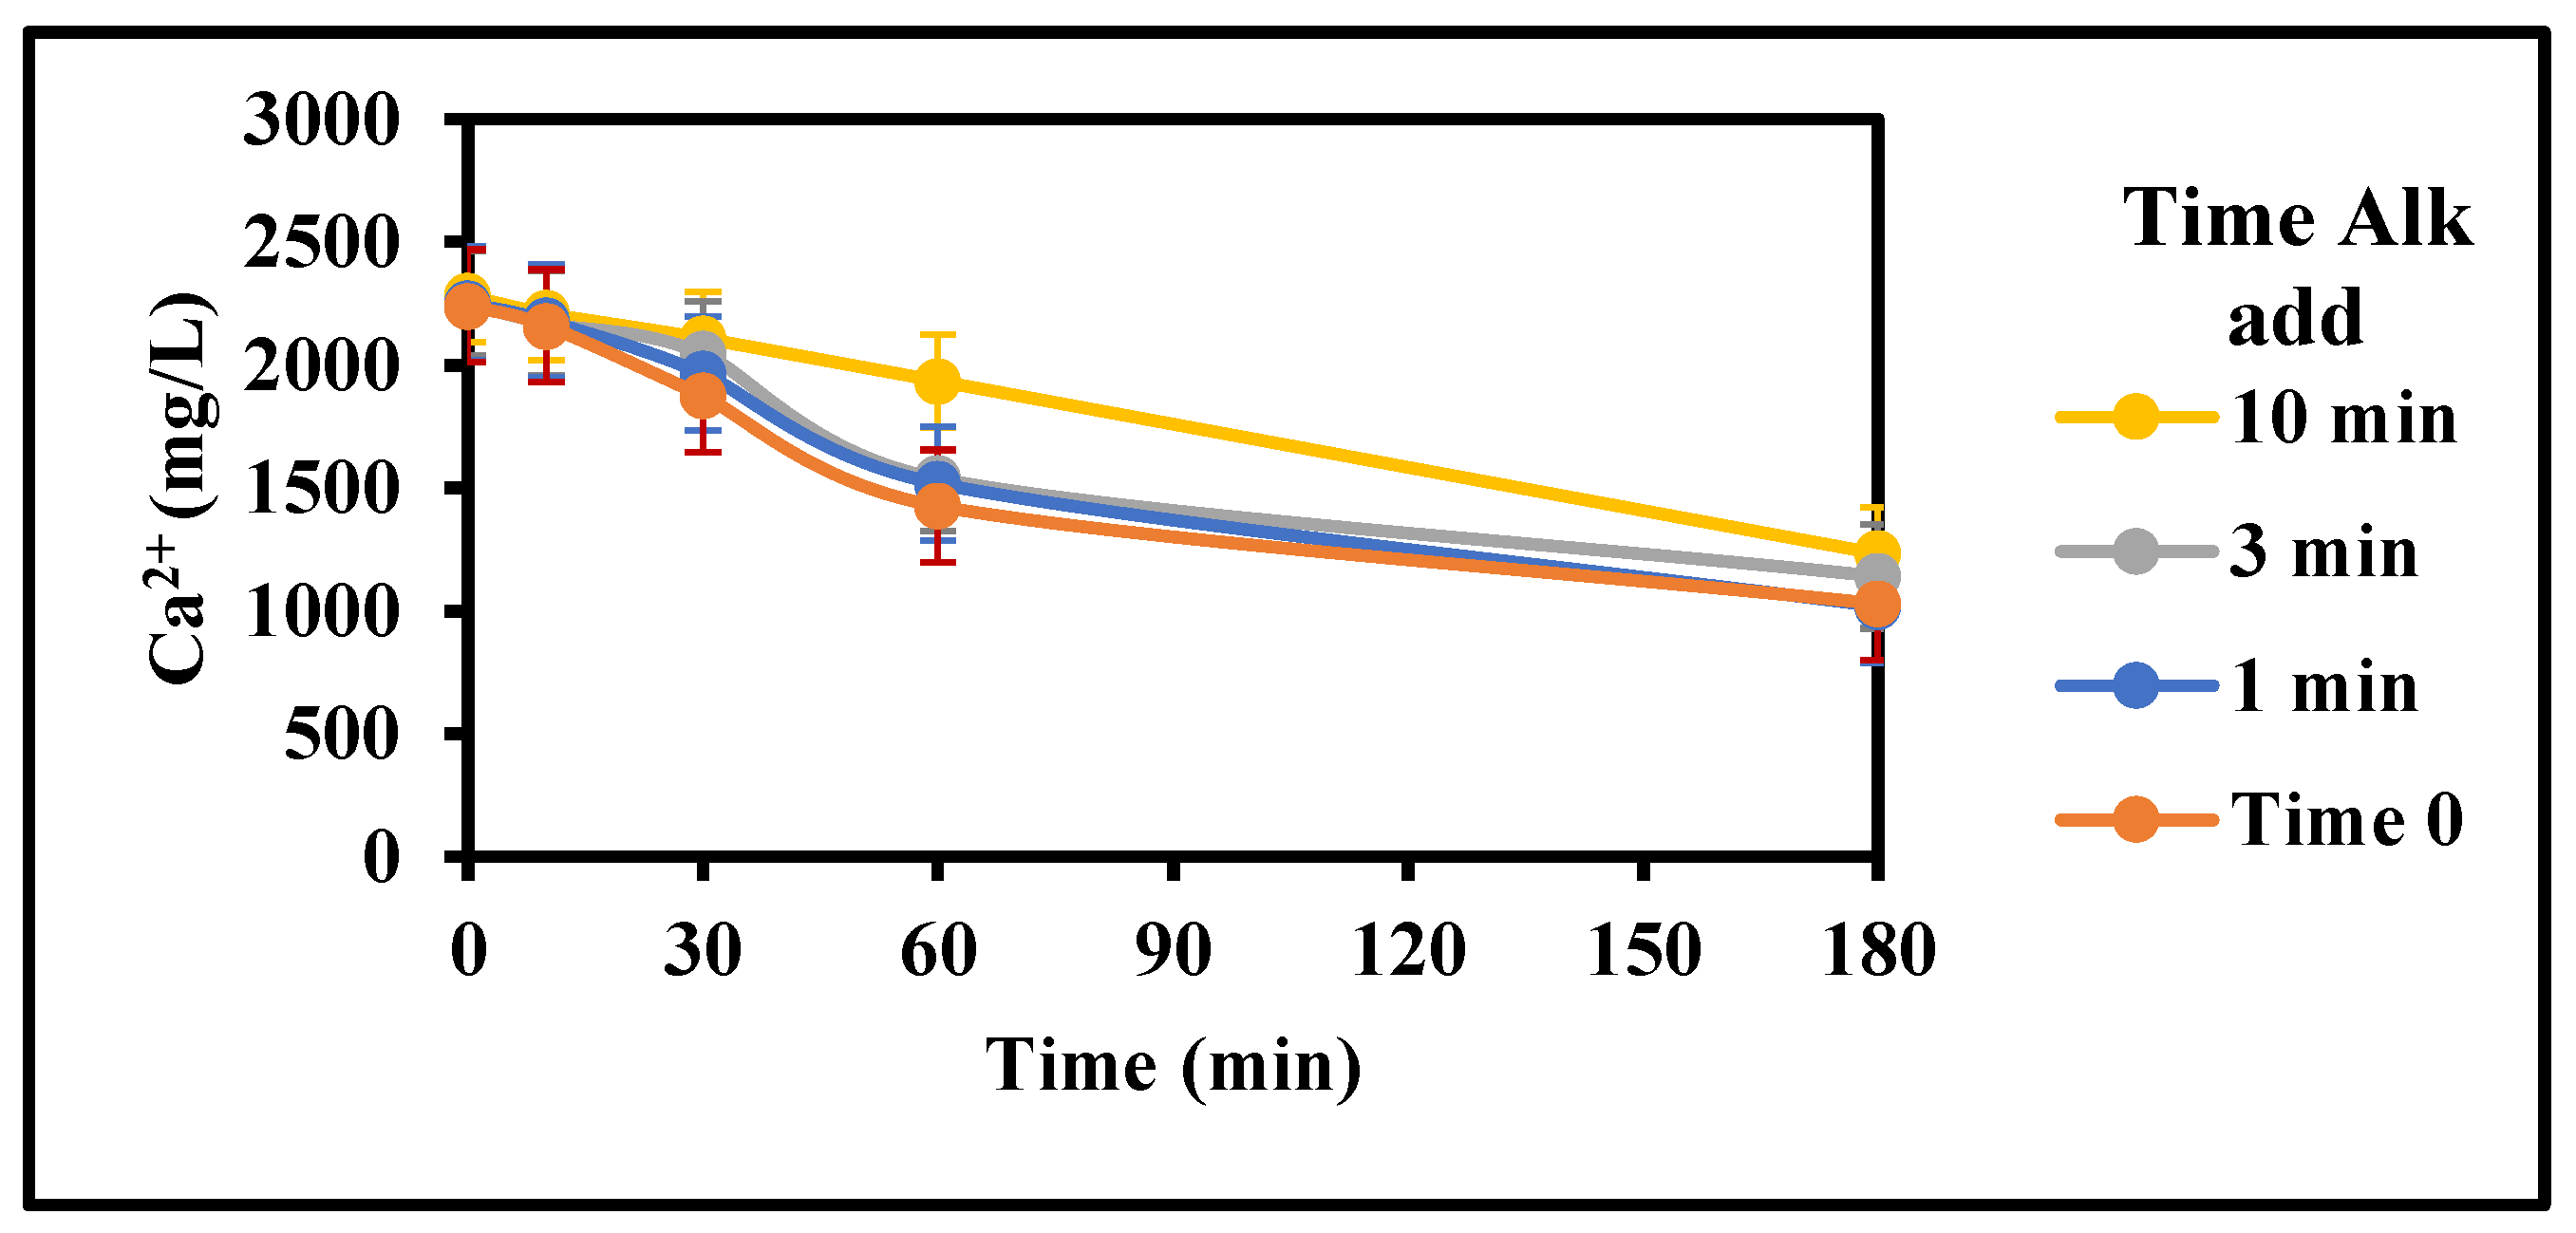
Figure 11.
Effect of CaCO3 addition period on gypsum inhibition (Top Dam water, 15 g/L Acidity, 4 g/L Fe3+, 22 g/L CaCO3, 0 g/L gypsum seed, 100 mg/L Inh. A, 25 °C, stirring rate: 200 rpm; Stirring time (min): 180/180; CaCO3 addition: Time 0 to 10 min).
Figure 11.
Effect of CaCO3 addition period on gypsum inhibition (Top Dam water, 15 g/L Acidity, 4 g/L Fe3+, 22 g/L CaCO3, 0 g/L gypsum seed, 100 mg/L Inh. A, 25 °C, stirring rate: 200 rpm; Stirring time (min): 180/180; CaCO3 addition: Time 0 to 10 min).
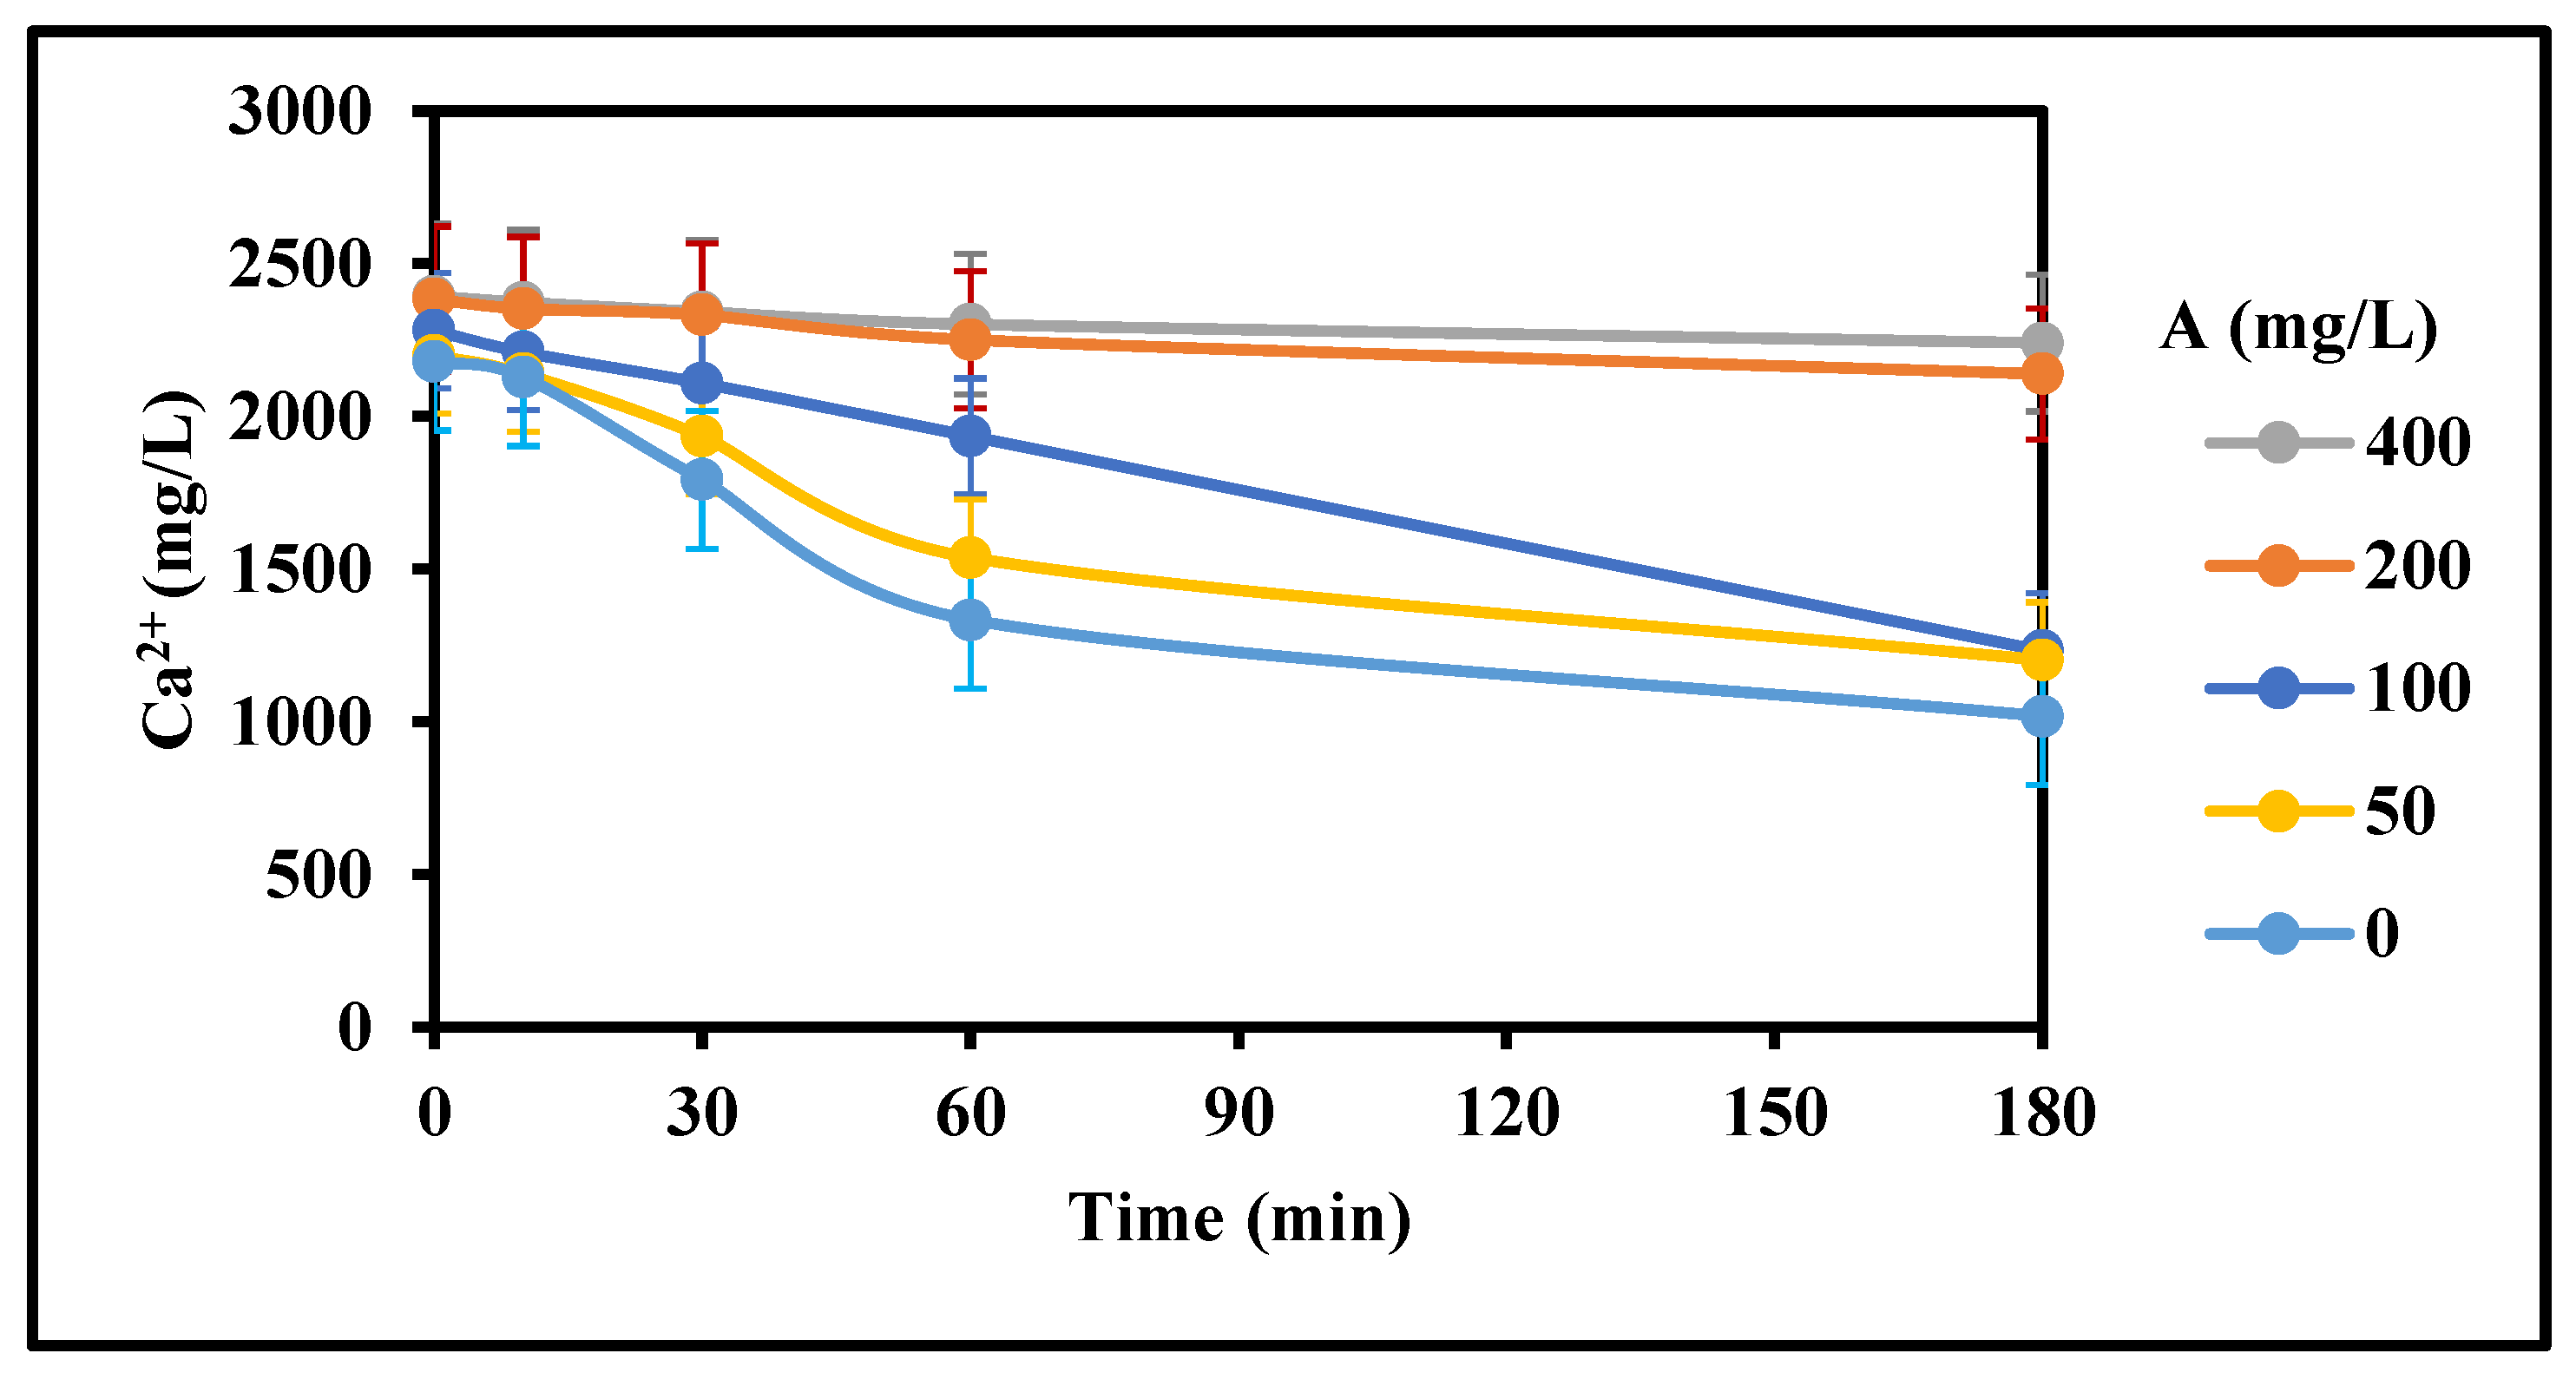
Figure 12.
Effect of inhibitor concentration gypsum inhibition (Top Dam water, 15 g/L Acidity, 4 g/L Fe3+, 22 g/L CaCO3, 0 g/L gypsum seed, 100, 200, 400 mg/L Inh A, 25 °C, stirring rate: 200 rpm; Stirring time (min): 180/180; CaCO3 addition period: 10 min).
Figure 12.
Effect of inhibitor concentration gypsum inhibition (Top Dam water, 15 g/L Acidity, 4 g/L Fe3+, 22 g/L CaCO3, 0 g/L gypsum seed, 100, 200, 400 mg/L Inh A, 25 °C, stirring rate: 200 rpm; Stirring time (min): 180/180; CaCO3 addition period: 10 min).
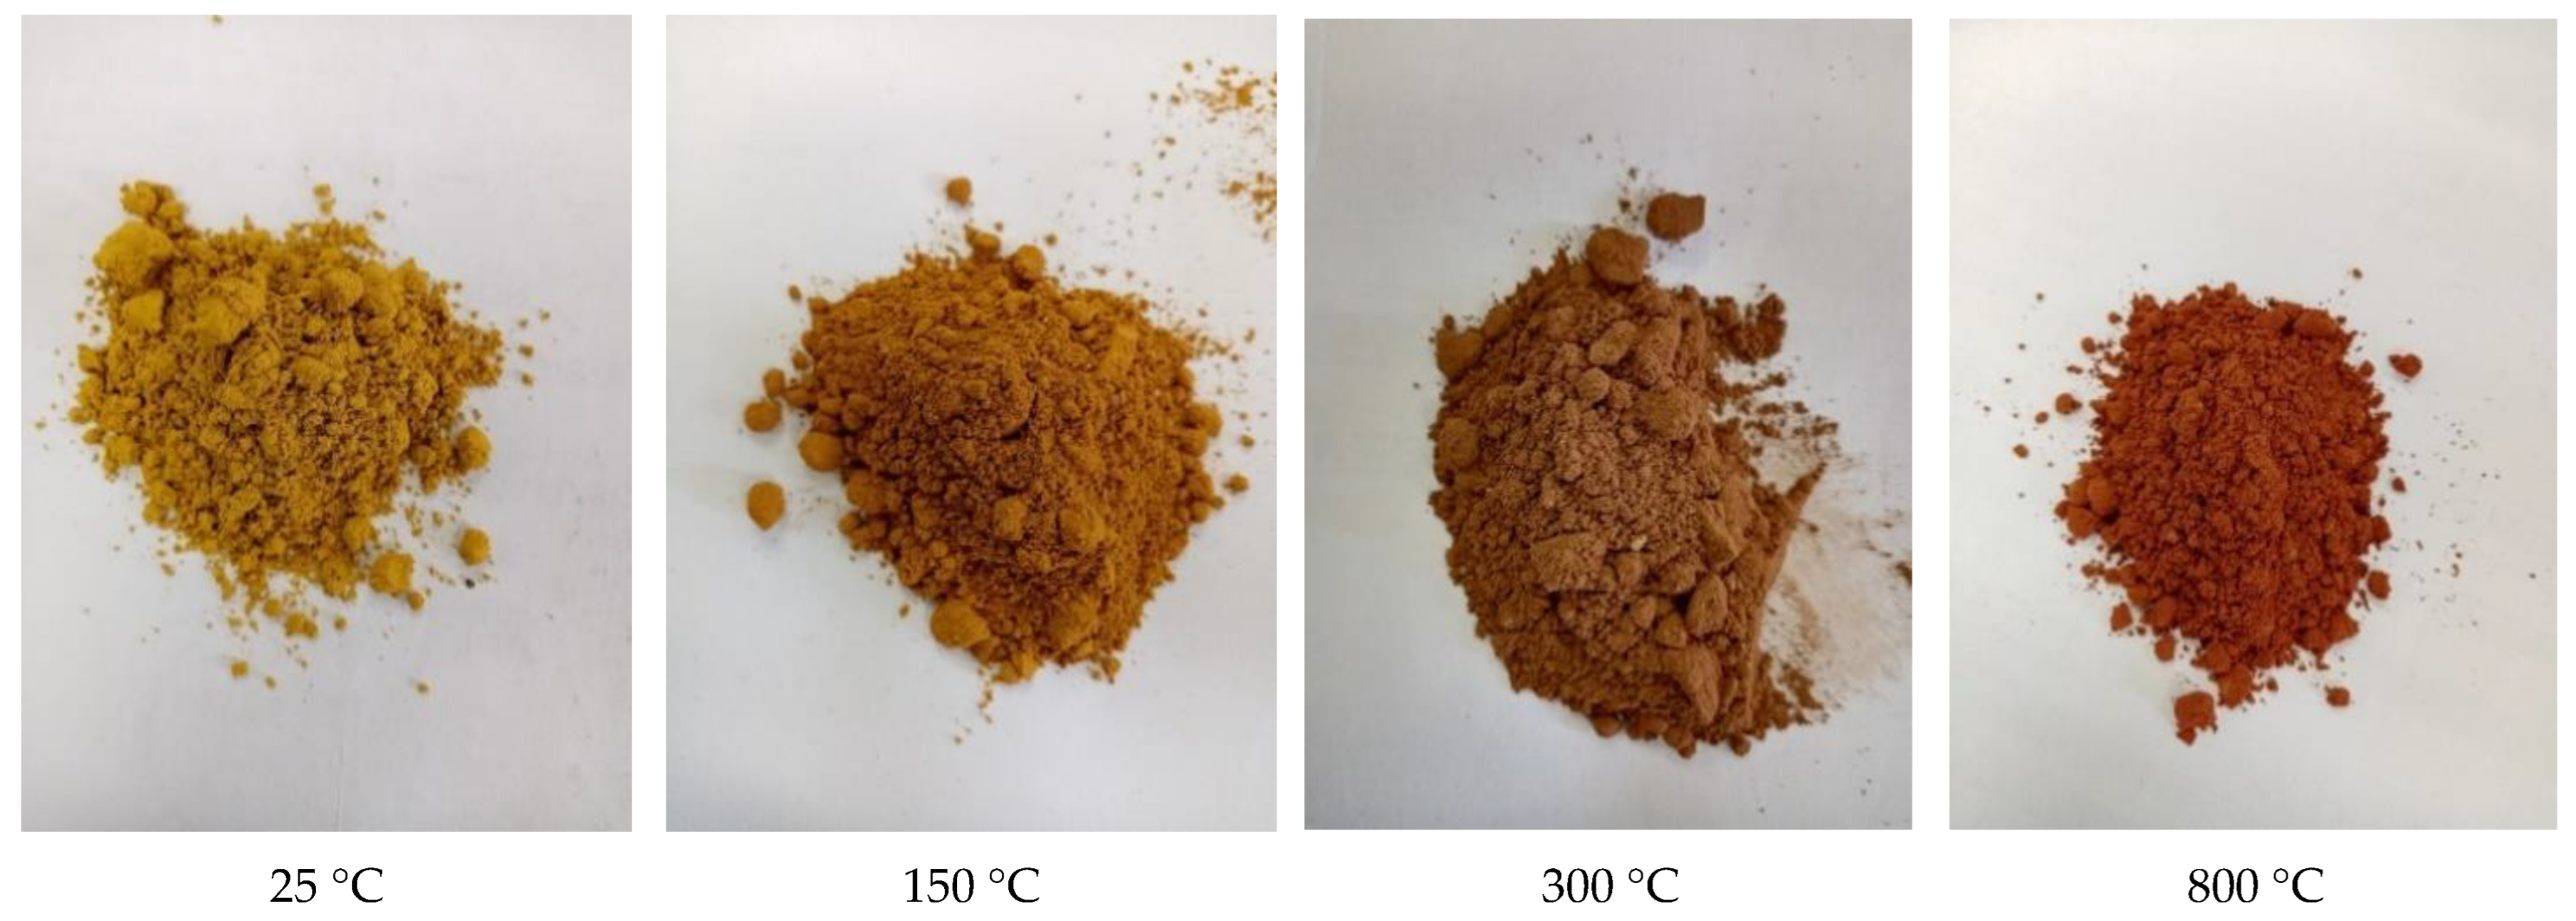
Figure 13.
Pigments produced from iron-rich mine water using CaCO3 for neutralization.
Figure 13.
Pigments produced from iron-rich mine water using CaCO3 for neutralization.
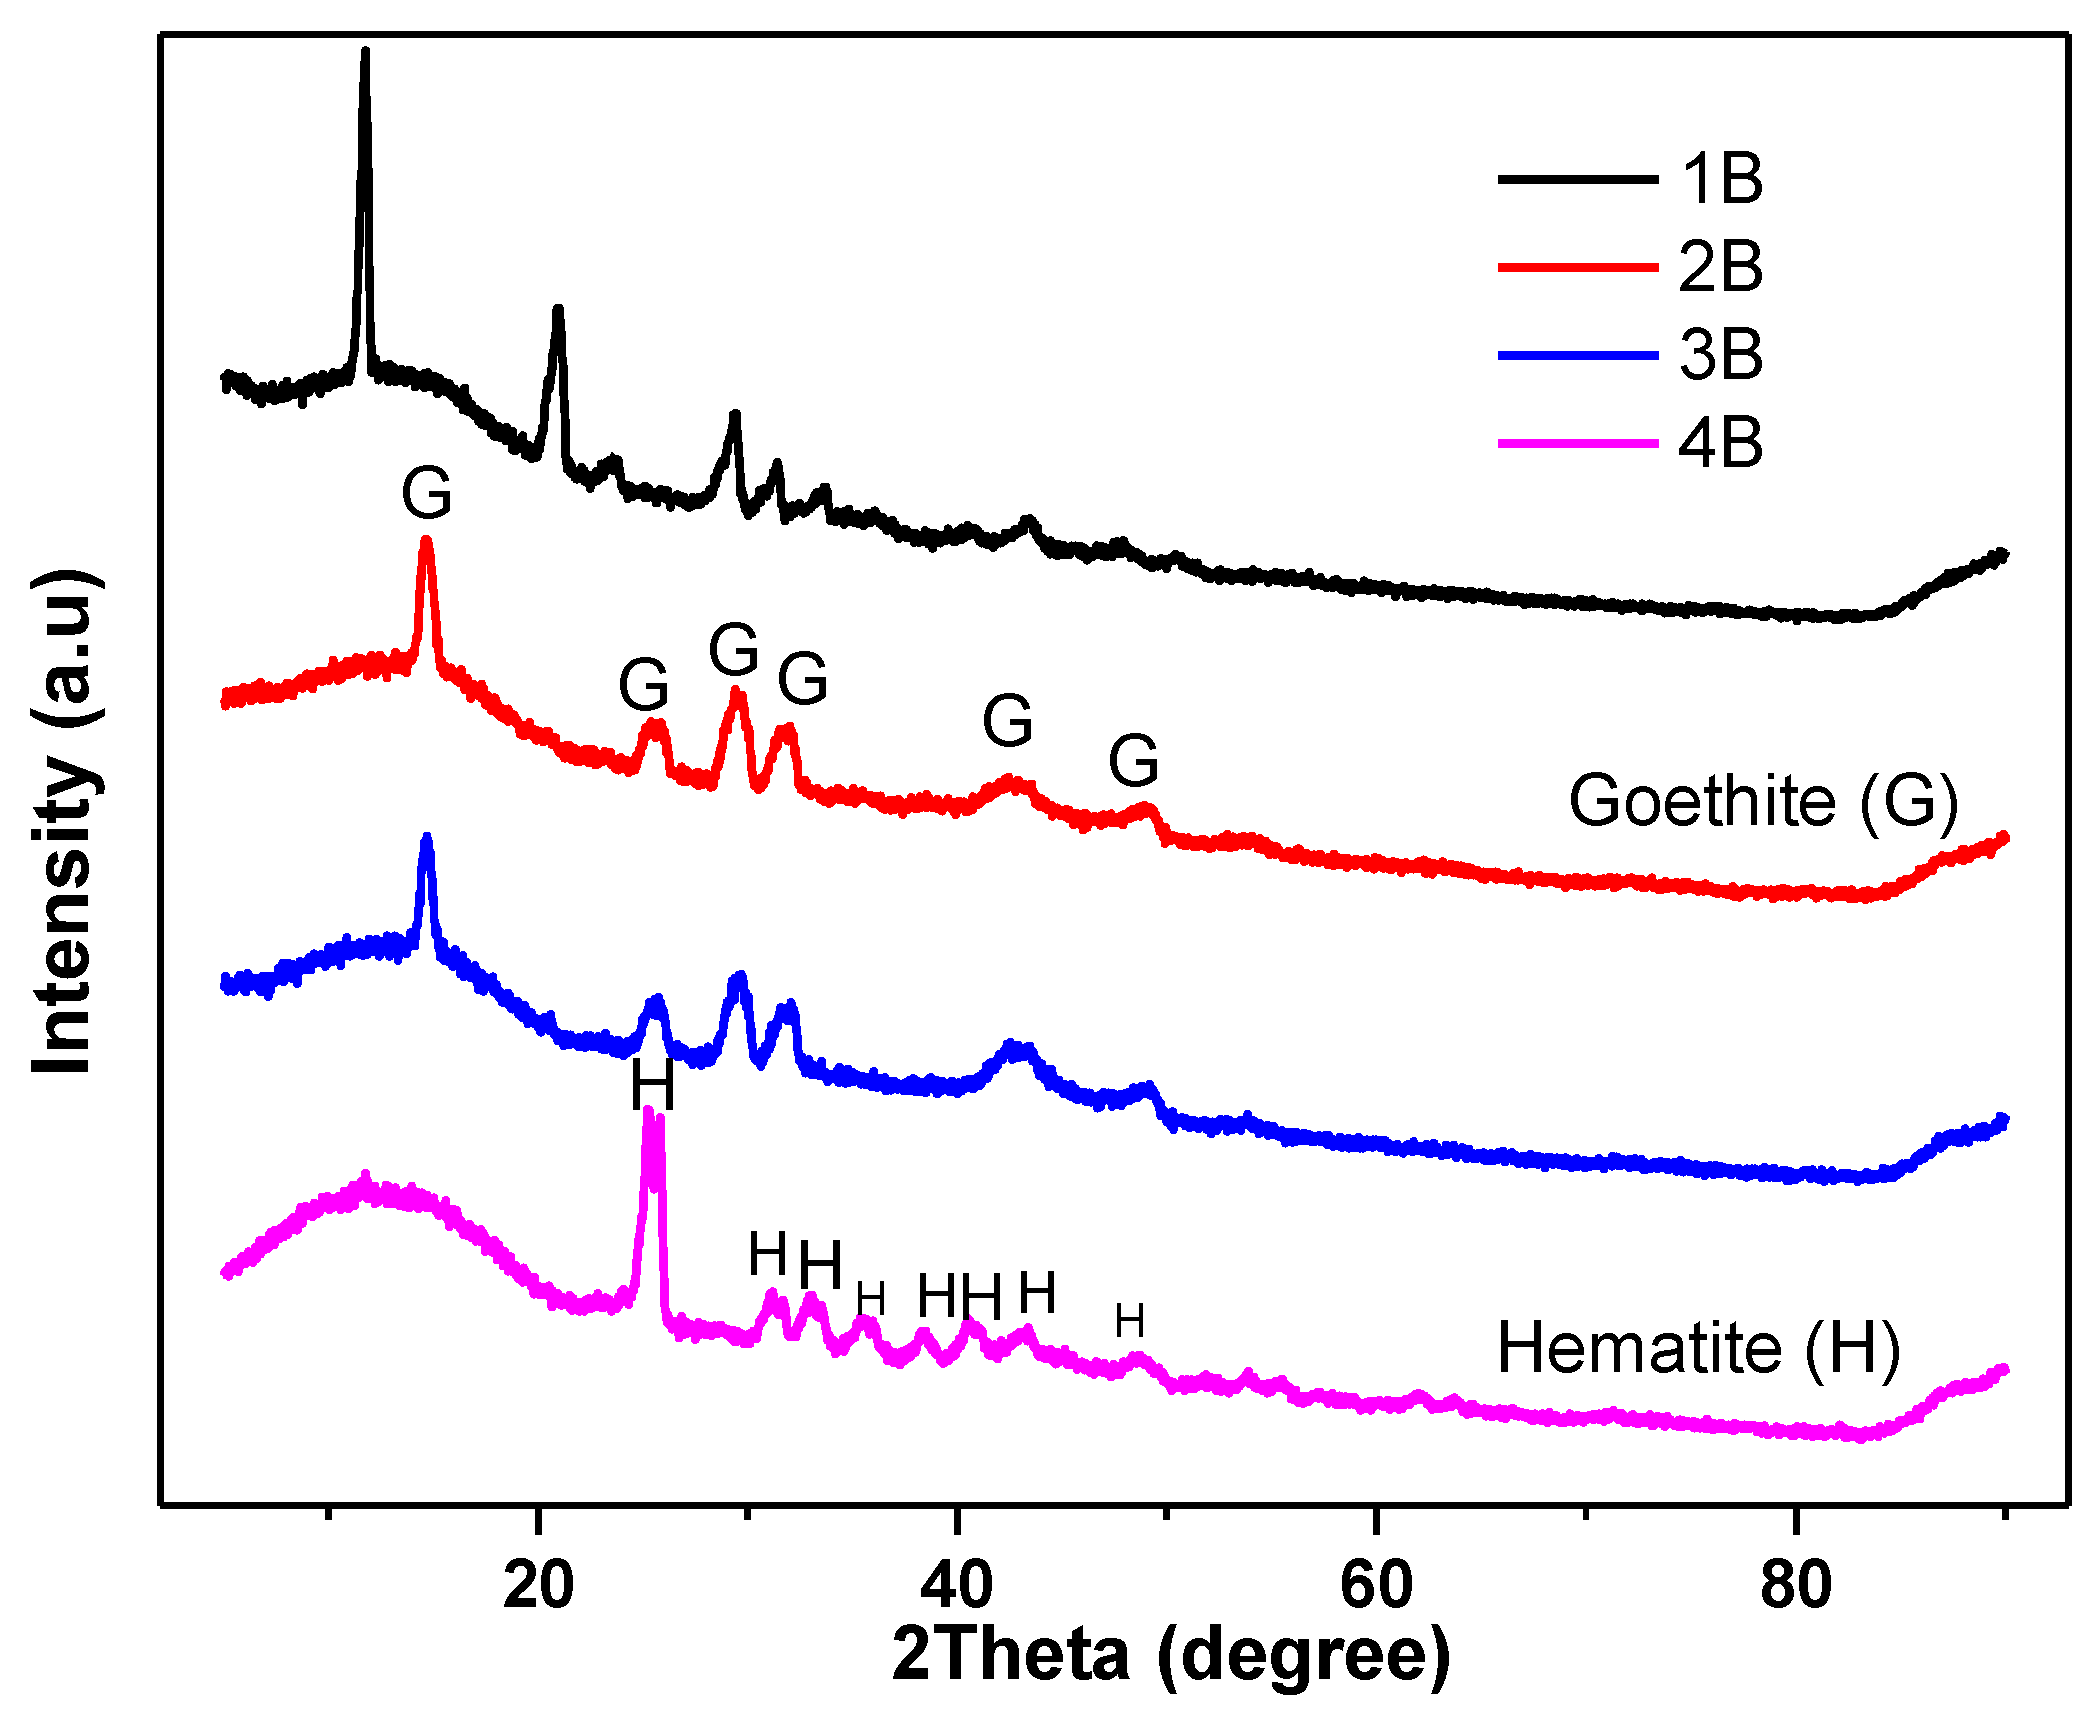
Figure 14.
XRD patterns of Nanoparticles (NPs) samples produced from AMD. Notes: 1B = (25 °C-CaCO3 as alkali); 2B = Goethite (150 °C-CaCO3 as alkali); 3B = Goethite (300 °C-CaCO3 as alkali); 4B = Hematite (800 °C-CaCO3 as alkali).
Figure 14.
XRD patterns of Nanoparticles (NPs) samples produced from AMD. Notes: 1B = (25 °C-CaCO3 as alkali); 2B = Goethite (150 °C-CaCO3 as alkali); 3B = Goethite (300 °C-CaCO3 as alkali); 4B = Hematite (800 °C-CaCO3 as alkali).
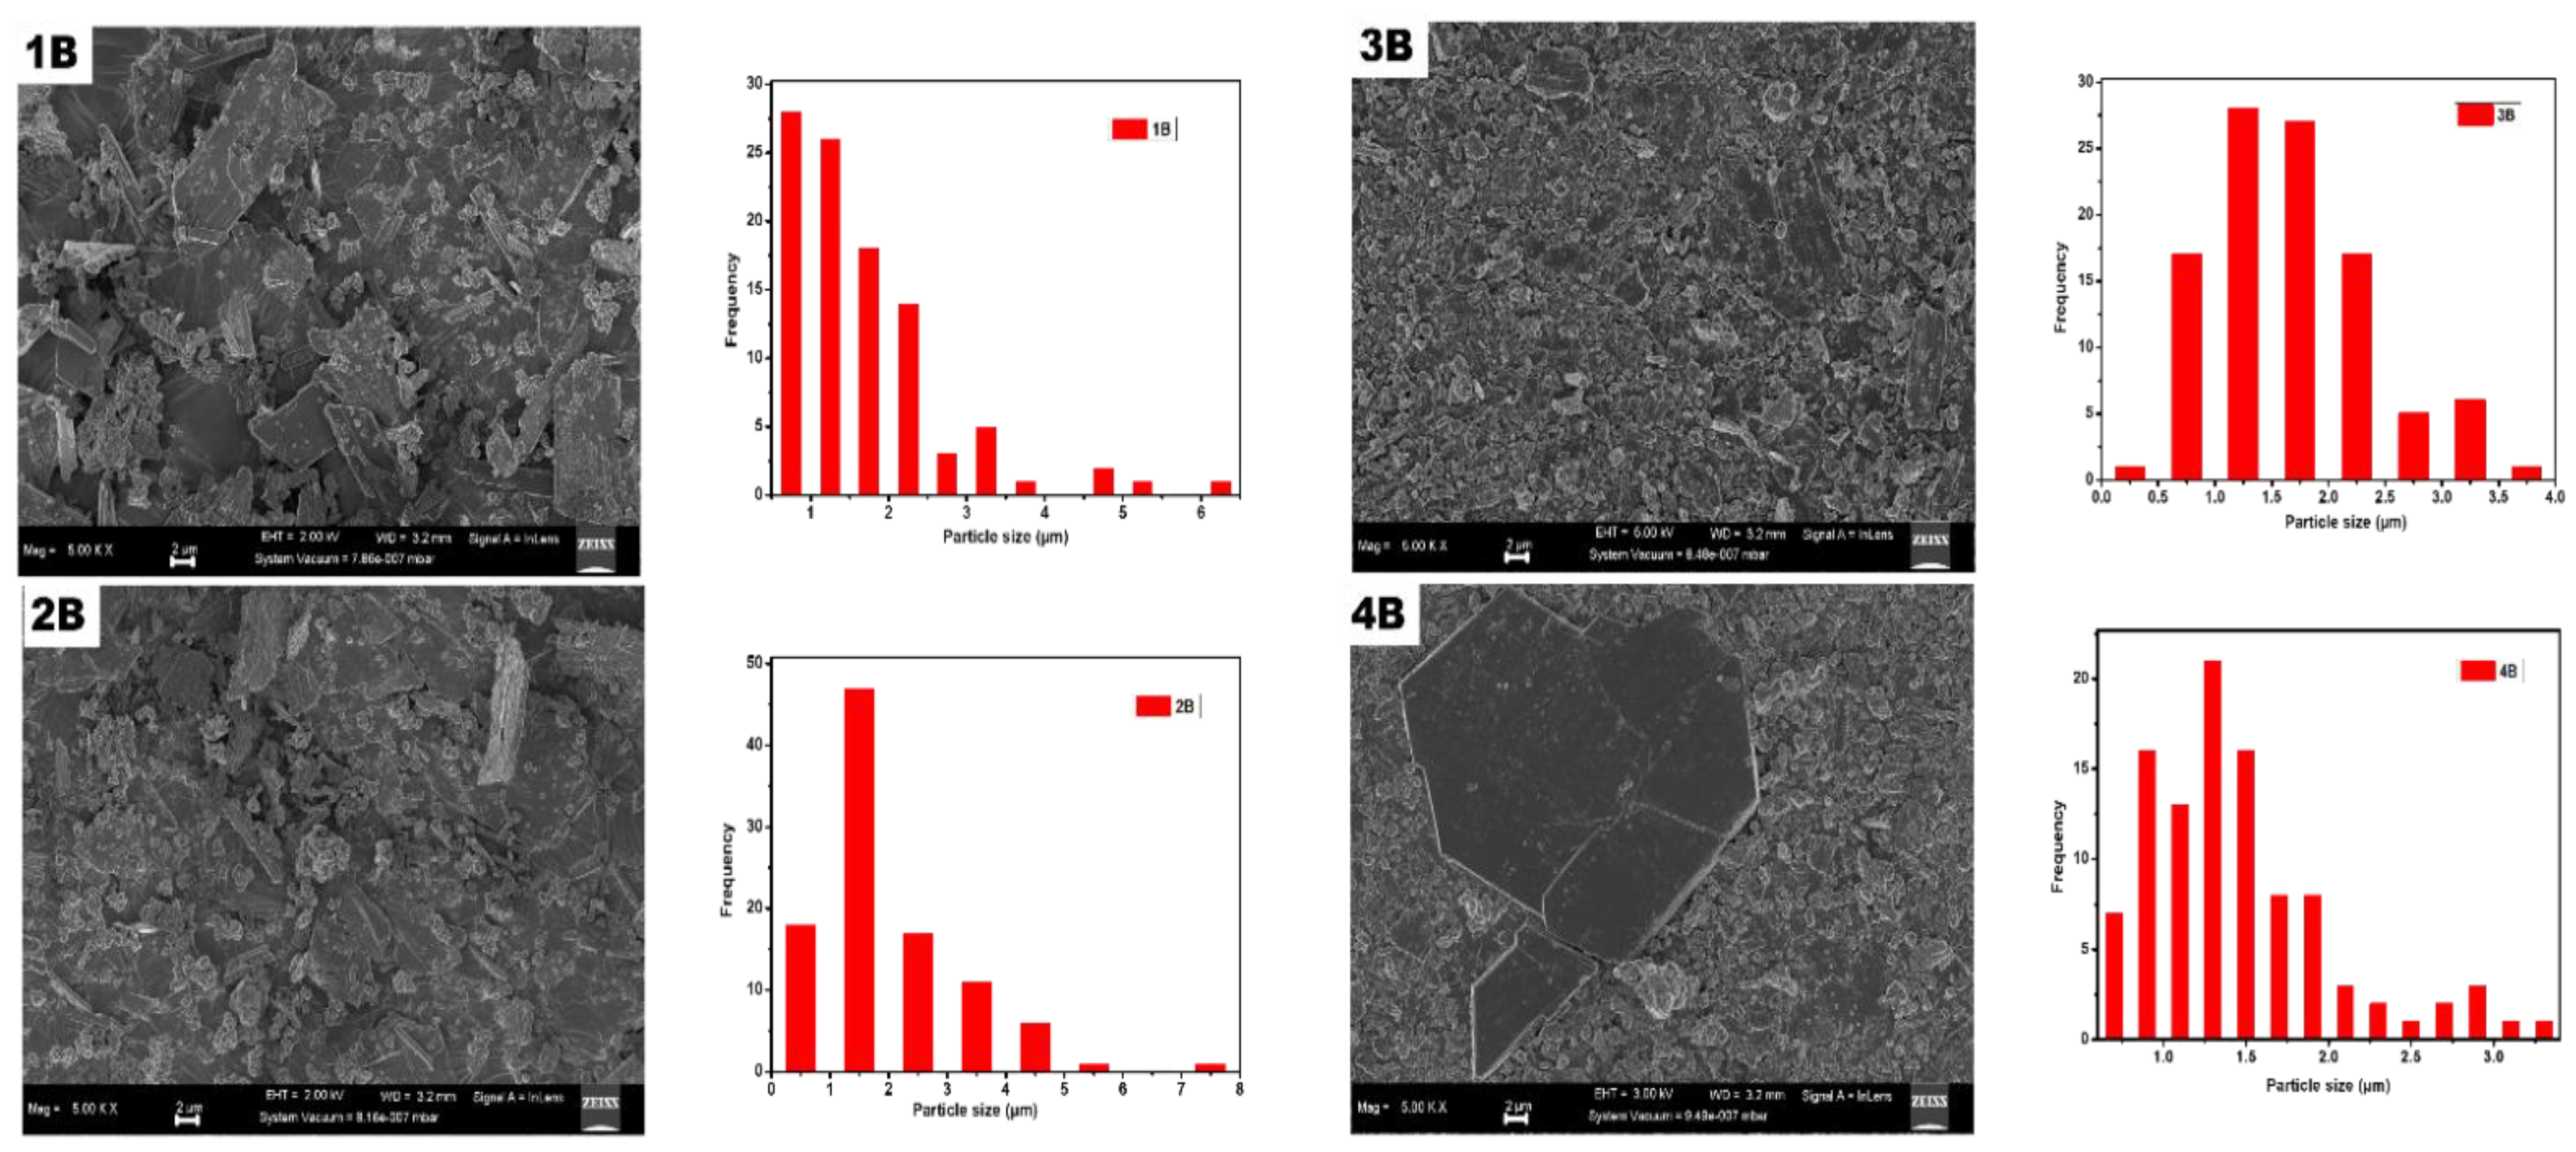
Figure 15.
Scanning electron microscope (SEM) pictures and their particle size distribution histogram of Nanoparticles samples produced from AMD.
Figure 15.
Scanning electron microscope (SEM) pictures and their particle size distribution histogram of Nanoparticles samples produced from AMD.
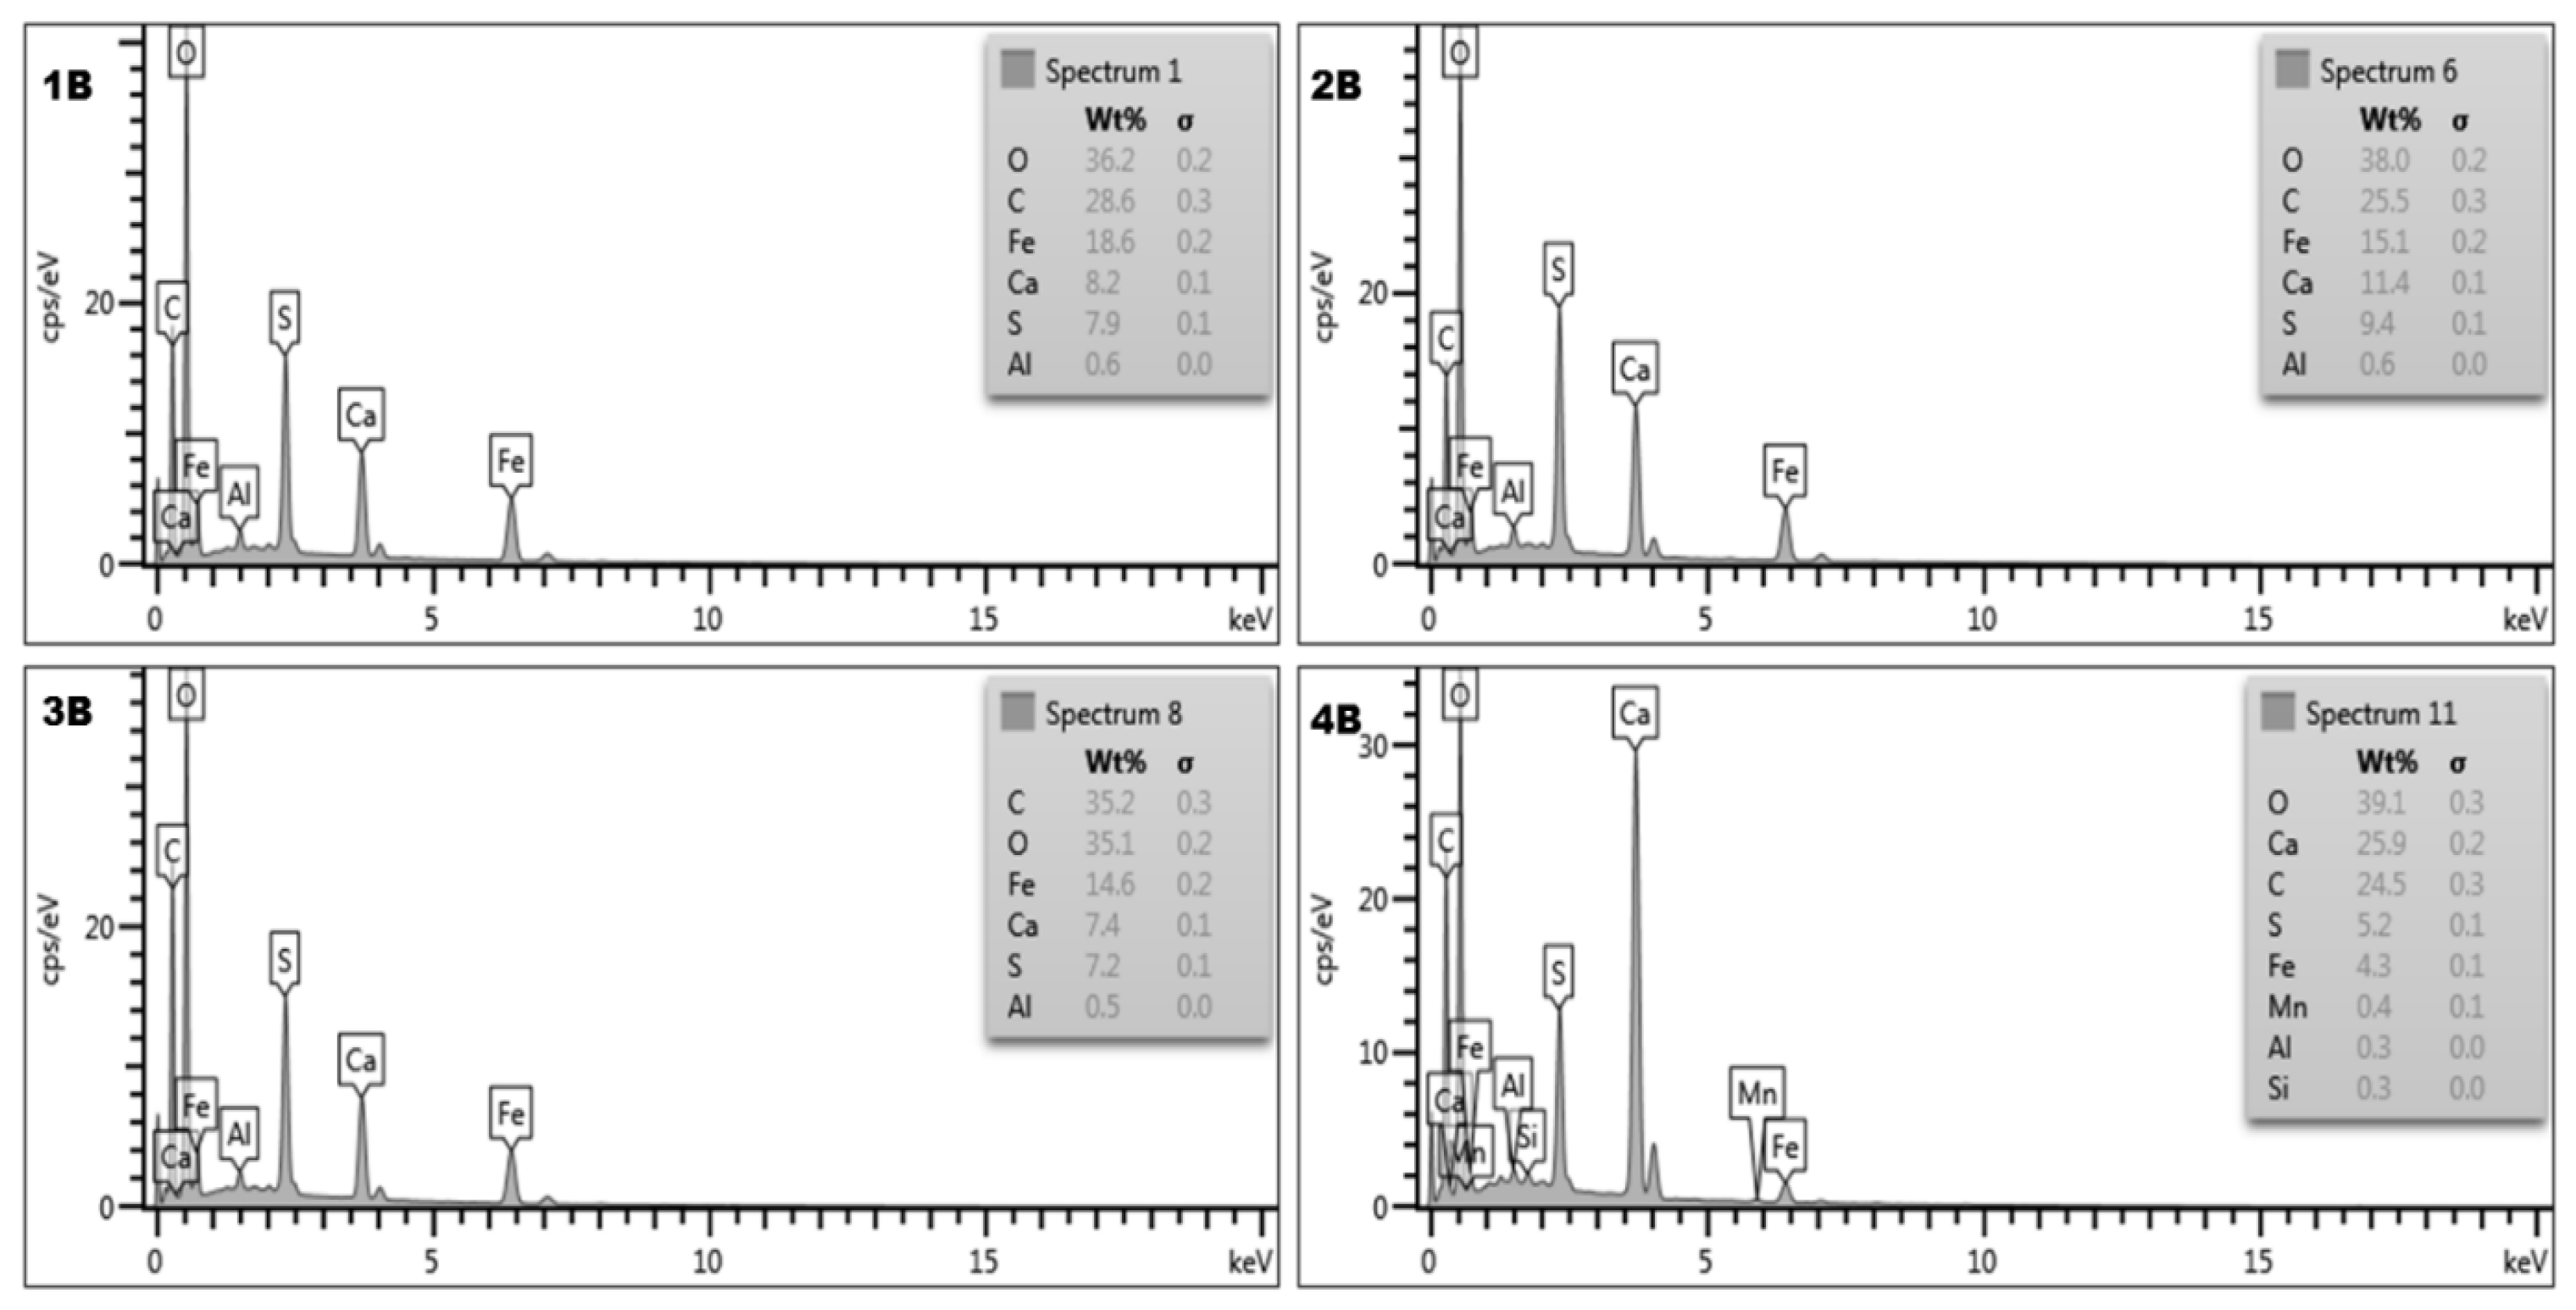
Figure 16.
Energy dispersive spectroscopy (EDS) plots of nanoparticles samples produced from AMD. 1B = (25 °C-CaCO3 as alkali); 2B = Goethite (150 °C-CaCO3 as alkali); 3B = Goethite (300 °C-CaCO3 as alkali); 4B = Hematite (800 °C-CaCO3 as alkali).
Figure 16.
Energy dispersive spectroscopy (EDS) plots of nanoparticles samples produced from AMD. 1B = (25 °C-CaCO3 as alkali); 2B = Goethite (150 °C-CaCO3 as alkali); 3B = Goethite (300 °C-CaCO3 as alkali); 4B = Hematite (800 °C-CaCO3 as alkali).
Table 1.
Chemical compositions of water in the Top Dam.
Table 1.
Chemical compositions of water in the Top Dam.
| | Top Dam |
|---|
| pH | 2.3 |
| Acidity (mg/L CaCO3) | 14,981.0 |
| H+ (mg/L H) | 40.0 |
| Na+ (mg/L) | 50.0 |
| K+ (mg/L) | 30.0 |
| Mg2+ (mg/L) | 300.0 |
| Ca2+ (mg/L) | 500.0 |
| Mn2+ (mg/L) | 200.0 |
| Fe2+ (mg/L) | 400.0 |
| Fe3+ (mg/L) | 4500.0 |
| t-Fe (mg/L) | 5000.0 |
| Al3+ (mg/L) | 300.0 |
| Si4+ (mg/L) | 60.0 |
| Sr2+ (mg/L) | 0.0 |
| Ba2+ (mg/L) | 0.0 |
| SO42− (mg/L) | 19,095.2 |
| Cl− (mg/L) | 200.0 |
| TDS (mg/L) | 25,475.2 |
| Cations (meq/L) | 397.8 |
| Anions (meq/L) | 397.8 |
Table 2.
Metals concentrations in
Figure 3.
Table 2.
Metals concentrations in
Figure 3.
| Parameter | Unit | Artificial Mine Water | Actual Mine Water |
|---|
| Fe3+ | mg/L | 3220 | 2569 |
| Fe2+ | mg/L | 503 | 251 |
| Ca2+ after Fe3+ removal | mg/L | 5000 | 3460 |
| AS26 inhibitor | mg/L | 100 | 100 |
| Prepared from | | CaSO4 and FeCl3 | Mine water and CaCO3 |
| Stirring rate | rpm | 200 | 200 |
| Stirring time | min | 180/180 | 180/180 |
| Temperature | °C | 25 | 25 |
Table 3.
Particle size parameters for Goethite and Hematite nanoparticles.
Table 3.
Particle size parameters for Goethite and Hematite nanoparticles.
| | Temperature (°C) | FWHM (2θ) | Β = FWHM*PI/180° | Average Crystallite Size
D (nm) = 0.9λ/βCosθ | d-Spacing
(Å) = λ/2sin(Ɵ) |
|---|
| 1B | 25 | 0.74 | 0.00654 | 11.9 | 4.25 |
| 2B | 150 | 0.73 | 0.00637 | 7.02 | 3.02 |
| 3B | 300 | 4.50 | 0.0393 | 7.27 | 2.81 |
| 4B | 800 | 7.47 | 0.0652 | 8.07 | 3.51 |
Table 4.
Removal of Fe3+ and other metals with only CaCO3 at 1 atm (OLI simulation).
Table 4.
Removal of Fe3+ and other metals with only CaCO3 at 1 atm (OLI simulation).
| | pH | Pressure [atm] (Y2) | Fe(+3) Aq [mg] (Y2) | Fe(OH)3 (Bernalite)—Sol [mg] (Y2) | CO2—Vap [mg] (Y2) | Al(+3) Aq [mg] (Y2) | MnCO3 (Rhodochrosite)—Sol [mg] (Y2) | Na(+1) Aq [mg] (Y2) | Mg(+2) Aq [mg] (Y2) | Ca(+2) Aq [mg] (Y2) | CaSO4.2H2O (Gypsum) [mg] (Y2) | C(+4) Aq [mg] (Y2) | CaCO3 (Calcite)—Sol [mg] (Y2) | S(+6) Aq [mg] (Y2) | Cl(−1) Aq [mg] (Y2) |
|---|
| 0 | 2.5 | 1.0 | 2000 | 0 | 0 | 300 | 0 | 100 | 200 | 300 | 0 | 0 | 0 | 3074 | 150 |
| 1000 | 2.6 | 1.0 | 1690 | 593 | 0 | 300 | 0 | 100 | 200 | 604 | 416 | 120 | 0 | 2997 | 150 |
| 2000 | 2.6 | 1.0 | 1314 | 1313 | 0 | 300 | 0 | 100 | 200 | 590 | 2194 | 240 | 0 | 2666 | 150 |
| 3000 | 2.7 | 1.0 | 938 | 2033 | 0 | 300 | 0 | 100 | 200 | 577 | 3971 | 360 | 0 | 2335 | 150 |
| 4000 | 2.7 | 1.0 | 562 | 2751 | 360 | 300 | 0 | 100 | 200 | 564 | 5745 | 382 | 0 | 2004 | 150 |
| 5000 | 2.8 | 1.0 | 192 | 3460 | 794 | 300 | 0 | 100 | 200 | 554 | 7509 | 383 | 0 | 1676 | 150 |
| 6000 | 3.5 | 1.0 | 4.0 | 3820 | 1228 | 226 | 0 | 100 | 200 | 549 | 9252 | 385 | 0 | 1351 | 150 |
| 7000 | 3.7 | 1.0 | 1.4 | 3825 | 1663 | 50 | 0 | 100 | 200 | 546 | 10,983 | 386 | 0 | 1029 | 150 |
| 8000 | 5.5 | 1.0 | 0.0 | 3827 | 1645 | 0 | 194 | 100 | 200 | 618 | 12,397 | 468 | 0 | 765 | 150 |
| 9000 | 5.9 | 1.0 | 0.0 | 3827 | 1417 | 0 | 385 | 100 | 200 | 756 | 13,228 | 593 | 171 | 611 | 150 |
| 10,000 | 5.9 | 1.0 | 0.0 | 3827 | 1417 | 0 | 385 | 100 | 200 | 756 | 13,228 | 593 | 1171 | 611 | 150 |
Table 5.
Removal of Fe3+ and other metals with only CaCO3 at 0.1 atm (OLI simulation).
Table 5.
Removal of Fe3+ and other metals with only CaCO3 at 0.1 atm (OLI simulation).
| CaCO3 [mg] | pH | Pressure [atm] (Y2) | Fe(+3) Aq [mg] (Y2) | Fe(OH)3 (Bernalite)—Sol [mg] (Y2) | CO2—Vap [mg] (Y2) | Al(+3) Aq [mg] (Y2) | MnCO3 (Rhodochrosite)—Sol [mg] (Y2) | Na(+1) Aq [mg] (Y2) | Mg(+2) Aq [mg] (Y2) | Ca(+2) Aq [mg] (Y2) | CaSO4·2H2O (Gypsum) [mg] (Y2) | C(+4) Aq [mg] (Y2) | CaCO3 (Calcite)—Sol [mg] (Y2) | S(+6) Aq [mg] (Y2) | Cl(−1) Aq [mg] (Y2) |
|---|
| 0 | 2.5 | 0.1 | 2000 | 0 | 0 | 300 | 0 | 100 | 200 | 300 | 0 | 0.0 | 0 | 3074 | 150 |
| 1000 | 2.6 | 0.1 | 1690 | 593 | 413 | 300 | 0 | 100 | 200 | 603 | 420 | 7.3 | 0 | 2996 | 150 |
| 2000 | 2.6 | 0.1 | 1314 | 1313 | 853 | 300 | 0 | 100 | 200 | 589 | 2200 | 7.3 | 0 | 2665 | 150 |
| 3000 | 2.7 | 0.1 | 938 | 2033 | 1292 | 300 | 0 | 100 | 200 | 575 | 3978 | 7.4 | 0 | 2333 | 150 |
| 4000 | 2.7 | 0.1 | 562 | 2752 | 1732 | 300 | 0 | 100 | 200 | 563 | 5753 | 7.4 | 0 | 2003 | 150 |
| 5000 | 2.9 | 0.1 | 192 | 3460 | 2171 | 300 | 0 | 100 | 200 | 552 | 7518 | 7.4 | 0 | 1674 | 150 |
| 6000 | 3.5 | 0.1 | 4 | 3820 | 2611 | 225 | 0 | 100 | 200 | 546 | 9263 | 7.4 | 0 | 1349 | 150 |
| 7000 | 3.7 | 0.1 | 1 | 3825 | 3051 | 49 | 0 | 100 | 200 | 543 | 10,996 | 7.5 | 0 | 1026 | 150 |
| 8000 | 6.6 | 0.1 | 0 | 3827 | 3141 | 0 | 353 | 100 | 200 | 579 | 12,564 | 28.7 | 0 | 734 | 150 |
| 9000 | 6.8 | 0.1 | 0 | 3827 | 3122 | 0 | 390 | 100 | 200 | 590 | 12,693 | 39.3 | 896 | 710 | 150 |
| 10,000 | 6.8 | 0.1 | 0 | 3827 | 3122 | 0 | 390 | 100 | 200 | 590 | 12,693 | 39.3 | 1896 | 710 | 150 |
Table 6.
Removal of remaining metals with Na2CO3 after Fe3+ removal with CaCO3 (OLI simulation).
Table 6.
Removal of remaining metals with Na2CO3 after Fe3+ removal with CaCO3 (OLI simulation).
| Na2CO3 [mg/L] | pH | Ca(+2) Aq [mg] (Y2) | CaCO3 (Calcite)—Sol [mg] (Y2) | Fe(+2) Aq [mg] (Y2) | FeCO3 (Siderite)—Sol [mg] (Y2) | Mn(+2) Aq [mg] (Y2) | S(+6) Aq [mg] (Y2) | Cl(−1) Aq [mg] (Y2) | C(+4) Aq [mg] (Y2) |
|---|
| 0 | 6.8 | 584 | 0 | 18.2 | 18.2 | 21.0 | 729 | 150 | 24.54 |
| 200 | 7.0 | 532 | 150 | 11.0 | 33.2 | 12.6 | 735 | 150 | 25.76 |
| 400 | 7.0 | 459 | 331 | 9.5 | 36.3 | 10.9 | 735 | 150 | 26.03 |
| 600 | 7.1 | 387 | 512 | 8.1 | 39.3 | 9.3 | 735 | 150 | 26.34 |
| 800 | 7.2 | 315 | 692 | 6.6 | 42.3 | 7.6 | 735 | 150 | 26.69 |
| 1000 | 7.3 | 243 | 872 | 5.2 | 45.3 | 5.9 | 735 | 150 | 27.10 |
| 1199 | 7.4 | 171 | 1051 | 3.7 | 48.3 | 4.2 | 735 | 150 | 27.59 |
| 1399 | 7.6 | 100 | 1229 | 2.3 | 51.3 | 2.4 | 735 | 150 | 28.22 |
| 1599 | 8.1 | 30 | 1403 | 0.9 | 54.2 | 0.7 | 735 | 150 | 29.34 |
| 1799 | 9.4 | 2 | 1473 | 0.3 | 55.3 | 0.0 | 735 | 150 | 43.28 |
| 1998 | 9.6 | 1 | 1475 | 0.3 | 55.3 | 0.0 | 735 | 150 | 65.73 |
Table 7.
Removal of remaining metals with Ca(OH)2 after Fe3+ removal with CaCO3 (OLI simulation).
Table 7.
Removal of remaining metals with Ca(OH)2 after Fe3+ removal with CaCO3 (OLI simulation).
| Ca(OH)2 [mg/L] | pH | Fe(+2) Aq [mg] (Y2) | FeCO3 (Siderite)—Sol [mg] (Y2) | Fe(OH)2 (Amakinite)—Sol [mg] (Y2) | Mn(+2) Aq [mg] (Y2) | MnCO3 (Rhodochrosite)—Sol [mg] (Y2) | Na(+1) Aq [mg] (Y2) | Ca(+2) Aq [mg] (Y2) | C(+4) Aq [mg] (Y2) | CaCO3 (Calcite)—Sol [mg] (Y2) | CaSO4·2H2O (Gypsum) [mg] (Y2) | Cl(−1) Aq [mg] (Y2) | Ca(OH)2 (Portlandite)—Sol [mg] (Y2) |
|---|
| 0 | 6.8 | 18.2 | 18.2 | 0.0 | 21.0 | 21.9 | 100 | 584 | 24.5 | 0 | 34 | 150 | 0 |
| 100 | 8.8 | 13.2 | 11.2 | 13.5 | 13.7 | 37.2 | 100 | 569 | 0.7 | 191 | 0 | 150 | 0 |
| 200 | 9.6 | 0.4 | 0.0 | 42.8 | 14.7 | 35.1 | 100 | 577 | 0.3 | 206 | 176 | 150 | 0 |
| 300 | 9.7 | 0.3 | 0.0 | 42.9 | 15.0 | 34.5 | 100 | 584 | 0.3 | 207 | 376 | 150 | 0 |
| 400 | 9.7 | 0.3 | 0.0 | 43.0 | 12.9 | 0.0 | 100 | 590 | 0.3 | 237 | 529 | 150 | 0 |
| 500 | 9.8 | 0.2 | 0.0 | 43.1 | 9.6 | 0.0 | 100 | 599 | 0.3 | 237 | 723 | 150 | 0 |
| 600 | 9.9 | 0.2 | 0.0 | 43.2 | 6.3 | 0.0 | 100 | 609 | 0.3 | 237 | 914 | 150 | 0 |
| 700 | 10.0 | 0.1 | 0.0 | 43.3 | 3.0 | 0.0 | 100 | 620 | 0.3 | 237 | 1099 | 150 | 0 |
| 800 | 10.7 | 0.0 | 0.0 | 43.4 | 0.2 | 0.0 | 100 | 637 | 0.2 | 237 | 1257 | 150 | 0 |
| 900 | 11.4 | 0.0 | 0.0 | 43.4 | 0.0 | 0.0 | 100 | 676 | 0.2 | 237 | 1323 | 150 | 0 |
| 999 | 11.6 | 0.0 | 0.0 | 43.4 | 0.0 | 0.0 | 100 | 717 | 0.2 | 237 | 1379 | 150 | 0 |
Table 8.
Mole ratio of Alkali dosage/Metals removed at 1 atm.
Table 8.
Mole ratio of Alkali dosage/Metals removed at 1 atm.
| Parameter | Unit | Metal |
|---|
| | | Fe3+ | Al3+ | Fe2+ | Mn2+ |
|---|
| Initial conc. | mg/L | 2000.0 | 300.0 | 200.0 | 200.0 |
| pH | | 3.5 | 3.8 | 6.6 | 6.6 |
| q mass | g | 18.6 | 9.0 | 27.9 | 28.0 |
| Acc. CaCO3 dosage | mg/L | 5000.0 | 7265.0 | 8047.5 | 8830.0 |
| CaCO3 dosage | mg/L | 5000.0 | 2265.0 | 782.5 | 782.5 |
| CaCO3 eq mass | g | 50.0 | 50.0 | 50.0 | 50.0 |
| CaCO3/Metal rem | mol/mol | 0.9 | 1.4 | 2.2 | 2.2 |
Table 9.
Mole ratio of Alkali dosage/Metals removed at 0.1 atm.
Table 9.
Mole ratio of Alkali dosage/Metals removed at 0.1 atm.
| Parameter | Unit | Metal |
|---|
| | | Fe3+ | Al3+ | Fe2+ | Mn2+ |
|---|
| Initial conc. | mg/L | 2000.0 | 300.0 | 200.0 | 200.0 |
| pH | | 3.5 | 3.8 | 6.6 | 6.6 |
| q mass | g | 18.6 | 9.0 | 27.9 | 28.0 |
| Acc. CaCO3 dosage | mg/L | 5000.0 | 7265.0 | 8047.5 | 8830.0 |
| CaCO3 dosage | mg/L | 5000.0 | 2265.0 | 782.5 | 782.5 |
| CaCO3 eq mass | g | 50.0 | 50.0 | 50.0 | 50.0 |
| CaCO3/Metal rem | mol/mol | 0.9 | 1.4 | 2.2 | 2.2 |
| CO2 (aq) | mg/L | 7.4 | 7.5 | | 39.3 |
| CO2 (vap) | mg | 2171.4 | 3050.7 | | 3122.2 |
Table 10.
Chemical cost and water quality when acid mine water is treated with Na2CO3 for removal of Fe3+, Al3+, Fe2+, Mn2+ and Ca2+.
Table 10.
Chemical cost and water quality when acid mine water is treated with Na2CO3 for removal of Fe3+, Al3+, Fe2+, Mn2+ and Ca2+.
| Compound | Unit | Composition | Price | Cost | Value |
|---|
| | | Feed | Fe(OH)3 | Other Metals | ZAR/t | ZAR/m3 Feed | ZAR/m3 Feed |
|---|
| Flow Feed | m3/h | 40.0 | 40.0 | 40.0 | | | |
| Na2CO3 | mg/L | | 5958.8 | 3300.6 | 5000.0 | 46.30 | |
| Na2CO3 | mg/L | | | | 5000.0 | 0.00 | |
| Product water | | | | | | | |
| pH | | | 3.2 | 5.7 | | | |
| TDS | mg/L | 12,660.9 | 13,241.8 | 13,684.2 | | | |
| H+ | mg/L | 5.0 | 0.0 | 0.0 | | | |
| Na+ | mg/L | 100.0 | 2685.9 | 4118.3 | | | |
| Mg2+ | mg/L | 200.0 | 200.0 | 200.0 | | | |
| Fe3+ | mg/L | 2000.0 | 0.0 | 0.0 | | | |
| Al3+ | mg/L | 300.0 | 300.0 | 0.0 | | | |
| Fe2+ | mg/L | 200.0 | 200.0 | 0.0 | | | |
| Mn2+ | mg/L | 200.0 | 200.0 | 0.0 | | | |
| Ca2+ | mg/L | 300.0 | 300.0 | 10.0 | | | |
| SO42− | mg/L | 9205.9 | 9205.9 | 9205.9 | | | |
| Cl− | mg/L | 150.0 | 150.0 | 150.0 | | | |
| Cations | meq/L | 196.0 | 196.0 | 196.0 | | | |
| Anions | meq/L | 196.0 | 196.0 | 196.0 | | | |
| Sludge | | | | | | | |
| Fe(OH)3 | mg/L | | 3826.3 | 0.0 | | | |
| Al(OH)3 | | | 0.0 | 866.7 | | | |
| FeCO3 | | | 0.0 | 414.9 | | | |
| MnCO3 | | | 0.0 | 418.6 | | | |
| CaCO3 | mg/L | | | | | | |
| Products | | | | | | | |
| Pigment | mg/L | | 5470.6 | | 20,000.0 | | 109.4 |
| Water | mg/L | | | | 12.0 | | 11.7 |
| Energy usage | kWh/m3 | | 0.6 | 0.6 | | | |
| Energy usage | kWh/m3 | | 0.6 | 0.6 | 1.2 | 2.16 | |
| Total | | | | | | 48.46 | 121.1 |
Table 11.
Chemical cost and water quality when acid mine water is treated with CaCO3 for removal of Fe3+ and Al3+, Ca(OH)2 for the removal of Fe2+, Mn2+, and Na2CO3 for the removal of Ca2+ associated with SO42−.
Table 11.
Chemical cost and water quality when acid mine water is treated with CaCO3 for removal of Fe3+ and Al3+, Ca(OH)2 for the removal of Fe2+, Mn2+, and Na2CO3 for the removal of Ca2+ associated with SO42−.
| Compound | Unit | Composition | Price | Cost | Value |
|---|
| | | Feed | Fe(OH)3 | Al(OH)3 | Other Metals | CaSO4 Crystal | CaCO3 | ZAR/t | ZAR/m3 Feed | ZAR/m3 Feed |
|---|
| Flow Feed | m3/h | 40 | 40 | | 40 | | 40 | | | |
| CaCO3 OLI | mg/L | | 5516 | 1756 | | | | | | |
| CaCO3 (calc) | mg/L | | 6031 | 1666 | | | | 750 | 5.77 | |
| Ca(OH)2 (OLI) | | | | | 799.0 | | | | | |
| Ca(OH)2 (calc) | mg/L | | | | 1140.4 | | | 2500 | 2.85 | |
| Na2CO3 | mg/L | | | | | | 2288 | 5000 | 11.44 | |
| Inhibitor | mg/L | | 120.0 | | | | | 60,000 | 7.20 | |
| Product water | | | | | | | | | | |
| pH | | | 3.5 | 4.0 | 10.7 | 10.7 | 10.0 | | | |
| TDS | mg/L | 12,660.9 | 13,068 | 13,435 | 13,453 | 2837 | 2853 | | | |
| H+ | mg/L | 5.0 | 0.0 | 0.0 | 0.0 | 0.0 | 0.0 | | | |
| Na+ | mg/L | 100.0 | 100.0 | 100.0 | 100.0 | 100.0 | 979 | | | |
| Mg2+ | mg/L | 200.0 | 200.0 | 200.0 | 1.0 | 1.0 | 1.0 | | | |
| Fe3+ | mg/L | 2000.0 | 0.0 | 0.0 | 0.0 | 0.0 | 0.0 | | | |
| Al3+ | mg/L | 300.0 | 300.0 | 0.0 | 0.0 | 0.0 | 0.0 | | | |
| Fe2+ | mg/L | 200.0 | 200.0 | 200.0 | 0.0 | 0.0 | 0.0 | | | |
| Mn2+ | mg/L | 200.0 | 200.0 | 200.0 | 0.0 | 0.0 | 0.0 | | | |
| Ca2+ | mg/L | 300.0 | 2712.5 | 3379.2 | 3995.6 | 873.4 | 10.0 | | | |
| SO42− | mg/L | 9205 | 9205 | 9205 | 9205 | 1712 | 1712 | | | |
| Cl− | mg/L | 150.0 | 150.0 | 150.0 | 150.0 | 150.0 | 150.0 | | | |
| HCO3− | mg/L | | | 500.0 | 500.0 | 500.0 | 200.0 | | | |
| OH− | mg/L | | | | | | 0.0 | | | |
| Cations | meq/L | 196.0 | 204.2 | 204.2 | 204.2 | 48.1 | 43.2 | | | |
| Anions | meq/L | 196.0 | 204.2 | 204.2 | 204.2 | 48.1 | 43.2 | | | |
| SO42− (OLI) | | | | | | 1503 | | | | |
| Sludge | | | | | | | | | | |
| Fe(OH)3 | mg/L | | 3826.3 | | 0.0 | | | | | |
| Al(OH)3 | | | 0.0 | | 866.7 | | | | | |
| FeCO3 | | | 0.0 | | 414.9 | | | | | |
| MnCO3 | | | 0.0 | | 418.6 | | | | | |
| CaCO3 | mg/L | | | | | | 245.9 | | | |
| Products | | | | | | | | | | |
| Pigment | mg/L | | 5470 | | | | | 20,000 | | 109.41 |
| Al(OH)3 | mg/L | | | 866.7 | | | | | | |
| CaSO4·2H2O | mg/L | | | | | 13,425 | | 20.0 | | 0.27 |
| CaCO3 | mg/L | | | | | | 2650 | 500.0 | | 1.33 |
| Water | mg/L | | | | | | | 12.0 | | 11.70 |
| Energy usage | kWh/m3 | | 0.6 | | 0.6 | | 0.6 | | | |
| Energy usage | kWh/m3 | | 0.6 | | 0.6 | | 0.6 | 1.2 | 2.16 | |
| Total | | | | | | | | | 29.43 | 122.71 |

 ,
, 


